
Submitted:
20 July 2024
Posted:
22 July 2024
You are already at the latest version
Abstract
This paper presents a novel normative framework for assessing granular base materials in rigid pavements, incorporating evaluations of California Bearing Ratio (CBR) alongside hydraulic conductivity tests. A critical component of this research adheres to Federal Highway Administration (FHWA) standards, which specify a permeability coefficient range of 0.05 to 0.20 cm/sec. Our investigations indicate that increased compaction energy inversely affects permeability, highlighting a sophisticated interplay between compaction dynamics and hydraulic characteristics. The study further elucidates that CBR values are profoundly impacted by the content of coarse-grained soil, advocating for a tailored approach to base layer assessment. Multivariable CBR analysis facilitated the identification of an optimal water content, underscoring that maintaining a minimum 80% CBR—while minimizing water content—can mitigate fatigue effects and enhance structural performance under heightened energy conditions. This research proposes bespoke, scientifically validated standards that integrate local geotechnical nuances, aimed at refining material selection processes and extending the durability of pavement infrastructures through foundational yet meticulous geotechnical evaluations.
Keywords:
California Bearing Ratio (CBR)
; permeability
; granular base materials
; rigid pavement
1. Introduction
The performance of pavements is largely influenced by the granular base, as it provides uniform support, stability, structural capacity, and load-bearing capacity. It also functions as a drainage layer, remaining unaffected by moisture (Babić et al., 2000; Delatte, 2008). Consequently, this layer is considered the primary structural component of the pavement, with its quality significantly impacting the pavement's performance and durability (Siswosoebrotho et al., 2005; Kwon et al., 2017). Typically, the base is composed of well-graded gravel-sand soil or partially or fully crushed rocks with low fines content (Ohiduzzaman et al., 2011). It can be stabilized with additives such as asphalt, cement, or other stabilizers, or remain non-stabilized, consisting of untreated granular material (Alawi & Helal, 2014).
Due to differing load distribution patterns in flexible and rigid pavements, granular bases serve various functions (Sargand et al., 2006). In flexible pavements, the base increases the load-bearing capacity of the upper layer, enhances rigidity, offers greater resistance to deformation and fatigue (being closer to the surface), provides drainage, and reduces stress from repeated loads (Yoder & Witczak, 1975; Hossain, 1998; Christopher et al., 2006). In rigid pavements, the granular base or subbase provides uniform support, prevents fines pumping, protects against freezing, facilitates drainage, increases structural capacity, and prevents volumetric changes of the subgrade (Yoder & Witczak, 1975; Christopher et al., 2006; American Concrete Pavement Association, 2007; FHWA, 2016). Therefore, the selection approaches for base materials should differ based on the type of pavement.
The hydraulic base, defined as the non-stabilized granular base supporting concrete slabs, must be stable, non-erodible, and have good drainage capacity. These characteristics ensure uniform support and optimal performance in rigid pavement. Without these properties, the base may exhibit low strength and rigidity, leading to loss of support and deformation of the layer. Hence, the quality of the granular base in concrete pavements is crucial for the long-term performance of the structure, relying on the durability, uniformity, and rigidity of the granular layer (Zhou et al., 2015; Zhang et al., 2017). To enhance the performance and quality of the granular base, the geotechnical properties of the material must be carefully selected to maximize its strength, focusing on particle shape, texture, angularity, gradation, fines content and mineralogy, plasticity, dust ratio, moisture content, and degree of compaction (Tutumluer, 2013; Chaulagai et al., 2017). Common parameters for evaluating the strength and rigidity of granular materials include the California Bearing Ratio (CBR-ASTM D1883-21) and the elastic modulus.
This research aims to establish the geotechnical requirements for the standards of granular bases of rigid pavement. Eight materials from different quarries in the Metropolitan Area of Querétaro (ZMQ) are geologically characterized and classified. Their compliance is evaluated and compared using the percentage within limits (PWL) (American Society of Civil Engineers, 2016) according to tests defined in international standards. Subsequently, the gradation of four out of the eight quarried materials is modified according to the maximum density curve criterion. Additionally, the gravimetric and volumetric properties of all tested specimens and the permeability coefficient are calculated using the Chapuis (2004) prediction model.
Further, geotechnical parameters promoting the stability and performance of the hydraulic base for rigid pavement are identified in the literature, alongside optimal values indicated by previous research. With the test results and those derived from applying new parameters found in the literature, statistical analysis is performed, and correlation graphs are created to determine which geotechnical properties are most related to the structural capacity (CBR) and permeability (k) of the materials. The analysis specifies the value ranges that achieve the minimum acceptable CBR (80% as per Babić et al. (2000), Siswosoebrotho et al. (2005), and Tutumluer (2013)) and the necessary permeability of 0.05 to 0.12 cm/s according to ACPA (2007) and FHWA (2016), thus achieving optimal quality for the granular base. A proposal for standards to evaluate granular materials for rigid pavement bases is developed, adaptable to the geotechnical conditions of the materials found in Querétaro, México. Additionally, CBR prediction models from the literature are evaluated, and a functional model for granular-based materials is established, providing the option to use a model instead of the CBR test. This paper also proposes technical parameters to promote a new standard normative for international use across a broad range of technical conditions.
2. Characteristics of Tested Materials
The samples were collected in accordance with the standard test method ASTM D75 (ASTM International, 2009a) and processed following the standard test method ASTM C702/C702M-11 (ASTM International, 2011). The geographical locations and geological characteristics of these materials are presented in Table 1.
The California Bearing Ratio (CBR) values were obtained from unsaturated samples compacted at their optimum water content, as determined by the ASTM D 1557 compaction tests. To simulate the weight of pavement, a load of 4.54 kg was placed atop the samples. Additionally, the materials were classified using several tests: consistency limits as per ASTM D4318-05 (ASTM International, 2005), dry loose volumetric mass according to SCT standard M-MMP-1-08/03 (SCT, 2003b), specific gravity as per ASTM C127-12 (ASTM International, 2012), Modified Proctor compaction test according to ASTM D1557-09 (ASTM International, 2009b), CBR testing in accordance with ASTM D1883-21 (ASTM International, 2021), and water content measurement following ASTM D2216-10 (ASTM International, 2010). Figure 1, Figure 2, Figure 3, Figure 4 and Figure 5 illustrate the grain size distribution of the different materials, aligned with various international standards (Dirección General de Carreteras, 2015, ASTM International, 2009, AASHTO, 2012, Dirección General de Caminos y Ferrocarriles, 2013, MINVU, 2016, Instituto Nacional de Vías, 2012).
In the second phase of this research, forty samples from four distinct quarries were subjected to varying compaction energies (CE) to explore their effects on the California Bearing Ratio (CBR) outcomes. Specifically, samples 1 to 5, 6 to 10, 11 to 15, and 16 to 20 were compacted using ASTM D 698 compaction energy standards. Conversely, samples 21 to 25, 26 to 30, 31 to 35, and 36 to 40 were compacted under the ASTM D 1557 compaction energy standards. This experimental setup was designed to systematically assess the impact of both CE and water content on the CBR results.
3. Results
Iso-CBR curves assist builders in determining the necessary water content, target volumetric mass, and required compaction energy to achieve the desired California Bearing Ratio (CBR) values. Higher compaction energies lead to enhanced strength outcomes compared to lower energies. The variability observed in these results highlights that each case is distinct, with outcomes more dependent on the rock’s origin than its particle size distribution. Compaction tests are conducted at two different energy levels, with each specimen undergoing CBR testing; the results are then utilized to construct iso-CBR graphs (Figure 6). This indicates that attaining maximum density alone does not suffice; a comprehensive understanding of the required construction processes to achieve optimal strength values is crucial. Additionally, Table 2 lists the necessary water quantity, volumetric mass, energy, and degree of compaction needed to reach at least an 80% CBR for each quarry. The 'Minimum CBR' column is incorporated to account for instances where some compaction curves exceed an 80% value. It is observed that compacting to 95% of the Maximum Dry Density (MDD) typically ensures satisfactory strength. However, it is imperative to conduct field verifications to confirm that bases compacted to this standard maintain their structural integrity.
According to literature, the geotechnical parameters influencing the strength and drainage capacity of the hydraulic base include: 1) particle shape, texture, and angularity; 2) granulometry; 3) fines content, plasticity, and dust ratio; 4) clay contamination; and 5) water content and degree of compaction. This research, however, was only able to determine the particle shape (elongated and flaky particles), granulometry, gravel content, sand content, fines content, G/S ratio, dust ratio, material passing sieve No. 40, plasticity index, liquid limit, sand equivalent, degree of compaction, water content, Dry Volumetric Mass, and additionally, Los Angeles abrasion. Consequently, Table 3 summarizes these properties for the materials characterized in Stage 1 and Stage 2, along with the percentages of CBR and drainage capacity (permeability) calculated using the Chapuis model (2004). The granulometric and gravimetric analyses for each sample are detailed in Table 4, Table 5, Table 6 and Table 7. In Stage 1, the specimens met the permeability criteria recommended by ACPA (2007) and FHWA (2016) (0.05 to 0.12 cm/s). However, none of the specimens in Stage 2 met this criterion, suggesting that lower compaction energy is a viable solution.
From the results of the compaction tests, the main volumetric and gravimetric parameters for each sample were obtained (Rojas-González et al., 2020). These parameters are also shown in Table 4, Table 5, Table 6 and Table 7. They include: the volumetric weight (), the dry volumetric weight (), the specific relative weight of the soil mass (), the specific density of solids (), the water content (, the relative compaction (Cr, %), the void ratio (), the porosity , the degree of saturation the degree of concentration of air , the volumetric water content , the degree of compaction with respect to dry volumetric weight from a compaction test , and the permeability coefficient .
Low CBR values of some samples from the same quarry are related to their low compaction energy. Therefore, CBR values are influenced by both the grain size distribution and the compaction energy.
Table 4 (AGC), Table 5 (El Tlacote), Table 6 (El Nabo), and Table 7 (Los Ángeles) show the permeability and the gravimetric and volumetric properties calculated for each specimen in Stage 1 and Stage 2. Again, few specimens meet the permeability criterion of ACPA (2007) and FHWA (2016), but it is noteworthy that most results are within the 0.01 to 0.05 cm/s drainage capacity range. Additionally, it is repeatedly demonstrated that reducing the degree of compaction increases the permeability of the aggregates.
In order to define which geotechnical parameters have the greatest influence on the percentage of CBR and the permeability of granular materials, linear regression adjustments were performed, where the R² coefficient indicates the reliability of the correlation between the adjusted parameters. The closer this coefficient is to one, the more reliable the correlation. Table 8 shows the R² values for each of the geotechnical parameters described in Table 3.
The statistical analysis detailed in Table 8 reveals fewer promising results for CBR, with correlation coefficients below 0.5, but more significant outcomes for permeability, where correlation coefficients exceed 0.5. This variance is likely attributed to the distinct behaviors of geotechnical parameters, which vary according to the specific material under consideration. Essentially, the relationship between parameters—whether showing an increase or decrease—becomes apparent when evaluating the same material, sharing a common rock genesis. However, when test results from different materials are compared, clear trends are less discernible, corroborating findings by Correa et al. (2012) and Chow (2014). This suggests that the inherent characteristics of each material heavily influence the behavior of its geotechnical properties, impacting the reliability of correlation outcomes across different samples. Nevertheless, it is essential to establish value ranges for these geotechnical properties that account for material variability and ensure the stability of the granular base of the pavement. Therefore, despite the low level of correlation, Table 8 shows that the geotechnical parameters with the greatest influence on CBR are the gravel content, sand content (R²=0.482 for both), and the gravel/sand ratio (R²=0.391), while for permeability, it is the percentage of material passing the No. 40 sieve (R²=0.796), fines content (R²=0.589), and the dust ratio (R²=0.446).
The materials from the Metropolitan Area of Querétaro were reevaluated using the recommendations proposed in this study, aiming to determine if the compliance level has improved under these new guidelines compared to the existing standard N-CMT-4-02-002/16. Consequently, Table 9 details the characterization of each material along with its respective evaluation criteria and the Percentage Within Limits (PWL) based on this research for each geotechnical parameter examined. The results show that the PWL has increased from 62% (under N-CMT-4-02-002/16) to 80% (an increase of 18%), suggesting that the new quality specifications proposed are more suitable for the materials from the Metropolitan Area of Querétaro for use in hydraulic bases. This heightened compliance is not merely based on scientific rationale but also incorporates geotechnical parameters known to affect the strength and stability of the hydraulic base. Furthermore, this approach encourages the use of local materials by establishing guidelines that enhance the properties of the aggregates, thus benefiting local infrastructure development.
3.2. CBR Predictive Models’ Evaluation
The CBR prediction models applied to materials from the Metropolitan Area of Querétaro include those by Rollings & Rollings (1996), Berney & Wahl (2008), Taskiran (2010), and Yildirim & Gunaydin (2011). Table 10 displays the CBR percentages obtained in the laboratory alongside those predicted by these models, and the absolute error. For the Berney & Wahl (2008) model, all adjustment coefficients were set to one. The algorithm from Rollings & Rollings (1996) consistently predicted a CBR of 75% across all materials, indicating it may not be suitable for accurate CBR prediction, similar to the Taskiran (2010) model, which is unsuitable for non-plastic aggregates (0% Plasticity Index) and features a complex algorithm.
Conversely, the models by Berney & Wahl (2008) and Yildirim & Gunaydin (2011) demonstrated the best performance in terms of CBR prediction, achieving the lowest prediction and relative errors. These models were further refined using Excel's "Solver" tool to minimize the sum of absolute errors, based on data collected in this study. The refinements are encapsulated in Equation 1 (Berney & Wahl, 2008) and Equation 2 (Yildirim & Gunaydin, 2011). The application of these models and their reliability are detailed in Table 11, which indicates an average relative error of 12%, offering improved accuracy compared to their original algorithms. However, the model encapsulated in Equation 2 is recommended due to its simplicity and minimal data input requirements, making it more practical for widespread application (Montes-Arvizu et al., 2020).
where:
G: percentage of coarse aggregate (gravel)
S: percentage of aggregate passing the No. 4 sieve
MDD: Maximum Dry Density in Kg/m³
wopt: Optimum water content (%)
The necessary parameters for these models include the dry specific volumetric weight, granular content (sand and gravel), percentage of sandy soils, finer content, the energy used during compaction tests, and the gravimetric water content of the compacted material. It's crucial to note that these models are only applicable to materials that exhibit mechanical properties similar to those tested in this report. Due to this significant limitation, it is essential to conduct tests on other materials and evaluate the proposed models for predicting CBR values. This will help ensure that the models are robust and can be reliably used in different geotechnical contexts.
3.1. Normative Proposal
The following is the proposed standard for granular bases of rigid pavements, recommended for materials sourced from the Metropolitan Area of Querétaro. The granular material for the hydraulic base should ideally consist of crushed aggregates (with a minimum of 98% crushed rocks) or partially crushed aggregates (with at least 75% crushed rocks) and should not exceed a maximum particle size of 25 mm (1 inch). Furthermore, the material for the rigid concrete base must conform to the gradation characteristics outlined in Table 12 and fulfill the quality requirements specified in Table 13. If the gradation distribution of a material does not adhere to the gradation curves proposed in this document, it should maintain a gravel-to-sand ratio (G/S) between 1.0 and 3.0.
Concurrently, the Percentage Within Limits (PWL) of the materials with respect to the quality requirements specified in national and international standards was calculated. Consequently, Table 14 was developed, which indicates the quality level of the materials from the quarries in each of the evaluated categories (N-CMT-4-02-002, 2016, PG-3, 2015, ASTM D1241, 2000, ASTM D2940 (2009), AASHTO M 147-65 (2012), Publication 332 (2016), EG-INVIAS (2012), and EG, 2013)
Additionally, Equation 2 can be utilized to estimate the approximate California Bearing Ratio (CBR) percentage, with an expected approximation error of 12%. This preliminary estimation is crucial for determining the feasibility of testing the material.
Therefore, the values of dry bulk density, solid bulk density, and degree of water saturation, which meet quality criteria, vary from one material to another and thus cannot be standardized. In other words, the values that adapt these properties in two materials can be similar, but the ranges for achieving good quality in one material do not typically coincide with those of another. Thus, the volumetric property of void ratio is likely a characteristic that can be standardized for quality control of granular materials. However, since it is more practical to determine the degree of compaction of the material than the void ratio, and thereby have better control of the quality of the hydraulic base through the degree of compaction with the aim of establishing the degree of compaction with which ratio values between 0.20 and 0.30 (CBR) and between 0.4 to 0.6 (permeability) are achieved, as shown in Figure 7. From this, it is deduced that the degree of compaction the material should exhibit is at least 95% (CBR) or between 93% and 95% (permeability). It should be noted that a lower degree of compaction increases permeability but decreases strength, making it ideal to find a degree of compaction where both parameters are not adversely affected. Therefore, it is recommended that the coarse base be compacted to 95% of its Maximum Dry Density (MDD), a percentage that coincides with the analysis of the iso-CBR curves with a 100% CBR value. However, this level of compaction is still subject to field evaluation.
4. Discussion
This paper introduces a novel framework for assessing granular base materials in pavements, emphasizing the balance between CBR and hydraulic conductivity. Key discussion points include the critical role of optimal water content and compaction energy in achieving desired CBR values, and the impact of these factors on material permeability and pavement durability. The research advocates for a tailored approach to material selection based on local geotechnical conditions, challenging standard practices and potentially influencing future pavement design standards. Additionally, the evaluation of CBR prediction models offers practical tools for pre-construction performance prediction, though their limitations and potential improvements need consideration.
5. Conclusions
This study presents a comprehensive analysis of the geotechnical properties of granular materials for hydraulic bases, offering insights that challenge and extend beyond the traditional norms specified by the SCT Mexican standard for granular bases of rigid pavements (N-CMT-04-02-002/16). It was found that local materials fell short of meeting these standards, particularly in gradation and particle shape, achieving only a 62% PWL compared to the required 90%. This significant finding suggests that the existing standards may not adequately reflect the unique geotechnical characteristics of the region's materials, highlighting the need for standard adaptation to local conditions.
This research innovatively demonstrates that higher compaction energy not only increases the Maximum Dry Density (MDD) but also optimizes the California Bearing Ratio (CBR), without necessitating maximum compaction relative to MDD or excessive water use. This approach can lead to more resource-efficient construction practices by allowing for reduced compaction levels while still achieving desired structural integrity. The development and application of iso-CBR curves, as introduced in this study, provide a valuable reference for engineers to predict compaction outcomes based on specific energy inputs and moisture content. This facilitates the implementation of more precise and customized material compaction strategies
Statistical analysis revealed that particle shape, texture, angularity, and gradation, alongside fines content and compaction degree, are critical in influencing both the CBR and hydraulic conductivity of the materials. The study specifies that a granular base optimal for high CBR values should have a carefully controlled coarse aggregate content with a G/S ratio close to 1.6, enhancing the strength of the materials. For hydraulic conductivity, the composition should include a precise range of fines and maintain specific dust ratios and sieve pass percentages.
This research contributes original methodologies and findings to the field of civil engineering by suggesting adjustments to standard practices based on localized material properties and introducing predictive modeling techniques that allow for pre-testing assessments of material suitability. These contributions are particularly valuable for global civil engineering practices, as they underscore the importance of adapting construction standards and practices to regional geotechnical realities, thereby enhancing the sustainability, efficiency, and effectiveness of infrastructure projects worldwide. The findings encourage engineers to rethink the traditional approaches to pavement design, advocating for a more flexible, technologically feasible, scientifically informed basis for decision-making in the construction of durable and efficient road systems.
Acknowledgments
Authors are gratefully acknowledged the financial support of the Consejo Nacional de Ciencia y Tecnología (CONACYT) for this research.
References
- Alawi, M. H., & Helal, M. M. (2014). A mathematical model for the distribution of heat through pavement layers in Makkah roads. Journal of King Saud University - Engineering Sciences, 26(1), 41–48. [CrossRef]
- American Association of State Highway and Transportation Officials (AASHTO). (2012). Standard Specification for Materials for Aggregate and Soil-Aggregate Subbase, Base, and Surface Courses (Designación AASHTO No. M 147-65). Estados Unidos: American Association of State Highway and Transportation Officials.
- American Concrete Pavement Association. (2007). Subgrades and subbases for concrete pavements. Skokie, Ill.: American Concrete Pavement Association.
- American Society of Civil Engineers. (2016). Construction management of earthworks: A guide to soil compaction, testing, and quality control. Reston, VA: ASCE Press.
- ASTM International. (2000). Standard Specification for Materials for Soil-Aggregate Subbase, Base, and Surface Courses (Designación ASTM No. D1241-00). Estados Unidos: American Society for Testing and Materials.
- ASTM International. (2005). Standard Practice for Liquid Limit, Plastic Limit, and Plasticity Index of Soils (Designación ASTM No. D4318-05). Estados Unidos: American Society for Testing and Materials.
- ASTM International. (2009a). Standard Practice for Sampling Aggregates (Designación ASTM No. D75/D75M-09). Estados Unidos: American Society for Testing and Materials.
- ASTM International. (2009b). Standard Specification for Materials for Laboratory Compaction Characteristics of Soil Using Modified Effort (56,000 ft-lbf/ft3(2,700 kN-m/m3)) (Designación ASTM No. D1557-09). Estados Unidos: American Society for Testing and Materials.
- ASTM International. (2010). Standard Specification for Laboratory Determination of Water (Moisture) Content of Soil and Rock by Mass (Designación ASTM No. D2216-10). Estados Unidos: American Society for Testing and Materials.
- ASTM International. (2011). Standard Specification for Materials for Reducing Samples of Aggregate to Testing Size (Designación ASTM No. C702/C702M-11). Estados Unidos: American Society for Testing and Materials.
- ASTM International. (2012). Standard Practice for Density, Relative Density (Specific Gravity), and Absorption of Coarse Aggregate (Designación ASTM No. C127-12). Estados Unidos: American Society for Testing and Materials.
- ASTM International. (2021). Standard Test Method for CBR (California Bearing Ratio) of Laboratory-Compacted Soils (Designación ASTM No. D1883-21). Estados Unidos: ASTM International.
- ASTM International. (2021). Standard Test Methods for Laboratory Compaction Characteristics of Soil Using Standard Effort (12,400 ft-lbf/ft3 (600 kN-m/m3)) (Designación ASTM No. D698-21). Estados Unidos: ASTM International.
- Babić, B., Prager, A., & Rukavina, T. (2000). Effect of fine particles on some characteristics of granular base courses. Materials and structures, 33(7), 419–424.
- Berney, E. S., & Wahl, R. E. (2008). A rapid Soils Analysis Kit (ERDC/GSL TR-08-3). U.S. Army Engineer Research and Development Center.
- Chaulagai, R., Osouli, A., Salam, S., Tutumluer, E., Beshears, S., Shoup, H., & Bay, M. (2017). Influence of Maximum Particle Size, Fines Content, and Dust Ratio on the Behavior of Base and Subbase Coarse Aggregates. Transportation Research Record: Journal of the Transportation Research Board, 2655, 20–26. [CrossRef]
- Chow, L. C. (2014). Permanent deformation behavior of Unbound Granular Materials and rutting Model Development (Master of Science in Civil Engineering). University of Illinois, Urbana-Champaign.
- Christopher, B. R., Schwartz, C., & Boudreau, R. (2006). Geotechnical Aspects of Pavements Publicación No. FHWA NHI-05-037 (No. FHWA NHI-05-037) (pp. 1-5 y 1-6). Washington: U.S. Department of Transportation Federal Highway Administration.
- Correa, M. J., García Elier, L., Botasso, H. G., Soengas, C., & Rebollo, O. (2012). Relación entre las características petrográficas y geotécnicas de agregados de la provincia de Buenos Aires. Infraestructura Vial, 14(25), 12–29. Recuperado de http://repositorio.ucr.ac.cr/handle/10669/13601.
- Delatte, N. J. (2008). Concrete Pavement Design, Construction and Performance (1st ed). London ; New York: Taylor & Francis.
- Dirección General de Caminos y Ferrocarriles. (2013). Manual de Carreteras con Especificaciones Técnicas Generales para Construcción (Especificaciones Técnicas No. EG-2013). Perú: Ministerio de Transporte y Comunicaciones.
- Dirección General de Carreteras. (2015). Pliego de Prescripciones Técnicas Generales para Obras de Carreteras y Puentes (PG-3) (Norma No. Orden FOM/2523/2014) (pp. 51–55). España: Ministerio de Fomento del Gobierno de España.
- Federal Highway Administration (FHWA). (2016). Bases and Subbases for Concrete Pavements (Tech brief No. FHWA-HIF-16-005). U.S. Department of Transportation. Federal Highway Administration.
- Hossain, M. (1998, agosto). Influence of Moisture Content in Granular Bases on Pavement Performance (Master of Science in Civil Engineering). Texas Tech University, Texas.
- Instituto Nacional de Vías (INVIAS). (2012). Especificaciones generales de construcción de carreteras y normas de ensayo para materiales de carreteras (Especificaciones generales de construcción de carreteras No. EGC-INVIAS). Colombia: Instituto Nacional de Vías.
- Kwon, J., Kim, S. H., Tutumluer, E., & Wayne, M. H. (2017). Characterisation of unbound aggregate materials considering physical and morphological properties. International Journal of Pavement Engineering, 18(4), 303–308. [CrossRef]
- Ministerio de Vivienda y Urbanismo (MINVU). (2016). Código de Normas y Especificaciones Técnicas de Obras de Pavimentación (Norma No. 332). Santiago de Chile: Ministerio de Vivienda y Urbanismo del Gobierno de Chile.
- Montes-Arvizu, M. E., Chavez-Alegria, O., Rojas-Gonzalez, E., Gaxiola-Camacho, J. R., & Millan-Almaraz, J. R. (2020). CBR Predictive Models for Granular Bases Using Physical and Structural Properties. Applied Sciences, 10(4), 1414. [CrossRef]
- Ohiduzzaman, M., Lo, S. C. R., & Craciun, O. (2011). Effect of Plasticity of Fines on the Deformation Behavior of Unbound Granular Base Material. Geo-Frontiers 2011: Advances in Geotechnical Engineering, 4782–4791. [CrossRef]
- Rojas González, E., Chávez Alegría, O., Pérez Rea, M. de la L., & Hernández Mendoza, C. E. (2020). Geotechnical Engineering I: An Introduction to Geotechnics (1st ed.). Universidad Autónoma de Querétaro.
- Rollings, M. P., & Rollings, R. S. (1996). Geotechnical materials in construction. New York: McGraw Hill.
- Sargand, S. M., Wu, S., & Figueroa, J. L. (2006). Rational approach for base type selection. Journal of Transportation Engineering, 132(10), 753–762.
- Secretaría de Comunicaciones y Transportes (SCT). (2016). Materiales para Bases Hidráulicas (Norma No. N-CMT-4-02-002/16). México: Secretaría de Comunicaciones y Transportes.
- Siswosoebrotho, B. I., Widodo, P., & Augusta, E. (2005). The influence of fines content and plasticity on the strength and permeability of aggregate for base course material. En Proceedings of the Eastern Asia Society for Transportation Studies (Vol. 5, pp. 853–856). Citeseer. Recuperado a partir de http://citeseerx.ist.psu.edu/viewdoc/download?doi=10.1.1.558.5001&rep=rep1&type=pdf.
- Taskiran, T. (2010). Prediction of California bearing ratio (CBR) of fine grained soils by AI methods. Advances in Engineering Software, 41(6), 886–892. [CrossRef]
- Tutumluer, E. (2013). Practices for Unbound Aggregate Pavement Layers. Washington, D.C.: Transportation Research Board. [CrossRef]
- Yildirim, B., & Gunaydin, O. (2011). Estimation of California bearing ratio by using soft computing systems. Expert Systems with Applications, 38(5), 6381–6391. [CrossRef]
- Yoder, E. J., & Witczak, M. W. (1975). Principles of Pavement Design (Second). Estados Unidos: John Wiley & Sons, Inc.
- Zhang, Z., Lyu, D., Xiao, Y., Chen, L., & Chen, X. (2017). Laboratory Investigation of the Mechanical Stability of Unbound Permeable Aggregate Base Materials: Preliminary Direct Shear Test Results. Geotechnical Frontiers 2017, 393–404.
- Zhou, W., Choi, P., Ryu, S. W., & Won, M. C. (2015). Evaluation of Pavement Support for Pavement Design. Journal of Transportation Engineering, 141(9), 04015019. [CrossRef]
Figure 1.
Grain size distribution for the samples from eight quarries. Granulometric Guidelines under Spain's PG-3 Standard (Dirección General de Carreteras, 2015).
Figure 1.
Grain size distribution for the samples from eight quarries. Granulometric Guidelines under Spain's PG-3 Standard (Dirección General de Carreteras, 2015).
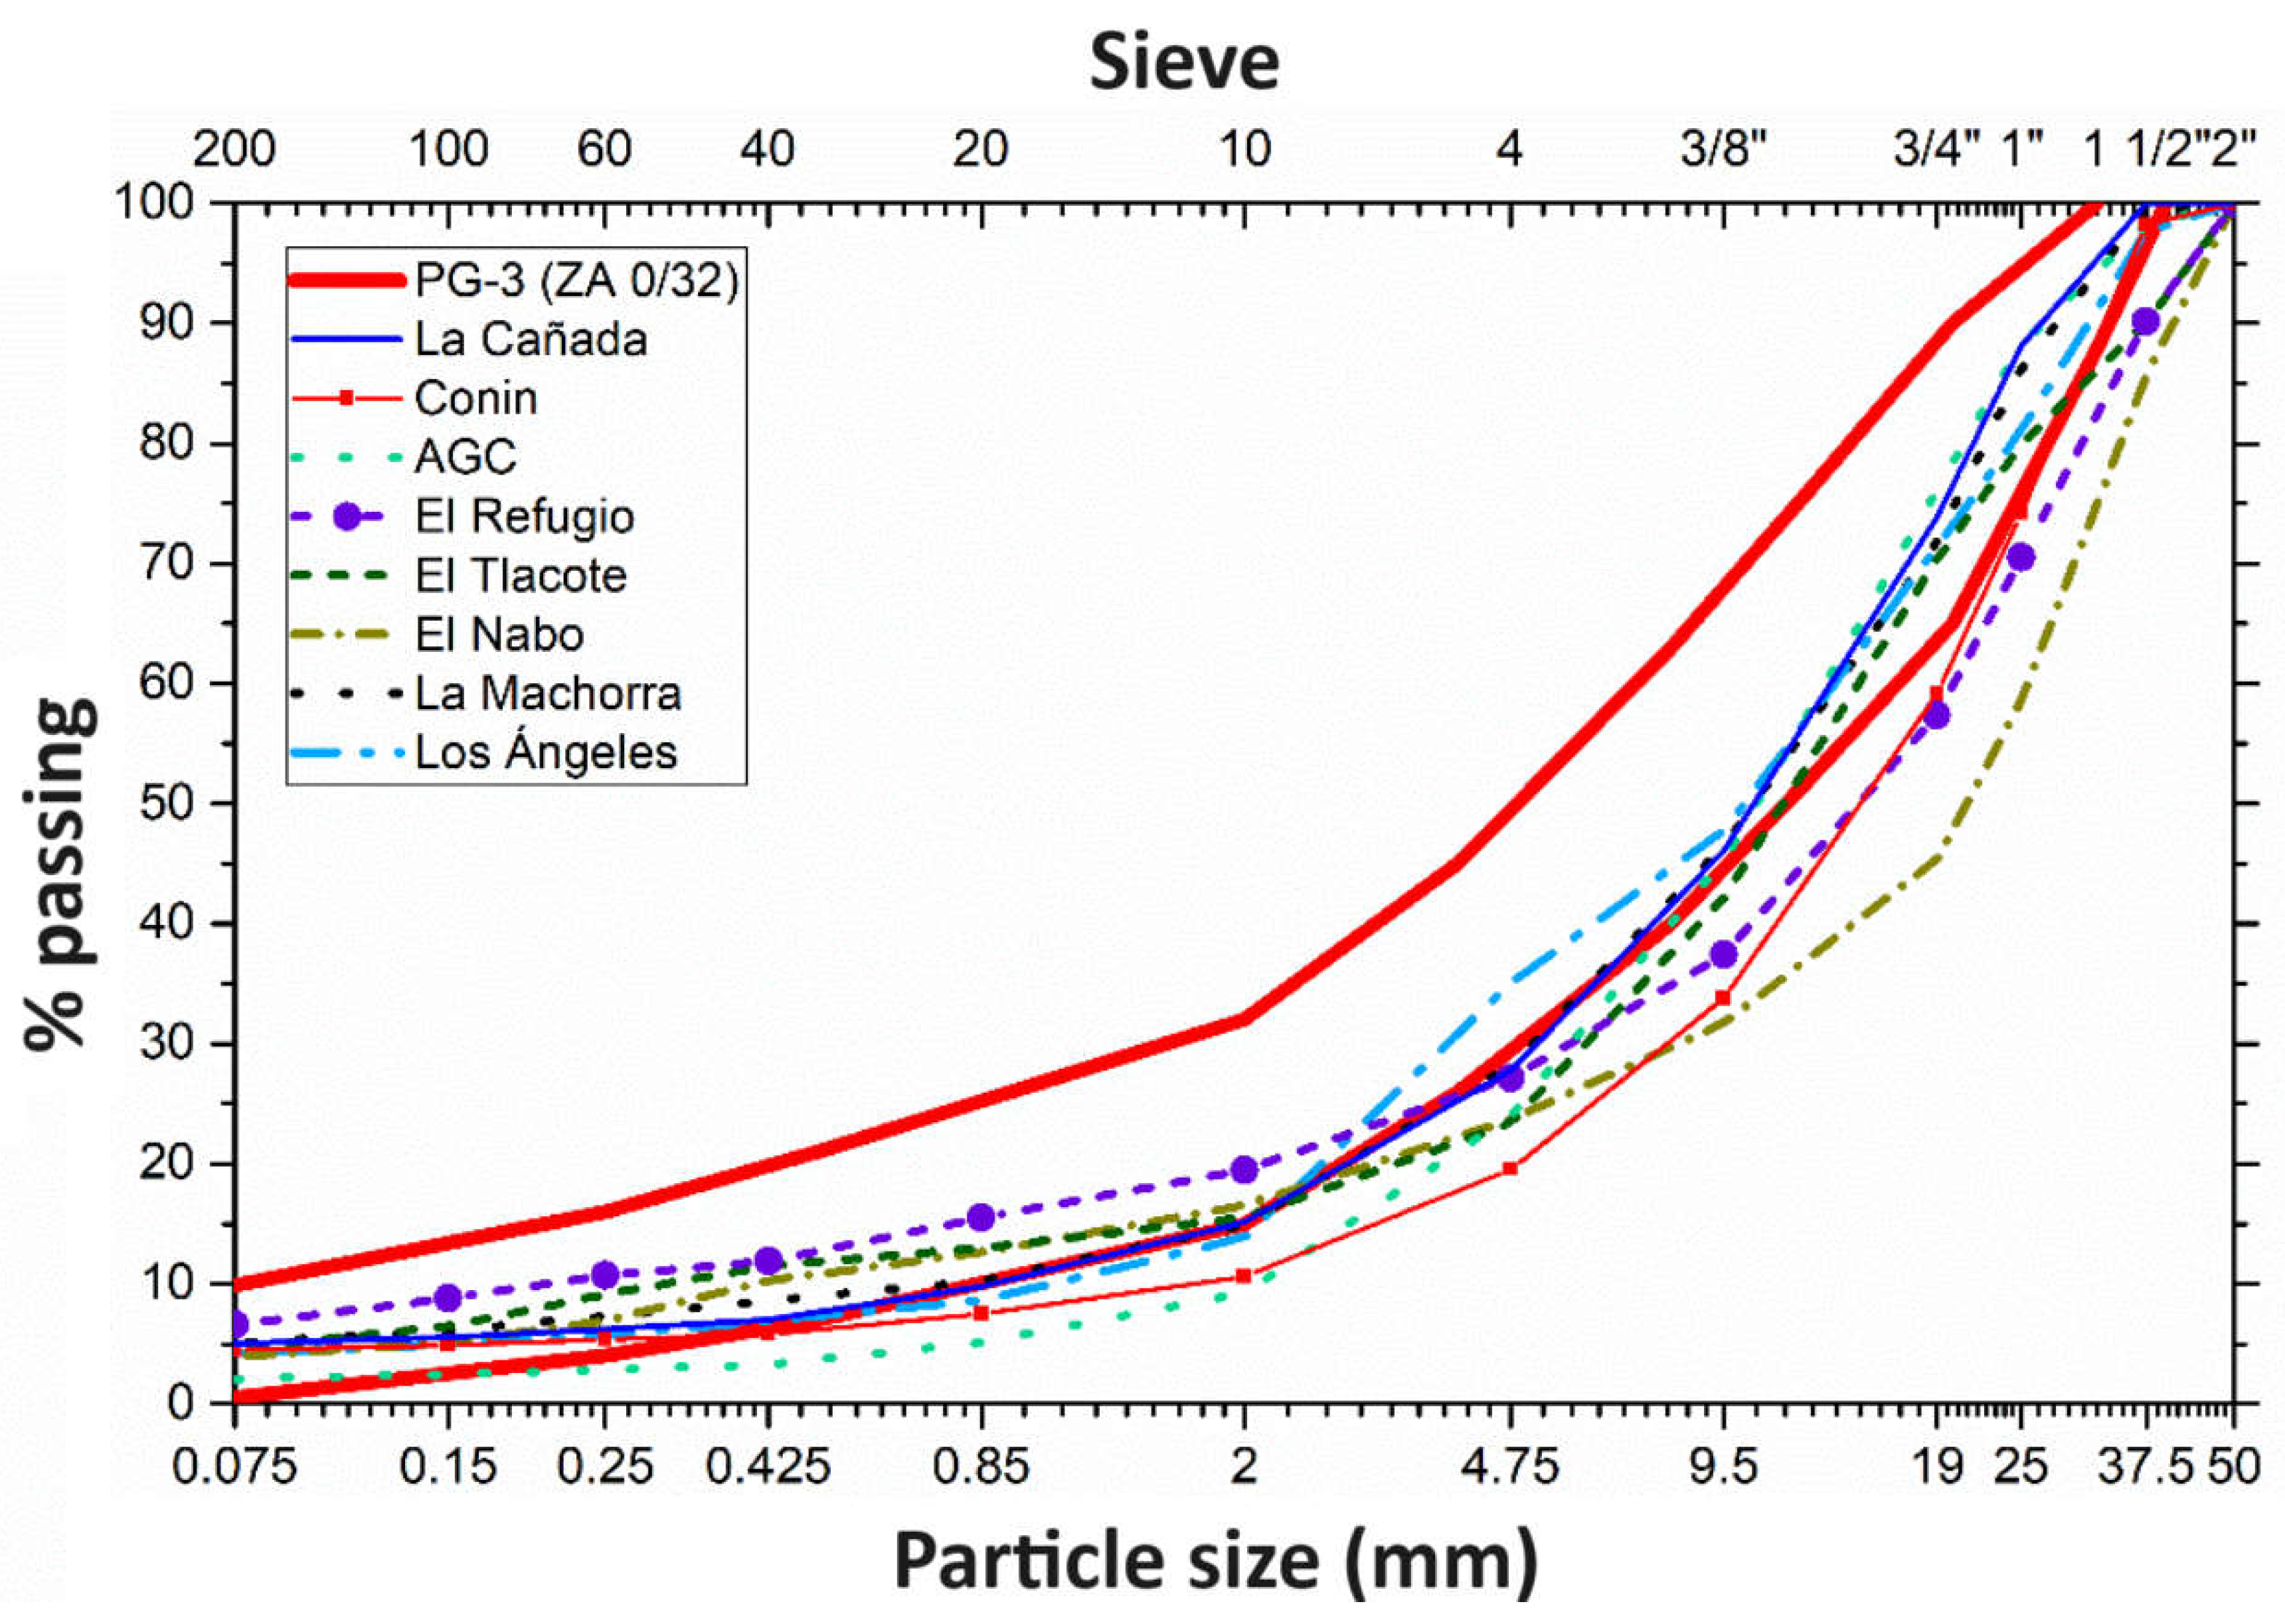
Figure 2.
Grain size distribution for the samples from eight quarries. Granulometric Guidelines under ASTM D2940 Standard (ASTM International, 2009).
Figure 2.
Grain size distribution for the samples from eight quarries. Granulometric Guidelines under ASTM D2940 Standard (ASTM International, 2009).
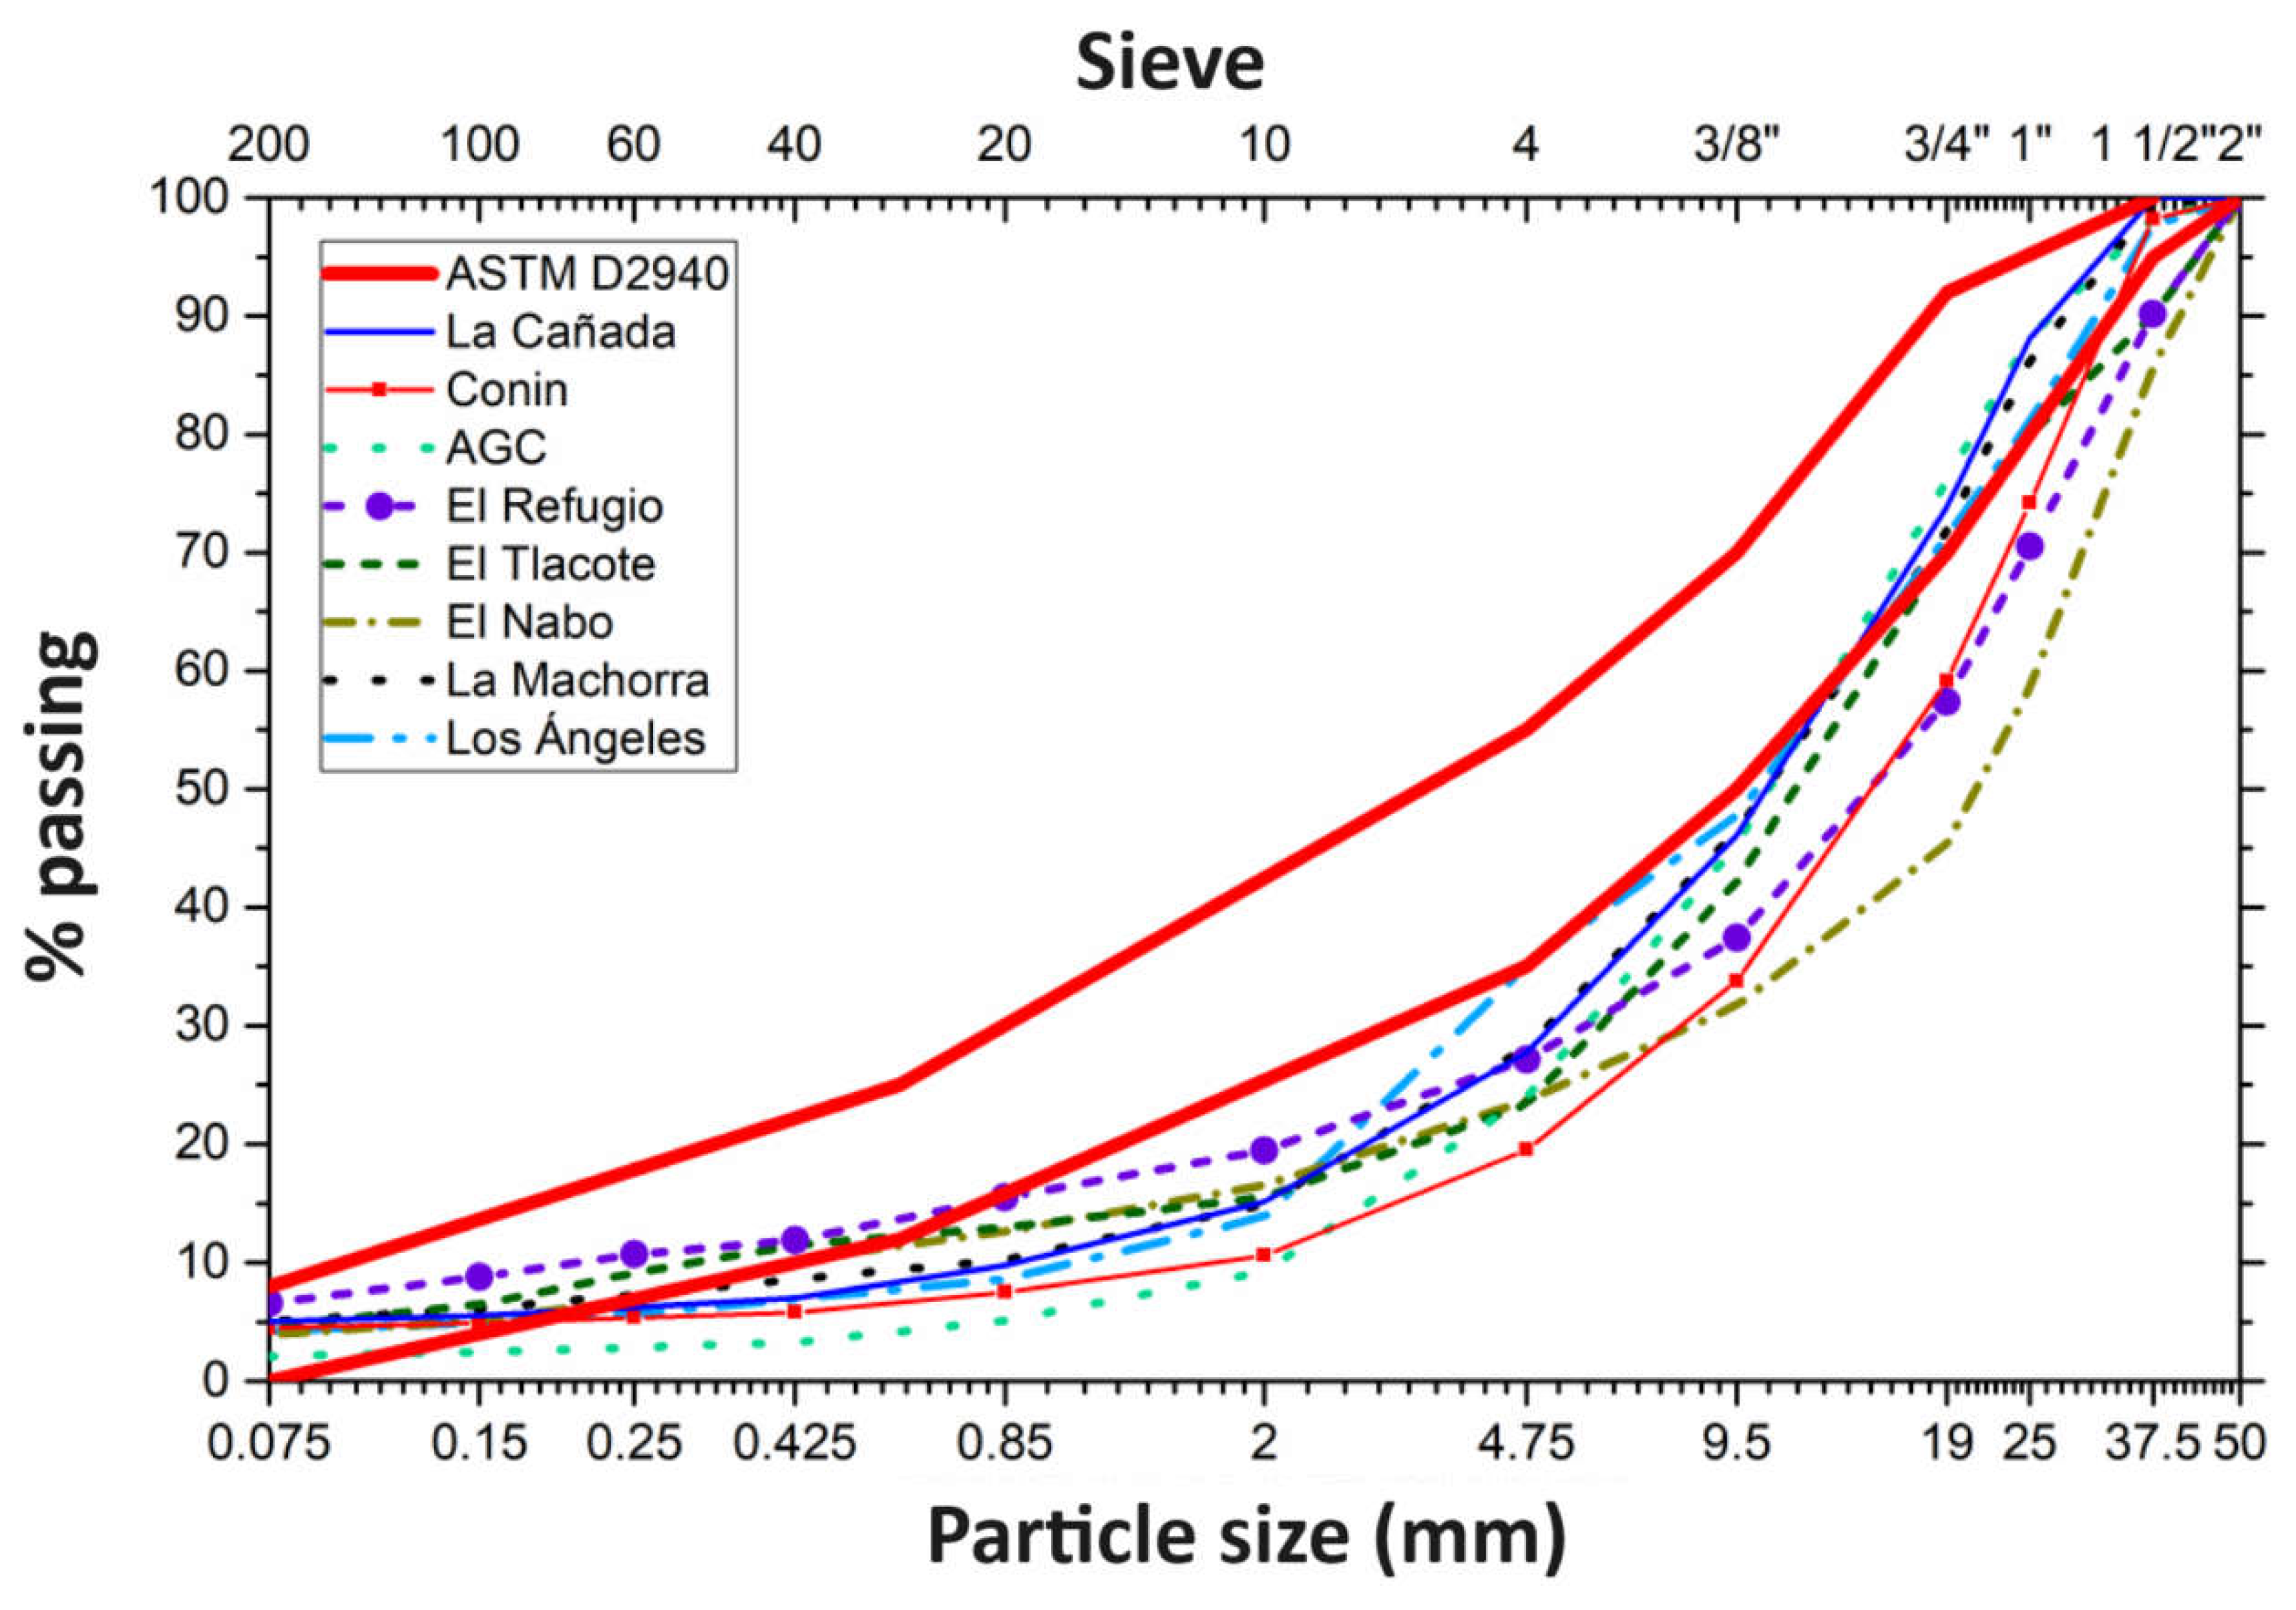
Figure 3.
Grain size distribution for the samples from eight quarries. Granulometric Guidelines under United States AASHTO Standard (AASHTO, 2012) and Peru EG-2013 Standard (Dirección General de Caminos y Ferrocarriles, 2013) (Type A and B).
Figure 3.
Grain size distribution for the samples from eight quarries. Granulometric Guidelines under United States AASHTO Standard (AASHTO, 2012) and Peru EG-2013 Standard (Dirección General de Caminos y Ferrocarriles, 2013) (Type A and B).
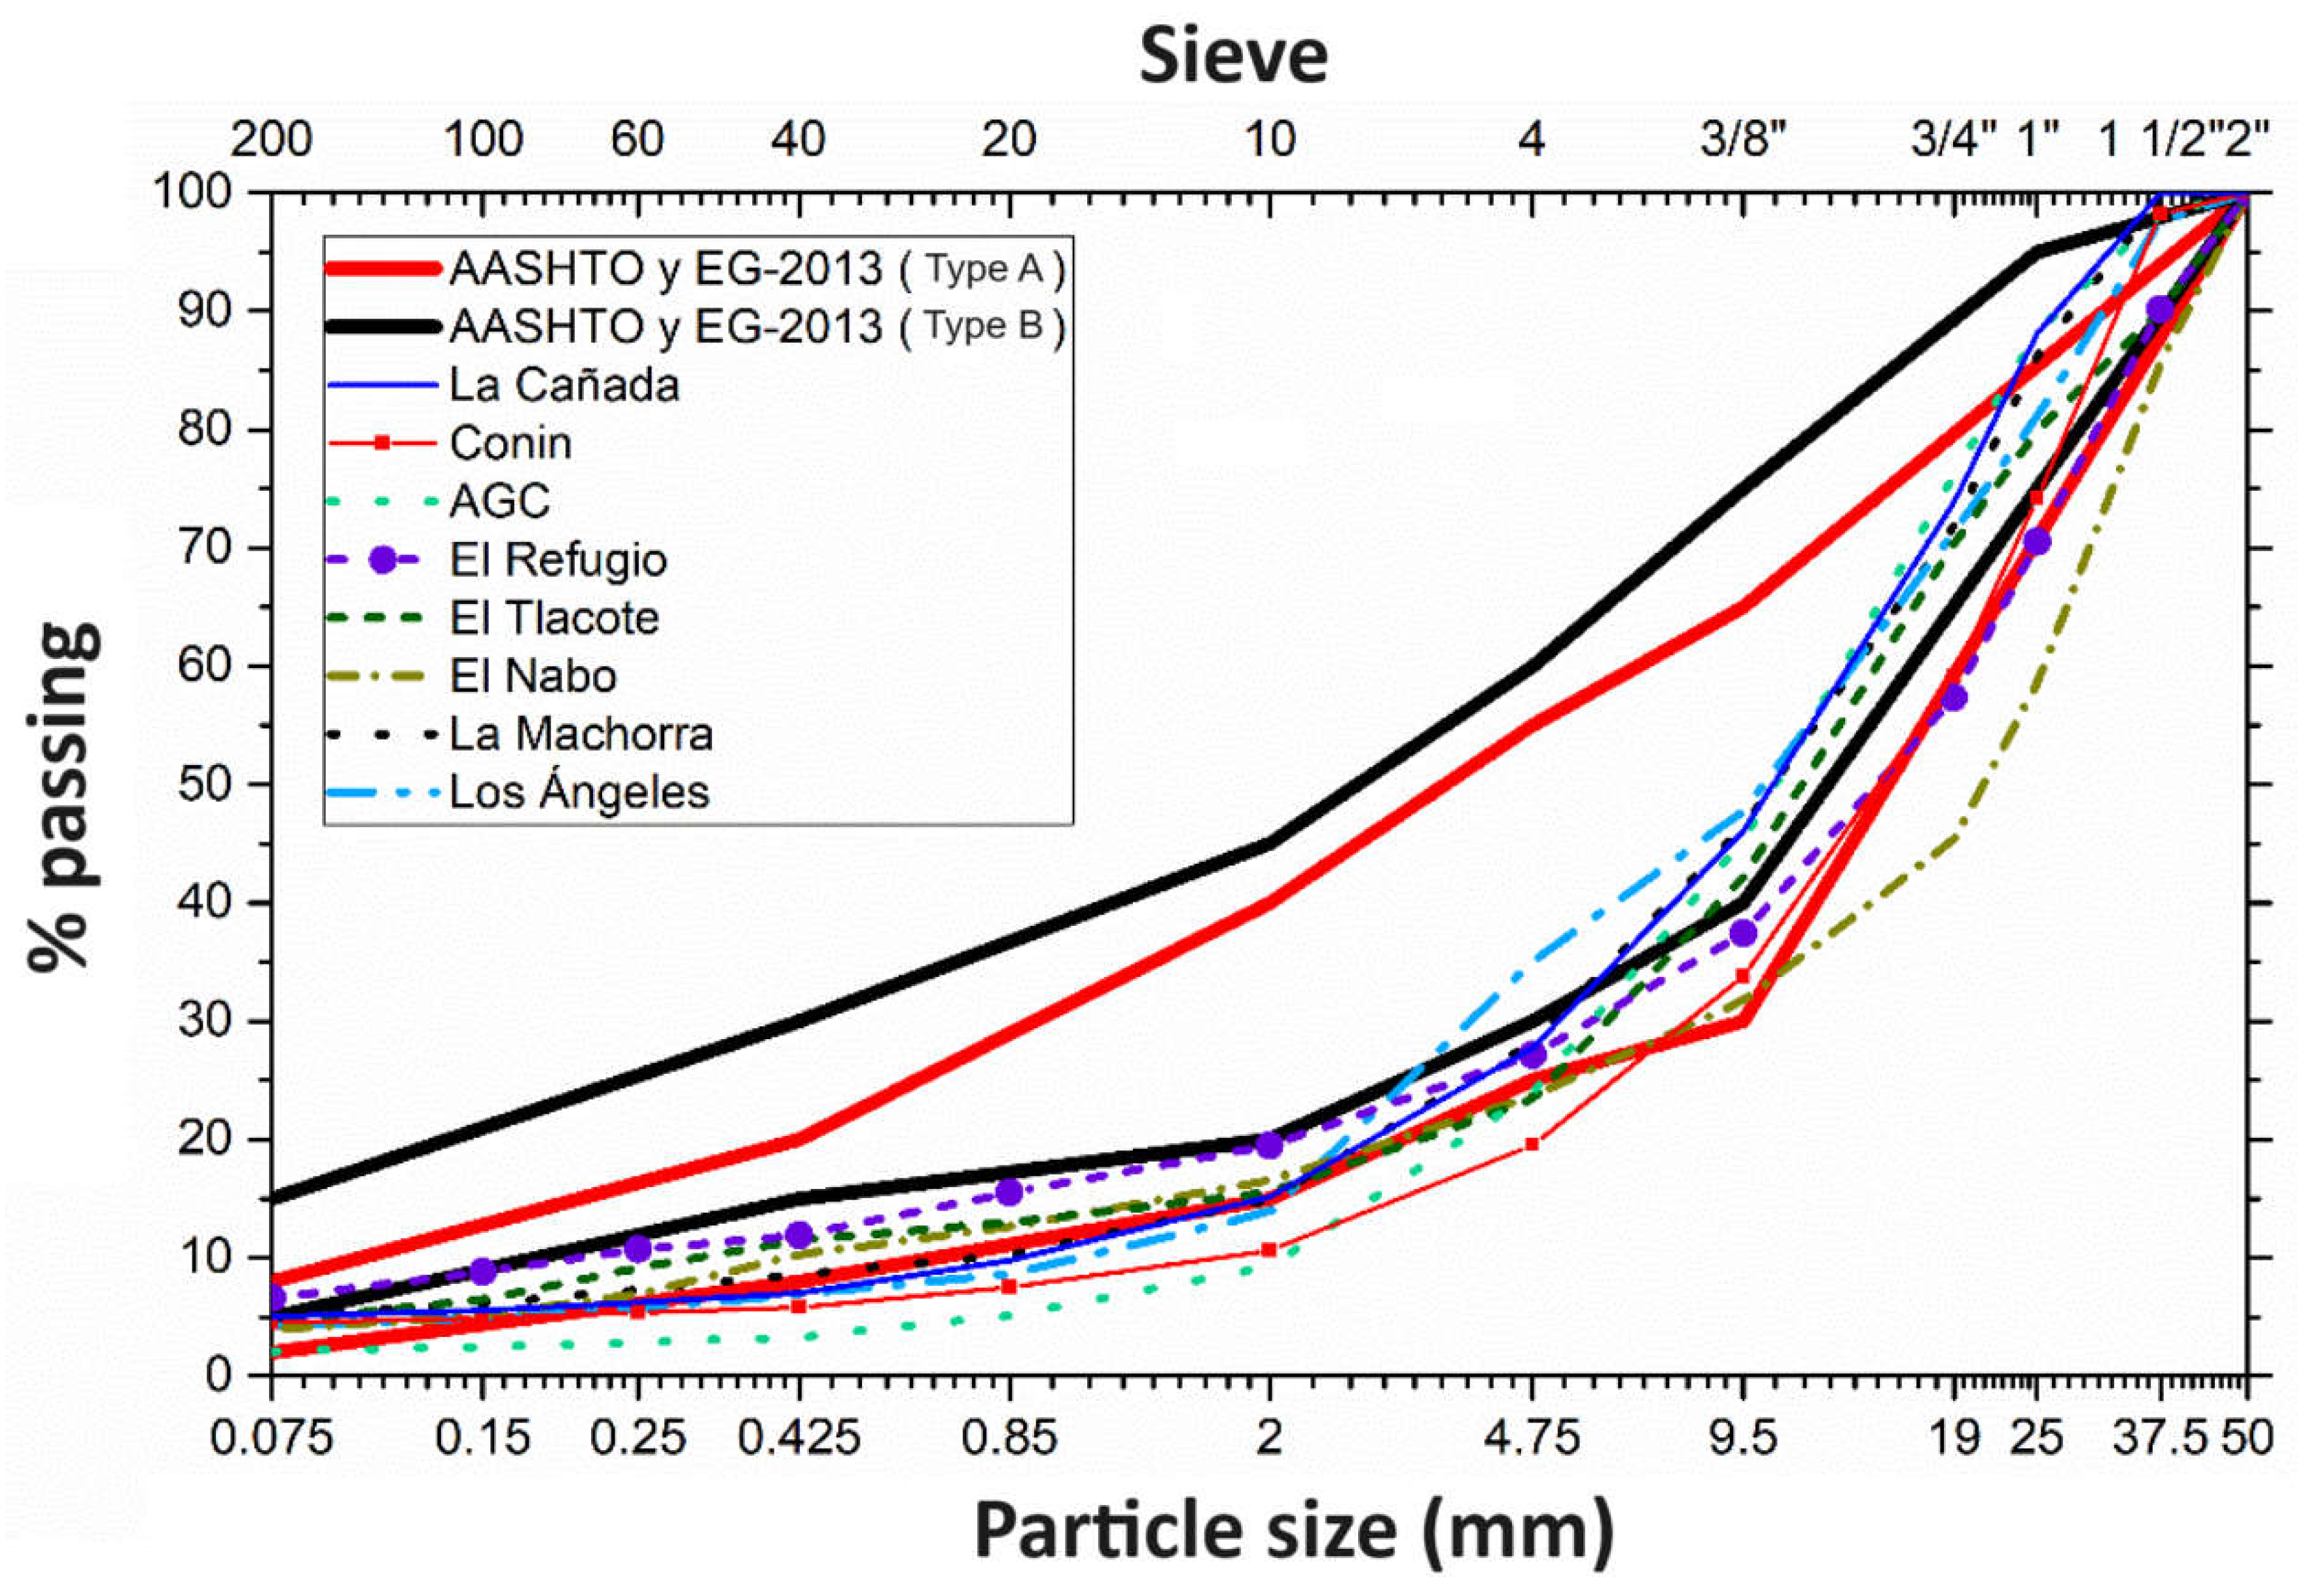
Figure 4.
Grain size distribution for the samples from eight quarries. Granulometric Guidelines under Chilean Standard Publication 332 (MINVU, 2016) (Band 1 and 3).
Figure 4.
Grain size distribution for the samples from eight quarries. Granulometric Guidelines under Chilean Standard Publication 332 (MINVU, 2016) (Band 1 and 3).
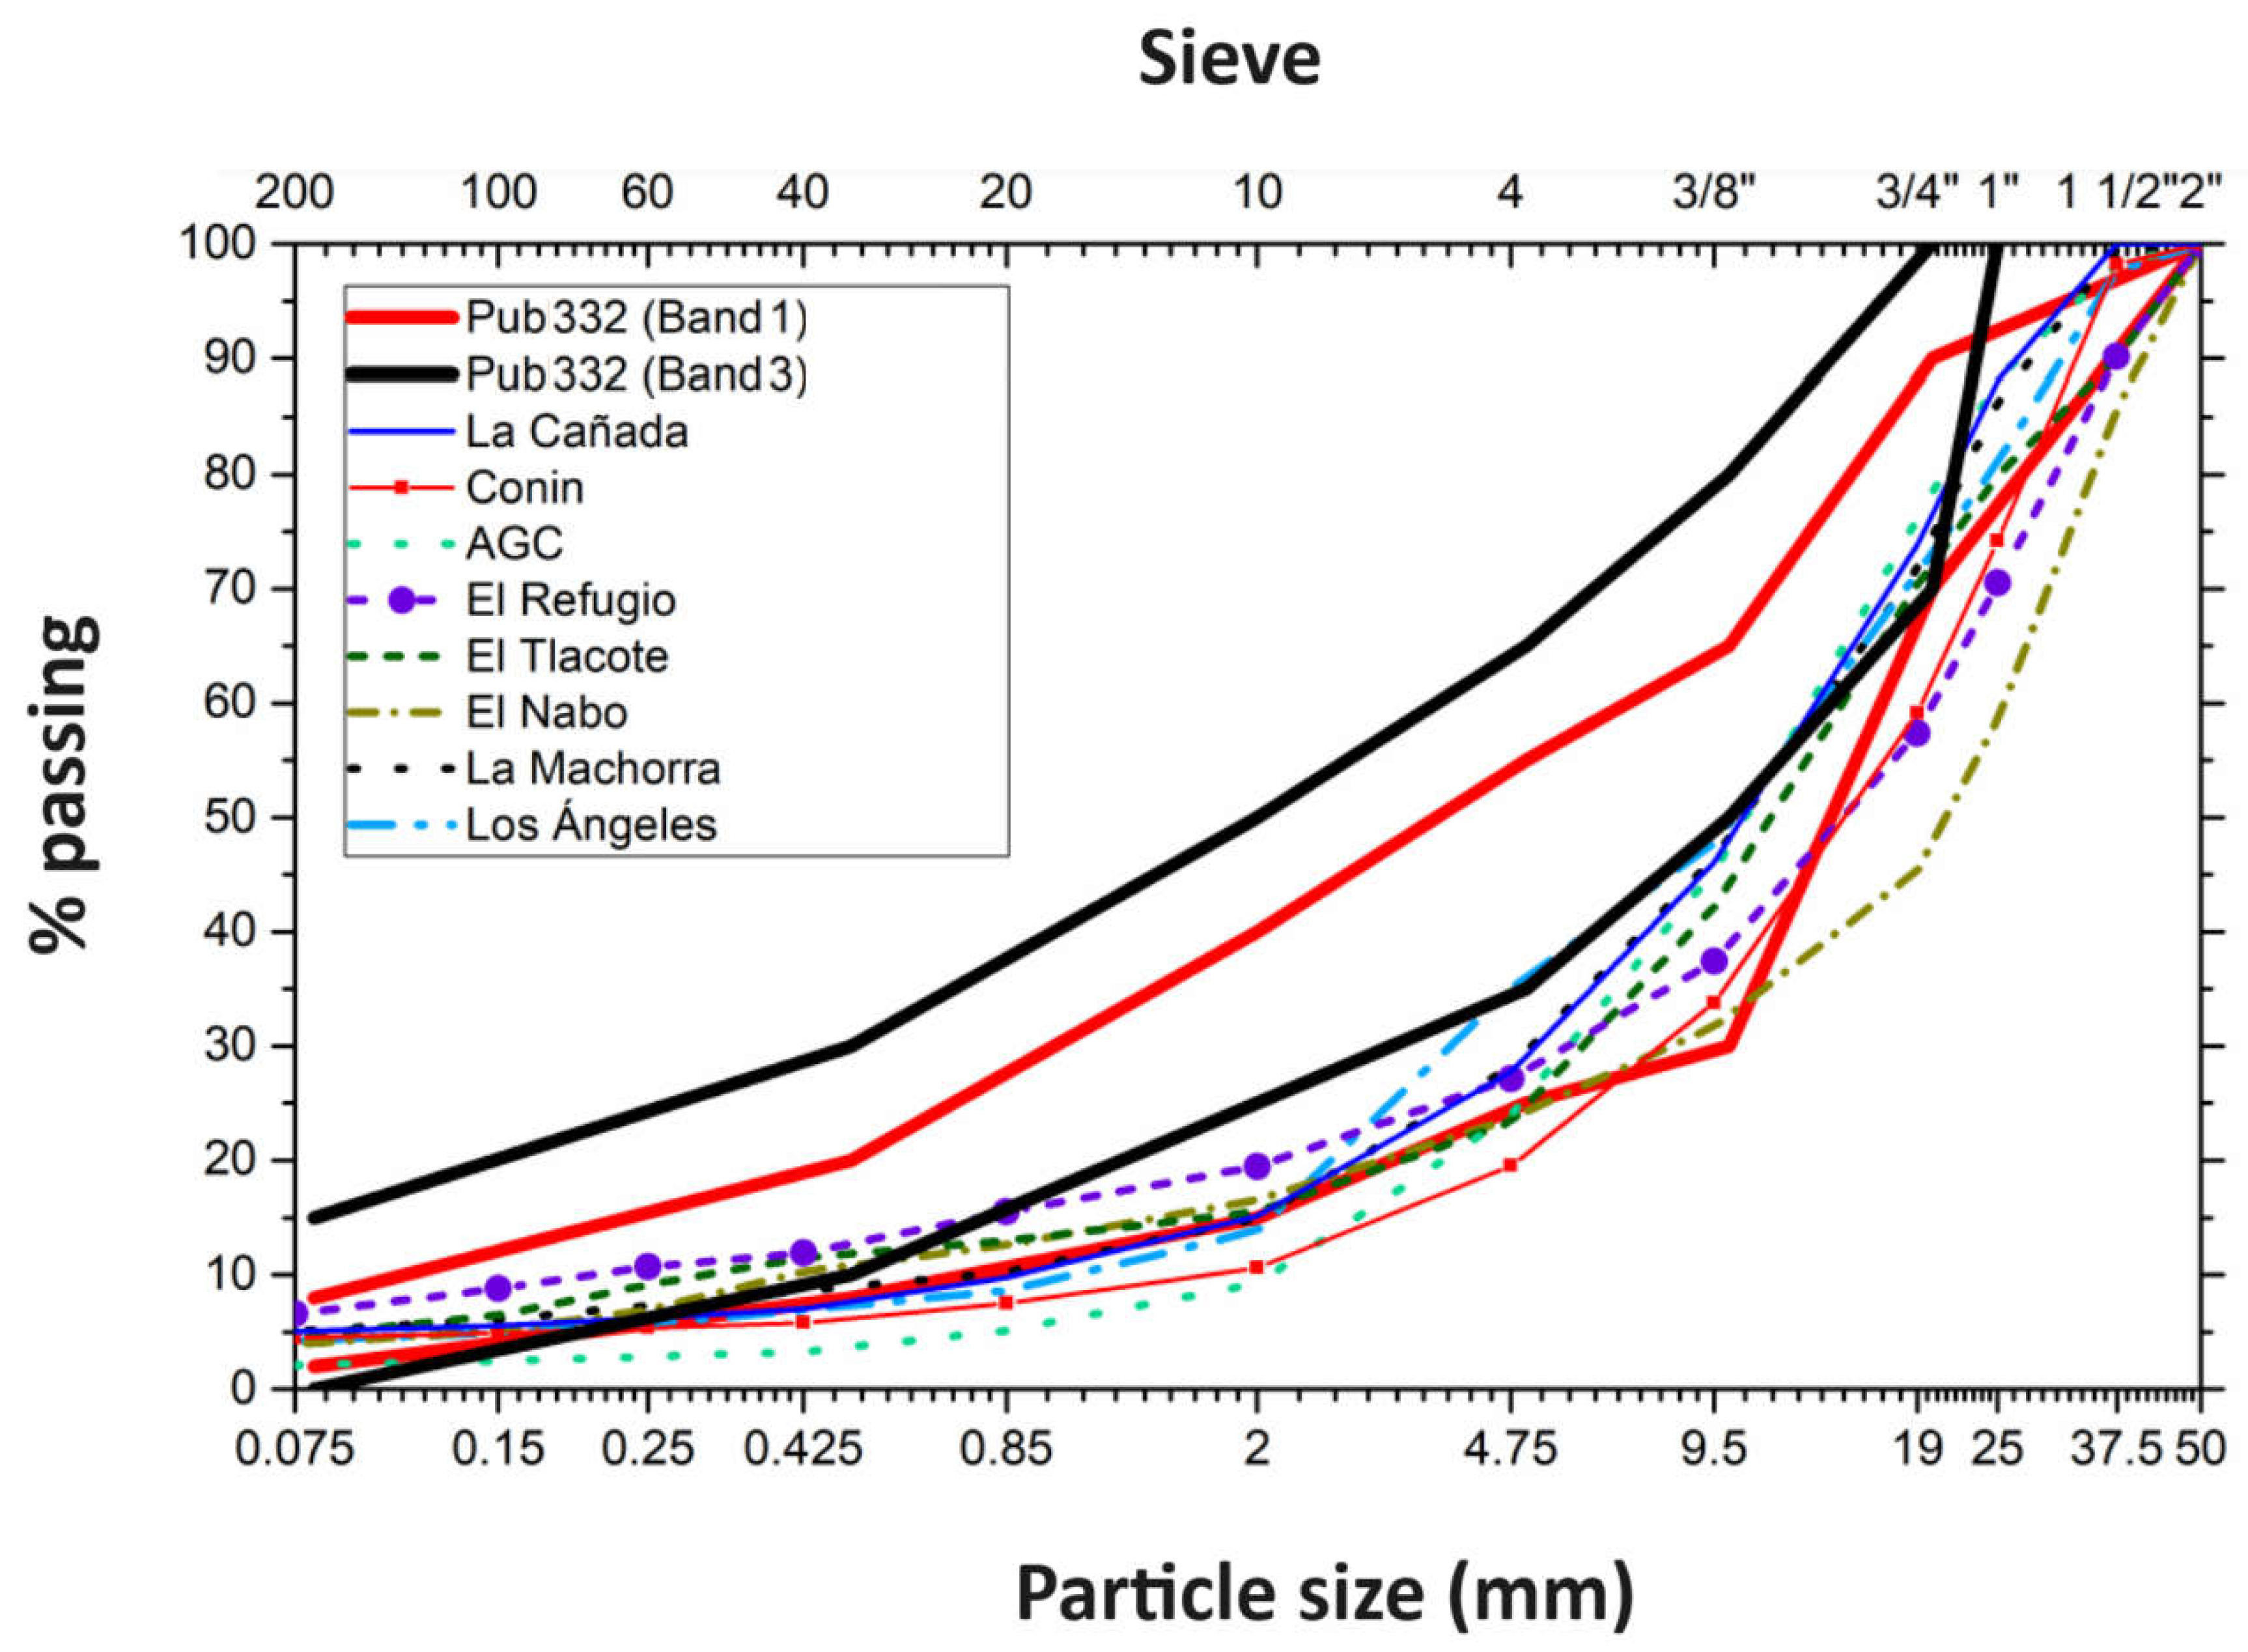
Figure 5.
Grain size distribution for the samples from eight quarries. Granulometric Guidelines under Colombian Standard EG-INVIAS (Instituto Nacional de Vías, 2012).
Figure 5.
Grain size distribution for the samples from eight quarries. Granulometric Guidelines under Colombian Standard EG-INVIAS (Instituto Nacional de Vías, 2012).
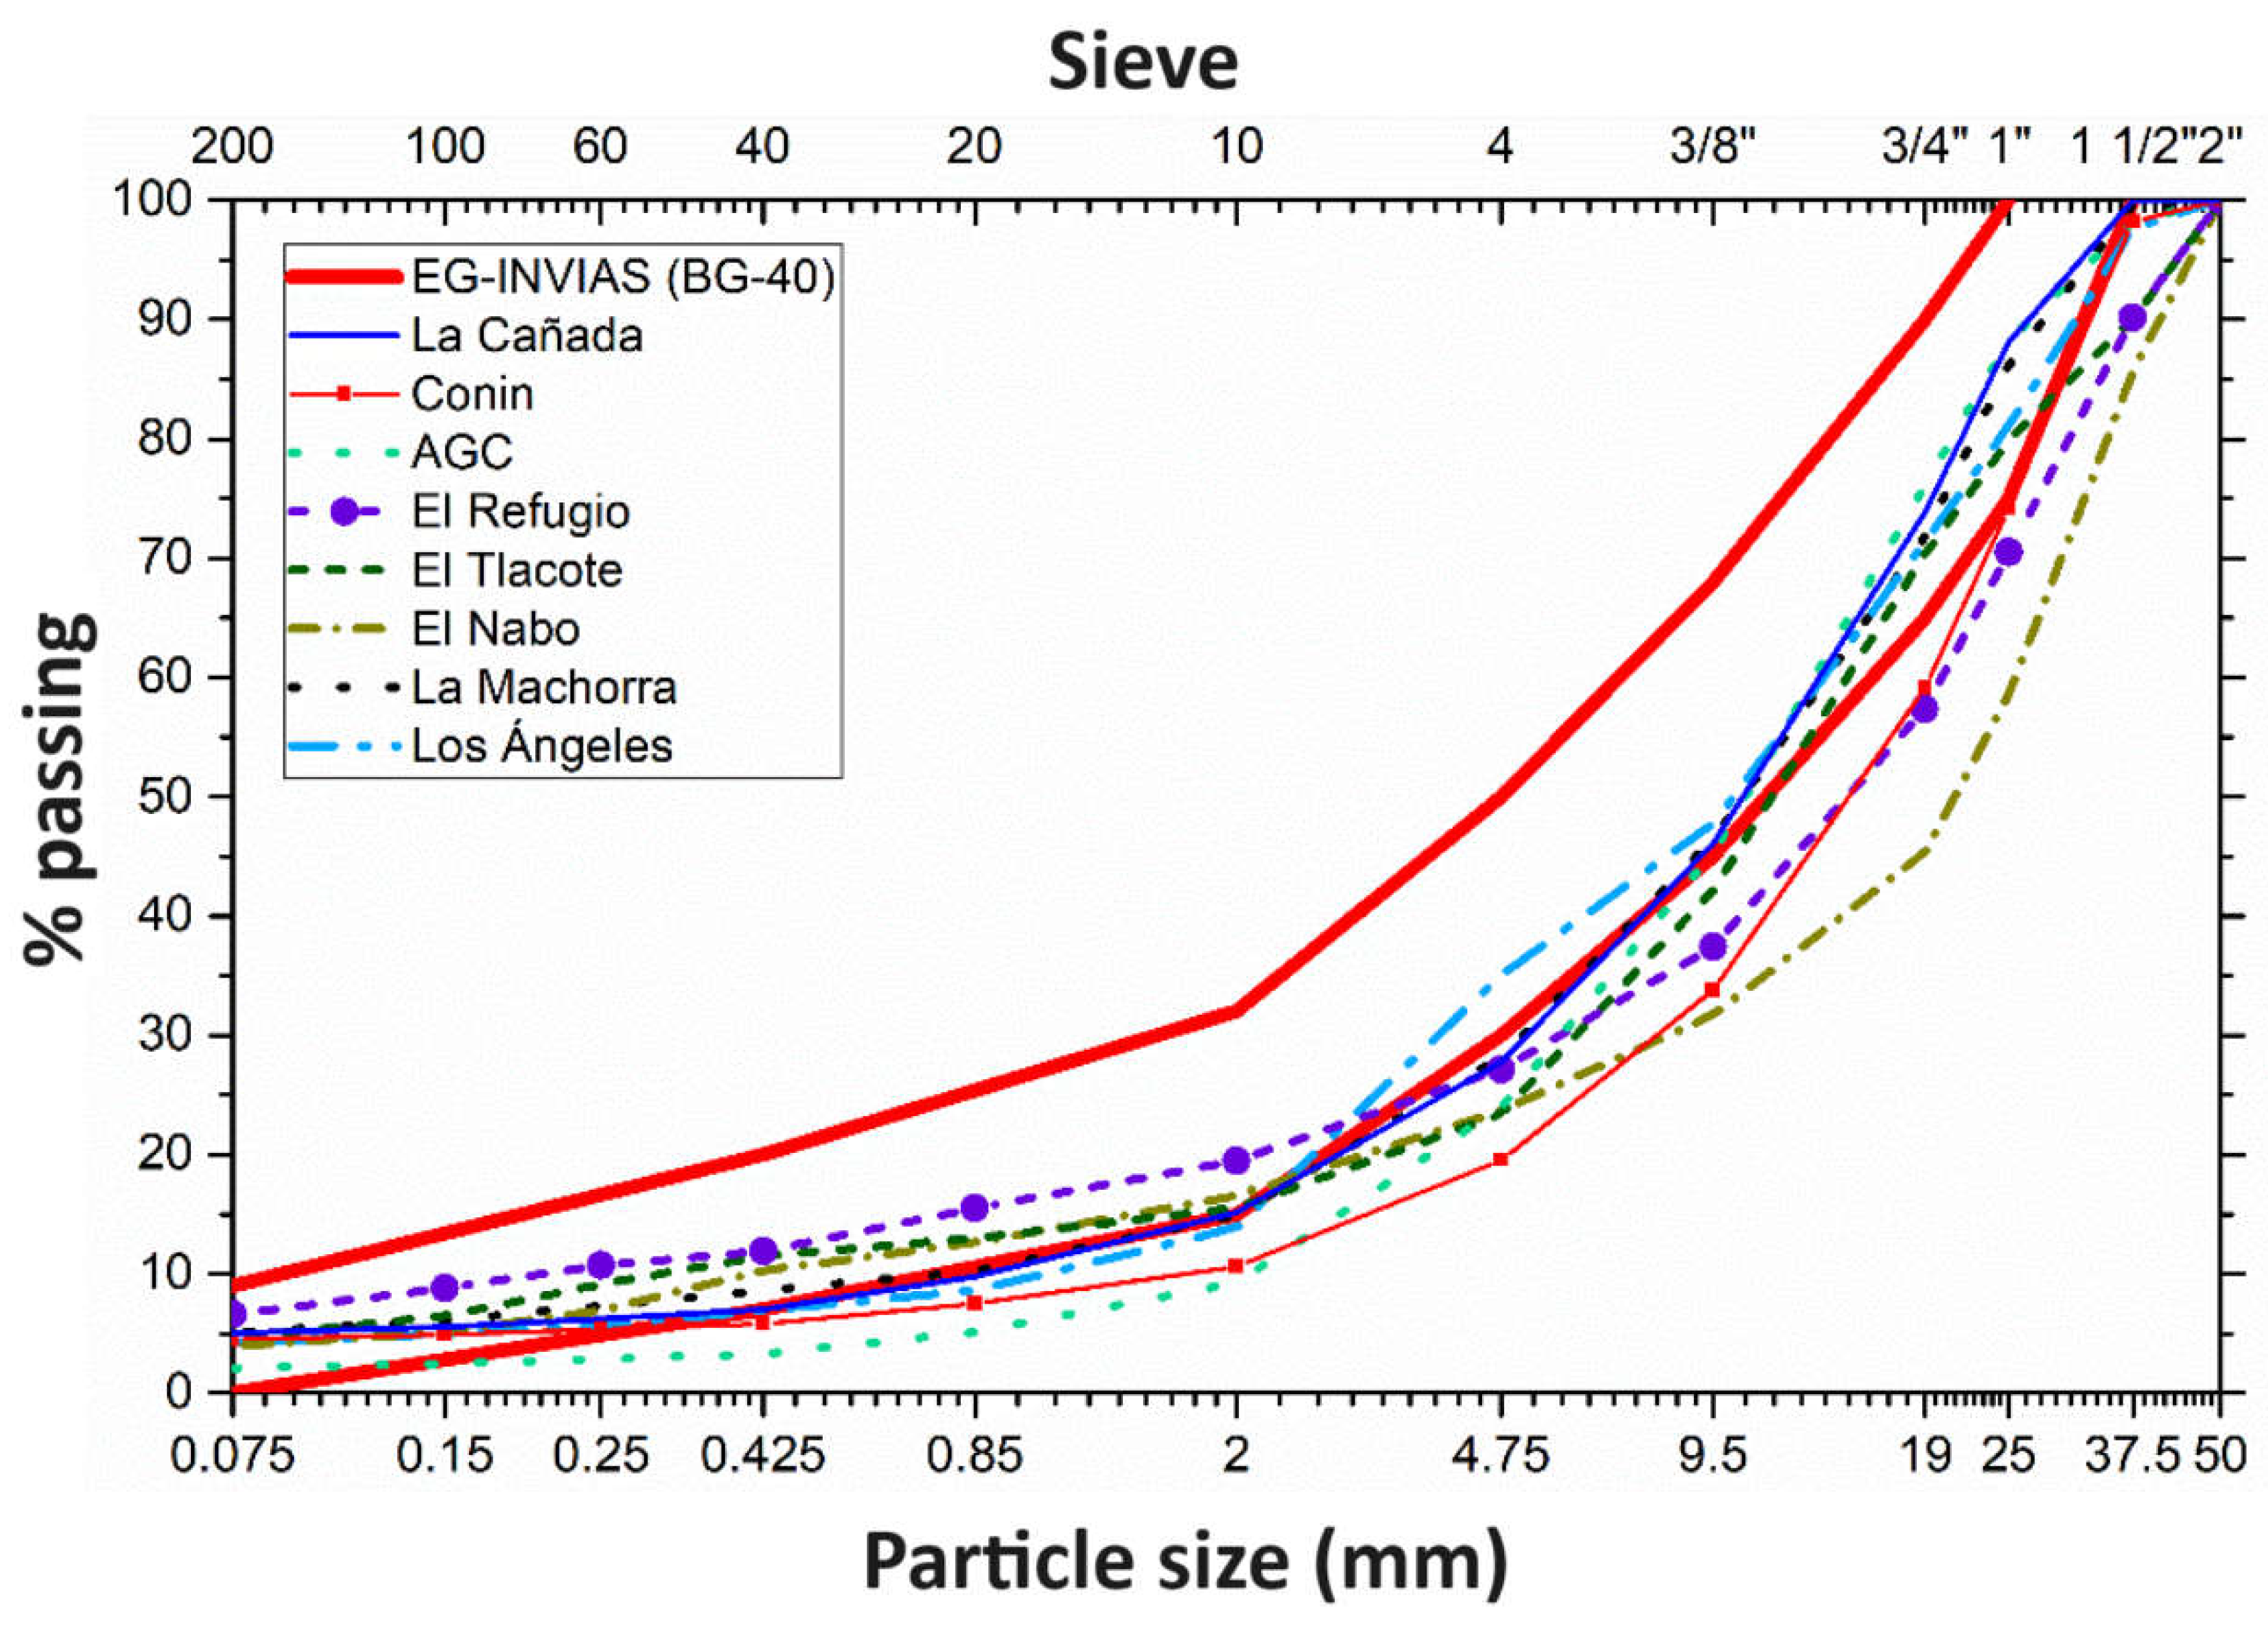
Figure 6.
Iso-CBR curves. Black line for ASTM D 698, red line for ASTM D 1557.
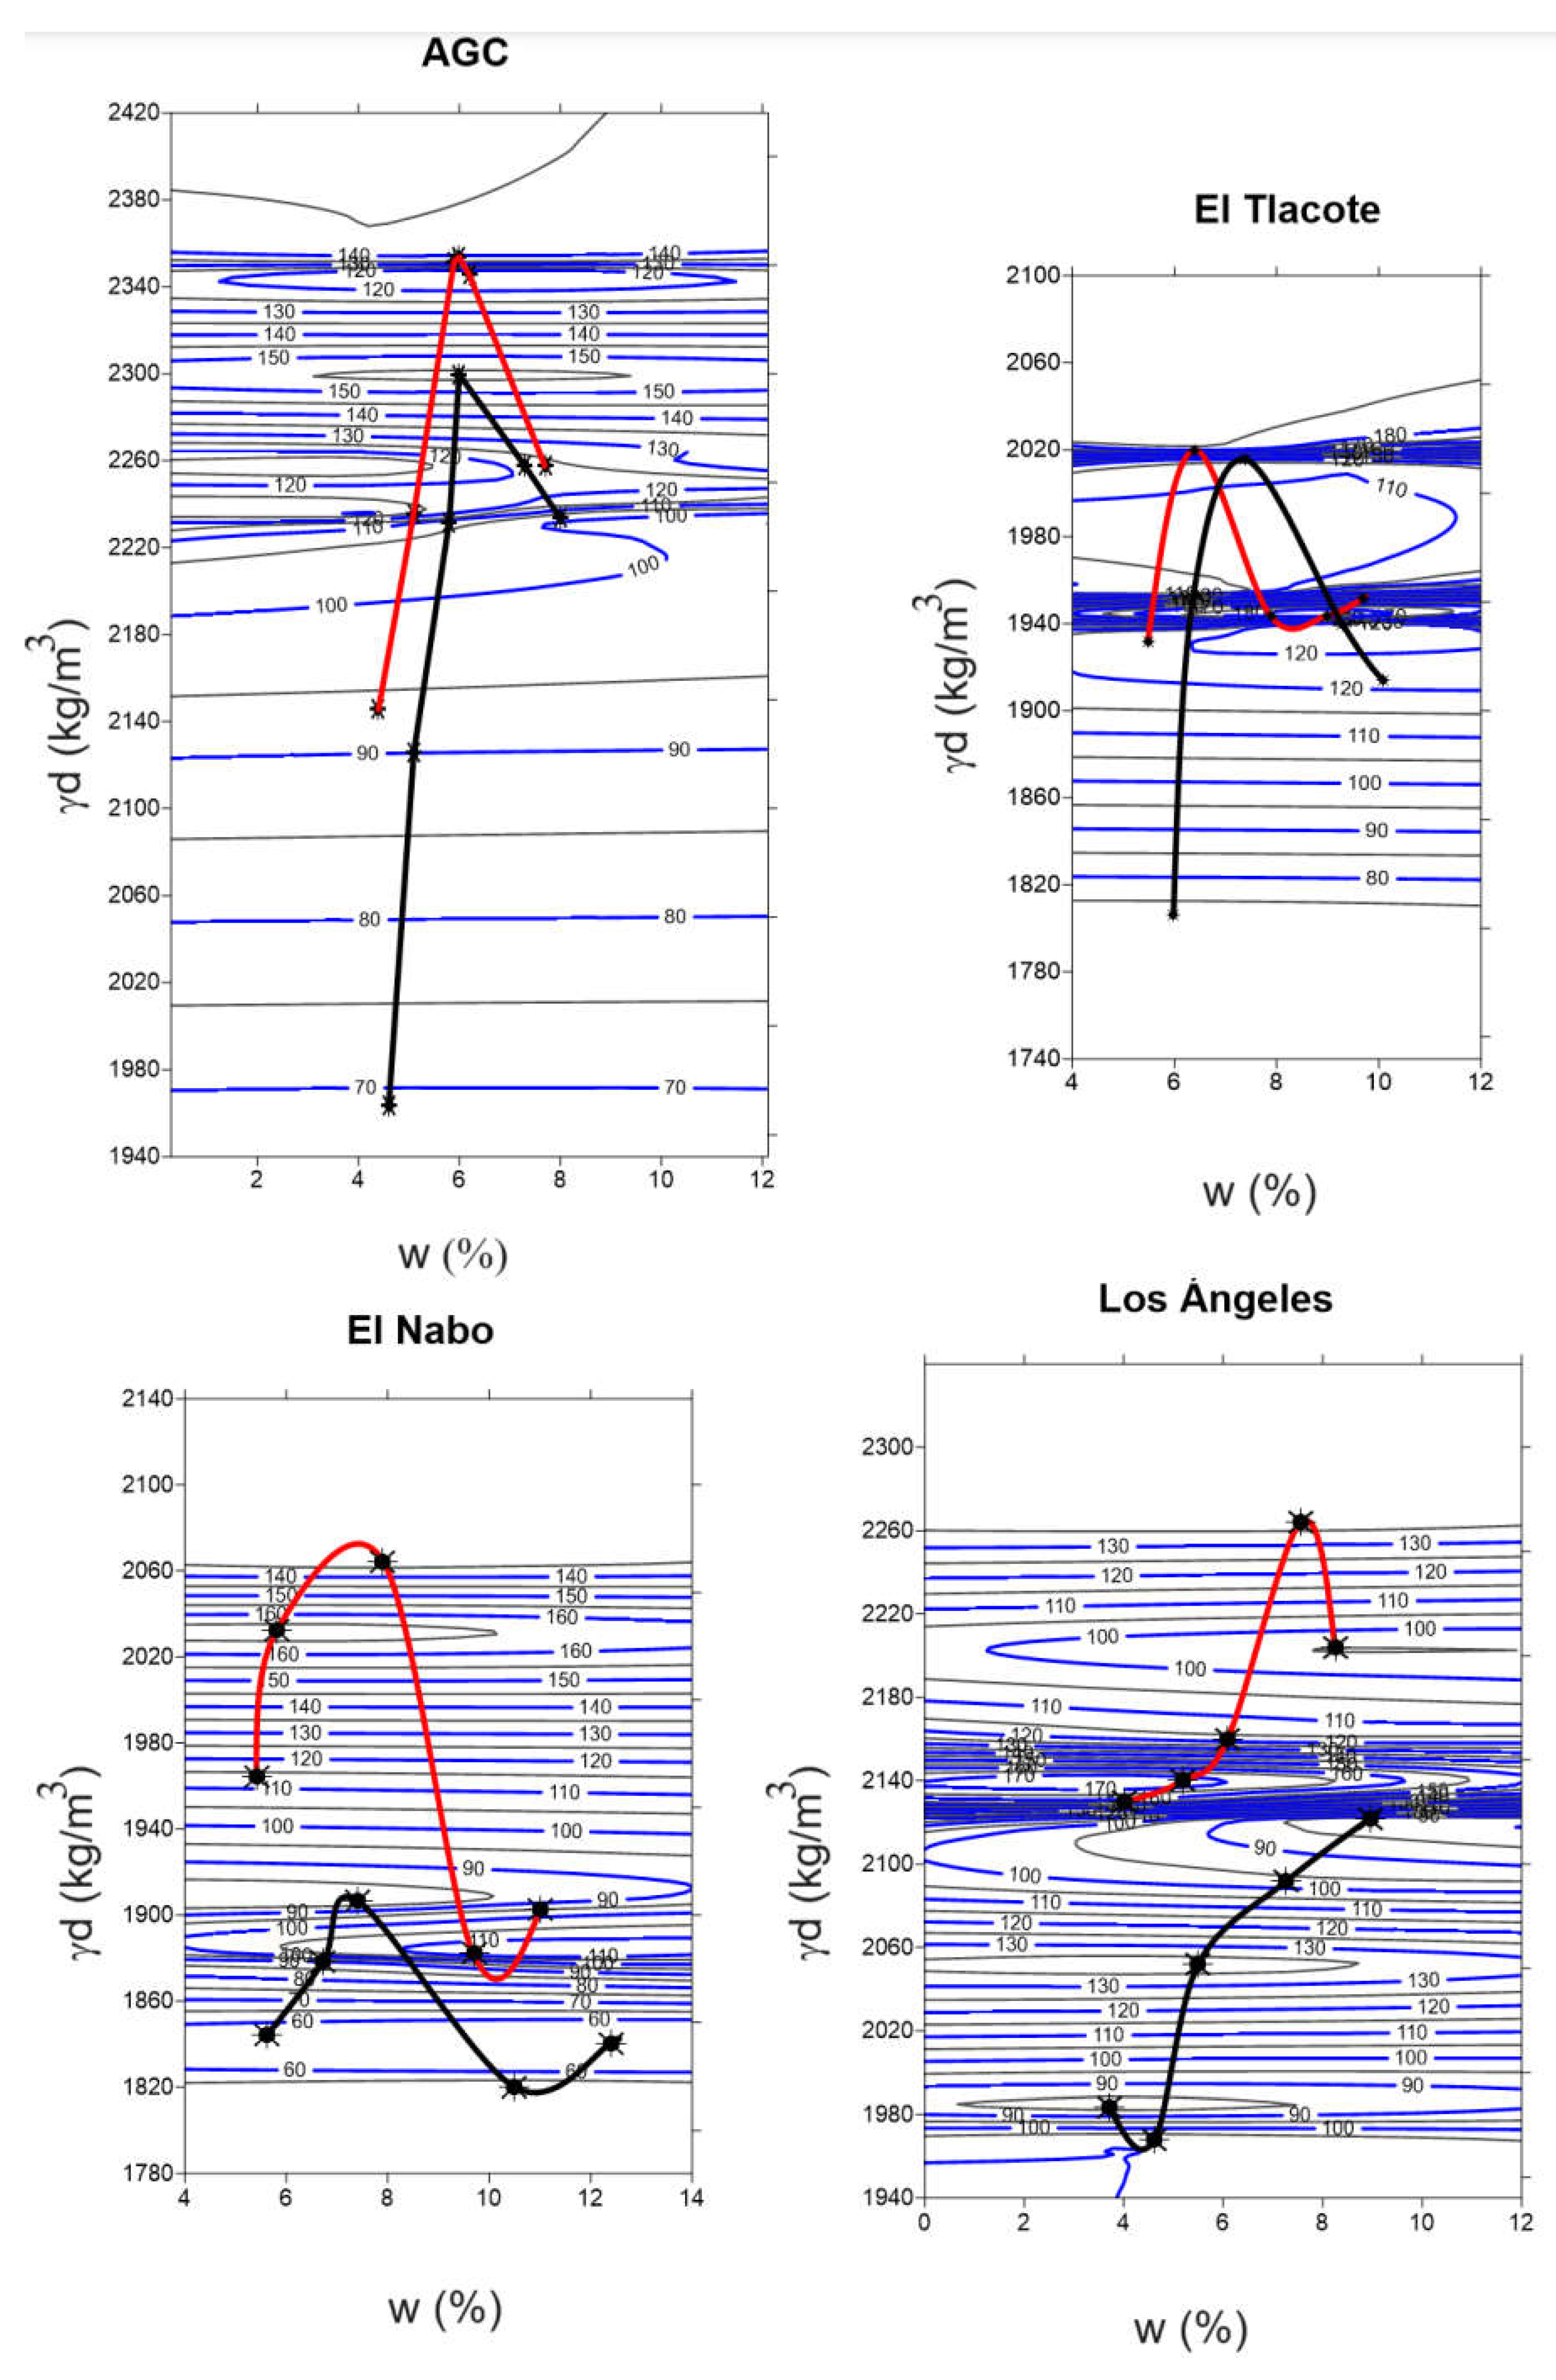
Figure 7.
Void Ratio (e) vs. Degree of Compaction (Gc), including ideal quality zones concerning the void ratio.
Figure 7.
Void Ratio (e) vs. Degree of Compaction (Gc), including ideal quality zones concerning the void ratio.
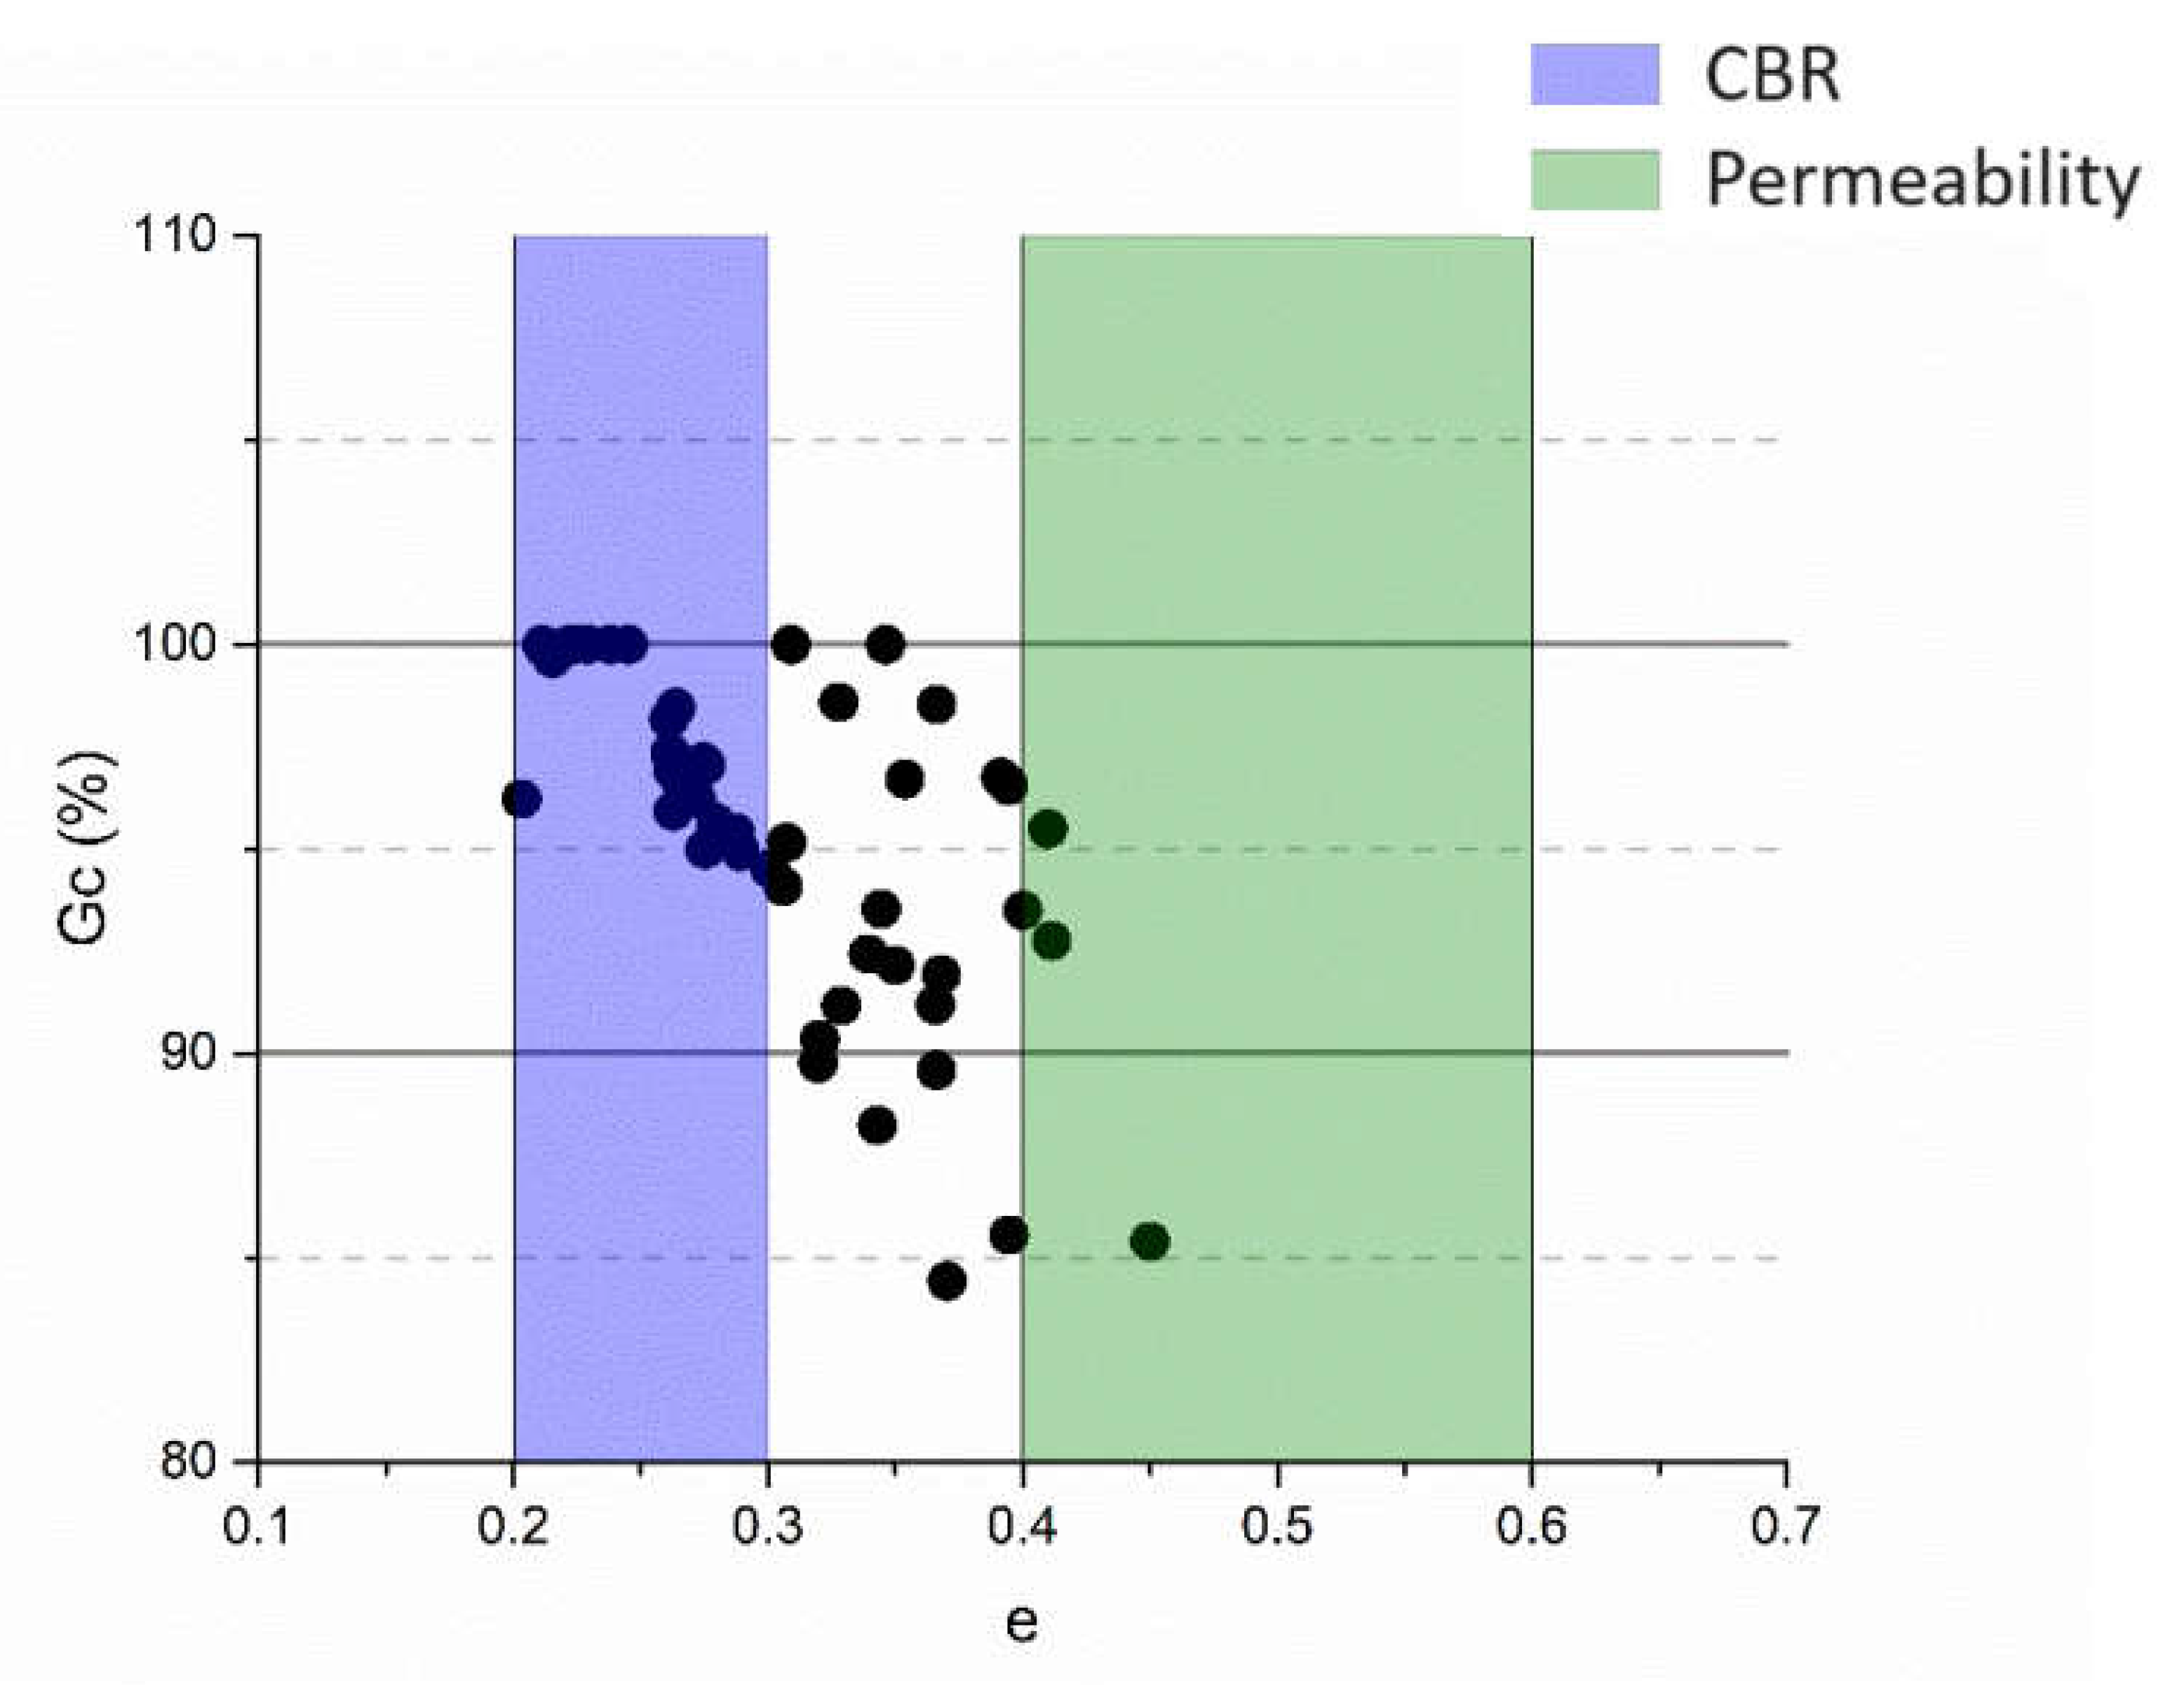

Table 1.
Location and geological characteristics of the rocks, treatment and classification of the soils.
Table 1.
Location and geological characteristics of the rocks, treatment and classification of the soils.
| Quarry | Geographical coordinates | Rock genesis | |
| La Cañada | 20°37’25.76”N | 100°18’23.94”O | Igneous basic extrusive |
| AGC | 20°37’24.90”N | 100°18’39.64”O | |
| Conin | 20°34’33.64”N | 100°18’33.53”O | |
| La Machorra | 20°32’21.88”N | 100°18’52.09”O | |
| Los Ángeles | 20°31’11.55”N | 100°30’7.50”O | |
| El Nabo | 20°40’53.48”N | 100°28’56.38”O | |
| El Tlacote | 20°39’49.70”N | 100°30’56.77”O | Igneous Acid extrusive |
| El Refugio | 20°47’44.02”N | 100°25’18.25”O | |
Table 2.
Parameters to Achieve a Minimum 80% CBR.
| Quarry | Energy | 100% of Gc | Conditions to obtain 80% of CBR | ||||
| MDD (kg/m3) | W opt. (%) | LBD (kg/m3) | w (%) | Gc in relation with MDD | CBR minimum | ||
| AGC | ASTM D 698 | 2300 | 6 | 2126 | 5.1 | 92 | 90 |
| ASTM D 1557 | 2354 | 6 | 2146 | 4.4 | 91 | 94 | |
| El Tlacote | ASTM D 698 | 2016 | 7.4 | 1840 | 4 | 91 | 90 |
| ASTM D 1557 | 2020 | 6.4 | 1932 | 5.5 | 96 | 121 | |
| El Nabo | ASTM D 698 | 1906 | 7.4 | 1880 | 6.7 | 99 | 90 |
| ASTM D 1557 | 2064 | 7.9 | 1902 | 11 | 92 | 98 | |
| Los Ángeles | ASTM D 698 | 2122 | 9 | 1985 | 4 | 94 | 90 |
| ASTM D 1557 | 2264 | 7.6 | 2204 | 8.3 | 97 | 94 | |
LBD= Loose Bulk density. wopt= optimum water content. w= water content. CBR: California Bearing Ratio, MDD Maximum Dry Density. Gc: Degree of compaction.
Table 3.
Summary of geotechnical properties influencing the strength and drainage capacity of the coarse base.
Table 3.
Summary of geotechnical properties influencing the strength and drainage capacity of the coarse base.
| Geotechnical parameter | Material | |||||||||||
| Stage 1 | Stage 2 | |||||||||||
| LC | C | AGC | ER | ET | EN | LA | LM | AGC | ET | EN | LA | |
| CBR (%) | 105 | 102 | 68 | 109 | 93 | 122 | 121 | 99 | 145 | 187 | 132 | 138 |
| k (cm/sec) | 0.12 | 0.31 | 0.57 | 0.01 | 0.01 | 0.04 | 0.17 | 0.11 | 0.01 | 0.01 | 0.02 | 0.01 |
| Elongated and flat particles (%) | 68 | 42 | 59 | 34 | 36 | 57 | 59 | 49 | 59 | 36 | 57 | 56 |
| % G | 77 | 85 | 78 | 79 | 81 | 80 | 69 | 77 | 69 | 69 | 69 | 64 |
| % S | 23 | 15 | 22 | 21 | 19 | 20 | 31 | 23 | 31 | 31 | 31 | 36 |
| % F | 5 | 4.5 | 2.1 | 6.6 | 4.6 | 3.9 | 4.2 | 5.1 | 5 | 5 | 5 | 5 |
| G/S | 3.2 | 5.3 | 3.5 | 3.5 | 4.1 | 3.9 | 2.1 | 3.1 | 2.1 | 2.1 | 2.1 | 2.1 |
| Cr (%) | 0.72 | 0.77 | 0.64 | 0.56 | 0.4 | 0.38 | 0.61 | 0.59 | 0.45 | 0.42 | 0.38 | 0.36 |
| passing No 40 (%) | 7 | 6 | 3 | 12 | 12 | 10 | 7 | 9 | 11 | 12 | 13 | 14 |
| PI (%) | 12 | 14 | 8 | 8 | 0 | 0 | 2 | 5 | 2 | 0 | 0 | 4 |
| LL (%) | 27 | 30 | 25 | 37 | 0 | 0 | 19 | 28 | 22 | 0 | 0 | 23 |
| Sand Equivalent (%) | 31 | 28 | 70 | 42 | 59 | 54 | 64 | 32 | 38 | 60 | 48 | 38 |
| Gc (%) | 91 | 90 | 93 | 96 | 96 | 89 | 88 | 87 | 100 | 100 | 100 | 100 |
| MDD (kg/m3) | 2396 | 2348 | 2267 | 1998 | 2135 | 2160 | 2331 | 2301 | 2354 | 2020 | 2064 | 2264 |
| Los Angeles Abrasion (%) | 105 | 102 | 68 | 109 | 93 | 122 | 121 | 99 | 145 | 187 | 132 | 138 |
| CBR: California Bearing Ratio, MDD Maximum Dry Density. Gc: Degree of compaction, LL: Liquid Limit, PI, Plastic Index, G=Gravel, S=Sand, F=Fine. k= permeability coefficient. | ||||||||||||
Table 4.
Permeability and gravimetric and volumetric properties of AGC quarry.
| Test number | Stage 1 | Stage 2 | ||||||||||
| ASTM D 698 | ASTM D 1557 | |||||||||||
| 1 | 2 | 3 | 4 | 5 | 21 | 22 | 23 | 24 | 25 | |||
| w (%) | 5 | 4.9 | 4.6 | 5.1 | 5.8 | 6 | 7.3 | 8 | 4.4 | 5.1 | 5.9 | 6 |
| gm (kg/m3) | 2189 | 2225 | 2055 | 2234 | 2362 | 2437 | 2423 | 2414 | 2240 | 2348 | 2489 | 2494 |
| gd (kg/m3) | 2083 | 2120 | 1964 | 2126 | 2232 | 2300 | 2258 | 2234 | 2146 | 2236 | 2352 | 2354 |
| Cr (%) | 75 | 81 | 55 | 78 | 92 | 100 | 95 | 92 | 76 | 87 | 100 | 100 |
| q (%) | 10 | 10 | 9 | 11 | 13 | 14 | 17 | 18 | 9 | 11 | 14 | 14 |
| e | 0.37 | 0.34 | 0.45 | 0.34 | 0.28 | 0.24 | 0.26 | 0.27 | 0.33 | 0.28 | 0.21 | 0.21 |
| Sr (%) | 39 | 41 | 29 | 43 | 60 | 72 | 80 | 83 | 38 | 52 | 79 | 80 |
| n (%) | 27 | 26 | 31 | 25 | 22 | 19 | 21 | 22 | 25 | 22 | 18 | 17 |
| Ga (%) | 61 | 59 | 71 | 57 | 40 | 28 | 20 | 17 | 62 | 48 | 21 | 20 |
| k (cm/sec) | 0.61 | 0.53 | 0.06 | 0.03 | 0.02 | 0.02 | 0.02 | 0.02 | 0.03 | 0.02 | 0.01 | 0.01 |
Specific gravity: 2.85, w: water content, γm: bulk density, γd, dry bulk density, Cr, relative compaction, θ: volumetric water content, e: void ratio, Sr, degree of saturation, n: porosity, Ga: degree of air content, k: permeability coefficient.
Table 5.
Permeability and gravimetric and volumetric properties of “El Tlacote” quarry.
| Test number | Stage 1 | Stage 2 | ||||||||||
| ASTM D 698 | ASTM D 1557 | |||||||||||
| 6 | 7 | 8 | 9 | 10 | 26 | 27 | 28 | 29 | 30 | |||
| w (%) | 4.3 | 5.8 | 6 | 6.4 | 7.4 | 9.3 | 10.1 | 5.5 | 6.4 | 7.9 | 9 | 9.7 |
| gm (kg/m3) | 2141 | 1907 | 1914 | 2079 | 2164 | 2120 | 2108 | 2038 | 2151 | 2099 | 2120 | 2141 |
| gd (kg/m3) | 2054 | 1802 | 1806 | 1954 | 2016 | 1940 | 1914 | 1932 | 2020 | 1944 | 1944 | 1952 |
| Cr (%) | 89 | 49 | 60 | 89 | 100 | 86 | 82 | 84 | 100 | 87 | 87 | 88 |
| q (%) | 9 | 10 | 11 | 13 | 15 | 18 | 19 | 11 | 13 | 15 | 18 | 19 |
| e | 0.2 | 0.37 | 0.37 | 0.26 | 0.22 | 0.27 | 0.29 | 0.28 | 0.22 | 0.27 | 0.27 | 0.27 |
| Sr (%) | 52 | 38 | 40 | 60 | 81 | 84 | 87 | 49 | 71 | 72 | 83 | 90 |
| n (%) | 17 | 27 | 27 | 21 | 18 | 21 | 22 | 22 | 18 | 21 | 21 | 21 |
| Ga (%) | 48 | 62 | 60 | 40 | 19 | 16 | 13 | 51 | 29 | 28 | 17 | 10 |
| k (cm/sec) | 0.01 | 0.03 | 0.04 | 0.02 | 0.01 | 0.02 | 0.02 | 0.02 | 0.01 | 0.02 | 0.02 | 0.02 |
Specific gravity: 2.47, w: water content, γm: bulk density, γd, dry bulk density, Cr, relative compaction, θ: volumetric water content, e: void ratio, Sr, degree of saturation, n: porosity, Ga: degree of air content, k: permeability coefficient.
Table 6.
Permeability and gravimetric and volumetric properties of “El Nabo” quarry.
| Test number | Stage 1 | Stage 2 | ||||||||||
| ASTM D 698 | ASTM D 1557 | |||||||||||
| 11 | 12 | 13 | 14 | 15 | 31 | 32 | 33 | 34 | 35 | |||
| w (%) | 6.8 | 6.8 | 5.6 | 6.7 | 7.4 | 10.5 | 12.4 | 5.4 | 5.8 | 7.9 | 9.7 | 11 |
| gm (kg/m3) | 2044 | 2079 | 1947 | 2004 | 2047 | 2010 | 2069 | 2070 | 2151 | 2227 | 2064 | 2113 |
| gd (kg/m3) | 1913 | 1946 | 1844 | 1878 | 1906 | 1820 | 1840 | 1964 | 2032 | 2064 | 1882 | 1902 |
| Cr (%) | 71 | 76 | 88 | 95 | 100 | 84 | 88 | 87 | 96 | 100 | 76 | 79 |
| q (%) | 13 | 13 | 10 | 13 | 14 | 19 | 23 | 11 | 12 | 16 | 18 | 21 |
| e | 0.34 | 0.32 | 0.39 | 0.37 | 0.35 | 0.41 | 0.39 | 0.31 | 0.26 | 0.25 | 0.37 | 0.35 |
| Sr (%) | 51 | 54 | 37 | 47 | 55 | 66 | 80 | 45 | 56 | 83 | 68 | 81 |
| n (%) | 26 | 24 | 28 | 27 | 26 | 29 | 28 | 24 | 21 | 20 | 27 | 26 |
| Ga (%) | 49 | 46 | 63 | 53 | 45 | 34 | 20 | 55 | 44 | 17 | 32 | 19 |
| k (cm/sec) | 0.04 | 0.03 | 0.05 | 0.04 | 0.04 | 0.05 | 0.05 | 0.03 | 0.02 | 0.02 | 0.04 | 0.04 |
Specific gravity: 2.57, w: water content, γm: bulk density, γd, dry bulk density, Cr, relative compaction, θ: volumetric water content, e: void ratio, Sr, degree of saturation, n: porosity, Ga: degree of air content, k: permeability coefficient.
Table 7.
Permeability and gravimetric and volumetric properties of “Los Ángeles” quarry.
| Test number | Stage 1 | Stage 2 | ||||||||||
| ASTM D 698 | ASTM D 1557 | |||||||||||
| 16 | 17 | 18 | 19 | 20 | 36 | 37 | 38 | 39 | 40 | |||
| w (%) | 5.2 | 4.4 | 3.7 | 4.6 | 5.5 | 7.3 | 9 | 4 | 5.2 | 6.1 | 7.6 | 8.3 |
| gm (kg/m3) | 2217 | 2082 | 2058 | 2060 | 2164 | 2244 | 2315 | 2214 | 2249 | 2292 | 2435 | 2388 |
| gd (kg/m3) | 2106 | 1994 | 1984 | 1968 | 2052 | 2092 | 2122 | 2130 | 2140 | 2160 | 2264 | 2204 |
| Cr (%) | 70 | 52 | 70 | 66 | 85 | 94 | 100 | 80 | 81 | 85 | 100 | 91 |
| q (%) | 11 | 9 | 7 | 9 | 11 | 15 | 19 | 8 | 11 | 13 | 17 | 18 |
| e | 0.32 | 0.39 | 0.4 | 0.41 | 0.35 | 0.33 | 0.31 | 0.31 | 0.3 | 0.29 | 0.23 | 0.26 |
| Sr (%) | 45 | 31 | 26 | 31 | 43 | 62 | 81 | 36 | 48 | 59 | 93 | 89 |
| n (%) | 24 | 28 | 29 | 29 | 26 | 25 | 24 | 23 | 23 | 22 | 19 | 21 |
| Ga (%) | 55 | 69 | 74 | 69 | 57 | 38 | 19 | 64 | 52 | 41 | 7 | 11 |
| k (cm/sec) | 0.17 | 0.27 | 0.05 | 0.05 | 0.04 | 0.03 | 0.03 | 0.03 | 0.03 | 0.02 | 0.01 | 0.02 |
Specific gravity: 2.78, w: water content, γm: bulk density, γd, dry bulk density, Cr, relative compaction, θ: volumetric water content, e: void ratio, Sr, degree of saturation, n: porosity, Ga: degree of air content, k: permeability coefficient.
Table 8.
Correlation coefficients of geotechnical parameters vs. CBR and permeability.
| Geotechnical parameter | CBR | Permeability | ||
| R2 | Standard Error | R2 | Standard Error | |
| Elongated and flat particles (%) | 0.017 | 31 | 0.054 | 0.17 |
| % G | 0.482 | 24 | 0.129 | 0.17 |
| % S | 0.482 | 24 | 0.129 | 0.17 |
| % F | 0.163 | 29 | 0.589 | 0.11 |
| G/S | 0.391 | 25 | 0.152 | 0.16 |
| % passing No. 40 | 0.408 | 25 | 0.796 | 0.08 |
| PI (%) | 0.259 | 27 | 0.304 | 0.15 |
| LL (%) | 0.176 | 29 | 0.141 | 0.16 |
| Sand Equivalent (%) | 0.000 | 32 | 0.064 | 0.17 |
| Gc (%) | 0.322 | 26 | 0.193 | 0.16 |
| MDD (kg/m3) | 0.111 | 30 | 0.173 | 0.16 |
| Los Angeles Abrasion (%) | 0.012 | 32 | 0.157 | 0.16 |
CBR: California Bearing Ratio, MDD: Maximum Dry Density. Gc: Degree of compaction, LL: Liquid Limit, PI, Plastic Index, G: Gravel, S: Sand, F: Fine.
Table 9.
Coefficients of the predictive models for each type of soil.
| Quarry | Geotechnical parameters | |||||||
| Granulometry | %passing No 40 | % F | PI (%) | DI (%) | Sand Equivalent (%) | Los Angeles Abrasion (%) | CBR (%) | |
| La Cañada | See Table 12 | 7 | 5 | 12 | 70 | 31 | 12 | 105 |
| Conin | 6 | 5 | 14 | 80 | 28 | 15 | 102 | |
| AGC | 3 | 2 | 8 | 60 | 70 | 12 | 68 | |
| El Refugio | 12 | 7 | NP | 60 | 42 | 31 | 109 | |
| El Tlacote | 11 | 5 | NP | 40 | 59 | 18 | 93 | |
| El Nabo | 10 | 4 | 2 | 40 | 54 | 23 | 122 | |
| Los Ángeles | 7 | 5 | 5 | 60 | 64 | 12 | 121 | |
| La Machorra | 9 | 5 | 5 | 60 | 32 | 11 | 99 | |
| Evaluated condition (Complies/Does Not Comply) | ||||||||
| Normative (proposal) | Under table 12 conditions | 5% min. | See note | 12% max. | See note | 40% min. | 35% max | 80% min |
| La Cañada | Yes | Yes | Yes | Yes | No | No | Yes | Yes |
| Conin | No | Yes | No | No | No | No | Yes | Yes |
| AGC | No | No | Yes | Yes | Yes | Yes | Yes | No |
| El Refugio | Yes | Yes | No | Yes | Yes | Yes | Yes | Yes |
| El Tlacote | Yes | Yes | Yes | Yes | Yes | Yes | Yes | Yes |
| El Nabo | No | Yes | Yes | Yes | No | Yes | Yes | Yes |
| Los Ángeles | Yes | Yes | Yes | Yes | Yes | Yes | Yes | Yes |
| La Machorra | Yes | Yes | Yes | Yes | Yes | No | Yes | Yes |
| PWL | Average: 80% | 86% | 82% | 72% | 54% | 67% | 100% | 91% |
| Note: if PI < 3%, up to 12% F; DI greater than 0.6 If 3% < PI < 7%, up to 8% F; DI greater than 0.6 If 7%< PI <12%, up to 5% F; DI up to0.6 | ||||||||
CBR: California Bearing Ratio, PI: Plastic Index, F: Fine. DI= Density index.
Table 10.
Characteristics of the samples for evaluation of the CBR predictive models.
| Material | CBR | CBR prediction/Absolute Error | ||||
| Rollings & Rollings (1996 | Berney & Wahl (2008) | Taskiran (2010) | Yildirim & Gunaydin (2011) | |||
| Stage 1 | La Cañada | 105 | 75/30 | 137/132 | 17/88 | 130/25 |
| Conin | 102 | 75/27 | 133/31 | 14/87 | 129/27 | |
| AGC | 68 | 75/6 | 139/71 | 17/51 | 124/56 | |
| El Refugio | 109 | 75/34 | 146/38 | 16/93 | 112/4 | |
| El Tlacote | 93 | 75/18 | 115/23 | --- | 119/26 | |
| El Nabo | 122 | 90/32 | 114/7 | --- | 119/2 | |
| Los Ángeles | 121 | 75/46 | 146/25 | 21/100 | 126/5 | |
| La Machorra | 99 | 75/24 | 143/44 | 19/81 | 125/26 | |
| Stage 2 | AGC | 145 | 75/24 | 143/2 | 22/123 | 127/18 |
| El Tlacote | 187 | 72/115 | 122/65 | --- | 111/76 | |
| El Nabo | 132 | 72/60 | 122/10 | --- | 113/19 | |
| Los Ángeles | 138 | 75/63 | 141/3 | 21/117 | 123/15 | |
| Sum of absolute error | 525 | 351 | 741 | 299 | ||
| Average relative error | 34% | 28% | 55% | 23% | ||
CBR: California Bearing Ratio.
Table 11.
Precision of CBR predictive models for material GW.
| Material | CBR | CBR prediction/Absolute Error | ||
| Berney &Wahl (2008) | Yildirim & Gunaydin (2011) | |||
| Stage 1 | La Cañada | 105 | 124/19 | 105/0 |
| Conin | 102 | 98/3 | 81/20 | |
| AGC | 68 | 108/40 | 102/33 | |
| El Refugio | 109 | 124/15 | 108/1 | |
| El Tlacote | 93 | 93/0 | 93/0 | |
| El Nabo | 122 | 91/30 | 94/27 | |
| Los Ángeles | 121 | 121/0 | 123/3 | |
| La Machorra | 99 | 105/6 | 102/3 | |
| Stage 2 | AGC | 145 | 140/5 | 128/17 |
| El Tlacote | 187 | 134/53 | 127/60 | |
| El Nabo | 132 | 134/2 | 134/52 | |
| Los Ángeles | 138 | 138/0 | 134/4 | |
| Sum of Absolute Error | 175 | 170 | ||
| Average Relative Error | 13% | 12% | ||
CBR: California Bearing Ratio.
Table 12.
Precision of CBR predictive models for material GP.
| Sieve | Size (mm) | Passing (%) | |
| Lower limit | Upper limit | ||
| 2” | 50 | 100 | --- |
| 1 ½” | 37.5% | 84 | 100 |
| 1” | 25 | 65 | 90 |
| ¾” | 19 | 55 | 70 |
| 3/8” | 9.5 | 35 | 50 |
| No. 4 | 4.75 | 25 | 35 |
| No. 10 | 2 | 13 | 25 |
| No. 20 | 0.85 | 7 | 19 |
| No. 40 | 0.425 | 5 | 16 |
| No. 60 | 0.25 | 3 | 14 |
| No. 100 | 0.15 | 2 | 12 |
| No. 200 | 0.075 | 0 | 11 |
| G/S | 3 | 1.3 | |
| DI | 0.2 | 0.6 | |
DI: Density Index, G: Gravel content, S: Sand content.
Table 13.
Quality specifications for granular base materials in rigid pavement. A proposal.
| Parameter | Condition | Value |
| The granular material of the granular base should preferably consist of crushed aggregates (at least 98% crushed rocks) or partially crushed aggregates (at least 75% crushed rocks), with a minimum particle size of 25 mm (1 inch). | ||
| G/S | From 1.0 a 3.0 (target 1.6) | |
| Finer content (%) | IP<3% | Until 12% |
| 3%<IP<7% | Until 8% | |
| 7%<IP<12% | Until 5% | |
| Dust ratio | 0%<%F<5% | 0.6 max. |
| 5%<%F<12% | 0.6 min. | |
| Sand Equivalent | Maximum 3% of F | Indifferent |
| More than 3% of F | 40% min. | |
| Methilene blue | Until 3% of F | Indifferent |
| 3% < %F < 8% | 1.5 g/kg max | |
| More than 8% of F | 0.7 g/kg max | |
| Los Angeles Abrasion | 35% max | |
| Gc | Indifferent | |
| CBR | 80% min | |
| e | 0.2-0.4 | |
| k (cm/sec) | 0.05 a 0.12 cm/s, dependiendo de las condiciones climáticas | |
F: Fine material. e: void ratio, k= permeability coefficient, CBR: California Bearing Ratio, Gc: Degree of compaction.
Table 14.
Calculation of the Percentage Within Limits (PWL) to determine the conformity of materials with respect to national and international standards.
Table 14.
Calculation of the Percentage Within Limits (PWL) to determine the conformity of materials with respect to national and international standards.
| Normative | Condition | Elongated and flat particles (%) | Sand equivalent (%) | Liquid Limit (%) | Plastic Index (%) | Los Angeles Abrasion (%) | CBR (%) | Average (%) |
| Mexico | ||||||||
| N-CMT-4-02-002/16 | --- | 21 | 67 | 62 | 31 | 100 | 91 | 62 |
| International | ||||||||
| PG-3 (2015) | AADT HV ≥2000 | 10 | 67 | 6 | 12 | 99 | --- | 32 |
| ASTM D1241 (2000) y D2940 (2009) | --- | --- | 78 | 62 | 31 | 100 | --- | 68 |
| AASHTO M 147-65 (2012) | --- | --- | --- | 62 | 31 | 100 | --- | 46 |
| Publication 332 (2016) | --- | --- | --- | 62 | 31 | 100 | 100 | 73 |
| EG-INVIAS (2012) | EA> 0.5 exp 6 | 10 | 78 | 62 | 20 | 100 | 66 | 56 |
| EG-2013 | masl <3000 | 0 | 78 | --- | 24 | 100 | 91 | 59 |
AADT HV: Annual Average Daily Traffic (Heavy Vehicles); EA: Equivalent Axles, masl: meters above sea level.
Disclaimer/Publisher’s Note: The statements, opinions and data contained in all publications are solely those of the individual author(s) and contributor(s) and not of MDPI and/or the editor(s). MDPI and/or the editor(s) disclaim responsibility for any injury to people or property resulting from any ideas, methods, instructions or products referred to in the content. |
© 2024 by the authors. Licensee MDPI, Basel, Switzerland. This article is an open access article distributed under the terms and conditions of the Creative Commons Attribution (CC BY) license (http://creativecommons.org/licenses/by/4.0/).
Copyright: This open access article is published under a Creative Commons CC BY 4.0 license, which permit the free download, distribution, and reuse, provided that the author and preprint are cited in any reuse.


