
Submitted:
19 July 2024
Posted:
22 July 2024
You are already at the latest version
Abstract
The current economic and political crisis has brought about a change in the environment in which Non-Governmental Development Organizations (NGDOs) have traditionally operated. This change can be summed up as a reduction in the funds they receive and an increase in the population they must serve. The need then arises to have mechanisms that allow an analysis of the good work performed by the NGDOs. Knowing the efficiency of the NGDOs in the management of their previous projects can contribute towards improving their future achievements. The aim of this research is to establish some objective indicators that allow an evaluation of the efficiency of these organizations. Firstly, a detailed analysis of the regulation of the three Agencies is conducted (Spanish-AECID, European- EuropeAid and American -USAID). This allows us to synthesize the indicators of good performance of the NGDO based on the study of the eligibility criteria of public donors. The research concludes with the study of the efficiency following the Promethee Approach. Our results reveals that 44.6% of the NGDOs (33 out of the 74 studied) operate inefficiently, compared to 29.7% which are efficient.
Keywords:
non-governmental development organisation (NGDO)
; performance
; indicators
; cooperation
; donor
; promethee
1. Introduction
In recent years, the economic crises and the publication in the media of dubious practices by Non-Governmental Development Organizations (NGDOs) have put organizations dedicated to development cooperation in trouble. It is necessary to strengthen these non-profit organizations with donors and with society in general and, in addition, provide their managers with tools that allow them to identify the areas in which they must act to improve their results, making the most of their resources. Efficiency studies cover both needs: on the one hand, they make it possible to identify which entities are the best performers, legitimizing them in relation to the society and, on the other hand, they give organizations a vision of their operation and possible areas for improvement.
There are several studies dedicated to efficiency in NGDOs. However, the limitations that third sector entities present, mainly due to the absence of a benefit that serves as an indicator and the use of peculiar resources, such as free donor financing public and private or the use of volunteers, it results in not having objective and agreed items to measure efficiency. There is not even a doctrinal consensus on the very notion of efficiency in the field of Development Cooperation, nor on what are the outputs, the objectives that these entities pursue.
This paper aims to study the efficiency in the development cooperation sector, define the objectives and resources of the NGDOs and find general indicators that allow verifying to what extent the entities are achieving their goals and using their resources to be able to apply them to an efficiency study.
The efficiency indicators are inferred from those used by public donors when they select the NGDOs to receive funding, the so-called eligibility criteria published in different norms and laws. Thus, efficiency is measured in this paper using the indicators collected in the eligibility criteria of three of the main cooperation agencies, the Spanish Agency for International Development Cooperation (AECID), the European Agency (EuropeAid) and the Agency for the United States for International Development (USAID).
It is a novel method of fixing identifiers because, up to now, in the studies analyzed, they were established either by the authors themselves, or by means of surveys conducted with NGDO personnel or agency technicians. The fact that the indicators are obtained from donor regulations allows them to be more general and more objective than those traditionally used.
One of the first facts found in this study is the opacity surrounding the eligibility criteria. The different criteria, the indicators used to corroborate compliance, and the sources from which the donors extract the data to quantify the indicator are scattered across different standards without establishing a clear relationship between them. The weights are generally available for the criteria, without disaggregating the weight of each indicator.
Given this opacity and in order to know if the indicators published by donors were sufficient to determine the award of a public grant to a NGDO, a simulation of granting public funding was applied. For this, the 74 NGDOs that in 2016 (up to 2018-2023) belonged to the Spanish Coordinator were taken. With the donor variables, a study of the efficiency of the coordinator´s NGDOs is carried out, using a technique that is an adaptation of the Promethee multi-criteria method known as PROMETHEE Productivity Analysis (PPA) developed by Ishizaka, Resce and Mareschal (2014) to study the efficiency of UK universities. Our efficiency study reveals that 44.6% of the NGDOs (33 out of the 74 studied) operate inefficiently, compared to 29.7% which are efficient.
We dedicate the following section to the literature review. The third section is oriented to inferring, from donor regulations, the efficiency indicators. For this, the eligibility criteria of three public agencies are analyzed, the Spanish Cooperation Agency (AECID), the European Agency (EuropeAid) and the American Agency (USAID). For each Agency, the criteria, indicators, verification sources and associated weights are extracted, reported in its regulations. This study shows that the criteria related to the narrative of the candidate project to be subsidized are, apparently, the most valued by donors, but a pre-selection is deduced, the existence of an internal tide of criteria and indicators, which donors do not specify.
The fourth section begins by combining the indicators established by the three donors, analyzed in the previous section with the methodology of Promethee applied to the list of organizations that have received the most public grants. The paper ends with the conclusions of this research, taking into account the results obtained in the previous section.
2. Literature Review
The first attempts to develop performance indicators for non-profit organizations were based on the adaptation of those established for for-profit organizations. Despite doctrinal efforts to reach a consensus, as early as 1998, Forbes showed how difficult it was to find valid indicators, since measures such as profitability or return per shareholder, which made it possible to evaluate the performance of for-profit organizations, were not easy to translate to the non-profit world.
Measuring the performance of third sector entities is subject to a series of limitations already known in the academic literature. The absence of a benefit that serves as an indicator, the search for rewards with qualitative and intangible features, the performance of material and immaterial activities that are difficult to quantify, the existence of volunteer staff or the difficulty of measuring the impact of their actions, mean that neither what performance should be measured, nor the approach to measure it, nor the indicators to use for it and not even what is the justification for measuring that performance (Cordery and Sinclair, 2013; Moxham, 2014; Bach-Mortensen and Montgomery, 2018) is clarified. Adding to these difficulties is the fact that there is a lack of official data on the third sector, especially on NGDOs due to the limitation of having to quantify their performance in third countries. In addition, the strong dependence of NGDOs on donations and the need to present a good image in order to continue to have the support of their funders, together with the lack of economic experts within these entities, can lead to misreporting, an incorrect imputation of accounting items that distort the operability of the data collected (Martín et al., 2012).
The limitations listed above mean that most of the published works approach the study of the efficiency of third sector entities from a common approach (Lecy et al., 2012; Cordery and Sinclair, 2013 and Mouchapms 2014), using various tools, all of them coming from the for-profit sphere, so that their validity for the third sector is questioned, and with indicators of achievement established subjectively by the authors of the study, generally based on the data available to carry it out. In this sense, Mouchamps (2014) states that traditional performance measurement tools (in his study he focused on three of them: the balanced scorecard, the social return on investment and the Global Reporting Initiative) would need to be adapted in such a way to the peculiarities of the third sector that, if this could be done successfully, we would be faced with a completely new tool.
Among the studies dedicated to analysing the performance of NGDOs or the third sector in general (excluding, therefore, those dedicated exclusively to social action or humanitarian aid organizations), there are studies dedicated to analysing the efficiency of one of the activities carried out by the organizations or of one aspect of their activity. Thus, Ribar and Wilhelm (2002) analysed the efficiency in fundraising and in carrying out interventions by American NGDOs, concluding that efficiency in one of the activities detracts from efficiency in the other. Hernangómez, Martín Cruz and Martín Pérez (2006) studied the objective pursued by NGDOs from the point of view of satisfying the interests that stakeholders place in the organization and, based on this objective of creating value for participants, analysed the efficiency of Spanish NGDOs. García and Marcuello (2007) studied the efficiency of NGDOs in attracting resources; the results obtained showed that the influence of size, measured by NGDO income, is very relevant in their efficiency and that the NGDOs that specialize in public funds or private funds obtain better results.
In 2011, Berber, Brockett, Cooper, Golden, and Parker, studied the efficiency of fundraising and service provision in non-profit organisations, taking as their objective the social benefit generated by these organisations. In their study, they state that to date no rigorous method has been presented to analyse the efficiency of non-profit organisations, with potential donors being satisfied with analysing the ratio of funds raised to administrative expenses, concluding that there are service provision costs that the organisations did not account for, in order to improve their image in the eyes of potential donors, which influenced the measurement of efficiency.
Martín, Martín, and Serrano (2015) use DEA to study the efficiency of Spanish NGDOs' development interventions. They conclude that efficiency is to some extent independent of the specific environment where the actions are implemented and depends, to a greater extent, on the type of cooperation instrument through which the aid has been channelled. They also conclude that the country results highlight the importance of focusing on smaller areas of action.
Gálvez, Caba and López (2016) studied the efficiency of Colombian NGOs, focusing on transparency as a means to legitimise these entities. They conclude that only 16.83% of the organisations studied are efficient, those that employ the fewest workers and volunteers and those that receive the least public funding. They also note a strong correlation between the transparency of the organisation, especially financial and performance transparency, and its efficiency, with the influence of governance transparency and the profile of the organisation on the organisation's efficiency not being significant.
Ferreira et al. (2017) focus on the study of fundraising activity and how the quality and quantity of fundraising can influence the performance of NGDOs. They conclude that the greater the diversity of funders, the lower the dependence of NGDOs on their donors, providing management autonomy that favours a better performance of the entity.
There are also studies dedicated to analysing the methodology used to study organisational efficiency and the most appropriate indicators for this purpose. Kaplan (2001) attempted to adapt the balanced scorecard of the for-profit sector to non-profit organisations. The same effort was made by González and Cañadas (2008) for Spanish organisations and Greiling (2010) for German third sector organisations. However, the use of the balanced scorecard has not taken off in the non-profit sector (Retozala, 2010), questioning whether the dimensions used to measure the performance of NGOs are appropriate, due to the fact that they do not include the evaluation of the decision-making process and due to the difficulty of evaluating the indicators established by the balanced scorecard to measure the outputs obtained and the necessary inputs for this (Mouchamps, 2014). Another criticism is that it tempts managers to set unambitious targets in order to be able to publicise the success of their achievements (Bisbe and Barrubés, 2012).
The tool commonly used by donors for the design and monitoring of interventions is the logical framework approach, which has also been widely criticised for its rigidity, to the extent that it has become a mere administrative procedure rather than a method of planning by objectives (Sainz, 2007; Cordery and Sinclair, 2013).
Mouchamps, in 2014, made an attempt to find the most suitable tool for measuring the performance of third sector organisations, and came to the overwhelming conclusion that "kitchen scales (tools designed for the for-profit sector) are being used to weigh elephants (non-profit organisations)", and that specific systems need to be designed for the third sector. However, there is an absence of studies examining how such systems should be developed (Moxham, 2014). Bach-Mortnsen and Montgomery (2018) went as far as to state that non-profit entities do not analyse their performance due to a lack of consistent guidelines on how such an evaluation should be carried out, with what criteria and indicators.
As we have seen, there is no agreement on which tools, criteria and indicators are the most appropriate for analysing the good work of third sector entities and, therefore, of NGOs. However, it is recognised in the studies analysed (Medina, 2009), as well as by the cooperation agencies themselves (European Commission, 2016; USAID, 2012; Resolution of 17 September 2013, of the Presidency of the Spanish Agency for International Development Cooperation) that the regulations and indicators established by donors to manage and choose the organisations to which they grant subsidies are rigorous and guarantee the good work of these organisations. Taking this statement into account, that is, if the criteria used by donors to select the NGDOs that will receive a grant are strict and guarantee the good work of the chosen organisations, they could serve as indicators of the good work of these entities and could give rise to indicators that are not only valid but also accepted for the third sector. Consequently, by analysing donor eligibility criteria, the indicators used by public donors to grant subsidies to some entities or others, it will be possible to obtain performance indicators for NGDOs that will allow us to classify entities according to their better or worse performance. We will devote the next section of this paper to this analysis.
3. Analysis of The Three Agencies
In this section, we establish a series of NGDO performance indicators based on the study of the eligibility criteria of public donors. For this purpose, an analysis of the regulations of three cooperation agencies has been carried out: Spanish Agency for International Development Cooperation (AECID), the European Agency (Europe-Aid) and the United States Agency for International Development (USAID). This study has allowed us to synthesize the indicators of good performance used by each one of the agencies. By comparing the criteria, indicators, requirements, weightings and sources of verification used by the three agencies, we will deduce which criteria and indicators can be used to verify the internal performance of NGDOs. These common indicators will allow us to demonstrate the performance of NGDOs to any public donor and, by extension, to the stakeholders of these entities.
3.1. Analysis of the AECID´s Eligibility Criteria
From the analysis of the general regulatory framework to which AECID grants are subject, it can be concluded that the eligibility criteria are defined in an imprecise and unclear manner, scattered throughout the regulations and without establishing precise relationships between the criteria, the indicators used to verify compliance and the sources of verification used for each indicator.
In all the regulations there is only one criterion relating to the entity's performance, which is to have a structure capable of sufficiently guaranteeing the fulfilment of its objectives. However, the indicators used by the donor to analyse compliance with this sufficiency criterion must be deduced from the sources of verification listed in article 7 f) of Royal Decree 193/2015, regulating the prescriptive registration in the AECID Register, as the Agency requires the organisation chart of the organisation and its delegations, the number of partners, the staff hired and the number of volunteers and development workers dedicated to activities related to international development cooperation. In sections g) and h) of the same article, and without relating them directly to any criteria, a certificate is requested accrediting the funds received from membership fees, donations and income generated by private fundraising activities that could finance part of the entity's activity, and the annual report corresponding to the last year of activity, if any.
All the indicators listed, although not explicitly stated in the regulation, are clearly related to the analysis of the material and human resources that the entity possesses and its capacity to carry out the development actions it undertakes, and can therefore be considered indicators of the criterion of sufficient structure.
This lack of legislative clarity in establishing the indicators used to verify compliance with the criterion of having a structure capable of sufficiently guaranteeing the fulfilment of its objectives means that it is not possible to be sure exactly which are the real indicators used by the Agency to verify this sufficiency. It is not known whether it takes these data in an absolute sense or whether it takes into account other indicators derived from them. Nor does the legislation make explicit what requirements these indicators must meet in order to consider that the entity has sufficient structure (a minimum number of partners, staff, projects carried out, etc., a reference threshold that sets the boundary between a bad and a good structure). It is known that the weight given by law to these requirements is 100%, as failure to meet the criterion of having a sufficient structure will result in refusal of registration in the AECID Register. Therefore, to calculate the weight given to each indicator of the criterion, this 100% is divided among all indicators (see Table 1).
In the general regulations, the rules governing subsidies according to the type of development cooperation action (agreement, project or action) establish four eligibility criteria, three of which refer to the formulation of the specific intervention to be subsidised: the quality and effectiveness of the aid, the complementarity of the project with the objectives of Spanish cooperation and the quality of the formulation, viability and sustainability of the proposed actions, and only one criterion referring to the internal functioning of the NGDO, institutional solvency, which is weighted with 20% of the total of the four criteria.
Furthermore, it is pointed out that, in the case of bidding for project subsidies, bidding NGDOs must have carried out at least five cooperation projects in the last eight years, which is why a new criterion is identified: the entity's previous experience, with the indicator being the number of projects carried out with a formal weighting of 100%. In the case of tenders for agreements, the NGDO is required to be qualified, a qualification requirement to which we will refer later (article 5 Order AEC/2909/2011).
After analysing the general regulations, it remains to study the specific regulations contained in the calls for proposals for each of the Agency's funding instruments. The AECID annually calls for grants for the implementation of projects, every four years it calls for agreements and periodically calls for development cooperation actions.
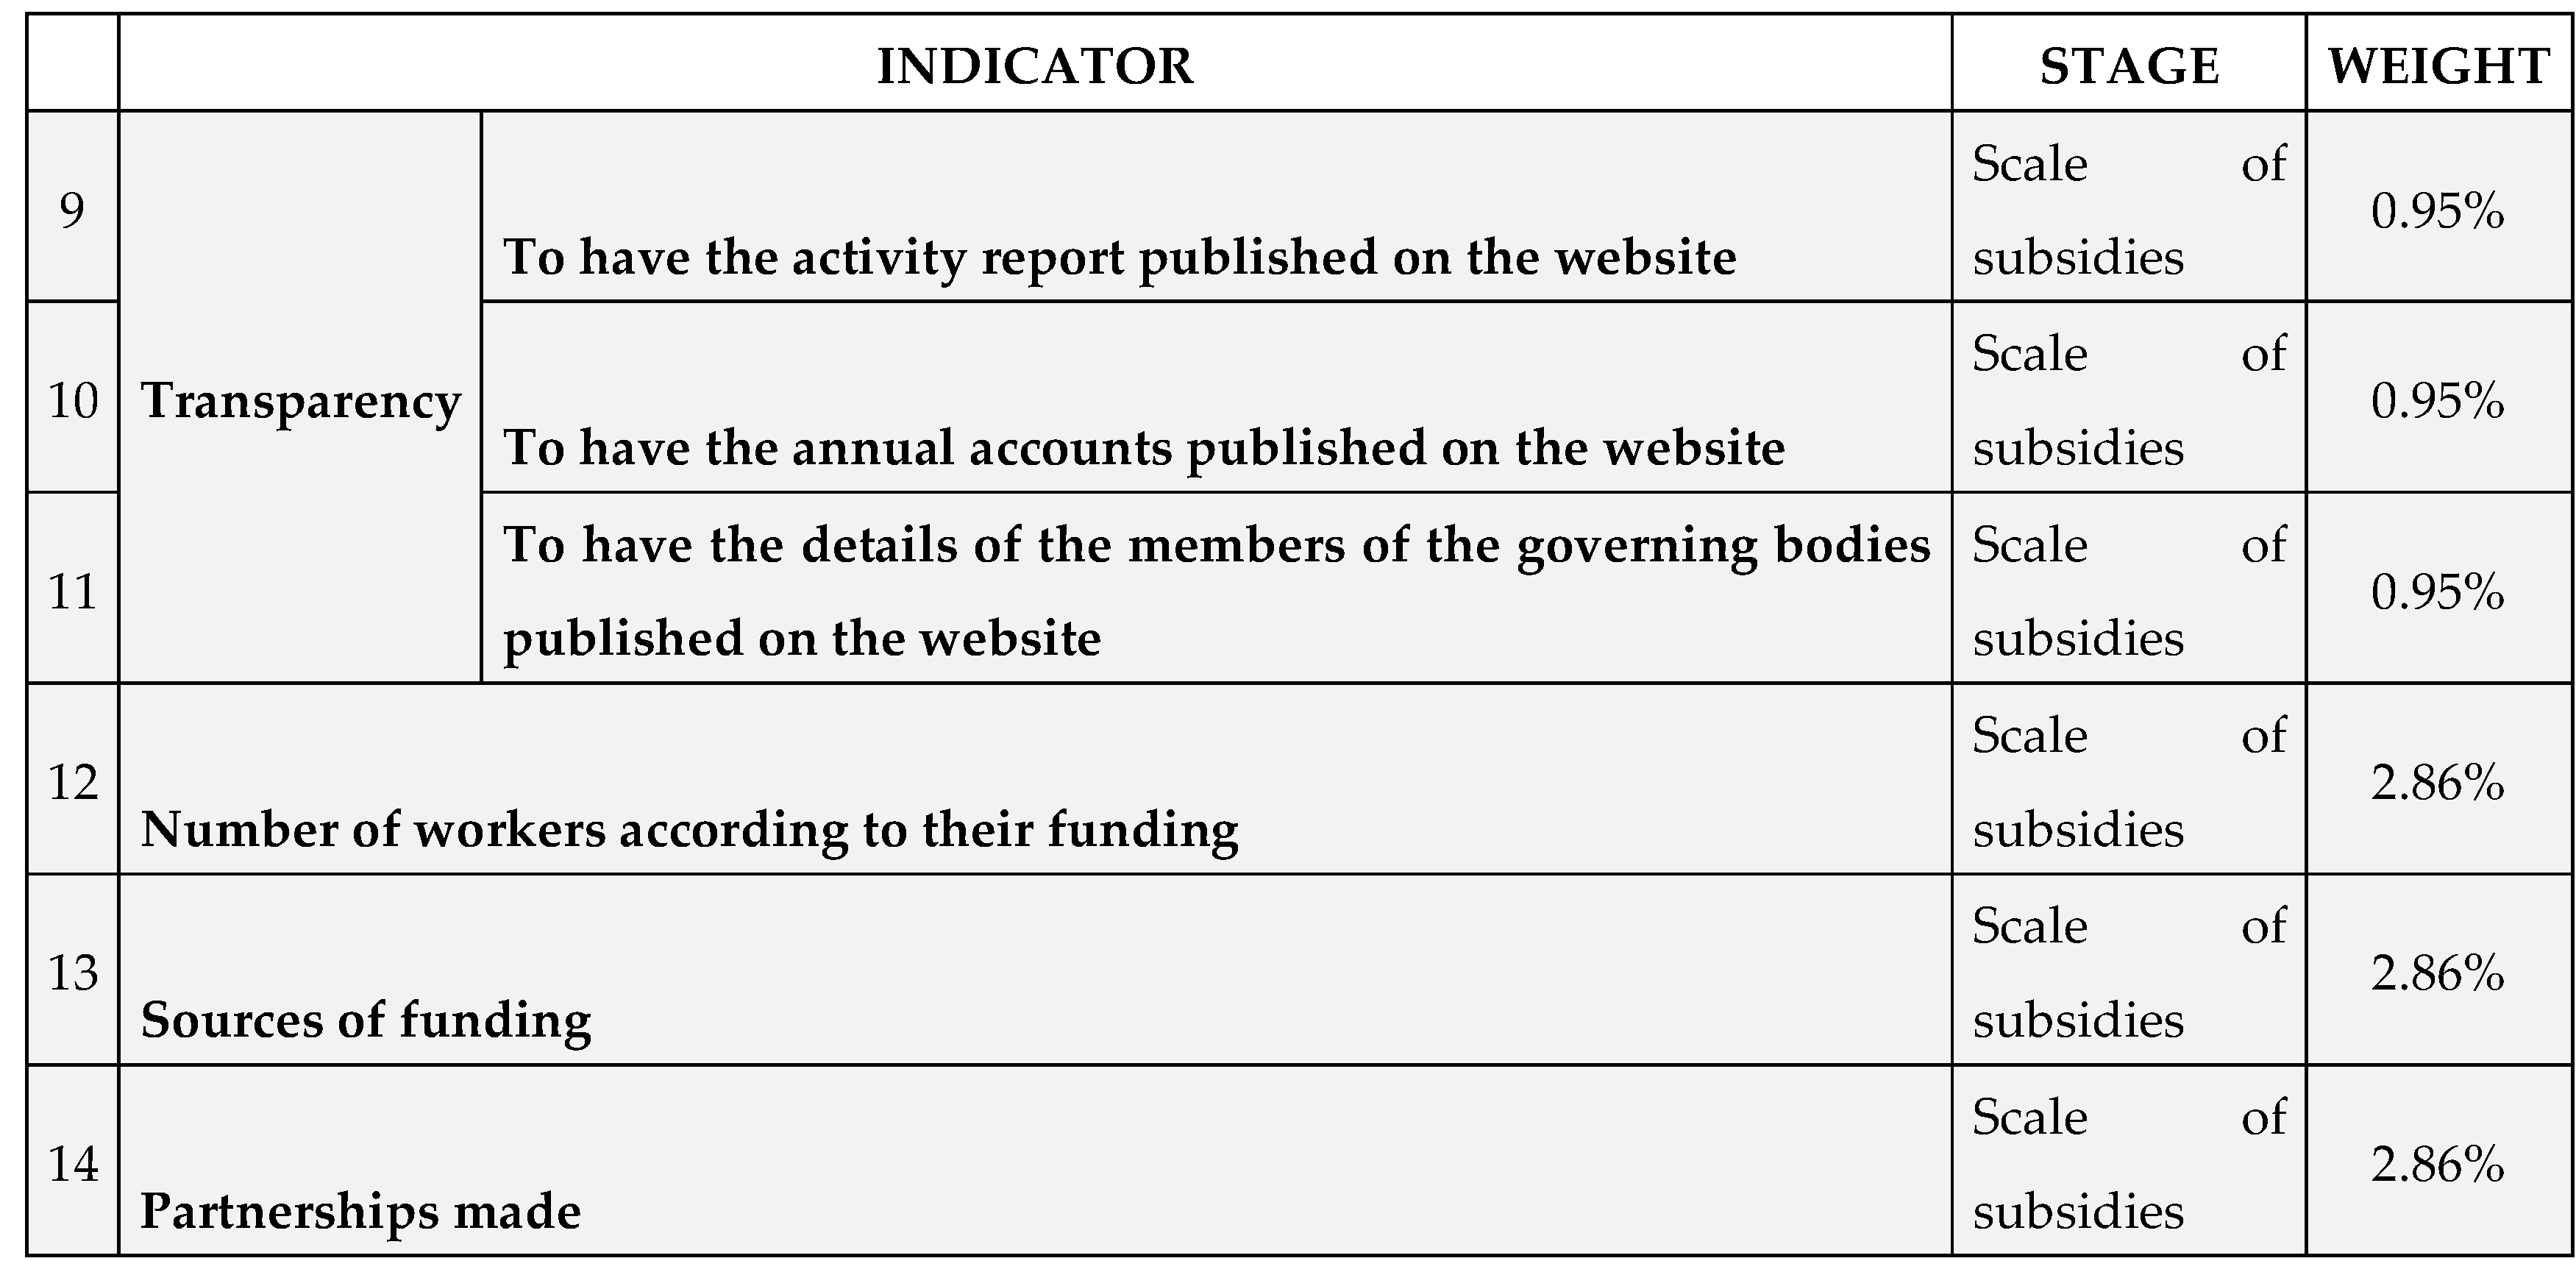
Taking into account all the indicators established by the Agency in the different funding instruments analysed, for the institutional solvency criterion, the only one referring to good internal functioning, the following indicators can be established: 1. having the following published on the organisation's website: activity reports, audited accounts and the composition of the governing bodies. 2. the number of employees according to the entity's funds. 3. indicators relating to sources of funding, 4. indicators referring to the quality of justification of previous AECID subsidies, 5. the existence of rules of conduct for employees, 6. the existence of mechanisms for processing complaints and suggestions, and 7. the alliances made.
In both calls for projects and agreements, the criterion of institutional solvency has a weight for the AECID of 20% in the evaluation (article 9 of Order AEC/2909/2011), but it is not known what specific weight the Agency gives to each of the indicators of this solvency, so for the purposes of this study, it is considered that they all have the same weight, i.e. each indicator listed counts 1/7 of the 20% (2.86%) corresponding to each solvency indicator.
In addition, some of the indicators listed involve data that are not publicly available, so the associated indicators 4, 5, 6 and 7 should not be taken into account. In summary, Table 2 shows the indicators extracted from the reading of Order AEC/2909/2011 as well as the different resolutions calling for grants for the three AECID cooperation instruments, except for the one referring to the required qualification.
The procedure to obtain the qualification is divided into two phases. In the first phase, it is analysed whether the organisation verifies a series of general requirements; without the accreditation of these requirements, it will not pass to the next phase and qualification will be denied. The second phase involves subjecting the organisation to a quantitative and qualitative assessment of its performance, giving each item analysed a certain score.
In order not to be exhaustive in listing all the indicators included in the Resolution regulating the rating of entities, Table 3 and Table 4 list only those indicators included in the assessment of the rating that are related to the internal functioning of the entity, leaving out the formal indicators and those whose verification requires unpublished data. Nor are the minimum compliance thresholds established by the Agency to consider the indicator passed taken into account, since, as they are established for large NGDOs, if these thresholds were taken into account, they would cease to be valid as indicators of good performance for medium-sized and small NGDOs.
For the purposes of this research, in order to weight these indicators, and given that the Agency gives 100% weight to compliance with each of the associated requirements, it will be considered that together they weigh 100% for the Agency, so that each of them will have a weight in this study of 1/8 of 100%, i.e. 12.5%.
Once the first phase has been completed, the Agency carries out a quantitative and qualitative assessment of the entity. The criteria and indicators extracted from the regulations that can be verified with the published data are shown in Table 4. It should be noted that those of the indicators established by the Agency that are closely related to each other have been grouped together in the same indicator, and that in other cases the wording of the indicator has been adapted so that it can be verified with public data; these points are indicated in Table 4.
Analysing all the indicators derived from the regulations that set out the AECID's eligibility criteria, the following conclusions can be drawn. Firstly, that there are repeated indicators or indicators that value similar concepts, which have been grouped together in a single indicator, adding the weighting given to each of them. Thus, for example, Table 5 shows how the number of workers is valued in indicators 3, 13, 22 and 25, which can be grouped together in a single indicator, called average workforce, with a weighting that is the result of the sum of the weights of each indicator grouped together. The average workforce would be an indicator with a total weight of 30.11 percentage points out of 260.78 possible.
Secondly, it is concluded that the indicators can be summarised, by similarity, in four criteria: experience, transparency and internal functioning, human resources and financial resources. Table 6 summarises the indicators extracted from the AECID's eligibility criteria, classified into criteria and summarised under a single criterion for all indicators that are similar. For each indicator, those to which it would correspond for the Agency are indicated.
3.2. Analysis of the European Union's Eligibility Criteria (Europe-Aid)
The European Union has been engaged in development cooperation since its creation as the European Economic Community in 1957. EU development cooperation policy is managed by the Commission's Directorate-General for International Cooperation and Development (DG DEVCO), which since 2015 has brought together the former Europe-Aid Cooperation Office (AIDCO, created in 2011) and the Directorate-General for Development and Relations with ACP (African, Caribbean and Pacific) States.1
The EU accompanies each call for proposals with a guide for applicants, which describes, among other things, the purpose of the call for proposals, the eligibility requirements for applicants and the evaluation criteria for the selection of competing NGDOs and the award of the grant. In general, in order to be eligible to tender for grants, the EU requires NGDOs to meet certain requirements related to: (i) the nationality of the entities (contracts are only concluded and grants awarded to entities from certain countries) or (ii) to the origin of the goods they intend to purchase with EU funds. In addition, it asks entities to provide a declaration of honour certifying that they have not committed any irregularities in their previous operation. These irregularities have to do with bankruptcy proceedings, fraud, corruption or terrorist offences in previous contracts with the EU. All these requirements cannot be considered indicators of good performance. In general, in order to check the financial and operational capacity of NGDOs, the EU requires applicants to be registered in the Potential Applicant Data On-Line Registration (PADOR). Organisations wishing to obtain EU funds must provide PADOR with data on the organisation's profile, values, target population, sectorial and geographical experience, as well as financial data, human resources, and the composition of the governing body. However, the regulations do not make explicit to what extent and how these data are used (Europe-Aid Online Registration Service, 2008).
Once registered in PADOR, an evaluation committee carries out a first analysis of the technical formulation of the project submitted by the NGDO to obtain the grant. In this first analysis (called analysis of the synthesis formulation), only aspects of the project are rated, according to criteria that are individually assessed on a scale of 1 to 5 (1 would be very poor compliance and 5 very satisfactory compliance). Only the summary documents that have obtained a certain minimum total score will be taken into account for pre-selection purposes. These criteria, as they refer to specific aspects of the project submitted by the NGDO for the grant (relevance and design), do not provide information on the general functioning of the organisation but only on how it will implement this particular project. Therefore, they cannot be considered as indicators of the organisation's performance.
After the pre-selection, in the next step the EU reassesses, through the data provided in a 'complete' application form, aspects related to the specific action to be carried out. In this step the goal is reassessing its relevance and also assessing its effectiveness, viability and sustainability, devoting a single criterion, to which it awards a weighting of 20 points out of 100, to the assessment of the operational and financial capacity of the applicants.
The indicators established by the EU linked to this criterion and their weighting are listed in Table 7. The scoring scale for each criterion ranges from 1 to 5, where 1 = very poor; 2 = poor; 3 = acceptable; 4 = satisfactory; 5 = very satisfactory. The NGDO must score a minimum of 12 points on this criterion to pass the selection. The description of the indicators is ambiguous as terms such as "sufficient experience", "sufficient capacity" or "sufficient sources of funding" are used, so the final score given to each indicator will depend on the experts.
After the evaluation of the financial and operational capacity, the NGDOs will be analysed by the evaluation committee by comparing the data declared to PADOR with the information contained in the statutes of the entity. These statutes include the financial reports, the audit report of the last year available, a legal entity form (showing the legal form of the entity and its personal data), a financial entity form (showing the bank in which the grant will be deposited) and a declaration of the entity stating that it has the means to carry out the action and commits itself to do so.
In no case does the EU provide information on the indicators, and the requirements associated with them, that serve as a basis for the assessment of NGDOs. It is not possible to know on what basis the EU finally decides which organisations to subsidise out of all those that have passed the previous stages analysed.2
The analysis of the data requested by the EU has made it possible to identify possible indicators that have been classified into four criteria (see Table 8). As the financial and operational capacity criterion has a weighting of 20% for the EU in the subsidy scale, it has been divided among all the indicators identified in this study, giving them all the same weighting.
3.3. Analysis of USAID Eligibility Criteria
The United States regulates the awarding of development cooperation grants in the Foreign Assistance Act of 1961 and in Regulation 2 CFR 200: Uniform Administrative Requirements, Cost Principles, and Audit Requirements for Federal Awards (U.S. Government Publishing Office [GPO], n.d.a). USAID, as the agency in charge of US foreign policy in the area of development cooperation, works under a series of rules, directives, encompassed in a system called ADS (Automated Directives System).
When USAID issues a Notices of Funding Opportunity (NOFO), any NGDO that wants to apply for a USAID grant must have a DUNS (Data Universal Numbering System) number, which identifies the organisation. It also must have a NATO Commercial and Government Entity Code (N Cage) and be registered in the United States Government Grants Management System (SAM) (US Federal Register of Contractors, USFCR, 2020). Obtaining the DUNS and (N) Cage does not require any additional requirements other than providing the organisation's identification data.
Registration with SAM also involves providing information on the organisation's age, fiscal year-end date, total revenues for the last three years, number of employees for the last year, compliance with environmental laws, tax obligations, and federal antitrust and corruption laws (affecting the organisation's officers and directors). These include that the organisation's representatives and officers must not be debarred from working with the federal government or have been convicted of antitrust violations, compliance with previous contracts with the US government, declaration of non-procurement of goods and services from countries that do not guarantee labour rights or have restricted foreign policies3, and compliance with US laws on non-discrimination on the basis of race, sex, religion, colour, sexual orientation or national origin. Upon registration with SAM, organisations seeking to receive a USAID grant must sign a declaration of honour4 certifying compliance with certain legal and ethical obligations.
Once these pre-requisites for registration have been met, USAID subjects the eligibility of organisations to a four-stage screening process.
The first phase consists of passing general criteria, usually related to the NGDO's experience, resources and compliance with US legislation. The second phase involves the fulfilment of the criteria set out in the specific call for proposals for a grant. These usually refer to the applicant organisation's previous experience both sectorially, and geographically, taking as indicators the number of successful actions previously carried out in the same sector and the number of years working in the country. Once the two previous phases have been completed, USAID submits the NGDO to an initial review. The criteria for passing this initial evaluation are established in each call for proposals, although, in general, they are in line with those listed in Table 9.
USAID does not establish the specific indicators that will be studied to verify compliance with each of the criteria, nor the weight to be given to each indicator. Thus, for example, one of the criteria that appears is previous experience in activities similar to those of the project with a weight of 10%. The fact is that it does not say whether experience will be measured by the number of projects previously carried out in the same sector, by the number of projects carried out in the same country, or whether other indicators will be taken into account. Nor does it indicate what the requirements are for each indicator to be considered positive, or what weight each indicator has when assessing the criterion in question if there is more than one indicator to check the same criterion. Furthermore, USAID gives the scale with the weights associated with each criterion, but does not establish the minimum score to be achieved in order to pass this preliminary phase. The only thing it adds is that the applicant will be informed in writing after the initial review.
In relation to the criteria set out in Table 9, those referring to the technical approach of the project (technical aspects) will not be taken into account in this study. The reason is that they are criteria related to a specific project in time and therefore represent a declaration of intent, but do not demonstrate the real functioning of the entity.
The criteria set out in the management and organisational analysis (management and institutional capacity) are considered, but their indicators are not provided by the Agency. It is known that the data on which the decision is based are contained in SAM and in the documents requested from the entity. In consequence, the analysis of previous experience will be based on the data on the seniority of the organisation contained in SAM and on the applicant's performance history. It is not possible to know, from the data in the performance history, which specific indicators are used to verify this experience, which has a weighting of 10% in the grant analysed. In this work, two indicators are considered: the length of service of the organisation and the number of projects previously carried out, both with a weight of 5% each (see Table 10).
To check human resources, USAID uses the indicator number of employees in the last year. Although as the criterion is worded, human resources - staff, partners and/or consultants - to implement all project components, including technical, administrative, financial and monitoring and evaluation, it seems to only analyse human resources. Considering that total income for the last three years is also requested (in SAM) and that audit reports are required (in the grant application), it is concluded that the analysis also covers financial resources. However, it is not known what data is analysed from these documents and therefore which indicators are associated with this requirement, so we will only consider the USAID explicit indicator of the number of people employed in the last year, with an associated weight of 25% (see Table 10).
If the NGDO passes the initial assessment, the three previous phases, it will go on to a new, more detailed analysis of its capacity, generally by means of a "pre-assessment survey" (NUPAS - Non-U.S. Organisation Pre-Award Survey). The NUPAS involves the analysis and evaluation, by a group of experts appointed by the Agency, of 29 criteria, classified into six categories or blocks, of equal weight, i.e. each of the blocks has a weight of 1/6 of the total score.
To verify compliance, each criterion may have one or more indicators, which will be evaluated according to a scale ranging from a score of 1 (inadequate compliance) to 4 (strong compliance). The score of the corresponding criterion is calculated as the average of the score obtained for each indicator. The block score is calculated as the average of the scores for each criterion and the overall score, the score obtained by the organisation, as the average of the scores in each of the 6 blocks. Depending on the score obtained, the experts conducting the evaluation will issue an audit report, with three possible results: (1) totally positive, the organisation is eligible to receive a grant; (2) positive, but with caveats, the organisation has operational deficiencies in certain aspects that USAID considers key and must be corrected to be eligible; and (3) negative, the organisation does not meet the minimum operational requirements to ensure proper management of USAID funds and the implementation of the activities to be funded. It is not known what average score the organisation must obtain for the report to be of one type or the other.
It should be noted that the NUPAS in some cases specifies the indicators of the criterion (for example, the solvency ratio as an indicator of the absorption capacity criterion) but in several cases, compliance with the criterion or the associated indicator is defined generically, using as a source of verification the observation by a group of experts of the organisation's internal procedures. This is done without specifying which variables are used by the group of experts or what must be included in these procedures for the indicator to be considered positive. Table 11 shows those indicators specified by the NUPAS, taking into account that those that the experts verify by means of data collected through observation have not been considered.
Having analysed the criteria, indicators, requirements, weightings and sources of verification used by the Spanish, European and American agencies, in the following section we will deduce, by comparing them, which criteria and indicators can be used to verify the internal performance of NGDOs.
3.4. Choice of Criteria and Indicators to Study the Good Performance of NGDOs
Having analysed the eligibility criteria of the Spanish, European and American agencies, it only remains to deduce, by comparison, which criteria are used to verify the good internal performance of the entities, the indicators and requirements associated with them, and the weights of these indicators.
The indicators obtained from the three donors analysed and the standardised weights calculated for each indicator (Table 6, Table 8 and Table 11) have been summarised in a single Table 12. The weights of each Agency for each indicator have been rounded and the indicators not covered by the different Agencies are listed as not applicable (N.A.).
From the study carried out in the previous section, we conclude that the criteria most frequently used by donors are four: (1) experience, (2) transparency and internal organisation or functioning, (3) human resources, and (4) resources and financial management. We now classify these indicators into the criteria listed above, establishing for each of them its realisation value or ideal value from the donor's point of view, in accordance with the regulations analysed in the previous section.
The first criterion is that of experience, collected by the agencies by means of the following indicators: 1. number of projects carried out previously; 2. length of service of the NGDO, which includes indicators related to the number of years the organisation has been involved in cooperation; 3. volume of funds managed and 4. number of countries in which it operates.
For donors, experience is a criterion to be maximised, awarding more points in the grant access scales to those organisations that offer higher numbers in different criteria. These are the number of projects executed, volume of funds managed, countries in which they operate or the organisation's seniority, which is logical, as the greater the experience, the better the internal functioning of the organisation due to the lessons learnt.
The second criterion is transparency and internal organisation. The assessment of the internal functioning of the organisation is usually exhaustive by the three donors analysed. From the point of view of transparency, the Spanish and American agencies assess whether the entity has a website or electronic headquarters. In the Spanish case, it is also made explicit that in order for the entity to be considered transparent, the webpage must include "activity reports, audited accounts, the composition of its governing bodies and technical teams" (AECID, 2019, article 11.2). In the case of USAID, it only refers to transparency within the criterion "governance and practice of good corporate governance", assessing "disclosure of data and transparency" but without defining what this consists of (USAID, n.d.).
On the other hand, if only the documents used by the three donors are taken into account to analyse the internal functioning of the organisation, without considering those that are used by a specific donor (such as the investment policy requested by AECID -AECID, 2017-), it can be deduced that the internal functioning is based on the analysis of different documents. These are the statutes (where it is also possible to assess whether the organisation has the functions of the board members, a procedure for the renewal of these members and a term limit), the strategic planning (which also includes the organisation's mission, vision and values), the activities report (which also allows us to know whether the actions carried out and the annual planning are monitored), the organisation chart (which, if complete, will also allow us to know whether the organisation's lines of responsibility, authority and communication are delimited), the annual accounts and the audit reports.
For donors, transparency and internal functioning is a maximisation criterion, with higher scores being awarded to those NGDOs that achieve higher scores on these indicators.
The third criterion covers human resources. Human resources are considered to be those people who work for the organisation, with or without an employment contract.
Another indicator that is considered interesting, and which is only assessed by the AECID, is the temporality rate, calculated, as defined by the AECID (2017), as a percentage of permanent contracts over the total staff. However, this definition does not correspond to that usually used in academic literature or by official5 bodies, which define the temporality rate as the ratio of temporary contracts over the total. This rate makes it possible to evaluate whether the organisation has a stable workforce, retaining their learning and experience, and also assesses whether the staff turnover is low, which can denote good staff management (good training, good remuneration, transparency in decisions, etc.).
The last criterion is financial resources. As with the criterion of transparency and internal organisation, the organisation's financial resources are assessed by donors using indicators and requirements that are not clearly publicised. For this, there is a group of people who are experts for the donor who analyse the organisation's policies, internal functioning and financial documents by observation.
However, from the comparison of the three agencies analysed, it can be deduced that the most important thing for the donor is to verify the existence of sufficient resources in the organisation to carry out the subsidised project and the stability of the organisation's financial resources.
Table 13 lists the indicators that have been deduced to analyse the performance of the institutions. We indicate whether for this group it is an indicator to be maximised or minimised, the indicators that have been discarded, the weights attributed to each indicator by each agency and the total weight that this indicator has for the donors. Indicators not considered by the different agencies are shown as not applicable (NA).
The indicators discarded are due to the fact that only one donor has taken them into account. The reason is that they are not considered to be an effective indicator for analysing the performance of the entities, such as the publication of the investment policy on its website, the number of sectors in which the NGDO operates or the number of networks to which it belongs.
As far as profits are concerned, in a non-profit sector, not making profits is not considered as a factor to be taken into account when analysing efficiency. The distribution of profits is limited by law (Article 3 of Law 49/2002 of 23 December 2002 on the tax regime for non-profit organisations and tax incentives for patronage), so that making a profit cannot be the reason for collaborating with the organisation or the objective expected of it.
4. Empirical Results: Promethee Approach
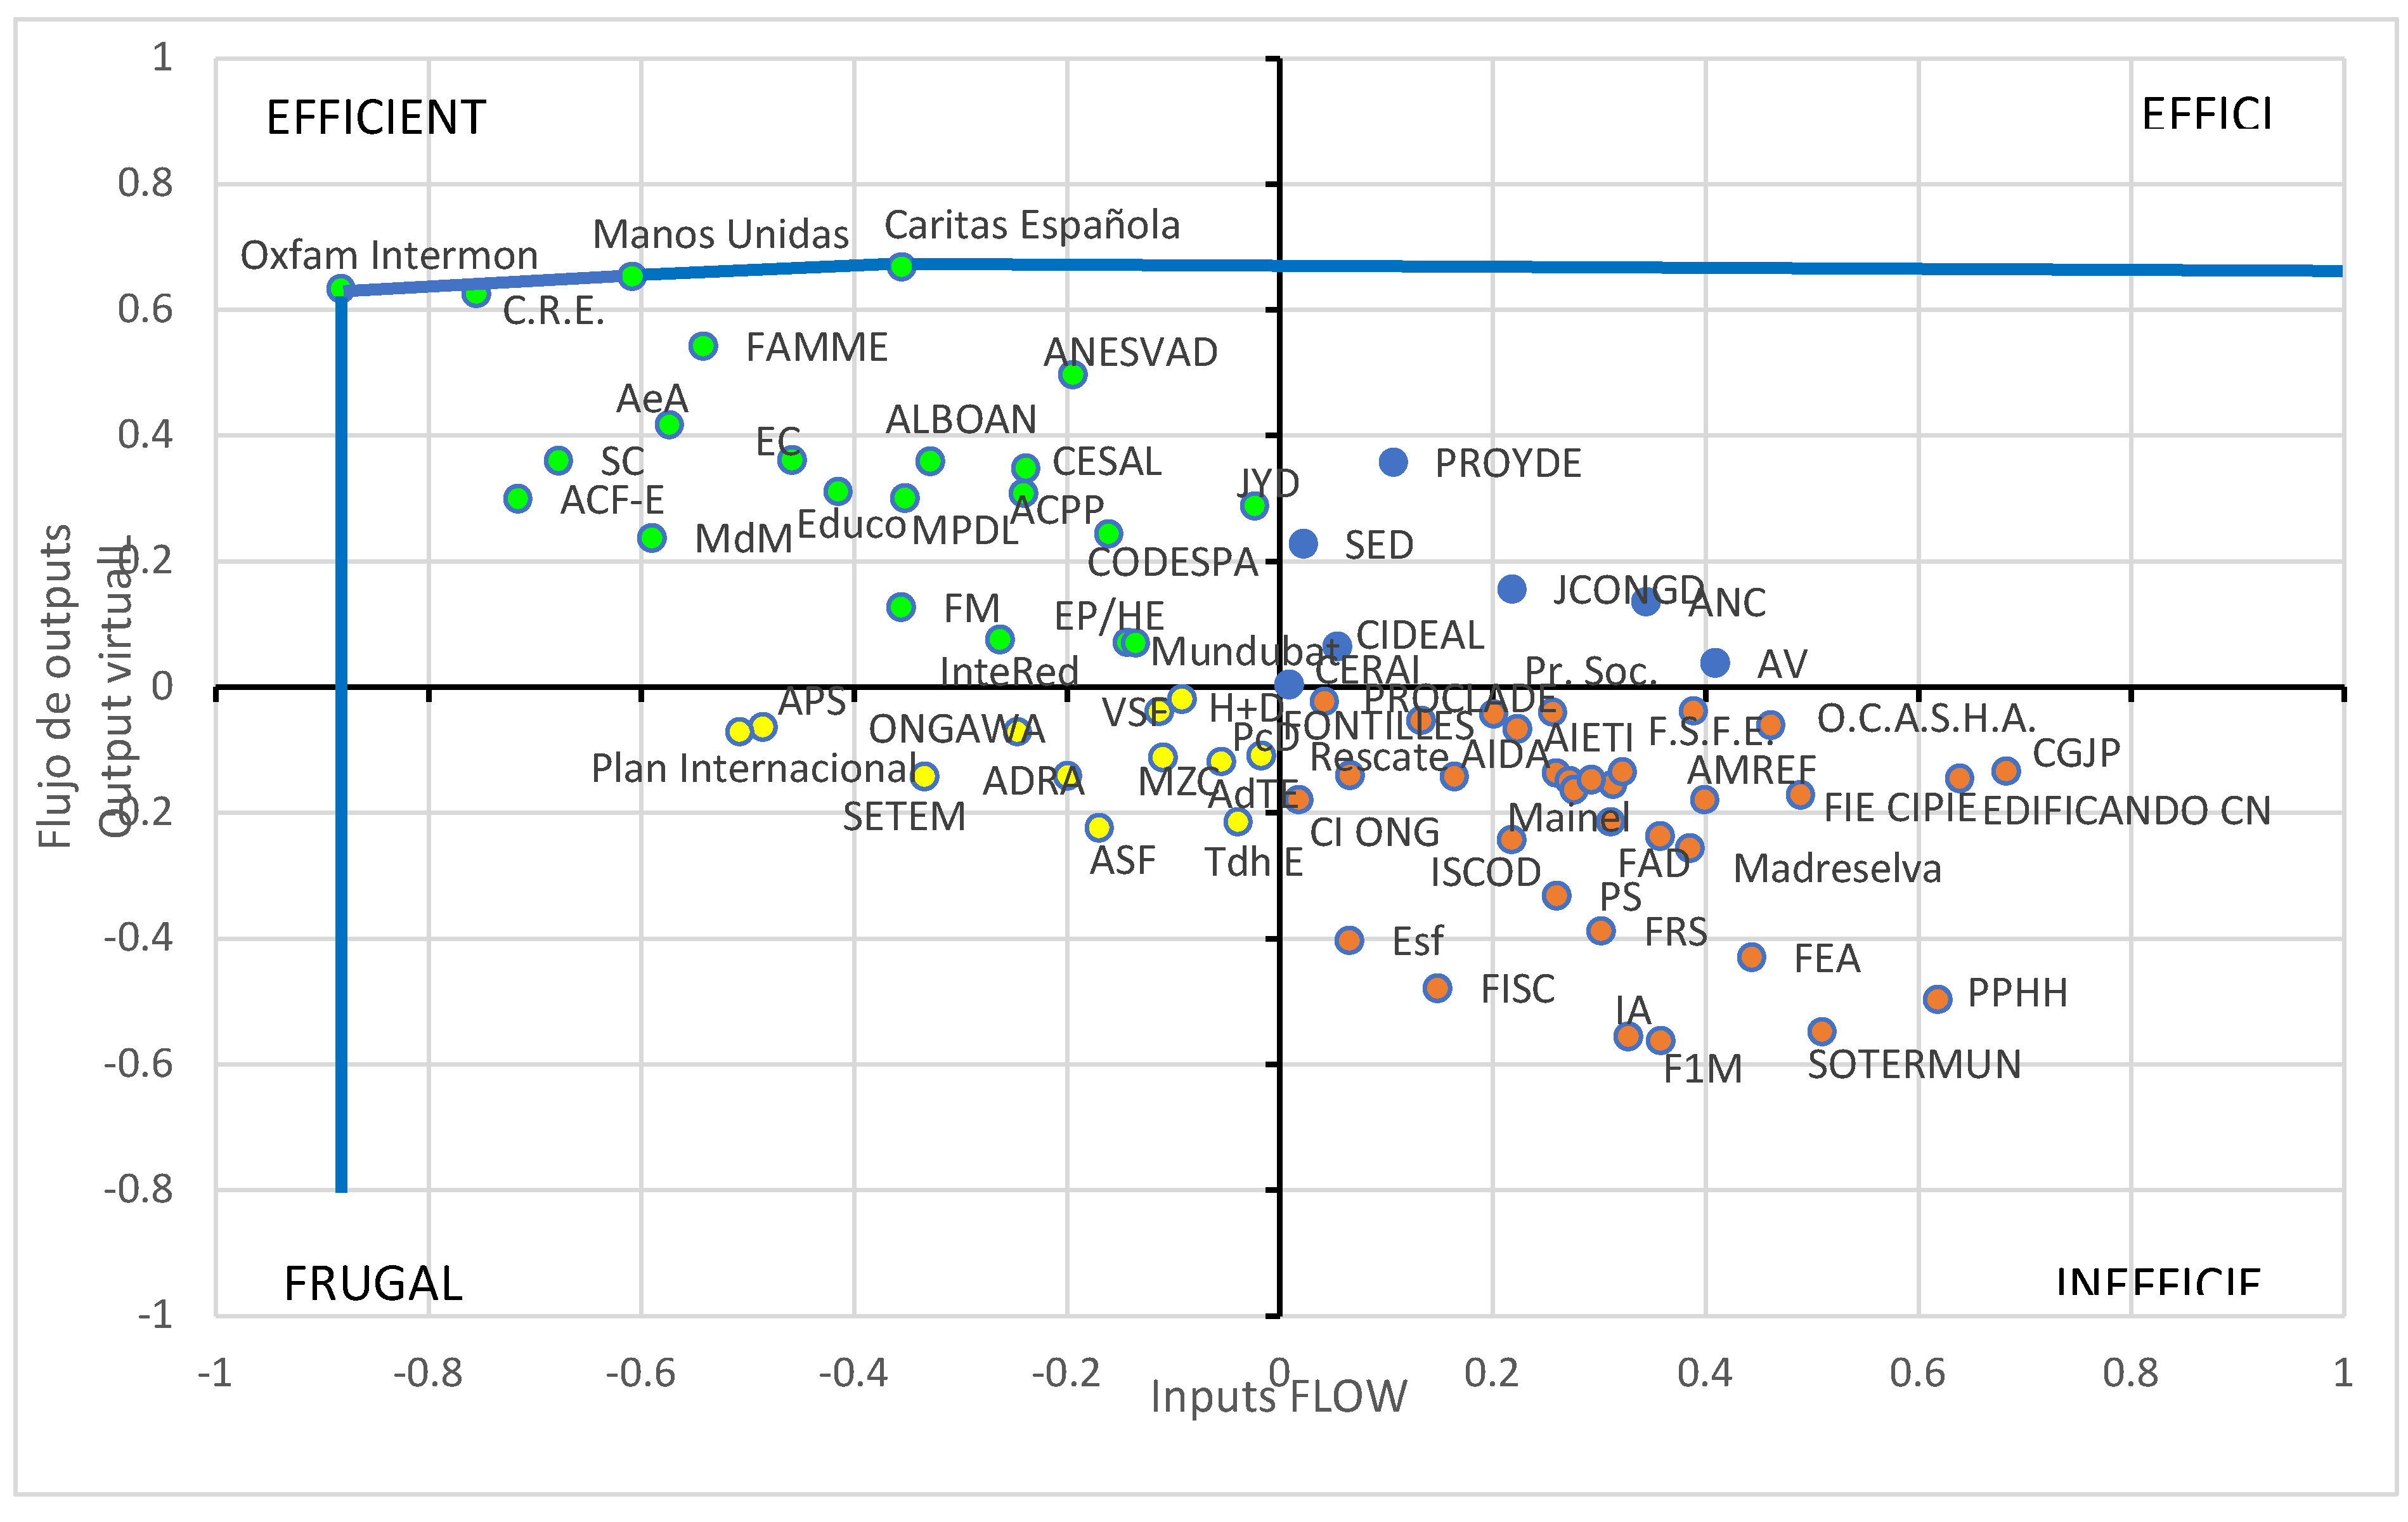
The efficiency of the 74 NGDOs that form part of the State NGDO Coordinating Committee is analysed using the indicators obtained from the donor eligibility criteria listed in previous tables. The data were obtained from those published by the Coordinating Committee in its recent sector report (Coordinadora de ONGD-España, 2017b), from the reports that NGDOs send to the Coordinating Committee and that the latter publishes on its website (Coordinadora de ONGD-España) and from the data on the website of each of the NGDOs in the sample. For the application of the method, the free software Visual Promethee 1.4 Academic Edition, (available at http://www.promethee-gaia.net/software.html) will be used. The steps are as follows: (i) Configuration of the multi-criteria decision matrix (ii) The different alternatives (the 74 NGDOs) and the indicators (listed in previous tables) that will be used to determine the efficiency of each NGDO, their values and weights, are loaded into the programme. Each indicator is assigned its unit of measurement and it is indicated whether it is an indicator to be maximised (the higher the indicator, the higher the value) or minimised (the lower the value, the higher the value). (iii) Two groups are created, the outputs (represented in the study by a green circle) and the inputs (represented in the study by a blue square), classifying each indicator in the corresponding group. Table 14 shows the NGDOs ranked according to their efficiency and the grants (in euros per project -€/pyto-) they have received from Spanish public donors during the analysed period, obtained from the BDNS. It also shows the order of the NGDOs from the highest to the lowest volume of grants received (in €/per project).
Taking the data to a spreadsheet and drawing a Cartesian plane where the virtual input is represented on the abscissa axis and the virtual output on the ordinate axis, Figure 1 (Appendix) is obtained.
The efficient frontier has also been represented by joining the NGDOs that occupy the best position (Oxfam Intermón, Manos Unidas and Cáritas Española), those with the highest net flow of output, given their inputs, or the lowest net flow of inputs given their outputs. It is important to take into account that we are working under the assumption that any positive convex linear combination of efficient NGDOs also belongs to the frontier, so the efficient frontier will be the one represented in Figure 1 by the blue line.
The virtue of the graphical representation is that it allows, in an intuitive way, to know what position each entity occupies, which entities are closer to it and what is the distance that separates it from the frontier. Moreover it also shows in which direction (if the frontier is closer to it by increasing the outputs, as would be the case of FAMME, or by decreasing the inputs, as would be the case of ACF-E).
By means of the graphical representation, NGDO managers can have a clear vision of which variables (inputs or outputs) they must act on to improve their position and, by analysing the functioning of the NGDOs located closer to the frontier, they can approach the decisions to be taken to improve the results obtained with their management (Figure 1 in Appendix).
The results obtained show that 44.6% of the NGDOs (33 out of the 74 studied) operate inefficiently, compared to 29.7% which are efficient. Moreover, 9.5% of the entities operate effectively, achieving their objectives, but at the cost of wasting resources, and 16.2% manage their resources well, but do not manage to satisfy the interests of all their participants, taken as the objectives of the NGDOs in this work.
Considering only the achievement of objectives (efficient and effective entities), 39.2% of NGDOs are efficient on the output side. On the input side, 45.9% of the NGDOs have a better management of their resources (efficient and frugal).
5. Conclusions
This paper aims to study the efficiency in the development cooperation sector, define the objectives and resources of the NGDOs and find general indicators that allow verifying to what extent the entities are achieving their goals and using their resources to be able to apply them to an efficiency study.
The efficiency indicators are inferred from those used by public donors when they select the NGDOs to receive funding, the so-called eligibility criteria published in different norms and laws. Thus, efficiency is measured in this paper using the indicators collected in the eligibility criteria of three of the main cooperation agencies: AECID, EuropeAid and USAID.
Given this opacity and in order to know if the indicators published by donors were sufficient to determine the award of a public grant to a NGDO, a simulation of granting public funding was applied. For this, the 74 NGDOs that in 2016 (up to 2018-2020) belonged to the Spanish Coordinator were taken. With the donor variables, a study of the efficiency of the coordinator´s NGDOs is carried out, using a technique that is an adaptation of the Promethee multi-criteria method known as PROMETHEE Productivity Analysis (PPA).
Our efficiency study reveals that 44.6% of the NGDOs (33 out of the 74 studied) operate inefficiently, compared to 29.7% which are efficient. Moreover, 9.5% of the entities operate effectively, achieving their objectives, but at the cost of wasting resources, and 16.2% manage their resources well, but do not manage to satisfy the interests of all their participants, taken as the objectives of the NGDOs in this work. Considering only the achievement of objectives (efficient and effective entities), 39.2% of NGDOs are efficient on the output side. On the input side, 45.9% of the NGDOs have a better management of their resources (efficient and frugal). Our results are important for academics, donors and managers of these type of organisations because they must be efficient in the use of the money they receive.
Funding
This research received no external funding.
Acknowledgments
We acknowledge the comments of the participants to the ACEDE Conference 2021.
Conflicts of Interest
The authors declare no conflict of interest.
Appendix A
Figure 1.
Classification of the NGDO according to their efficiency.
| 1 | Despite the creation of the Commission's Directorate General for International Cooperation and Development (DG DEVCO), the European Cooperation Agency is still generally referred to as Europe-Aid, so this study will use this name as it is the best known. |
| 2 | Nor is the weight given to the distribution of funds by country, which is so often the case in community policy, made explicit. |
| 3 | Available in U.S. Government Publishing Office [GPO] (s.f.-b). |
| 4 | The model is in ADS Reference 303mav Certifications, Assurances, Other Statements of the Recipient and Solicitation Standard Provisions, partial revision 22th May 2017 (USAID, 2017b). |
| 5 | See as an example the concept of temporality rate used by the Spanish Ministry of Labour in “Servicio Público de Empleo Estatal” [SEPE], 2018. |
References
- AECID (2017). Proceso de Calificación de Organizaciones no Gubernamentales de Desarrollo, Manual de autoevaluación para la acreditación como ONGD calificada. Recuperado el 11 de enero de 2019 de http://www.aecid.es/Centro-Documentacion/Documentos/documentos%20adjuntos/170810%201%20Manual%20Calif%20Nuevas.pdf.
- AECID (2018a). Resolución de 21 de mayo de 2018, de la Presidencia de la Agencia Española de Cooperación Internacional para el Desarrollo, por la que se convocan subvenciones a Acciones de Cooperación para el Desarrollo correspondientes al año 2018. Recuperado el 14 de julio de 2020 de https://www.aecid.gob.es/es/Paginas/DetalleProcedimiento.aspx?idp=277.
- AECID (2018b). Resolución de la Presidencia de la Agencia Española de Cooperación Internacional para el Desarrollo por la que se aprueba la convocatoria pública de concesión de subvenciones para la realización de convenios de cooperación para el desarrollo correspondiente al periodo 2018-2021. Recuperado el 13 de abril de 2019 de https://www.aecid.gob.es/es/Paginas/DetalleProcedimiento.aspx?idp=265.
- AECID (2019). Resolución de la Presidencia de la Agencia Española de Cooperación Internacional para el Desarrollo por la que se aprueba la convocatoria pública de concesión de subvenciones para la realización de proyectos de cooperación para el desarrollo, incluidos los de Educación para el Desarrollo en España, correspondiente al año 2019. Recuperado el 15 de diciembre de 2019 de https://www.aecid.gob.es/es/Paginas/DetalleProcedimiento.aspx?idp=310.
- Agyemang G., O’Dwyer B., Unerman J., Awumbila M. (2017). Seeking “conversations for accountability”: Mediating the impact of non-governmental organization (NGO) upward accountability processes. Accounting, Auditing & Accountability Journal, 30(5) pp. 982-1007. [CrossRef]
- Álvarez Orellana S.M. (2012). Una introducción a la cooperación internacional al desarrollo. REDUR 10, pp.285-309. Recuperado el 11 de julio de 2020 de https://dialnet.unirioja.es/servlet/articulo?codigo=4104832.
- Andrés-Alonso P., Martín-Cruz N., Romero-Merino M.E. (2006) The governance of nonprofit organizations: Empirical evidence from nongovernmental development organizations in Spain. Nonprofit and Voluntary Sector Quarterly, 4(35), pp.588-604. [CrossRef]
- Arroyo-Almaraz I., Calle Mendoza S., Van Wyk C (2018). La eficacia en la comunicación de las ONGD. El uso de Facebook en campañas de emergencia. Revista Latina de Comunicación Social, 7 (73) pp. 765-789. [CrossRef]
- Atukuzwe k.k.(2018). Effect of Institutional Reforms on the Performance of Non-Governmental Organizations: A Case Study of Un-Habitat. Digital repository Unites States International Uniersity-Africa. Recuperado el 30 de agosto de 2020 de http://erepo.usiu.ac.ke/11732/3950.
- Ayllón B. (2007). La cooperación internacional para el desarrollo: fundamentos y justificaciones en la perspectiva de la Teoría de las Relaciones Internacionales. Carta Internacional, 2(2) pp.32-47. Recuperado el 23 de enero de 2017 de https://www.cartainternacional.abri.org.br/Carta/article/view/416.
- Bach-Mortensen A.M., Montgomery P. (2018). What are the barriers and facilitators for third sector organisations (non-profits) to evaluate their services? A systematic review. systematic review 7(13) pp. 2-15. [CrossRef]
- Báez Melian J.M. (2008). Un análisis crítico del actual sistema internacional de cooperación al desarrollo. Estudios Económicos de Desarrollo Internacional, 8(2), pp.21–40.
- Berber P., Brockett P.L., Cooper W.W., Golden L., Parker B.R. (2011). Efficiency in fundraising and distributions to cause-related social profit enterprises. Socio-Economic Planning Sciences, 45 (1), pp.1–9.
- Bisbe J., Barrubés J. (2012). El Cuadro de Mando Integral como instrumento para la evaluación y el seguimiento de la estrategia en las organizaciones sanitarias. Revista Española de Cardiología 65 (10), pp. 919-927.
- Cabedo J.D., Fuertes-Fuertes I., Maset-LLaudes A. (2017). Improving and measuring transparency in NGOs: A disclosure index for activities and projects. Non profit Management & Leadership, 28(3) pp. 329-348. [CrossRef]
- Comisión Europea (2016). Contratación pública y subvenciones para las acciones exteriores de la Unión Europea. Una guía práctica (Versión 2016.0- 5 de enero de 2016) (PRAG). Recuperado el 13 de febrero de 2018 de. http://ec.europa.eu/europeaid/prag.
- Cooley A., Ron J. (2002). The NGO scramble: organizational insecurity and the political economy of transnational action. International Security 27 (1), pp.5-39. Cambridge, Reino Unido: MIT Press.
- Coordinadora de ONG para el Desarrollo-España (2017). Informe de la Coordinadora sobre el sector de las ONGD. Edición 2017. Recuperado el 19 de abril de 2020 de http://informe2017.coordinadoraongd.org/.
- Cordery C., Sinclair R. (2013): Measuring performance in the third sector. Qualitative Research in Accounting & Management, 10 (3/4), pp. 196-212. [CrossRef]
- Corral-Lage F., Maguregui-Urionabarrenechea L., Elechiguerra-Arrizabalaga C. (2019). An empirical investigation of the Third Sector in Spain: towards a unified reconceptualization. Revista de Contabilidad Spanish Accounting Review, 22 (2) pp. 145-155. [CrossRef]
- Data Universal Numbering System (DUNS) (2020). Informa Dun & Bradstreet. Recuperado el 13 de julio de 2020 de https://numero-duns.informa.es/.
- Dubois A., Yoldi P. (2001): La financiación del desarrollo: flujos privados y ayuda oficial al desarrollo. Vitoria-Gasteiz: Servicio Central de Publicaciones del Gobierno Vasco. Recuperado el 22 de febrero de 2017 de http://publicaciones.hegoa.ehu.es/uploads/pdfs/71/La_financiacion_del_desarrollo._manual_3._castellano.pdf?1488539213.
- Ecer S., Magro M., Sarpça S. (2017) The relationship between nonprofits’ revenue composition and their economic-financial efficiency. Nonprofit and Voluntary Sector Quarterly, 1(46), pp.141-155.
- Federal Service Desk, (s.f.). ¿Qué es un código CAGE o NCAGE y cómo obtengo uno?. USA: fsd.gov. Recuperado el 13 de julio de 2020 de https://www.fsd.gov/fsd-gov/answer.do?sysparm_number=kb0011119.
- Ferreira M.R., Carvalho A., Teixeira F. (2017). Non-Governmental Development Organizations (NGDO) Performance and Funds—A Case Study. Journal of Human Values, 23 (3) pp. 178-192. [CrossRef]
- Forbes D.P. (1998): Measuring the unmeasurable: Empirical studies of nonprofit organization effectiveness from 1977 to 1997. Nonprofit and Voluntary Sector Quarterly, 27 (2), pp.183-202.
- Gálvez-Rodríguez M.M.; Caba-Pérez C.; López-Godoy M. (2016). NGOs efficiency and transparency policy: The Colombian case. Innovar: Revista de Ciencias Administrativas y Sociales, 26(60), pp.67-82. Universidad Nacional de Colombia: Escuela de Administración de Empresas y Contaduría Pública. [CrossRef]
- García Cebrián L. I., Marcuello Cerbós C. (2007). Eficiencia y captación de fondos en las organizaciones no gubernamentales para el desarrollo. Revista de Economía Pública, Social y Cooperativa, 58, pp.221-249. Recuperado el 11 de julio de 2020 de https://dialnet.unirioja.es/servlet/articulo?codigo=2470635.
- Gazzola P., Amelio S., Papagiannis F., Michaelides Z. (2019). Sustainability reporting practices and their social impact to NGO funding in Italy. Critical Perspectives on Accounting 102085. [CrossRef]
- Gómez Galán M., Sanahuja J.A. (1999): El Sistema Internacional de Cooperación al Desarrollo una Aproximación a sus Actores e Instrumentos. Madrid: CIDEAL.
- González Quintana M.J., Cañadas Molina E. (2008). Los Indicadores de gestión y el cuadro de mando en las entidades no lucrativas. CIRIEC-España, Revista de Economía Pública, Social y Cooperativa, 63, pp.227-252. Valencia, Centre International de Recherches et d'Information sur l'Economie Publique, Sociale et Coopérative. Recuperado el 11 de julio de 2020 de https://www.redalyc.org/pdf/174/17412307009.pdf.
- Greatbanks R., Elkin G. (2010). The use and efficacy of anecdotal performance reporting in the third sector. International Journal of Productivity and Performance Management, 59 (6) pp. 571-585. [CrossRef]
- Greiling D. (2010). Balanced scorecard implementation in German non-profit organisations. International Journal of Productivity and Performance Management, 59 (6) pp. 534-554. [CrossRef]
- Hernangómez Barahona J., Martín Cruz N., Martín Pérez V. (2006). La relevancia del objetivo en la medida de la eficiencia. Un análisis para las ONGD españolas desde la teoría del comportamiento. Boletín Económico del ICE, 2884, pp.55-68. Madrid: ICE.
- Kaplan R.S. (2001). Strategic performance and measurement in nonprofit organisations. Nonprofit Management and Leadership, 11(3), pp.353- 370. Recuperado el 11 de julio de 2020 de http://docshare02.docshare.tips/files/13452/134524942.pdf.
- Larrú J.L. (2015). Corrupción y ayuda al desarrollo: evidencias, teoría y aplicaciones para España. Cuadernos Económico de ICE, 78, pp.261-280. Recuperado el 2 de julio de 2020 de https://repositorioinstitucional.ceu.es/bitstream/10637/6821/1/Corrupcion_Larru_CuaderEcoICE_2009.pdf.
- Lecy J.D., Schmitz H.P., Swedlund H. (2012). Non-governmental and not-for-profit organizational effectiveness: a modern synthesis. Voluntas: International Journal of Voluntary and Nonprofit Organizations, 23(2), pp.434-457. Baltimor, EE UU: International Society for Third-Sector Research.
- Ley 23/1998, de 7 de julio, de Cooperación Internacional para el Desarrollo. Boletín Oficial del Estado (BOE) núm. 162 de 8 de julio de 1998.
- Ley 38/2003, de 17 de noviembre, General de Subvenciones. Boletín Oficial del Estado (BOE) núm. 276 de 18 de noviembre de 2003.
- Luke B., Barraket J, Eversole R. (2013): Measurement as legitimacy versus legitimacy of measures Performance evaluation of social Enterprise. Qualitative Research in Accounting & Management, 10 (3/4) pp. 234 – 258. [CrossRef]
- Maguregui Urionabarrenechea M.L., Corral Lage J., Elechiguerra Arrizabalaga C. (2015). Gestionar con calidad las entidades sin ánimo de lucro: hacia una eficacia, eficiencia y economía en la rendición de cuentas. Revista de Estudios Empresariales, Segunda época, 1, pp.28-57. Recuperado el 28 de diciembre de 2018 de https://revistaselectronicas.ujaen.es/index.php/REE/article/view/2205.
- Martín Pérez V, Martín Cruz N., Gámez Alcalde C. (2012). La eficiencia y el misreporting contable en las ONGD españolas. Análisis de proyectos de cooperación internacional para el desarrollo. Academia: Revista Latinoamericana de Administración, 51, pp.1-14. Bogotá: Consejo Latinoamericano de Escuelas de Administración. Recuperado el 12 de marzo de 2020 de https://www.redalyc.org/pdf/716/71625040002.pdf.
- Martín Pérez V., Martín Cruz N, Serrano Rodríguez M.J. (2015). Eficiencia de las ayudas al desarrollo: El caso español. Revista Venezolana de Gerencia (RVG), 20(70), pp.285-311. Universidad del Zulia.
- Martín Pérez V., Martín Cruz N (2020).. Influence of online transparency on efficiency. Analysis of spanish NGDOs. CIRIEC - España. Revista de economía pública social y cooperativa, 99 (10) pp.: 5-35.
- Matos P.V. Romão M., Miranda Sarmento J., Alexandre Abaladas A. (2019). The adoption of project management methodologies and tools by NGDOs: A mixed methods perspective. Journal of Business Research, 101 pp.651-659. [CrossRef]
- Medina Rey J.M. (2009). Transparencia y buen gobierno en las ONGD´S. Revista española del tercer sector, 11, pp.93-113. Fundación Luis Vives. Recuperado el 18 de julio de 2020 de http://www.plataformatercersector.es/sites/default/files/N11%20RETS%20Las%20ONG%20de%20Desarrollo.pdf.
- Mouchamps H. (2014). Weighing elephants with kitchen scales. International Journal of Productivity and Performance Management, 63 (6) pp. 727 – 745. [CrossRef]
- Moxham C. (2014). Understanding third sector performance measurement system design: a literature review. International Journal of Productivity and Performance Management, 63 (6) pp. 704 – 726. [CrossRef]
- Nunnenkamp P., Öhler H. (2010). Funding, Competition and the Efficiency of NGOs: An Empirical Analysis of Non-charitable Expenditure of US NGOs Engaged in Foreign Aid. Kiel Working Paper, 1640. Kiel, Alemania: Kiel Institute for the World Economy. Recuperado el 2 de agosto de 2020 de https://www.econstor.eu/bitstream/10419/37096/1/63187822X.pdf.
- Orden AEC/1303/2005, de 27 de abril, por la que se regulan las bases para la concesión de subvenciones a organizaciones no gubernamentales de desarrollo, para la realización de intervenciones en materia de cooperación internacional para el desarrollo. Boletín Oficial del Estado (BOE) núm. 113, de 12 de mayo de 2005.
- Orden AEC/2909/2011, de 21 de octubre, por la que se establecen las bases para la concesión de subvenciones de cooperación internacional para el desarrollo. Boletín Oficial del Estado (BOE) núm.261, de 29 de octubre de 2011.
- Price J.L. (1968). Organizational effectiveness: An inventory of propositions. Homewood, EE UU: Richard D. Irwin.
- Real Decreto 887/2006, de 21 de julio, por el que se aprueba el Reglamento de la Ley 38/2003, de 17 de noviembre, General de Subvenciones. Boletín Oficial del Estado (BOE) núm.176, de 25/07/2006.
- Real Decreto 794/2010, de 16 de junio, por el que se regulan las subvenciones y ayudas en el ámbito de la cooperación internacional. Boletín Oficial del Estado (BOE) núm. 154, de 25 de junio de 2010.
- Real Decreto 193/2015 de 23 de marzo, por el que se aprueba el Reglamento del Registro de Organizaciones No Gubernamentales de Desarrollo. Boletín Oficial del Estado (BOE) núm.83, de 7 de abril de 2015.
- Registro federal de contratistas de EE UU (USFCR) (2020). Start a SAM Registration. Recuperado el 13 de julio de 2020 de https://usfcr.com/sam-registration/?utm_medium=ppc&utm_term=system%20for%20award%20management&utm_campaign=SAM&utm_source=adwords&hsa_tgt=kwd-37660679064&hsa_ad=442167707643&hsa_src=g&hsa_mt=b&hsa_ver=3&hsa_cam=122161541&hsa_acc=1449812725&hsa_kw=system%20for%20award%20management&hsa_grp=5341822301&hsa_net=adwords&gclid=Cj0KCQjwpZT5BRCdARIsAGEX0zlhUXrGhPn1Umpcxd70Z6hD8S0pE8upyfXwyIIBFx3piF13pe20fosaAtllEALw_wcB.
- Retolaza J.L. (2010). Factores estratégicos de éxito en las Empresas de Inserción. Tesis Doctoral. Universidad del País Vasco. UPV/EHU.
- Resolución de 17 de septiembre de 2013, de la Presidencia de la Agencia Española de Cooperación Internacional para el Desarrollo, por la que se establece el procedimiento para la obtención, revisión y revocación de la calificación por las organizaciones no gubernamentales de desarrollo. Boletín Oficial del Estado (BOE) núm. 250 de 18 de octubre de 2013.
- Ribar D.C., Wilhelm M.O. (2002). Altruistic and joy-of-giving motivations in charitable behavior. Journal of Political Economy 110(2), pp.425-457. University of Chicago. Recuperado el 2 de junio de 2020 de https://econweb.ucsd.edu/~jandreon/PhilanthropyAndFundraising/Volume%201/16%20Ribar%20Wilhelm%202002.pdf.
- Sainz H. (2007). Venturas y desventuras del enfoque del marco lógico. Revista Española de Desarrollo y Cooperación, 20, pp.133-150. Instituto Universitario de Desarrollo y Cooperación.
- Sanahuja J.A. (2007): ¿Más y mejor ayuda? La Declaración de París y las tendencias en la cooperación al desarrollo, pp.71-101. En Mesa, M. (coord.), Paz y conflictos en el Siglo XXI: Tendencias globales anuario 2007-2008. Madrid: Centro de Educación e Investigación para la Paz (CEIPAZ), Icaría.
- Servicio de Registro en línea de EuropeAid (2008). Manual de usuario de PADOR. Recuperado el 4 de julio de 2020 de http://www.anong.org.uy/docs/noticias/docs%20convocatoria%20com%20europea/PADOR.pdf.
- Taysir E.A., Taysir N.K. (2012). Measuring effectiveness in nonprofit organisations: an integration effort. Journal of Transnational Management, 17, pp.220-235. Recuperado el 11 de julio de 2020 de https://www.researchgate.net/publication/271992270_Measuring_Effectiveness_in_Nonprofit_Organizations_An_Integration_Effort.
- The Foreign Assistance Act of 1961. P.L. 87-195; 22 U.S.C. 2151 et seq.
- U.S. Government Publishing Office [GPO] (s.f.a). 2 CFR 200 -Uniform administrative requirements, cost principles, and audit requirements for federal awards, de 1 de enero de 2014 Gov.info. Recuperado el 14 de julio de 2020 de https://www.govinfo.gov/content/pkg/CFR-2014-title2-vol1/pdf/CFR-2014-title2-vol1-part200.pdf.
- U.S. Government Publishing Office [GPO] (s.f.b). 22 CFR 228.03 - Identification of principal geographic code numbers, de 1 de abril de 2002. Gov. Info. Recuperado el 14 de julio de 2020 de https://www.govinfo.gov/content/pkg/CFR-2002-title22-vol1/pdf/CFR-2002-title22-vol1-sec228-03.pdf.
- USAID (s.f.). Non-Us Organization Pre-Award Survey (NUPAS). Recuperado el 12 de marzo de 2018 de https://www.usaid.gov/sites/default/files/documents/1868/303sama1.docx.
- USAID (2012). Non-U.S. Organization Pre-Award Survey, Guidelines and Support, Additional Help for ADS Chapter 303. Recuperado el 23 de marzo de 2018 de: https://www.usaid.gov/sites/default/files/documents/1868/303sam.pdf.
- USAID (2017a): ADS 303 –Grants and Cooperative greements to Non-Governmental Organizations, Functional Series 300 –Acquisition and Assistance, partial revision de 3 de abril de 2017. Recuperado el 13 de febrero de 2018 de https://www.usaid.gov/sites/default/files/documents/1868/303.pdf.
- USAID (2017b): ADS Reference 303maa, Standard Provisions for U.S. Nongovernmental Organizations, partial revisión 22 de mayo de 2017. Recuperado el 8 de marzo de 2018 de https://www.usaid.gov/ads/policy/300/303maa.
- USAID (2017c): ADS Reference 303mab, Standard Provisions for non-U.S. Nongovernmental Organizations, partial revision 23 de junio de 2017. Recuperado el 8 de marzo de 2018 de https://www.usaid.gov/ads/policy/300/303mab.
- USAID (2017d): ADS Reference 303mat Standard Provisions for Fixed Amount Awards to Nongovernmental Organizations, partial revision de 4 de junio de 2017. Recuperado el 8 de marzo de 2018 de https://www.usaid.gov/ads/policy/300/303mat.
- USAID (2018). Municipal Waste Recycling Program (MWRP) to Reduce Plastics Pollution of the Oceans – Indonesia, Philippines, Sri Lanka, and Vietnam. Recuperado el 1 de agosto de 2020 de https://www.usaid.gov/sites/default/files/documents/1861/MWRP_APS_as_Amended_2018_01.pdf.
- USAID (2020). Operational Policy (ADS). Recuperado el 1 de julio de 2020 de https://www.usaid.gov/who-we-are/agency-policy.

Table 1.
Indicators from AECID's general regulations.
| INDICATOR | STAGE | WEITGH | Total Weight | |
|---|---|---|---|---|
| 1 | Organisation chart | AECID Registration | 12.50% | 100% |
| 2 | Number of members | AECID Registration | 12.50% | |
| 3 | Number of workers hired | AECID Registration | 12.50% | |
| 4 | Number of volunteers | AECID Registration | 12.50% | |
| 5 | Number of development workers | AECID Registration | 12.50% | |
| 6 | Volume of private funds received | AECID Registration | 12.50% | |
| 7 | Volume of public donations received | AECID Registration | 12.50% | |
| 8 | Annual report of activities | AECID Registration | 12.50% |
Source: Own elaboration.
Table 2.
Indicators from Order AEC/2909/2011 and the resolutions on the call for subsidies.
Source: Own elaboration.
Table 3.
Indicators collected in the first qualification phase.
| INDICATOR | STAGE | WEIGHT | Total Weight | |
|---|---|---|---|---|
| 15 | Years in cooperation receiving public funding | Minimum qualification requirements | 12.50% | 100% |
| 16 | Number of projects executed | Minimum qualification requirements | 12.50% | |
| 17 | Volume of funds managed | Minimum qualification requirements | 12.50% | |
| 18 | Audit of annual accounts | Minimum qualification requirements | 12.50% | |
| 19 | Volume of profits or losses | Minimum qualification requirements | 12.50% | |
| 20 | Evolution of shareholders' equity | Minimum qualification requirements | 12.50% | |
| 21 | Number of staff hired | Minimum qualification requirements | 12.50% | |
| 22 | Social base: Number of members and private donors. | Minimum qualification requirements | 12.50% |
Source: Own elaboration.
Table 4.
Indicators extracted from the quantitative and qualitative assessment of the AECID qualification.
Table 4.
Indicators extracted from the quantitative and qualitative assessment of the AECID qualification.
| INDICATOR | STAGE | WEIGHT (real of the agency) | Total weight | |
|---|---|---|---|---|
| 23 | Solvency Ratio | Scale of qualification | 6.00% | 49.35 / 100 The rest of the indicators up to 100 points cannot be assessed due to a lack of public data or because they are formal (for example, the number of women in managerial positions or presence in priority countries for Spanish cooperation). |
| 24 | Average Workforce | Scale of qualification | 2.25% | |
| 25 | Temporariness Rate (average percentage of permanent contracts with respect to the average workforce). | Scale of qualification | 2.00% | |
| 26 | Average ratio of co-operating partners per project (includes the AECID requirement: Number of development workers in the field) | Scale of qualification | 3.15% | |
| 27 | Number of partners | Scale of qualification | 3.00% | |
| 28 |
Number of volunteers Includes the following AECID indicators: 1) Number of volunteers (with a weight of 3 points out of 100) and 2) The organisation has had volunteer personnel continuously for the last five years and has complied with Law 6/1996 and Law 23/1998 (which is valued with 1.08 points out of 100). |
Scale of qualification | 4.08% | |
| 29 | Volume of funds earmarked for cooperation | Scale of qualification | 2.00% | |
| 30 | Years of dedication of the NGDO to Development Co-operation | Scale of qualification | 4.00% | |
| 31 | Number of countries in which it is present | Scale of qualification | 2.00% | |
| 32 |
Publicity on the website of the Strategic Planning. It covers the following AECID requirements: 1) The existence of a document setting out the mission, vision and values (scored 0.45 points out of 100); 2) The publicity of this document (scored 0.45 points out of 100), 3) Staff, including volunteers, are aware of the mission, vision and values (scored 0.45 points out of 100). |
Scale of qualification | 4.05% | |
| 33 | The names of the people who make up the board of trustees or the board of directors are published with a brief biographical sketch or curriculum vitae on the website. It meets AECID requirements: 1) The members of the governing bodies are publicised (scored 0.9 points out of 100) and 2) The members of the governing bodies are renewed (scored 0.45 points out of 100). | Scale of qualification | 1.35% | |
| 34 |
It has an updated website. It includes the AECID indicators: 1) The NGDO has an updated website (rated 1.5 points out of 100) and 2) There is a website that complies with the provisions of Law 19/2013 (rated 2.475 points out of 100). |
Scale of qualification | 3.98% | |
| 35 | Organisational chart and document that defines the functions of each department and job position. | Scale of qualification | 0.50% | |
| 36 |
Publication of the annual activity report on the website. This indicator includes the following AECID indicators: 1) The governing body annually monitors compliance with the objectives established in the strategic planning (rated 0.9 points out of 100), 2) The entity's activities are in line with the vision and strategic plan (rated 0.9 points out of 100), 3) There is a document that includes the annual planning of activities, approved by the governing body (rated 1.6 points out of 100), 4) The governing body is aware of the degree of compliance with the objectives of the annual planning (rated 1 point out of 100), 5) The governing body is aware of the degree of compliance with the objectives of the annual planning (rated 1 point out of 100). (rated 1.6 points out of 100), 5) The governing body is aware of the degree of compliance with the objectives of the annual planning (rated 1 point out of 100) and 6) The Activities report is sent annually to members and collaborators (rated 0.9 points out of 100). |
Scale of qualification | 5.30% | |
| 37 |
Membership of networks and platforms. This includes the following AECID indicators: 1) The NGDO belongs to a specific Spanish platform for Development Cooperation (rated 1.05 points out of 100) and 2) The NGDO belongs to an international platform and actively participates (rated 1.05 points out of 100). |
Scale of qualification | 2.10% | |
| 38 | The website contains the investment policy | Scale of qualification | 0.90% | |
| 39 | Profit or loss. | Scale of qualification | 0.315% | |
| 40 |
The audit reports are published on the website. It includes the following AECID indicators: 1) The audit reports of the last three years do not reflect uncertainty regarding the continuity of the activity (valued with 0.525 points out of 100) and 2) In the last six years, the audit reports of the Annual Accounts do not present the same qualification on two or more occasions (valued with 0.315 points out of 100). |
Scale of qualification | 0.84% | |
| 41 | Evolution of equity | Scale of qualification | 0.315% | |
| 42 |
The annual accounts are published on the website. Includes the AECID indicator: access to accounting records. |
Scale of qualification | 0.315% | |
| 43 |
Percentage of public funding This includes AECID's requirement of: In each of the last five years, considered separately, more than 80% of income does not come from public subsidies. |
Scale of qualification | 0.90% |
Source: Own elaboration.
Table 5.
Grouping of indicators corresponding to the average workforce indicator.
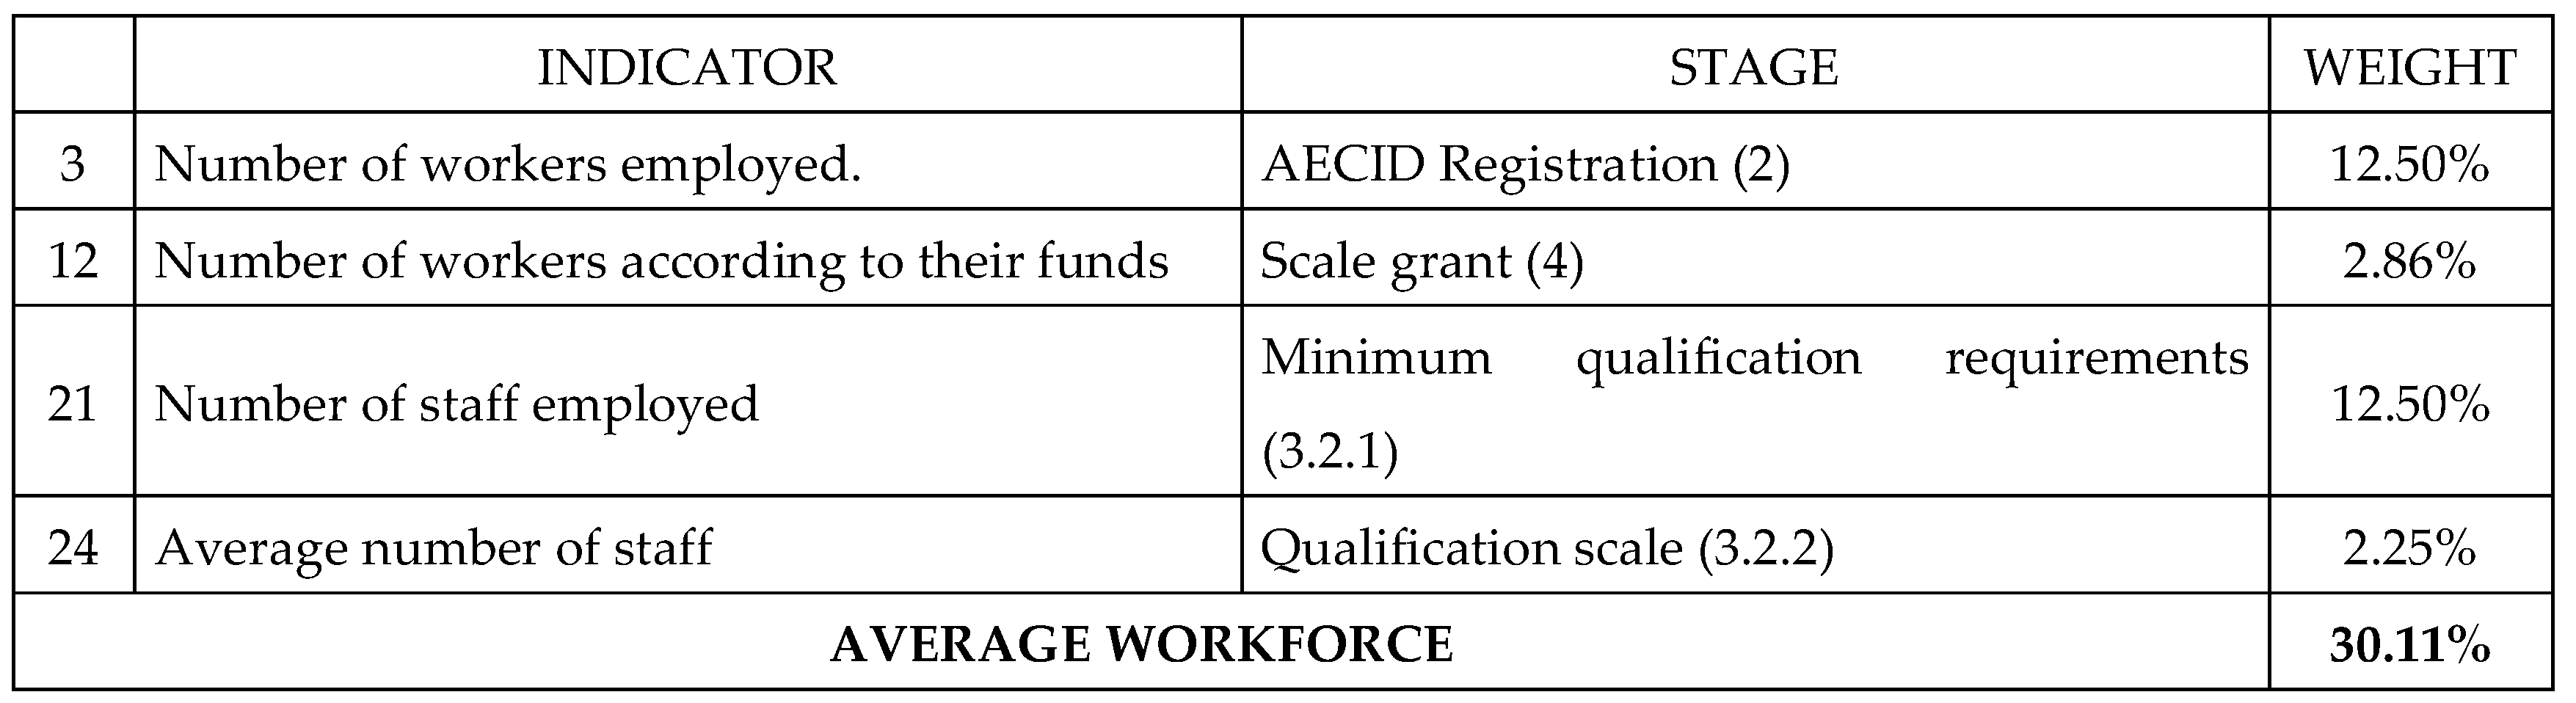
Source: Own elaboration.
Table 6.
Aggregate indicators and standardised weights used by AECID.
| SUMMARY INDICATOR | INDICATORS | TOTAL WEIGHT | STANDARDISED WEIGHT | |
|---|---|---|---|---|
| Experience | Volume of funds managed | 17 y 29 | 14.50% | 5.50% |
| Number of projects implemented | 16 | 12.50% | 5% | |
| Number of countries in which it is present | 31 | 2% | 0.70% | |
| Age of the NGDO | 15 y 30 | 16.50% | 6% | |
| TRANSPARENCY AND PERFORMANCE | Publication of the organisation chart on the website | 1 y 34 | 13.16% | 5% |
| Organisational chart and a document that defines the functions of each department and job position. | 2 | 0.50% | 0.20% | |
| Publication of the strategic planning on the website. | 32 y 34 | 4.71% | 2% | |
| Publication of the annual activity report on the website. | 8, 9, 34 y 36 | 19.41% | 7.50% | |
| Have the annual accounts and audit reports published on the website. | 10, 18, 34, 40 y 42 | 15.27% | 6% | |
| Having the names of the people who make up the board of trustees or the board of directors with a brief biographical sketch or curriculum vitae published on the website. | 11, 33 Y 34 | 2.96% | 1% | |
| The website contains the investment policy. | 34 y 38 | 1.56% | 0.60% | |
| Membership of networks and platforms. | 14 y 37 | 4.96% | 2% | |
| HUMAN RESOURCES | Average workforce | 3,12,21 y 24 | 30.11% | 11.50% |
| Temporary staffing rate | 25 | 2% | 0.70% | |
| Number of volunteers | 4 y 28 | 16.58% | 6.50% | |
| Number of development workers (average ratio of development workers per project). | 5 y 26 | 15.65% | 6% | |
| FINANCIAL RESOURCES | Social base: Number of partners and private donors. | 2, 22 y 27 | 28.00% | 11% |
| Volume of private funds received | 6 y 13 | 13.93% | 5% | |
| Volume of public donations received | 7 y 13 | 13.93% | 5% | |
| Percentage of public funding | 43 | 0.90% | 0.30% | |
| Solvency ratio (Current assets / Current liabilities) | 23 | 6.00% | 2.50% | |
| Evolution of shareholders' equity | 20 y 41 | 12.82% | 5% | |
| Profit or loss | 19 y 39 | 12.81% | 5% | |
| TOTAL WEIGHT | 260.78% | 100 | ||
Source: Own elaboration.
Table 7.
Indicators for the financial and operational capacity criterion of the EU full application form.
Table 7.
Indicators for the financial and operational capacity criterion of the EU full application form.
| Section | Maximun Score |
|---|---|
| 1. Financial and operational capacity | 20 |
| Do the applicants and, if applicable, their affiliated entities have sufficient project management experience? | 5 |
| Do the applicants and, if applicable, their affiliated entities have sufficient technical expertise? (in particular, knowledge of the issues to be addressed)? | 5 |
| Do the applicants and, if applicable, their affiliated entities have sufficient management capacity (in particular staff, equipment and capacity to manage the budget of the action)? | 5 |
| Does the lead applicant have stable and sufficient sources of funding? | 5 |
Source: Assessment table of the completed application form. (European Commission, 2016).
Table 8.
Indicators derived from the EU's financial and operational capacity criterion.
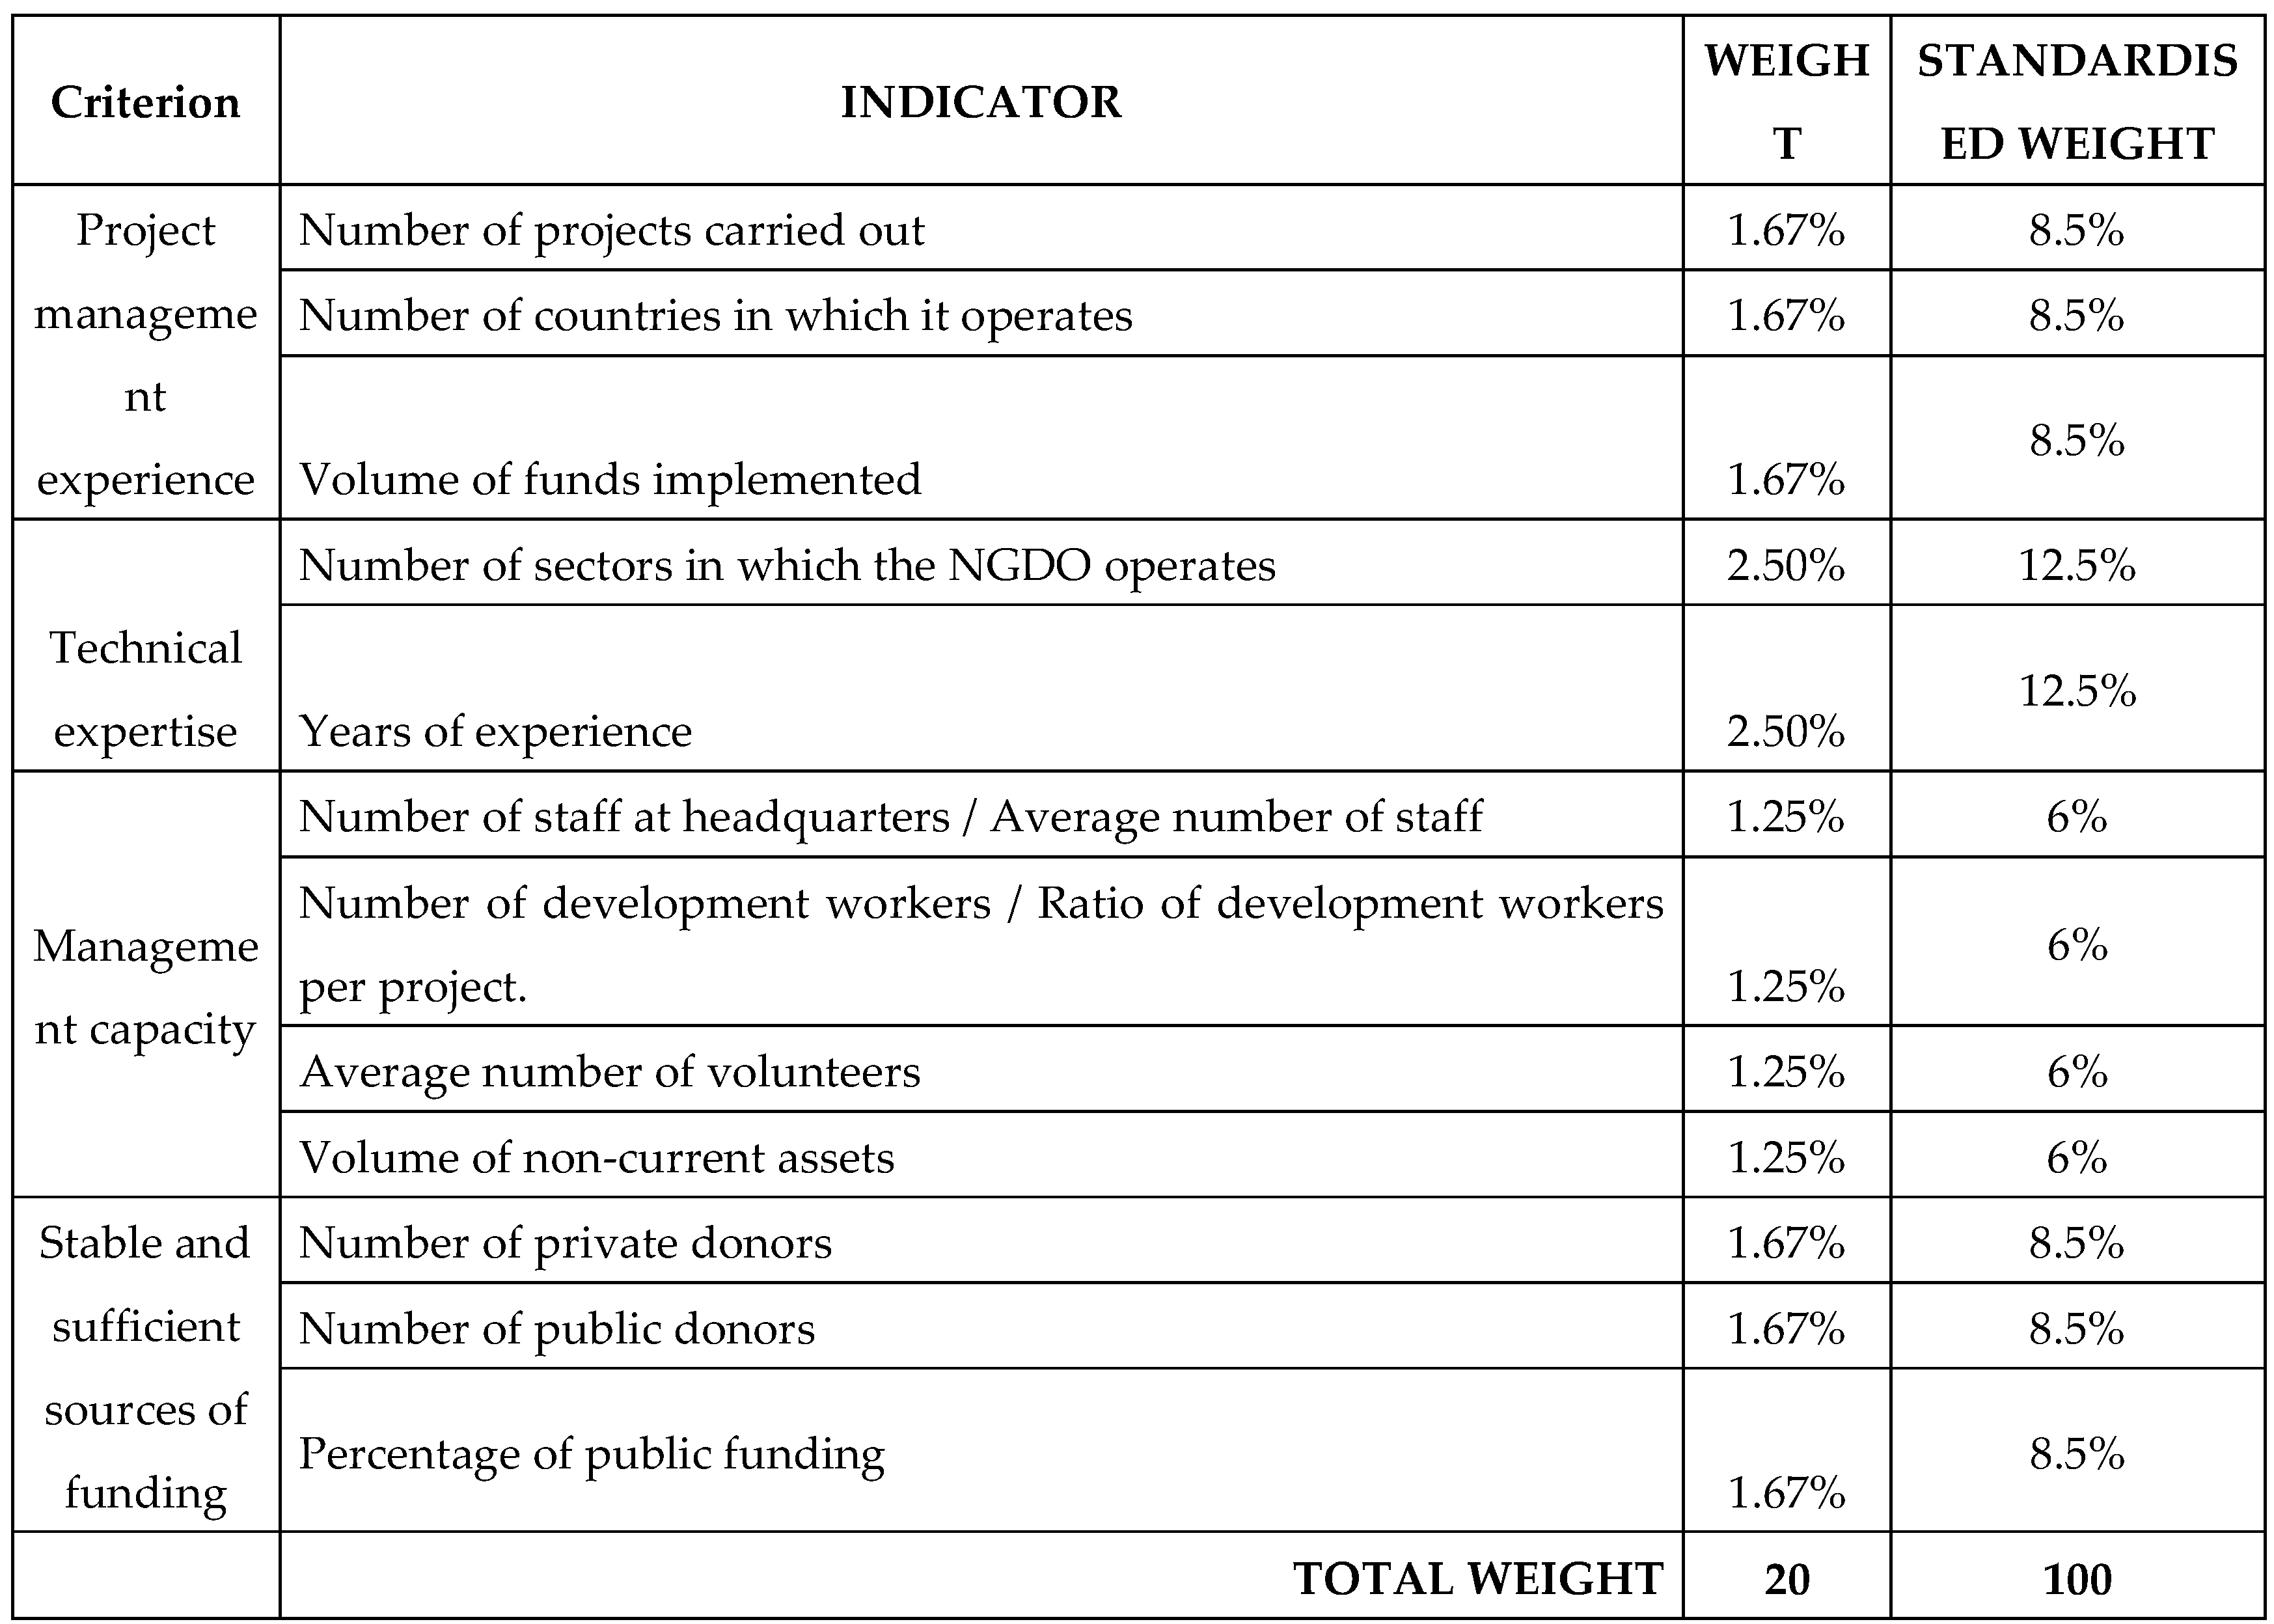
Source: Own elaboration.
Table 9.
USAID Initial Review Assessment Criteria.
| Technical Aspects (65 points) |
| Creative solutions for the priority intervention areas (30%) |
| Coherent implementation plan and likelihood of implementation within the proposed timeframe (13%) |
| Describe any potential risks of the proposed activity to (i) the health and safety of participants and beneficiaries, or to (ii) the environment and local ecosystems; and detail risk mitigation plans (2%) |
| Proposed monitoring and evaluation factors as indicators to measure programme impacts (10%) |
| Strategy for capturing knowledge and sharing lessons learned (10%) |
| Management and institutional capacity (35 points) |
| Human resources (staff, partners and/or consultants) to implement all project components, including technical, administrative, financial and monitoring and evaluation. (25%) |
| Previous performance experience of the applicant in similar project activities (10%) |
Source: USAID (2018).
Table 10.
Indicators derived from the USAID targeting phases.
| PHASE | CRITERION | INDICATORS | WEIGHT | TOTAL WEIGHT |
|---|---|---|---|---|
| 1. To work with USAID | Experience | Age of the NGDO | 33.33% | 100% |
| Human resources | Number of employees | 33.33% | ||
| Financial resources | Income in the last three years | 33.33% | ||
| 2. As required by the call for proposals | Experience | Number of countries in which it operates | 50.00% | 100% |
| Number of projects carried out | 50.00% | |||
| 3. Initial review | Experience | Age of the NGDO | 5.00% | 35% |
| Number of projects carried out | 5.00% | |||
| Human resources | Number of employees in the last year | 25.00% |
Source: Own elaboration.
Table 11.
USAID eligibility criteria, indicators and weights.
| PHASE | CRITERION | INDICATORS | WEIGHT | TOTAL WEIGHT |
|---|---|---|---|---|
| 1. To work with USAID | Experience | Age of the ONGD | 33.33% | 100% |
| Human resources | Number of employees | 33.33% | ||
| Financial resources | Revenues in the last three years | 33.33% | ||
| 2. As required by the call for proposals | Experience | Number of countries in which it operates | 50.00% | 100% |
| Number of projects carried out | 50.00% | |||
| 3. Initial review | Experience | Age of the ONGD | 5.00% | 35% |
| Number of projects carried out | 5.00% | |||
| Human resources | Number of employees in the last year | 25.00% | ||
| 4. NUPAS | 1.3 Organisational structure |
The organisation chart of the organisation can be found on its website | 1.67% | 26.42% |
| The organisation chart shows the lines of authority, responsibility and communication. | 1.67% | |||
| 1.4 Governance | Disclosure of data and transparency | 3.33% | ||
| 1.5 Internal Control |
The statutes are available on the organisation's website | 1.67% | ||
| The statutes contain the functions of the board, a term limit for board members and a system for the renewal of board members. | 1.67% | |||
| 2.9 Financial resource management2.12 Audit and review of financial statements | Annual accounts and audit reports are published on the website. |
2.60% | ||
| 2.10 Sources of funding |
Number of public donors |
0.64% | ||
| Number of private donors |
0.64% | |||
| 4.1 Human resources policy | The organisation chart of the organisation is published on the website. | 2.10% | ||
| The organisation chart shows the functions of each department and employee. | 2.10% | |||
| 6.1 Treasury management | Solvency ratio | 8.33% |
Source: Own elaboration.
Table 12.
Comparison of AECID, Europe-Aid and USAID Eligibility Indicators.
| INDICATOR | AECID WEIGHT |
Europe-Aid WEIGHT |
USAID WEIGHT |
|---|---|---|---|
| Volume of funds managed | 5.5% | 8.5% | N.A. |
| No. of projects implemented | 5% | 8.5% | 21% |
| Number of countries in which it is present | 0.7% | 8.5% | 19% |
| Number of sectors in which the NGDO is active | N.A. | 12.5% | N.A. |
| Age of the NGDO | 6% | 12.5% | 14.5% |
| Publication of the organisation chart on the website. | 5% | N.A. | 2% |
| The organisation chart delimits the functions of each department and job position. | 0.2% | N.A. | 2% |
| Publication of the annual report of activities on the website. | 7.5% | N.A. | |
| The annual accounts and audit reports are published on the website. | 6% | N.A. | 1% |
| The names of the people who make up the board of trustees or the board of directors with a brief biographical sketch or curriculum vitae are published on the website. | 1% | N.A. | N.A. |
| The statutes are published on the organisation's website. | N.A. | N.A. | 1% |
| The statutes contain the functions of the board, a term limit for board members and a procedure for their appointment and dismissal. Membership of networks and platforms. |
N.A. | N.A. | 1% |
| Membership of networks and platforms. | 2% | N.A. | N.A. |
| Number of employees /average workforce | 11.5% | 6% | 22% |
| Temporariness rate | 0.7% | N.A. | N.A. |
| Number of volunteers | 6.5% | 6% | N.A. |
| Number of development workers / Average ratio of development workers per project | 6% | 6% | N.A. |
| Publicity on the website of the Strategic Planning. | 2% | N.A. | N.A. |
| The website includes the investment policy. | 0.6% | N.A. | N.A. |
| Social base: Number of partners and private donors. | 11% | 8.5% | 0.25% |
| Number of public donors | 8.5% | 0.25% | |
| Volume of private funds received | 5% | N.A. | N.A. |
| Volume of public donations received | 5% | N.A. | N.A. |
| Percentage of public funding | 0.3% | 8.5% | N.A. |
| Solvency ratio (Current assets / Current liabilities) | 2.5% | N.A. | 3% |
| Development of shareholders' equity | 5% | N.A. | N.A. |
| Volume of non-current assets | N.A. | 6% | N.A. |
| Income in the last three years | N.A. | N.A. | 13% |
| Profit or loss. | 5% | N.A. | N.A. |
| 100% | 100% | 100% |
Source: Own elaboration.
Table 13.
Criteria, indicators, and eligibility weights for public donors.
| SUMMARY INDICATOR | Max/min | AECID WEIGHT | Europe-Aid WEIGHT | USAID WEIGHT | TOTAL WEIGHT | Normalised Weight | |||
|---|---|---|---|---|---|---|---|---|---|
| Experience | No. of projects implemented | Max. | 5.0% | 8.5% | 21.0% | 35% | 13.0% | ||
| Age of the NGDO | 6.0% | 12.5% | 14.5% | 33% | 12.0% | ||||
| Volume of funds managed | 5.5% | 8.0% | N.A. | 14% | 5.0% | ||||
| Number of countries in which it is present | 0.7% | 8.5% | 19.0% | 28% | 10.0% | ||||
| Human Resources | Number of employees/average staff | Max. | 11.5% | 6.0% | 22.0% | 40% | 14.5% | ||
| Number of volunteers | 6.5% | 6.0% | N.A. | 13% | 5.0% | ||||
| Number of development workers/ Average ratio of development workers per project | 6.0% | 6.0% | N.A. | 12% | 4.0% | ||||
| Temporary staff ratio | 0.7% | N.A. | N.A. | 1% | 0.3% | ||||
| Financial Resoruces | Social base: Number of partners and private donors. | Max. | 11.0% | 8.5% | 0.25% | 20% | 7.0% | ||
| Number of public donors | Max. | N.A. | 8.5% | 0.25% | 9% | 3.0% | |||
| Volume of private funds received | Max. | 5.0% | N.A. | 13.0% | 11.5% | 4.0% | |||
| Volume of public donations received | Max. | 5.0% | N.A. | 11.5% | 4.0% | ||||
| Percentage of public funding | Min. | 0.30% | 8.5% | 9% | 3.0% | ||||
| Solvency ratio (Current assets / Current liabilities) | Max. | 2.5% | N.A. | 3.0% | 6% | 2.0% | |||
| Development of own funds | Max. | 5.0% | N.A. | N.A. | 5% | 2.0% | |||
| Transparency and Internal Functioning | Details of members of governing bodies | To have on the website the names of the people who make up the Board of Trustees or the Board of Directors with a brief biographical sketch or curriculum vitae. | Max. | 1.0% | N.A. | N.A. | 1% | 0.4% | |
| Statutes | The statutes are available on the website of the organisation. | N.A. | N.A. | 1.0% | 1% | 0.4% | |||
| The statutes include the functions of the board, a term limit for its members and a procedure for their appointment and dismissal. | N.A. | N.A. | 1.0% | 1% | 0,4% | ||||
| Organisation chart | The organisation chart is available on the website | 5.0% | N.A. | 2.0% | 7% | 2.5% | |||
| The organisation chart delimits the functions of each department and job. | 0.20% | N.A. | 2.0% | 2% | 1.0% | ||||
| Strategic planning | Strategic planning is published on the website | 2.0% | N.A. | N.A. | 2% | 1.0% | |||
| Annual report of activities | Publication of the annual activity report on the website | 7.5% | N.A. | N.A. | 8% | 3.0% | |||
| Annual accounts and audit reports | The annual accounts and audit reports are published on the website. | 6.0% | N.A. | 1.0% | 7% | 2.5% | |||
| TOTAL WEIGHTS ASSUMED | 92.4% | 81.0% | 100% | 273.4% | 100% | ||||
| Indicators not considered: | N.A. | N.A. | N.A. | ||||||
| Membership of networks and platforms | 2.0% | N.A. | N.A. | ||||||
| Number of sectors in which the NGDO operates. | N.A. | 12.5% | N.A. | ||||||
| The website contains the investment policy | 0.60% | N.A. | N.A. | ||||||
| Volume of non-current assets | N.A. | 6.0% | N.A. | ||||||
| Profit or loss. | 5.0% | N.A. | N.A. | ||||||
| WEIGHTS INDICATORS DISCARDED | 7.60% | 18,50% | 0,00% | ||||||
| TOTAL | 100% | 100% | 100% | ||||||
Source: Own elaboration.
Table 14.
Net flows of inputs and outputs.
| NGDO | Input virtual (X) | Output virtual (Y) | Effectives | Efficients | Frugals | Inefficients |
|---|---|---|---|---|---|---|
| inputs + outputs + | inputs - outputs + | inputs - outputs - | inputs + outputs - | |||
| AV | 0,4095 | 0,0382 | YES | |||
| ANC | 0,3442 | 0,1354 | YES | |||
| CERAI | 0,0086 | 0,0044 | YES | |||
| CIDEAL | 0,0544 | 0,0651 | YES | |||
| JCONGD | 0,2182 | 0,1554 | YES | |||
| PROYDE | 0,1066 | 0,3573 | YES | |||
| SED | 0,022 | 0,2273 | YES | |||
| ACF-E | -0,7159 | 0,2991 | YES | |||
| ALBOAN | -0,3279 | 0,3587 | YES | |||
| ACPP | -0,2406 | 0,3075 | YES | |||
| EP/HE | -0,143 | 0,0712 | YES | |||
| AeA | -0,5735 | 0,4165 | YES | |||
| Caritas Española | -0,355 | 0,6684 | YES | |||
| CESAL | -0,2384 | 0,3481 | YES | |||
| CODESPA | -0,1606 | 0,2432 | YES | |||
| C.R.E. | -0,7549 | 0,625 | YES | |||
| Educo | -0,415 | 0,3104 | YES | |||
| FM | -0,3557 | 0,1264 | YES | |||
| ANESVAD | -0,1943 | 0,4966 | YES | |||
| EC | -0,4578 | 0,3609 | YES | |||
| InteRed | -0,2624 | 0,0754 | YES | |||
| JYD | -0,0233 | 0,2878 | YES | |||
| Manos Unidas | -0,6079 | 0,6531 | YES | |||
| MdM | -0,5899 | 0,2372 | YES | |||
| FAMME | -0,5416 | 0,5424 | YES | |||
| MPDL | -0,3521 | 0,3004 | YES | |||
| Mundubat | -0,1355 | 0,0701 | YES | |||
| Oxfam Intermón | -0,882 | 0,6327 | YES | |||
| SC | -0,6777 | 0,3603 | YES | |||
| ADRA | -0,1991 | -0,1411 | YES | |||
| APS | -0,4853 | -0,0641 | YES | |||
| AdTE | -0,0545 | -0,119 | YES | |||
| ASF | -0,1696 | -0,2238 | YES | |||
| Tdh E | -0,0393 | -0,2148 | YES | |||
| H+D | -0,0917 | -0,0191 | YES | |||
| MZC | -0,1097 | -0,1116 | YES | |||
| ONGAWA | -0,2461 | -0,071 | YES | |||
| PcD | -0,0174 | -0,1095 | YES | |||
| Plan Internacional | -0,5075 | -0,0716 | YES | |||
| SETEM | -0,3336 | -0,1425 | YES | |||
| VSF | -0,1131 | -0,0391 | YES | |||
| AIDA | 0,2014 | -0,0432 | YES | |||
| AIETI | 0,2233 | -0,0669 | YES | |||
| AMREF | 0,3131 | -0,1551 | YES | |||
| FONTILLES | 0,0419 | -0,0229 | YES | |||
| CGJP | 0,6827 | -0,1343 | YES | |||
| COOPERACCIO | 0,2602 | -0,1363 | YES | |||
| CI ONG | 0,0182 | -0,1793 | YES | |||
| Esf | 0,0654 | -0,4028 | YES | |||
| EDIFICANDO CN | 0,6391 | -0,1452 | YES | |||
| FAD | 0,311 | -0,2141 | YES | |||
| F.S.F.E. | 0,3886 | -0,0383 | YES | |||
| FERE-CECA | 0,3224 | -0,1347 | YES | |||
| FISC | 0,1483 | -0,4785 | YES | |||
| Fundación Adsis | 0,2722 | -0,149 | YES | |||
| FEA | 0,4434 | -0,4297 | YES | |||
| FRS | 0,3022 | -0,3876 | YES | |||
| FDV | 0,3992 | -0,1798 | ||||
| FIE CIPIE | 0,4898 | -0,1718 | YES | |||
| Madreselva | 0,3852 | -0,256 | YES | |||
| Mainel | 0,3572 | -0,2376 | YES | |||
| FUDEN | 0,2768 | -0,1634 | YES | |||
| F1M | 0,358 | -0,5621 | YES | |||
| PROCLADE | 0,1331 | -0,0536 | YES | |||
| Promoción Social | 0,2568 | -0,0399 | YES | |||
| IA | 0,3279 | -0,5557 | YES | |||
| ISCOD | 0,2179 | -0,2432 | YES | |||
| FMDLP | 0,2931 | -0,1467 | YES | |||
| O.C.A.S.H.A. | 0,4616 | -0,0606 | YES | |||
| PROSALUS | 0,164 | -0,1421 | YES | |||
| PS | 0,2603 | -0,3319 | YES | |||
| PPHH | 0,6182 | -0,4967 | YES | |||
| Rescate | 0,0663 | -0,1403 | YES | |||
| SOTERMUN | 0,5095 | -0,5484 | YES | |||
| Total | 7 | 22 | 12 | 33 |
Source: Own Elaboration form Visual PROMETHEE 1.4 Academic Edition.
Disclaimer/Publisher’s Note: The statements, opinions and data contained in all publications are solely those of the individual author(s) and contributor(s) and not of MDPI and/or the editor(s). MDPI and/or the editor(s) disclaim responsibility for any injury to people or property resulting from any ideas, methods, instructions or products referred to in the content. |
© 2024 by the authors. Licensee MDPI, Basel, Switzerland. This article is an open access article distributed under the terms and conditions of the Creative Commons Attribution (CC BY) license (http://creativecommons.org/licenses/by/4.0/).
Copyright: This open access article is published under a Creative Commons CC BY 4.0 license, which permit the free download, distribution, and reuse, provided that the author and preprint are cited in any reuse.


