

Submitted:
18 July 2024
Posted:
19 July 2024
You are already at the latest version
Abstract
Leptospirosis is a zoonosis with global public health impact, particularly in poor socio-economic settings of tropical regions. Transmitted through urine-contaminated water or soil from rodents, dogs, and livestock, leptospirosis causes over a million clinical cases annually. Risk factors include outdoor activities, livestock production, and substandard housing that foster high densities of animal reservoirs. This One Health study in southern Chile examined Leptospira serological evi-dence of exposure people from urban slums, semi-rural, and farm settings, using the Extreme Gradient Boosting algorithm to identify key influencing factors. In urban slums, age, shrub terrain, distance to Leptospira-positive households, and neighborhood housing density were contributing factors. Human exposure in semi-rural communities was linked to environmental factors (tree, shrub, and lower vegetation terrain) and animal variables (Leptospira-positive dogs and rodents, and proximity to Leptospira-positive households). On farms, dog counts, animal Leptospira preva-lence, and proximity to Leptospira-contaminated water samples were significant drivers. The study underscores that disease dynamics vary across landscapes, with distinct drivers in each community setting. This case study demonstrates how the integration of machine learning with comprehensive cross-sectional epidemiological and geospatial data provides valuable insights into leptospirosis eco-epidemiology. These insights are crucial for informing targeted public health strategies and for generating hypotheses for future research.
Keywords:
Leptospirosis
; Communities
; One Health
; Extreme Gradient Boosting
; Eco-epidemiology
1. Introduction
Leptospirosis, a zoonotic disease of global distribution caused by the pathogenic bacterial species Leptospira, poses a significant health risk to both humans and animals [1]. In humans, leptospirosis can cause asymptomatic infection, flu-like illness or sometimes jaundice, kidney failure, meningitis, or even death [2]. Globally, it has been estimated that leptospirosis causes around a million clinical cases and 58000 deaths each year but, due to poor diagnosis and reporting, the actual burden is unknown [3]. The transmission of Leptospira is a multifaceted process that includes a diverse range of hosts and reservoirs and operates through both direct and indirect pathways. Humans may acquire infections either through direct contact with infected animals, both wildlife and domestic animals, or indirectly through exposure to contaminated environments (soil, water) [4]. It is considered an occupational hazard related to activities such as agriculture, sewage management, and animal husbandry [5], as well as an infection associated with routine domestic or recreational activities that put individuals in contact with a Leptospira-contaminated environment. Rodents (rats, mice) serve as primary synanthropic reservoirs, although other wildlife species such as raccoons, skunks, opossums, foxes, and deer can also become infected [6]. Dogs transmit the pathogen to humans through either direct contact or urine-infected materials or environment [7]. Domesticated farm animals like cattle and sheep can also act as a carrier of Leptospira and people can become infected by direct contact with blood, aborted fetuses, vaginal discharge, or calving products from infected animals as well as indirectly through the urine-contaminated farm environment [8]. Human-to-human infection is also possible via breast milk or sexual contact but is very rare [9,10]. More importantly, people can become infected when exposed to water and soil that is contaminated with Leptospira [11]. Communities with low socio-economic conditions are vulnerable to exposure given the inadequate sanitation and lack of safe drinking water [12]. Tropical climate areas where there is frequent flooding caused by high rainfall and natural disasters often result in high risk of Leptospira infection [13,14]. Moreover, humidity and warm temperatures in tropical areas cause the pathogen to persist longer in the environment, specifically in soil, which in turn, increases the likelihood of exposure [15]. The multifaceted nature of leptospirosis is driven by a variety of factors, encompassing ecological, animal, and anthropogenic elements. Geographical differences further contribute to the dynamic nature of the transmission, indicating that the intricate web of factors influencing the disease may differ significantly from one community to another. Understanding the interactions among these elements is crucial for developing targeted and effective strategies to mitigate the impact of leptospirosis in different regions. However, the existing literature is scarce about how leptospirosis can be present in different community settings and their unique relationships between the various transmission drivers.
The growing body of research on leptospirosis prevalence highlights the lack of a comprehensive investigation framework. While numerous studies have explored the prevalence of leptospirosis within different populations, a noticeable limitation arises from the absence of simultaneous consideration of human, animal, and environmental factors. The One Health approach advocates for an integrated and interdisciplinary perspective that acknowledges the interconnectedness of human, animal, and environmental health. Utilizing the principles of One Health in leptospirosis research facilitates a more holistic understanding of disease dynamics and transmission pathways. By scrutinizing the complex interactions among humans, animals, and their shared environment through adopting a One Health framework, researchers can gain insight into the intricate epidemiology of leptospirosis and devise more efficacious prevention and control measures.
Thus, the data presented herein constitute a case study integrating leptospirosis data from rodents, dogs, and the environment (all previously published), along with new livestock and human seroprevalence data from an eco-epidemiological study conducted in Chile [11,16,17]. The Los Rios region in south-central Chile, a predominantly agricultural and farming area juxtaposed with scattered urban settlements, has been a location of several leptospirosis studies [18]. A previous serosurvey targeting individuals with occupational hazards revealed a seroprevalence of around 22%, underscoring the need to elucidate disease dynamics and effective control measures [19]. Additionally, a survey conducted in dogs in the area reported a leptospirosis seroprevalence of 25%, with variations across different community types, highlighting the interconnectedness of human-influenced environments and animal health [20]. Rodents in the region were shown to have kidney carriage of around 20%, further emphasizing the multifaceted nature of leptospirosis transmission pathways in the Chilean site [21].
Using a One Health framework, the objective of this study was to identify the intricate relationships between human Leptospira exposure and different drivers, including household characteristics, animal reservoirs, environmental conditions, and water sources, in three distinct community settings in the Los Rios region of Chile: urban slums, semi-rural and farm communities. We hypothesized that the drivers of human Leptospira exposure would be different in those three communities given different environmental settings and compositions of animal reservoirs. Specifically, we expected that rodent-related variables and household conditions would drive human Leptospira exposure in urban slum communities, while the exposure in semi-rural areas will be impacted by environmental conditions and household variables. In farm communities, we expected that livestock and wildlife-related variables would play an important role in driving human Leptospira exposure.
2. Materials and Methods
2.1. Study Area
The study design and data come from a study on the eco-epidemiology of leptospirosis conducted in the Los Rios region in south-central Chile (Latitude: 39°15′S - 40°33′S, Longitude: 73°43′W-71°35′W) [11,16]. The climate is the region characterized as temperate rainforest with annual cumulative rainfall if 2588 mm and ranges from 1200 mm in the central valley up to 5000 mm in the Andes Mountain. Average temperature has less variation throughout the year, with 17°C in summer and 8°C in winter [16,21]. Communities were selected to represent three community types (i) urban slums: informal settlements in the outskirts of a major city characterized by substandard housing, (ii) semi-rural: rural community settlements away from major cities where households are clustered together and (iii) farm: dispersed households, typically small family farms, located in a specific rural locality. Communities were chosen from areas that have the highest number of settlements in the region, specifically the central valley and the vicinity of the region’s capital. Most of the communities were located within the elevation of 0-100 m above sea level, except for two households in farm communities which were at 100-200 m elevation above sea level [3,21]. Individual households within each community were selected randomly and enrolled based on willingness to participate in all components of the study, which included rodent trapping, sampling of domestic animals, sampling of surface water sources in the peri-domestic environment, and sampling of household members.
2.2. Data Collection
The data collection for the eco-epidemiology study was conducted between August 2010 and March 2012 and involved 422 households from 12 communities, 4 of each community type. A questionnaire survey was carried out to obtain information on socio-demographic characteristics, housing conditions, presence of animals, and to characterize each sample.
Leptospirosis status in people and domestic animals- Data available included Leptospira exposure status of 907 people. Household members 13 years old and older who consented to participate provided a one-time serum sample to measure Leptospira-specific antibodies. Dogs and livestock present at the residence were also sampled to obtain serum for Leptospira antibody testing.
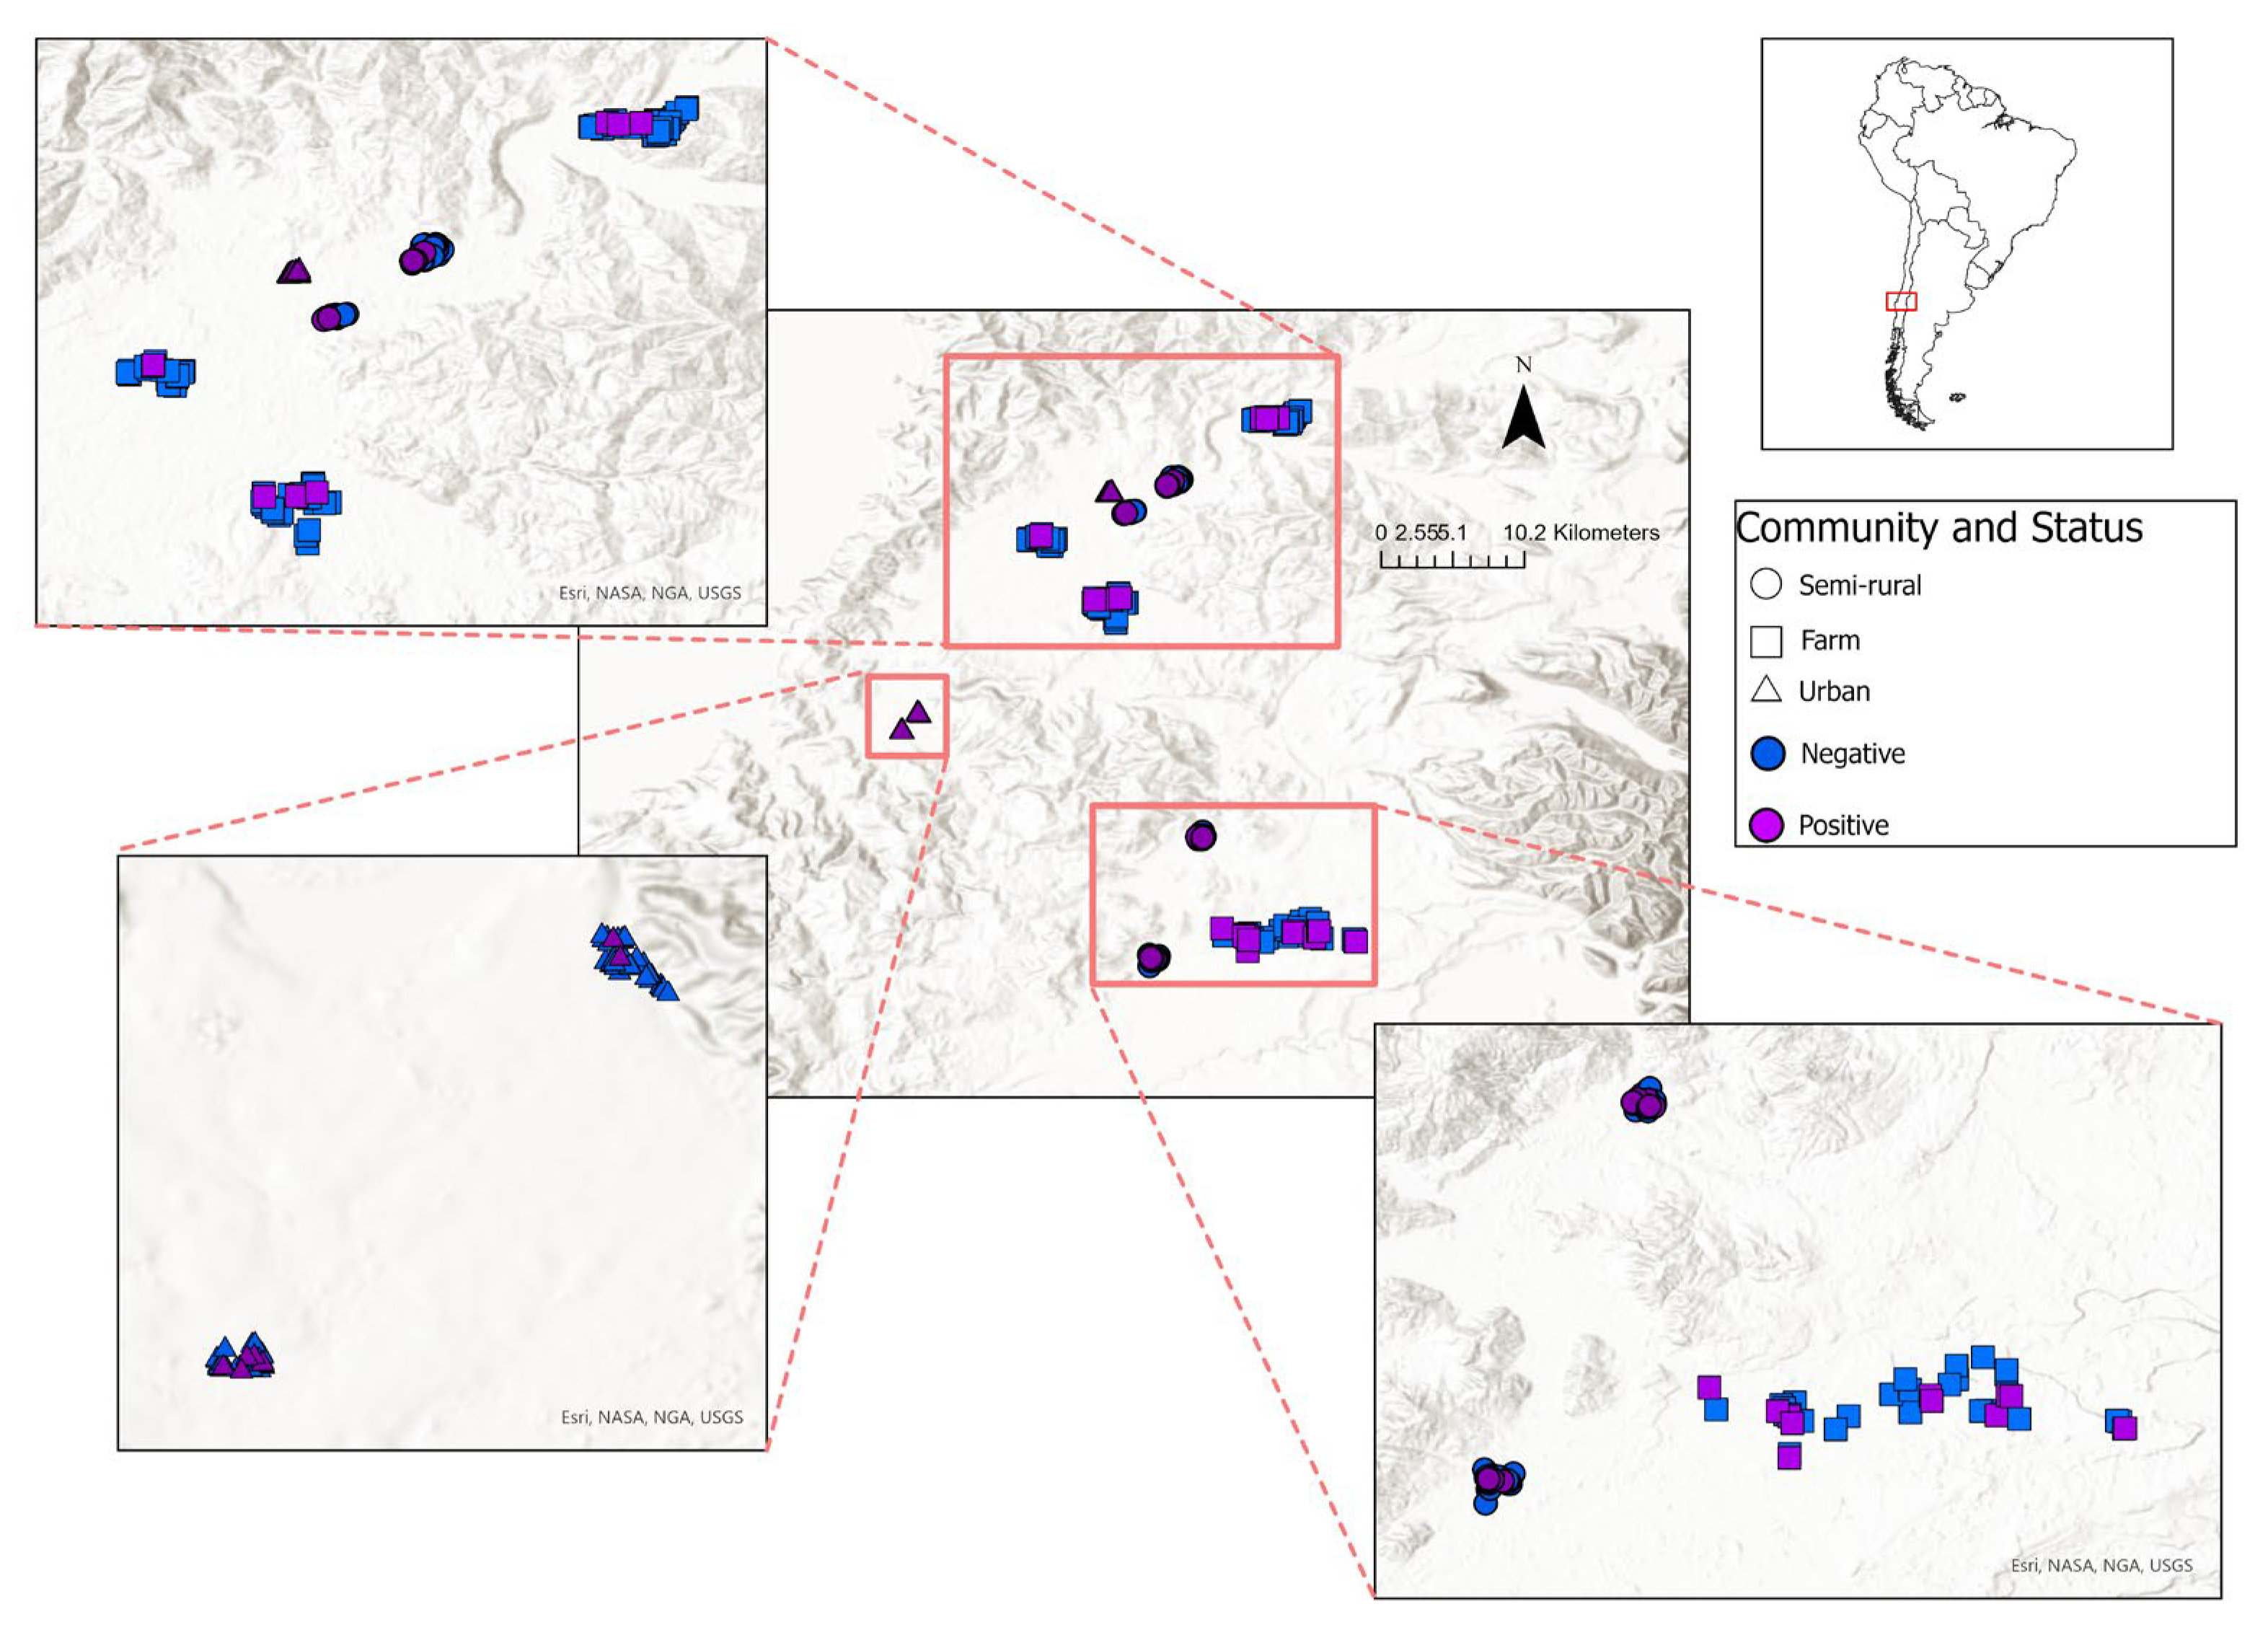
Figure 1.
Study area and distribution of leptospirosis seropositive (purple) and seronegative (blue) participants across the various community types indicated by shape (semi-rural: circle, farm: square, urban slums: triangle).
Figure 1.
Study area and distribution of leptospirosis seropositive (purple) and seronegative (blue) participants across the various community types indicated by shape (semi-rural: circle, farm: square, urban slums: triangle).
The microscopic agglutination test (MAT) with a panel of 20 serovars, representing 17 serogroups was run on serum samples at Austral University, Chile (L. interrogans serovars Australis, Bratislava, Autumnalis, Bataviae, Canicola, Djasiman, Grippotyphosa, Icterohaemorrhagiae, Mankarso, Pomona, Pyrogenes, and Wolffi, L. borgpetersenii serovars Ballum, Javanica, and Tarassovi, L. kirschneri serovar Cynopteri, L. santarosai serovars Borincana, Alexi, and Georgia, and L. weilii serovar Celledoni) as described previously [20]. Titers of 1:100 or higher were considered positive to classify each individual (people and animals) as seropositive or seronegative for Leptospira. We calculated the cumulative number of seropositive animals for cattle (bov_com_pos), sheep (ovi_com_pos), dogs (dog_com_pos) and all animals (animal_pos_com) in each community.
Leptospirosis status in rodents- Trapped rodents were euthanized and kidneys were tested for presence of Leptospira DNA using Polymerase Chain Reaction (PCR) as previously described [16]. Test results were used to create a variable representing the number of households within 100-meter with positive rodents weighted inversely by the distance from the house (distance_pos_rod).
Leptospira contamination in the peridomestic environment- Surface water samples were collected from various sources and locations in the household environment and tested for the presence of pathogenic Leptospira DNA using PCR as previously described [16]. Results were then used to calculate variables that represent the proportion of positive puddle samples in the community (puddle_pos), the proportion of positive samples considering all water source types (puddles, rivers, wells, ponds, etc.) in the community (water_prev_com), and the number of households within 100-meter with positive water samples weighted inversely by distance from the house (distance_pos_water).
Participant characteristics- A questionnaire was used to collect individual socio-demographic characteristics (age, sex) and behaviors that could exposure people to Leptospira such as gardening (garden), swimming (swim), cleaning animal barns (clean_barn), cleaning sewers (clean_drain), water drainage (clean_water_drain), slaughter animals (slaughter), milking (milking), and/or cleaning after animal birth (clean_birth).
Household animal characteristics- Rodent presence was obtained based on trapping efforts as the number of rodents trapped at the household (rodent_count) and the total for each community (rodent_count_comm), as previously described [16]. A questionnaire was used to collect data on reported presence of rodents (e.g., observing rodents, seeing rodent droppings, seeing, or smelling rodent urine, whether gnawed boxes, food, or wood, holes in the walls were found, or hearing rodent noises) [16], as well as domestic animal-related variables such as the total number of cattle, sheep, and dogs in the household.
Spatial and environmental variables- Geospatial variables from multiple sources were used to describe the environmental settings of each community. Details on how variables were generated have been described previously [16,21]. Variables used for this analysis included the number of houses within a 100-meter radius (house) and the number of buildings within a 100-meter radius (buildings). Land cover was defined as the dominated terrain within the surrounding radius and categorized as tree canopy (tree), lower vegetation (lowveg), shrub (shrub), or barren space (field). Bioclimatic variables used in this study to represent the climatic conditions of the study area (bio1, bio2, bio12, bio15) were collected from WorldClim (worldclim.org) [22].
All human participants provided written consent to participate in this study, including the disclosure of their domestic and livestock information. The study protocol was approved by the University of Minnesota’s Institutional Review Board (No. 0903 M62042) and Institutional Animal Care and Use Committee (No. 0904A63201) and the Austral University’s Human and Animal Ethics Committee (No. 01/09). More details about data collection can be found in [11,16,20,21]. See Table 1 for further information on data descriptions and sources.
2.3. Extreme Gradient Boosting Model
XGBoost is a high-performing gradient classification and regression boosting machine learning algorithm that is widely used in disease prediction, identifying medical conditions, image classification and object detection [23,24,25]. This algorithm uses split techniques, which select the features that best separate the data into two groups. This method is well suited for our analysis because it identifies complex and non-linear relationships among the drivers and Leptospira exposure and adjusts the collinearity between the drivers [26]. It also minimizes overfitting and achieves high predictive accuracy through regularization techniques such as pruning and shrinkage, and by ensemble learning with decision trees [23].
We run separate XGBoost models for the three different community types. For each model fitting, we randomly split the observations into training and testing sets under the ratio of 80% and 20%. The training dataset was used to run the models and identify the drivers, while the testing dataset was used to estimate the accuracy of the model.
The performance of the XGBoost can be sensitive to their hyperparameters [27]. After splitting, we tuned a variety of hyperparameters to optimize the performance of the model. A matrix of hyperparameters was provided by using the expand.grid function to find the best combination of the hyperparameters [28]. Specifically, the maximum tree depth, learning rate, and gamma were adjusted here, given that these variables generally exhibit the most significant impact on model performance [29]. Furthermore, we accounted for unbalanced classes, which refers to an imbalance between the number of positive and negative cases, by adjusting the model parameter ‘scale_pos_weight’ [30]. This is estimated as the total number of negative cases divided by the total number of positive cases (See Table 2 for detailed information about the parameterization). The final XGBoost classification model was fitted using those tuned hyperparameters. To account for stochasticity in random split of training and testing set in model development, we performed 2000 iterations of our data splits and perform the final splitting processes for them. This allowed us to use an ensemble modeling approach that incorporated information and uncertainties from multiple random split scenarios and create confidence intervals for evaluating the model and determining the importance of the drivers.
We also generated the variable importance (‘gain score’- represents how much a variable contributes to enhancing the model’s predictions) on for every model iteration and took the average to show the most important drivers of leptospirosis in three community types and the partial dependency plots to show the relationship between potential drivers and Leptospira exposure. To evaluate the performance of the final model, we used the area under the receiver operating characteristics curve (AUC) value, which assesses how well the model can distinguish positive and negative cases [31]. The XGBoost model development and the associated analyses were performed using the “XGBoost” package in R version 4.3.1 [32,33].
3. Results
3.1. Seroprevalence of Leptospirosis
Evidence of Leptospira exposure was evident in all community types with an overall seroprevalence in people of 6.0%. Seroprevalence was also 6.0% for each community type, while ranging by community from 3.7% to 10.3%. Leptospira occurrence was high with 20.4% of rodent kidney carriers and 13.5% of water samples classified as PCR positive. Among dogs owned by household members, 26.8% were seropositive with a marked increase in urban dogs (45.1%) compared with rural dogs (22.3%). Sheep and cattle were the main livestock in the area with overall seroprevalences of 16.5% and 31.2%, respectively (Figure 2).
Overall, our study revealed varying seroprevalence in people across different demographic and behavioral categories. Males exhibited a higher seroprevalence (6.5%) than females (5.6%), while individuals engaging in swimming activities showed a higher seroprevalence (6.8%) compared to non-swimmers (4.0%). People living in households harboring positive rodents and dogs had greater seroprevalences (7.1% and 7.8%, respectively) than those without such animals (5.0% and 5.6%, respectively). Additionally, gardening and barn cleaning activities were associated with increased seroprevalence (6.7% and 6.8%, respectively) compared to individuals who did not perform these tasks (4.1% and 5.4%, respectively missing % for those). People who reported activities involving slaughtering and milking animals displayed higher seroprevalence (7.3% and 8.3%, respectively) than those who did not (5.7% and 5.8%, respectively % for those) (Table A1). Notably, the lowest seroprevalence was observed among participants involved in sewage drain cleaning activities (2.3%).
3.2. Urban Slum Community
The final XGBoost model for urban slum communities that was used to predict the seropositive and seronegative participants for the testing data performs well with an average AUC value of 95.09% (range: 87.08%-98.36%). The most important drivers in urban slum communities were the square meters of shrub terrain in 100-meter radius (shrub) followed by age, and the number of houses in a 100-meter radius (houses) (Figure 3A).
The probability of Leptospira exposure, in general, increases as the areas of shrub terrain within 100-meter radius increase (Figure 4). Males have higher probability of getting exposed to Leptospira than females.
The probability of exposure is positively correlated with the number of houses in a 100-meter radius. Additionally, model results revealed that environmental drivers such as areas of wetlands (wetland), tree terrain (tree), and low vegetation (lowveg) in a 100-meter radius can positively impact Leptospira exposure. The local ecology of Leptospira was reflected in the relationship between probability of human exposure and the number of households within 100-meter with positive water samples (distance_water_pos) and the number of households within 100-meter with positive rodents (distance_pos_rod) (Figure 4).
3.3. Semi-Rural Community
The AUC value from model performance for the model of semi-rural communities was 88.27% (range:82.63-90.04). The most important drivers of Leptospira exposure in semi-rural communities were age, slope of the terrain (FlowAcc), and tree and field areas (Figure 3B). The probability of Leptospira exposure was higher among the youngest and the oldest people, in particular those older than 60 years old (Figure 5). The probability of exposure increased when the slope of the terrain increased. There was a higher exposure probability when there was high tree coverage, while this effect was oppositive for field area coverage.
Although with a relatively low importance score, several animal-related drivers emerged in the model (Figure 3B). Household seroprevalence of Leptospira in animals (AnimHHPrev), trapped rodent count (rodent_count), and household seroprevalence of Leptospira in dogs (DogHHPrev) were positively associated with exposure probability, while species diversity (spdiv) was negatively associated. Exposure probability generally increased as the number of households within 100-meter with positive rodents (distance_pos_rod) increased. (Figure 5).
3.4. Farm Community
The XGBoost model showed high prediction of seropositive and seronegative individuals with an AUC value of 91.74% (range: 84.56- 95.13). Slope of the terrain (FlowAcc), low vegetation area (lowveg), and the number of households within 100-meter with positive water samples (distance_water_pos) were significantly affecting human Leptospira exposure (Figure 3C). The probability of Leptospira exposure was positively correlated with terrain slope and low vegetation and negatively correlated with the number of households within 100 meters with positive water samples (Figure 6).
Other results showed that the exposure probability increased with the increasing seroprevalence of Leptospira among animals in a household (AnimHHPrev), while the species diversity (spdiv), the number of dogs in the household (dog_count), and community level seroprevalence in animals (AnimCommPrev) were negatively associated with the probability of Leptospira exposure. Age had a U-shape type of relationship, similar to the Semi-Rural community type, indicating a higher exposure probability in the younger and older ages. For the number of households within 100-meter with positive rodents (distance_pos_rod), the relationship was variable, but it increased sharply when there were 3 or more households within 100 meters with positive rodents (Figure 6).
4. Discussion
Leptospirosis, a zoonotic disease caused by the pathogenic spirochetes of the genus Leptospira, poses significant public health challenges worldwide, especially in tropical regions [34,35]. It is also present in temperate regions and, using One Health principles, our case study unveiled the intricate landscape of leptospirosis transmission across varied community settings in Chile. We found distinct seroprevalences and risk factors associated with demographic, behavioral, environmental, and animal-related variables in those communities. Urban slum areas showed higher exposure probabilities linked to environmental factors like shrub terrain and positive water samples, while semi-rural and farm communities exhibited different patterns influenced by age, household characteristics, and animal prevalence. These findings shed light on the multifaceted nature of leptospirosis transmission, informing targeted interventions for reducing human exposure and enhancing public health efforts.
Our research combined data from systematic efforts to detect leptospirosis in humans, animals, and the peri-domestic environment, unveiling the presence of Leptospira across the distinct community types in the study area of Chile and with varying seroprevalences among humans and domestic animals, rodent kidney carriages, and environmental contamination. The overall 6% seroprevalence in humans is similar to several studies in Colombia and Mexico in similar socio-economic settings [36,37,38]. Previous studies found that features of inadequate living conditions such as dirt floors, proximity to sewage, and absence of proper sanitation, as well as behavioral factors such as walking barefoot, having uncovered wounds, and gathering firewood are contributors to exposure [15]; however, our modeling did not reveal any individual behaviors as significant risk factors. This may be because disease transmission is primarily determined by the living environment, where external factors can have a more significant impact on disease spread, overshadowing the influence of individual behaviors. It could also be because MAT antibodies are evidence of an exposure in the past that may not be reflected in the behaviors reported in the survey. Based on our overall descriptive analysis, males exhibited a higher seroprevalence (6.5%) compared to females (5.6%), suggesting potential gender-specific differences in exposure or susceptibility to infection which has often been reported in the existing literature [39,40,41]. However, when analyzing by community type, our XGBoost models revealed contrasting effects in which men had higher exposure probability than women in urban slum communities but women had higher exposure probability than men in semi-rural communities. This finding may reflect differences in behavioral patterns, occupational activities, or exposure to contaminated environments between genders [42]. Models consistently revealed age as an important factor but with different relationships. There was a negative association with age in urban slum communities, with a higher probability at younger ages, but it had was U-shape in semi-rural and rural communities. The different trends could reflect different demographics and associated activities in the communities. For example, study participants from urban slum communities tended to be younger [43] and the higher probability among this group could reflect their greater representation. In semi-rural and rural, higher exposure probability among the youngest (<40 years) and the oldest (>60 years) ages could reflect common recreational, occupational, and domestic activities with exposure to a contaminated environment or infected farm animals such as swimming, gardening, or livestock management. The high exposure probability among older adults may also reflect a longer period at risk of becoming exposed.
Several environmental variables such as shrub terrain, wetlands, tree terrain, lower vegetation, and field terrain showed to impact the likelihood of Leptospira exposure, suggesting the importance of considering landscape heterogeneity when assessing exposure risk across different types of communities. The identified positive correlation with vegetation covers surrounding the households such as the presence of trees and lower vegetation (i.e., bushes) in all community types and shrubs in urban communities highlights the interconnectedness of wildlife habitats and leptospirosis risk [44]. Those land covers can act as critical habitats for wildlife reservoirs, notably rodents, increasing the likelihood of human-animal contact and subsequent disease transmission [45,46,47]. Additionally, the shaded, humid conditions under vegetation cover can modify microclimatic conditions by trapping and retaining moisture in the soil, creating damp conditions that are ideal for the survival of Leptospira outside of its hosts. This extended survival in moist soil increases the duration during which humans can encounter Leptospira, further facilitating transmission [44,48,49]. Furthermore, the presence of wetlands was positively associated with the likelihood of exposure in semi-rural and farm communities which is consistent with the notion that they can act as reservoirs for Leptospira [46,48] facilitating its survival and dissemination through water-borne transmission [5,45]. The presence of open fields can also be a contributing factor because it can lead to trash accumulation, attracting dogs and rodents, as well as standing water. This factor manifested differently as it was positively correlated with the probability of exposure in urban slums; however, the pattern was different for semi-rural and farm communities likely due to interactions with other vegetation features and the built-in environment. It is widely recognized that downward slopes enhance surface water flow, leading to the accumulation of stagnant water bodies and moist soil ideal for Leptospira survival [41]. The flow accumulation variable used in this analysis was found to be important in the three community types. Derived from slope data, this variable aimed to capture land features that facilitate water movement downhill during rainfall or flooding which results in resuspension of Leptospira present in the soil and sediment, leading to areas with high environmental contamination and high exposure risk [50].
Leptospirosis has been associated with urbanization in which the conditions of high-density, low-income housing are highly suitable for Leptospira contamination and transmission [51,52,53,54]. This effect of high-density housing was evident across all three community types when measured by the number of houses in a 100-meter radius. Additionally, the number of households within a 100-meter radius with water samples positive for pathogenic Leptospira emerged as a factor positively associated with exposure risk for the urban slum community type, further supporting the idea of exposure risk from of a Leptospira contaminated peri-domestic environment in these vulnerable communities [55,56]. However, this relationship differed in semi-rural and farm community types when exposure risk was the highest where there were few houses with positive water samples in the immediate vicinity. This could be an effect of water sources, which are often shared or communal, making contamination more widespread, or that rural households have greater exposure to environmental factors such as open fields or livestock, making localized household contamination less relevant [57]. Additionally, mobility patterns and water usage behaviors in rural communities might lead to a mismatch between household proximity to contaminated water and actual exposure risk [58].
Although animal-related variables were present across all communities, these variables were more evident in semi-rural and farm communities. The variable measuring the number of houses with Leptospira-positive rodents in the surrounding area was found to impact exposure risk in all three types of communities. There was a clear positive trend in urban slum communities, which is consistent with the findings regarding water sample contamination. This is also consistent with the general knowledge that synanthropic rodents are ubiquitous reservoirs of Leptospira [44]. Although with a lower importance level in the model results than other variables, dog household seroprevalence in semi-rural communities was associated with increased exposure risk. Dogs are recognized reservoir hosts for leptospirosis, capable of shedding the bacterium in their urine and contaminating the environment [59]. The often limited access to veterinary care and vaccination in low-resource settings leads to underdiagnosis and untreated [60,61]. A high seroprevalence of Leptospira in dogs within households could be correlated to an increased likelihood of human exposure because of transmission from the dogs or a dog-contaminated environment. Alternatively, both dogs and people could be subject to similar sources of Leptospira. Although also of low importance level in the modeling results, it is worth noting that the seroprevalence of Leptospira in all farm animals within the household was positively associated with exposure risk in semi-rural and farm communities. Households in these communities had a variety of livestock such as cattle, sheep, and pigs which can contribute to environmental contamination and pose a risk to household members through occupational and/or domestic activities [62,63,64]. The variable could represent an overall measurement of the underlying Leptospira exposure risk at the household level. The inverse relationship observed between increasing species diversity and Leptospira exposure, more importantly in rural communities, may reflect several ecological and epidemiological factors. A low diversity of domestic animal species in the farm system investigated here could indicate higher abundance of more competent hosts that contribute to increase transmission and higher likelihood of human exposure [47]. This association could also be the result of farm management practices and other activities correlated with both likelihood of exposure in people and species diversity.
Our study has several limitations. Firstly, the cross-sectional nature of the study design limits our ability to capture the temporal change in the relationship between identified risk factors and Leptospira exposure in community participants. Leptospirosis status in the community participants was measured using presence of antibodies which indicate an exposure sometime in the past, and although the populations in the study communities were stable regarding time of residence in the sampled locations, some of the factors may not reflect the same conditions as the time of the exposure. Additionally, the use of self-reported data and reliance on recall of the participants may have introduced information bias to reported behaviors. Furthermore, the multi-strain and multi-host transmission dynamics of Leptospira are complex but our study focused solely on the broad relationships between various eco-epidemiological drivers and human exposure. We were not able to investigate underlying mechanisms or pathways of transmission or how drivers may interact with one another to influence exposure risk. However, the benefit of using cross-sectional sampling is that it allows for a cost-efficient comprehensive investigation and is particularly useful as an initial approach in areas with limited knowledge of the leptospirosis situation. Findings can generate hypotheses for future research incorporating longitudinal study designs with incidence cases and genomic approaches for strain identification in humans, animals, and the environment and provide further insights into the transmission dynamics of leptospirosis.
5. Conclusions
Across urban slums, semi-rural, and farm communities, the overall human seroprevalence by community type was similar; however, our study results show the intricate interplay between environmental, socio-demographic, and animal-related factors in shaping leptospirosis transmission dynamics across these different community types. In urban slum areas, densely populated environments and altered landscapes contribute to disease risk, with environmental and rodent-related factors driving the transmission. Similarly, semi-rural communities exhibit complex interactions between environmental features and animal-related variables influencing exposure probability. In contrast, farm communities present unique challenges characterized by the coexistence of agricultural practices and human habitation. Here, environmental factors interact with livestock presence to shape disease dynamics. Emphasizing a One Health approach, which recognizes the interconnectedness of human, animal, and environmental health, is paramount in addressing the complex nature of leptospirosis transmission. The case study presented here is an example of the integration of efforts across disciplines for data collection at the human-environment-animal interface and novel methods such as machine learning for the analysis of complex data. Adopting a holistic approach that considers the health of humans, animals, and ecosystems is essential for achieving sustainable disease control and ensuring the health and prosperity of communities worldwide.
Author Contributions
Conceptualization, H.T., C.M.Z, and A.Y.; methodology, H.T, A.Y., S.B., M.S.; resources, C.M.Z.; writing—original draft preparation, H.T.; writing—review and editing, all authors.; supervision, A.Y, C.M.Z. All authors have read and agreed to the published version of the manuscript.
Funding
Data used for this study originated from a project funded by the National Science Foundation, Ecology of Infectious Diseases Program (Project No. 0913570).
Institutional Review Board Statement
The study protocol was approved by the University of Minnesota’s Institutional Review Board (No. 0903 M62042) and Institutional Animal Care and Use Committee (No. 0904A63201) and the Austral University’s Human and Animal Ethics Committee (No. 01/09).
Informed Consent Statement
Written informed consent for sample collection, testing, and reporting was obtained from all participants involved in the study.
Data Availability Statement
The data presented in this study are available on request from the corresponding author due to sensitive disease, life history and income information.
Acknowledgments
We thank Marcelo Gonzalez, Gunther Heyl, Carolina Encina, and Meghan Mason who assisted with various aspects of the original data collection and processing.
Conflicts of Interest
The authors declare no conflicts of interest.
Appendix A

Table A1.
Seroprevalence of Leptospirosis in different demographic and behavioral factors.
| Variables | Number of Participants | MAT positive | seroprevalence (%) | 95% CI |
|---|---|---|---|---|
| Sex of the person | ||||
| Male | 387 | 25 | 6.46 | 4.22-9.39 |
| Female | 520 | 29 | 5.57 | 3.77-7.91 |
| Person swim | ||||
| Yes | 629 | 43 | 6.84 | 4.99-9.09 |
| No | 278 | 11 | 3.96 | 1.99-6.97 |
| Positive rodents in the household | ||||
| Yes | 407 | 29 | 7.13 | 4.82-10.07 |
| No | 500 | 25 | 5.00 | 3.26-7.29 |
| Positive dog in the household | ||||
| Yes | 128 | 10 | 7.81 | 4.13-7.51 |
| No | 779 | 44 | 5.64 | 3.81-13.90 |
| Positive Cattle in the household | ||||
| Yes | 299 | 16 | 5.35 | 3.09-8.54 |
| No | 608 | 38 | 6.25 | 4.46-8.48 |
| Positive sheep in the household | ||||
| Yes | 282 | 13 | 4.61 | 2.48-7.75 |
| No | 625 | 41 | 6.56 | 4.75-8.79 |
| work in garden | ||||
| Yes | 269 | 11 | 4.09 | 2.06-7.20 |
| No | 638 | 43 | 6.73 | 4.92-8.97 |
| Clean barn | ||||
| Yes | 337 | 23 | 6.82 | 4.37-10.06 |
| No | 570 | 31 | 5.44 | 3.73-7.63 |
| Clean sewage drains | ||||
| Yes | 46 | 1 | 2.27 | 0.05-11.53 |
| No | 861 | 53 | 6.15 | 4.64-7.97 |
| Person slaughter | ||||
| Yes | 123 | 9 | 7.31 | 3.40-13.43 |
| No | 784 | 45 | 5.74 | 4.22-7.60 |
| Person milk animals | ||||
| Yes | 48 | 4 | 8.33 | 2.32-19.98 |
| No | 859 | 50 | 5.82 | 4.35-7.60 |
| Clean animal at birth | ||||
| Yes | 96 | 5 | 5.21 | 1.71-11.73 |
| No | 811 | 49 | 6.04 | 4.50-7.91 |
References
- Crecelius, E.M. and M.W. Burnett, Leptospirosis. J. Spec. Oper. Med., 2020. 20(4): p. 121.
- Haake, D.A., Levett, P.N. (2015). Leptospirosis in Humans. In: Adler, B. (eds) Leptospira and Leptospirosis. Current Topics in Microbiology and Immunology, vol 387. Springer, Berlin, Heidelberg.
- Costa, F., et al., Global Morbidity and Mortality of Leptospirosis: A Systematic Review. PLoS Negl Trop Dis, 2015. 9(9): p. e0003898. [CrossRef]
- Luna, J., et al., Assessment of Risk Factors in Synanthropic and Wild Rodents Infected by Pathogenic Leptospira spp. Cap-tured in Southern Chile. Animals, 2020. 10(11): p. 2133.
- Guerra, M.A., Leptospirosis: Public health perspectives. Biologicals, 2013. 41(5): p. 295-297. [CrossRef]
- Ellis, W.A., Animal leptospirosis. Curr Top Microbiol Immunol, 2015. 387: p. 99-137.
- Bradley, E.A. and G. Lockaby, Leptospirosis and the Environment: A Review and Future Directions. Pathogens, 2023. 12(9): p. 1167.
- Montes, V. and G. Monti, Pathogenic Leptospira spp. Seroprevalence and Herd-Level Risk Factors Associated with Chilean Dairy Cattle. Animals, 2021. 11(11): p. 3148.
- Harrison, N.A. and W.R. Fitzgerald, Leptospirosis--can it be a sexually transmitted disease? Postgrad Med J, 1988. 64(748): p. 163-4.
- Bolin, C.A. and P. Koellner, Human-to-Human Transmission of Leptospira interrogans by Milk. J. Infect. Dis., 1988. 158(1): p. 246-247.
- Muñoz-Zanzi, C., et al., Leptospira Contamination in Household and Environmental Water in Rural Communities in South-ern Chile. Int. J. Environ. Res. Public Health, 2014. 11(7): p. 6666-6680.
- Pappas, G., et al., The globalization of leptospirosis: worldwide incidence trends. Int J Infect Dis, 2008. 12(4): p. 351-7. [CrossRef]
- Miller, D.A., M.A. Wilson, and G.W. Beran, Relationships between prevalence of Leptospira interrogans in cattle, and regional, climatic, and seasonal factors. Am J Vet Res, 1991. 52(11): p. 1766-8. [CrossRef]
- Romero, E.C., C.C. Bernardo, and P.H. Yasuda, Human leptospirosis: a twenty-nine-year serological study in São Paulo, Bra-zil. Rev Inst Med Trop Sao Paulo, 2003. 45(5): p. 245-8.
- Mwachui, M.A., et al., Environmental and Behavioural Determinants of Leptospirosis Transmission: A Systematic Review. PLoS Negl Trop Dis, 2015. 9(9): p. e0003843.
- Muñoz-Zanzi, C., et al., Household characteristics associated with rodent presence and Leptospira infection in rural and ur-ban communities from Southern Chile. Am J Trop Med Hyg, 2014. 90(3): p. 497-506.
- Alexander, A.D., The distribution of leptospirosis in Latin America. Bull World Health Organ, 1960. 23(1): p. 113-25.
- Zamora, J., et al., [Serological survey of human leptospirosis in a high risk population in Chile]. Rev Med Chil, 1990. 118(3): p. 247-52.
- Lelu, M., et al., Seroepidemiology of leptospirosis in dogs from rural and slum communities of Los Rios Region, Chile. BMC Vet Res, 2015. 11(1): p. 31. [CrossRef]
- Mason, M.R., et al., Distribution and Diversity of Pathogenic Leptospira Species in Peri-domestic Surface Waters from South Central Chile. PLoS Negl Trop Dis, 2016. 10(8): p. e0004895. [CrossRef]
- Munoz-Zanzi, C., C. Campbell, and S. Berg, Seroepidemiology of toxoplasmosis in rural and urban communities from Los Rios Region, Chile. Infect Ecol Epidemiol, 2016. 6: p. 30597.
- Fick, S.E. and R.J. Hijmans, WorldClim 2: new 1-km spatial resolution climate surfaces for global land areas. Int. J. Climatol., 2017. 37(12): p. 4302-4315.
- Chen, T. and C. Guestrin, XGBoost: A Scalable Tree Boosting System, in Proceedings of the 22nd ACM SIGKDD International Conference on Knowledge Discovery and Data Mining. 2016, Association for Computing Machinery: San Francisco, California, USA. p. 785–794.
- Ogunleye, A. and Q.G. Wang, XGBoost Model for Chronic Kidney Disease Diagnosis. IEEE/ACM Trans Comput Biol Bioinform, 2020. 17(6): p. 2131-2140. [CrossRef]
- Shaheed, K., et al., Optimized Xception Learning Model and XgBoost Classifier for Detection of Multiclass Chest Disease from X-ray Images. Diagnostics (Basel), 2023. 13(15). [CrossRef]
- Aydin ZE, Ozturk ZK. Performance analysis of xgboost classifier with missing data. In: Proceedings of the 1st international conference on computing and machine intelligence, Vol. 2. 2021.
- Putatunda, S. and K. Rama, A Comparative Analysis of Hyperopt as Against Other Approaches for Hyper-Parameter Opti-mization of XGBoost, in Proceedings of the 2018 International Conference on Signal Processing and Machine Learning. 2018, Asso-ciation for Computing Machinery: Shanghai, China. p. 6–10.
- Davagdorj, K., et al., XGBoost-Based Framework for Smoking-Induced Noncommunicable Disease Prediction. Int J Environ Res Public Health, 2020. 17(18).
- Srinivas, P. and R. Katarya, hyOPTXg: OPTUNA hyper-parameter optimization framework for predicting cardiovascular dis-ease using XGBoost. Biomed. Signal Process. Control, 2022. 73: p. 103456.
- Farooq, Z., et al., Artificial intelligence to predict West Nile virus outbreaks with eco-climatic drivers. Lancet Reg Health Eur, 2022. 17: p. 100370.
- Jin, H. and C.X. Ling, Using AUC and accuracy in evaluating learning algorithms. IEEE Transactions on Knowledge and Data Engineering, 2005. 17(3): p. 299-310.
- R Core Team R: A language and environment for statistical computing. R Foundation for Statistical Computing, Vienna, Aus-tria. 2020.
- Chen T, H.T., Benesty M, Khotilovich V, Tang Y, Cho H, Chen K, Mitchell R, Cano I, Zhou T, Li M, Xie J, Lin M, Geng Y, Li Y, Yuan J, xgboost: Extreme Gradient Boosting. . 2023.
- Karpagam, K.B. and B. Ganesh, Leptospirosis: a neglected tropical zoonotic infection of public health importance-an updated review. Eur J Clin Microbiol Infect Dis, 2020. 39(5): p. 835-846. [CrossRef]
- Notobroto, H.B., Y.A. Mirasa, and F.S. Rahman, Sociodemographic, behavioral, and environmental factors associated with the incidence of leptospirosis in highlands of Ponorogo Regency, Province of East Java, Indonesia. Clin. Epidemiol. Glob. Health, 2021. 12. [CrossRef]
- Romero, M., J. Sanchez, and L. Hayek, Prevalencia de anticuerpos contra Leptospira en población urbana humana y canina del Departamento del Tolima. Revista de Salud Pública, 2010. 12: p. 268-275. [CrossRef]
- Alvarado-Esquivel, C., et al., Leptospira Exposure and Gardeners: A Case-Control Seroprevalence Study. J Clin Med Res, 2016. 8(1): p. 25-8.
- Benschop, J., et al., Sero-prevalence of leptospirosis in workers at a New Zealand slaughterhouse. N Z Med J, 2009. 122(1307): p. 39-47.
- Carrero, S., et al., Seroprevalencia de infección por Leptospira y factores de riesgo en estudiantes de una universidad de Co-lombia. Nova, 2017. 15: p. 131.
- Dias, J.P., et al., Factors associated with Leptospira sp infection in a large urban center in northeastern Brazil. Rev Soc Bras Med Trop, 2007. 40(5): p. 499-504. [CrossRef]
- Wynwood, S.J., et al., Leptospirosis from water sources. Pathog Glob Health, 2014. 108(7): p. 334-8. [CrossRef]
- Goarant, C., Leptospirosis: risk factors and management challenges in developing countries. Res Rep Trop Med, 2016. 7: p. 49-62. [CrossRef]
- Davignon, G., et al., Leptospirosis: toward a better understanding of the environmental lifestyle of Leptospira. Front. Water, 2023. 5.
- Moseley, M., et al., Mixed Leptospira Infections in a Diverse Reservoir Host Community, Madagascar, 2013-2015. Emerg Infect Dis, 2018. 24(6): p. 1138-1140.
- Cucchi, K., et al., Hydroclimatic drivers of highly seasonal leptospirosis incidence suggest prominent soil reservoir of patho-genic Leptospira spp. in rural western China. PLoS Negl Trop Dis, 2019. 13(12): p. e0007968.
- Cunha, M., et al., Rainfall and other meteorological factors as drivers of urban transmission of leptospirosis. PLoS Negl Trop Dis, 2022. 16(4): p. e0007507. [CrossRef]
- Kocher, A., et al., Biodiversity and vector-borne diseases: Host dilution and vector amplification occur simultaneously for Amazonian leishmaniases. Mol. Ecol., 2023. 32(8): p. 1817-1831. [CrossRef]
- Chiani, Y.T., et al., Presence of Leptospira spp. in a Mosaic of Wetlands Used for Livestock Raising under Differing Hydrocli-matic Conditions. Appl Environ Microbiol, 2023. 89(6): p. e0197122.
- Caley, P. and D. Ramsey, Estimating disease transmission in wildlife, with emphasis on leptospirosis and bovine tuberculosis in possums, and effects of fertility control. J. Appl. Ecol, 2001. 38(6): p. 1362-1370. [CrossRef]
- Bacallao, J., et al., Socioeconomic factors and vulnerability to outbreaks of leptospirosis in Nicaragua. Int J Environ Res Public Health, 2014. 11(8): p. 8301-18. [CrossRef]
- Zakharova, O.I., et al., Ecological and Socio-Economic Determinants of Livestock Animal Leptospirosis in the Russian Arctic. Front Vet Sci, 2021. 8: p. 658675. [CrossRef]
- Baquero, O.S. and G. Machado, Spatiotemporal dynamics and risk factors for human Leptospirosis in Brazil. Sci Rep, 2018. 8(1): p. 15170.
- Hagan, J.E., et al., Spatiotemporal Determinants of Urban Leptospirosis Transmission: Four-Year Prospective Cohort Study of Slum Residents in Brazil. PLoS Negl Trop Dis, 2016. 10(1): p. e0004275.
- Reis, R.B., et al., Impact of environment and social gradient on Leptospira infection in urban slums. PLoS Negl Trop Dis, 2008. 2(4): p. e228.
- Kembhavi, R.S., G.D. Velhal, and A.K. Shah, Epidemiological determinants of leptospirosis in rural and urban districts of Maharashtra, India. J Family Med Prim Care, 2021. 10(9): p. 3361-3367.
- Sluydts, V., et al., Ecology and distribution of Leptospira spp., reservoir hosts and environmental interaction in Sri Lanka, with identification of a new strain. PLoS Negl Trop Dis, 2022. 16(9): p. e0010757.
- Daniels, M.E., et al., Waterborne exposure during non-consumptive domestic use of surface water: a population study across WASH service levels in rural India. J Water Health, 2023. 21(6): p. 751-762.
- Galan, D.I., et al., Epidemiology of human leptospirosis in urban and rural areas of Brazil, 2000-2015. PLoS One, 2021. 16(3): p. e0247763.
- Awoniyi, A.M., et al., Population dynamics of synanthropic rodents after a chemical and infrastructural intervention in an urban low-income community. Sci Rep, 2022. 12(1): p. 10109.
- Céspedes Z, M., et al., Prevalencia de Leptospirosis y factores de riesgo en personas con antecedentes de fiebre en la Provincia de Manu, Madre de Dios, Perú. Rev. Peru Med. Exp. Salud Publica, 2003. 20: p. 80-185.
- Maze, M.J., et al., Risk factors for human acute leptospirosis in northern Tanzania. PLoS Negl Trop Dis, 2018. 12(6): p. e0006372. [CrossRef]
- Brockmann, S.O., et al., Risk factors for human Leptospira seropositivity in South Germany. Springerplus, 2016. 5(1): p. 1796. [CrossRef]
- Anderson, T., et al., Animals Exposed to Leptospira Serogroups Not Included in Bacterins in the United States and Puerto Ri-co. Trop Med Infect Dis, 2023. 8(3).
- Harran, E., et al., Identification of Pathogenic Leptospira kirschneri Serogroup Grippotyphosa in Water Voles (Arvicola ter-restris) from Ruminant Pastures in Puy-de-Dome, Central France. Pathogens, 2023. 12(2).
Figure 2.
Leptospira positivity distribution in rodents (PCR kidney carriage positivity), domestic animals (MAT seropositivity), water (PCR positivity) and people among (MAT seropositivity) (A) by community type and (B) in each of the 12 communities, three within each community type. Darker color in a bar represents the proportion of individuals with a MAT titer ≥1:400.
Figure 2.
Leptospira positivity distribution in rodents (PCR kidney carriage positivity), domestic animals (MAT seropositivity), water (PCR positivity) and people among (MAT seropositivity) (A) by community type and (B) in each of the 12 communities, three within each community type. Darker color in a bar represents the proportion of individuals with a MAT titer ≥1:400.
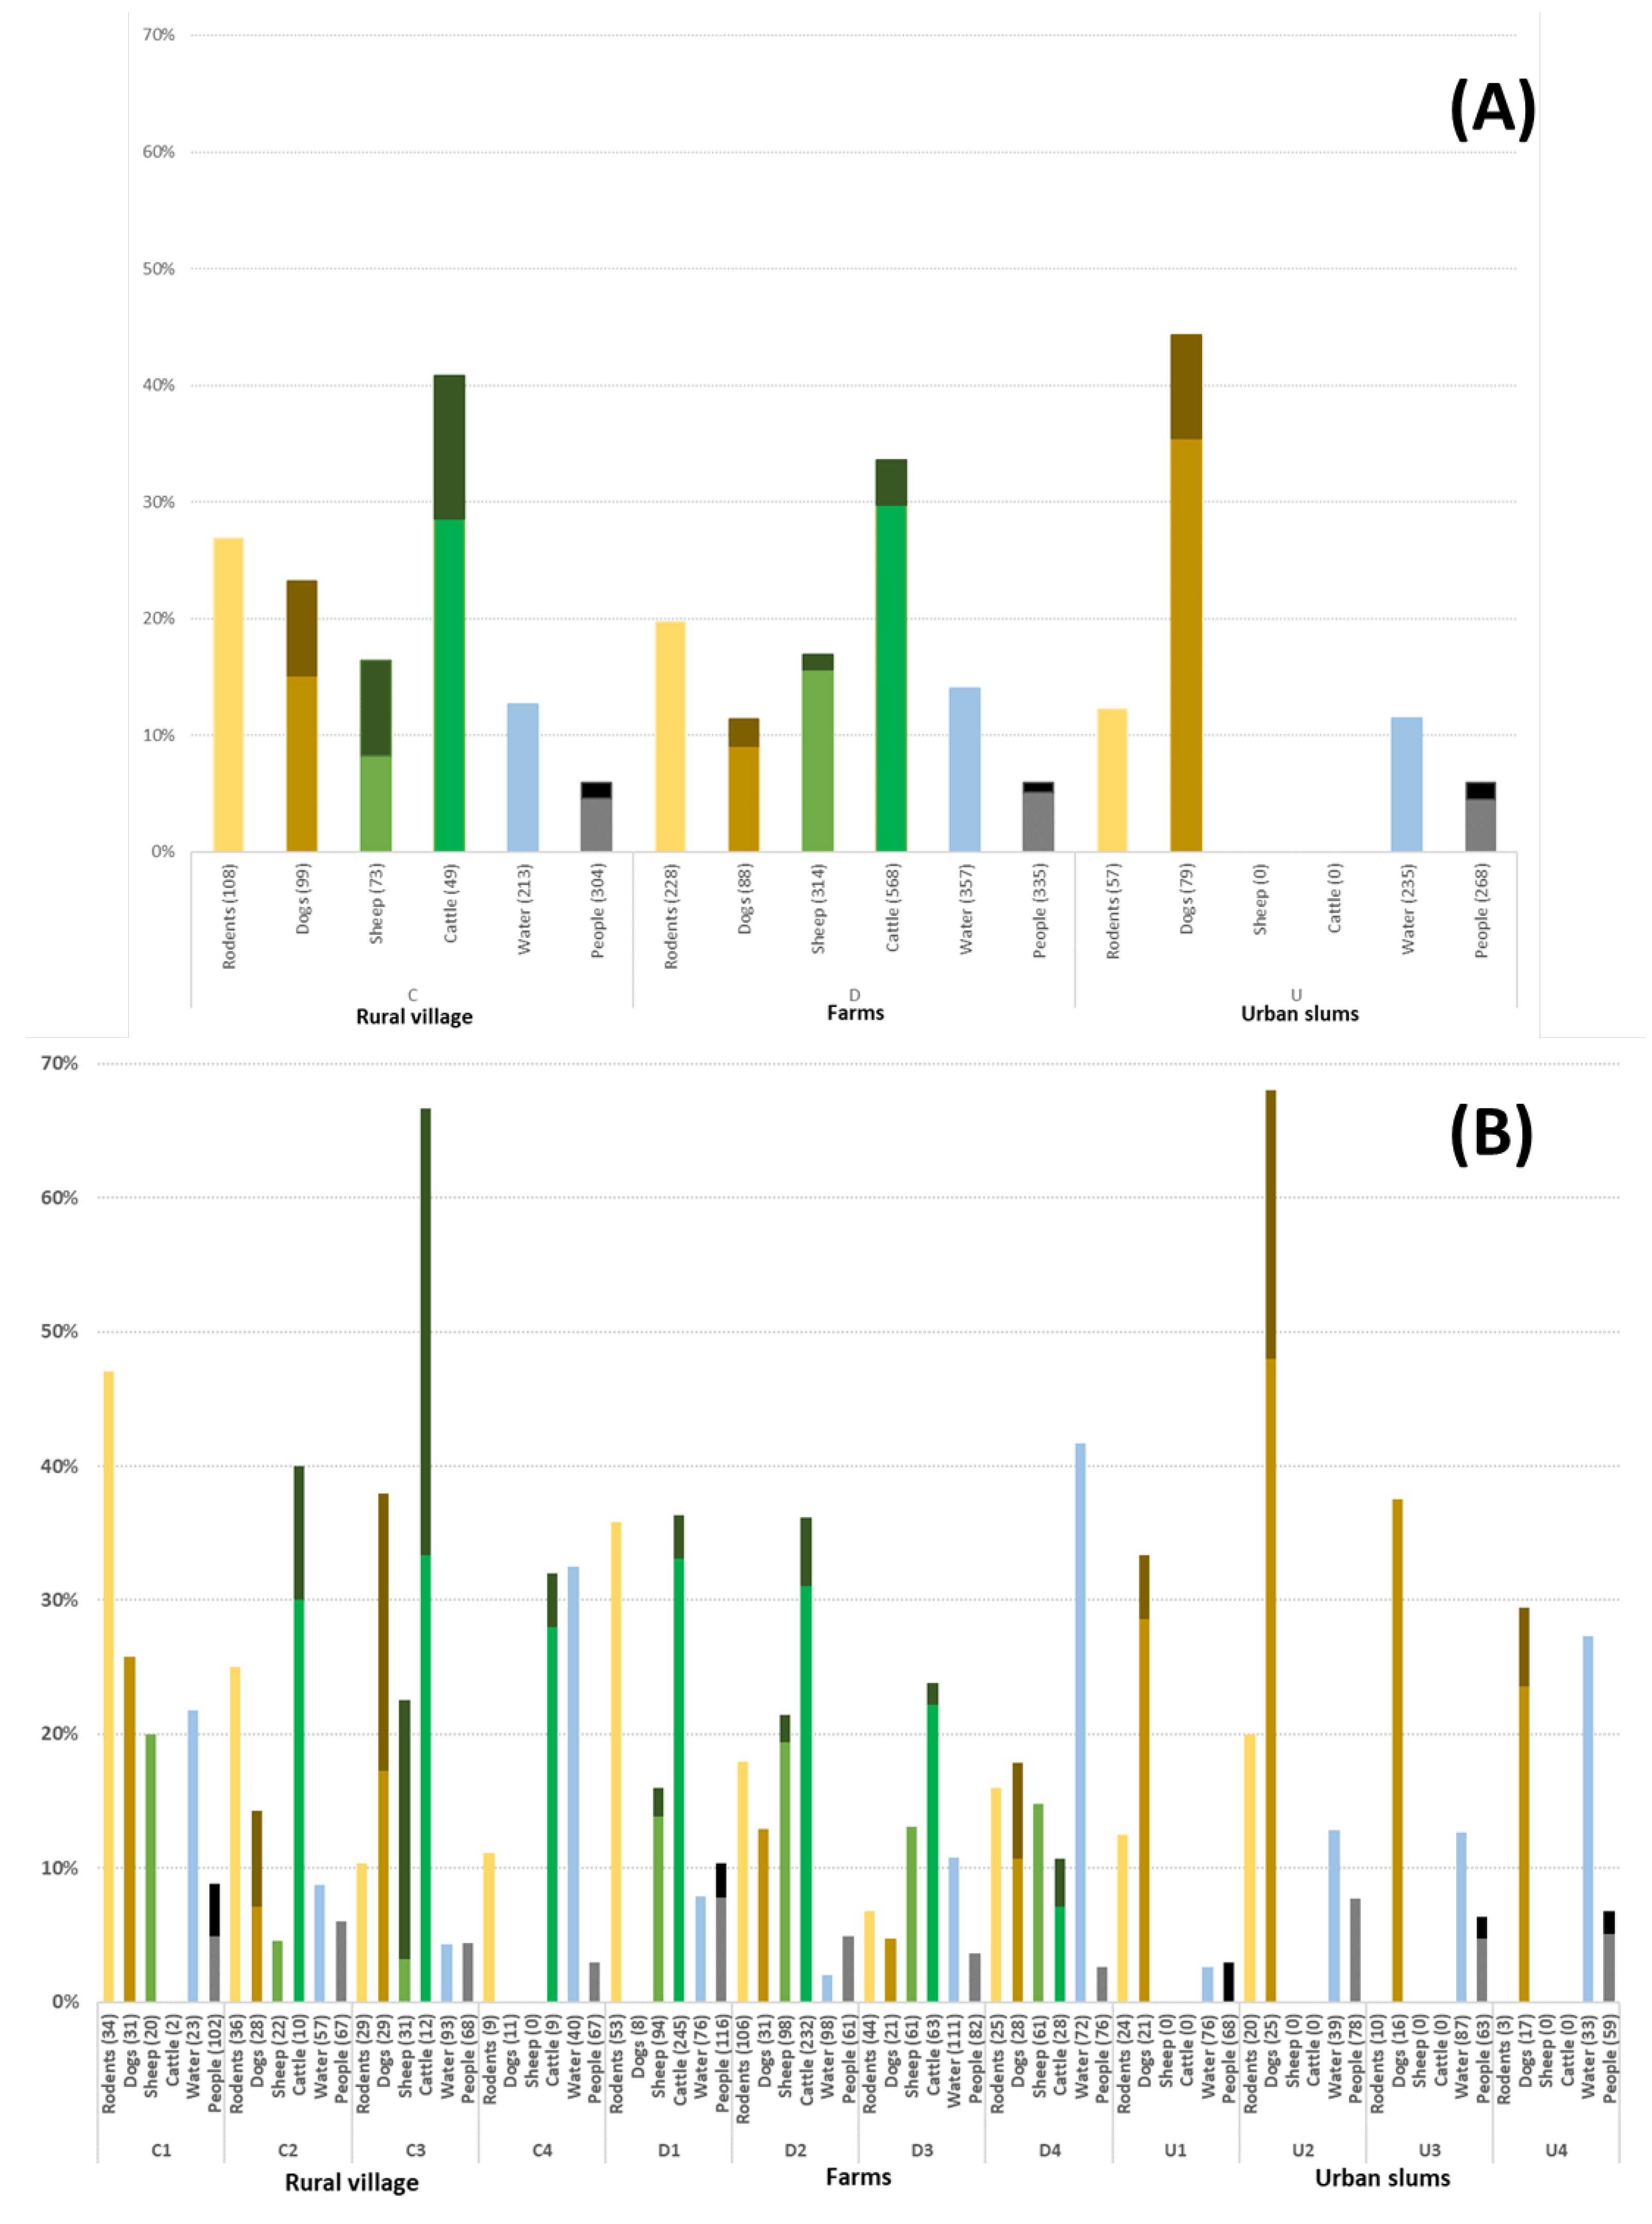
Figure 3.
Variable Importance plot for the model results of the three community types, A) Urban slums, B) Semi-Rural, and C) Farm. Variables with more than a 2% importance frequency score have been shown. The bars were color-coded for ease of interpretation of the overall trend in the predicted relationship between each variable and human exposure probability across the three different community types. Note that the relationship types depicted here were derived visually from Figure 4, Figure 5 and Figure 6 and were simplified to overall positive or negative but actual relationships are non-linear.
Figure 3.
Variable Importance plot for the model results of the three community types, A) Urban slums, B) Semi-Rural, and C) Farm. Variables with more than a 2% importance frequency score have been shown. The bars were color-coded for ease of interpretation of the overall trend in the predicted relationship between each variable and human exposure probability across the three different community types. Note that the relationship types depicted here were derived visually from Figure 4, Figure 5 and Figure 6 and were simplified to overall positive or negative but actual relationships are non-linear.
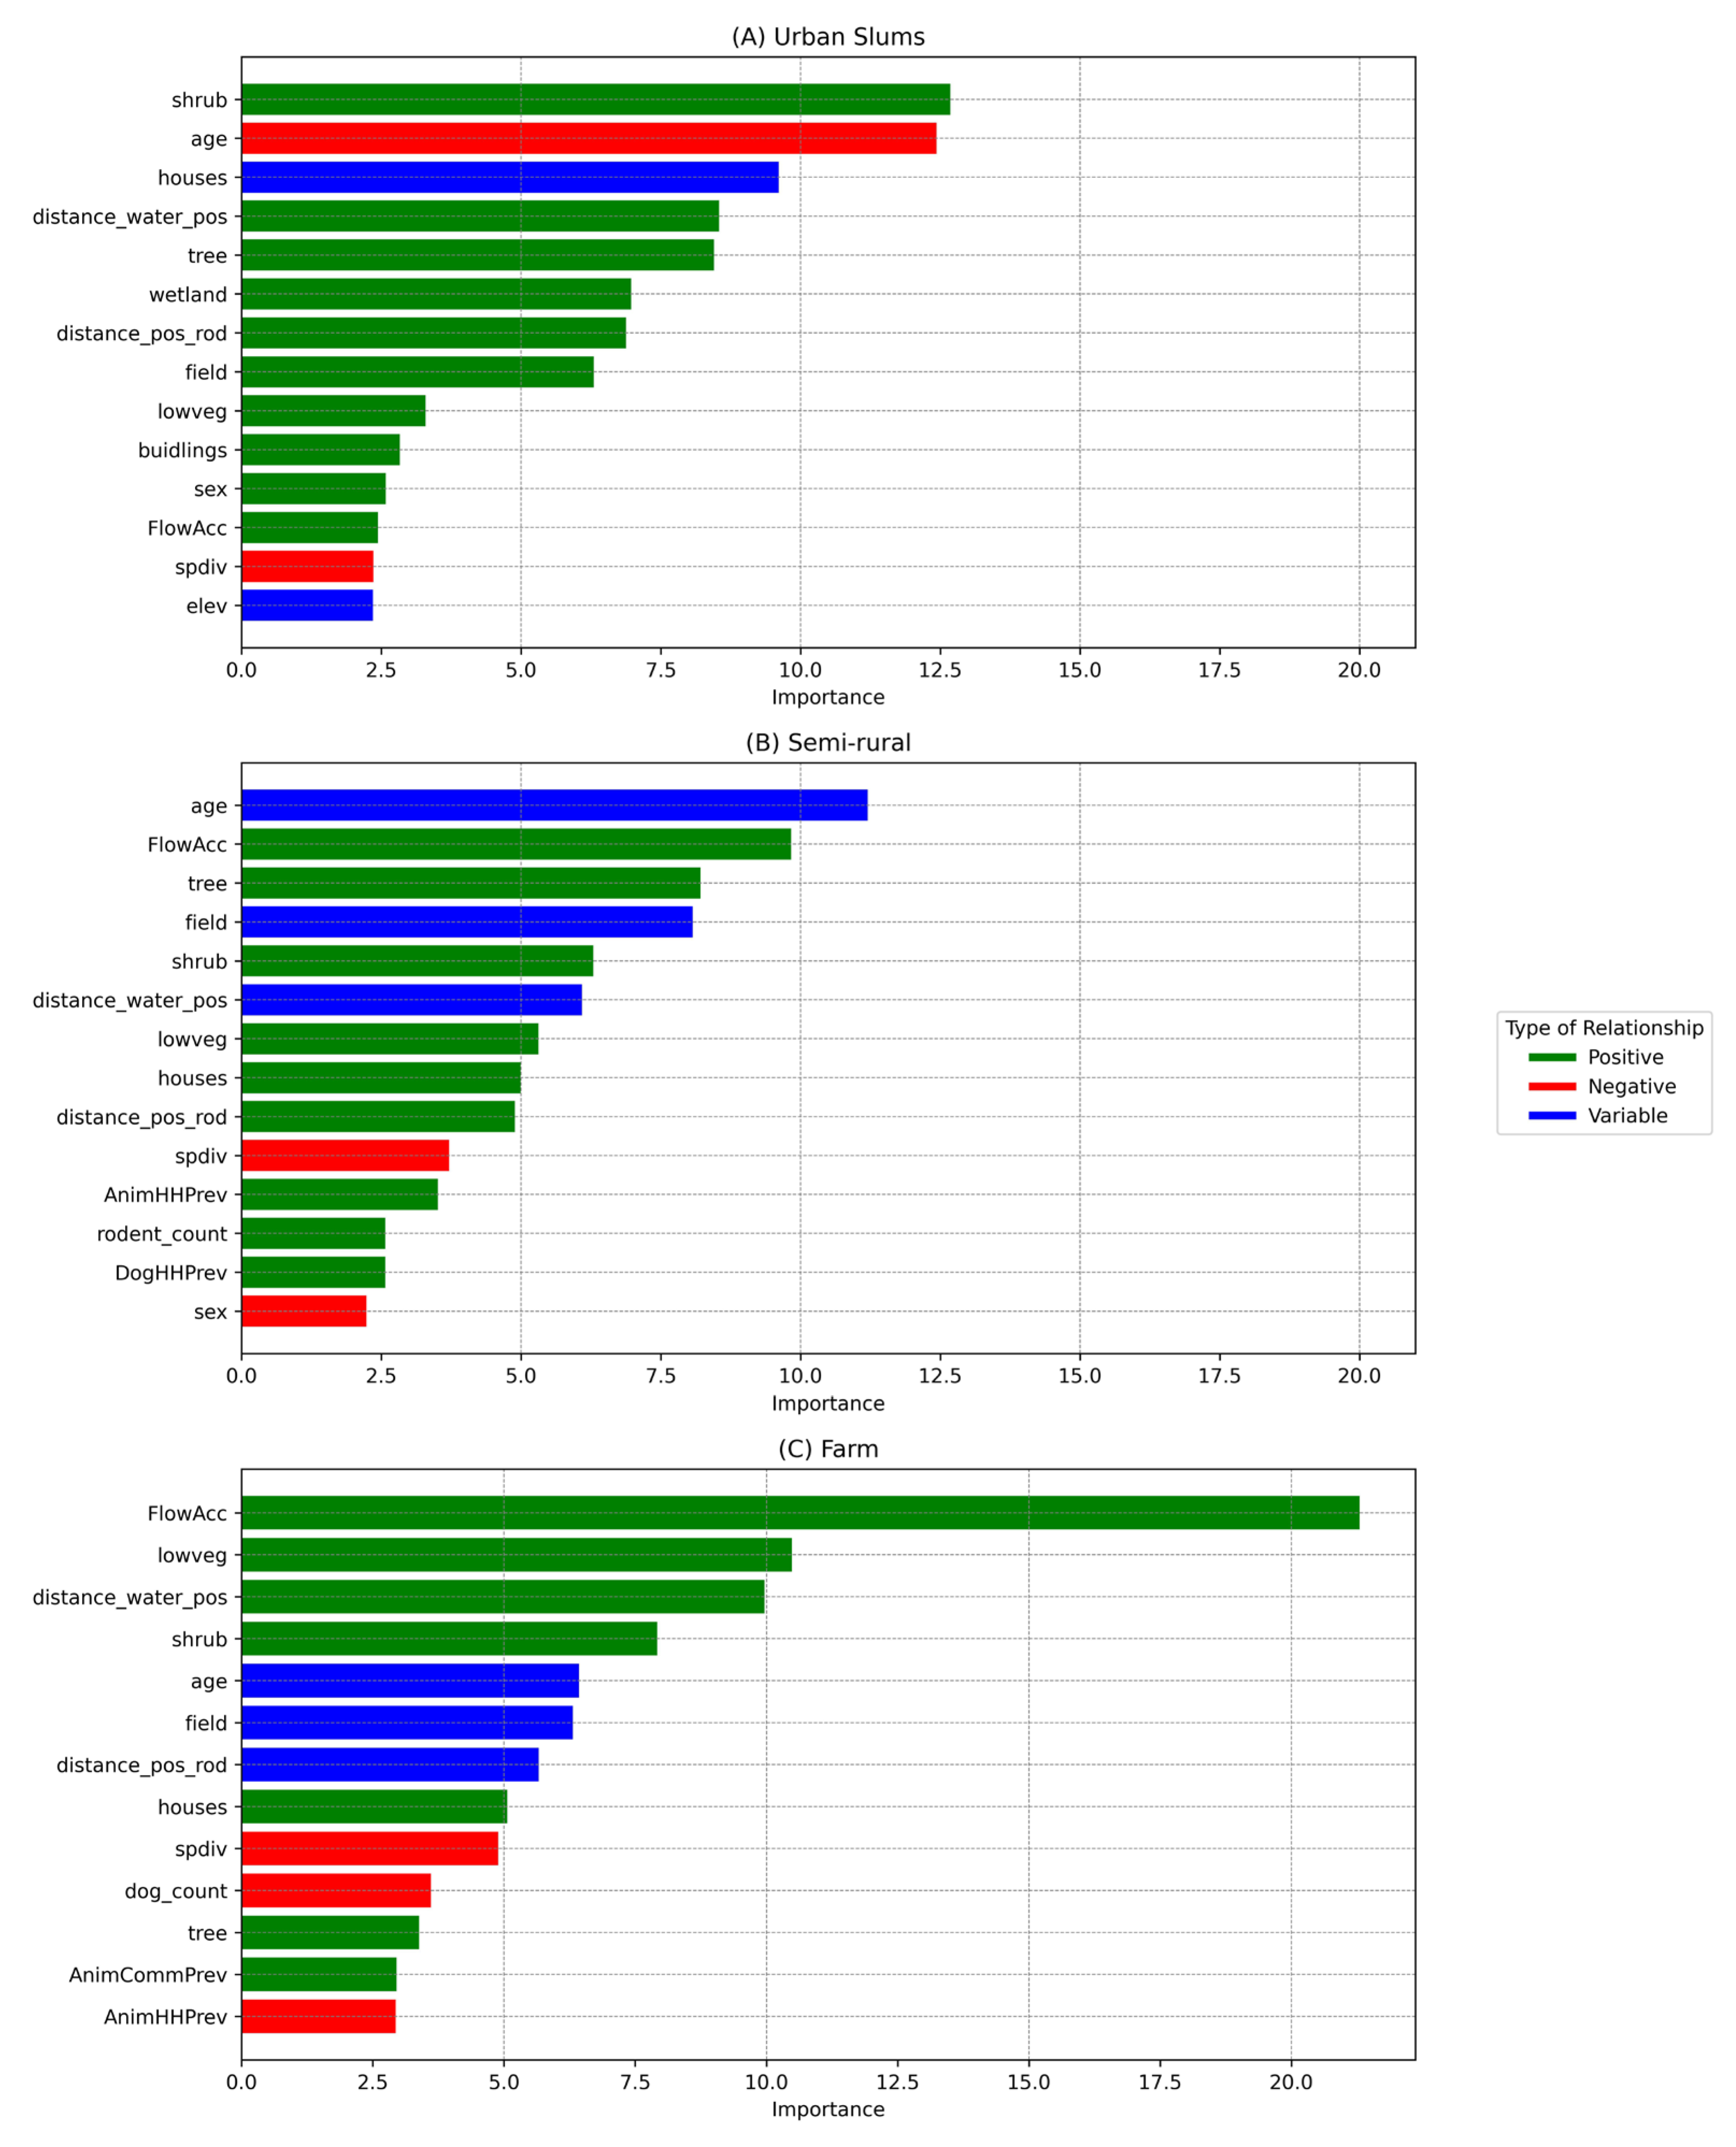
Figure 4.
The Partial dependency plots of covariates used in the model for Urban slum communities. The gray shading area indicates the confidence intervals derived from the model iterations. The variable importance score is reported in the parentheses.
Figure 4.
The Partial dependency plots of covariates used in the model for Urban slum communities. The gray shading area indicates the confidence intervals derived from the model iterations. The variable importance score is reported in the parentheses.
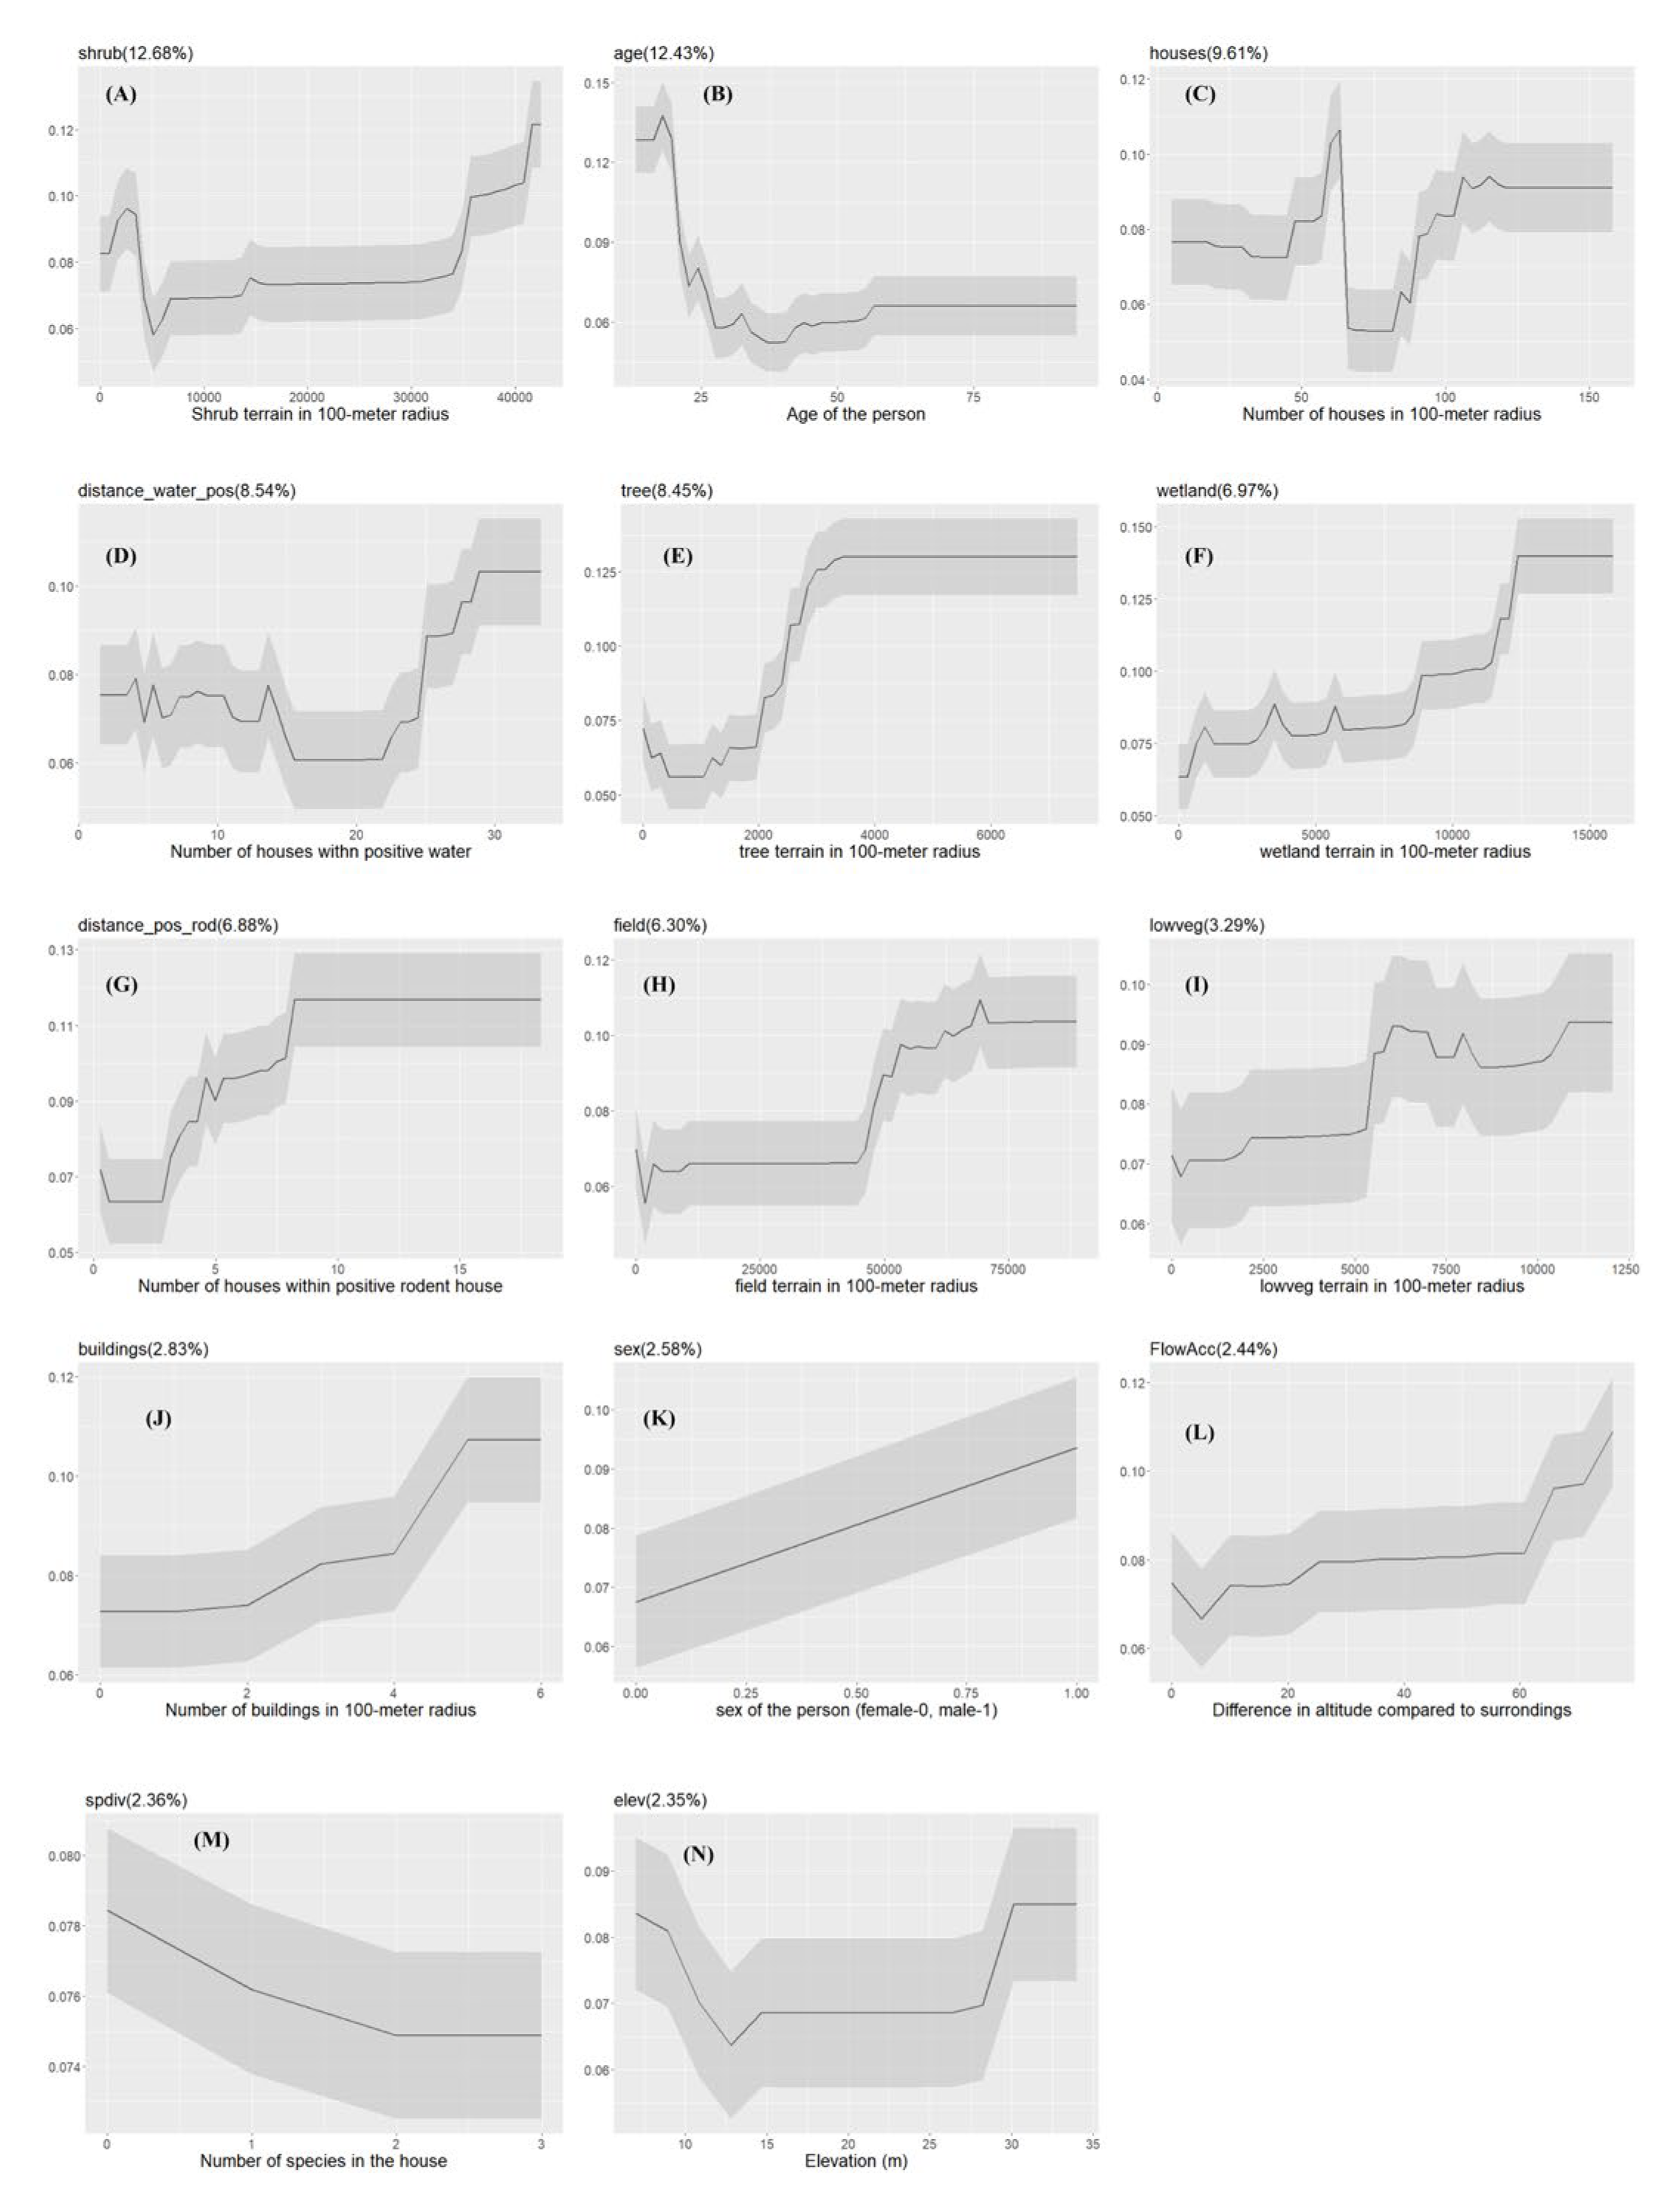
Figure 5.
The Partial dependency plots of covariates used in the model for Semi-Rural communities. The gray shading area indicates the confidence intervals derived from the model iterations. The variable importance score is reported in the parentheses.
Figure 5.
The Partial dependency plots of covariates used in the model for Semi-Rural communities. The gray shading area indicates the confidence intervals derived from the model iterations. The variable importance score is reported in the parentheses.
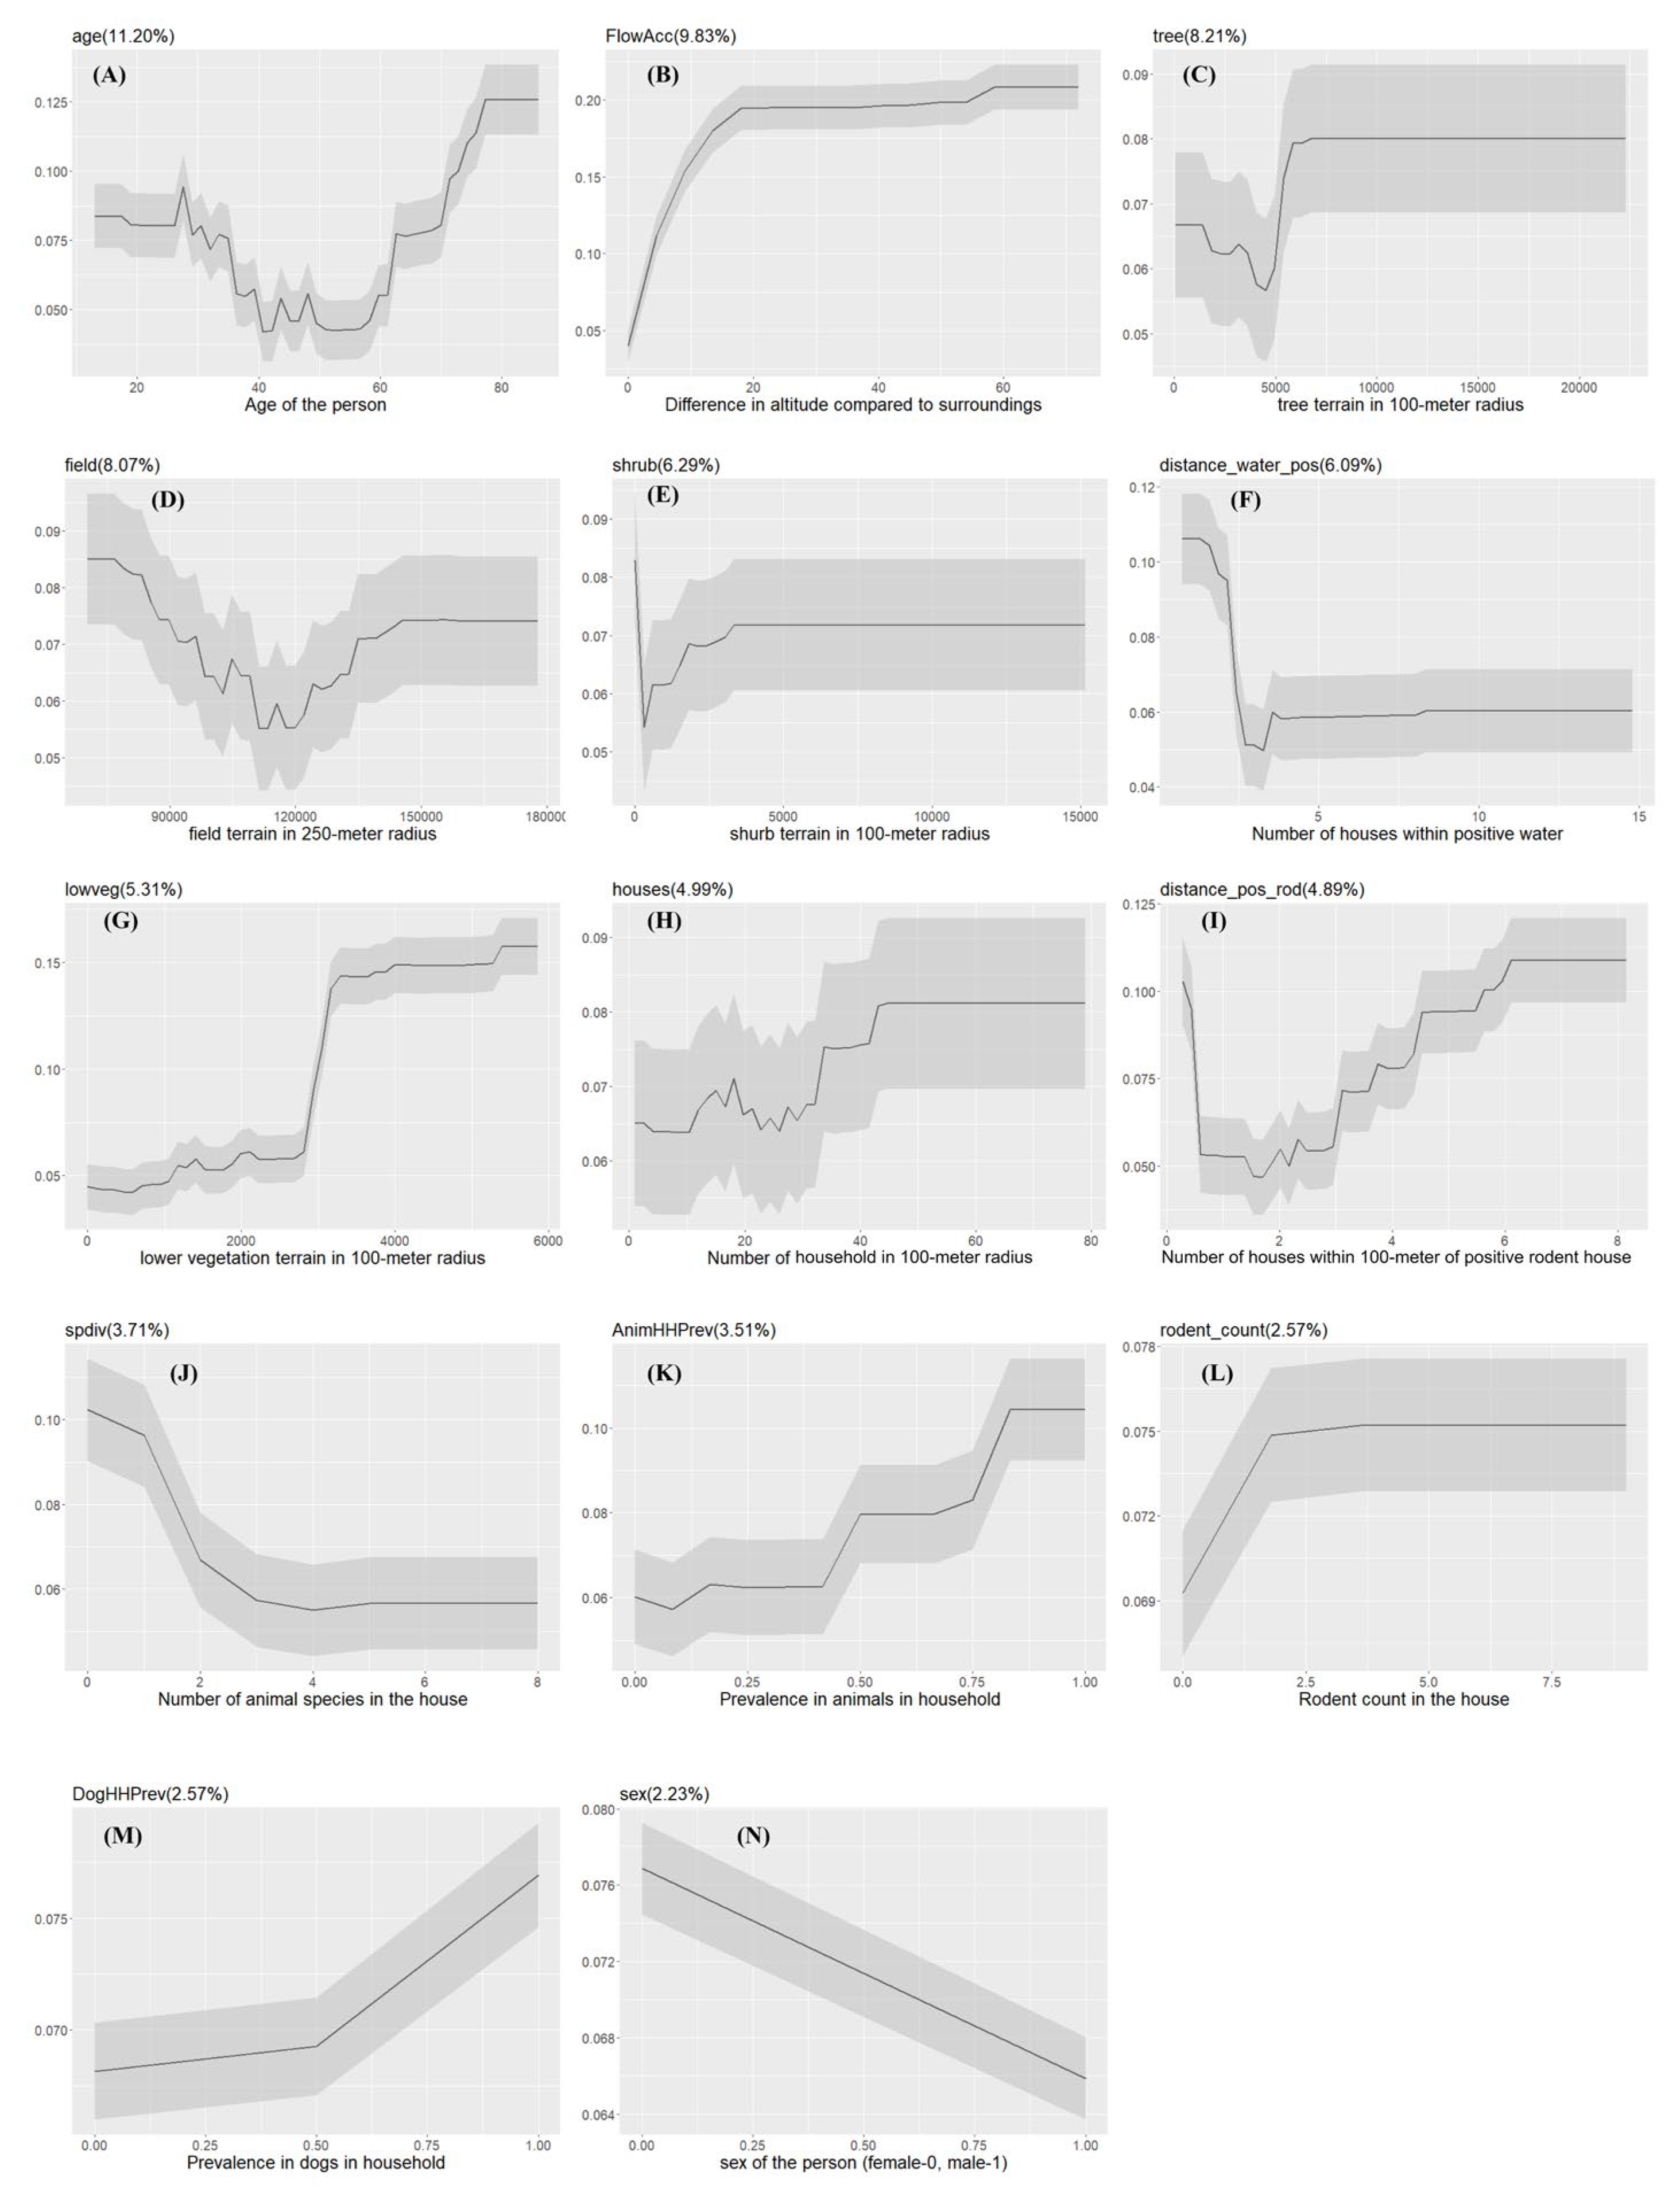
Figure 6.
The Partial dependency plots of covariates used in the model for Farm communities. The gray shading area indicates the confidence intervals derived from the model iterations. The variable importance score is reported in the parentheses.
Figure 6.
The Partial dependency plots of covariates used in the model for Farm communities. The gray shading area indicates the confidence intervals derived from the model iterations. The variable importance score is reported in the parentheses.
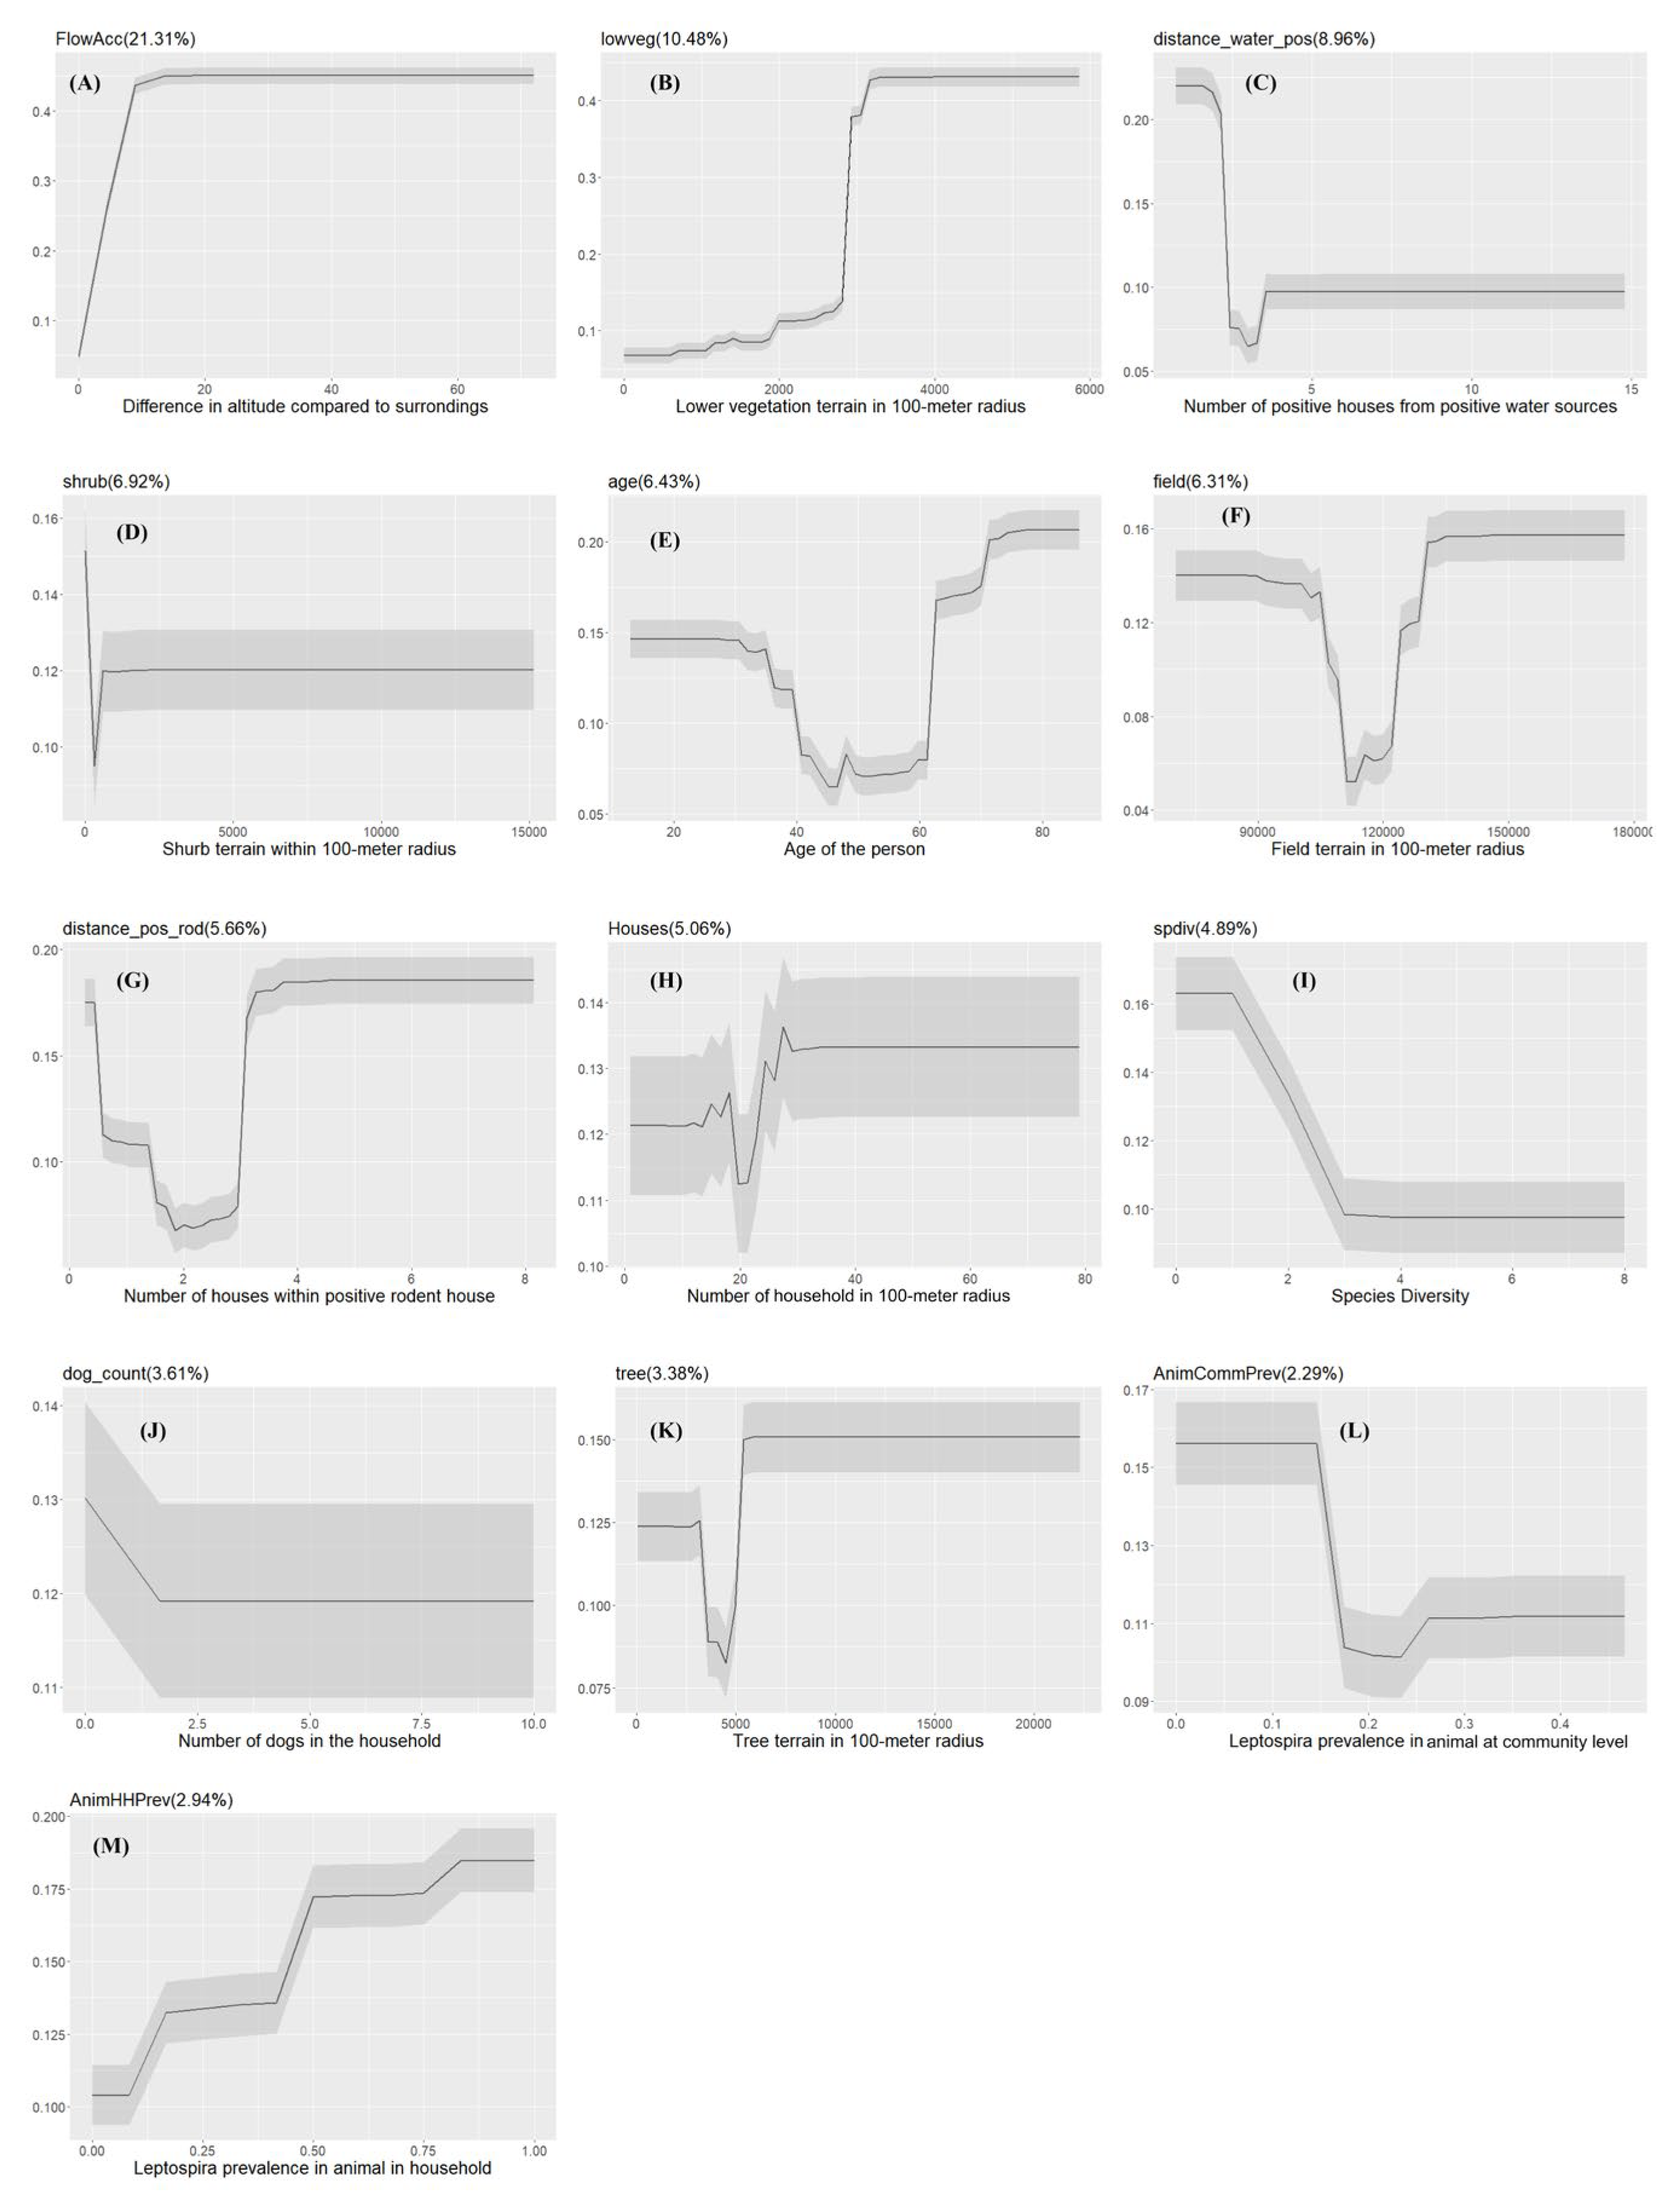
Table 1.
Description and source of the variables included in the study.
| Type | Variable Name | Description | Source |
|---|---|---|---|
| Socio-demographic and household characteristics | sex | Sex of the person | Questionnaire |
| age | Age of the person (in years) | ||
| clean_barn | Person cleans barns | ||
| clean_drain | Person cleans drains in the field | ||
| slaughter | Person butchers meat | ||
| milking | Person milks cows | ||
| clean_birth | Person cleans cow birth products | ||
| clean_water_drain | Person cleans water drains | ||
| clean_field | Person cleans fields | ||
| swim | Person swims | ||
| season | Sampling season | ||
| house | Number of houses within 100-meter radius | Derived from worldview-2 satellite imagery | |
| buildings | Number buildings within 100-meter radius | ||
| Environmental | elev | Altitude of sampled household | Derived from worldview-2 satellite imagery |
| FlowAcc | Difference in altitude compared to surroundings (higher numbers means greater slope downward) | ||
| tree | Square meters of tree-dominated terrain within 100-meter radius | ||
| lowveg | Square meters of lower-vegetation terrain within 100-meter radius (e.g., bushes and other short plants) | ||
| shrub | Square meters of shrub-dominated terrain within 100-meter radius | ||
| wetland | Square meters of wetland terrain within 100-meter radius | ||
| field | Square meters of field terrain within 250-meter radius | ||
| bio1 | Annual mean temperature | worldclim.org | |
| bio2 | Mean Diurnal Range (Mean of monthly (max temp – min temp)) | ||
| bio12 | Annual Precipitation | ||
| bio15 | Precipitation Seasonality (Coefficient of Variation) | ||
| puddle_pos_com | Proportion of Leptospira positive puddles in the community | Laboratory testing | |
| water_prev_com | Proportion of Leptospira positive water samples in the community (all water source types) | ||
| distance_pos_water | Number of households within 100 meters with Leptospira-positive water samples weighted inversely by distance from house | Derived from worldview-2 satellite imagery | |
| Animal | rodent_count | Number of rodents trapped in the household | Questionnaire |
| rod_pos | Presence of Leptospira positive rodents in the household | Derived | |
| rodent_count_com | Number of rodents trapped in the community | Questionnaire | |
| RodHHPrev | Leptospira prevalence in rodents at household level | Derived | |
| rodent_prev_com | Leptospira prevalence in rodents in the community | Derived | |
| distance_pos_rod | Number of households within 100-meter with Leptospira-positive rodents weighted inversely by distance from house | Derived from worldview-2 satellite imagery | |
| spdiv | Number of different domestic animal species in the household | Derived | |
| bov_count | Number of bovines in the household | Questionnaire | |
| bov_pos | Presence of seropositive bovines in the household | Derived | |
| BovHHPrev | Leptospira seroprevalence in bovines at household level | ||
| bov_com_pos | Number of seropositive bovines in the community | ||
| bov_com_prev | Leptospira seroprevalence in bovines at community level | ||
| ovi_count | Number of ovines in the household | Questionnaire | |
| ovi_pos | Presence of seropositive ovines in the household | Derived | |
| OviHHPrev | Leptospira seroprevalence in ovines at household level | ||
| ovi_pos_com | Number of seropositive ovines in the community | ||
| OviComPrev | Leptospira seroprevalence in ovines at community level | ||
| dog_count | Number of dogs in the household | Questionnaire | |
| dog_pos | Presence of seropositive dogs in the household | Derived | |
| DogHHPrev | Leptospira seroprevalence in dogs at household level | ||
| dog_com_pos | Number of seropositive dogs in the community | ||
| DogComPrev | Leptospira seroprevalence in dogs at community level | ||
| Anim_pos | Presence of seropositive animals in the household | ||
| AnimalHHPrev | Leptospira seroprevalence in farm animals at household level | ||
| animal_pos_com | Number of overall seropositive farm animals in the community | ||
| AnimCommPrev | Leptospira seroprevalence in farm animals at community level |
Table 2.
Parameters that were used to tune the models.
| Parameter | Description | Range | Interval |
|---|---|---|---|
| scale_pos_weight | Weight of positive class to address class imbalance | Neg/pos | Fixed |
| nrounds | Number of boosting rounds or iterations during the training process. | 100-600 | 50 |
| learning_rate | Learning rate for gradient boosting | 0-1 | 0.01 |
| max_depth | Maximum depth of the decision tree | 0-10 | 1 |
| min_child_weight | Minimum sum of instance weight (Hessian) needed in a child | 0-10 | 1 |
| gamma | Minimum loss reduction required to make a further partition on a leaf node | 0-5 | 0.1 |
| subsample | Fraction of training data to randomly sample during training | 0-1 | 0.1 |
| colsample_bytree | Fraction of features to be randomly sampled for each tree | 0-1 | 0.1 |
| objective | Learning task and objective function (binary classification in this case) | Binary:logistic | |
| Max_delta_step | Introduce an ‘absolute’ regularization capping the weight before apply eta correction. | 1-10 | 0.1 |
Disclaimer/Publisher’s Note: The statements, opinions and data contained in all publications are solely those of the individual author(s) and contributor(s) and not of MDPI and/or the editor(s). MDPI and/or the editor(s) disclaim responsibility for any injury to people or property resulting from any ideas, methods, instructions or products referred to in the content. |
© 2024 by the authors. Licensee MDPI, Basel, Switzerland. This article is an open access article distributed under the terms and conditions of the Creative Commons Attribution (CC BY) license (http://creativecommons.org/licenses/by/4.0/).
Copyright: This open access article is published under a Creative Commons CC BY 4.0 license, which permit the free download, distribution, and reuse, provided that the author and preprint are cited in any reuse.