Submitted:
18 July 2024
Posted:
19 July 2024
Read the latest preprint version here
Abstract
The yield of logging in a forest management area using only the volume variable is not sufficient to assess effective wood productivity. The objective was to evaluate production using different logging variables to point out possible divergences between what was planned and what was actually carried out, in order to indicate adjustments to annual operating plans (AOPs) in the Amazon. The database comes from a community forest management area in the Tapajós National Forest, con-sidering three sources: 100% inventory, AOP planning and the post-exploration report. The pro-duction yield considering the number of trees felled and the effective volume were compared with the AOP planning. The volume estimated by the generic equation was compared with the cubed volume and the commercial height variable was evaluated. Of the 6,267 trees selected, 5,090 trees were harvested (3.2 trees.ha-1), indicating a yield of 85.0% of the estimated volume. Of the 25 commercial species logged, the most representative were: Manilkara huberi, Vochysia maxima, Lec-ythis lurida, Couratari guianensis and Hymenaea courbaril. It can be concluded that the number of trees, cubed volume and commercial height are post-exploration yield response variables and not just volume, as is currently used in SFMPs.
Keywords:
Community-Based Forest Management
; Annual Operating Plan
; Commercial Height
; Tapajós National Forest
1. Introduction
The Tapajós National Forest (better known by the name Flona Tapajós), is a Sustainable Use Conservation Unit that was created in 1974 with the basic objective of promoting the sustainable multiple use of forest resources and encouraging scientific research, with an emphasis on methods for the sustainable exploitation of native forests [1,2]. The first experiments with forest management in the Amazon were carried out in Flona Tapajós, one of them in 1999 to 2003 funded by ITTO (International Tropical Timber Organization) and DFID (UK Department for International Development) to subsidize a realistic low-impact logging venture under the coordination of Brazilian Institute of the Environment and Renewable Resources - IBAMA [2,3]. Another important experience was the experimental management at km 67 carried out by Embrapa Amazônia Oriental in 1979, which is one of the oldest study sites on the sustainability of timber forest management in the Amazon [4,5], and which was the first to carry out a second cycle of timber harvesting in 2014, after 35 years [5,6].
Currently, part of the Flona Tapajós is granted on a non-remunerative basis to the Tapajós Flona Mixed Cooperative - COOMFLONA (founded on February 16, 2005 by 24 cooperative members with the aim of managing the natural resources of the conservation unit, always valuing social and environmental issues) for timber harvesting [7,8]. COOMFLONA is made up of traditional residents who operate and manage full community forest management, bringing direct economic, ecological and social benefits to the cooperative members and indirectly to the communities that make up the inhabitants of Flona Tapajós [3].
Forest management is made up of a set of activities aimed at minimizing the impacts resulting from forest exploitation, with a view to making better use of timber and non-timber forest resources, maintaining forest cover and ensuring continuous production [9,10]. Its key principle is action planning (Reis et al., 2013), which ranges from pre-exploitation, exploitation to post-exploitation. It is a forest management activity that makes it possible to obtain economic, social and environmental benefits at the same time, as long as the ecosystem’s support mechanisms are respected [12,13].
The ordering and planning of annual production, considering the planned cutting cycle, is legally known as the annual operating plan (AOP). The AOP is based on the commercial stock of an Annual Production Unit (APU), presented after carrying out a 100% inventory of commercial species selected for exploitation [14,15]. It provides information on technical harvesting capacity, the number of trees per species and the estimated volume of standing timber [16]. Selective logging is planned by selecting trees that must have a diameter at breast height (DBH) equal to or greater than 50 cm as a minimum dimension [12,16,17] and a maximum diameter of 200 cm [17]. For this selection process, the restrictions described in the forestry legislation must be complied with, which generally stipulates a minimum of 3 to 4 trees per 100 ha and a maximum cutting intensity of 30 m³.ha-1 [12,16,17,18].
The volume of standing wood is, by definition, the most important variable in the process of defining production [19,20,21), especially of the stem, as it is the most highly valued commercial part of the tree [22]. For the first year of implementation of the Sustainable Forest Management Plan (SFMP), the volume of standing timber is obtained indirectly by applying the cylinder volume formula using the variables DBH and commercial height and using the shape factor of 0.7 to consider the taper of the trees [10,23,24]. After the first year of logging, SFMPs must present a specific equation for estimating the volume of standing timber [12]. Therefore, production is based on the estimated volume of standing timber, with the final report containing the actual volume, i.e., that which was harvested and transported, to be presented after logging [16,17]. Based on this information, it is possible to assess the yield or efficiency of the harvest in terms of volume [25].
In fact, whether using the shape factor or equations, volume can be underestimated or overestimated [10]. The main factors for this to happen are related to: i) errors in commercial height measurements/estimates [10,26], ii) the use of generic equations [10,27,28], iii) the occurrence of hollows, problems with the execution of logging techniques in the field [29,30,31,32,33], such as the direction in which the tree fell with a high impact [30] and annotation errors in the 100% inventory [34]. In view of this, post-exploration evaluation is an important tool for assessing the efficiency of the management carried out, and can point to indicators that were not sufficient or that need to be adjusted in the next planning stage, with a view to improving yield results.
Predominantly, the studies that partially address logging yield make a general assessment considering total volumes before and after the activity [32,35], not considering an assessment with the number of trees selected and felled. The hypothesis of this study is that a joint analysis between the variables volume and number of trees can indicate the effective yield, but also an evaluation of the efficiency of the volumetric equation. It is also possible to analyze the estimates and measurements of merchantable height and DBH in order to assess the consistency of this data, especially in relation to merchantable height because it is a difficult variable to obtain in natural forests [26,36,37], largely due to the difficulty of using sophisticated equipment in dense environments, leaving ocular estimation as the most common option [37]. However, there is no standardized way of evaluating post-exploitation production/yield, nor what indicators can be considered so that they can be implemented in future planning aimed at improving long-term production in forest management plans in the Amazon. In view of this, the aim of this study was to propose an analysis of production using different logging variables in order to point out possible discrepancies between what was planned and what was actually carried out, as well as to evaluate the results.
2. Materials and Methods
2.1. Study Area
The study area is located in Flona Tapajós, specifically in Annual Production Unit 9 (APU 9), which is part of the Community Forest Management (CFM) area that is under concession to COOMFLONA on a non-remunerative basis. APU 9 was logged in 2015 and has a total area of 1,600 ha which is subdivided into 15 work units (WUs), 10 of which were along km 67 of the BR 163 highway and 5 units along km 83. It is important to note that the Tapajós Flona is located in an area that has six altimetric elevation bands, but APU 9 is concentrated between 100 and 200 m (Figure 1).
COOMFLONA is a social organization currently made up of 313 cooperative members, who are residents of the Tapajós National Forest who directly manage the commercialization, financial and administrative aspects of forest management in this Sustainable Use Conservation Unit (UCS). The cooperative was created in 2005 with the support of the Pilot Program for the Protection of Tropical Forests (PPG7), better known by the acronym ProManejo/IBAMA, which was one of the projects funded to promote sustainable forest management in the Amazon [7].
As part of the strategies to train residents, 900 hectares of forest were initially managed, subdivided into three APUs of 100 hectares, 300 hectares and 500 hectares, with the costs of exploitation during this period being financed outright [7]. From 2009 onwards, the cooperative began to manage its activities with its own resources. Throughout the consolidation process, that is, overcoming the initial difficulties, COOMFLONA has already managed more than 12,000 hectares, equivalent to 15% of the total area available for forest management in the Tapajós Flona [38]. COOMFLONA exploits an average of 24 species every year [39] and its management model is currently a benchmark in Latin America, generating more than R$10 million a year in annual production areas ranging from 1,500 ha to 2,000 ha [38].
When evaluating the climatic variables in the study area, it can be seen that APU 9 falls into the Am3 climatic subtype, indicating that in the least rainy month the average rainfall totals are below 60 mm and the average annual rainfall varies between 2,000 mm and 2,500 mm. It is worth noting that in the northernmost part of the Flona the typology changes to subtype Am4, which is an indicator of reductions in annual rainfall [40]. The annual thermal regime, in terms of average air temperature, shows temperatures varying between 25.5°C and 27.0°C, and in APU 9 the thermal range of variation goes from 25.5°C to 26.5°C (Figure 2), indicating that these variations can help in the analysis of possible phenotypic expressions in a management area, as is the case with the APUs in the Flona Tapajós.
The predominant soils in the Flona Tapajós belong to the Latossols, Argisols and Arenosols classes, with topography varying from flat to undulating [41]. Flona Tapajós has typical vegetation of Submontane Ombrophilous Dense Forest, which predominates in the western region of the state of Pará [42], characterized by the occurrence of species of high commercial value, such as: Manilkara huberi (Ducke) Cheval. (maçaranduba); Dinizia excelsa Ducke (angelim); Mezilaurus itauba (Meisn.) Taub. Ex Mez (itaúba); Handroanthus serratifolius (Vahl) Nich. (ipê-amarelo) and Hymenaea courbaril L., (jatobá) [38].
2.2. Database
The data analyzed in this study came from three sources, provided by an institutional cooperation agreement: 1) 100% forest inventory; 2) production defined in the AOP and 3) post-exploration report. In this way, the method encompassed analysis from the selection of trees for felling to the actual data contained in the final logging activity report.
The 100% forest inventory carried out by COOMFLONA included 105 species of interest, either currently commercial or potential for the timber market. During the inventory, the Circumference at 1.30 m from the ground (CBH) was measured using a tape measure, the commercial height of the stem was estimated, up to the first insertion of the branches and the quality of the stem was classified into three categories: straight, slightly crooked and crooked. This data was recorded on field cards and tabulated on electronic spreadsheets for later analysis by the technical manager.
Based on the 100% inventory, the standing timber volume of each tree was estimated and the selection of trees to be logged was planned. This planning, which makes up the AOP, shows the volume values per species to be logged, the number of trees that can be logged and the trees selected for felling, according to the vernacular name inventoried (Table 1). The cutting intensity approved by the environmental agency in AOP 9 was 28.62 m³.ha-1, which was equivalent to an estimated harvest of 4.08 trees.ha-1.
In this POA, the species Hymenaea courbaril15 and Lecythis pisonis22 had a Minimum Cutting Diameter (MCD) ≥ 70 cm. Since the MCD was greater than 50 cm, a technical study was not required for these particularities [16,17]. However, under current legislation, the change to a MCD below 50 cm requires studies that observe the technical guidelines available, taking into account the diametric distribution from 10 cm DBH and other ecological characteristics that are relevant to their natural regeneration, in addition to their intended use [12,16,17].
Tree volume was estimated using the generic Equation (1) given in the AOP for APU 9, which was based on the Schumacher and Hall model:
where: - estimated volume with bark in m³, DBH - diameter at breast height in cm, H - commercial height in m and ln - neperian logarithm.
In addition to the trees selected, the POA also showed the number of trees that could be cut down. These trees can be selected a posteriori if they need to be replaced in the field, as there may be a prominent hollow that makes it impossible to cut down the previously selected tree. The hollow test was carried out in preparation for felling the tree, where the chainsaw operator inserted the saber at the cutting height, discarding those trees with a prominent hollow. In cases where the hollow was small, the tree could still be felled.
The post-exploration report included the volume actually logged. The effective volume is related to the cubing carried out in the storage yard based on the Smalian formula, taking into account the diameter at the ends of the log and its length, which varied by 5 m on average for each log, as follows:
where: - Smalian volume, in cubic meters; and - sectional areas at the ends of the log, in square meters and - length of the log in meters.
To analyze logging yield, we first calculated the Logging Yield in Volume () and Logging Yield in Number of Trees () indices by species, both based on the work carried out by [25]. The following expressions were used to calculate % and %:
where: – Volume actually logged; – Authorized Volume; – Number of Trees Logged; – Number of Trees Authorized.
Based on the volume and number of authorized trees, as well as the effective volume and number of trees felled per species, we applied a t-test with a 95% probability to check that what was planned in the AOP was statistically the same as what was carried out.
In addition, we carried out a more detailed volumetric analysis with the felled trees, in which case we used the paired t-test with a 95% probability to check the difference between the volume estimated by the generic AOP equation and the volume measured in the field, in the hypothesis of attesting to the efficiency of the equation among the species logged.
Finally, we evaluated the commercial height variable estimated in the inventory with the commercial height based on the sum of the logs of each tree felled, the latter being considered the “real” commercial height. To ascertain the difference between them and their impact on the volumetric estimate, we applied a paired t-test with a 95% probability. The following expression was used to calculate the difference:
where: - difference in merchantable height; - merchantable height from the sum of the logs per tree; - merchantable height estimated in the forest inventory.
The data was tabulated and organized in an Excel spreadsheet and the statistics were processed in SAS.
3. Results
The results showed that in the 100% inventory 26,097 trees with DBH ≥ 35 cm were recorded, distributed among 99 species. The five species with the highest number of trees recorded were: Lecythis lurida (11.4%), Manilkara huberi (8.7%), Vochysia maxima (7.9%), Couratari guianensis (7.0%), and Carapa guianensis (5.4%). Of these species, only Carapa guianensis was not included in the list for timber harvesting, as in COOMFLONA’s Management Plan it is intended for non-timber use.
When planning the AOP, 6,267 trees were previously selected for felling, representing 19.5% of the entire 100% inventory. Of the 25 commercial species, Manilkara huberi, Vochysia maxima, Lecythis lurida, Couratari guianensis and Hymenaea courbaril stood out as representing 56.7% of the number of trees selected for felling and consequently 60% of the estimated volume.
After logging, 5,090 trees were felled over the 1,600 ha, representing an average of 3.2 trees per hectare. The effective volume was 37,331.031 m³, which corresponded to 85.0% of the volume estimated during the forest management planning phase (Figure 3).
The species that achieved logging values close to the planned volume and number of trees felled were: Hymenolobium petraeum1, Cedrelinga catenaeformis4, Dipteryx odorata6, Vatairea paraensis7, Parkia multijuga10, Handroanthus serratifolius12, Lecythis lurida14, Hymenaea courbaril15, Vochysia maxima21, Bagassa guianensis23 and Couratari guianensis24. These showed a yield of 85% in volume and 75% of trees felled, respectively. It should also be noted that these species together accounted for 69.3% of the effective volume in the APU area.
The species with the biggest discrepancies between plan and execution were: Cedrela odorata3, Terminalia dichotoma5 and Pseudopiptadenia psilostachya9. However, these species together accounted for only 2.9% of the APU’s effective volume. The other species accounted for between 55% and 85%, both in terms of volume and number of trees felled.
Considering the statistical analysis using the t-test at 95% probability, a significant difference was found (p-value < 0.05), both for the number of trees authorized and felled, as well as for the volume authorized and the effective volume. In general, there was a difference between the volume and number of trees planned in the AOP and the number of trees and volume logged in the actual harvest, as shown in the post-exploration report.
Table 2 lists the statistics by species using the paired t-test with 95% probability. In this evaluation, the trees that were felled were analyzed using the volume estimated by the AOP equation, with the volume cubed after logging.
Of the 25 species logged, 10 had statistically similar authorized and cubed volumes using the paired t-test with 5% significance and 15 had different volumes. In general, the generic equation used in AOP 9 tended to underestimate most of the species logged.
There were differences in the commercial heights of most of the trees. Of the 5,090 trees felled, 2,884 trees (56.7%) had their commercial height underestimated, with an average error of 3.7 meters, which represented 20.7% of the average commercial height. For 2,165 trees (42.5%) there was an overestimation of commercial height with an average error of 3.8 meters, which represented 17.4% in relation to the average commercial height. Figure 4 shows that, in general, inventory estimation errors did occur, but they tended to be greater at the ends of the height classes, with the smallest being overestimated and the largest underestimated.
Estimated merchantable heights and merchantable heights based on log measurements were statistically different using the paired t-test at 5% significance (p-value = 0.000012).
4. Discussion
In the APU analyzed, 25 species were on the list for exploitation out of a total of 99 species recorded in the census. This number, however, is in line with the average number of species managed annually by COOMFLONA, which is 24 species, according to a study by [39]. In a study with data from forestry enterprises in Amazonas and Rondônia, one of which is owned by a private company and the other by a concession in a public area, 78 and 139 species were recorded in the census, respectively, and 47 and 38 species were defined for felling [35]. The studies by [14], evaluating five APUs in the Jamari National Forest, found that an average of 79 species (±27.3 species) had been inventoried in the census, of which 37% were only indicated for logging. However, it is important to mention that the management areas were not equal in size and stock.
Considering the typology of Amazonian forests, where the greatest diversity of tree species is found in the tropics [43], it is not difficult to find a significant number of species in the census, the main source for planning the production of a forestry enterprise [11]. However, for harvesting, the selection of species is consequently reduced due to compliance with the cutting intensity restriction, which is limited to 30 m³.ha-1 and also by the consumer market
Although the number of species to be logged was considerably high in the study area, the species Manilkara huberi18, Vochysia maxima21, Lecythis lurida14, Couratari guianensis24 and Hymenaea courbaril15 accounted for 60% of the entire planned volume. Although this was due to the consumer market, since M. huberi18 and H. courbaril15 were among the most exploited species in the state of Pará between 2006 and 2016 [44,45], these species also have a high stock in the Flona Tapajós. However, it is important to evaluate post-exploitation yields, not only in general, but also at the species level, in order to have a list of the best performers and make adjustments to those with low yields.
The overall logging yield in APU 9 was 80% higher, taking into account both the number of trees felled and the actual volume logged. In a study comparing the operational efficiency of logging between a private area in Amazonas and a public one in Rondônia, [35] recorded an average yield in volume of 84.7% compared to what was planned in both locations.
In the state of Pará, 85 licensed management plans were evaluated [25], which were divided into three different categories (private, public and community), obtaining the following average volume yields of 90.54% (private areas), 61.77% (public concession areas) and 91.19% (community domain areas). Although the average volume yield in public concession areas was below the averages of the other categories analyzed, there were plans that achieved yields of over 80%, but most were below 60%, justifying the average presented [25]. Analyzing logging yields due to the presence of hollows in a logging area in the Saracá-Taquera National Forest, [32] reported a net volume yield of 78.9%, largely due to the number of trees that were replaced.
In Flona Tapajós, analyzing some studies developed with logging data, it is possible to observe differences in yield. Analyzing data from 36 species logged in the second cycle at the Embrapa experimental site, [46] recorded a 61.84% yield in volume. Evaluating the efficiency of volume estimation in an APU in 2014, [26] found a yield of 84.04%. In an analysis of 10 years (2007 to 2016) of exploration activities at COOMFLONA, [39] found an average yield of 73%. It is important to note that the differences between the volumetric yields were related to different causes, including the presence of hollow trees with a low number of replaceable trees [32,46], technical issues involving felling direction, estimation of commercial height [26].
Although some situations in the field cannot be controlled, making a post-exploration diagnosis is important because we have the possibility of maintaining what was positive, implementing a new methodology or a negative factor to improve decision-making for future planning. For example, in situations where the presence of hollows is an intrinsic characteristic of a species due to the type of soil it is found in, this species can be removed from the exploration list for a future plan [31]. In a more generalized situation based on the set of trees, [35] and [10] point out that this issue could be improved by identifying hollow trees before planning the harvest, i.e., during the census, but that this is still a challenge to implement, given that the hollow test as it is carried out today is not efficient [31].
Predominantly, the studies on yield that have been presented have made a general analysis considering all species and focusing mainly on the volume variable to define harvest yield, without taking into account the number of trees felled. In this study, the number of trees was evaluated together with volume to show that the relationship between these variables facilitates the analysis of the tendency to underestimate or overestimate a volumetric equation. In Figure 2, for example, it can be seen that C. catenaeformis4, P. multijuga10, and V. maxima21 reached almost 100% of their volume with approximately 80% of the trees selected for felling, i.e., there was an overestimation of the generic AOP equation for these species. In the case of A. lecointei20 and M. huberi18, there was a tendency to underestimate, since the yield in the number of trees felled was higher than the effective volume. In a study in the Saracá-Taquera National Forest where [32] evaluated the impact of hollowing on volumetric yield, they found the highest net volumetric yield for Hymenaea excelsum (99.7%), followed by Couratari guianensis (99.6%), Caryocar villosum (97.4%) and Manilkara elata (76.2%).
In the statistical evaluation of these yields, both in terms of number of trees and volume, the t-test showed a significant difference between what was planned and what was actually harvested, even though the overall yield percentage was over 80%. This may have been due to the low yields of C. odorata3, T. dichotoma5 and P. psilostachya9. The low yields of these species were related to volumetric underestimation of the equation and the high frequency of hollow trees. In a study on the quality of logging, [30] also found a high rate of hollowing in P. psilostachya. Species with low yields in the post-exploration analysis should be evaluated carefully when planning the next exploration, leaving them in second priority. On the other hand, species with high yields will be given priority in the next planning, with the proviso that maintenance restrictions must be met and the concentration of trees assessed in order to avoid large clearings in the forest.
For most species, the generic equation used by AOP 9 underestimated the volume, which was already expected according to studies by [10,24,28,47], since the existence of variability in the shape of the stems has a significant impact on determining the volume exploited. This makes it necessary to use specific equations in future plans, or at least for groups of species with similar phenotypic characteristics, as these reduce the variability between species and improve accuracy [10,27,47,48].
Commercial height is a variable that is difficult to measure in tropical forests, due to the operational difficulty of using hypsometers, leaving eye estimation as the most used option in inventories [37]. In this study we found a difference of over 15% in the heights when compared to field measurements. This result does not differ much from [26], who found an average error of 18.93% in Flona Tapajós and [10] with underestimation errors of 22% in commercial height in a concession forest in the state of Pará. In fact, these differences may interfere with the accuracy of the double entry equation, but without this variable the volumetric adjustments are not good. It is therefore necessary to continually evaluate this variable in order to try to reduce the difference between what is estimated in the field, in line with the recommendations already mentioned in the works by [26,37,49,50], who concluded that well-trained teams can obtain a good estimate when taking height, but even so in larger trees there is a greater tendency for errors. An alternative would be to adjust a hypsometric equation [10], where DBH is used as an independent variable to estimate height, but the heterogeneity of natural forests [51] prevents good results, becoming a limiting factor in obtaining a good fit. It is therefore necessary to find strategies that can be effective for this problem in natural forests.
5. Conclusions
The post-harvest analysis with different variables proved to be more reliable for assessing the yield of forest management in Flona Tapajós.
Timber yields that only consider volume tend to omit possible adjustments that could improve the planning of timber harvesting in the area to be logged.
It is important to look for statistically possible alternatives or strategies for using commercial height in natural forests.
Author Contributions
Conceptualization, R.B.S.R and L.G.M,; preparation of maps and characterization of climatic conditions L.G.M and L.S.S.L; methodology, R.B.S.R. and L.G.M.; investigation, R.B.S.R., L.G.M. and L.S.S.L.; writing—original draft preparation, R.B.S.R.; writing—review and editing, L.G.M., C.T.S.D., A.H.M.O., D.F.C.A and E.J.G.A.; supervision, L.G.M.; project administration, R.B.S.R. and L.G.M. All authors have read and agreed to the published version of the manuscript.
Funding
This research received no external funding.
Data Availability Statement
Data are contained within the article and are also available from the corresponding author.
Acknowledgments
To Professor Dr. João Ricardo Vasconcellos Gama (in memorian) for initial contributions to this study; To COOMFLONA for providing data for this research; To the Postgraduate Program in Society, Nature and Development at the Federal University of Western Pará.
Conflicts of Interest
The authors declare no conflicts of interest.
References
- Brasil., 2000. Lei Federal N. 9.985, de 18 de julho de 2000. https://www.planalto.gov.br/ccivil_03/LEIS/L9985.htm (accessed in 05 April 2024).
- Bacha, C.J.C.; Rodriguez, L.C.E. Profitability and social impacts of reduced impact logging in the Tapajós National Forest, Brazil – A case study. Ecological Economics 2007, 63, 70–73. [Google Scholar] [CrossRef]
- Humphries, J.; Holmes, T.P.; Kainer, K.; Koury, C.G.G.; Cruz, E.; Rocha, R.M. Are community-based forest enterprises in the tropics financially viable? Case studies from the Brazilian Amazon. Ecological Economics 2012, 77, 62–73. [Google Scholar] [CrossRef]
- Higuchi, N.; Santos, J.; Lima, A.J.N.; Higuchi, F.G.; Silva, R.P.; Souza, C.A.S.; Pinto, F.R.; Teixeira, L.M.; Carneiro, M.C.; Silva, S.R. Perspectivas do manejo florestal sustentável para a Amazônia brasileira. Hiléia—Rev. Direito Ambient. Amaz. 2007, 8, 78–93. [Google Scholar]
- Mazzei, L.; Ruschel, A. Estoque comercial para o segundo ciclo de corte na Floresta Nacional do Tapajós—Área experimental km 67—Embrapa, Anais do II Seminário de Pesquisa Científica da Floresta Nacional do Tapajós; ICMBio: Belém, Brasil, 2014; pp. 161–166. [Google Scholar]
- Rodrigues, M.I.; Souza, A.N.; Mazzei, L.; Silva, J.N.M.; Joaquim, M.S.; Pereira, R.S.; Biali, L.J.; Rodriguez, D.R.O.; Lustosa-Junior, I.M. Financial variability of the second cutting of forest management in Tapajós National Forest, Brazil. Forest Policy and Economics 2022, 136, 102694. [Google Scholar] [CrossRef]
- Ferreira-Neto, P.S. Projeto Ambé: Manejando a Floresta e Colhendo Conhecimentos, 1°ed.; Ministério do Meio Ambiente: Brasília, Brasil, 2008; p. 85. [Google Scholar]
- Espada, A.L.V.; Sobrinho, M.V. Logging Community-Based Forest in the Amazon: An Analysis of External Influences, Multi-Partner Governance, and Resilience. Forests 2019, 10, 461. [Google Scholar] [CrossRef]
- Angelo, H.; Silva, J.C.; Almeida, A.N.; Pompermayer, R.S. Análise estratégica do Manejo Florestal na Amazônia Brasileira. Floresta 2014, 44(3), 341–348. [Google Scholar]
- Cardoso, R.M.; Miguel, E.P.; Souza, H.J.; Souza, A.N.; Nascimento, R.G.M. Wood volume is overestimated in the Brazilian Amazon: Why not use generic volume prediction methods in tropical forest management? Journal of Environmental Management 2024, 350, 119593. [Google Scholar] [CrossRef] [PubMed]
- Reis, S.L.; Couto, C.S.; Pinheiro, C.S.; Espada, A.L.V.; Lima, J.A.; Lentini, M.W. Técnicas pré-exploratórias para o planejamento da Exploração de Impacto Reduzido no Manejo Florestal Comunitário e Familiar (Manual Técnico), 1a ed.; Instituto Floresta Tropical: Belém, Brasil, 2013; p. 148. [Google Scholar]
- Brasil., 2009. Resolução Conama N. 406, de 02 de fevereiro de 2009. https://www.normasbrasil.com.br/norma/?id=110471 (accessed in 01 February 2024).
- Brasil., 2012. Lei Federal N. 12.651, de 25 de maio de 2012. https://www.planalto.gov.br/ccivil_03/_ato2011-2014/2012/lei/l12651.htm (accessed in 01 February 2024).
- Biazatti, S.C.; Mora, R.; Sccoti, M.S.V.; Brito-Júnior, J.F.; Souza, L.A.; Souza, L. Planning and forest production in concession area in the western Amazon. Brazilian Journal of Development 2019, 5(7), 8938–8953. [Google Scholar] [CrossRef]
- Romero, F.M.B.; Jacovine, L.A.G.; Ribeiro, S.C.; Torres, C.M.M.E.; Silva, L.F.; Gaspar, R.O.; Rocha, S.J.S.S.; Staudhammer, C.L.; Fearnside, P.M. Allometric equations for volume, biomass and carbon in commercial stems harvested in a managed forest in the southwestern Amazon: A case study. Forests 2020, 11, 874. [Google Scholar] [CrossRef]
- Brasil., 2006. Instrução Normativa Ministério do Meio Ambiente N. 5, de 11 de dezembro de 2006. http://www.diariodasleis.com.br/busca/exibelink.php?numlink=216088 (accessed in 22 October 2023).
- Semas – Secretaria de Meio Ambiente e Sustentabilidade do Estado do Pará., 2015. Instrução Normativa N. 5, de 10 de setembro de 2015. https://www.legisweb.com.br/legislacao/?id=303363 (accessed in 22 October 2023).
- Brasil., 2015. Instrução Normativa Ministério do Meio Ambiente N. 1, de 12 de fevereiro de 2015. http://pesquisa.in.gov.br/imprensa/jsp/visualiza/index.jsp?data=13/02/2015&jornal=1&pagina=67&totalArquivos=304 (accessed in 05 April 2024).
- Thomas, C.; Andrade, C.M.; Schneider, P.R.; Finger, C.A.G. Comparação de equações volumétricas ajustadas com dados de cubagem e análise de tronco. Ciência Florestal 2006, 16(3), 319-327.
- Colpini, C.; Travagin, D.P.; Soares, T.S.; Silva, V.S.M. Determinação do volume, do fator de forma e da porcentagem de casca de árvores individuais em uma Floresta Ombrófila Aberta na região noroeste de Mato Grosso. Acta Amazonica 2009, 39(1), 97–104. [Google Scholar] [CrossRef]
- Leão, F.M.; Nascimento, R.G.M.; Emmert, F.; Santos, G.G.A.; Caldeira, N.A.M.; Miranda, I.S. How many trees are necessary to fit an accurate volume model for the Amazon forest? A site-dependent analysis. Forest Ecology and Management 2021, 480, 118652. [Google Scholar] [CrossRef]
- Silva-Ribeiro, R.B.; Gama, J.R.V.; Souza, A.L.; Leite, H.G.; Soares, C.P.B.; Silva, G.F. Métodos para estimar o volume de fustes e galhos na Floresta Nacional do Tapajós. Revista Árvore 2016, 40(1), 81-88.
- Heinsdijk, D.; Bastos, A.M. Inventários florestais na Amazônia. Boletim do Serviço Florestal n. 6, Ministério da Agricultura: Rio de Janeiro, Brasil, 1963; pp. 100.
- Lanssanova, L.R.; Silva, F.A.; Schons, C.T.; Pereira, A.C.S. Comparação entre diferentes métodos para estimativa volumétrica de espécies comerciais da Amazônia. BIOFIX Scientific Journal 2018, 3(1), 109–115. [Google Scholar] [CrossRef]
- Pereira, D.C.P.; Ruschel, A.R.; Pereira-Junior, R.A.; Silva, U.S.C. The use of volume yield and the number of trees to control forest management operations and combat illegal harvesting. Journal of Agricultural Science 2022, 14, 142–156. [Google Scholar] [CrossRef]
- Gomes, K.M.A.; Silva-Ribeiro, R.B.; Gama, J.R.V.; Andrade, D.F.C. Eficiência na estimativa volumétrica de madeira na Floresta Nacional do Tapajós. Nativa 2018, 6(2), 170–176. [Google Scholar] [CrossRef]
- Akindele, S.O.; LeMay, V.M. Development of tree volume equations for common timber species in the tropical rain forest area of Nigeria. Forest Ecology and Management 2006, 226, 41–46. [Google Scholar] [CrossRef]
- Cysneiros, V.C.; Pelissari, A.L.; Machado, S.A.; Figueiredo-Filho, A.; Souza, L. Modelos genéricos e específicos para estimativa do volume comercial em uma floresta sob concessão na Amazônia. Scientia Forestalis 2017, 45(114), 295–304. [Google Scholar] [CrossRef]
- Nogueira, E.M.; Nelson, B.W. Fearnside, P.M. Volume and biomass of trees in central Amazonia: influence of irregularly shaped and hollow trunks. Forest Ecology and Management 2006, 227, 14–21. [Google Scholar] [CrossRef]
- Ferreira, J.E.S.; Paraense, V.C. Controle de qualidade no processo de derruba em área de manejo florestal comunitário no Projeto de Desenvolvimento Sustentável Virola Jatobá, Anapú – PA. Observatorio de la economia latinoamericana 2016, 9p. [Google Scholar]
- Medeiros, S.H.S.; Nascimento, C.C.; Oliveira, B.R.; Souza, M.A.S.; Barros, F.B. Diagnosis of hollow trees in an area of effective sustainable forest management in the Amazon forest. International Journal for Innovation Education and Research 2021, 9(1), 527–539. [Google Scholar] [CrossRef]
- Almeida, V.B.; Silva, J.N.M.; Steinbrenner, M.K.A. Impacto da ocorrência de árvores ocas no rendimento da colheita de madeira na Floresta Nacional de Saracá-Taquera, Pará. Pesq. flor. bras. 2022, 42, 1–12. [Google Scholar] [CrossRef]
- Santos, M.F.; Figueiredo-Filho, A.; Gama, J.R.V.; Retslaff, F.A.S.; Costa, D.L. Evaluation of the occurrence of hollow in trees in managed forest in the Eastern Brazilian Amazon. Forest Science 2023, 69, 397–414. [Google Scholar] [CrossRef]
- Brancalion, P.H.S.; Almeida, D.R.A.; Vidal, E.; Molin, P.G.; Sontag, V.E.; Souza, S.E.X.F.; Schulze, M.D. Fake legal logging in the Brazilian Amazon. Science Advances 2018, 4(8), eaat1192. [Google Scholar] [CrossRef] [PubMed]
- Emmert, F. Combinação de dados de campo e métodos computacionais para o planejamento da exploração florestal na Amazônia. Doutorado em Ciências Florestais, Universidade de Brasília, Brasília, 2014.
- Segura, M.; Kanninen, M. Allometric models for tree volume and total aboveground biomass in a Tropical Humid Forest in Costa Rica. Biotropica 2005, 37(1), 2–8. [Google Scholar] [CrossRef]
- Curto, R.A.; Silva, G.F.; Soares, C.P.B.; Martins, L.T.; David, H.C. Métodos de estimação de altura de árvores em Floresta Estacional Semidecidual. Floresta 2013, 45(1), 105–116. [Google Scholar] [CrossRef]
- Andrade, D.F.C.; Braga, C.R.; Silva, J.R.; Chaves, A.R.S. Do mil ao milhão: Estudo de caso do Manejo Florestal Comunitário na Floresta Nacional do Tapajós. Biodiversidade Brasileira 2022, 12, 5–17. [Google Scholar]
- Almeida, B.R.S.; Melo, L.O.; Cruz, G.S.; Melo, M.S.; Santos, M.F.; Nicoletti, M.F.; Ribeiro, R.B.S. Índices de produtividade em uma área de manejo florestal comunitário na Amazônia brasileira. Adv. For. Sci. 2021, 8(1), 1271–1278. [Google Scholar] [CrossRef]
- Martorano, L.G.; Soares, W.B.; Moraes, J.R.S.C.; Nascimento, W.; Aparecido, L.E.O.; Villa, P.M. Climatology of Air Temperature in Belterra: Thermal Regulation Ecosystem Services Provided by the Tapajós National Forest in the Amazon. Rev. Bras. Meteorologia 2021, 36, 327–337. [Google Scholar] [CrossRef]
- Instituto Chico Mendes de Conservação da Biodiversidade – ICMBio. Plano de Manejo Floresta Nacional do Tapajós – Volume I – Diagnóstico, 1°ed.; Ministério do Meio Ambiente: Brasília, Brasil, 2019; p. 316. [Google Scholar]
- Instituto Brasileiro de Geografia e Estatística – IBGE. Manual técnico da vegetação brasileira, 2°ed.: Ministério do Planejamento, Orçamento e Gestão: Brasília, Brasil, 2012; pp. 272.
- Cysneiros, V.C.; Mendonça-Júnior, J.O.; Lanza, T.R.; Moraes, J.C.R.; Samor, O.J.M. Espécies madeireiras da Amazônia: riqueza, nomes populares e suas peculiaridades. Pesq. flor. bras. 2018, 38, e201801567. [Google Scholar] [CrossRef]
- Santana, A.C.; Santos, M.A.S.; Santana, A.L.; Yared, A.G. O valor econômico da extração manejada de madeira no Baixo Amazonas, Estado do Pará. Revista Árvore 2012, 36(3), 527-536.
- Conceição, A.K.C.; Lira, A.G.S.; Sousa, L.M.R.; Maestri, M.P.; Aquino, M.G.C. Exploração e valorização em tora de 10 espécies florestais no Baixo Amazonas, Estado do Pará, entre 2006-2016. Enciclopédia Biosfera 2020, 17(31), 80-86.
- Buchmann, H.M. Exploração Florestal e seus impactos em áreas de primeiro e segundo ciclo de corte do manejo florestal na Amazônia Oriental, Brasil. Mestrado em Ciências Florestais, Universidade de Brasília, Brasília, 2016.
- Santos, M.F.; Gama, J.R.V.; Costa, D.L.; Figueiredo-Filho, A.; Gomes, K.M.A.; Leite, R.S.; Dias, A.N. Generic and specific volumetric equations for individual trees in the Tapajós National Forest, Eastern Amazon. Revista Brasileira de Ciências Agrárias 2021, 16(1), e8527.
- Lima, G.A.; Silva-Ribeiro, R.B.; Gomes, K.M.A.; Ximenes, L.C.; Cruz, G.S. Ajuste volumétrico por grupo e para 24 espécies comerciais em uma área de manejo florestal comunitário. Rev. Agro. Amb. 2022, 15(2), 497–505. [Google Scholar] [CrossRef]
- Bechtold, W.A.; Zarnoch, S.J.; Burkman, W.G. Comparisons of modeled height predictions to ocular height estimates. South. J. Appl. For. 1998, 22(4), 216–221. [Google Scholar] [CrossRef]
- Silva, G.F.; Curto, R.A.; Soares, C.P.B.; Piassi, L.C. Avaliação de métodos de medição de altura em florestas naturais. Revista Árvore 2012, 36(2), 341-348.
- Oliveira, A.H.M.; Freitas, L.J.M.; Magliano, M.M.; Chaves, J.H.; Dias, C.T.S.; Martorano, L.G. Spatio-Temporal Assessment of Heterogeneity by Logging Intensity in a Federal Concession Area in the Brazilian Amazon. Forests 2024, 15, 1062. [Google Scholar] [CrossRef]
Figure 1.
– Location of Annual Production Unit 9 in the Tapajós National Forest.

Figure 2.
– Climatic typology of the Legal Amazon in which APU 09 is located in the Tapajós National Forest.
Figure 2.
– Climatic typology of the Legal Amazon in which APU 09 is located in the Tapajós National Forest.
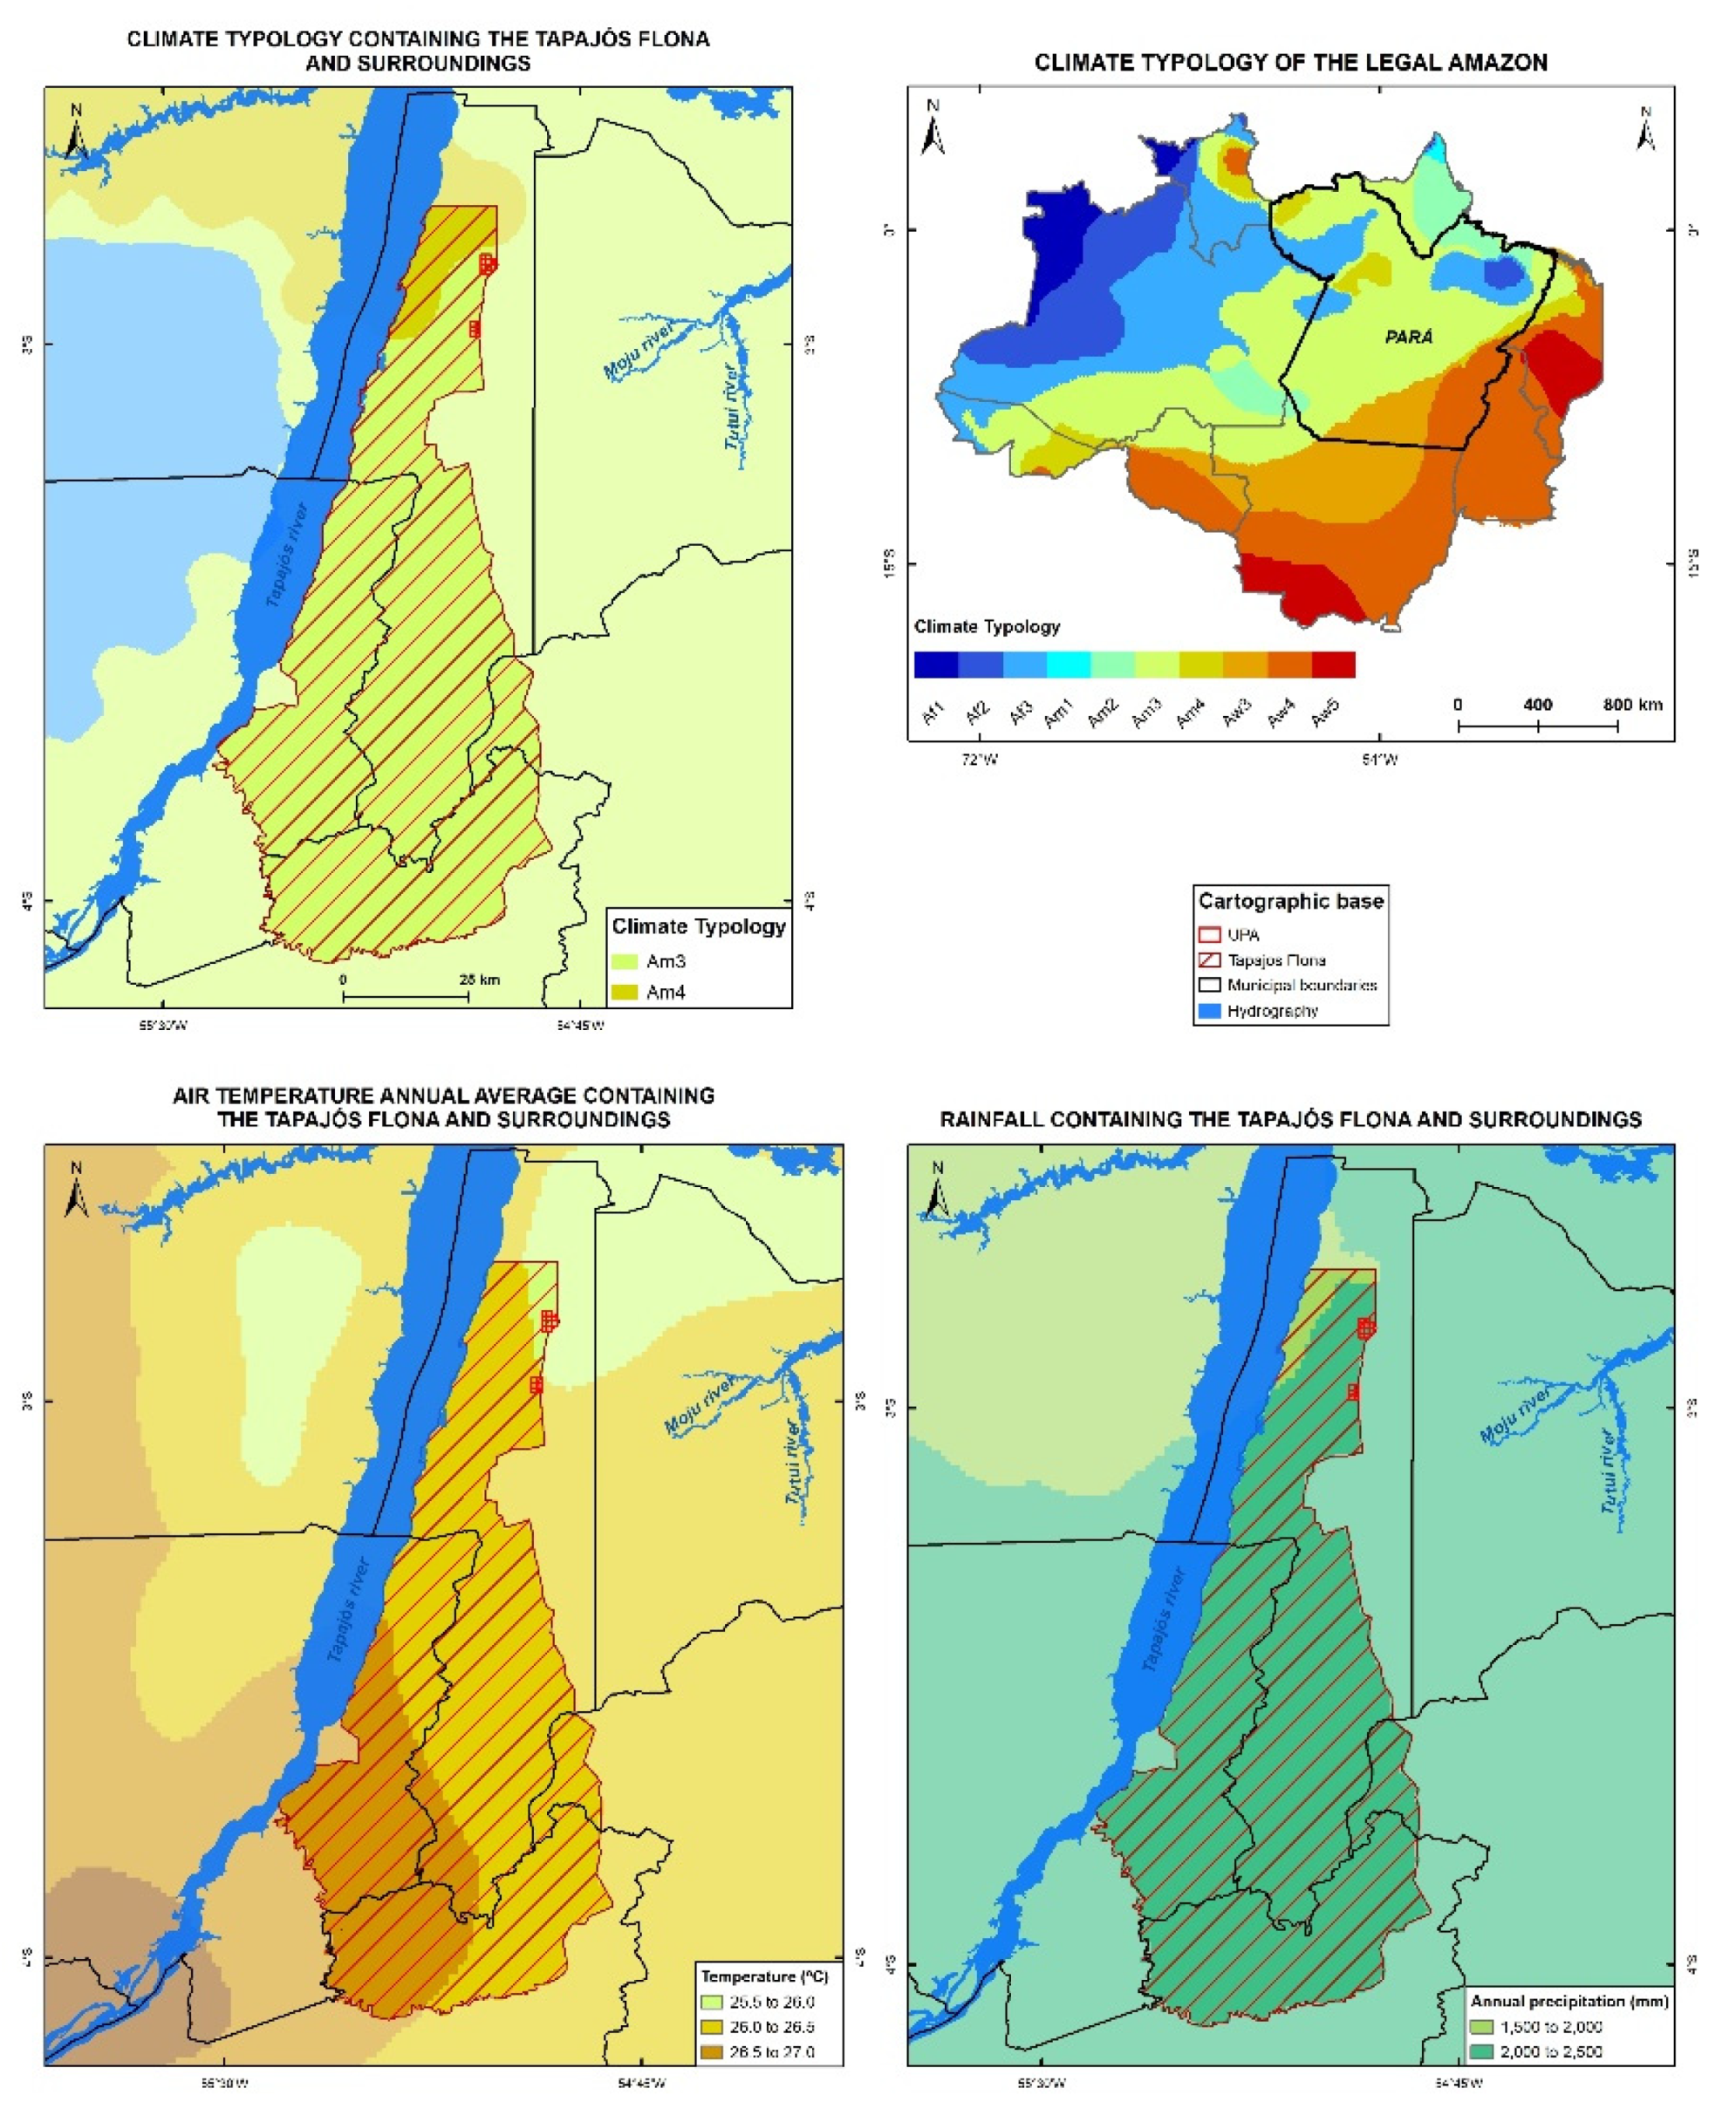
Figure 3.
- Forestry yield indices by species. Where IREFna% - Logging Yield Index in number of trees and IREFvol% - Logging Yield Index in volume.
Figure 3.
- Forestry yield indices by species. Where IREFna% - Logging Yield Index in number of trees and IREFvol% - Logging Yield Index in volume.
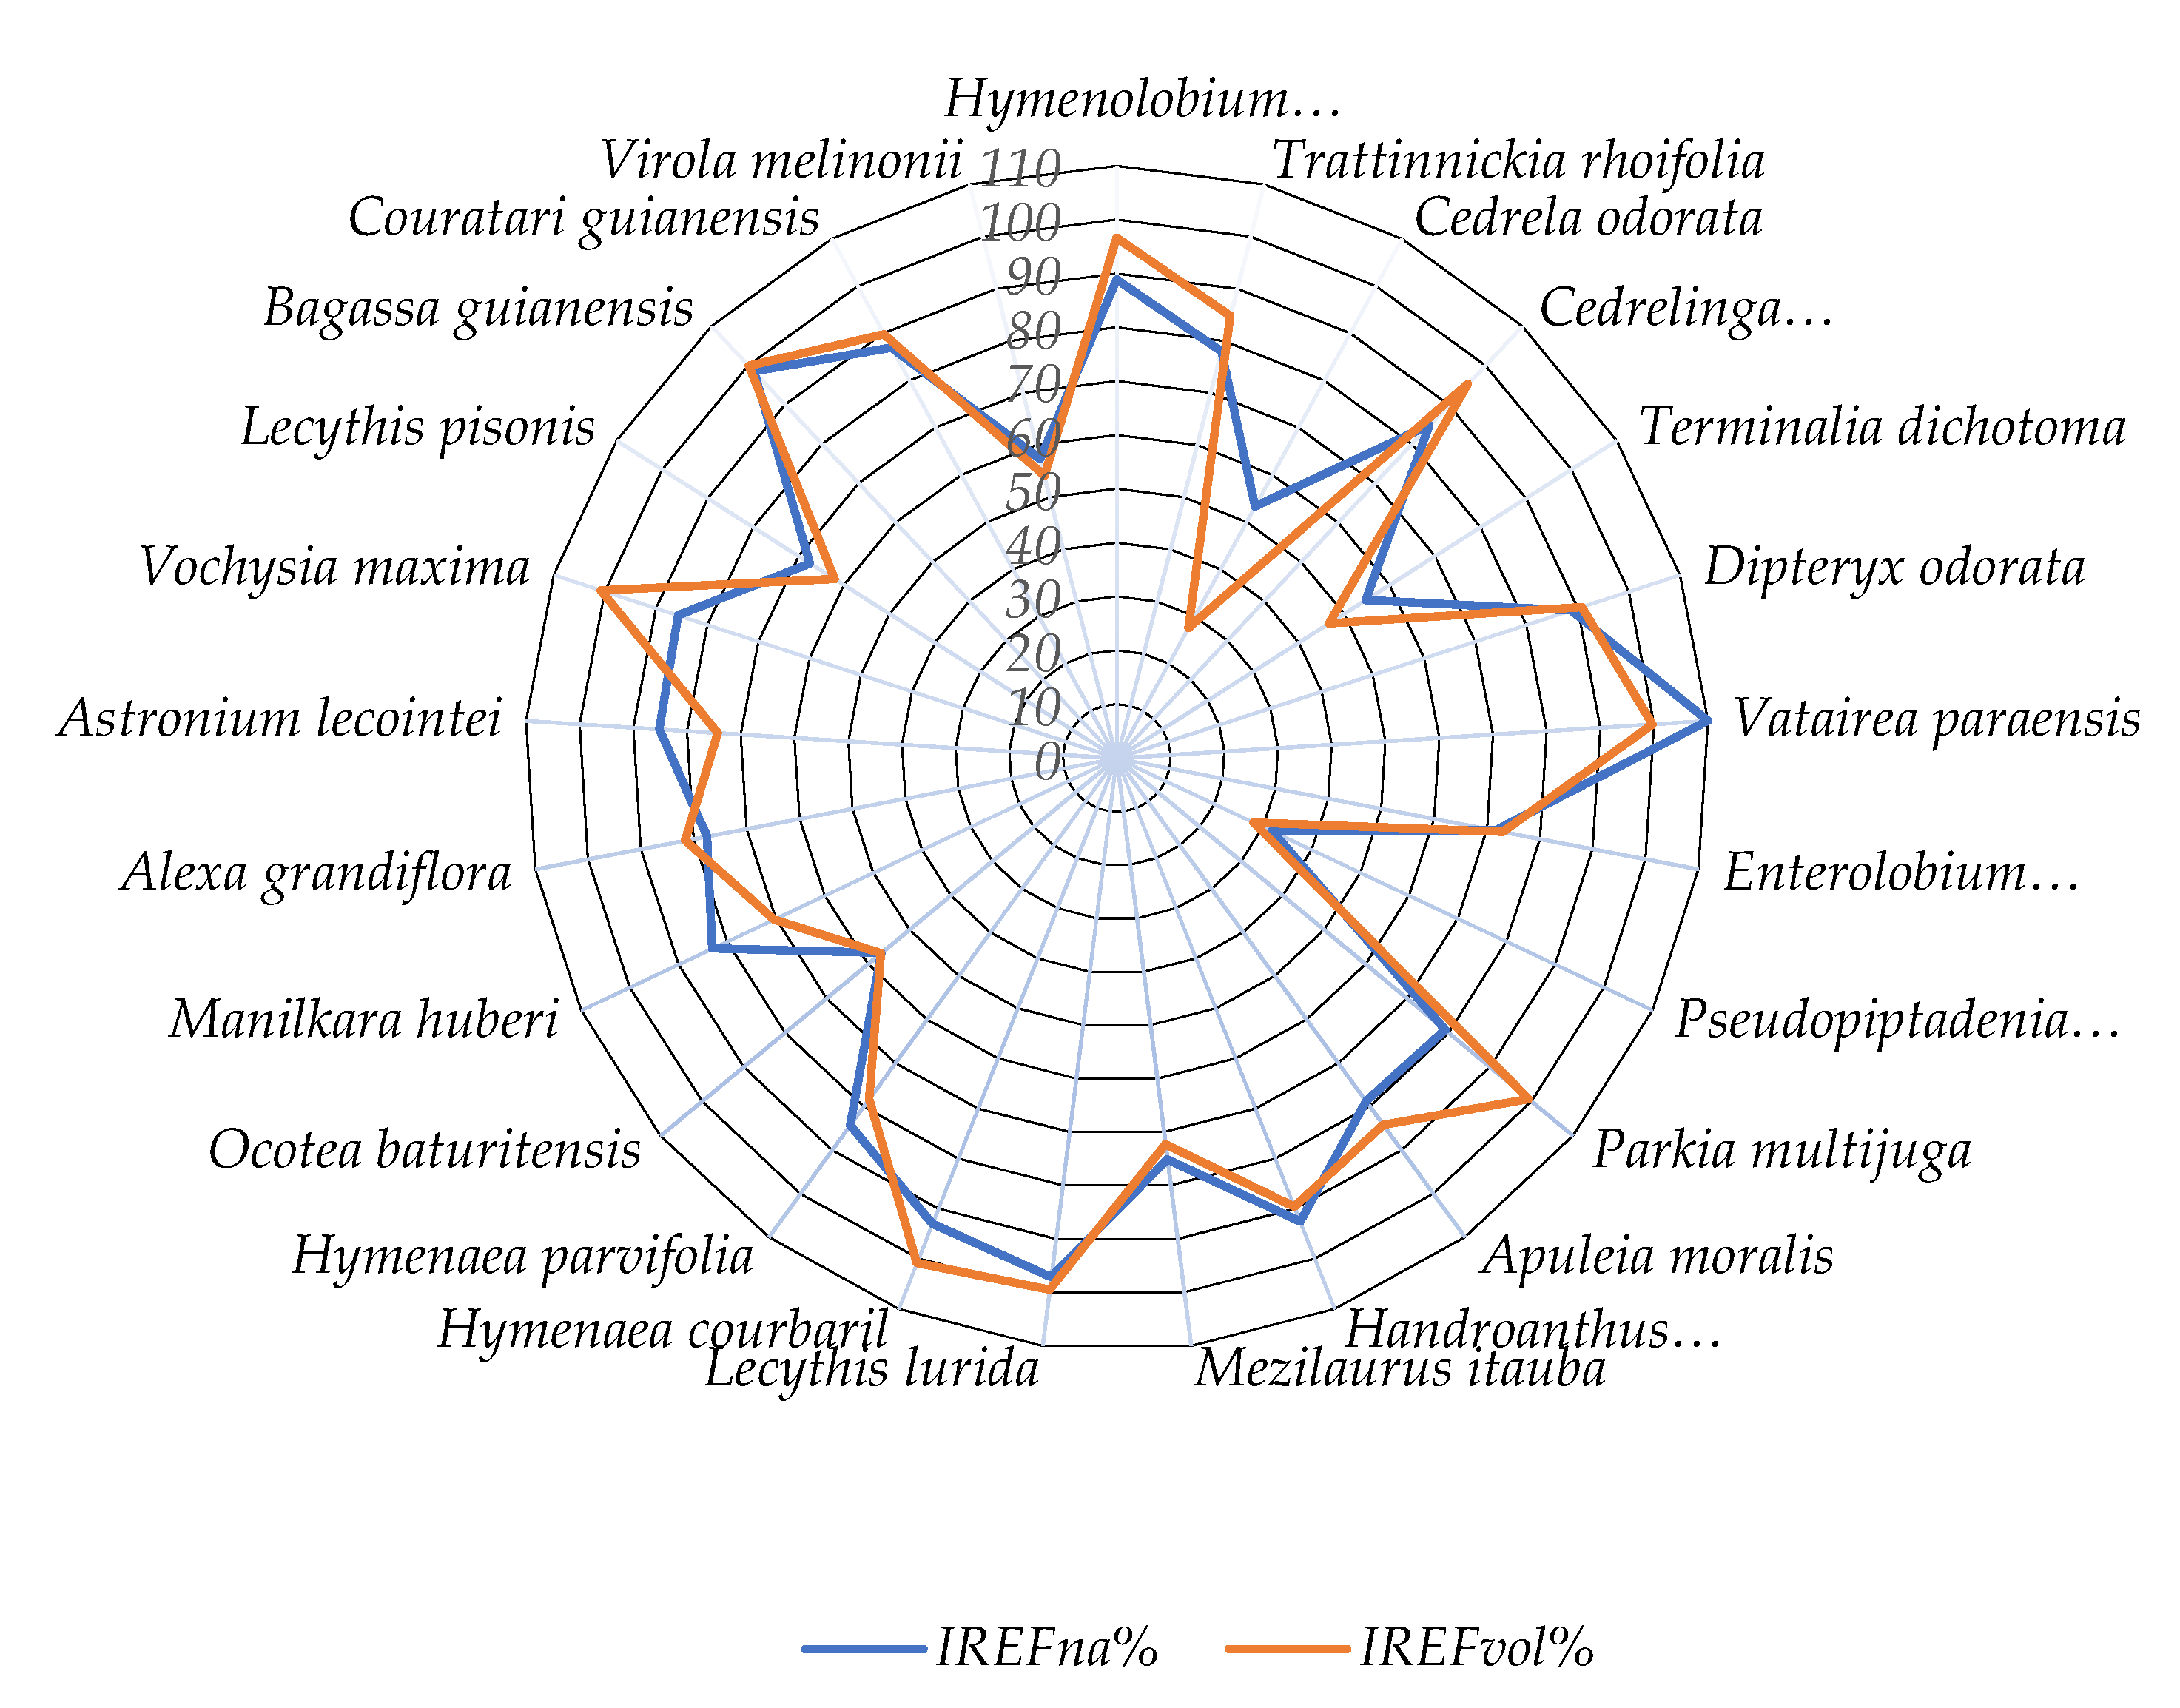
Figure 4.
- Distribution of commercial height errors by commercial height class center.
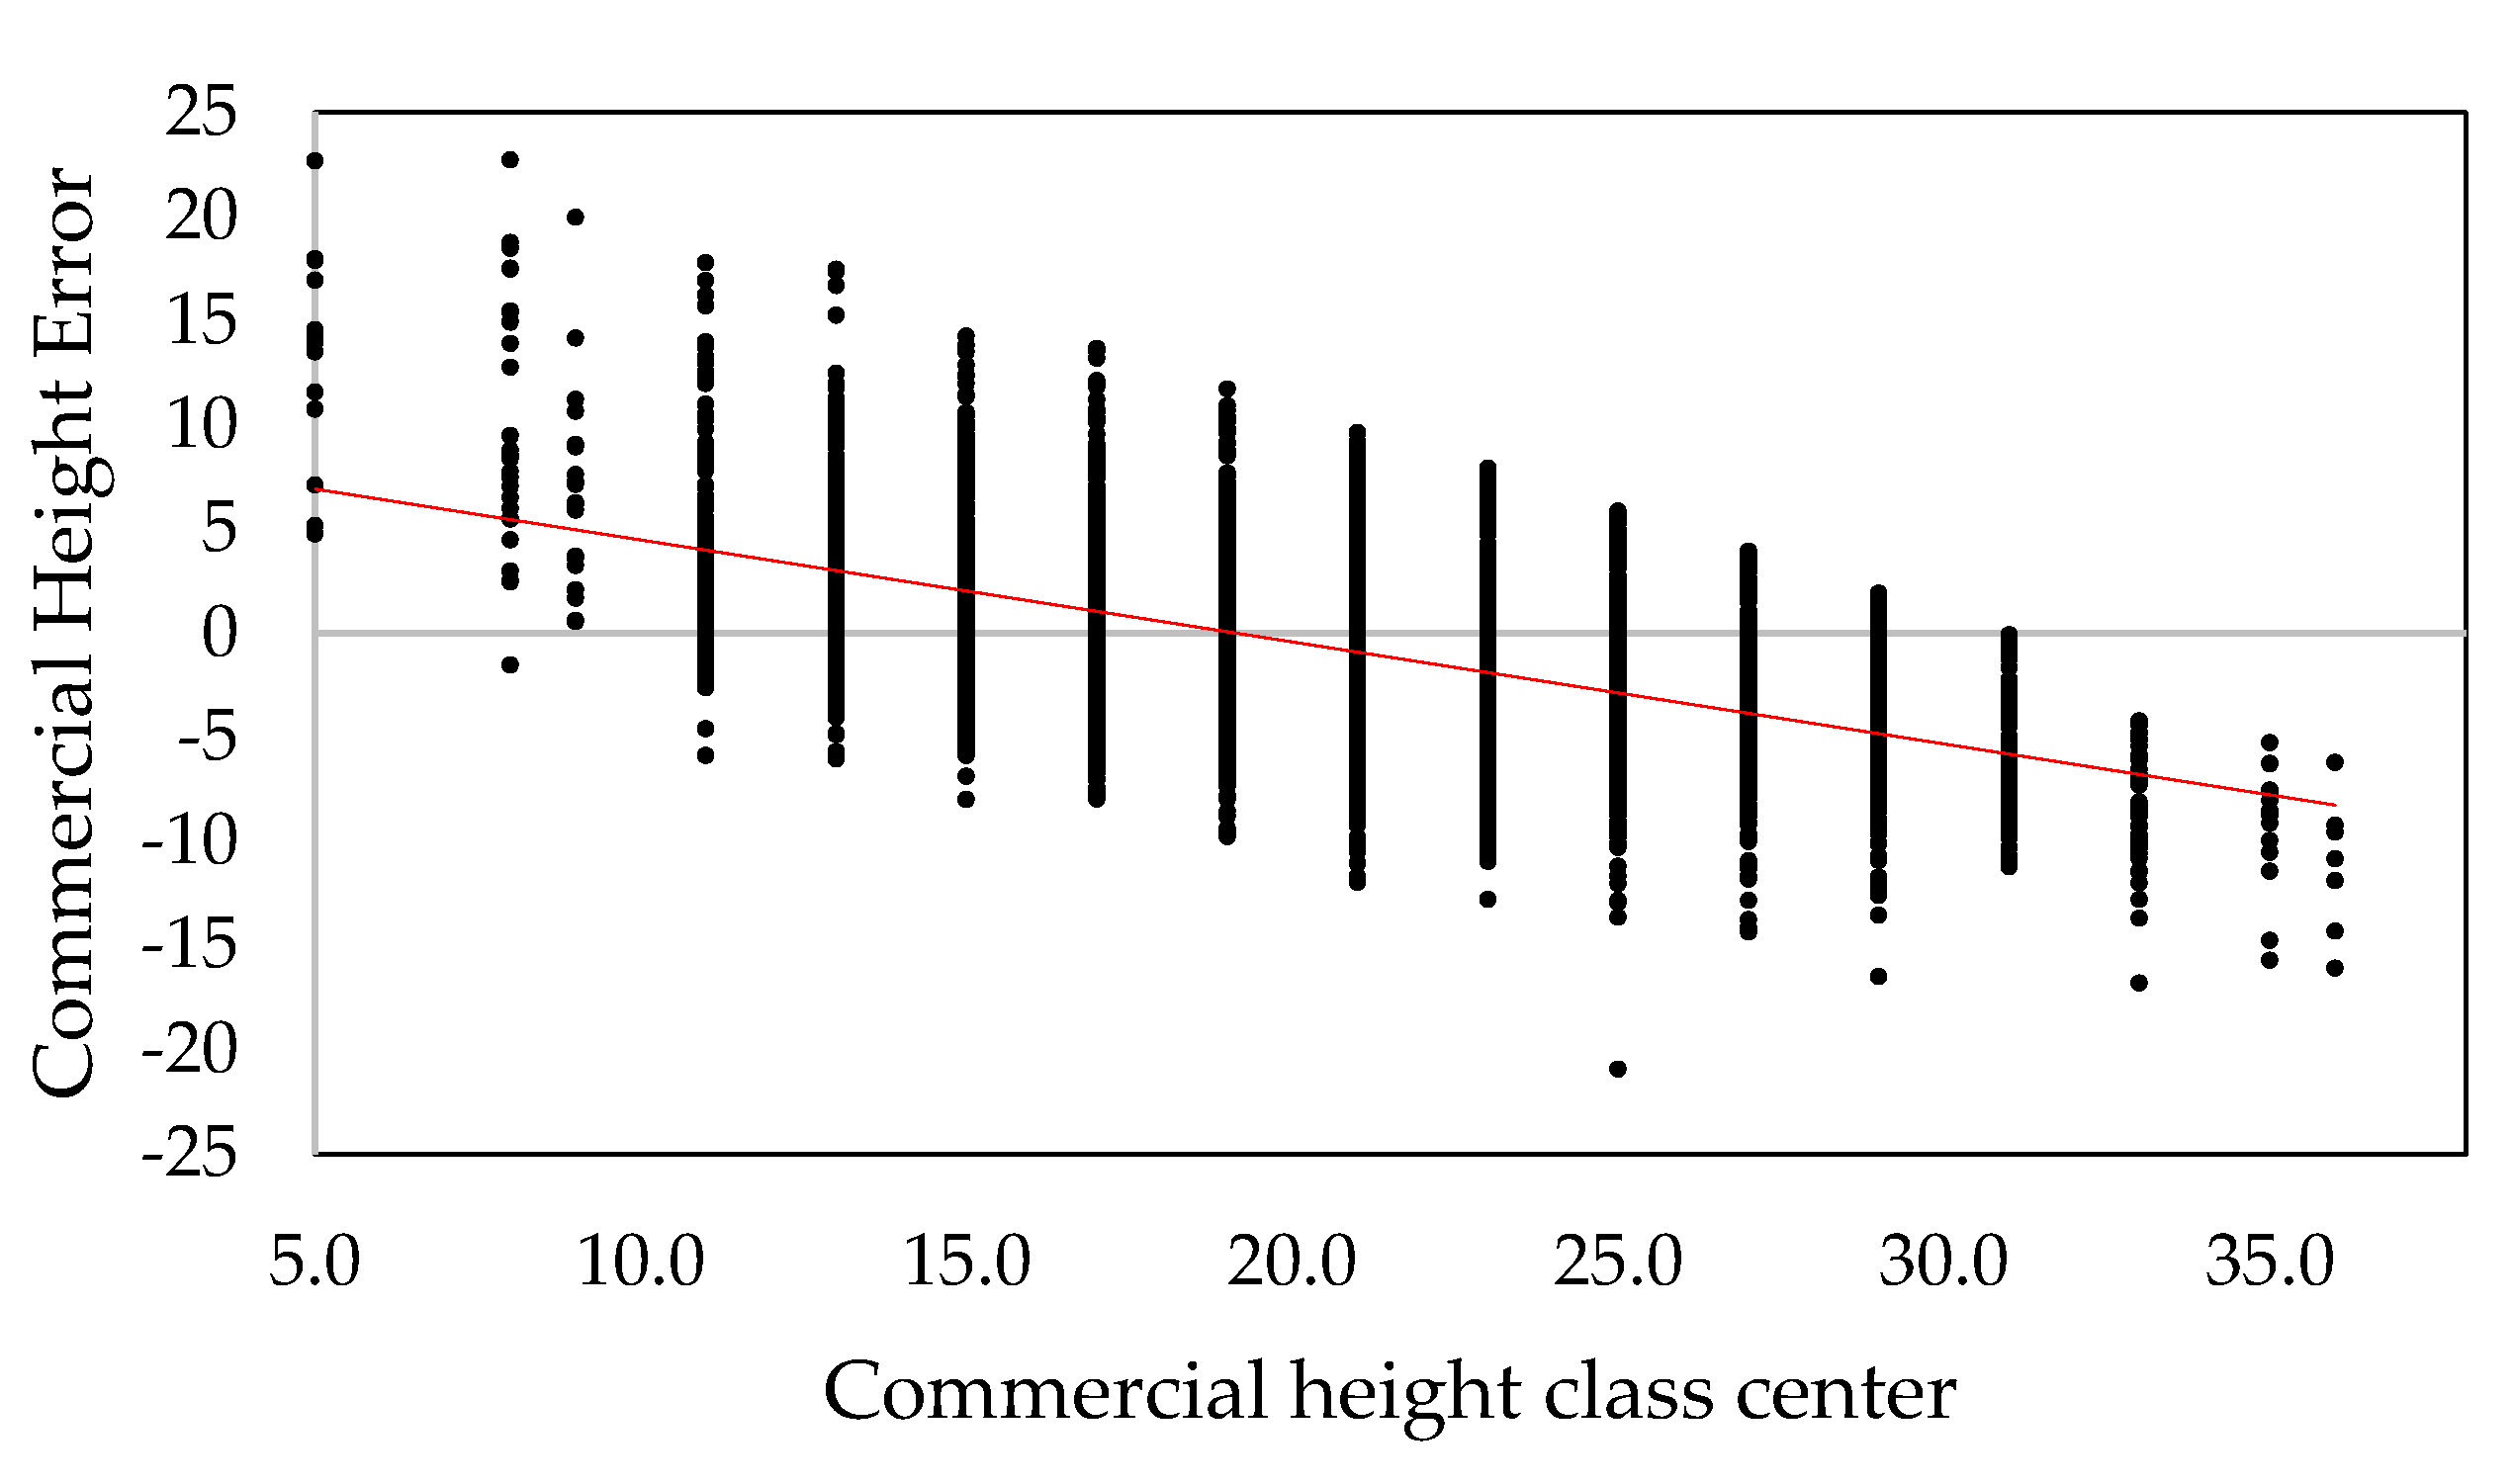

Table 1.
- Vernacular name, scientific name, minimum cutting diameter, number of trees and estimated volume of trees suitable and selected for logging in the Annual Operational Plan for APU 9.
Table 1.
- Vernacular name, scientific name, minimum cutting diameter, number of trees and estimated volume of trees suitable and selected for logging in the Annual Operational Plan for APU 9.
| Vernacular Name | Scientific Name | MCD (cm) | Susceptible to Exploitation | Selected for Exploitation | ||
|---|---|---|---|---|---|---|
| NT | Vol. (m³) | NT | Vol. (m³) | |||
| Angelim pedra1 | Hymenolobium petraeum Ducke | 50 | 91 | 901.524 | 45 | 587.392 |
| Breu amescla2 | Trattinnickia rhoifolia Willd. | 50 | 108 | 813.15 | 59 | 542.455 |
| Cedro vermelho3 | Cedrela odorata L. | 50 | 44 | 272.477 | 15 | 123.235 |
| Cedrorana4 | Cedrelinga catenaeformis Ducke | 50 | 231 | 2,017.859 | 151 | 1,650.019 |
| Cuiarana5 | Terminalia dichotoma G. Mey. | 50 | 300 | 1,433.679 | 199 | 1,134.631 |
| Cumarú6 | Dipteryx odorata (Aubl.) Willd. | 50 | 230 | 1,084.961 | 170 | 915.286 |
| Fava amargosa7 | Vatairea paraensis Ducke | 50 | 60 | 560.812 | 30 | 384.290 |
| Fava rosca8 | Enterolobium schomburgkii (Benth.) Benth. | 50 | 133 | 576.015 | 74 | 392.390 |
| Fava timborana9 | Pseudopiptadenia psilostachya (Benth.) G.P.Lewis & L.Rico | 50 | 470 | 2,274.976 | 317 | 1,800.010 |
| Fava tucupi10 | Parkia multijuga Benth. | 50 | 190 | 916.598 | 125 | 709.113 |
| Garapeira11 | Apuleia moralis Spruce ex Benth. | 50 | 123 | 825.581 | 85 | 655.028 |
| Ipê amarelo12 | Handroanthus serratifolius (Vahl) Nichols. | 50 | 114 | 570.515 | 68 | 391.956 |
| Itaúba13 | Mezilaurus itauba (Meisn.) Taub. exMez | 50 | 337 | 2,170.5 | 237 | 1,764.814 |
| Jarana14 | Lecythis lurida (Miers) S.A. Mori | 50 | 1413 | 6,725.749 | 699 | 4,023.381 |
| Jatobá15 | Hymenaea courbaril L. | 70 | 678 | 7,197.455 | 576 | 6,599.200 |
| Jutaí mirim16 | Hymenaea parvifolia Huber | 50 | 314 | 1,768.412 | 217 | 1,398.118 |
| Louro preto17 | Ocotea baturitensis Vattimo | 50 | 220 | 836.007 | 155 | 655.370 |
| Maçaranduba18 | Manilkara huberi (Ducke) Chevalier | 50 | 1384 | 6,905.416 | 868 | 4,993.089 |
| Melancieira19 | Alexa grandiflora Ducke | 50 | 336 | 1,289.437 | 187 | 892.568 |
| Muiracatiara20 | Astronium lecointei Ducke | 50 | 346 | 2,189.567 | 271 | 1,910.905 |
| Quaruba21 | Vochysia maxima Ducke | 50 | 1535 | 8,870.185 | 817 | 6,085.643 |
| Sapucaia22 | Lecythis pisonis Cambess. | 70 | 162 | 870.976 | 114 | 682.648 |
| Tatajuba23 | Bagassa guianensis Aubl. | 50 | 94 | 579.7 | 66 | 452.72 |
| Tauari24 | Couratari guianensis Aubl. | 50 | 1059 | 6,874.44 | 591 | 4,681.336 |
| Virola25 | Virola melinonii (R.Benoist) A.C.Sm. | 50 | 277 | 906.241 | 131 | 513.313 |
| Total | - | 10,249 | 59,432.231 | 6,267 | 43,938.909 | |
1 to 25 - vernacular and scientific name linkage; NT – number of trees; MCD – minimum cutting diameter in cm; Vol.- volume in m3. Source: Adapted from AOP COOMFLONA 2015.
Table 2.
- Analysis between estimated volume and cubed volume of APU 9 with paired t-test with 95% significance.
Table 2.
- Analysis between estimated volume and cubed volume of APU 9 with paired t-test with 95% significance.
| Scientific Name | NTH | Estimated Volume | Cubed Volume | p-Value |
|---|---|---|---|---|
| Hymenolobium petraeum1 | 40 | 488.831 | 567.857 | 0.00095897* |
| Trattinnickia rhoifolia2 | 46 | 403.171 | 460.110 | 0.00141063* |
| Cedrela odorata3 | 8 | 46.172 | 34.008 | 0.00465273* |
| Cedrelinga catenaeformis4 | 128 | 1,349.000 | 1,572.311 | 0.00001480* |
| Terminalia dichotoma5 | 109 | 622.857 | 529.399 | 0.00792930* |
| Dipteryx odorata6 | 151 | 767.024 | 831.517 | 0.00546452* |
| Vatairea paraensi7 | 33 | 387.699 | 383.256 | 0.41347822ns |
| Enterolobium schomburgkii8 | 53 | 267.477 | 286.463 | 0.05554114ns |
| Pseudopiptadenia psilostachya9 | 101 | 508.731 | 505.334 | 0.41935600ns |
| Parkia multijuga10 | 99 | 554.459 | 704.137 | 0,00000008* |
| Apuleia moralis11 | 67 | 504.444 | 551.658 | 0.02308588* |
| Handroanthus serratifolius12 | 63 | 354.980 | 351.282 | 0.36517347ns |
| Mezilaurus itauba13 | 178 | 1,250.539 | 1,275.293 | 0.16832851ns |
| Lecythis lurida14 | 679 | 3,749.010 | 4,003.557 | 0.00000003* |
| Hymenaea courbaril15 | 536 | 5,948.718 | 6,656.527 | 3.96858x10⁻²⁰* |
| Hymenaea parvifolia16 | 183 | 1,124.806 | 1,094.830 | 0.10194928ns |
| Ocotea baturitensis17 | 88 | 373.437 | 372.742 | 0.47763160ns |
| Manilkara huberi18 | 721 | 3,959.130 | 3,513.711 | 5.16601x10⁻²⁷* |
| Alexa grandiflora19 | 145 | 672.135 | 740.277 | 1.95260x10-05* |
| Astronium lecointei20 | 231 | 1,587.729 | 1,420.082 | 1.38104x10-06* |
| Vochysia maxima21 | 700 | 5,090.283 | 6,131.901 | 1.30820x10⁻³¹* |
| Lecythis pisonis22 | 77 | 431.818 | 423.620 | 0.30576322ns |
| Bagassa guianensis23 | 65 | 441.916 | 452.379 | 0.24148850ns |
| Couratari guianensis24 | 514 | 3,883.514 | 4,202.914 | 3.24665x10-08* |
| Virola melinonii25 | 75 | 268.533 | 277.681 | 0.23588335ns |
| Total | 5,090 | 35,036.414 | 37,342.846 | - |
* significant at 5% probability; ns - not significant at 5% probability, NTH – Number of Trees Harvested.
Disclaimer/Publisher’s Note: The statements, opinions and data contained in all publications are solely those of the individual author(s) and contributor(s) and not of MDPI and/or the editor(s). MDPI and/or the editor(s) disclaim responsibility for any injury to people or property resulting from any ideas, methods, instructions or products referred to in the content. |
© 2024 by the authors. Licensee MDPI, Basel, Switzerland. This article is an open access article distributed under the terms and conditions of the Creative Commons Attribution (CC BY) license (http://creativecommons.org/licenses/by/4.0/).
Copyright: This open access article is published under a Creative Commons CC BY 4.0 license, which permit the free download, distribution, and reuse, provided that the author and preprint are cited in any reuse.


