Submitted:
18 July 2024
Posted:
19 July 2024
You are already at the latest version
Abstract
Blockages in sewers and drains often result in overflows and flooding that cause significant environmental pollution and public health risks particularly in hospitals where the consequences can be catastrophic. Due to their low “visibility”, sewers and drains are inherently difficult to monitor and maintain, resulting in a reactive management approach whereby maintenance or repair is carried out only after a system failure has occurred. This study investigates the application of the reflected wave technique, a unique sonar-like monitoring system, capable of identifying changes to the geometry of closed-pipe-conduits, as a means of active system monitoring to enable maintenance to be conducted in a pro-active basis.
An experimental setup was developed to simulate a horizontal drain using standard pipework of 100 mm diameter and 70 m length. Blockages representing 30% and 75% coverage of the drain’s cross-sectional area, with lengths from 30 mm to 3000 mm, were added to the drain. A sinusoidal air pressure wave of 10 Hz was applied and the resultant system pressure response recorded. All but the two smallest blockages (30% with 30 mm length and 30% with 100 mm length) were detected and located with good accuracy. The reflected wave technique could provide a novel and non-invasive method for blockage detection and overall system monitoring for sewers and drains.
Keywords:
wastewater
; sewer
; hospital drain
; blockage
; reflected wave
; system monitoring
1. Introduction
Approximately 300,000 sewer blockages occur in the UK each year, with an associated cost of £100 million [1]. These blockages often lead to sewer flooding, causing distress and disruption to homeowners and businesses, and resulting in high clean-up costs and increased insurance premiums. In addition to public health impacts, sewer flooding also has major impacts on the environment [2].
An investigation by Water UK revealed that wipes made up around 93% of the material causing sewer blockages, with less than 1% being products designed to be flushed, like toilet paper [1]. Most wipes do not break down in water, and so can accumulate in sewers and drains, ultimately causing blockages within the system. Other materials that cause blockages include: fat, oil, and food scraps; and sanitary items such as towels and tampons [3]. The water industry acknowledges that, in order to avoid blockages from occurring, more needs to be done to encouraging people to dispose of non-flushable items into bins, rather than flushing them down toilets [4], however, in the meantime, sewer blockages remain a major problem. Anecdotal evidence suggests that blockages in hospital drains are a highly frequent and recurring issue that poses real risks to public health and imposes demands on resources and maintenance staff.
1.1. Methods of Blockage Detection
Early detection and location of blockages in sewers and drains is crucial in order to avoid sewer flooding, and should be part of timely maintenance. Conventional methods for “finding” blockages include: visual inspections to identify slow-draining water or obvious material accumulation at drain entry points [5]; and remote-controlled camera inspections that provide internal images of the sewer/drain pipe [6]. However, these methods of finding blockages are time consuming and rely on the experience/expertise of the inspectors and system accessibility.
Studies have begun to explore the use of acoustic and transient wave techniques for blockage detection in sewers and drains [7,8]. These technologies have gained significant interest in recent years as they can potentially provide high sensitivity, flexibility, speed, and the ability to deal with complex systems [8].
One such method is the reflected wave technique, which is widely used for fault detection in a number of different applications: finding faults in electrical systems and power networks [9,10]; leak detection in pipes [11]; and pipe blockage detection in the oil and gas industry [12,13]. The reflected wave technique has also previously been developed by the authors as a means for detecting and locating depleted water trap seals in building drainage systems to minimise cross-transmission of disease [14,15,16]. In this current study, the authors apply the reflected wave technique to the detection and location of blockages within sewers and drains.
1.2. The Reflected Wave Technique
The reflected wave technique works by transmitting a pressure wave into the system and analysing the reflections caused by system boundaries. As the pressure wave propagates the system, it is altered by each boundary encountered (such as junctions, trap seals, air admittance valves, etc.) which induce a characteristic reflection onto the propagating wave [14]. Any anomalies in the system will create reflections that alter the propagating pressure wave from the “defect free system baseline.”
The type of anomaly, determines the form of reflection induced [16]. For example, an open-ended pipe induces a -1 reflection (which appears as a pressure drop) and a closed-end pipe induces a +1 reflection (which appears as a pressure rise), see Figure 1.
By measuring the time it takes for a reflection to return, the presence and location of the anomaly can be determined using the “pipe period” concept. The pipe period is the time taken for a pressure wave to travel to a reflecting boundary and return to source. If L is the pipe length and c is the wave propagation speed, pipe period, T, can be determined by:
By recording the pipe period of an induced refection, the location of the source of the reflection can be determined. The pipe period of an induced reflection can be found by comparing a recorded pressure trace with that of the defect free system baseline. If an anomaly exists within the system, such as a blockage, it can be detected and located using the reflected wave technique.
The reflected wave technique has several benefits over other methods as it is non-invasive, has the ability to locate faults from a single access point, and can be applied to various pipe configurations, geometries, and materials. This is important when considering building drainage system monitoring as these systems tend to be complex with a large amount of different boundaries and, in particular, water trap seals which need to be safeguarded.
2. Materials and Methods
2.1. Apparatus
An experimental setup was developed at Heriot-Watt University to investigate the concept of applying the reflected wave technique to blockage detection in sewers and drains. A test-rig was constructed in the laboratory that simulated a horizontal drain of 70 m in length using 100 mm diameter uPVC pipework, see Figure 2.
An acoustic wave generator was used to apply a sinusoidal air pressure wave into the simulated horizontal drain. A sinusoidal air pressure wave of 10Hz was used as the applied pressure wave as this form of wave has been shown to be non-destructive when applied to building drainage systems; protecting the integrity of the water trap seals by limiting the impact of any propagating wave on the surface of the water seal and ensuring no displacement [17,18].
Two differential pressure sensors with voltage output, P1 and P2, (both SensorTechnics, model 113LP25D-PDB, with pressure range of ±250 mm water gauge) were connected to the test-rig to record the system pressure response. P1 was located 2 m from the acoustic wave generator and 14 m from the blockage start position. P2 was located 3.4 m from the blockage start position. The pressure sensors were connected to a data acquisition board (Keithley, model KPCI-3116) with a sampling rate of 2000 Hz.
2.2. Simulating a Blockage
Blockages were made from concrete and cast in moulds to depict blockages filling cross-sectional areas of 30% and 75% of the drain pipe, simulating partial pipe blockages, see Figure 3. Blockages were also formed in a range of lengths (0.03 m, 0.06 m, 0.1 m, 1.0 m, 2.0 m, and 3.0 m). Concrete was chosen as the blockage material to emulate the density of the types of blockages seen in sewers and drains, and also for practicality and ease of conducting laboratory tests.
A full list of the range of blockages used in this study are shown in Table 1. A total of 12 blockages were tested with volumes ranging from 0.07 m3 to 17.67 m3. The cross-sectional coverage values (30% and 75%) are in relation to the 100 mm diameter test-rig pipework with cross-sectional area of 78.54 cm2.
All blockages were positioned within the test-rig to ensure a consistent blockage start position. This was an important factor for assessing accuracy of the reflected wave technique in detecting and locating these blockages.
2.3. Test Procedure
The first step, when using the reflected wave technique, is to determine the pressure response of the system to the applied pressure wave in which no anomalies exist [16]. This is referred to as the defect free system baseline, P, and is what all tests are subsequently compared:
where N is the number of defect free system responses and j is the measurement point. For this study, a total of 10 defect free system responses were recorded, in response to the applied sinusoidal air pressure wave generated by the acoustic wave generator. These were then averaged to determine the defect free system baseline.
The maximum absolute difference between the defect free system baseline and each of the defect free system responses was then calculated. This provides the system threshold (h-value) which takes account of signal noise when checking the goodness-of-fit between the tests and the defect free system baseline.
The goodness-of-fit is assessed using a time series change detection algorithm based on the absolute difference, Dt, between the defect free system baseline, P, and the measured test pressure response P:
For each data point, the change in goodness-of-fit is assessed. If the absolute difference between the two traces exceeds the h-value, then a change is said to have occurred (indicating the presence of an anomaly in the system), and the time of the change is recorded. This time is taken as the pipe period, T, allowing the pipe length, L, (i.e. the anomaly location) to be calculated from Equation 1. The wave propagation speed, c, is taken as 343 m/s for air in a pipe.
2.4. Adding a Blockage
Once the defect free system baseline was determined, the blockages were added to the test-rig (one at a time) and subsequent test pressure responses were measured. Each blockage was added at the same position within the pipe to ensure consistent start positions. Once in place, the acoustic wave generator was used to apply the sinusoidal air pressure wave. For each blockage, a total of 5 test pressure responses were measured and an average taken, before comparing with the defect free system baseline.
3. Results and Discussion
3.1. Determination of the System Threshold (h-Value)
The maximum absolute difference between the 10 defect free system responses recorded, and the averaged defect free system baseline, was found to be 1.5 mm water gauge which was, therefore, set as the h-value for the system.
For subsequent tests with blockages, the time series change detection algorithm assessed the goodness-of-fit between the defect free system baseline and the measured test pressure response. When a change exceeded the h-value of 1.5 mm water gauge, the time of the change was recorded and used to estimate the location of the blockage.
3.2. Measured Test Pressure Responses: Blockage Reflections
Each blockage was added to the test-rig in turn, positioned with the consistent start position (14 m from pressure sensor P1, and 3.4 m from pressure sensor P2). Figure 4 shows the measured test pressure responses against the defect free system baselines.
It can be seen that the measured test pressure response changes from the defect free system baseline when a blockage is present in the pipework. The change is depicted as a positive reflection that increases the pressure at a specific time.
The magnitude of the reflection change is a factor of the blockage cross-sectional coverage (the 75% blockage produces a larger reflection than the 30% blockage) and the blockage length (longer blockages produce larger reflections than shorter blockages). It can also be seen that the reflection change is larger and clearer when recorded by pressure sensor P2 (closest to the blockage) when compared to that recorded at P1 (furthest from the blockage).
3.3. Applying the Time Series Change Detection Algorithm
Each of the measured test pressure responses were analysed by applying the time series change detection algorithm. Figure 5 shows the results of the analysis for the range of lengths of the 30% blockage. The same analysis was also conducted for the 75% blockage. The first two columns of graphs in the figure (left-side) depict analysis of the data measured at pressure sensor P1 (14 m from the blockage) and the second two columns of graphs (right-side) depict analysis of the data measured at pressure sensor P2 (3.4 m from the blockage). Each row of graphs relate to each length of blockage (from 30 mm to 3000 mm [3m]). For each pressure sensor, a graph showing the absolute difference between the measured test pressure response and defect free system baseline (goodness-of-fit), together with a graph showing the time series change detection (indicating if goodness-of-fit exceeds the h-value) is depicted for each blockage length.
Figure 5 shows that the time series change detection algorithm was unable to detect very short blockages of 30 mm and 100 mm for a blockage with 30% cross-sectional coverage. All longer blockages, from 300 mm to 3000 mm, were detected.
Table 2 displays the detection and location results for each blockage tested, for both the 30% and 75% blockages. The blockage characteristics (including the known location, pipe period, and length) and compared with that of the detected blockage information (including detected pipe period and detected location). Again, it can be seen that for the 30% blockage, the 30 mm and 100 mm long blockages are not detected by either pressure sensor. However, for the 75% blockage, only the 30 mm long blockage is not detected at pressure sensor P1; all other blockages are detected, and all blockages are detected at pressure sensor P2 for the 75% blockage.
The detected location of the 300 mm long, 30% blockage (18.61 m) by pressure sensor P1 has a high variance (33%) from the known location of the blockage (14 m). Also, there is a high variance (31%) between the detected location of the 60 mm, 75% blockage (18.35 m) and the known location (14 m). It appears that very short blockages are either undetectable by the time series change detection algorithm or, if detected, can have a high variance in detected location. All other blockages are located within 1-8% of the known location. The accuracy in locating the blockage is improved using data from pressure sensor P2 (closest to the blockage), with just 1-3% variance. Pressure sensor P2 was also able to locate the 30 mm, 75% blockage to within 1% of the known location, whereas pressure sensor P1 was unable to detect it at all.
Overall, the reflected wave technique has been shown to successfully detect and locate a wide range of blockages within the simulated horizontal drain-pipe.
4. Conclusions
This study has investigated the use of the reflected wave technique for the detection and location of blockages within sewers and drains. As a concept, it has been shown that the technique can detect and locate partial blockages in pipes by sending an applied sinusoidal air pressure wave into the system and analysing the reflections generated by the blockage.
Using a time change detection algorithm to analyse the measured test pressure response against a defect free system baseline, has been shown to be effective in detecting blockages within the simulated horizontal drain-pipe (across the range of 30% blockages with lengths from 300 mm to 3000 mm, and 75% blockages with lengths of 30 mm to 3000 mm). Whilst the detected location of the shortest blockages were seen to have high variance (around 31-33%) when measured from the pressure sensor furthest from the blockage, this was improved when measured from the pressure sensor closer to the blockage (-2-3%), and all other blockage locations were detected with good accuracy (1-8%).
The reflected wave technique has been demonstrated as a suitable approach to blockage detection in sewers and drains, allowing periodic or continuous monitoring of such systems and enabling early detection of blockages (or other defects) that may occur. This will enable improved monitoring of sewer and drains so that maintenance can be carried out on a proactive basis.
5. Patents
Patent No: TBC
Author Contributions
Conceptualization, D.K., D.C. and M.Go.; methodology, D.K., D.C. and M.Go.; software, D.K., D.C. and M.Go.; validation, D.K., D.C. and M.Go.; formal analysis, D.K. and M.Ga.; investigation, D.K. and M.Ga.; resources, D.K.; data curation, D.K., M.Ga. and M.Go.; writing—original draft preparation, D.K. and M.Ga.; writing—review and editing, D.C., M.Go. and K.S.; visualization, D.K. and M.Ga.; supervision, D.K., D.C. and M.Go.; project administration, D.K., D.C. and M.Go.; funding acquisition, D.K., D.C. and M.Go. All authors have read and agreed to the published version of the manuscript.”
Funding
This research was funded by Heriot-Watt University.
Data Availability Statement
Dataset available on request from the authors.
Acknowledgments
The authors would like to thank the administrative and technical teams at Heriot-Watt University for their support during this work.
Conflicts of Interest
The authors declare no conflicts of interest.
References
- Drinkwater, A.; Moy, F. Wipes in sewer blockage study: Final Report. Report Ref. No. 21CDP.WS. Water UK. 2017.
- Owolabi,T.A.; Mohandes, S.A.; Zayed, T. Investigating the impact of sewer overflow on the environment: A comprehensive literature review paper. Journal of Environmental Management 2022, 301:113810. [CrossRef]
- Blockages. Available online: https://www.thameswater.co.uk/help/water-and-waste-help/blockages (accessed on 20 May 2024).
- New proof that flushing wipes is a major cause of sewer blockages. Available online: https://www.stwater.co.uk/news/news-releases/new-proof-that-flushing-wipes-is-a-major-cause-of-sewer-blockage/ (accessed on 20 May 2024).
- Alshami, A.; Elsayed, M.; Ali, E.; Eltoukhy, A.E.E; Zayed, T. Monitoring Blockage and Overflow Events in Small-Sized Sewer Network Using Contactless Flow Sensors in Hong Kong: Problems, Causes, and Proposed Solution. IEEE Access, 2023, 11, pp. 87131-87149. https://dx.doi.org/10.1109/ACCESS.2023.3305275.
- Kumar, J.S.J.; Tiwari, J.; Khasnavis, S; Joseph, A.A. Design of a sewer robot to detect blockages in sewer. Middle-East Journal of Scientific Research, 2016, 24(S1), pp. 236-239. https://dx.doi.org/10.5829/idosi.mejsr.2016.24.S1.47.
- Ali, M.T.; Horoshenkov, K.V.; Tait, S.J. Rapid detection of sewer defects and blockages using acoustic-based instrumentation. Water Sci Technol. 2011, 64(8), pp.1700-1707. https://dx.doi.org/10.2166/wst.2011.183.
- Yu, Y.; Safari, A.; Niu, X.; Drinkwater, B; Horoshenkov, K.V. Acoustic and ultrasonic techniques for defect detection and condition monitoring in water and sewerage pipes: a review. Applied Acoustics, 2021, 183, 108282. [CrossRef]
- Furse, C.; Kafal, M.; Razzaghi, R.; Shin, Y-J. Fault Diagnosis for Electrical Systems and Power Networks: A Review. IEEE Sensors Journal, 2021, 21 (2), pp.888-906. [CrossRef]
- Kingston, S.; Benoit, E.; Edun, A.S.; Elyasichamazkoti, F.; Sweeney, D.E.; Harley, J.B.; Kuhn, P.K.; Furse, C.M. A SSTDR Methodology, Implementations, and Challenges. Sensors (Basel). 2021, 21(16): 5268. [CrossRef]
- Sharp, D.B.; Campbell, D.M. Leak detection in pipes using acoustic pulse reflectometry. Acustica, 1997, 83, pp. 560-566.
- Monteiro, P.C.C., Jr.; da Silva Monteiro, L.L.; Netto, T.A.; Vidal, J.L.A. Assessment of the Acoustic Reflectometry Technique to Detect Pipe Blockages. J. Offshore Mech. Arct. Eng. 2021, 143(5): 051801. [CrossRef]
- Papadopoulou, K.A.; Shamout, M.N.; Lennox, B.; Mackay, D.; Taylo, A.R. An evaluation of acoustic reflectometry for leakage and blockage detection. In Proceedings of the Institution of Mechanical Engineers, Part C: Journal of Mechanical Engineering Science. 2008, 222(6), pp. 959-966. [CrossRef]
- Kelly D.A.; Swaffield J.A.; Jack L.B.; Campbell D.P.; Gormley M. Pressure transient identification of depleted appliance trap seals: A pressure pulse technique. Building Services Engineering Research & Technology, 2008, 29 (2), pp. 165-181. [CrossRef]
- Kelly D.A.; Swaffield J.A.; Jack L.B.; Campbell D.P.; Gormley M. Pressure transient identification of depleted appliance trap seals: A sinusoidal wave technique. Building Services Engineering Research & Technology, 2008, 29 (3), pp. 219-232. [CrossRef]
- Kelly D.A.; Gormley M. Automatic detection of depleted fixture trap seals using the reflected wave technique. Building Services Engineering Research & Technology, 2013, 35 (3), pp. 254-267. [CrossRef]
- Kelly D.A. Identification of depleted appliance trap seals within the building drainage and ventilation system - A transient based technique. In Proceedings from CIB W062 33rd International Symposium on Water Supply and Drainage for Buildings, Brno, Czech Republic, 19-21 September 2007.
- Swaffield, J.A. Influence of unsteady friction on trap seal depletion. In Proceedings from CIB W062 33rd International Symposium on Water Supply and Drainage for Buildings, Brno, Czech Republic, 19-21 September 2007.
Figure 1.
Propagation of applied pressure wave (∆pI) along pipe and induced reflection from: (a) an open-ended pipe and; (b) a closed-end pipe
Figure 1.
Propagation of applied pressure wave (∆pI) along pipe and induced reflection from: (a) an open-ended pipe and; (b) a closed-end pipe
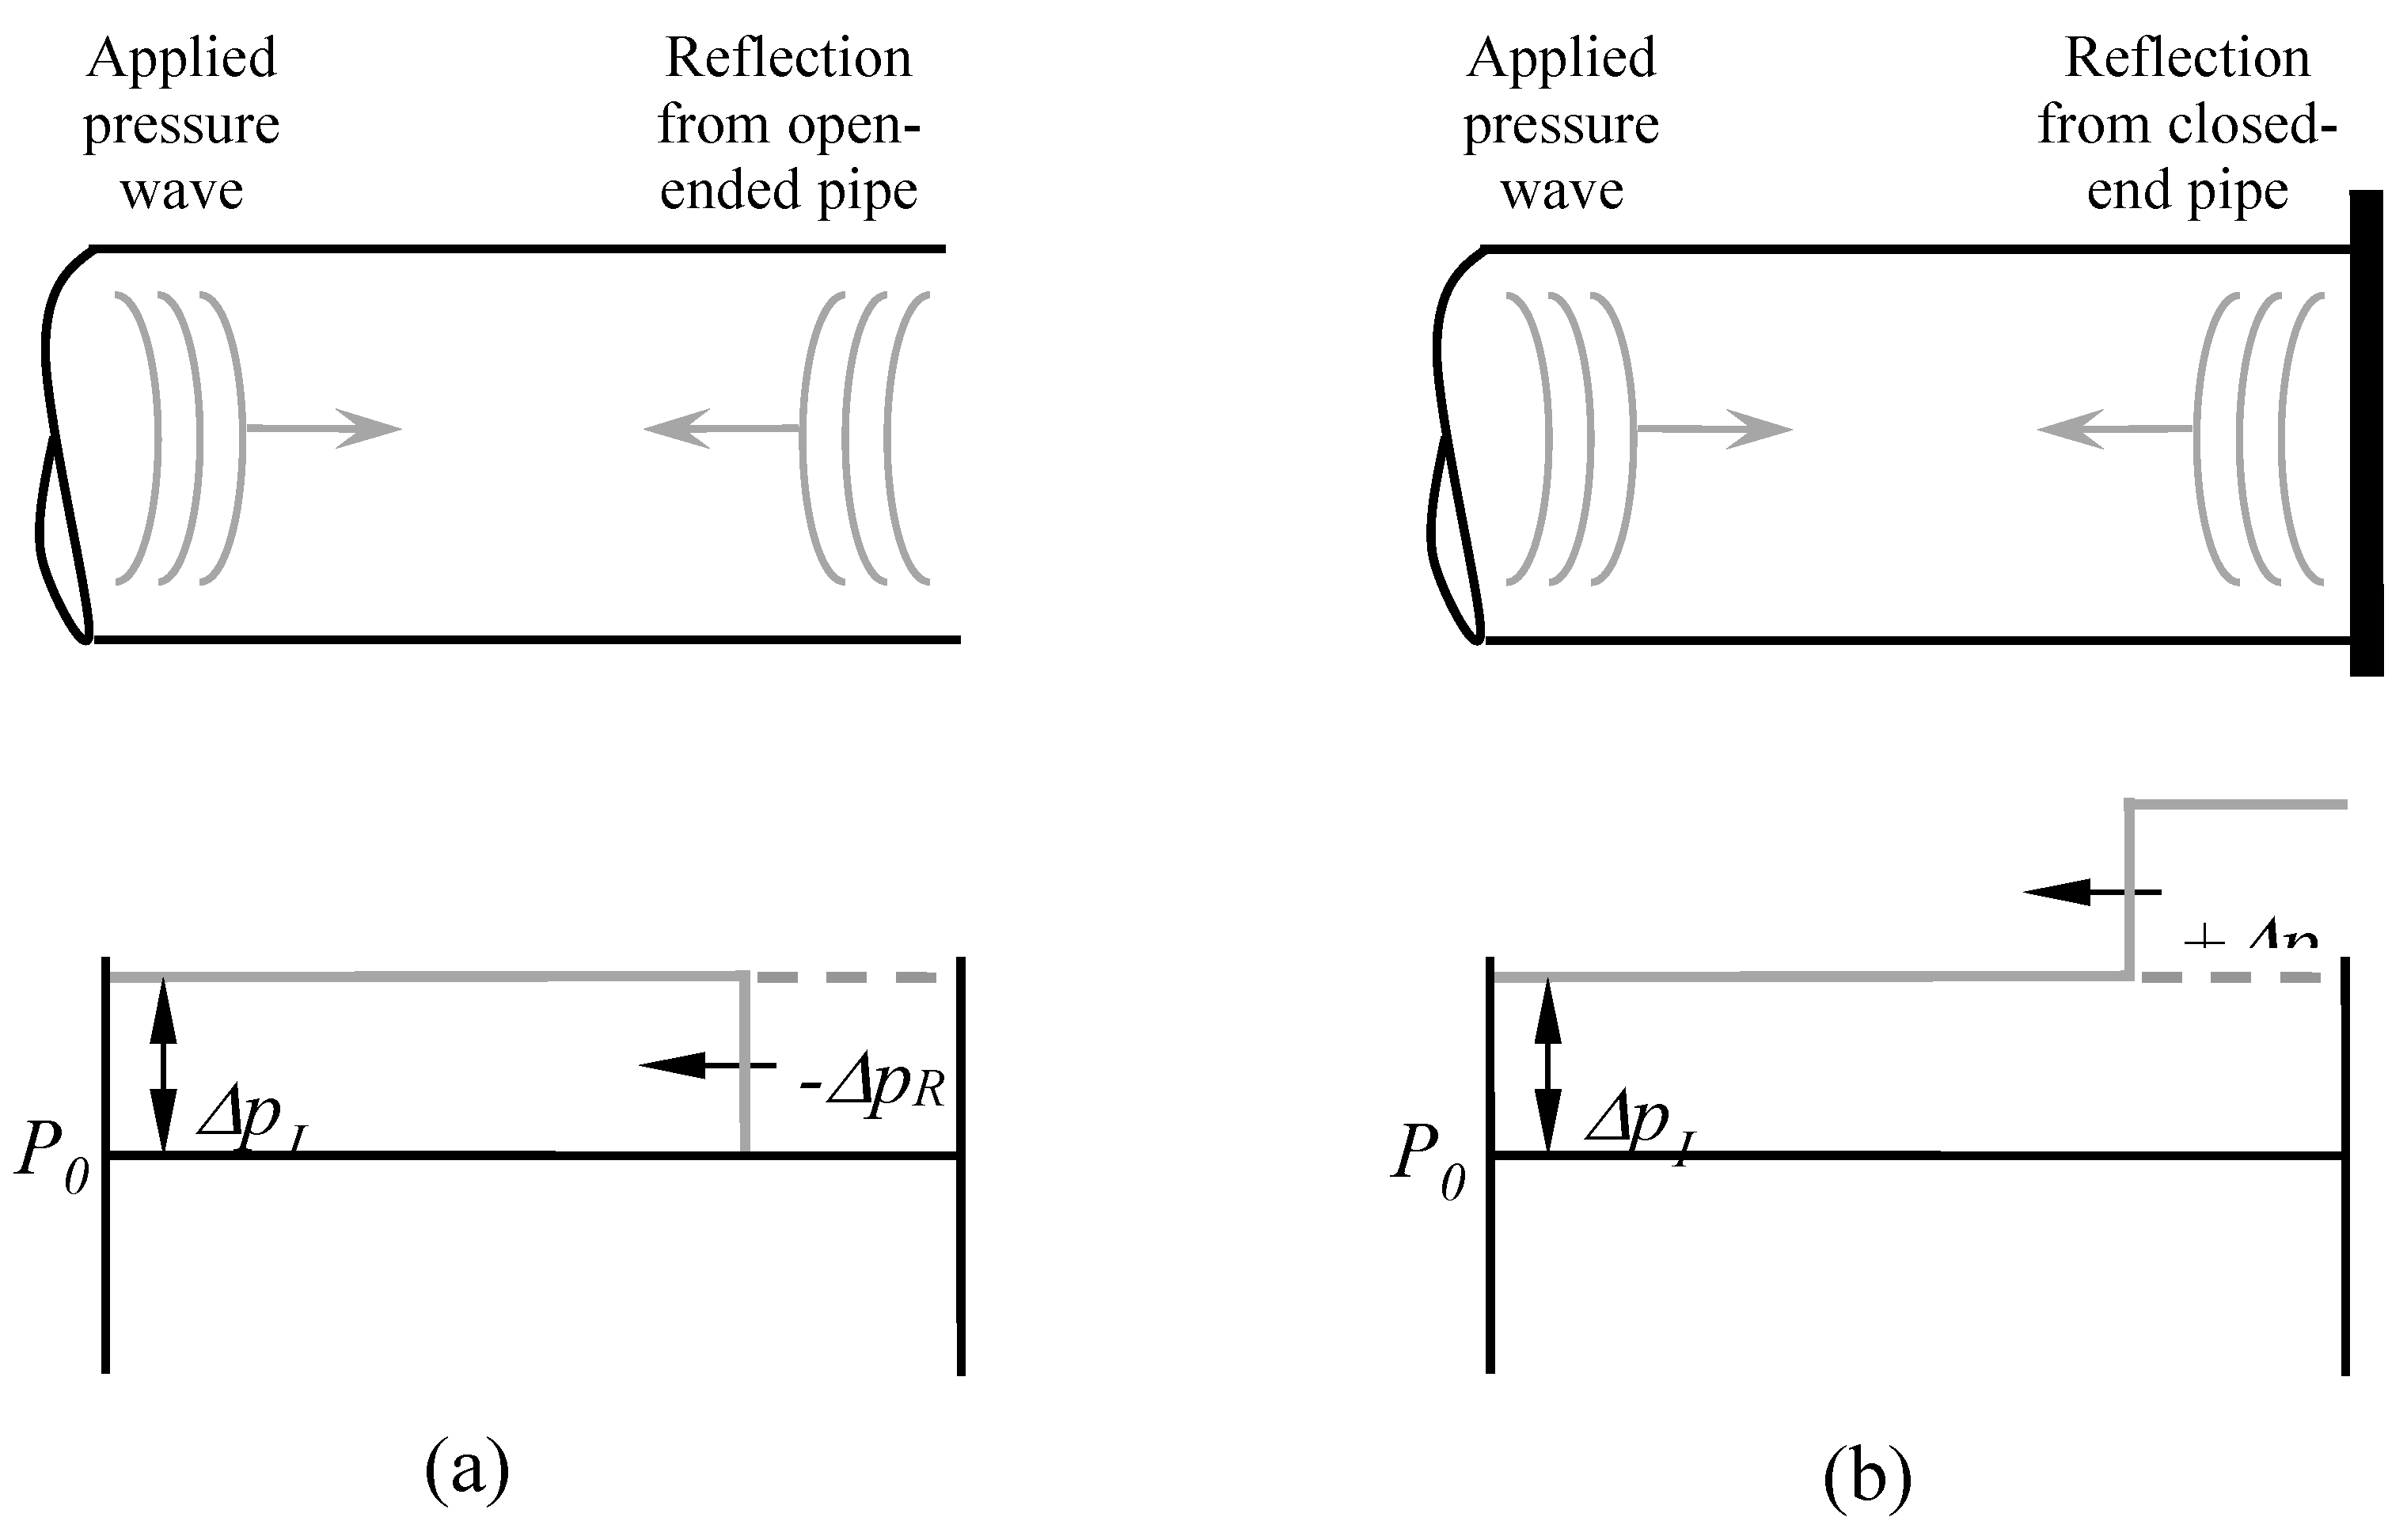
Figure 2.
Experimental setup showing test-rig constructed to simulate 70 m length of horizontal drain pipe with acoustic wave generator, two pressure sensors (P1 and P2) located 14 m and 3.4 m, respectively, from the blockage start position
Figure 2.
Experimental setup showing test-rig constructed to simulate 70 m length of horizontal drain pipe with acoustic wave generator, two pressure sensors (P1 and P2) located 14 m and 3.4 m, respectively, from the blockage start position
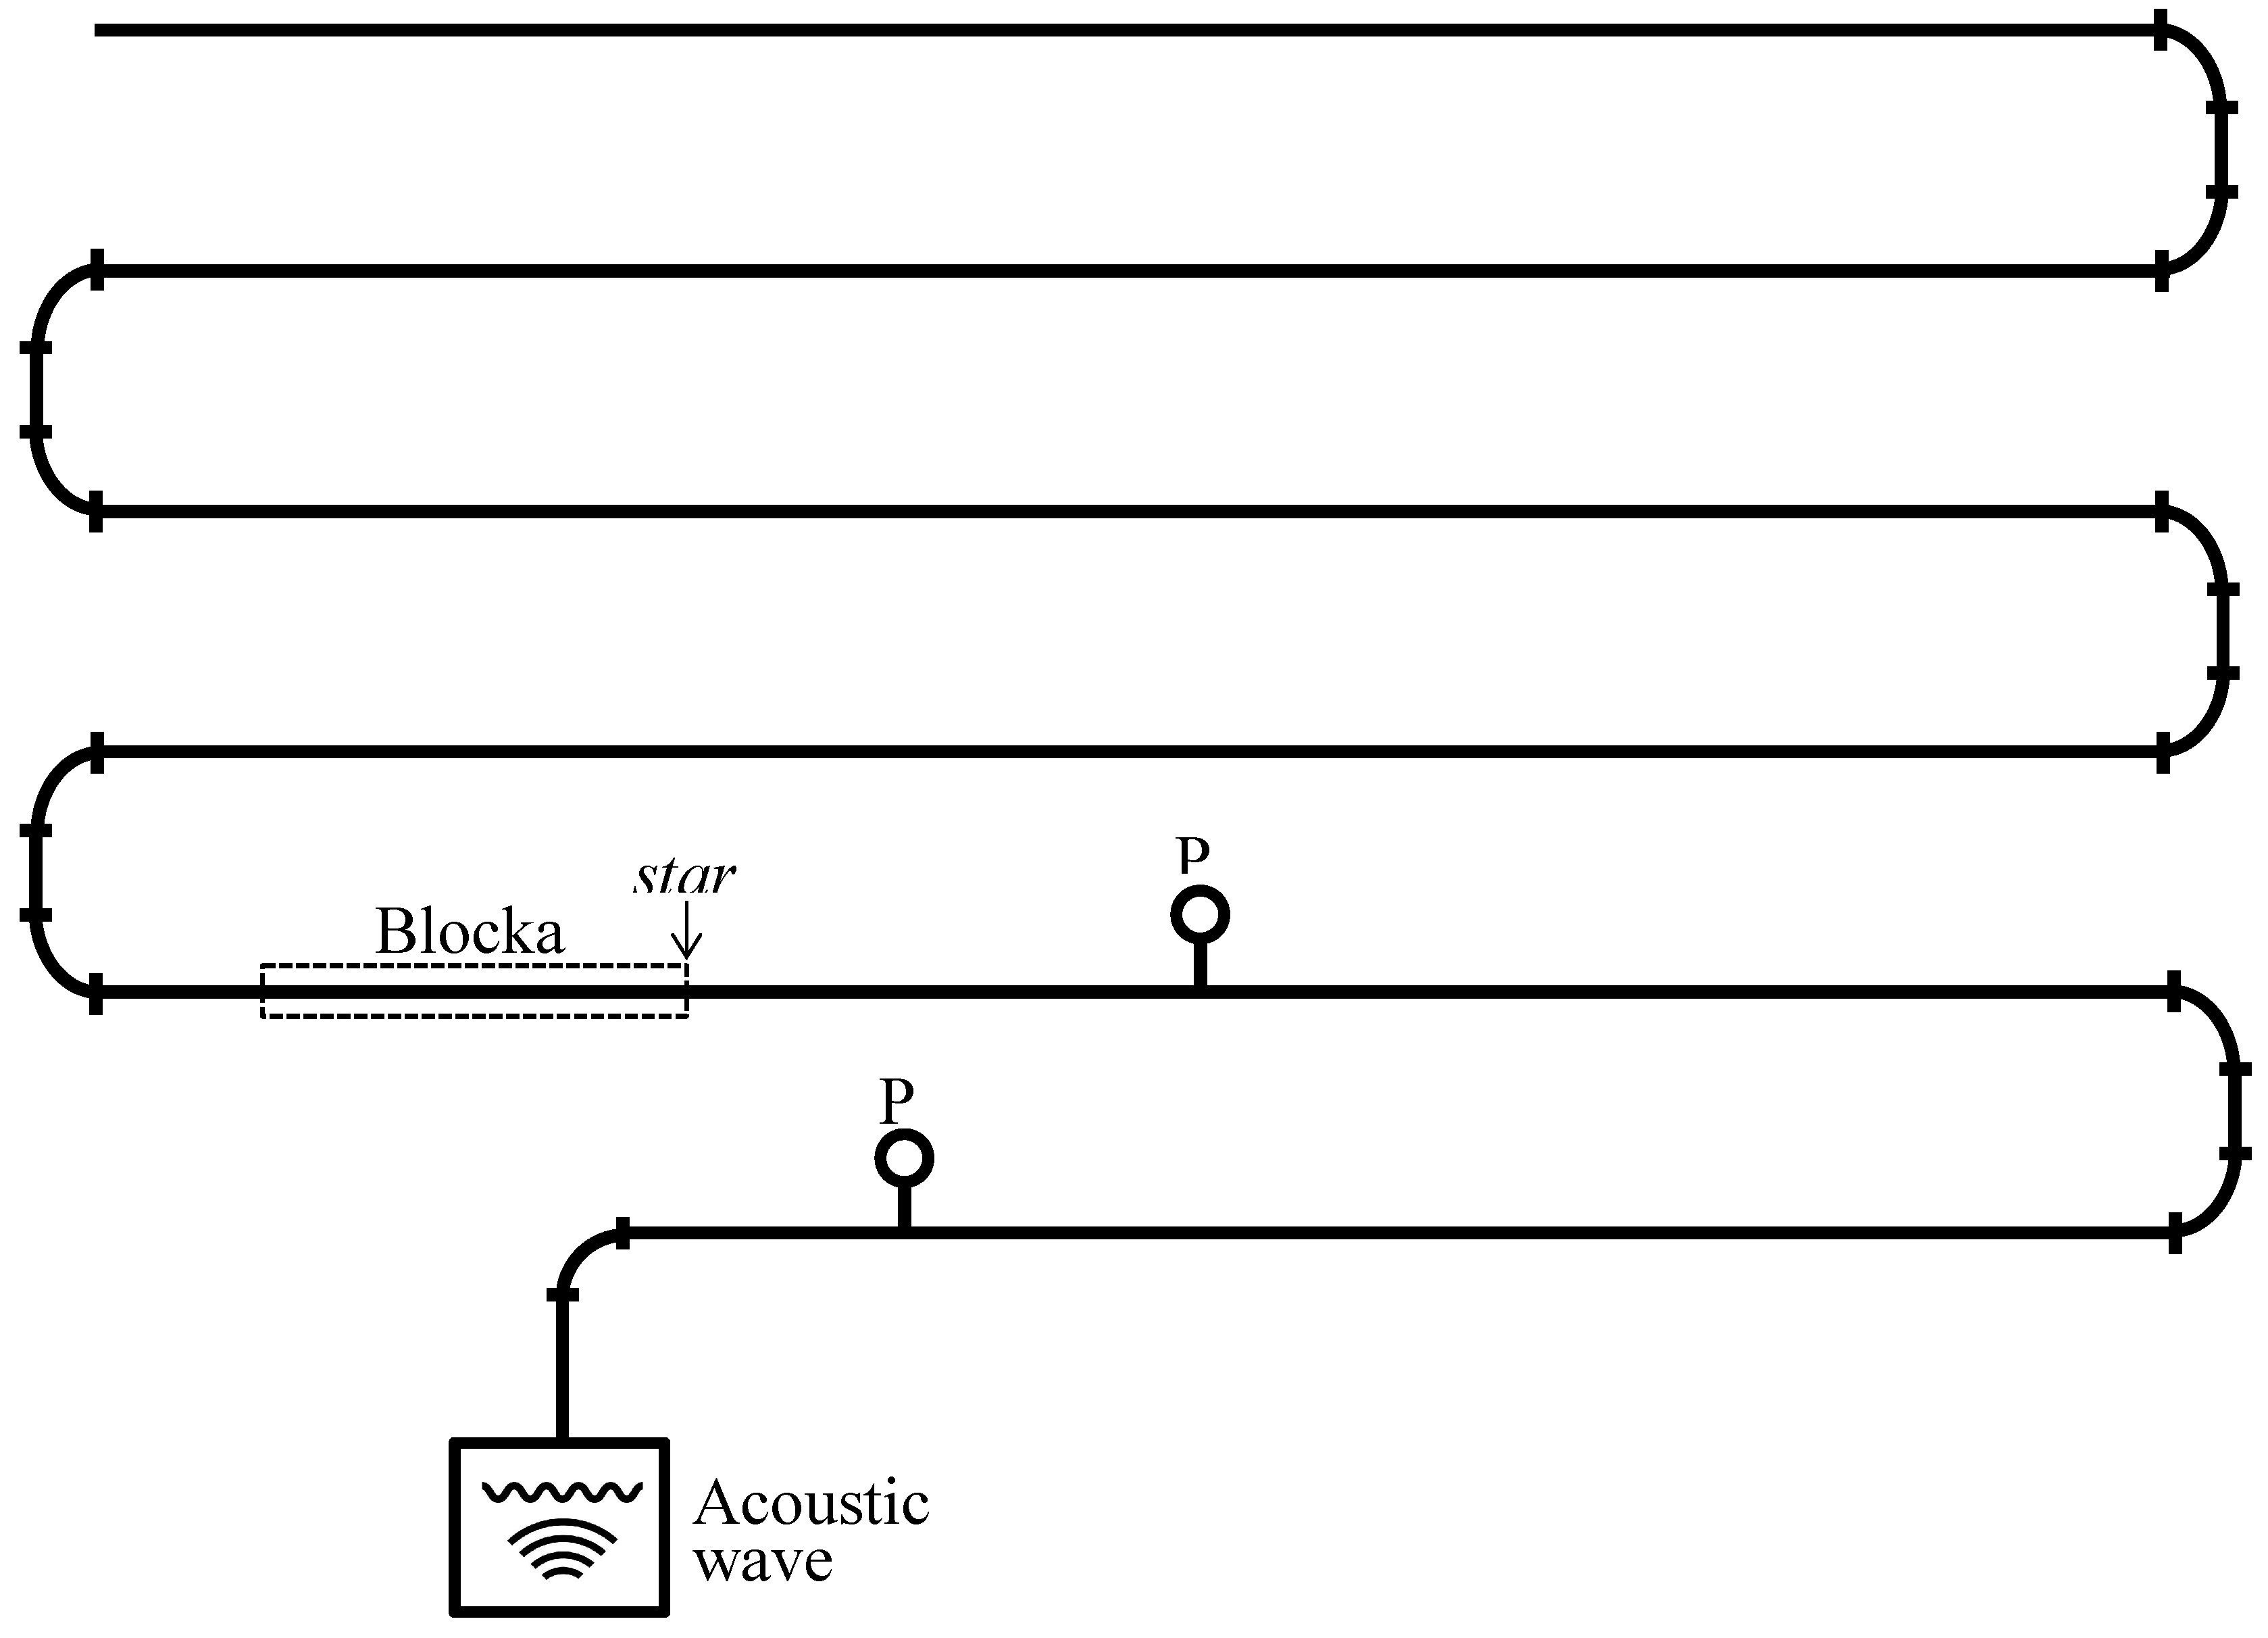
Figure 3.
Cross-section showing the 30% and 75% blockages within the 100 mm diameter pipework of the test-rig
Figure 3.
Cross-section showing the 30% and 75% blockages within the 100 mm diameter pipework of the test-rig
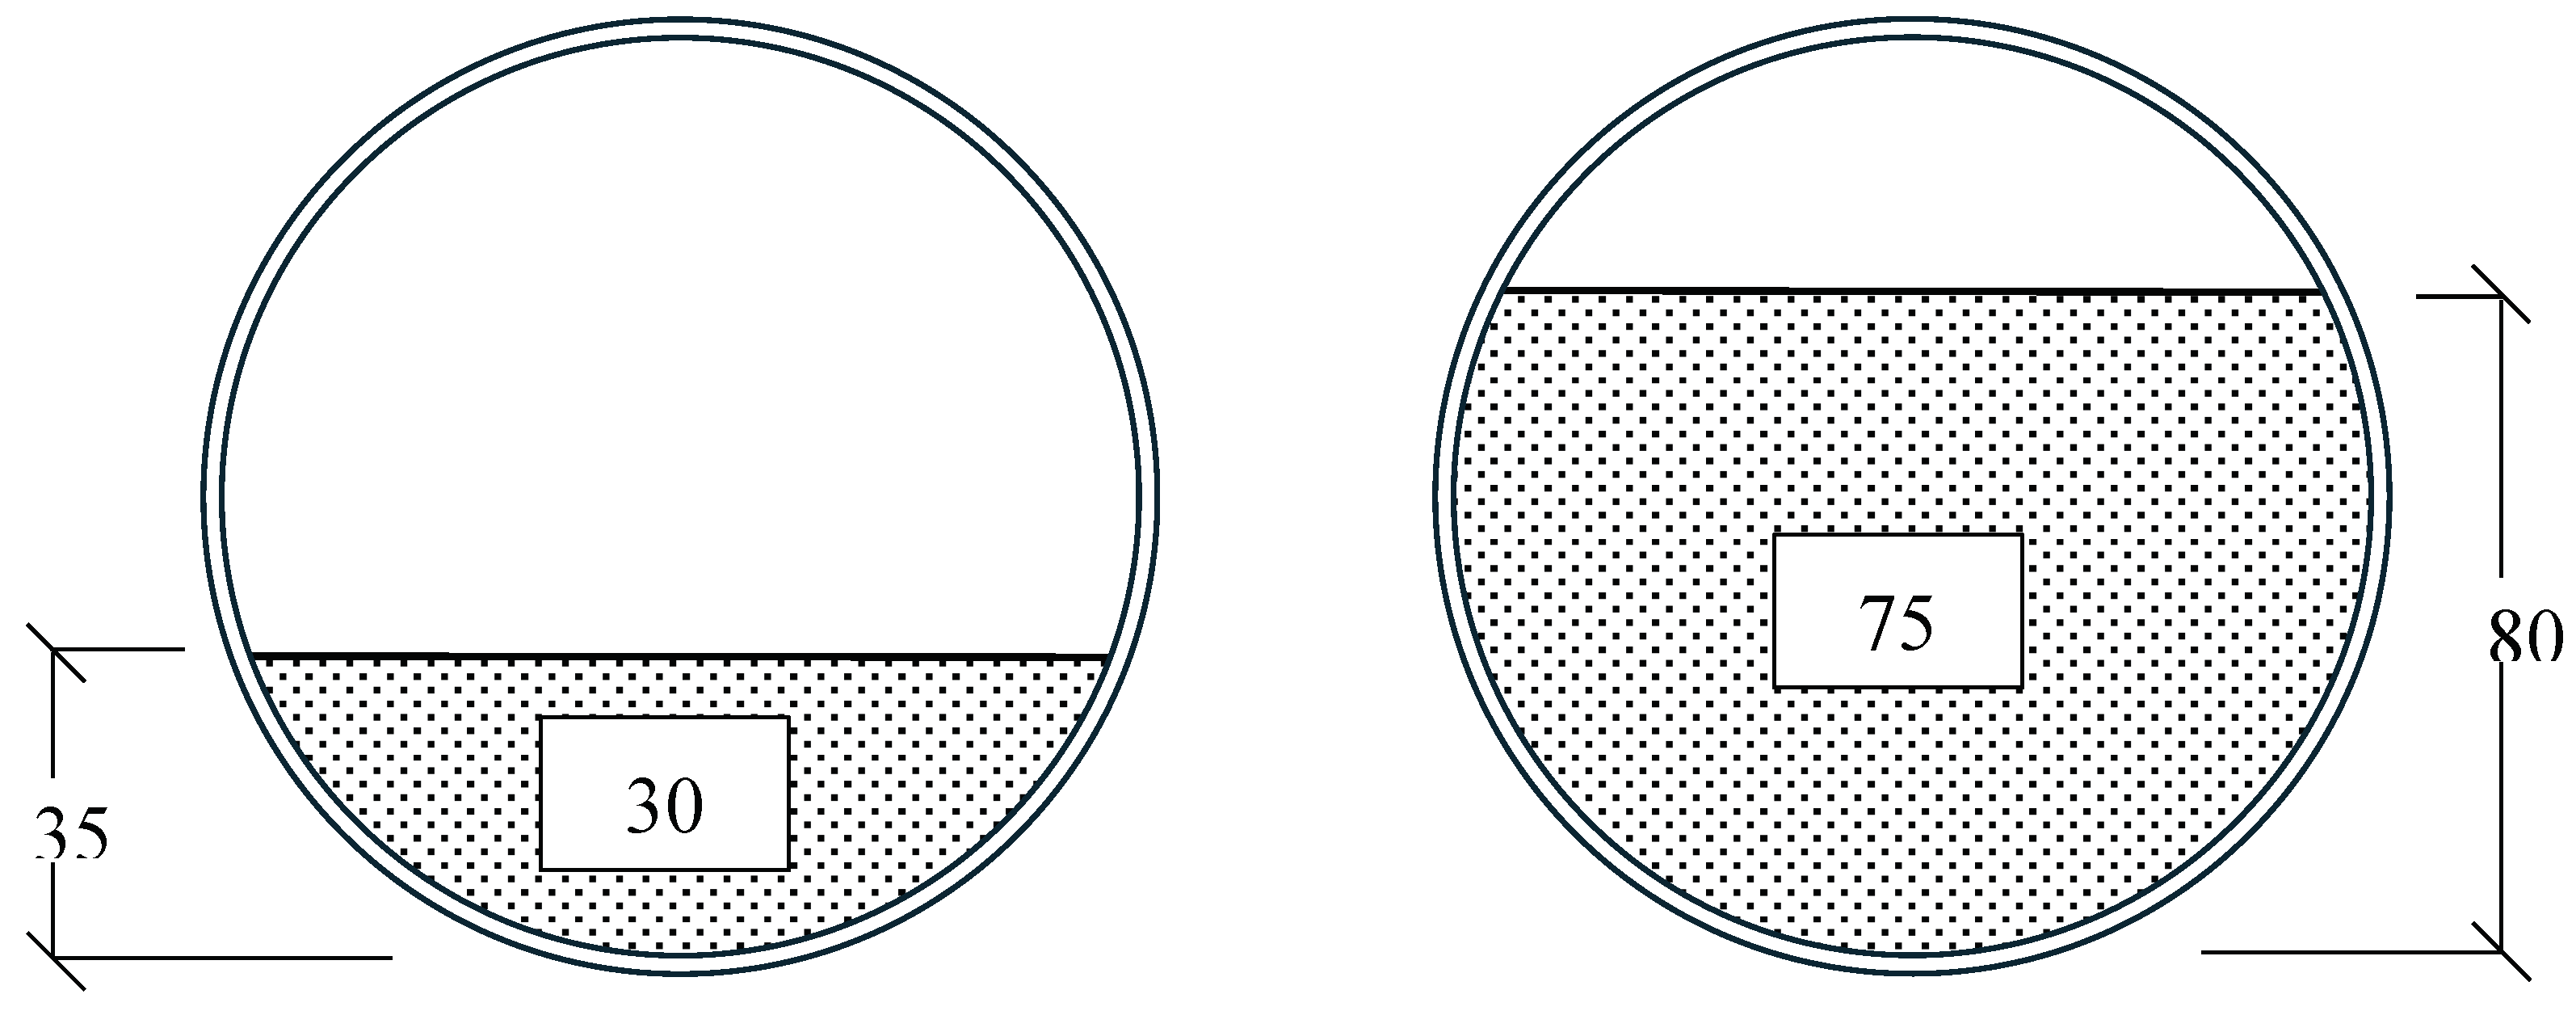
Figure 4.
Measured test pressure responses compared with the defect free system baseline for: (a) 30% blockage recorded at P1; (b) 30% blockage recorded at P2; (c) 75% blockage recorded P1; and (d) 75% blockage recorded at P2
Figure 4.
Measured test pressure responses compared with the defect free system baseline for: (a) 30% blockage recorded at P1; (b) 30% blockage recorded at P2; (c) 75% blockage recorded P1; and (d) 75% blockage recorded at P2
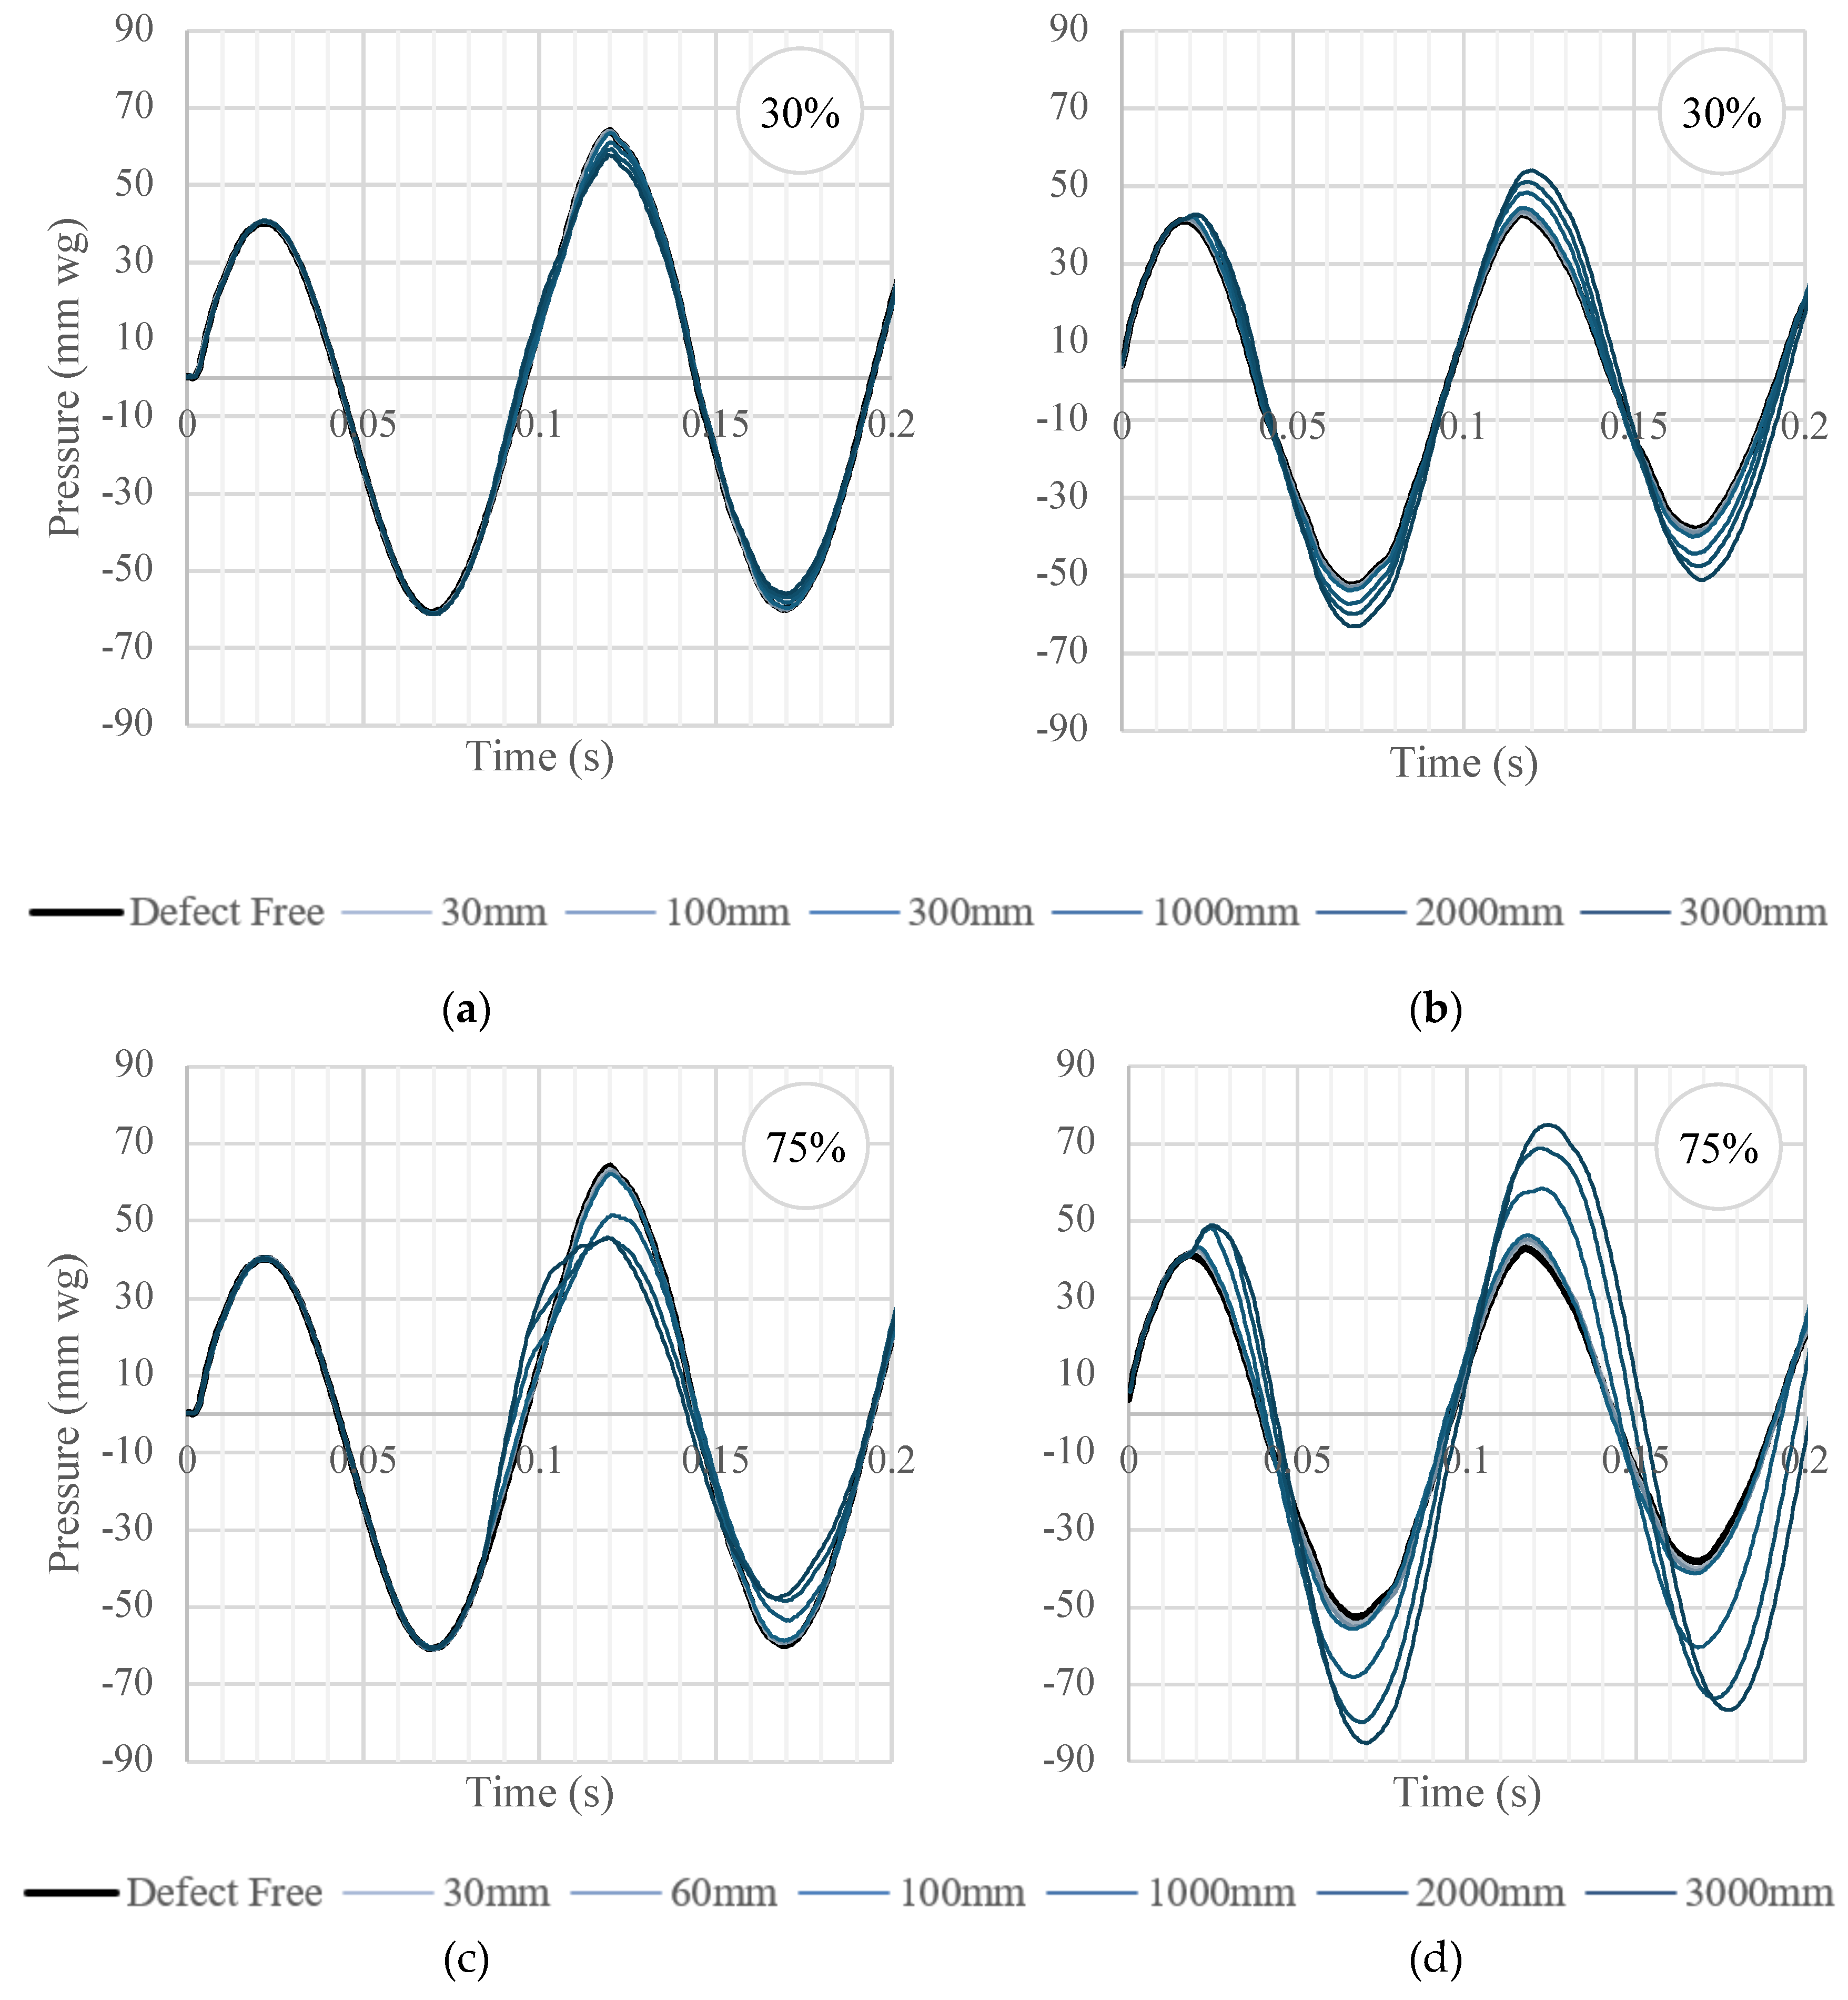
Figure 5.
Time series change detection algorithm applied to the data for the range of lengths of the 30% blockage. The first two columns of pressure and change graphs are for data recorded at P1, the second two columns are for data recorded at P2.
Figure 5.
Time series change detection algorithm applied to the data for the range of lengths of the 30% blockage. The first two columns of pressure and change graphs are for data recorded at P1, the second two columns are for data recorded at P2.
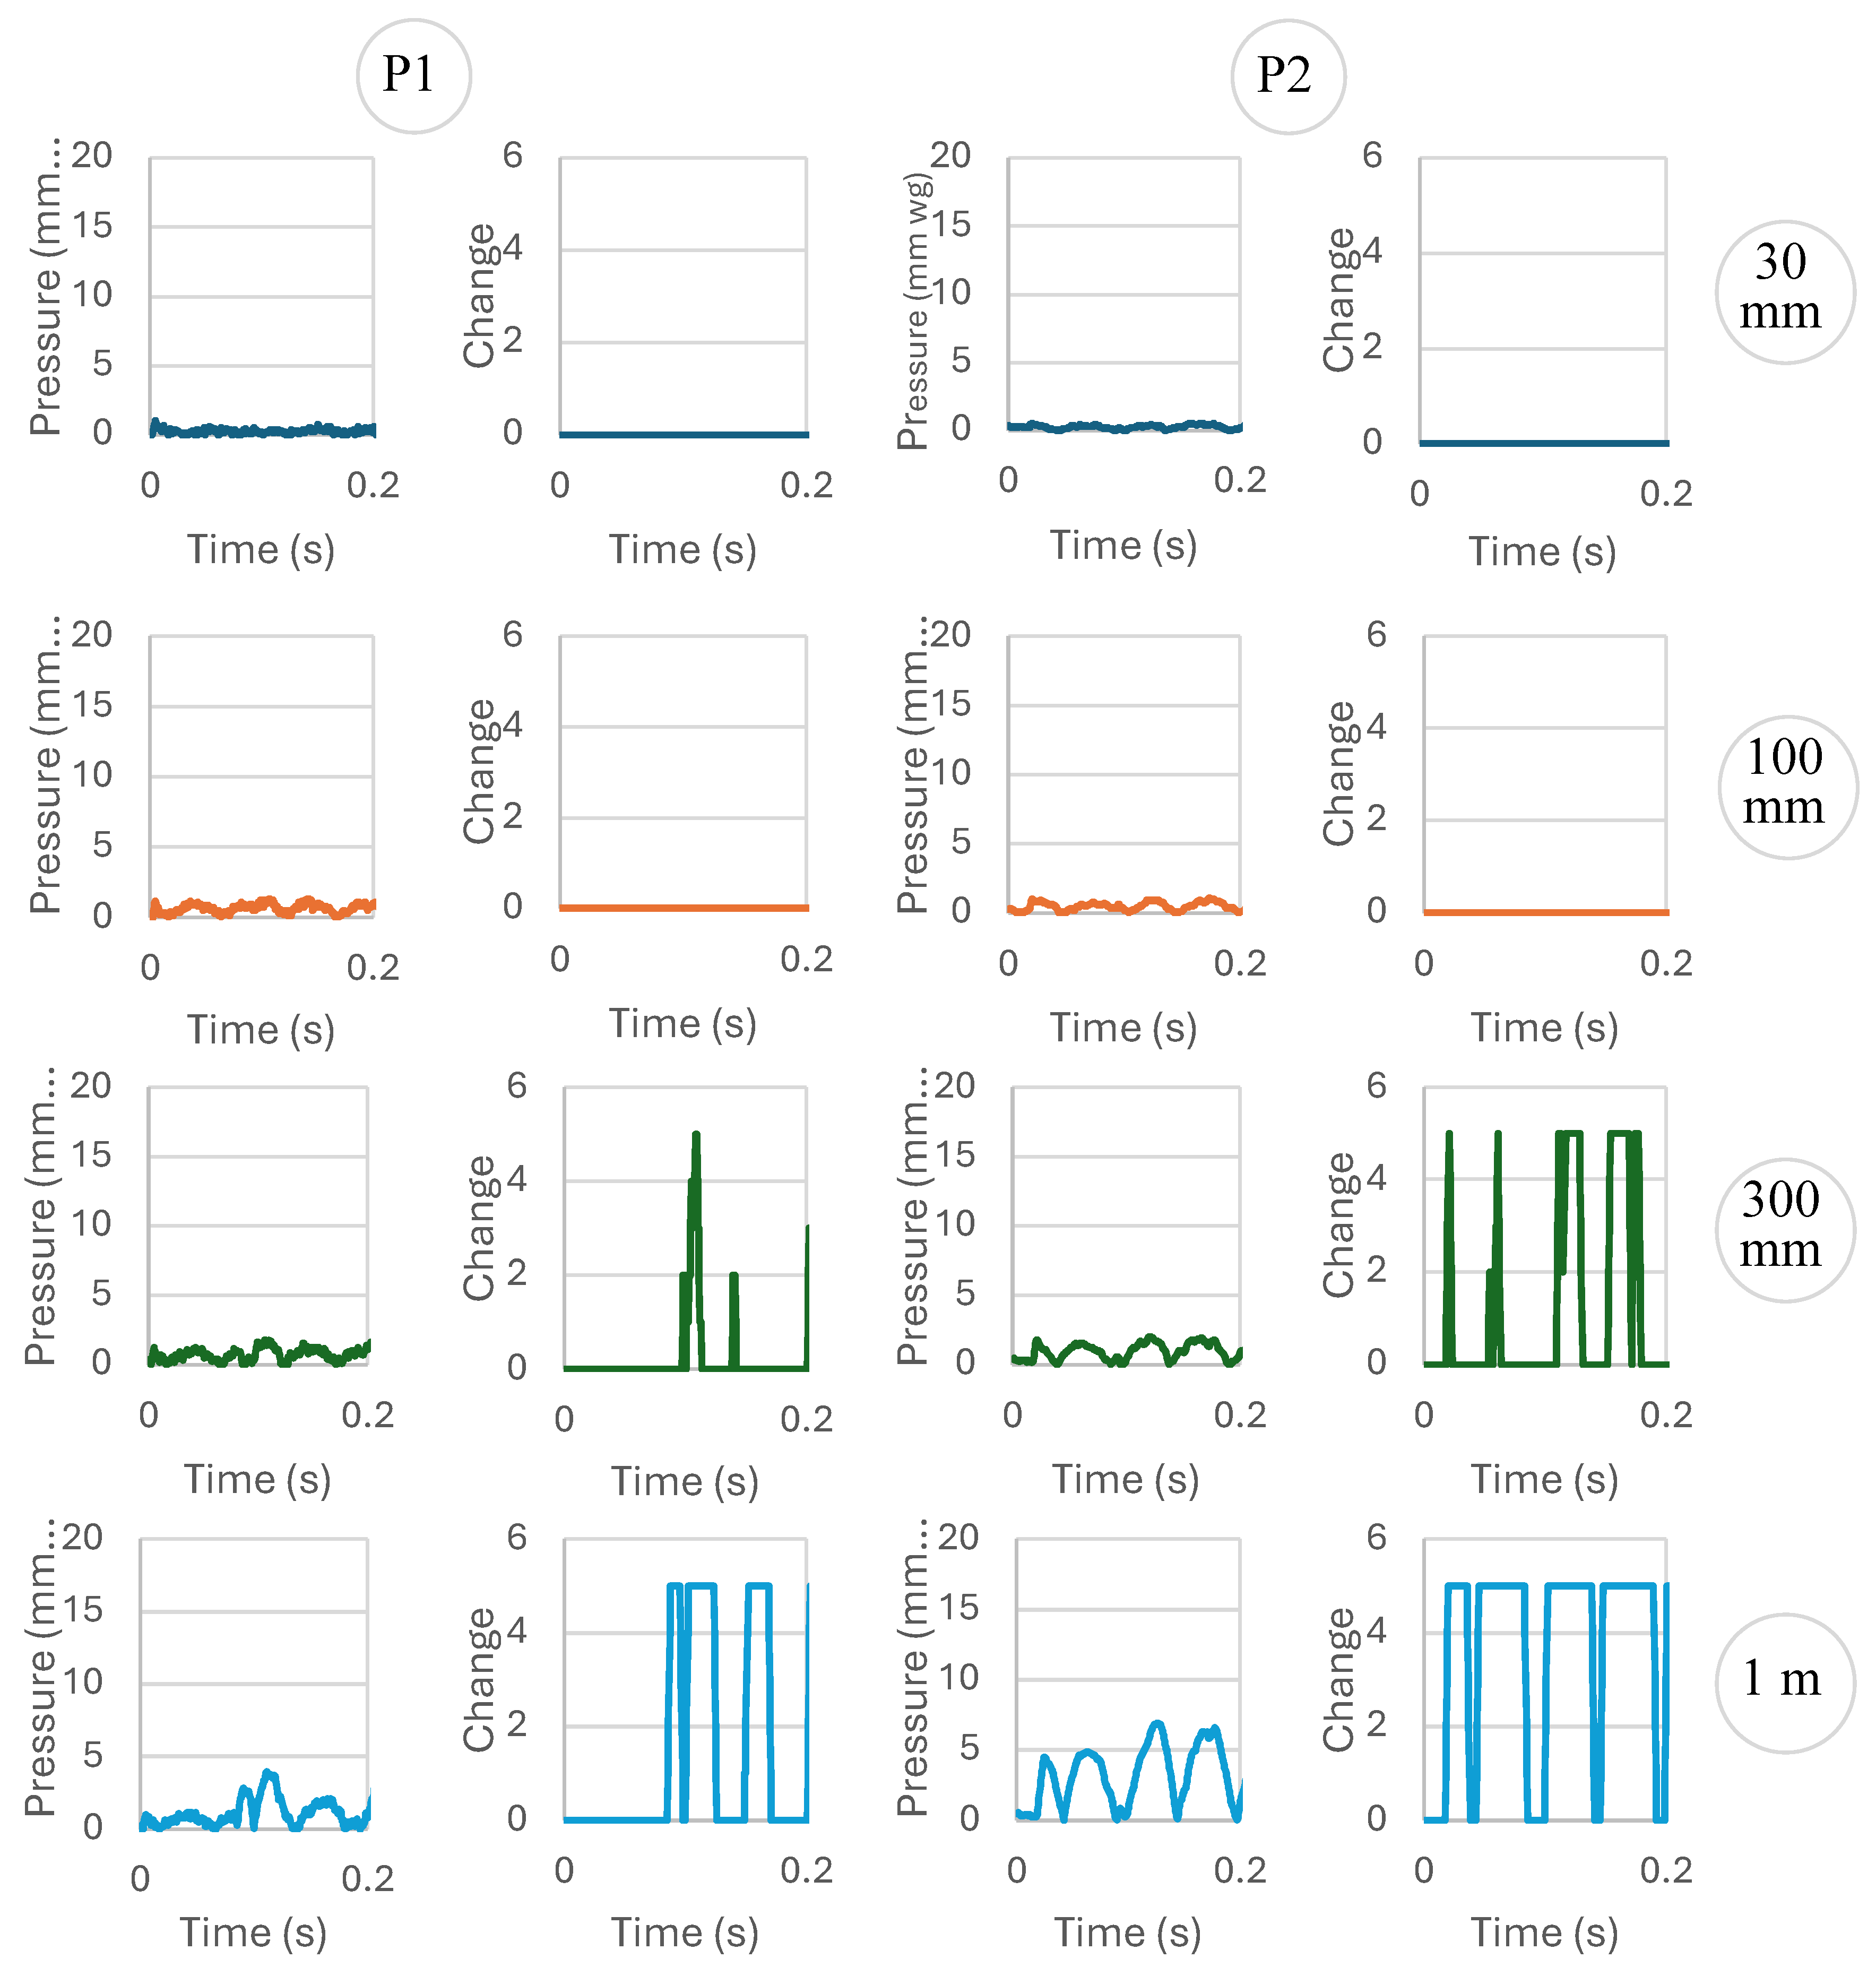
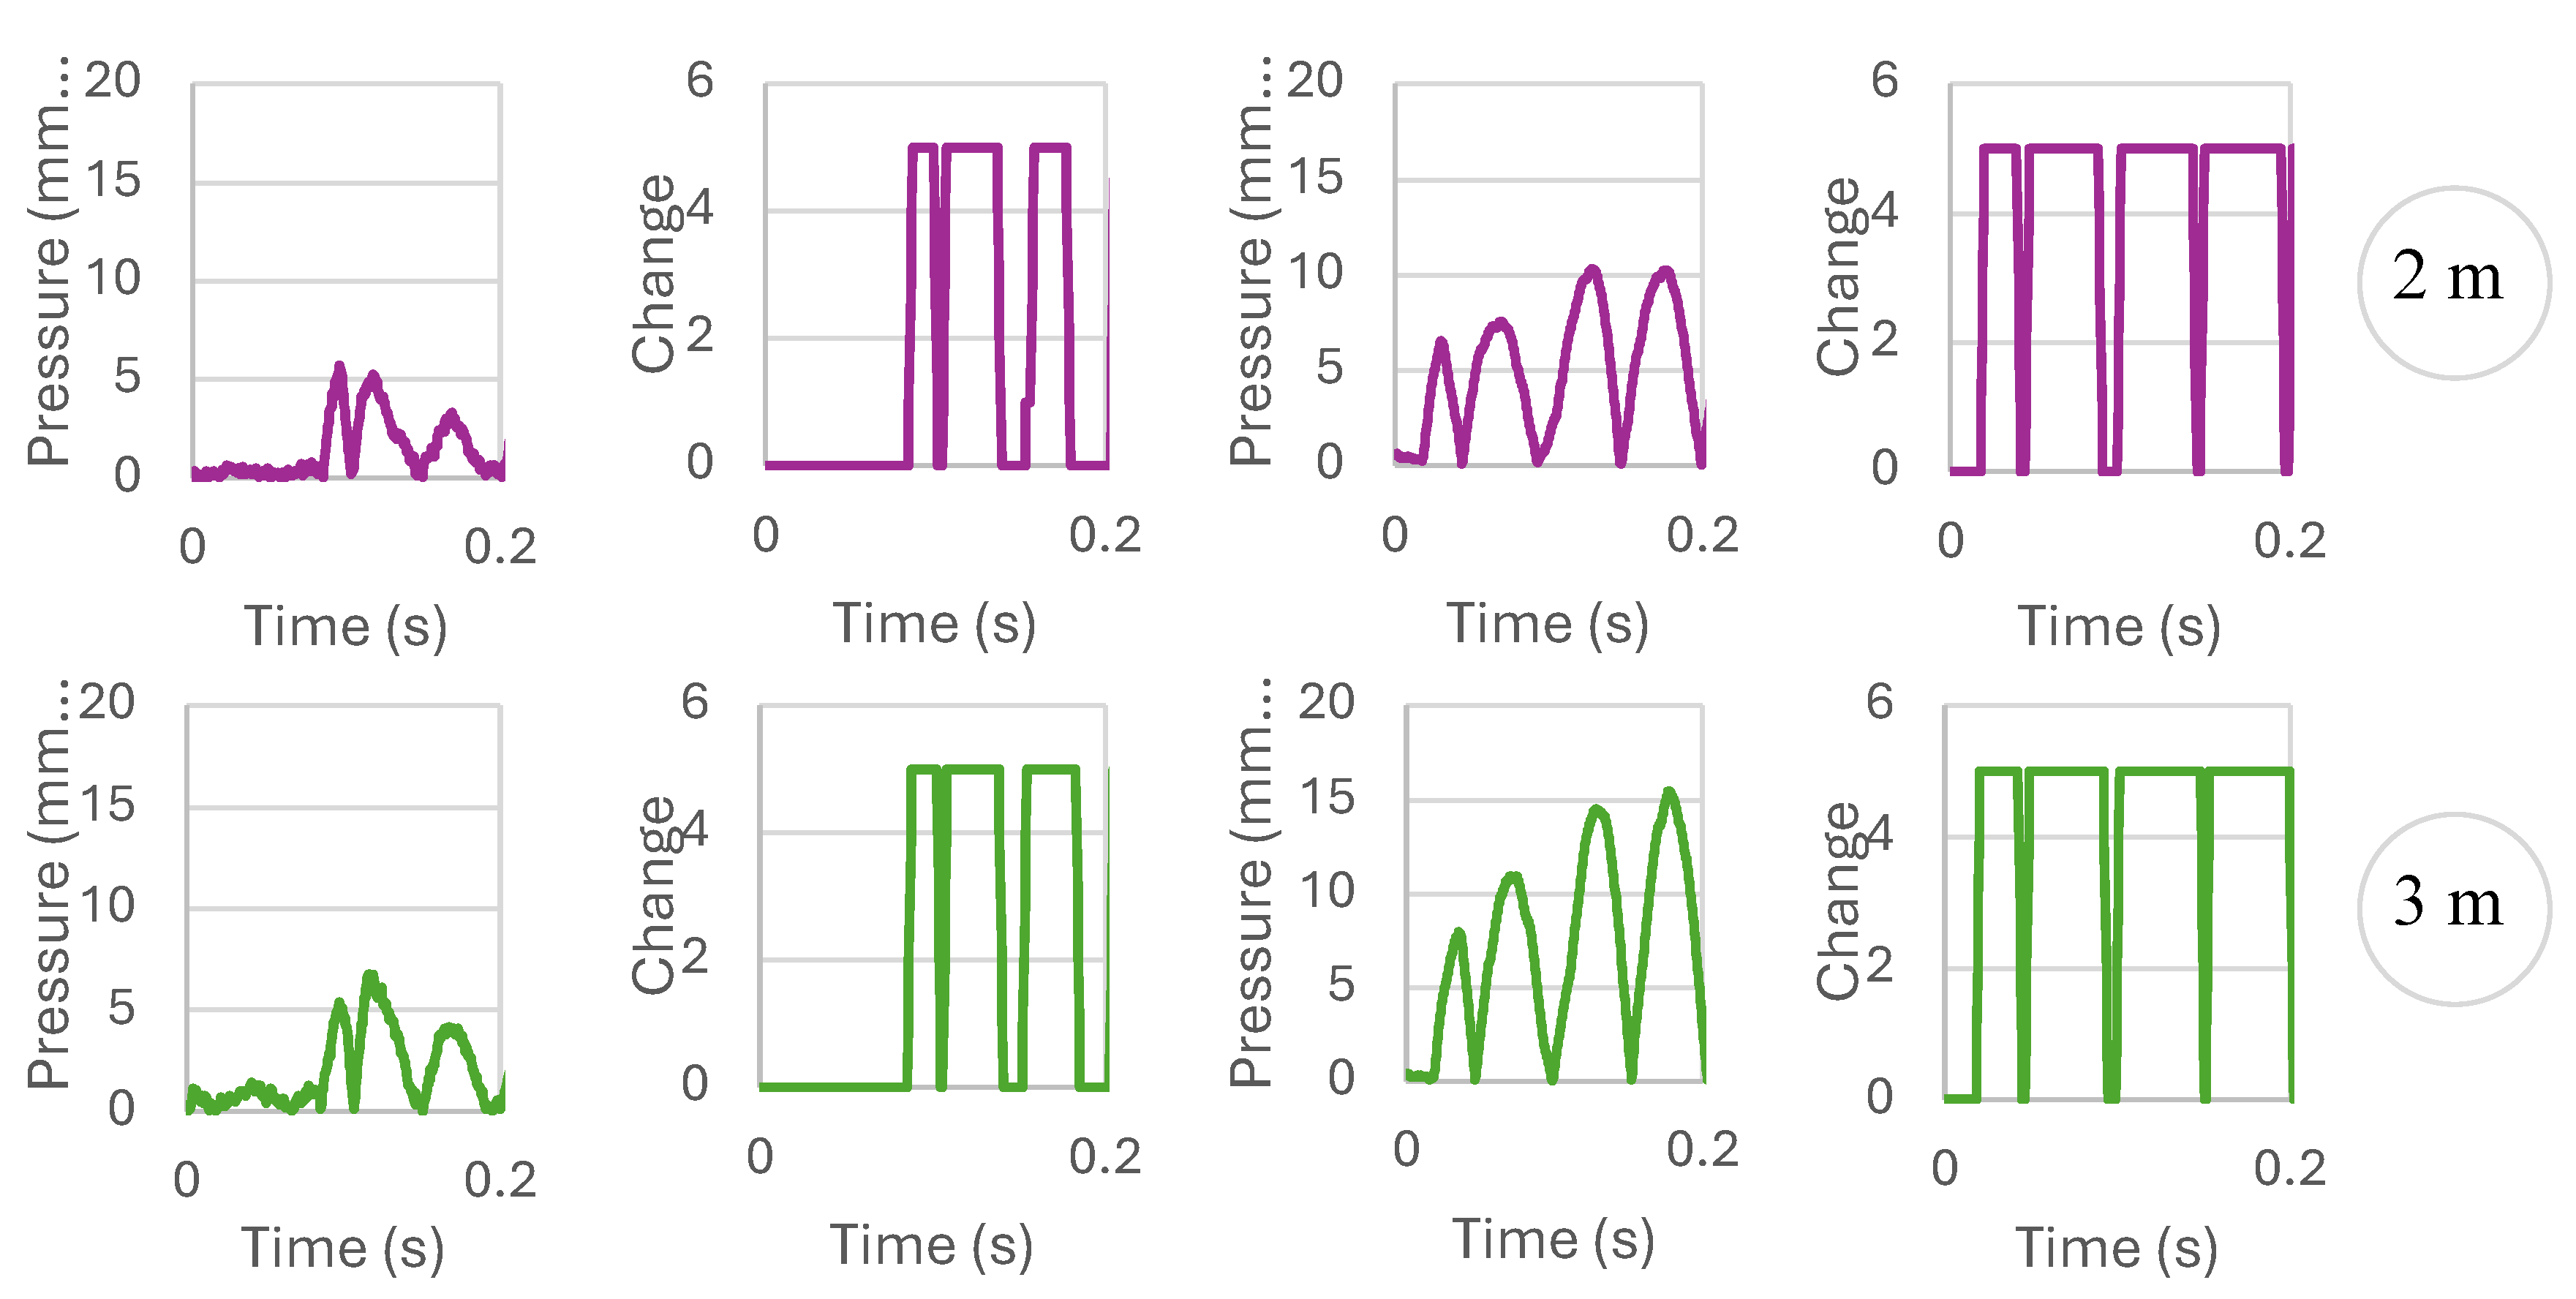

Table 1.
Physical properties of the range of blockages used in this study. Cross-sectional coverage values are in relation to the 100 mm diameter test-rig pipework (cross-sectional area of 78.54 cm2)
Table 1.
Physical properties of the range of blockages used in this study. Cross-sectional coverage values are in relation to the 100 mm diameter test-rig pipework (cross-sectional area of 78.54 cm2)
| Cross-sectional coverage | Cross-sectional area (cm2) | Length (m) |
Volume (m3) |
|---|---|---|---|
| 30% | 23.6 | 0.03 | 0.07 |
| 0.1 | 0.24 | ||
| 0.3 | 0.71 | ||
| 1.0 | 2.36 | ||
| 2.0 | 4.71 | ||
| 3.0 | 7.07 | ||
| 75% | 58.9 | 0.03 | 0.18 |
| 0.06 | 0.35 | ||
| 0.1 | 0.59 | ||
| 1.0 | 5.89 | ||
| 2.0 | 11.78 | ||
| 3.0 | 17.67 |
Table 2.
Results of applying the time series change detection algorithm to detect 30% and 75% blockages of various lengths within a 100 mm diameter drain-pipe
Table 2.
Results of applying the time series change detection algorithm to detect 30% and 75% blockages of various lengths within a 100 mm diameter drain-pipe
| Cross-sectional coverage | Pressure Sensor | Blockage Characteristics | Detected Blockage Information | Variance | |||
|---|---|---|---|---|---|---|---|
| Location (m) |
Pipe Period (s) |
Length (mm) |
Pipe Period (s) |
Location (m) |
|||
| 30% | P1 |
14 | 0.0816 | 30 | #N/A | #N/A | #N/A |
| 100 | #N/A | #N/A | #N/A | ||||
| 300 | 0.1085 | 18.61 | 33% | ||||
| 1000 | 0.0875 | 15.01 | 7% | ||||
| 2000 | 0.0865 | 14.83 | 6% | ||||
| 3000 | 0.0880 | 15.09 | 8% | ||||
| P2 | 3.4 | 0.0198 | 30 | #N/A | #N/A | #N/A | |
| 100 | #N/A | #N/A | #N/A | ||||
| 300 | 0.0205 | 3.52 | 3% | ||||
| 1000 | 0.0200 | 3.43 | 1% | ||||
| 2000 | 0.0200 | 3.43 | 1% | ||||
| 3000 | 0.0205 | 3.52 | 3% | ||||
| 75% | P1 |
14 | 0.0816 | 30 | #N/A | #N/A | #N/A |
| 60 | 0.1070 | 18.35 | 31% | ||||
| 100 | 0.0850 | 14.58 | 4% | ||||
| 1000 | 0.0855 | 14.66 | 5% | ||||
| 2000 | 0.0845 | 14.49 | 4% | ||||
| 3000 | 0.0850 | 14.58 | 4% | ||||
| P2 | 3.4 | 0.0198 | 30 | 0.0200 | 3.43 | 1% | |
| 60 | 0.0195 | 3.34 | -2% | ||||
| 100 | 0.0195 | 3.34 | -2% | ||||
| 1000 | 0.0200 | 3.43 | 1% | ||||
| 2000 | 0.0195 | 3.34 | -2% | ||||
| 3000 | 0.0195 | 3.34 | -2% | ||||
Disclaimer/Publisher’s Note: The statements, opinions and data contained in all publications are solely those of the individual author(s) and contributor(s) and not of MDPI and/or the editor(s). MDPI and/or the editor(s) disclaim responsibility for any injury to people or property resulting from any ideas, methods, instructions or products referred to in the content. |
© 2024 by the authors. Licensee MDPI, Basel, Switzerland. This article is an open access article distributed under the terms and conditions of the Creative Commons Attribution (CC BY) license (http://creativecommons.org/licenses/by/4.0/).
Copyright: This open access article is published under a Creative Commons CC BY 4.0 license, which permit the free download, distribution, and reuse, provided that the author and preprint are cited in any reuse.


