
Submitted:
18 July 2024
Posted:
19 July 2024
You are already at the latest version
Abstract
In order to study the effect of explosion load on the flexural performance of RC beams, two RC beams of the same size were carried out explosion test and bearing capacity test successively. Piezoelectric intelligent aggregate was embedded in the beams in advance to monitor the damage state of the beams, which realized the whole process of damage monitoring of the concrete inside the structure from explosion damage to compression damage.Based on wavelet packet analysis and residual bearing capacity damage evaluation criteria, the beam damage was quantitatively evaluated, and the bending bearing capacity of RC beam after explosion damage was compared and analyzed.The results show that the change of concrete strain gauge signal, the phenomenon of crack development and the increase of internal crack development index indicate that the RC beam is damaged by explosion load.After explosion damage, the damage index of the beam increases and the residual bending capacity decreases, which proves that the piezoelectric intelligent aggregate sensor can effectively monitor the bending capacity change of the component after explosion damage.
Keywords:
piezoelectric intelligent aggregate
; explosion load
; high strength concrete beam
; bending resistance
; damage monitoring
; wavelet packet analysis
1. Introduction
Reinforced concrete beams are important components in concrete structures, and when concrete beams are broken, the appearance and function of the structure will be affected, thus significantly affecting the durability of the structure [1]. Explosions have a very dangerous effect on buildings as they can cause serious damage to buildings, resulting in loss of life. As blasting overpressure may cause very strong load, beam damage caused by explosion load will shorten the service time of the structure and even cause the collapse of the structure [2]. Using effective means to monitor the damage of RC beams and study the residual bearing capacity of RC beams after blast impact damage is of great significance to evaluate the safety of RC structures.
At present, there are a lot of studies on the analysis of antiknock performance and damage assessment of reinforced concrete beams damaged by explosion loads [3,4,5]. Yang et al. [6] studied the dynamic characteristics of reinforced concrete beams under explosion load and carried out near-field explosion tests with five different rubber modified concrete contents. Katchalla et al. [7] adopted LS-DYNA numerical method to establish probabilistic models of reinforced concrete beams and columns under six kinds of explosion loads, and verified the reliability of the probability equation by comparing the probabilistic models with experimental results. Li et al. [8] studied the anti-knock performance of high-strength concrete beams under different concrete strengths and longitudinal reinforcement ratios. Li et al. [9] conducted explosion tests on concrete beams made of high-strength concrete and 520mpa stainless steel reinforcement to study the flexural performance of high-strength concrete beams made of stainless steel reinforcement. Xu et al. [10] studied the failure mode and dynamic response of RC beams under the action of continuous explosions, and compared the antiknock performance of two 0.5kgTNT continuous explosions and a single 1kgTNT explosion at the same distance and the same proportional distance. Li et al. [11] conducted an explosion test on 23 P-section reinforced concrete beams with a length of 100cm to study the effects of different explosive locations and distance on the antiknock performance of the components. TNT is located at three locations: The damage degree of reinforced concrete beams can be evaluated by observing the diameter of crater, spalling of concrete and the range of detonation caused by blast load. Liu et al. [12] conducted tests on 10 reinforced concrete beams under different explosion conditions caused by different explosion distances and different combinations of explosives. Based on the test data, an empirical expression was established to correct the relationship between mid-span displacement and proportional distance.
The bearing capacity is the basic parameter of the concrete member, and the degradation degree of the bending bearing capacity is directly related to the change of the mechanical properties of the concrete member. Residual bearing capacity is one of the important factors to evaluate the anti-explosion performance and damage degree of a component. The component will lose part of its bearing capacity after experiencing explosion load, which inevitably increases the possibility of continuous collapse of the structure. Therefore, it is very important to study the residual bearing capacity of the component after the explosion load. Ding et al. [13] studied the prediction of the residual bearing capacity of corroded RC columns based on machine learning method, established a prediction model of the residual bearing capacity of corroded RC columns, and carried out tests on the influence of stirrup corrosion level, shear span ratio and axial load ratio on the residual bearing capacity of corroded RC columns. Liu et al. [14] took the actual fire-damaged bridge as an example, established a mechanical numerical model considering the internal temperature field, and analyzed the residual bearing capacity of hollow slab beams with different damage degrees in a fire. Chen et al. [15] in order to study the structural performance of corroded reinforced concrete columns under different load conditions, the regression fitting method is used to simplify the calculation of bearing capacity coefficient of steel bars, an effective method for evaluating the residual bearing capacity of steel bars is proposed. Deng et al. [16] used nonlinear finite element analysis to study the variation of residual bearing capacity of T-shaped joints with square hollow sections under impact load. Mi et al. [17] studied the residual bearing capacity of 3 CFST columns and 7 CFDST columns under impact loads, and analyzed the effects of steel tube thickness, concrete type, impact energy and impact load on the residual bearing capacity. Molkens et al. [18] proposed an evaluation method to evaluate the residual bearing capacity of concrete structures after fire by evaluating the load imposed on the slabs based on the maximum allowable characteristic value of the running. Mohammed et al. [19] carried out a flexural bearing capacity test of glass fiber reinforced polymer reinforced concrete beams to study the influence of different PET fiber content concrete on the flexural performance of the components.
Various non-destructive testing (NDT) techniques can be used to detect the state of important components in a structure. At present, the non-destructive testing methods used for building structures mainly include ultrasonic detection method [20], acoustic emission monitoring method [21], image processing monitoring method [22], optical fiber sensor [23], impact echo method [24], etc. Kuznetsov et al. [25] detect the internal defects of concrete and reinforced concrete structures with ultrasonic low-frequency tomography instruments. Liu et al. [26] used acoustic emission technology to evaluate the mechanical properties of concrete beams reinforced by BFRP plates, and studied the damage process and mechanism of components in the flexural bearing capacity test by analyzing acoustic emission signals without AE parameters. Pazdera et al. [27] used the non-destructive testing method of impact echo to determine the location and extent of internal defects in fire-damaged reinforced concrete structures. Lei et al. [28] combined UAV technology with digital image processing technology for crack detection of bridge structures. Rajabi et al. [29] used Schmidt rebound hammer method and ultrasonic pulse velocity test as non-destructive testing to evaluate the mechanical properties of two-stage concrete (TSC) and conventional concrete.
At present, lead zirconate titanate (PZT) sensors are widely used in the field of building structural health monitoring due to their advantages such as low price [30], good piezoelectric effect [31], broadband frequency response [32], and sensing and driving functions [33,34]. However, because PZT is very fragile, it is easily affected by the external environment. In order to be embedded in concrete structures, piezoelectric ceramic sheets are encapsulated in concrete blocks to obtain SmartAggregate (SA) [35].Since then, SA has been widely used in damage monitoring, including crack monitoring of concrete structures.Li et al. [36] compared embedded SA sensors with traditional surface-mounted acoustic emission (AE) sensors in terms of their ability to detect and assess damage to concrete structures.The results verify the feasibility of using intelligent aggregate as embedded AE sensor to monitor the damage of concrete structures.Zou et al. [37] studied the influence of temperature on the performance of the SA-based active monitoring method for concrete structures.Jiang et al. [38] used an embedded piezoelectric ceramic sensor to monitor the degradation caused by corrosion in prestressed concrete structures, and verified that the proposed monitoring method can provide early warning for the initial corrosion of prestressed concrete structures.Xu et al. [39] proposed a new method for damage detection of concrete column structures under explosion load by using embedded SA, and proved the effectiveness of embedded SAs active sensing in column damage monitoring under explosion load.Xu et al. [40] used SA-based active sensing technology to monitor bond slip in GFRP-reinforced concrete structures.
In this paper, the active sensing technology based on piezoelectric smart aggregate is used to carry out explosion tests on two RC beams embedded with piezoelectric smart aggregate. The existence of explosion damage is proved by the development of cracks, the dynamic strain of concrete and the change of piezoelectric signal. In order to study the law of the residual bearing capacity of the beam after explosion, the bearing capacity test of the beam after explosion test is further carried out, and the bending behavior of the beam damaged by explosion is studied through the deformation of the beam and the change of piezoelectric signal. The internal crack development index R obtained by wavelet packet analysis method is compared with the damage index D based on the damage evaluation criterion of residual bearing capacity. It is proved that piezoelectric intelligent aggregate sensor can effectively monitor the change of flexural bearing capacity of components after explosion damage.
2. Piezoelectric Intelligent Aggregate Monitoring Principle
2.1. Piezoelectric Intelligent Aggregate and Active sensing Technology Loss Measurement Principle
Lead zirconate titanate (PZT) is a commonly used piezoelectric material with strong piezoelectric effect. Since PZT is a brittle material and is susceptible to the external environment, two marble blocks are used to package PZT, which can increase its service life without affecting the function of PZT material. Finally, the BNC joint is connected to form piezoelectric intelligent aggregate (smartaggregate, SA).SA is characterized by piezoelectric effect, which can be divided into positive piezoelectric effect and inverse piezoelectric effect [41]. When the piezoelectric material is subjected to external load and deforms, polarization occurs inside the material, and polarization anomalous charge appears on the SA surface. This conversion of mechanical energy to electrical energy is called positive piezoelectric effect. Conversely, applying an electric field to the material will create stress and strain on the material, and this conversion of electrical energy to mechanical energy is called the inverse piezoelectric effect. Then using the piezoelectric effect of SA and the characteristics of imbedding concrete structure, piezoelectric smart aggregate embedded in concrete can be used as a driver to generate stress waves or a sensor to receive stress waves. The piezoelectric intelligent aggregate SA1 is specified as the driving end and the aggregate SA2 as the receiving end of the signal. When the stress wave meets the damage such as cracks in the structure during propagation, the energy of the stress wave will be attenuated, as shown in Figure 1.
2.2. Damage Index Based on Wavelet Packet Energy
Concrete members are those with initial cracks, and some of the energy of stress waves will be lost in the transmission process. However, when damage cracks appear, the stress wave energy at the receiving end will be greatly weakened, and the attenuation amplitude of stress wave energy will increase with the increase of structural damage degree. Therefore, by comparing the stress wave energy of piezoelectric sensor before and after damage, the internal damage degree of concrete member can be determined. In order to avoid signal interference, it is necessary to use appropriate signal processing technology for noise reduction. Wavelet packet analysis can effectively extract the required signal amplitude, and on the premise of multi-layer resolution analysis of the frequency band, the high-frequency signal is further decomposed into low frequency and high frequency signals by Fourier transform method, and the best basis function is selected adaptively to match the signal, so as to improve the signal analysis ability [42]. In this study, wavelet analysis was used to obtain the response value of the received energy of the sensor.
Signal S is decomposed for n times to obtain 2n sets of signals, where the signal in the frequency band is (m is the sampling point). is time band signal energy, the expression is:
Therefore, the decomposed energy vector of signal S at time i is:
Let i=0, the internal structure is in a lossless state, combined with the root mean square index to determine the structural damage degree at time i, the internal crack development index R is the structural damage degree formula is:
When the R-value approaches 0, the component is considered healthy. When the value of R is close to 1, the structure is in a state of complete damage, that is, failure. When the structure is subjected to external loads, with the increase of the load, the crack's ability to weaken the signal will directly cause the R value to change from 0 to 1. Therefore, the piezoelectric active sensing technology can quantitatively evaluate and predict the damage degree inside the structure by the size of the internal crack development index R, which can provide theoretical guidance for the real-time dynamic health monitoring of the structure.
3. Fabrication of Test Components
RC beam is designed with a double-reinforced rectangular section. The section size (b×h) of the beam is 110mm×220mm, and the total length of the beam is L=1.5m. The layout of reinforcement bars, spacing of reinforcement bars and thickness of protective layer of the test beam are shown in Figure 2. Before concrete is poured, two piezoelectric smart aggregates (sas) are symmetrically fixed on the steel cage of the test beam with the span as the center, and the distance between the two sas is 400mm.
In order to study the flexural performance of RC beams under explosion load, two reinforced concrete beams were fabricated. The specimens are made of C40 strength grade concrete and 42.5 grade ordinary Portland cement. The concrete mix ratio design is shown in Table 1 according to JGJ55-2011 "Common Concrete Mix ratio Design Regulations". After curing for 28 days under specified conditions, the cured reinforced concrete beams are shown in Figure 3, numbered BEAM-1 and BEAM-2 respectively.
4. Test Plan
4.1. Explosion Test Is Carried Out on Beam-1 BEAM
In order to compare the flexural performance before and after explosion load, explosion test only causes explosion pre-damage to Beam-1 BEAM, and the equipment required for explosion test is shown in Figure 4. The explosion test was carried out in the laboratory explosion tank. In order to reasonably simulate the boundary conditions of both ends of the beam, the specimen beam was fixed by the steel support. Explosives of 100gTNT equivalent were used in the test, and the explosives were suspended 100mm above the center of the detonation surface of the RC beam, and a millisecond detonator was used to detonate, as shown in Figure 5. At the same time, in order to monitor the dynamic response of the beam, three concrete strain gauges are arranged at the side of the beam every 50mm, numbered S.G.1, S.G.2, S.G.3 from the top of the beam to the bottom of the beam.
4.2. Bearing Capacity Experiment of Two RC Beams
After the explosion test, the bearing capacity test of Beam-1 BEAM and Beam-2 BEAM is carried out. The bearing capacity test equipment is shown in Figure 6. In this test, the flexural performance is studied in the form of four-point loading. The actuator transmits the force to the distribution beam and then the distribution beam transmits it to the specimen beam, and the transmission line connected to the actuator transmits the load data to the computer in real time. It adopts the form of hierarchical loading, and the whole loading rate is controlled at 0.1KN/S. In the initial stage, the load control mode is adopted, with each stage loading 5KN;After the specimen cracks, the load of each stage is increased by 10KN;When the load reaches 0.8 times the calculated value of ultimate bearing capacity, the load grade is encrypted, and each grade is 5KN until the specimen is damaged. According to GBT50152-2012 "Standard for Test Methods of Concrete structures", one of the following phenomena occurs, that is, when the concrete in the compression zone is crushed and collapsed, the mid-span bending deflection reaches 1/5 of the span or the main crack in the tension zone reaches 1.50mm, the beam body is judged to be damaged. In order to monitor the concrete strain on the beam side, 5 concrete strain gauges are arranged in the side span of the beam from the top of the beam to the bottom of the beam every 50mm. The numbers are A1, A2, A3, A4 and A5 from the top of the beam to the bottom of the beam. The mid-span deformation was obtained through the analysis of the data change of the displacement meter, and a displacement meter was placed at the span and two supports respectively, as shown in Figure 7.
5. Test Results and Analysis
5.1. Analysis of Explosion Damage Results of Beam-1 BEAM
After the explosion test, the explosion damage of Beam-1 BEAM is shown in Figure 8. Part of the white layer on the blasting surface is washed off, and the concrete at the edge is slightly peeled off. In the middle area of the side span, there is a top-down penetrating crack and 7 oblique cracks, which are roughly symmetrical distribution. The overall damage degree of the specimen beam under the action of explosion load is not large.
Figure 9 shows the time-history curve of dynamic strain of concrete on the sides of three beams. The analysis of the results shows that, compared with the peak strain values of the three concrete strain gauges, the peak strain values of S.G.1 and S.G.2 are 1.89 times and 1.42 times of those of S.G.3 respectively, and the peak strain values of concrete gradually decrease from near the explosion facing surface to near the back explosion surface. The further the distance from the explosion source, the smaller the tensile stress of the concrete and the smaller the deformation.
Figure 10 reflects the reception of piezoelectric signals of Beam-1 BEAM before and after the explosion. It can be concluded that the explosion caused damage to the components, thus weakening the piezoelectric signals. Based on the internal crack development index R obtained by wavelet packet analysis, the internal crack development index of DBEAM-1 beam is 0.79. According to the comparison of piezoelectric signal time history curve and internal crack development index, it can be shown that the explosion load causes internal cracks and weakens the piezoelectric signal. Consistent with the damage status diagram and strain results, it reflects that the explosion load causes damage to Beam-1 BEAM, and verifies that the change of piezoelectric signal obtained by piezoelectric active sensing technology can reflect the damage caused by explosion load on the member.
5.2. Analysis of Bearing Capacity Test Results of Two Beams
Figure 11 shows the crack development of BEAM-1 and BEAM-2 beams after bearing capacity test. By comparing Figure 11 (a) and (b), it can be seen that the number of cracks in beams without explosion damage (BEAM-2) is more than that of beams with explosion damage (BEAM-1), because the explosion load causes cracks in BEAM-1. As the load of bearing capacity test increases, The initial crack from the explosion will develop rapidly and the concrete in the compression zone will be crushed faster, and the structure will fail. The ultimate bearing capacity of the concrete in the compression zone of beams without explosion damage is larger, which indicates that the bending bearing capacity of the beams is degraded by explosion load.
The load-deflection curve of the specimen beam is shown in Figure 12. By comparing the load-deflection curves of two specimen beams, it can be seen that: The development law of deflection of specimen beams is similar. During the initial loading process, the mid-span deflection of Beam-1 BEAM under the same load is larger than that of Beam-2 BEAM. Compared with the initial slope of the curve, it can be concluded that the initial section bending stiffness of Beam-1 BEAM is 50.3% of that of Beam-2 BEAM, indicating that the explosion load weakens the initial section stiffness of the flexural member to a certain extent. In the failure stage, the final deflection of Beam-1 BEAM is reduced by 16.0% compared with Beam-2 BEAM, which can prove that the ductility of Beam-2 BEAM is better than that of Beam-1 BEAM, and the plastic behavior of reinforced concrete beam is more obvious after explosion damage.
The concrete strain distribution along the interface height under different loads is shown in Figure 13. From the concrete strain distribution curve of Beam-2 BEAM, it can be seen that the strain distribution section of concrete at 20KN conforms to the assumption of plain section, and the linear relationship of strain is good. With the continuous increase of the load, the lower concrete cracks and gradually exits the work, and the position of the neutral axis begins to shift upward at 50KN, and the relative height of the compression zone gradually decreases. At each stage of loading in the later stage, it can be observed that the height of the relative pressure zone is further reduced, and the neutral axis is further moved up until the component is completely failed and destroyed. Compared with Beam-2, it is found that the neutralization axis of Beam-1 BEAM has shifted upward since the initial loading, because the explosion load has caused certain damage to the entire concrete structure. Once the load is loaded, these damage micro-cracks will quickly go through and crack, resulting in the upward movement of the neutralization axis and the reduction of the compression zone during the initial loading process.
Figure 14 shows the time history curve of piezoelectric signal waveform before and after the bearing capacity of Beam-2 BEAM. It can be seen that the signal before the bearing capacity is fuller, and the piezoelectric signal gradually weakens with the increase of load, while the signal after the bending failure of the member is greatly reduced in terms of amplitude and energy, indicating that the failure of the member will significantly weaken the piezoelectric signal. The signal waveform time history curve of Beam-1 BEAM before and after static pressure is shown in Figure 15. The development of piezoelectric signal of Beam-1 BEAM is different from that of Beam-2 BEAM. Before static pressure, the receiving end of Beam-1 beam can still receive a certain intensity signal. The signal is enhanced because the concrete microcracks in the compression zone created by the explosion are constantly squeezed and closed during the process of load increase. To a certain extent, the cracks in the concrete are reduced and the piezoelectric signal is strengthened. After that, the signal began to decline rapidly until the component was destroyed, and the signal basically disappeared.
After the piezoelectric signal was processed by wavelet packet analysis method, it was converted into the internal crack development index-load curve under continuous loading during the test process, as shown in Figure 16. The damage curve of Beam-2 BEAM is regarded as three stages: the beam is in a healthy state before static pressure, and the internal crack development index changes gently in the initial stage, at which time the beam is in the elastic stage. After reaching the cracking load, the internal crack development index has a relatively obvious steep decline, which is called the crack development stage. When the generation and development of cracks reach a certain extent, it is mainly due to the expansion of crack width, and the growth rate of internal crack development index tends to be flat until the bearing capacity of the member is completely lost, and the damage index becomes 1. The signal of Beam-1 BEAM is different from that of Beam-2 BEAM. The damage development of Beam-1 beam can be regarded as two stages: healing section and failure section. The crack development index in the healing section will gradually decrease to close to 0. The crack development index in the failure section will rapidly develop to 1. The turning point of the crack development index is defined as the crack healing point, and the appearance of the crack healing point corresponds to the piezoelectric signal amplitude increasing to the maximum immediately. From the internal crack development curve, it can be seen that the crack healing point of Beam-1 BEAM appears at 96KN, and its residual flexural bearing capacity is 166.9KN. In the test, the appearance of the crack healing point means that 57.52% of the ultimate load has been reached, and the appearance of the crack healing point means that the internal damage of the member will develop rapidly until the failure of the member. The fracture healing point of the damaged component can predict the damage of the component in advance and give a warning.
5.3. Analysis of Flexural Capacity
As a basic parameter of reinforced concrete beams, flexural capacity is directly related to the damage of reinforced concrete beams and can be used to evaluate various failure modes of reinforced concrete beams. Therefore, flexural capacity is an important parameter for damage assessment of reinforced concrete beams. The damage assessment method based on residual bearing capacity [43] is used to quantitatively evaluate the damage of reinforced concrete beams under explosion load. The expression of damage index D is defined as follows:
where N' is the residual bearing capacity of beams after explosion and N is the bearing capacity of unexploded damaged beams. The damage grade of reinforced concrete beams based on bearing capacity degradation is defined as follows: D=0.0~0.2, indicating mild injury; D=0.2~0.5, indicating moderate injury; D=0.5~0.8, indicating serious injury; D=0.8~1.0, indicating collapse.
The ultimate load of the high-strength concrete beam is the corresponding ultimate bearing capacity/residual bending bearing capacity of the specimen. The residual flexural bearing capacity of Beam-2 BEAM is 194.8KN, and that of Beam-1 BEAM is 166.9 KN, and the damage index D is 0.143, indicating that the bearing capacity degradation of Beam-1 BEAM is 14.3%, indicating mild damage. The results are shown in Table 3. From the comparative analysis of the two, it can be seen that the bearing capacity of Beam-1 BEAM decreases to a certain extent compared with that of Beam-2 BEAM, indicating that the piezoelectric active sensing technology can sensitically capture the damage and bearing capacity decline of the structure. In addition, the piezoelectric signal is very sensitive to the cracking of the structure, so the damage index is relatively larger than the bearing capacity degradation. It can provide a good early warning function for engineering practice.
Combining the piezoelectric intelligent aggregate signal and the residual bearing capacity damage index, it can be seen that the bending bearing capacity of reinforced concrete beams will decrease to a certain extent when the piezoelectric signal has a certain loss, which proves the effectiveness of piezoelectric active sensing technology for monitoring the bearing capacity changes of components.
6. Conclusions
(1) Based on piezoelectric active sensing technology, the internal crack development index was defined to evaluate the internal damage degree of high-strength concrete beams, and the dynamic damage process of specimen beams under explosion load was tracked. The results show that the internal crack development index of RC beams subjected to explosion load increases significantly, which proves that the piezoelectric active sensing technology can effectively monitor the dynamic damage of RC beams under explosion load.
(2) The internal crack development index of Beam-2 BEAM can be divided into three stages: initial stage, development stage and failure stage; BEAM-1 beams go through two stages: healing and destruction. When the static pressure load reaches 143KN, the crack healing point of Beam-1 BEAM appears, and 78.37% of the ultimate load of the member has been reached. It indicates that the fracture healing point is close to the ultimate load of the member failure, and the fracture healing point of the damaged member can predict the failure of the member in advance and give a warning.
(3) After the explosion damage is detected by the built-in piezoelectric intelligent aggregate, the static load test is carried out to verify the results. The results show that the internal crack development index of the RC beam under the explosion load increases while its residual bending capacity decreases, showing mild damage, which proves the effectiveness of the piezoelectric active sensing technology for monitoring the change of the bearing capacity of the member.
References
- Zhong, J.; Song, C.; Xu, J.; Cheng, Y.; Liu, F. Experimental and numerical simulation study on failure mode transformation law of reinforced concrete beam under impact load. Int. J. Impact Eng. 2023, 179. [Google Scholar] [CrossRef]
- Carta, G.; Stochino, F. Theoretical models to predict the flexural failure of reinforced concrete beams under blast loads. Eng. Struct. 2012, 49, 306–315. [Google Scholar] [CrossRef]
- Wang, W.; Yang, G.; Yang, J.; Wang, J.; Wang, X. Experimental and numerical research on reinforced concrete slabs strengthened with POZD coated corrugated steel under contact explosive load. Int. J. Impact Eng. 2022, 166. [Google Scholar] [CrossRef]
- Hanifehzadeh, M.; Aryan, H.; Gencturk, B.; Akyniyazov, D. Structural Response of Steel Jacket-UHPC Retrofitted Reinforced Concrete Columns under Blast Loading. Materials 2021, 14, 1521. [Google Scholar] [CrossRef]
- Zhao, C.; Liu, Y.; Wang, P.; Jiang, M.; Zhou, J.; Kong, X.; Chen, Y.; Jin, F. Wrapping and anchoring effects on CFRP strengthened reinforced concrete arches subjected to blast loads. Struct. Concr. 2020, 22, 1913–1926. [Google Scholar] [CrossRef]
- Yang, F.; Ke, Z.; Feng, W.; Li, X.; Chen, S.; Li, H. Effects of crumb rubber particles on the dynamic response of reinforced concrete beams subjected to blast loads. Eng. Struct. 2024, 300. [Google Scholar] [CrossRef]
- Katchalla, B.; Jaswanth, G.; Mukesh, K.; Kasturi, B.; Hrishikesh, S. Performance-based probabilistic deflection capacity models and fragility estimation for reinforced concrete column and beam subjected to blast loading. Reliability Engineering & System Safety. 2022, 227, 108729. [Google Scholar]
- Li, Y.; Algassem, O.; Aoude, H. Response of high-strength reinforced concrete beams under shock-tube induced blast loading. Constr. Build. Mater. 2018, 189, 420–437. [Google Scholar] [CrossRef]
- Li, Y.; Aoude, H. Effects of stainless steel reinforcement and fibers on the flexural behaviour of high-strength concrete beams subjected to static and blast loading. Eng. Struct. 2023, 291. [Google Scholar] [CrossRef]
- Xu, Y.; Huang, F.; Liu, Y.; Yan, J.; Bai, F.; Yu, H.; Wang, B.; Wang, J. Effect of close-in successive explosions on the blast behaviors of reinforced concrete beams: An experimental study. Structures 2023, 53, 29–46. [Google Scholar] [CrossRef]
- Li, Z.; Liu, Y.; Yan, J.-B.; Yu, W.-L.; Huang, F.-L. Experimental investigation of p-section concrete beams under contact explosion and close-in explosion conditions. Def. Technol. 2018, 14, 540–549. [Google Scholar] [CrossRef]
- Liu, Y.; Yan, J.-B.; Huang, F.-L. Behavior of reinforced concrete beams and columns subjected to blast loading. Def. Technol. 2018, 14, 550–559. [Google Scholar] [CrossRef]
- Ding, Z.; Zheng, S.; Lei, C.; Jia, H.; Chen, Z.; Yu, B. Machine learning-based prediction for residual bearing capacity and failure modes of rectangular corroded RC columns. Ocean Eng. 2023, 281. [Google Scholar] [CrossRef]
- Liu, Z.; Xie, H.; Han, B.; Li, P.; Jiang, Z.; Yu, J. Experimental study on residual bearing capacity of full-size fire-damaged prestressed concrete girders. Structures 2022, 45, 1788–1802. [Google Scholar] [CrossRef]
- Chen, H.-P.; Jiang, Y.; Li, W.-B. Residual load-bearing capacity of corroded reinforced concrete columns with an annular cross-section. Ocean Eng. 2023, 286. [Google Scholar] [CrossRef]
- Deng, P.; Chen, X.; Yang, B.; Guo, J.; Liu, Y. Finite element analysis on the residual bearing capacity of axially preloaded tubular T-joints subjected to impacts. Structures 2021, 31, 286–304. [Google Scholar] [CrossRef]
- Mi, Y.; Liu, Z.; Wang, W.; Yang, Y.; Wu, C. Experimental study on residual axial bearing capacity of UHPFRC-filled steel tubes after lateral impact loading. Structures 2020, 26, 549–561. [Google Scholar] [CrossRef]
- Molkens, T.; Van Coile, R.; Gernay, T. Assessment of damage and residual load bearing capacity of a concrete slab after fire: Applied reliability-based methodology. Eng. Struct. 2017, 150, 969–985. [Google Scholar] [CrossRef]
- Mohammed, A.A.; Muhammad, M.A.; Mohammed, B.K. Effect of PET waste fiber addition on flexural behavior of concrete beams reinforced with GFRP bars. Case Stud. Constr. Mater. 2023, 19. [Google Scholar] [CrossRef]
- Duan, S.; Wang, Y.; Zhao, Y. Analysis and discussion of steel pipe-encased concrete defects by ultrasonic inspection. Nondestruct. Test. 2018, 40, 74–78. [Google Scholar]
- Sagar, R.V. Acoustic emission characteristics of reinforced concrete beams with varying percentage of tension steel reinforcement under flexural loading. Case Stud. Constr. Mater. 2017, 6, 162–176. [Google Scholar]
- Liu, Y.; Cho, S.; Spencer, B.; Fan, J. Concrete Crack Assessment Using Digital Image Processing and 3D Scene Reconstruction. J. Comput. Civ. Eng. 2016, 30. [Google Scholar] [CrossRef]
- Barrias, A.; Rodriguez, G.; Casas, J.R.; Villalba, S. Application of distributed optical fiber sensors for the health monitoring of two real structures in Barcelona. Struct. Infrastruct. Eng. 2018, 14, 967–985. [Google Scholar] [CrossRef]
- Liu, W.; Li, J.; Yang, J.; Jia, H.; Pan, W. Detection of concrete defects in steel tube lining by impact echo method. Nondestruct. Test. 2021, 43, 47–52. [Google Scholar]
- Kuznetsov, M.S.; Maltseva, O.V.; Noskov, A.S.; Kuznetsov, A.S. Experience of using the ultrasonic low-frequency tomograph for inspection of reinforced concrete structures. IOP Conf. Ser. Mater. Sci. Eng. 2019, 481, 012047. [Google Scholar] [CrossRef]
- Liu, K.; Wulan, T.; Yao, Y.; Bian, M.; Bao, Y. Assessment of damage evolution of concrete beams strengthened with BFRP sheets with acoustic emission and unsupervised machine learning. Eng. Struct. 2024, 300. [Google Scholar] [CrossRef]
- Pazdera, L.; Dvořák, R.; Hoduláková, M.; Topolář, L.; Mikulášek, K.; Smutny, J.; Chobola, Z. Application of Acoustic Emission Method and Impact Echo Method to Structural Rehabilitation. Key Eng. Mater. 2018, 776, 81–85. [Google Scholar] [CrossRef]
- Lei, B.; Wang, N.; Xu, P.; Song, G. New Crack Detection Method for Bridge Inspection Using UAV Incorporating Image Processing. J. Aerosp. Eng. 2018, 31. [Google Scholar] [CrossRef]
- Rajabi, A.M.; Moaf, F.O.; Abdelgader, H.S. Evaluation of Mechanical Properties of Two-Stage Concrete and Conventional Concrete Using Nondestructive Tests. J. Mater. Civ. Eng. 2020, 32, 04020185. [Google Scholar] [CrossRef]
- Viera, M.A.A.; Gotz, R.; de Aguiar, P.R.; Alexandre, F.A.; Fernandez, B.O.; Junior, P.O. A Low-Cost Acoustic Emission Sensor based on Piezoelectric Diaphragm. IEEE Sensors J. 2020. [Google Scholar] [CrossRef]
- Wang, X.; Hu, S.; Li, W.; Qi, H.; Xue, X. Use of numerical methods for identifying the number of wire breaks in prestressed concrete cylinder pipe by piezoelectric sensing technology. Constr. Build. Mater. 2021, 268. [Google Scholar] [CrossRef]
- Hu, Y.; Yang, Y. Wave propagation modeling of the PZT sensing region for structural health monitoring. Smart Mater. Struct. 2007, 16, 706–716. [Google Scholar] [CrossRef]
- Zhu, X.Q.; Hao, H.; Fan, K.Q. Detection of delamination between steel bars and concrete using embedded piezoelectric actuators/sensors. J. Civ. Struct. Health Monit. 2013, 3, 105–115. [Google Scholar] [CrossRef]
- Han, F.; Jiang, J.; Xu, K.; Wang, N. Damage Detection of Common Timber Connections Using Piezoceramic Transducers and Active Sensing. Sensors 2019, 19, 2486. [Google Scholar] [CrossRef] [PubMed]
- Song, G.; Gu, H.; Mo, Y.-L. Smart aggregates: multi-functional sensors for concrete structures—a tutorial and a review. Smart Mater. Struct. 2008, 17. [Google Scholar] [CrossRef]
- Li, W.; Kong, Q.; Ho, S.C.M.; Lim, I.; Mo, Y.L.; Song, G. Feasibility study of using smart aggregates as embedded acoustic emission sensors for health monitoring of concrete structures. Smart Mater. Struct. 2016, 25, 115031. [Google Scholar] [CrossRef]
- Zou, D.; Du, C.; Liu, T.; Li, W. Effects of temperature on the performance of the piezoelectric-based smart aggregates active monitoring method for concrete structures. Smart Mater. Struct. 2019, 28, 035016. [Google Scholar] [CrossRef]
- Jiang, T.; Kong, Q.; Peng, Z.; Wang, L.; Dai, L.; Feng, Q.; Huo, L.; Song, G. Monitoring of Corrosion-Induced Degradation in Prestressed Concrete Structure Using Embedded Piezoceramic-Based Transducers. IEEE Sensors J. 2017, 17, 5823–5830. [Google Scholar] [CrossRef]
- Xu, K.; Deng, Q.; Cai, L.; Ho, S.; Song, G. Damage Detection of a Concrete Column Subject to Blast Loads Using Embedded Piezoceramic Transducers. Sensors 2018, 18, 1377. [Google Scholar] [CrossRef] [PubMed]
- Xu, K.; Ren, C.; Deng, Q.; Jin, Q.; Chen, X. Real-Time Monitoring of Bond Slip between GFRP Bar and Concrete Structure Using Piezoceramic Transducer-Enabled Active Sensing. Sensors 2018, 18, 2653. [Google Scholar] [CrossRef] [PubMed]
- Meng, Y.; Yan, S. Statistical algorithm for damage detection of concrete beams based on piezoelectric smart aggregate. Trans. Tianjin Univ. 2012, 18, 432–440. [Google Scholar] [CrossRef]
- Karami, V.; Chenaghlou, M.; Gharabaghi, A.M. A combination of wavelet packet energy curvature difference and Richardson extrapolation for structural damage detection. Appl. Ocean Res. 2020, 101, 102224. [Google Scholar] [CrossRef]
- Yan, Q.S. Damage Assessment of Subway Station Columns Subjected to Blast Loadings. Int. J. Struct. Stab. Dyn. 2018, 18. [Google Scholar] [CrossRef]
Figure 1.
Active sensing technology damage measurement schematic diagram.
Figure 2.
Reinforcement and geometric parameters of reinforced concrete beam.
Figure 3.
Reinforced concrete beam.
Figure 4.
Explosion vessel and data acquisition system.

Figure 5.
Blasting device.
Figure 6.
Bearing capacity test equipment layout.
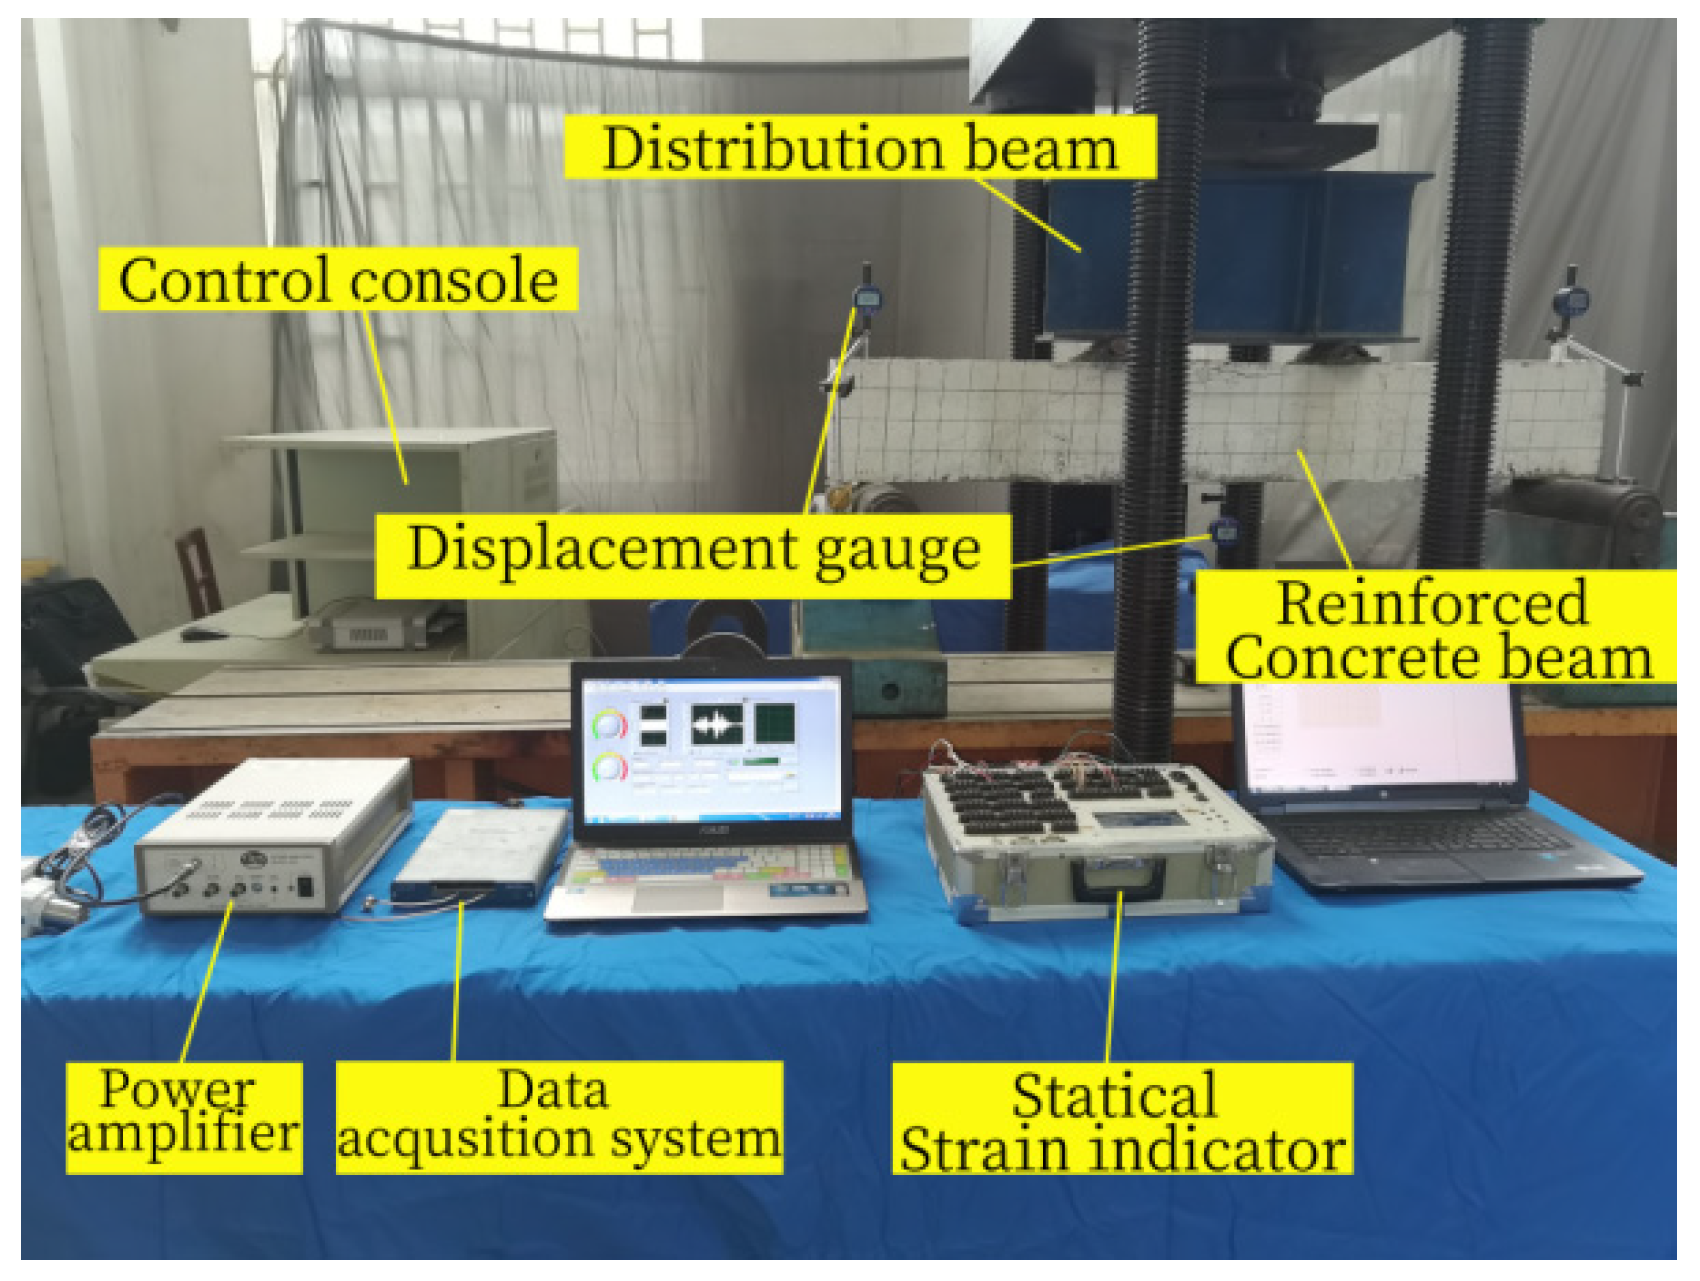
Figure 7.
Bearing capacity test measuring point arrangement.
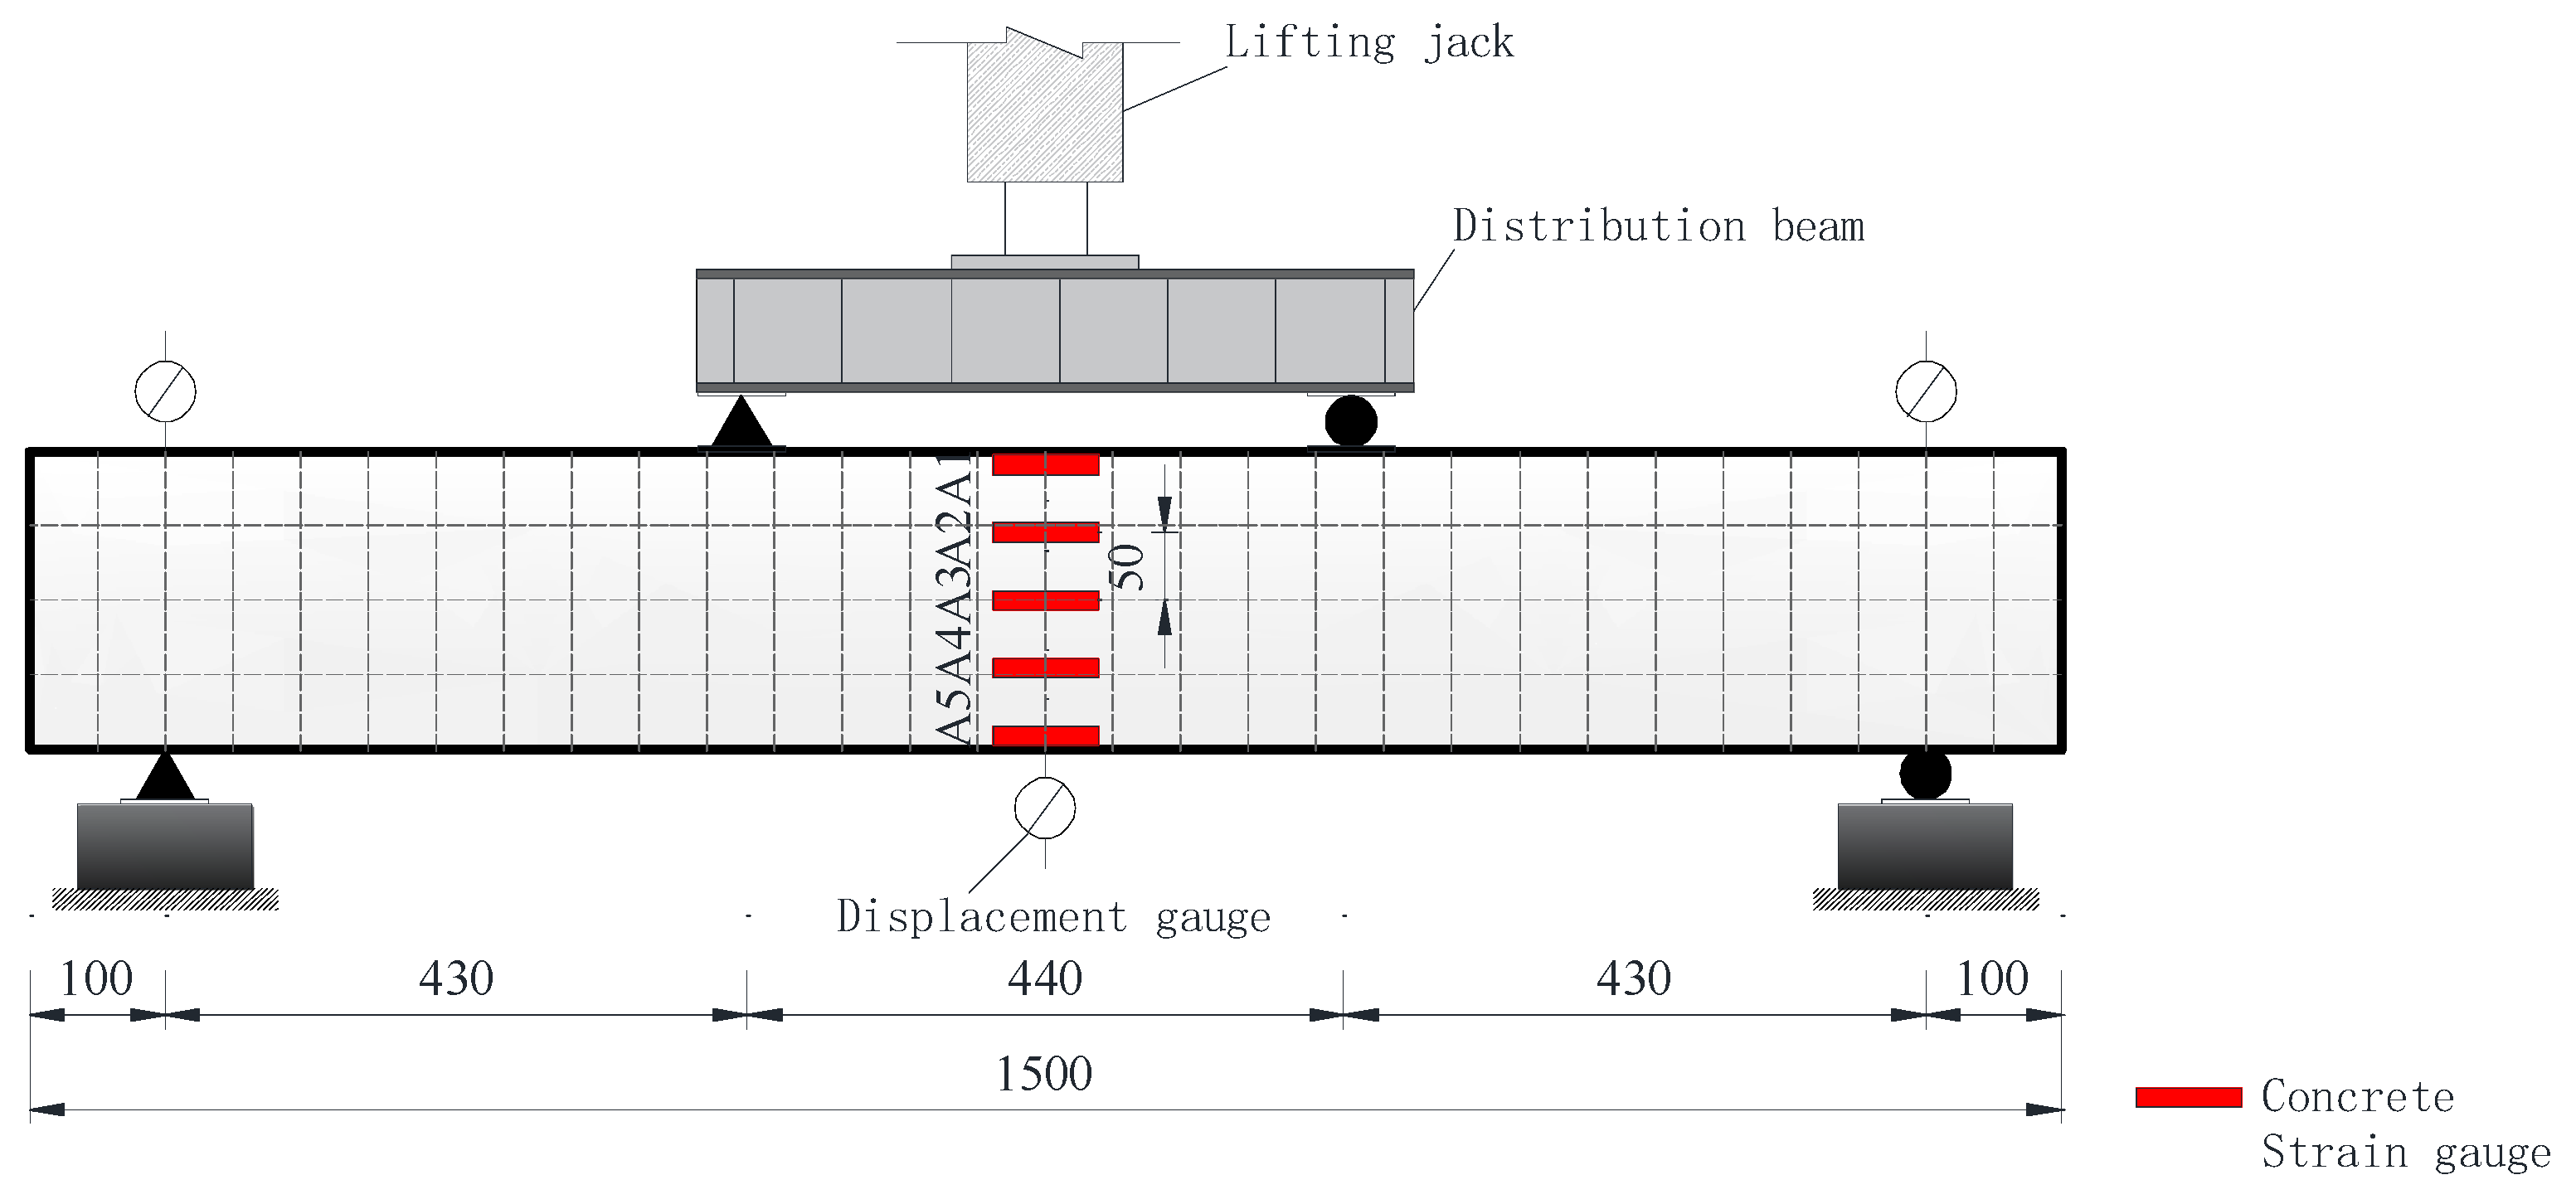
Figure 8.
Explosion damage of Beam-1 BEAM.
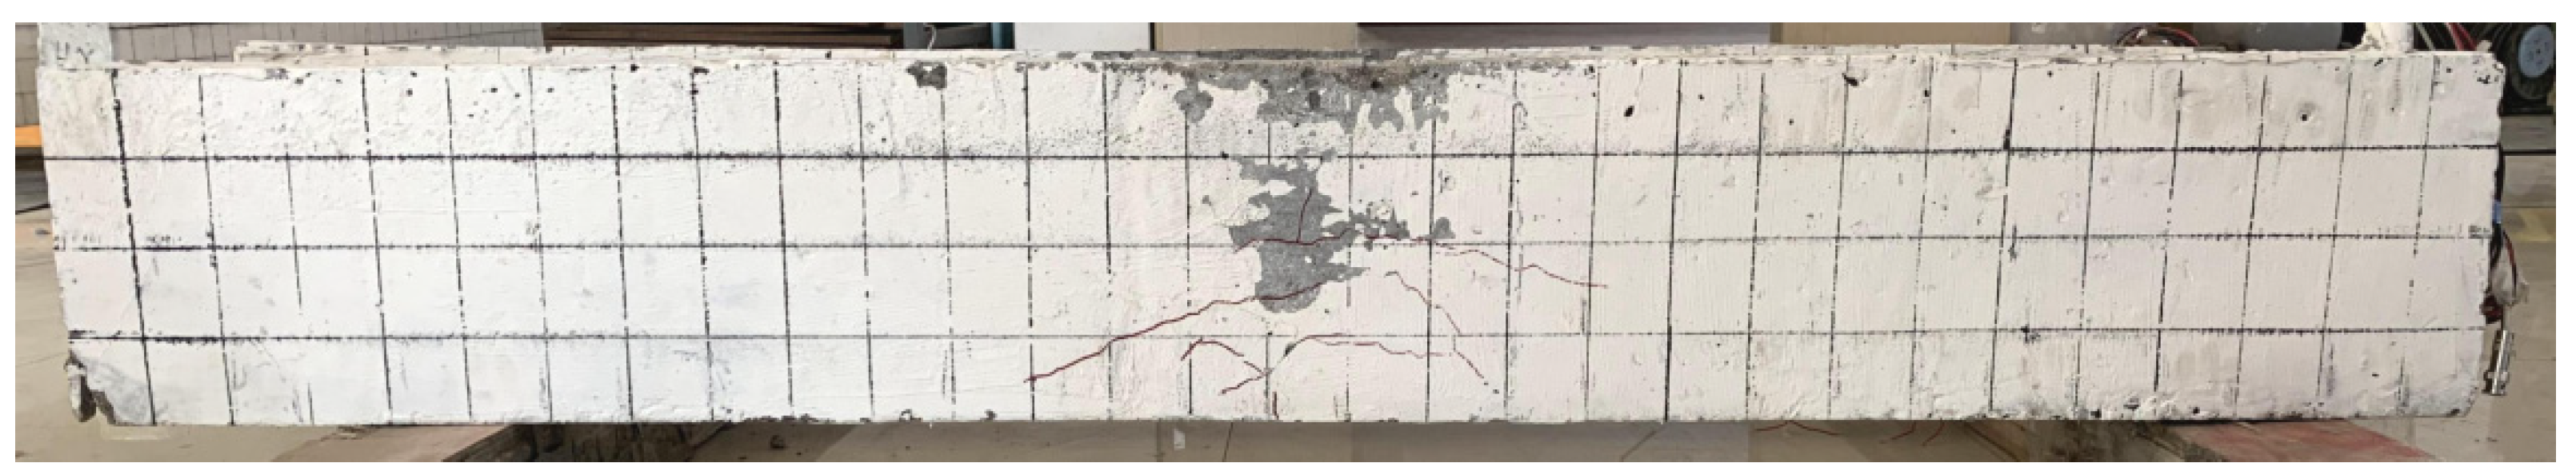
Figure 9.
Dynamic time-history curve of concrete strain on beam side.
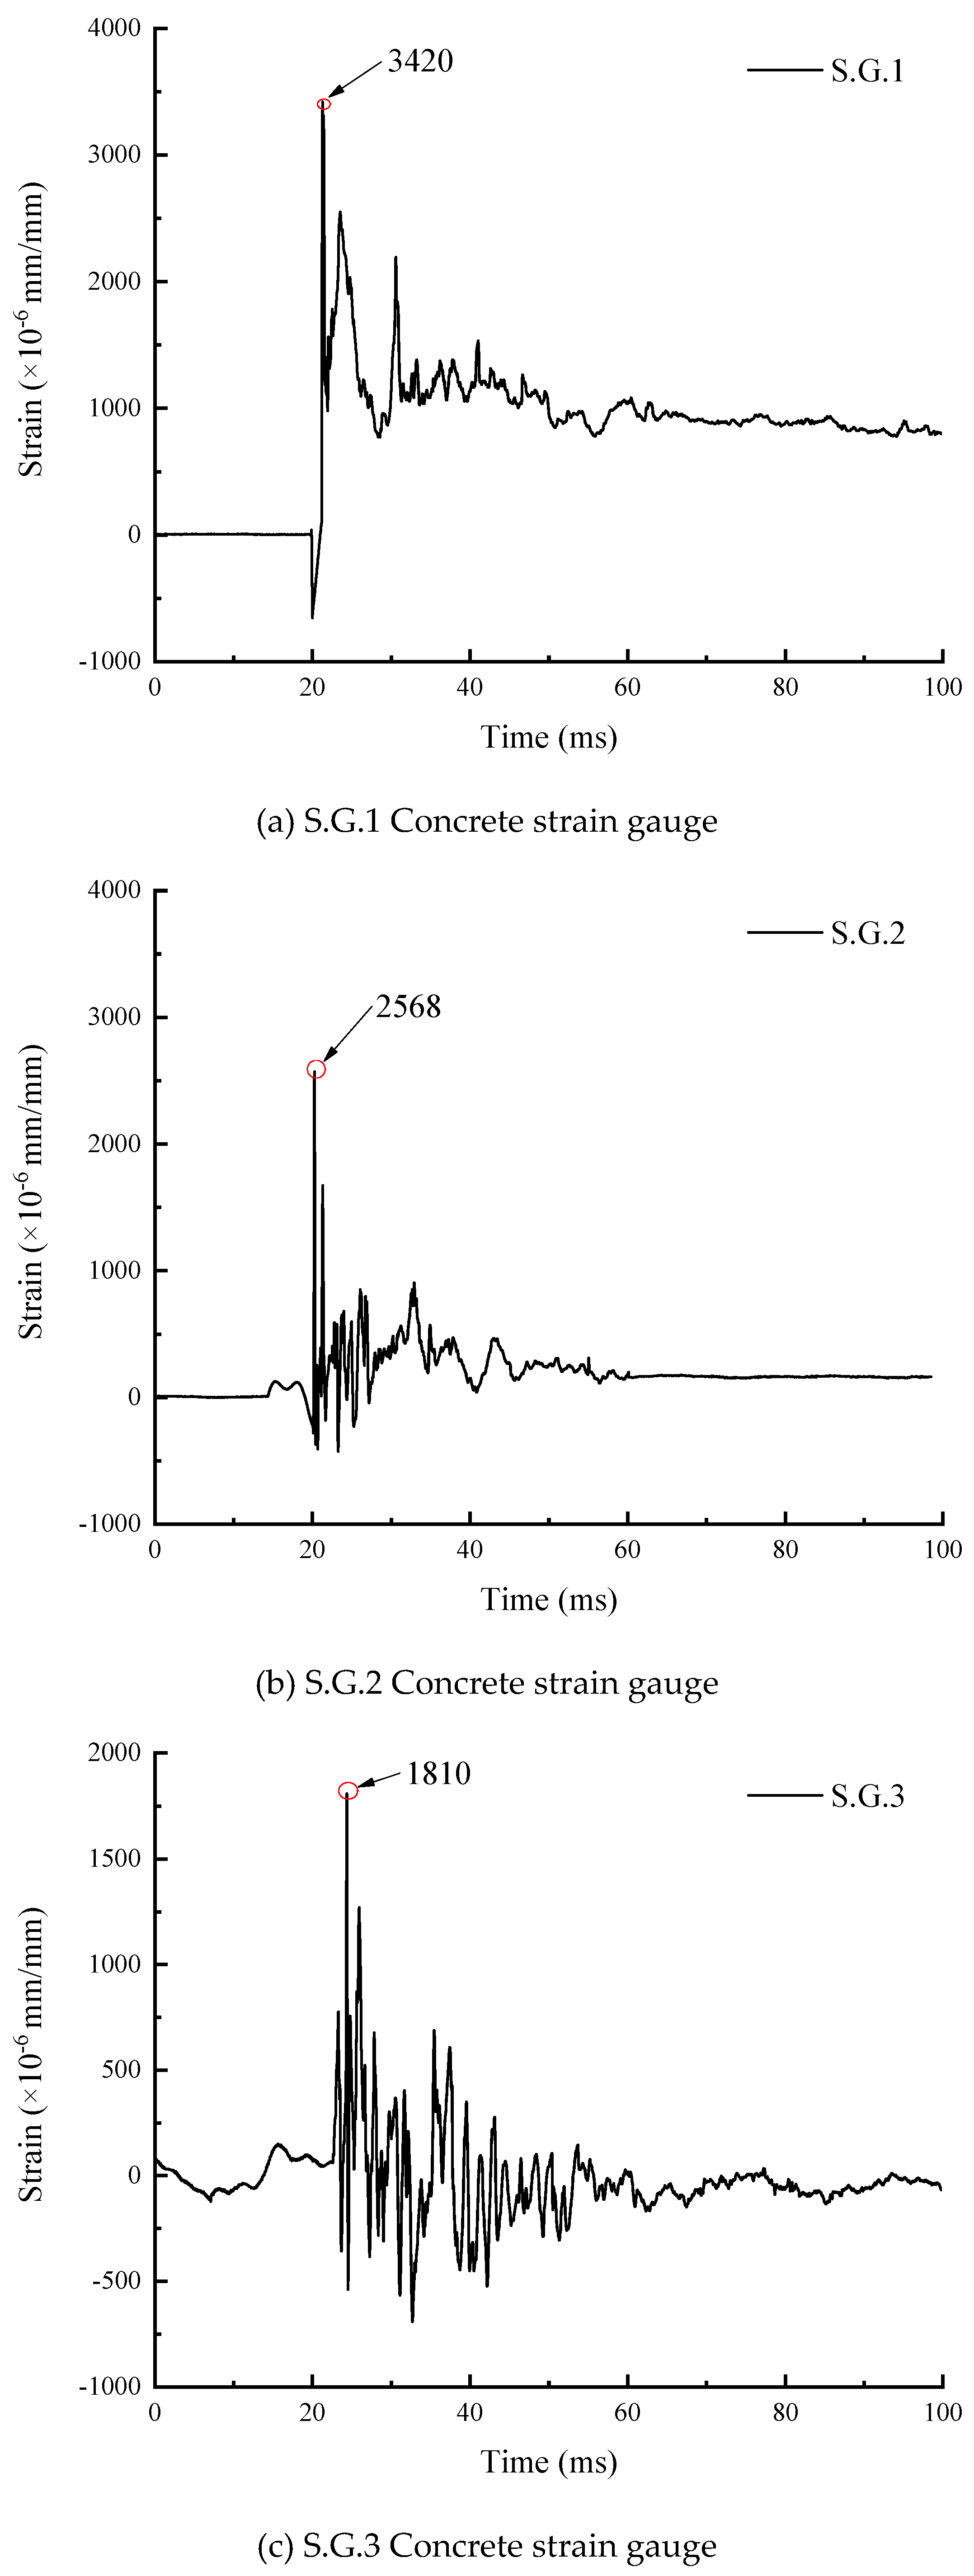
Figure 10.
Piezoelectric signals before and after BEAM explosion.
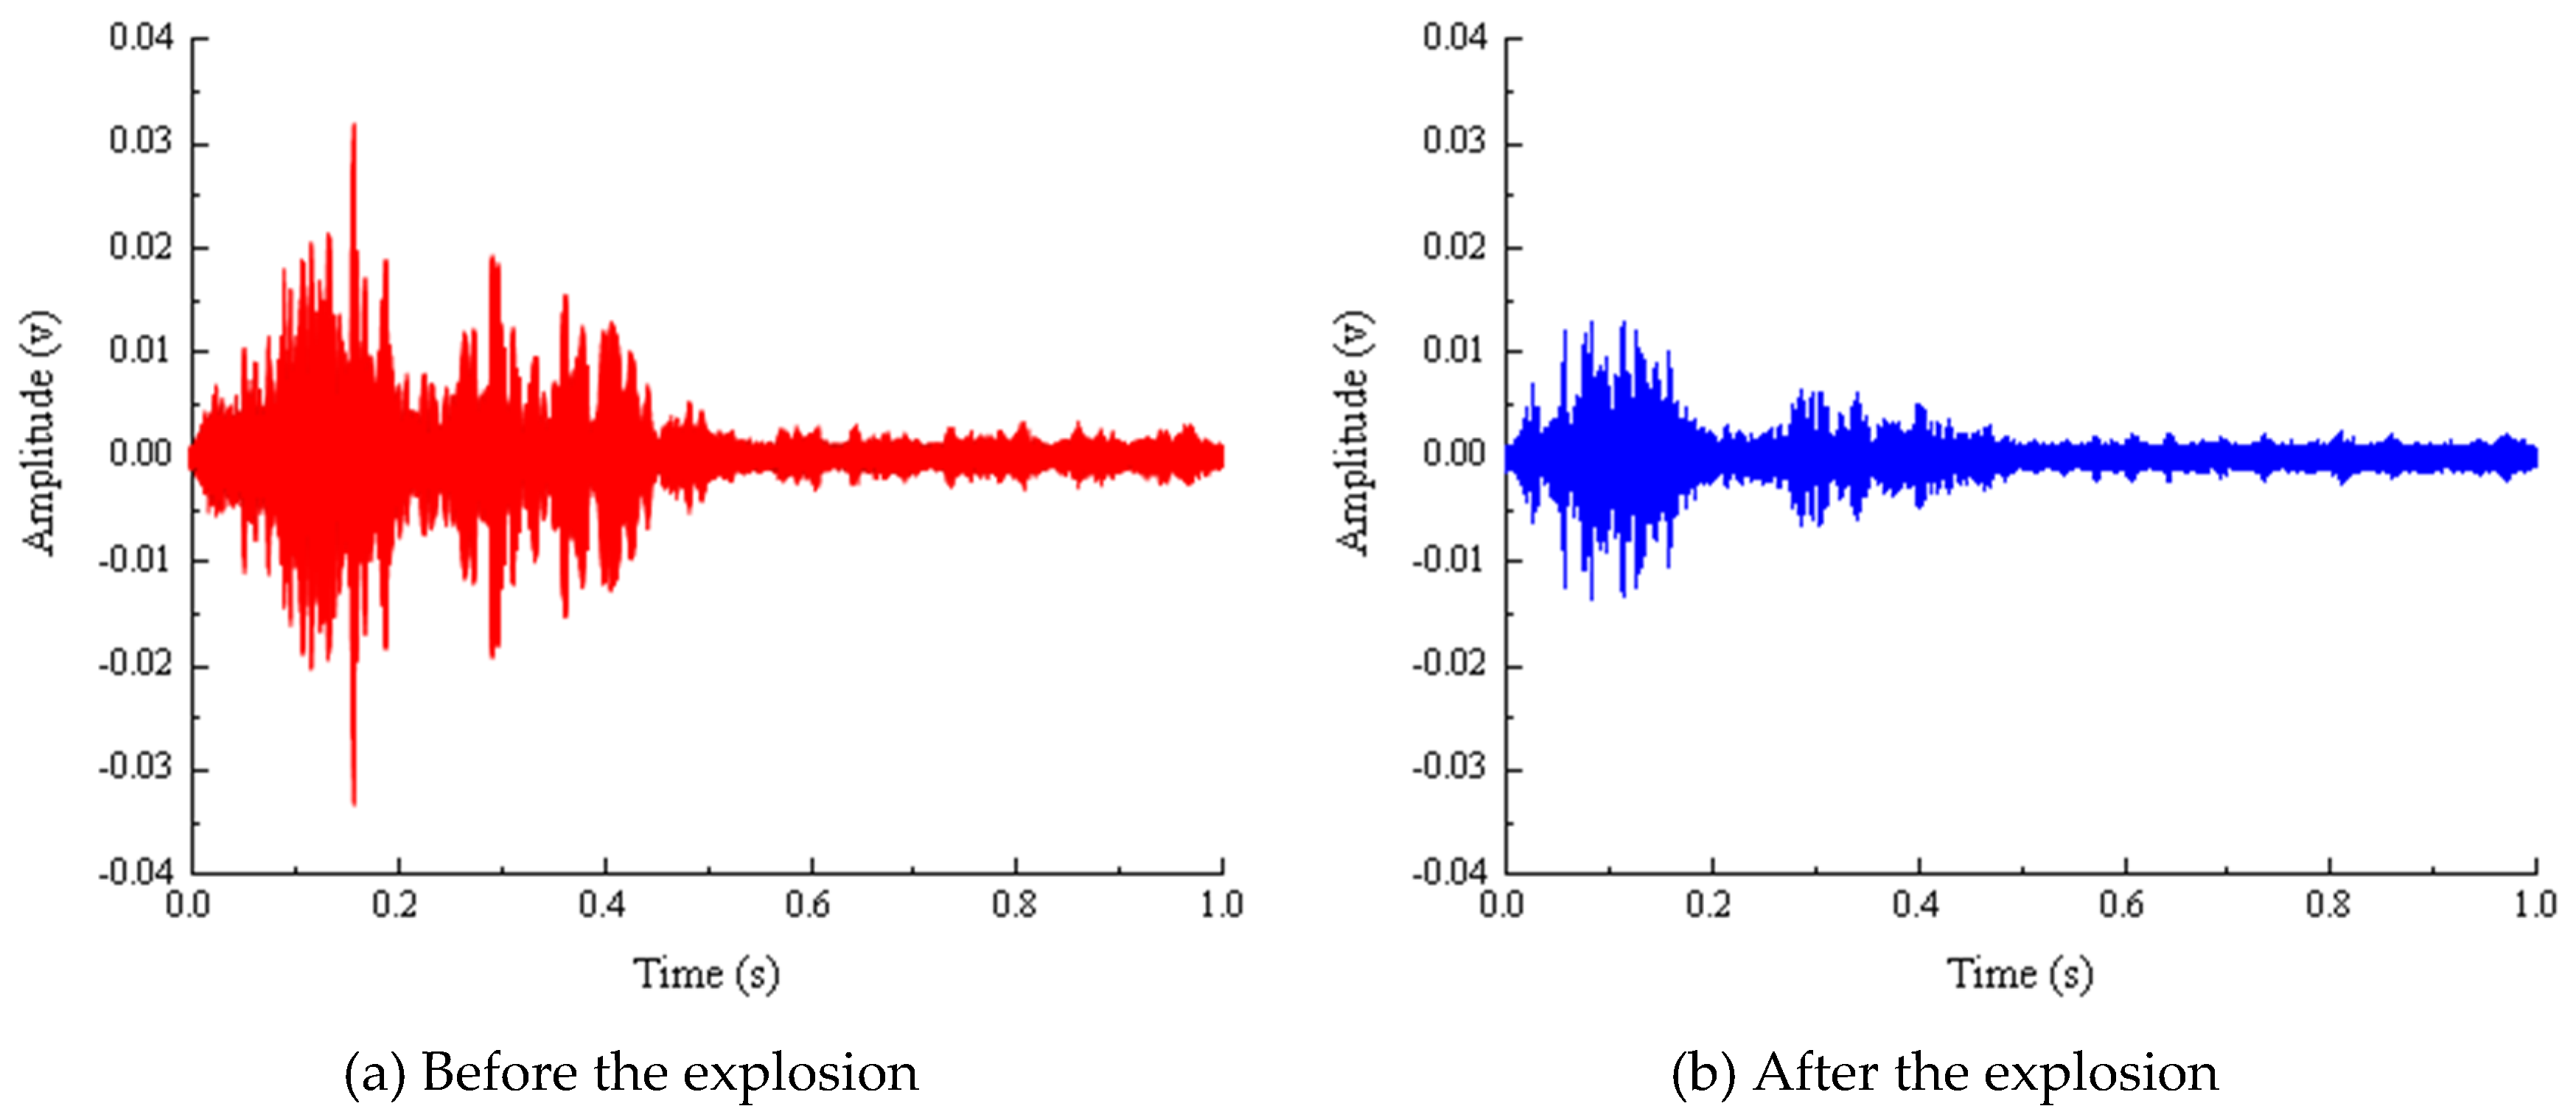
Figure 11.
Crack development status of two beams.
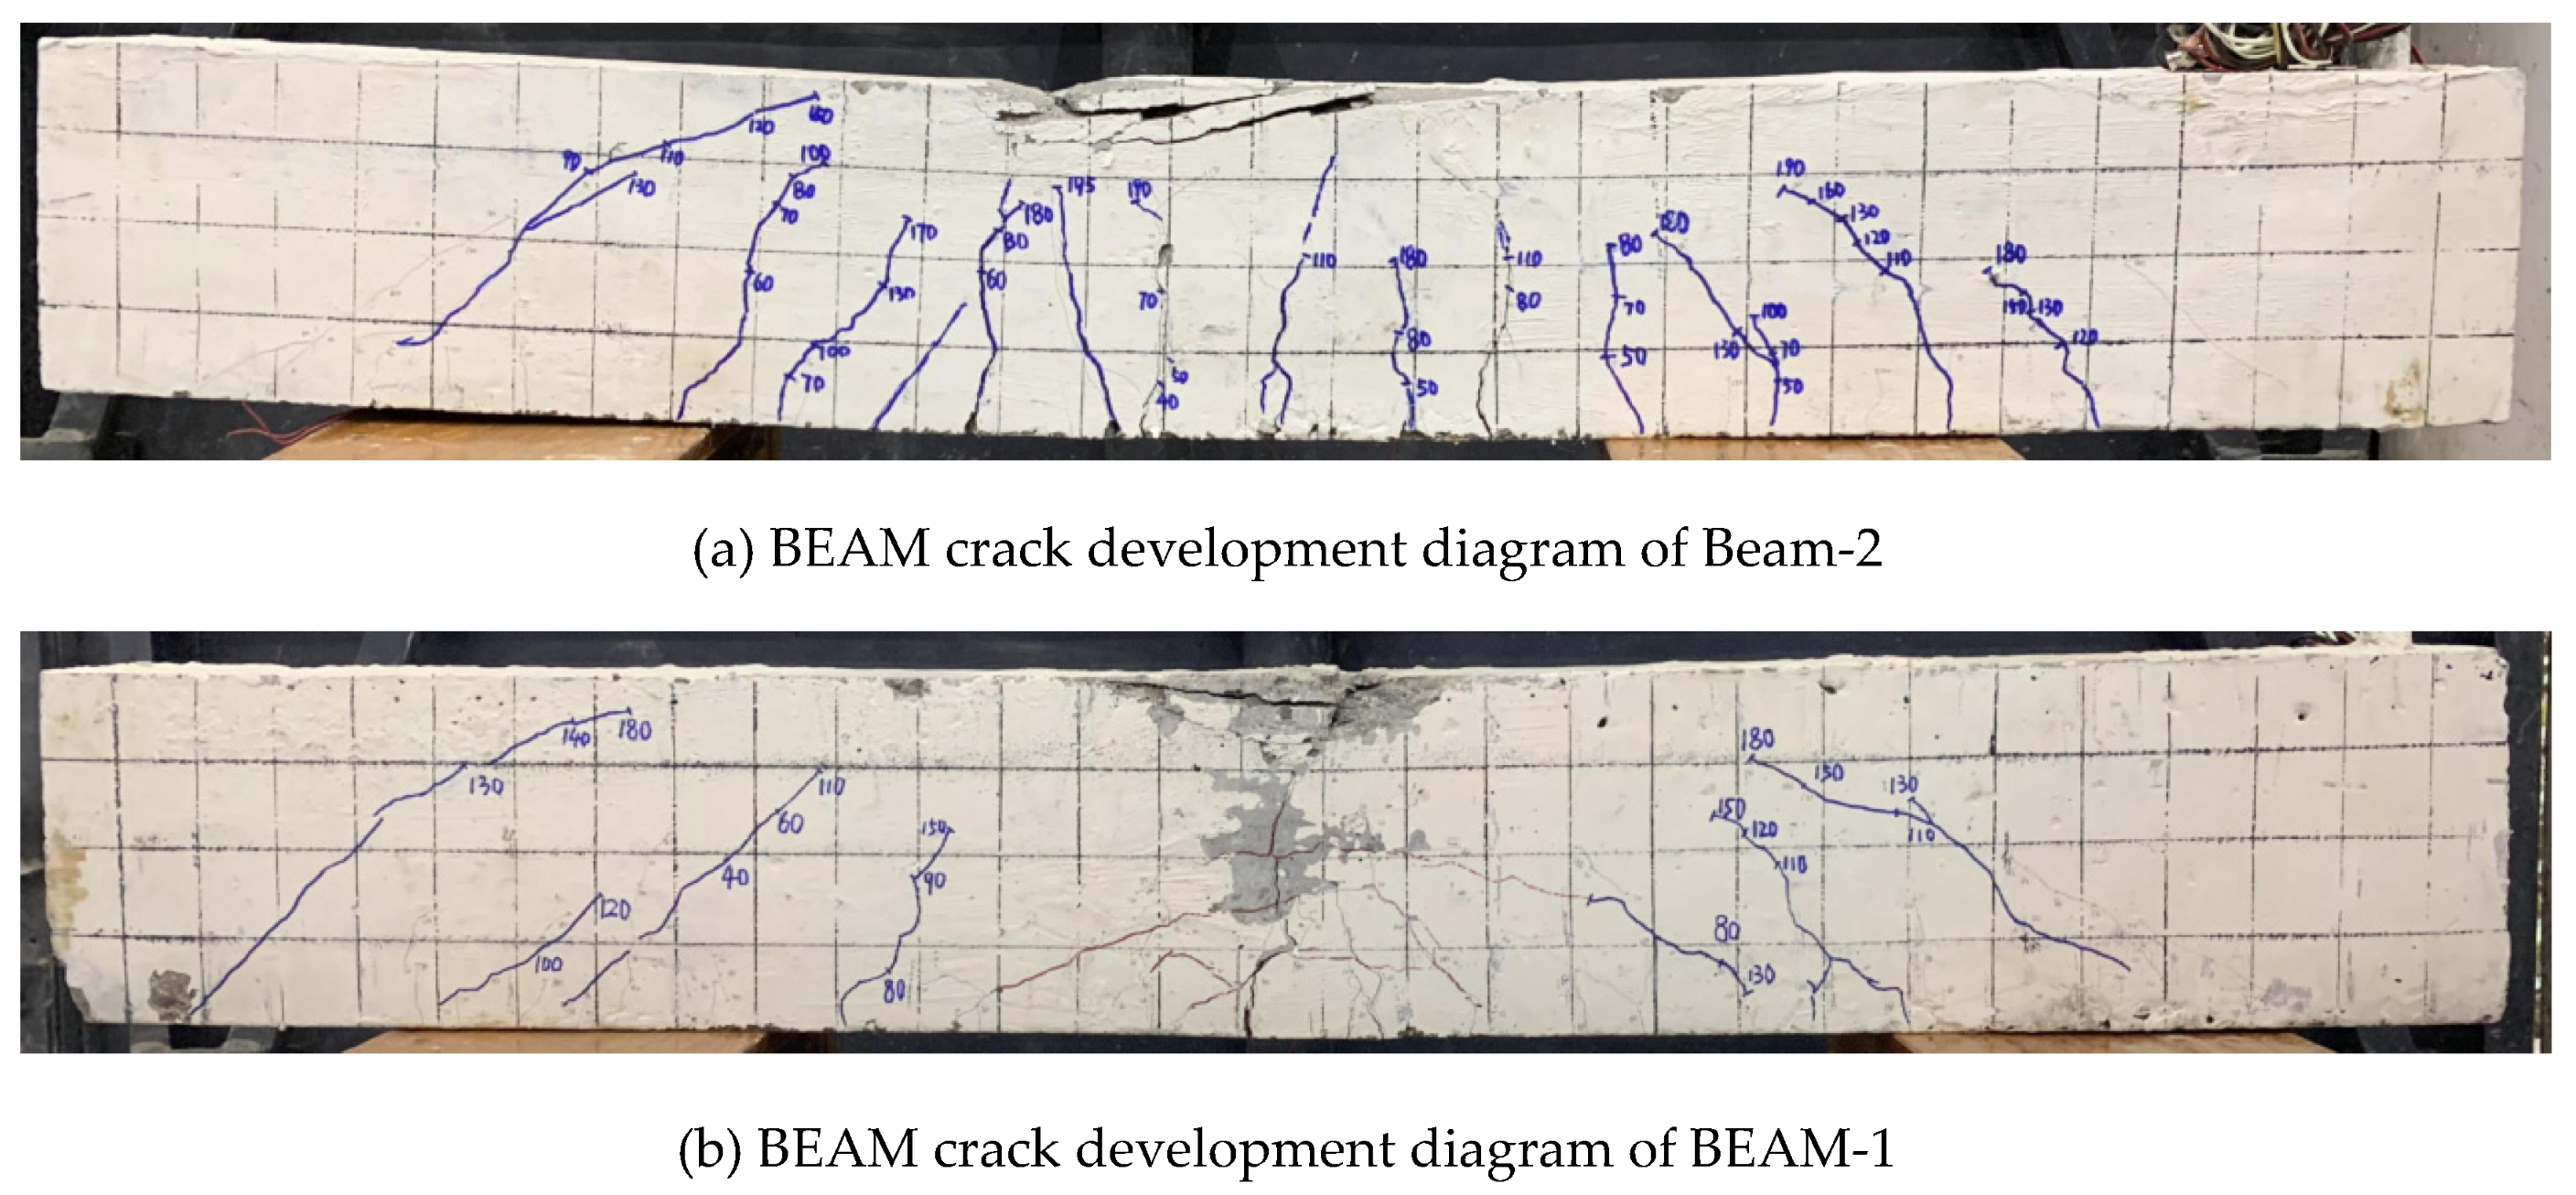
Figure 12.
Load-deflection curve.
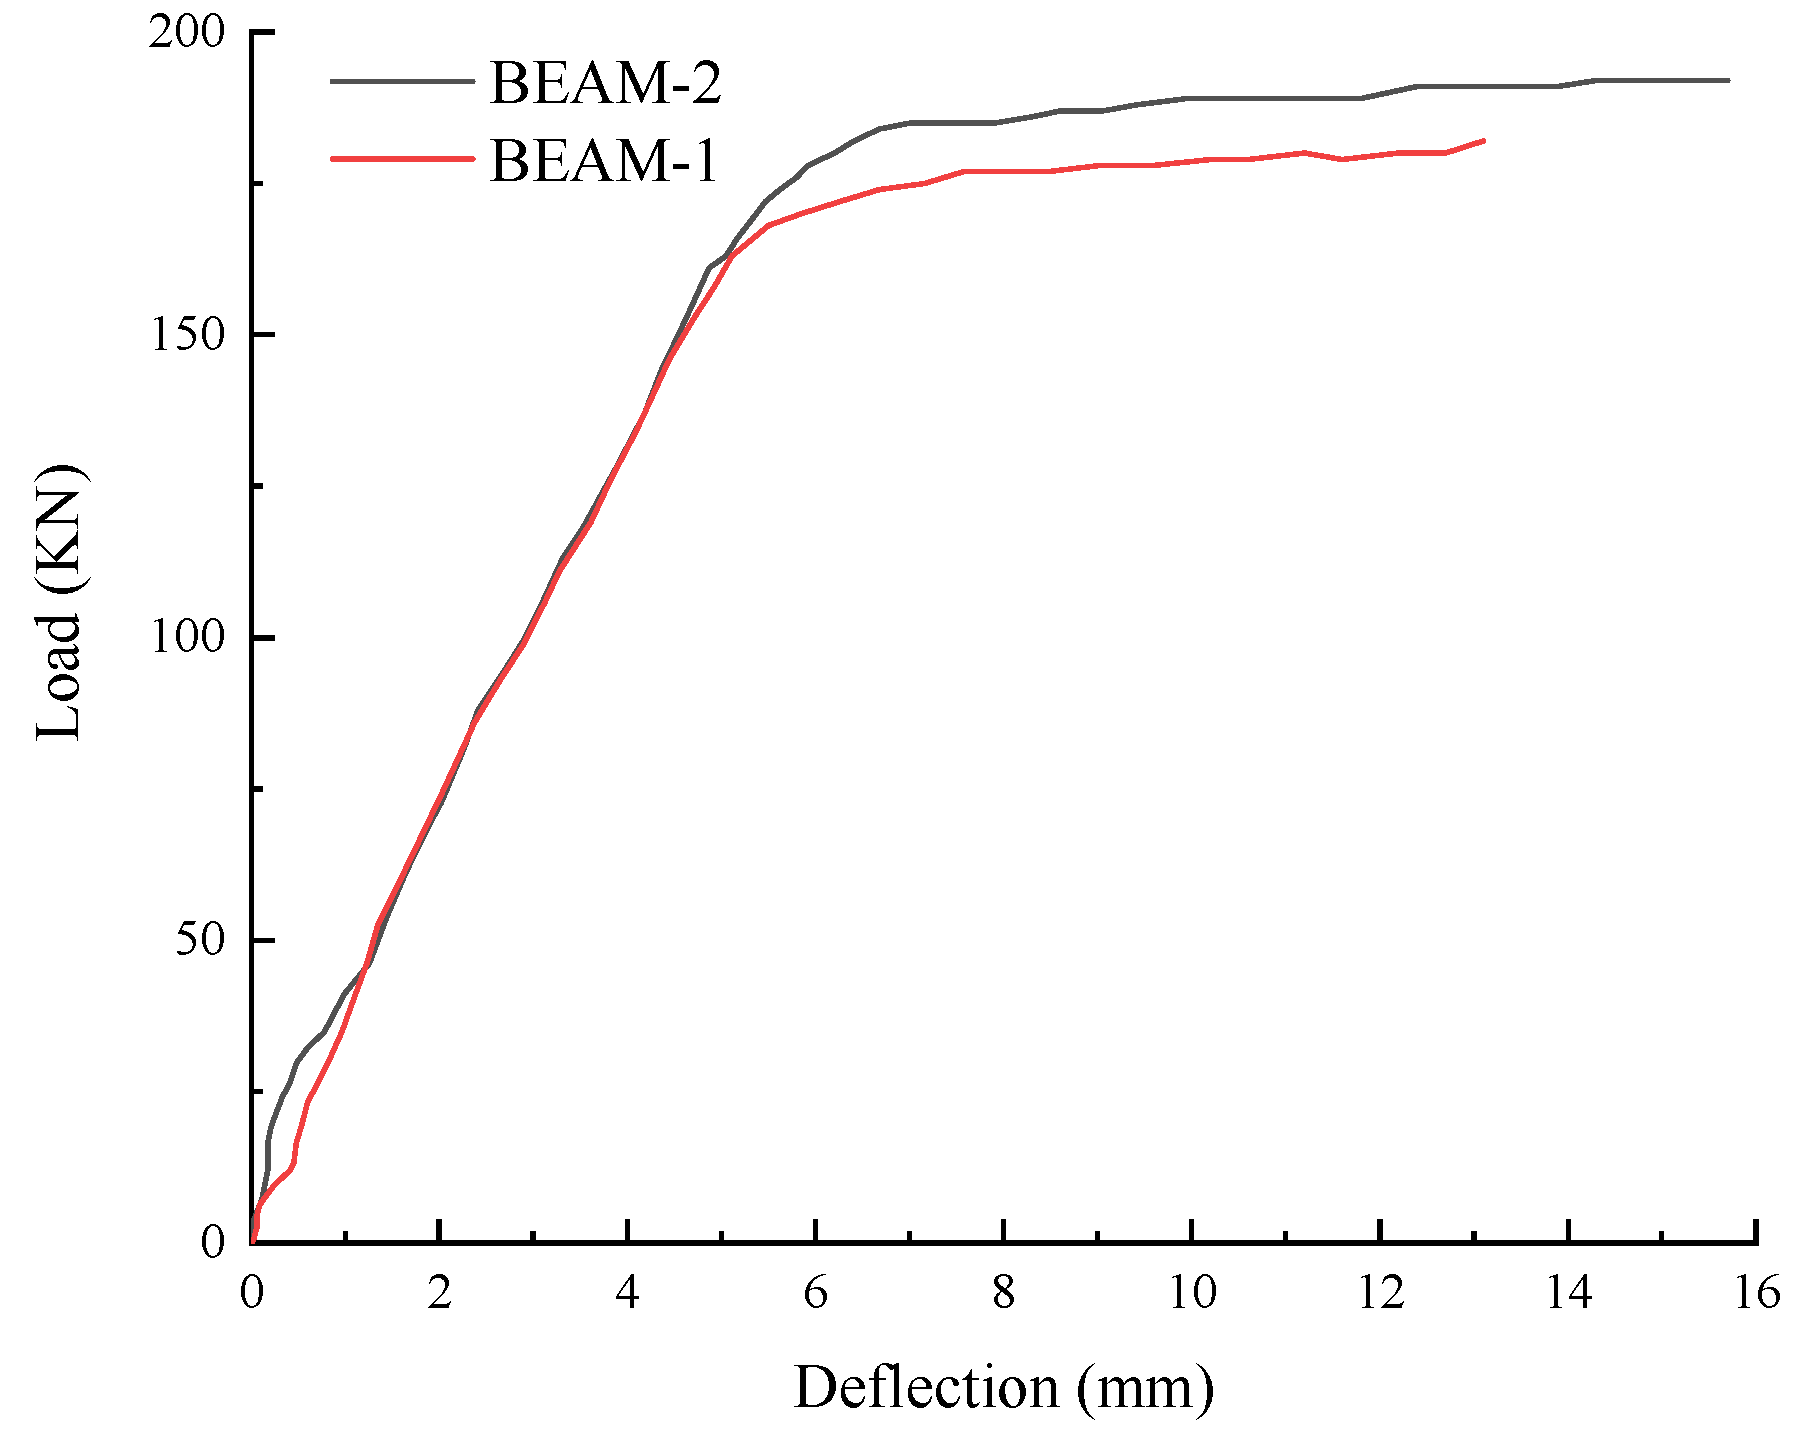
Figure 13.
Distribution of concrete strain along section height under different loads.
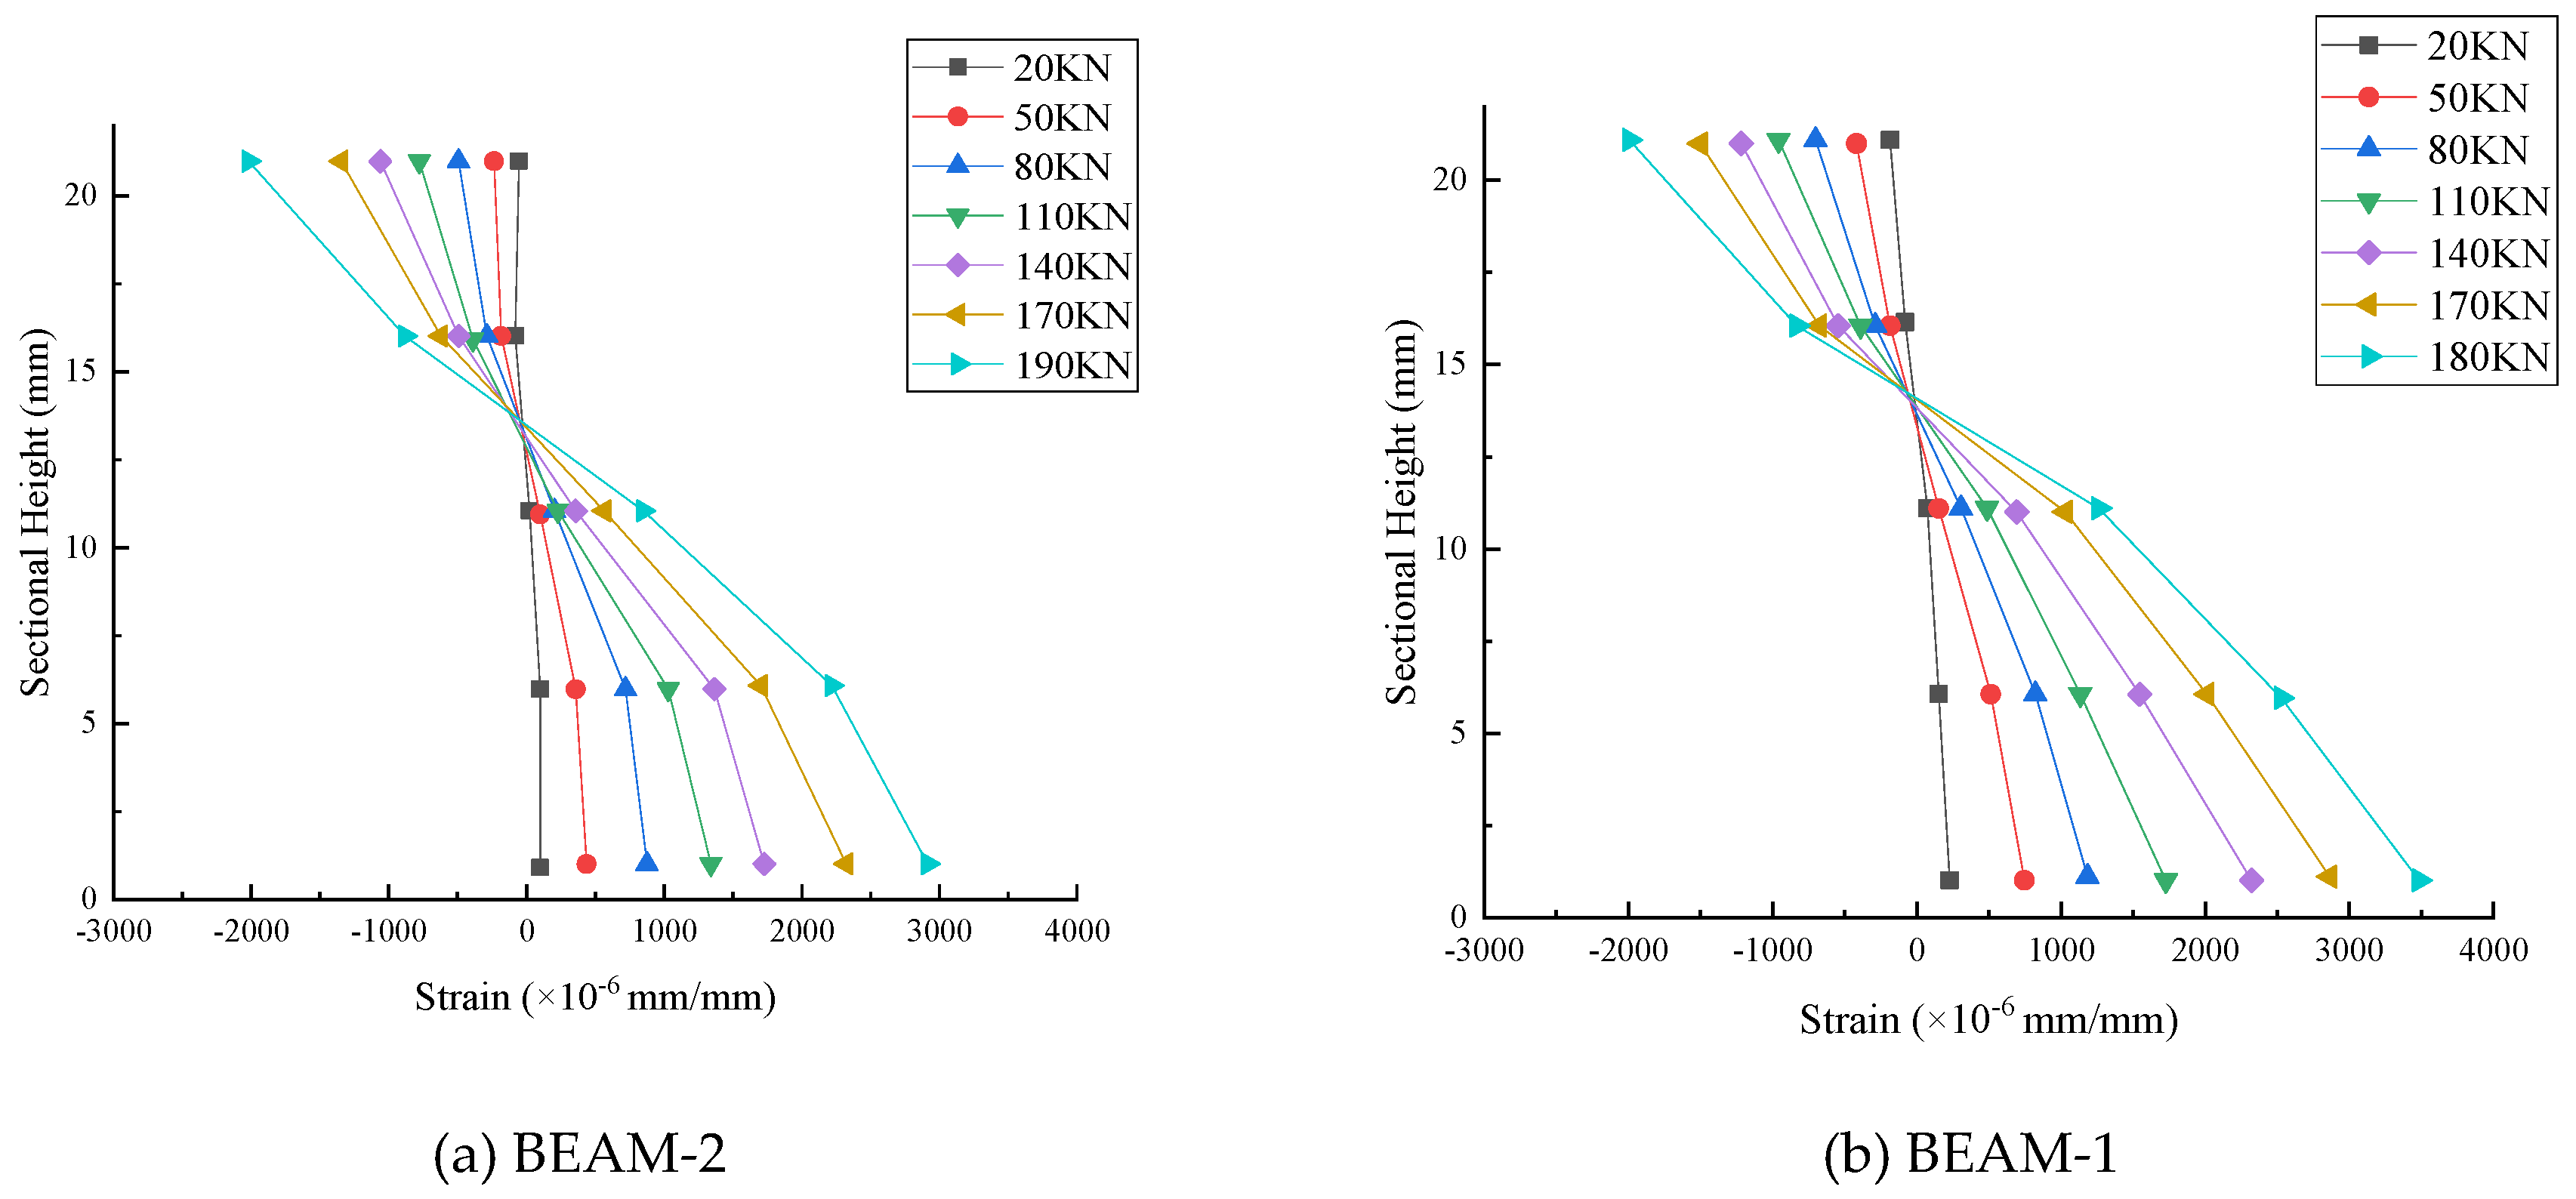
Figure 14.
Piezoelectric signal of beam bearing capacity test of Beam-2.
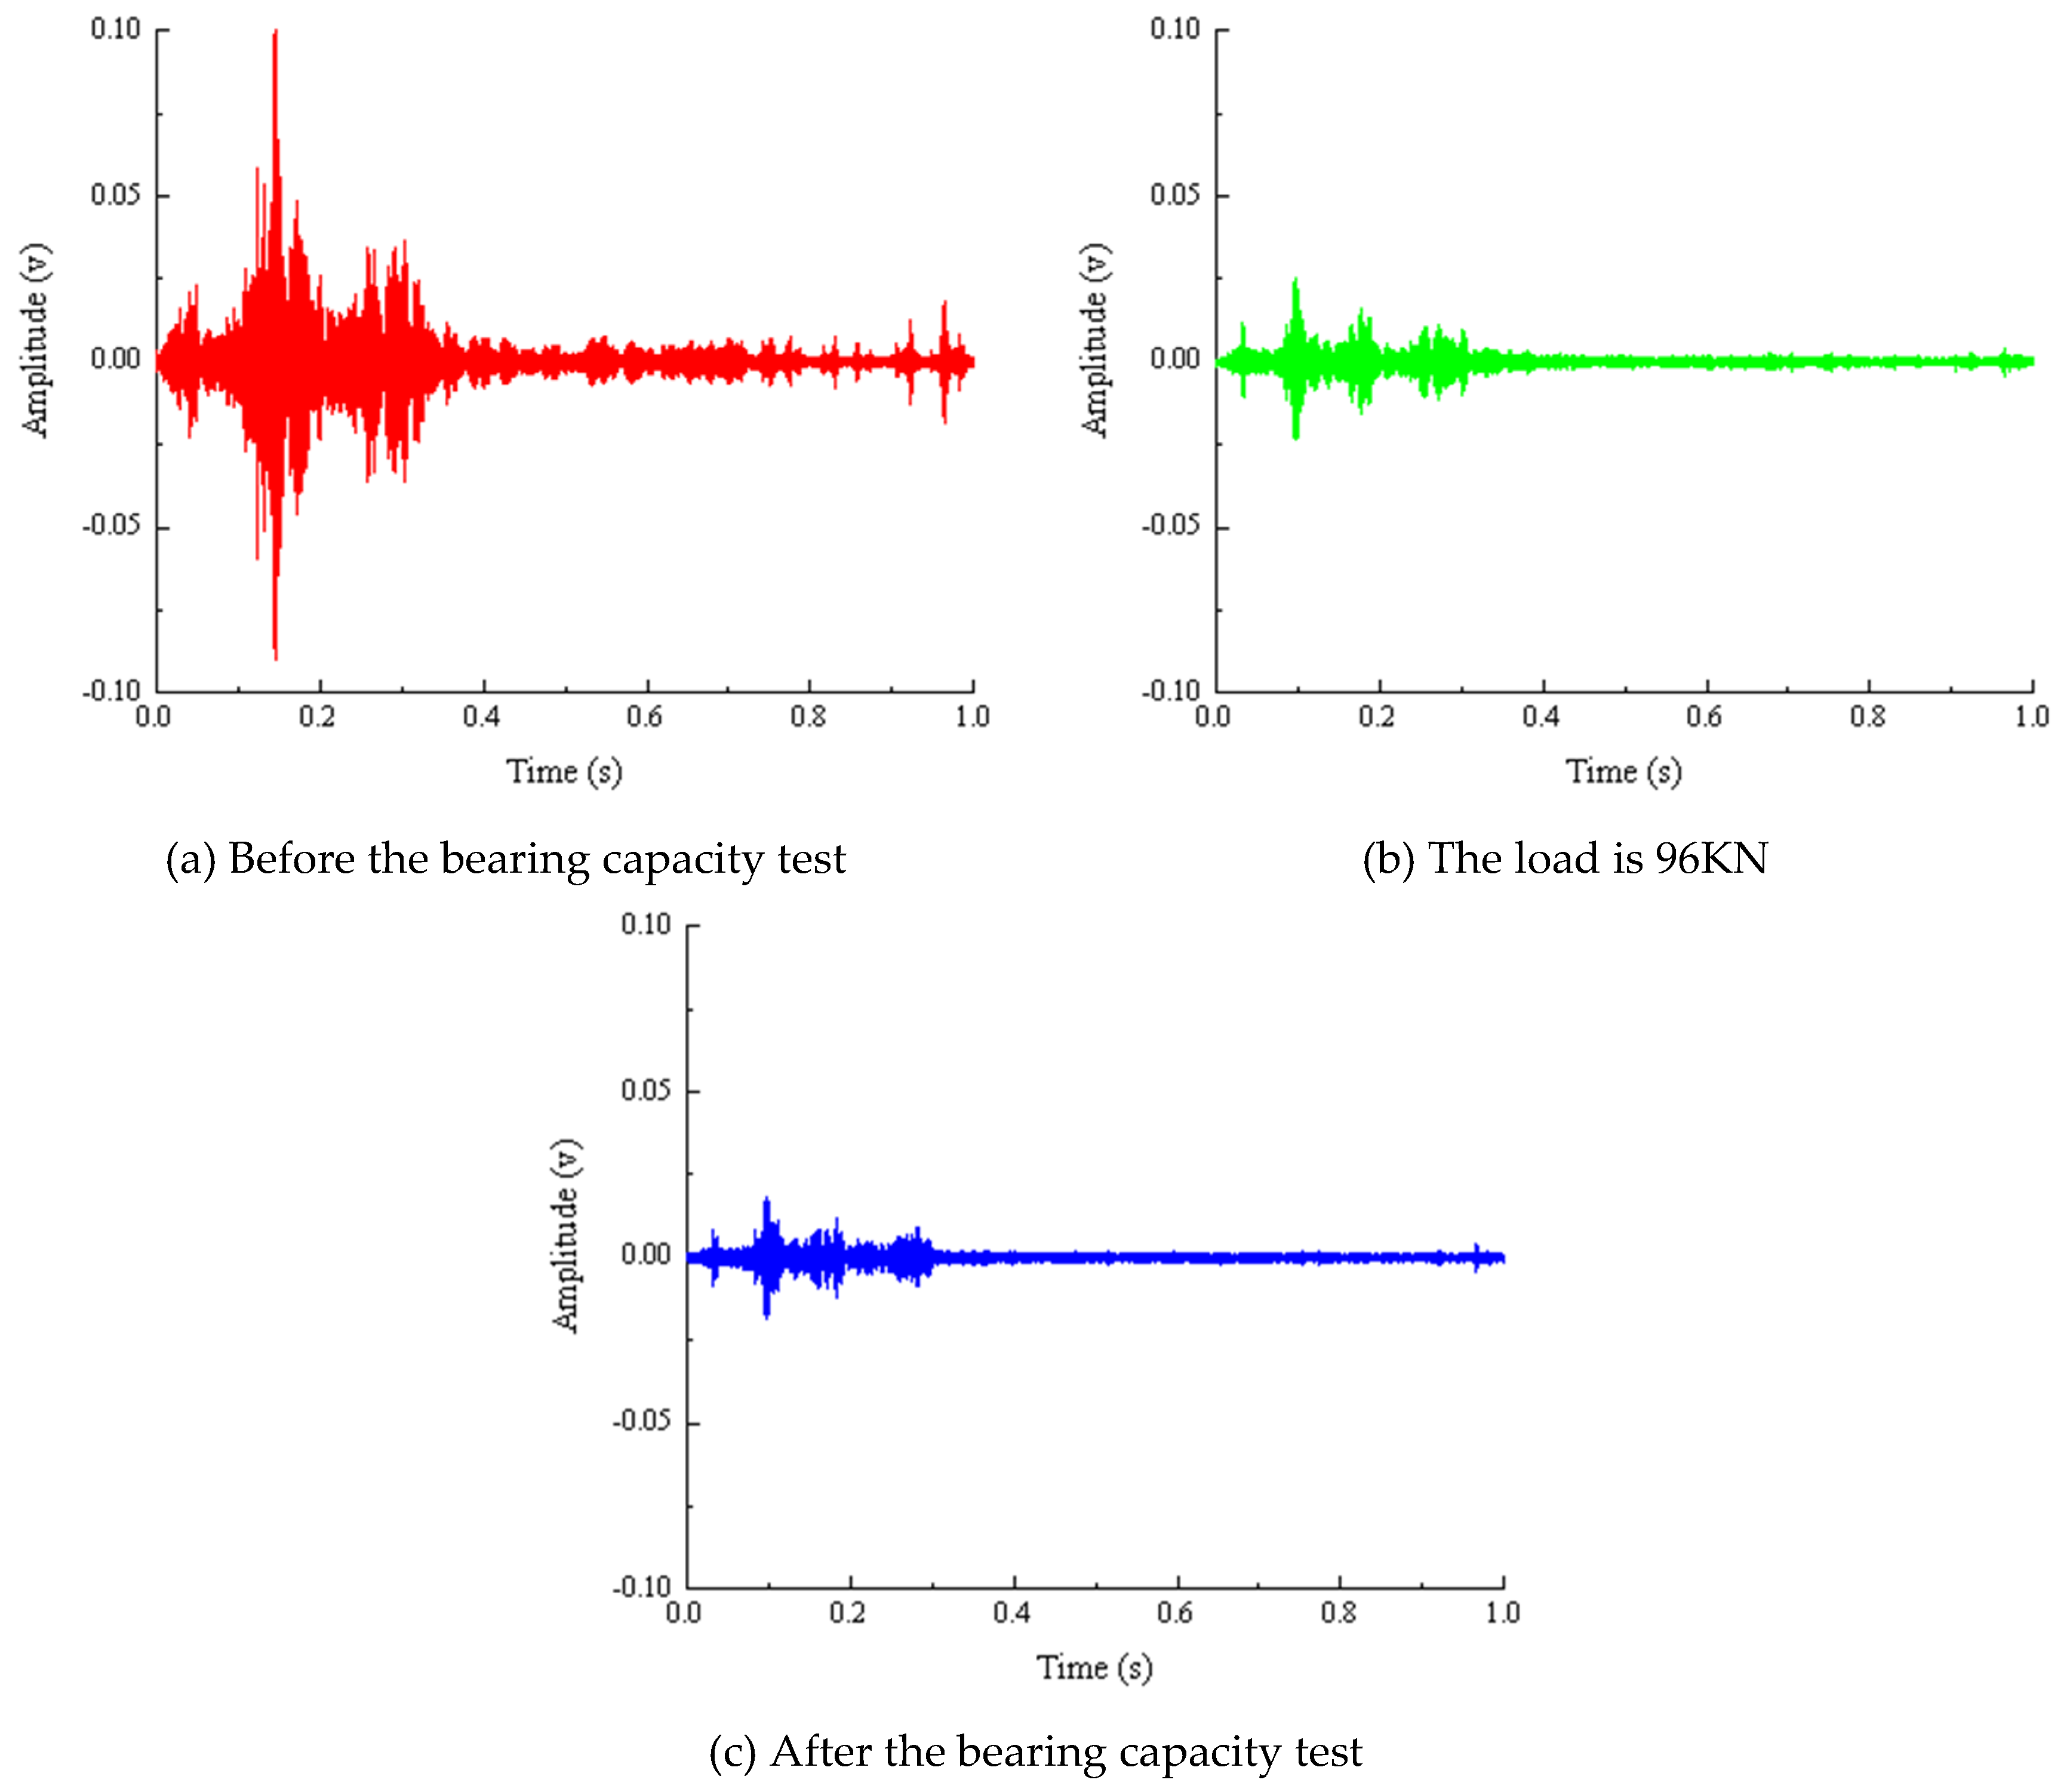
Figure 15.
Piezoelectric signal of beam bearing capacity test of Beam-1.
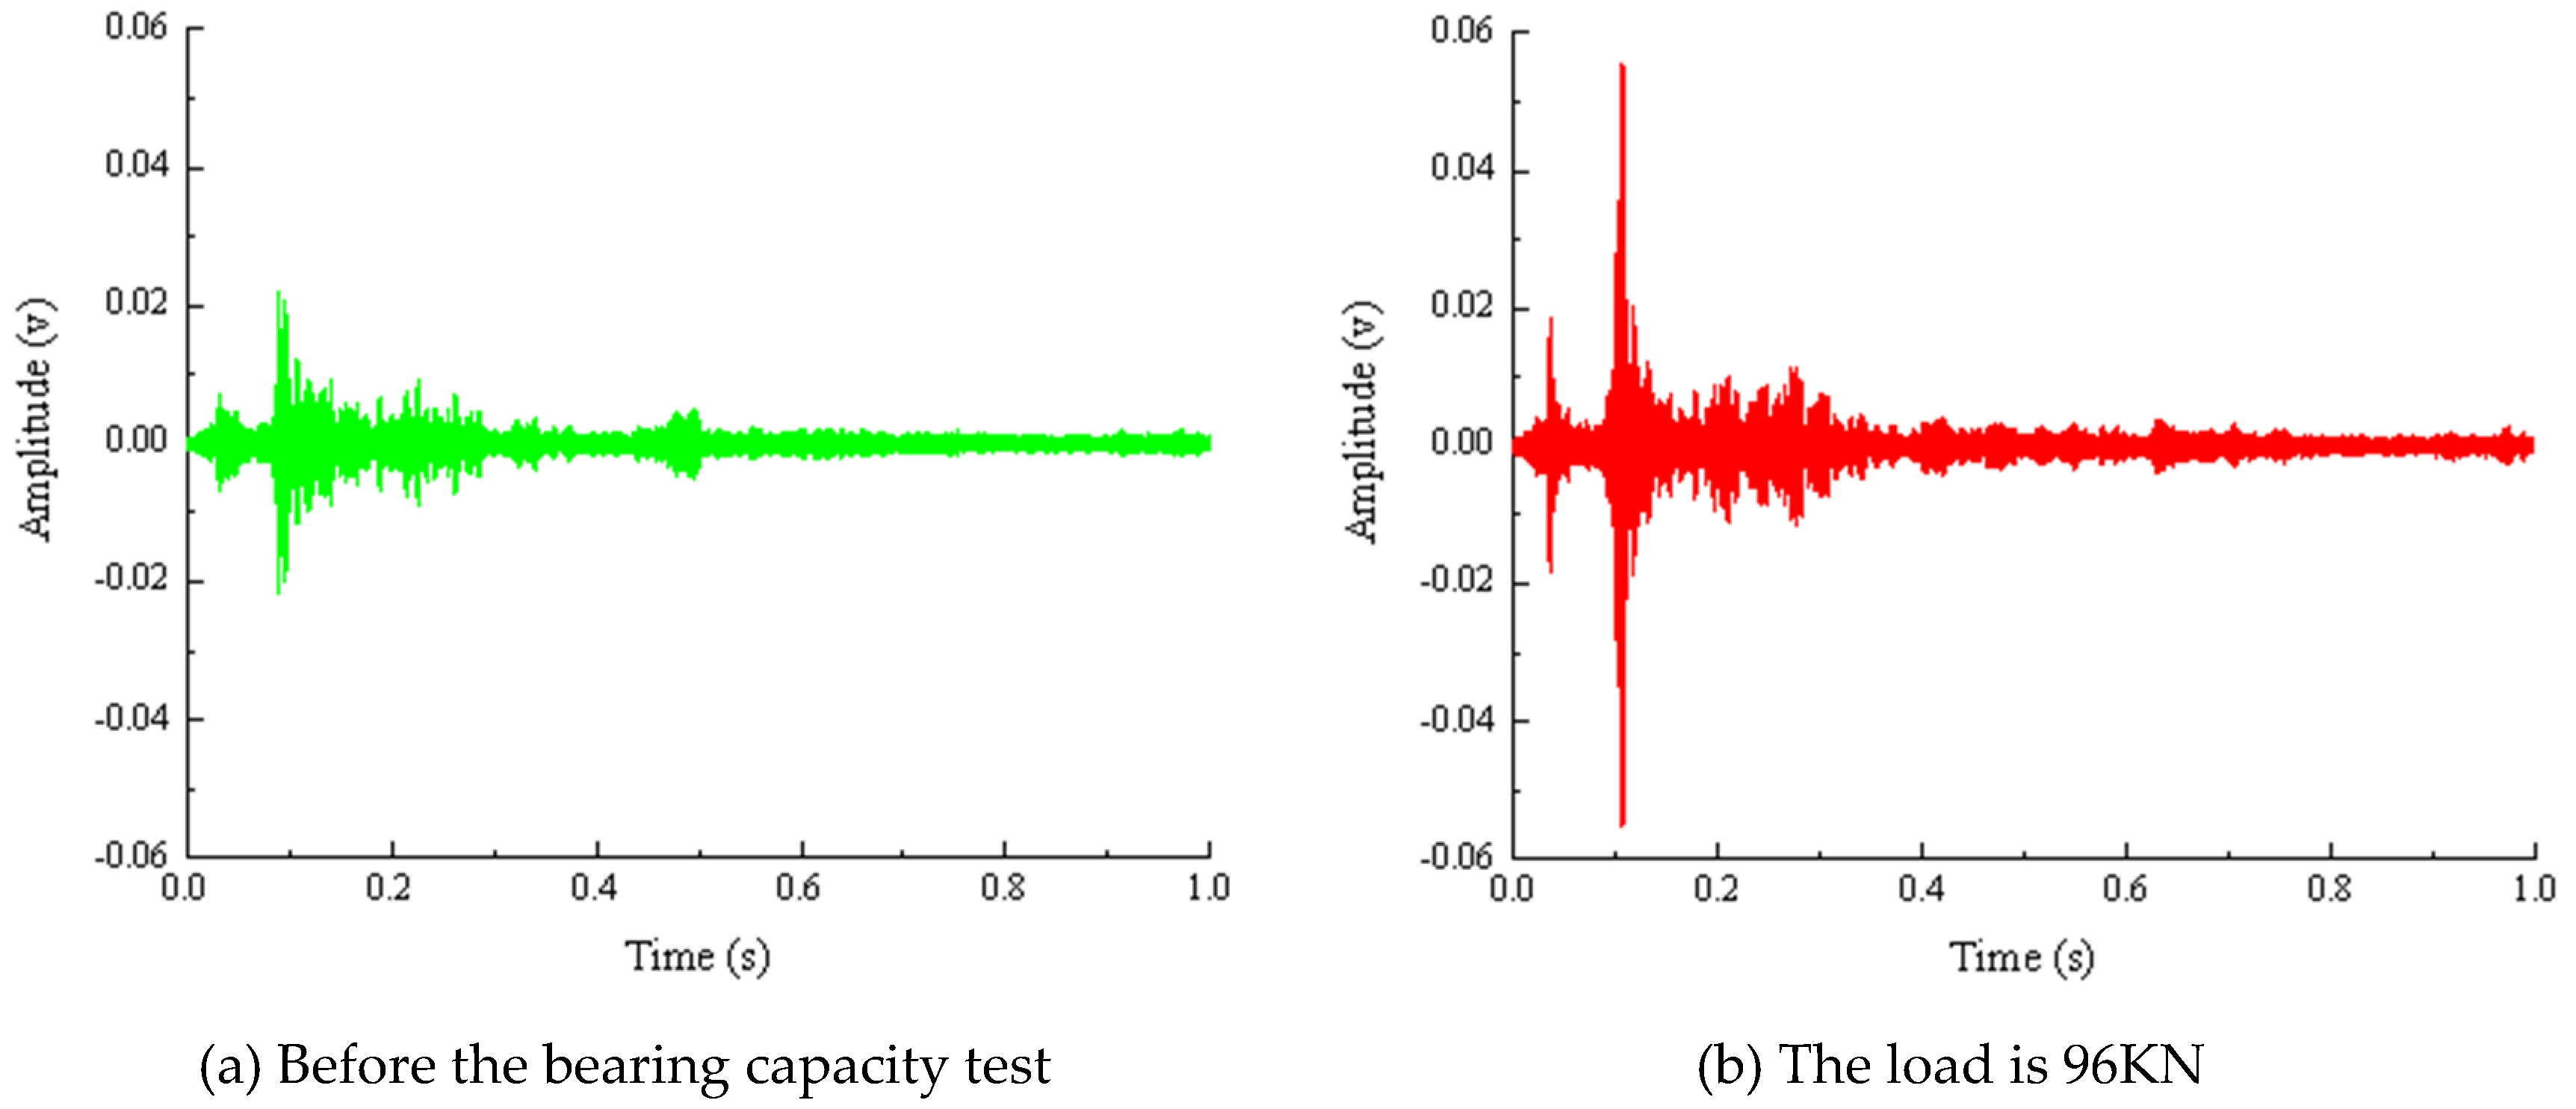
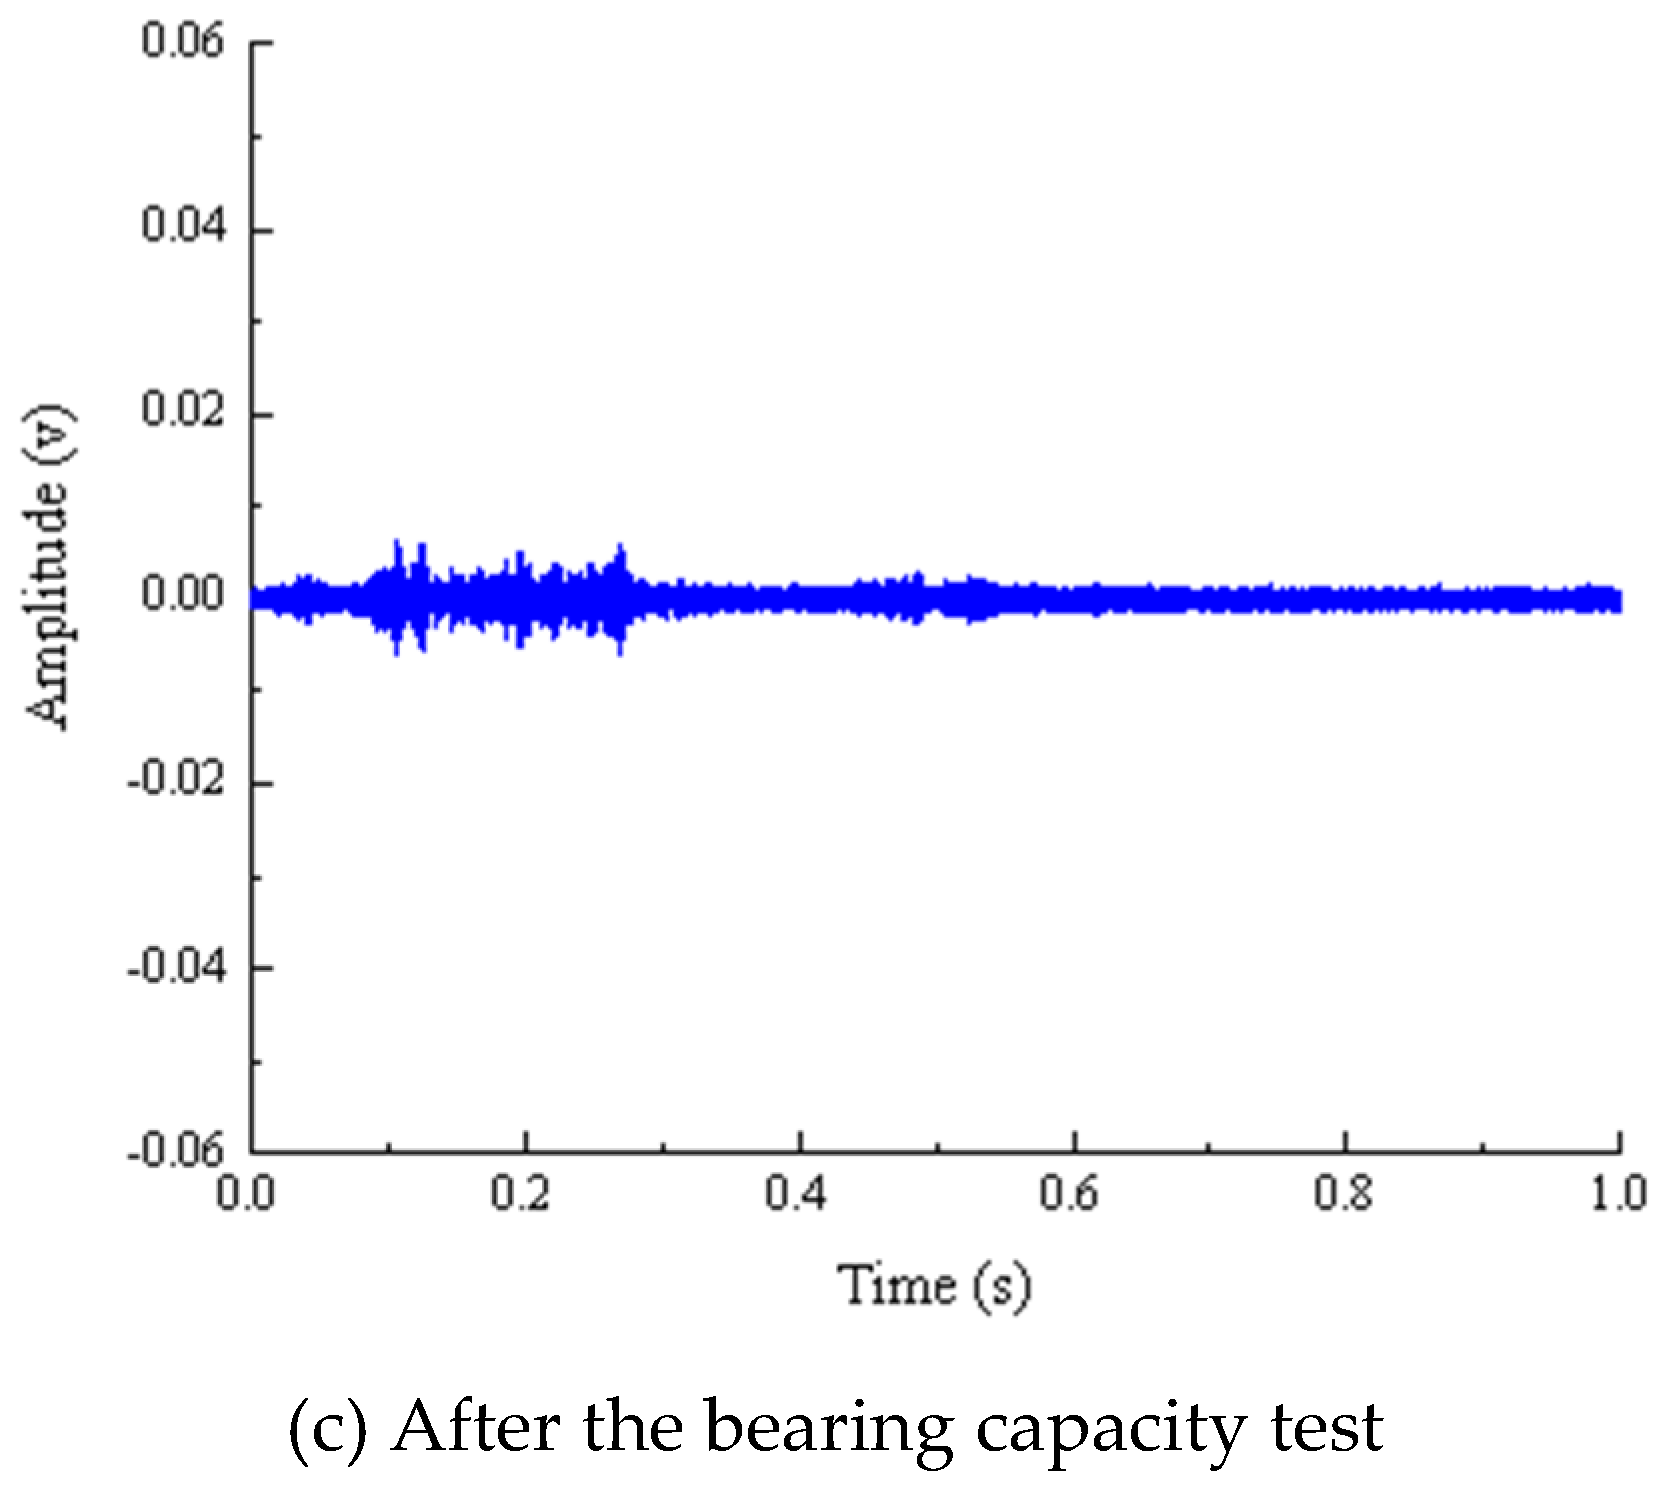
Figure 16.
Internal crack development index-load curve.
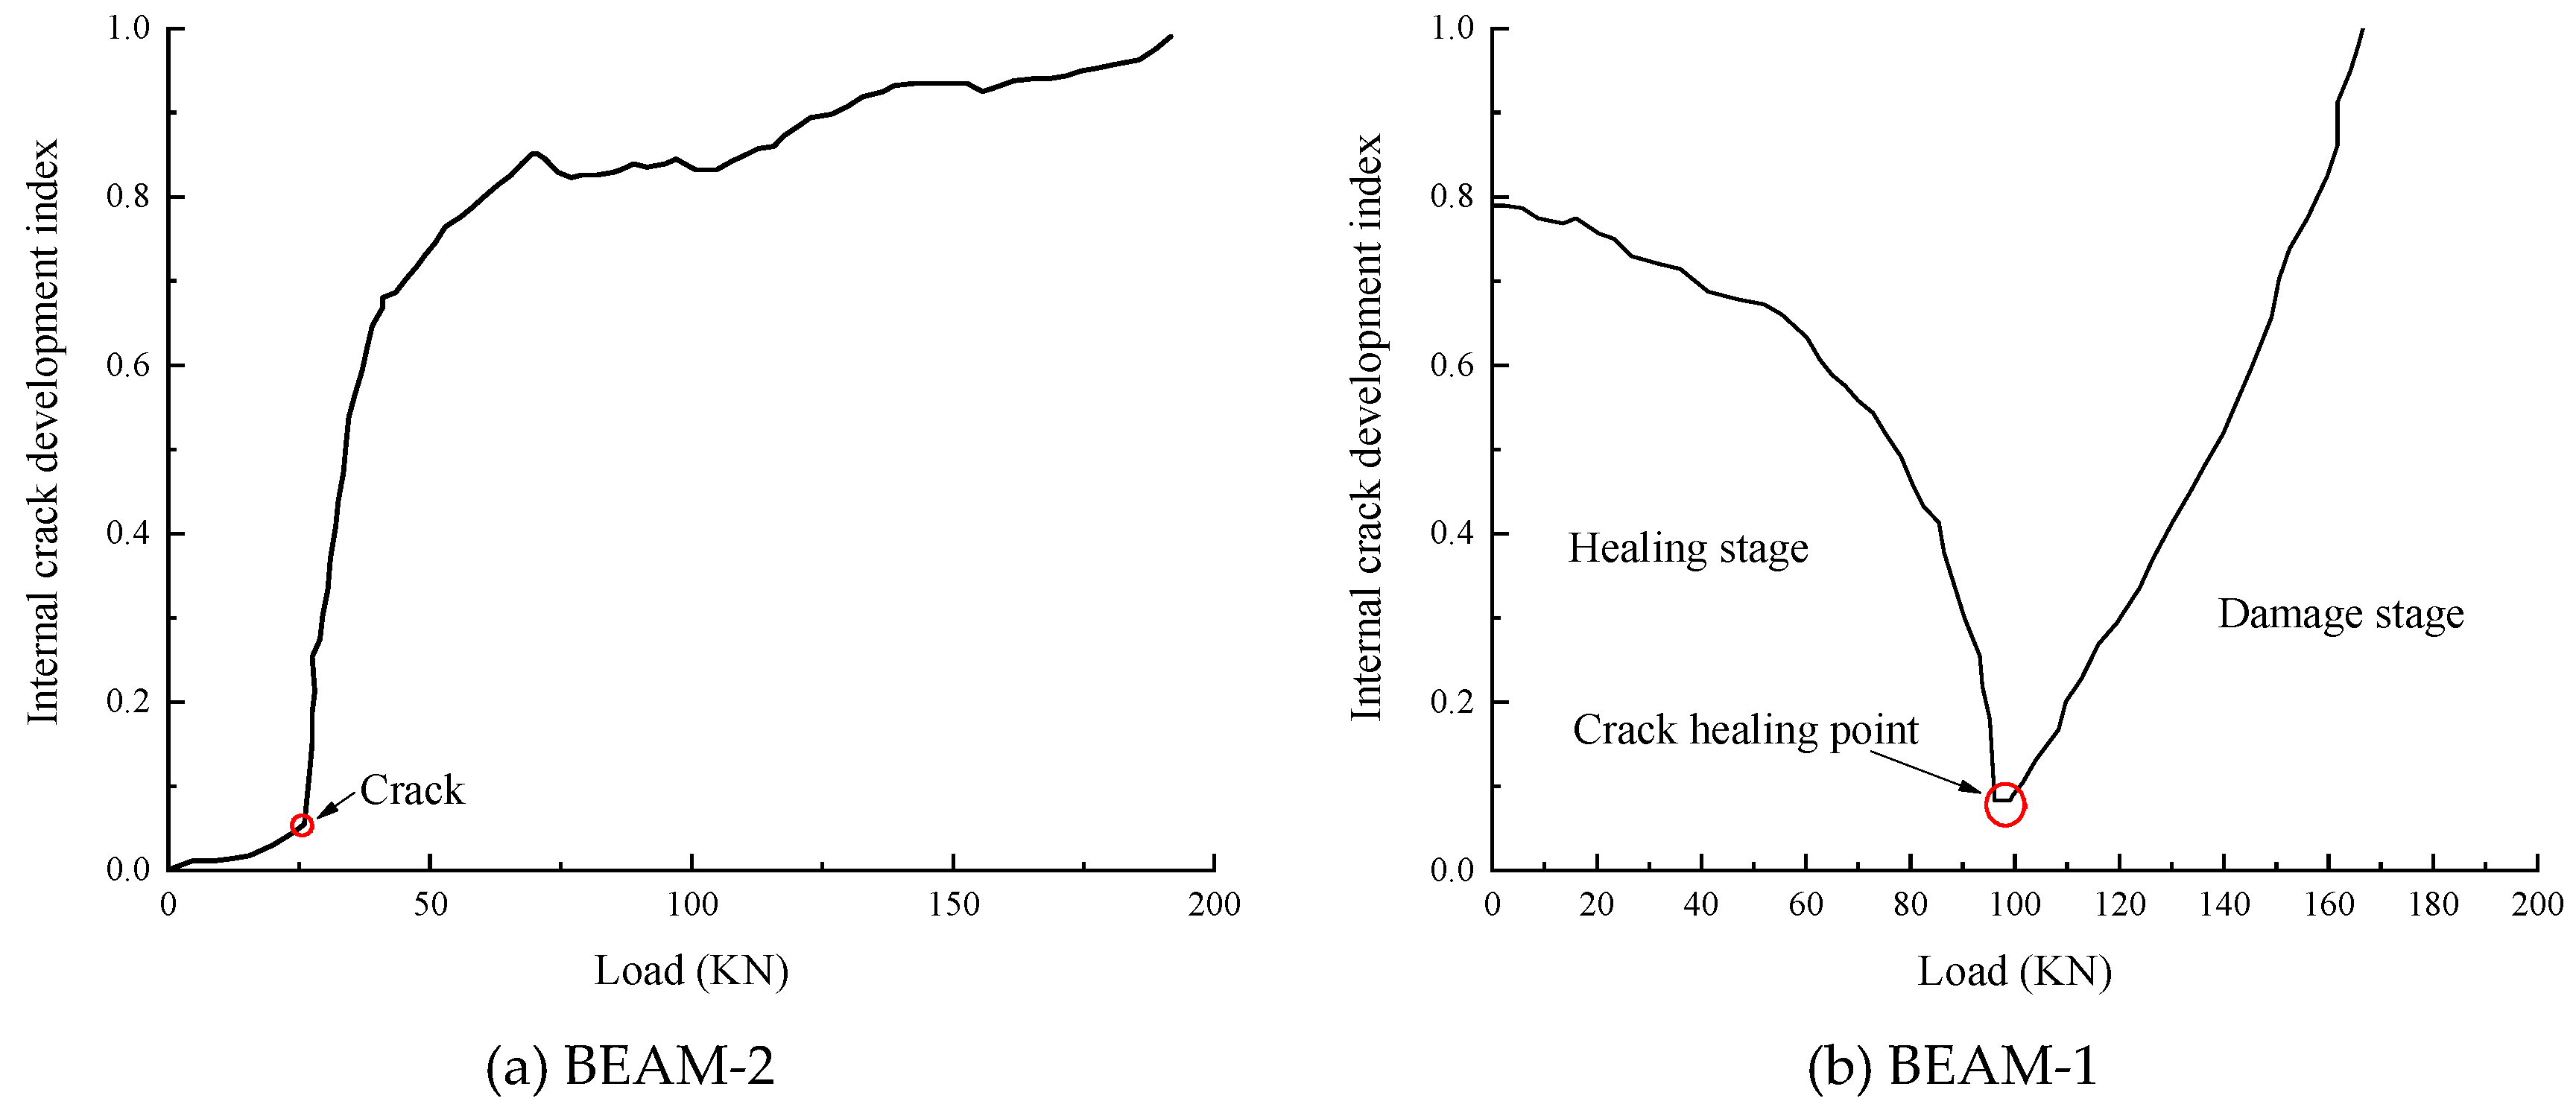

Table 1.
Concrete Mix Ratio.
| Type | Water-cement ratio(%) | Cement (kg/m3) |
Sand (kg/m3) |
Stone (kg/m3) |
Water (kg/m3) |
|---|---|---|---|---|---|
| C40 | 0.39 | 432 | 558 | 1242 | 168 |
Table 3.
Comparative analysis of damage assessment.
| Working condition | TNT equivalent(g) | Internal crack development index (R) | Damage index (D) | Damage assessment |
|---|---|---|---|---|
| BEAM-2 | - | 0 | 0 | - |
| BEAM-1 | 100 | 0.79 | 0.143 | Mild injury |
Disclaimer/Publisher’s Note: The statements, opinions and data contained in all publications are solely those of the individual author(s) and contributor(s) and not of MDPI and/or the editor(s). MDPI and/or the editor(s) disclaim responsibility for any injury to people or property resulting from any ideas, methods, instructions or products referred to in the content. |
© 2024 by the authors. Licensee MDPI, Basel, Switzerland. This article is an open access article distributed under the terms and conditions of the Creative Commons Attribution (CC BY) license (http://creativecommons.org/licenses/by/4.0/).
Copyright: This open access article is published under a Creative Commons CC BY 4.0 license, which permit the free download, distribution, and reuse, provided that the author and preprint are cited in any reuse.


