Submitted:
16 July 2024
Posted:
17 July 2024
Read the latest preprint version here
Abstract
This article raise a topic of critical examination of polypropylene, a key polymeric material, and its extensive application within the automotive industry, particularly focusing on the manufacturing of brake fluid reservoirs. The study aims to enhance the understanding of polypropylene's behavior under mechanical stresses through a series of laboratory destruction tests and numerical simulations, emphasizing the Finite Element Method (FEM). A novel aspect of this research is the introduction of the PEAK parameter, a groundbreaking approach designed to assess the material's resilience against varying states of strain, known as triaxiality. This parameter facilitates the identification of critical areas prone to crack initiation, thereby enabling the optimization of component design with a minimized safety margin, which is crucial for cost-effective production. The methodology involves conducting burst tests to locate crack initiation sites, followed by FEM simulations to determine the PEAK threshold value for the Sabic 83MF10 polypropylene material. The study successfully validates the predictive capability of the PEAK parameter, demonstrating a high correlation between simulated results and actual laboratory tests. This validation underscores the potential of the PEAK parameter as a predictive tool for enhancing the reliability and safety of polypropylene automotive components. The research presented in this article contributes significantly to the field of material science and engineering by providing a deeper insight into the mechanical behavior of polypropylene and introducing an effective tool for predicting crack initiation in automotive components. The findings hold promise for advancing the design and manufacturing processes in the automotive industry, with potential applications extending to other sectors.
Keywords:
polymer
; polypropylene
; triaxiality
; crack
; PEAK
; PEEQ
; TRIAX
; plastic strain
; reservoir
1. Introduction
The advent of polymeric materials, particularly polypropylene, first introduced to the market in the year 1951 [1], marked a significant milestone in the realm of material science and engineering. These materials have since played a pivotal role across a broad spectrum of industrial sectors. The selection of polymeric materials, especially polypropylene, is predicated on their exceptional mechanical properties, their inherent resistance to aging, the ability to maintain dimensional stability over the entirety of their lifecycle, their superior resistance to the initiation and propagation of cracks, and notably, their suitability for large-scale manufacturing processes such as extrusion and injection molding [2,3,4,5].
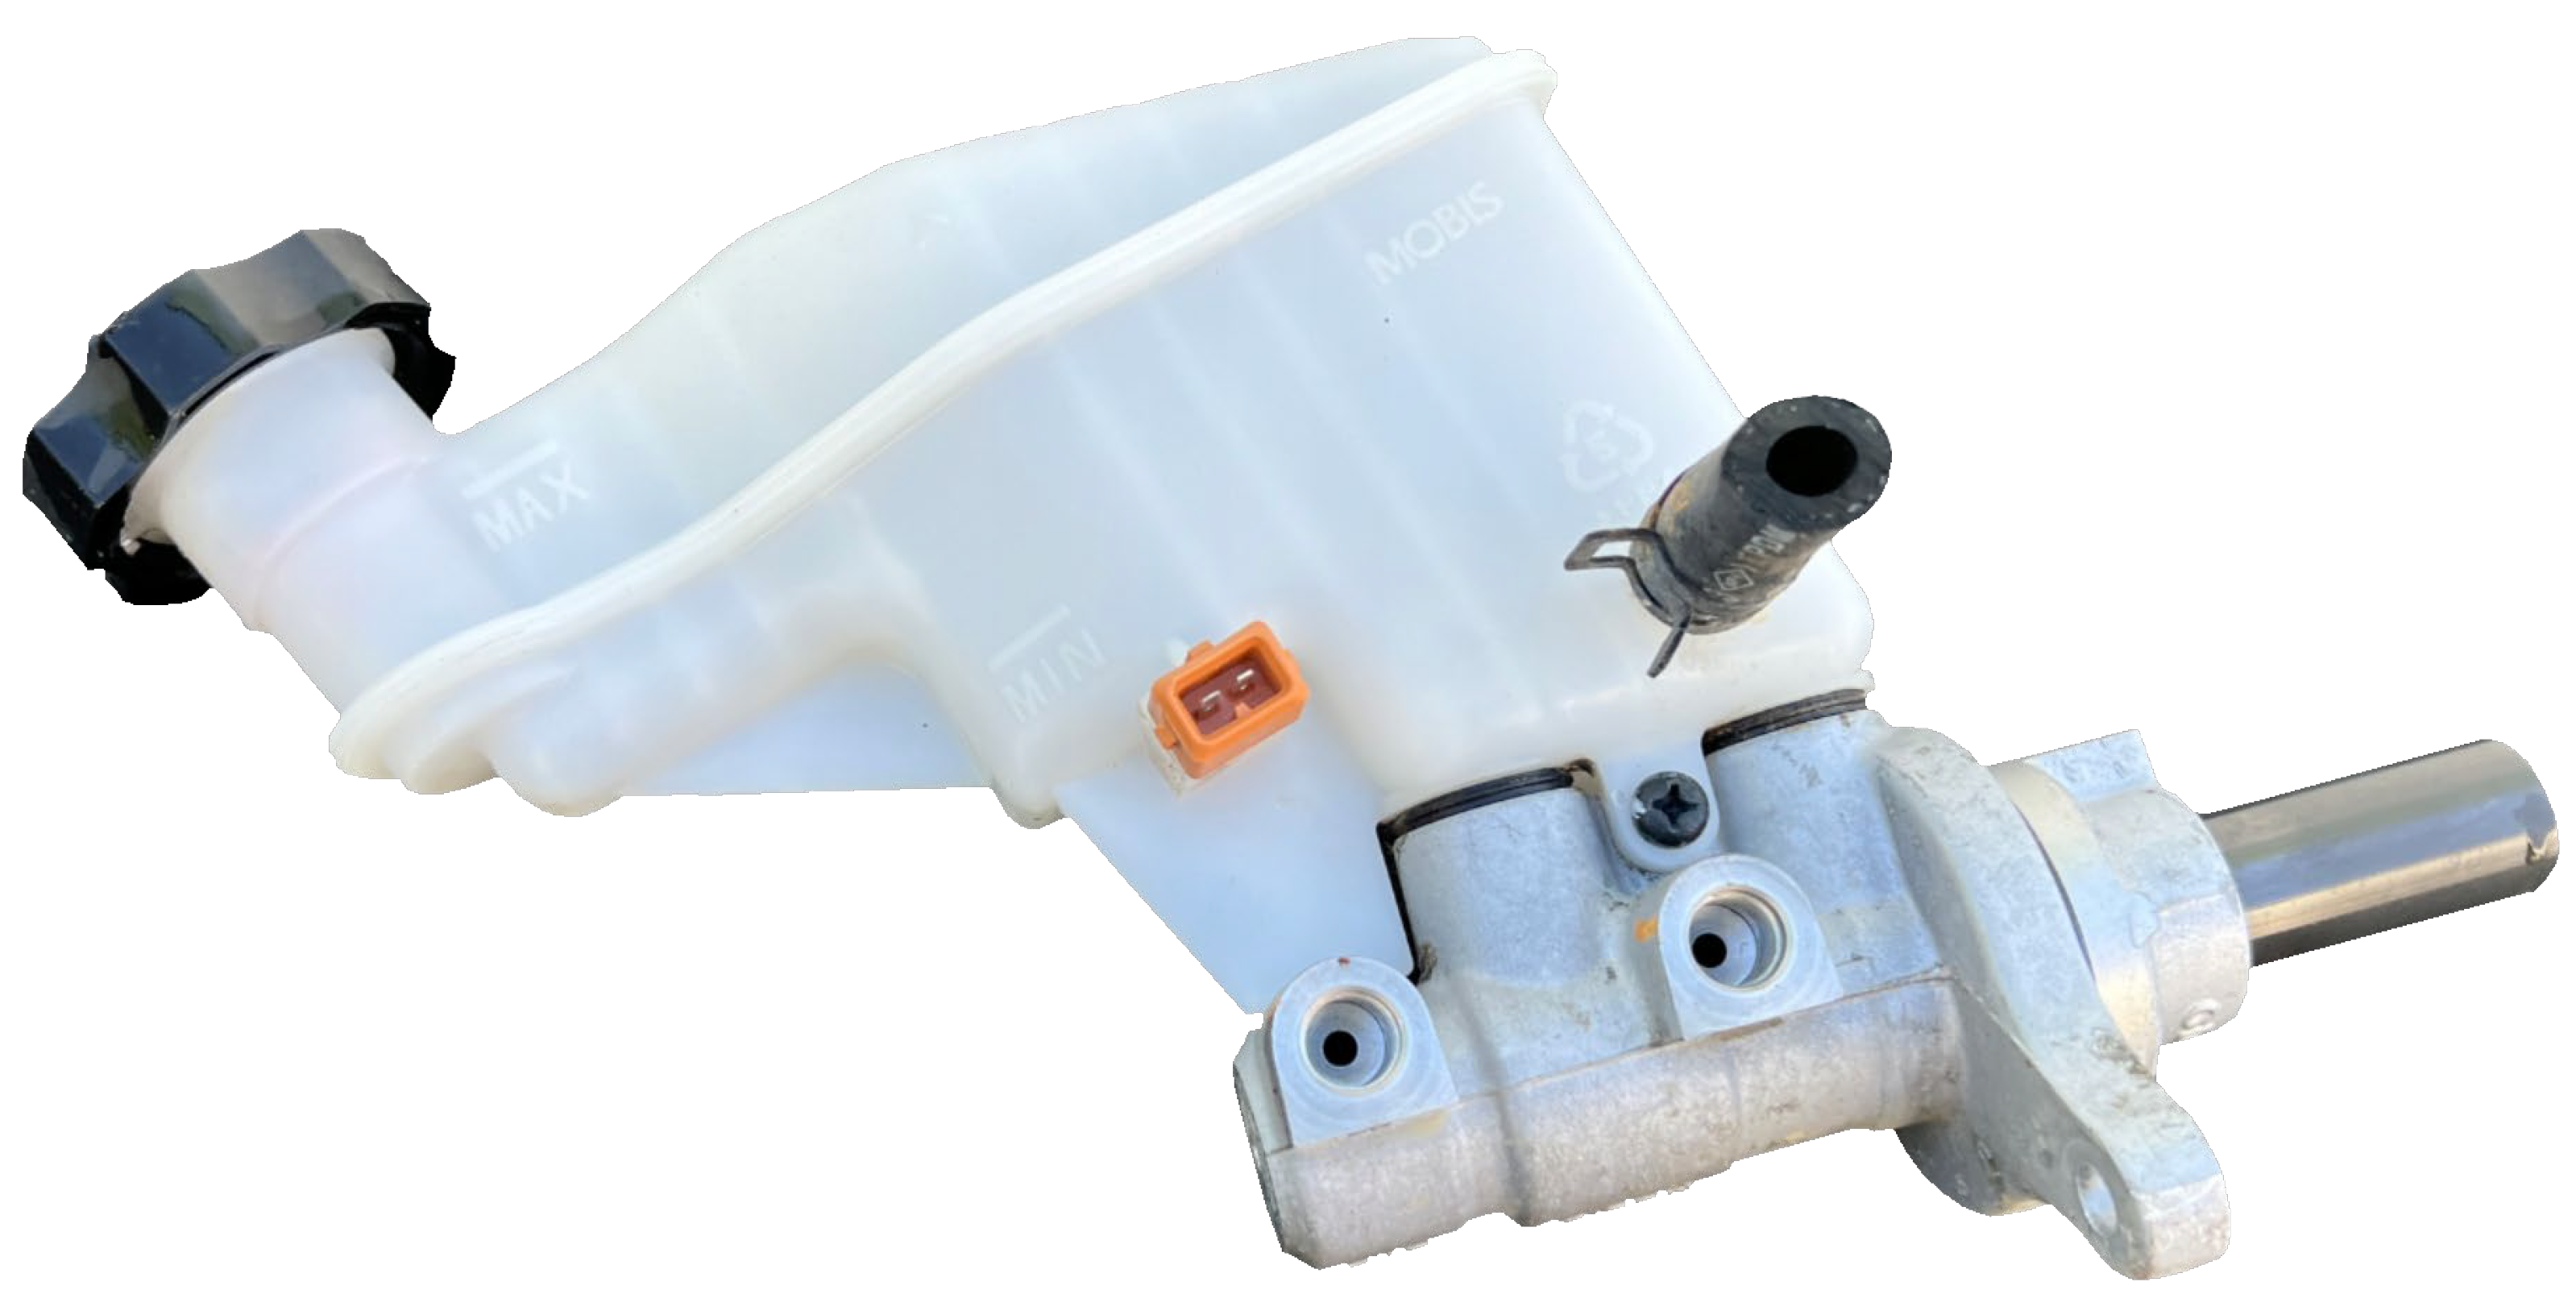
Given these advantageous properties, polypropylene has been extensively utilized within the automotive industry, serving not only in the fabrication of interior vehicle components but also in the production of parts that are subjected to significant mechanical stresses and are integral to the safety of the vehicle occupants [6]. An illustrative example of such an application is the brake fluid reservoir, an essential component within the braking systems of passenger vehicles. This component is subjected to critical mechanical stresses during the initial factory filling process, a stage at which a specialized filling head applies a considerable multidirectional load on the filler neck, testing the material’s resilience.
Figure 1.
Brake fluid reservoir mounted on brake fluid pump.
In the context of the ongoing efforts towards topological optimization of automotive components, including the aforementioned brake fluid reservoir, it becomes imperative to rigorously assess and validate the structural integrity of these components prior to initiating mass production. Historically, the adoption of numerical testing methodologies, with a particular emphasis on those based on the Finite Element Method (FEM), has been favored. The preference for these methodologies stems from their ability to deliver rapid and accurate results, thereby facilitating the efficient design and optimization of components. However, the reliance on numerical methods for the comprehensive validation of component structures necessitates the utilization of highly accurate material models that faithfully represent the physical and mechanical behavior of the object under simulation [7].
The Finite Element Method (FEM) is a widely recognized numerical technique used in engineering and mathematical modeling to find approximate solutions to boundary value problems for partial differential equations. It is particularly known for its effectiveness in simulations involving complex geometries, diverse material properties, and various boundary conditions. However, FEM is not the only method available for such simulations and required specially treated elements in the crack region [8,9,10,11,12]. Alternative numerical techniques, such as the Differential Quadrature Method (DQM) and the Bezier Multi-Step Method, have also been developed and applied successfully, particularly in predicting crack initiation in polymers. These methods offer precise solutions for complex mechanical behaviors and can serve as suitable alternatives to FEM in specific scenarios. The Differential Quadrature Method (DQM) is a numerical technique that approximates derivatives by a weighted sum of all function values in the domain. This method has been effectively applied in solving linear and nonlinear differential equations across various engineering fields. It is particularly noted for its high accuracy and efficiency in dealing with complex boundary conditions and geometries. The application of DQM in predicting crack initiation in polymers is discussed in [13]. This paper explores how DQM can be utilized to accurately predict the mechanical behavior of polymers, especially focusing on the challenges posed by cracks and defects. The Bezier Multi-Step Method is another numerical technique that has been applied to the field of polymer simulations, particularly in predicting crack initiation. This method leverages the properties of Bezier curves, which are widely used in computer graphics and geometric modeling, to solve differential equations. By integrating the Bezier curve’s control points into the solution process, this method provides a flexible and accurate approach to modeling complex mechanical behaviors. The effectiveness of the Bezier Multi-Step Method in this context is detailed in [14]. This article highlights the method’s precision and adaptability in handling the intricate dynamics involved in crack initiation and propagation in polymers. Both the Differential Quadrature Method and the Bezier Multi-Step Method offer promising alternatives to the Finite Element Method for simulations involving complex mechanical behaviors, such as crack initiation in polymers. These methods provide precise, efficient solutions and can be particularly advantageous in scenarios where traditional FEM might face limitations due to geometric complexity, material heterogeneity, or boundary condition intricacies.
A series of tests have been carried out to determine the basic strength parameters of polymer materials, including: determining the influence of triaxiality on the initiation of material cracking [15,16,17,18,19,20]. Importantly, all these studies mainly used printed samples, which allowed obtaining specially prepared shapes to obtain a relatively wide range of different states of material stress (triaxiality). Due to the nature of producing brake fluid tanks through the injection process, it is not possible to obtain, among others, at a reasonable cost: cylindrical samples. At the same time, the observed stress state in the tanks, i.e., the range from shear to triaxial stretching during the test of filling the tank with high-pressure fluid at a constant rate, allows us to focus on a narrowed range of material stress. Due to the above limitations and access only to existing brake reservoirs, the PEAK parameter (Adam Kasprzak’s Plastic Strain) was proposed, understood as a limit value sensitive to changes in the state of material strain (triaxiality), standardly used in such situations, Equivalent Plastic Strain (PEEQ).
The purpose of further laboratory destruction tests and numerical simulations is to find the PEEQ and TRIAX parameters for the crack initiation locations, which will enable determining the boundary of the critical area and determining the original PEAK parameter, which is the limit of the safe range of the material state, guaranteeing consistency while minimizing the safety margin which is important due to the production costs of the reservoirs.
2. Material Definition
All reservoirs used for further tests were made of Polypropylene called Sabic 83MF10 without reinforcing inclusions such as glass fibers, etc. The basic strength parameters are presented below:

Table 1.
Basic material properties for Polypropylene Sabic 83MF10 [21].
Table 1.
Basic material properties for Polypropylene Sabic 83MF10 [21].
| Parameter | Value |
|---|---|
| Density | |
| Tensile modulus | |
| Poisson ratio | |
| Yield stress in RT |
Due to the nature of the limited range of loads characteristics, the numerical simulation used a material model taking into account the Young’s modulus , Poisson ratio and the Johnson-Cook plasticity model with the characteristics:
3. Experiment Definition
The introduction to further research is the selection of 15 tanks, including 5 different models of tanks, 3 pieces each.
3.1. Laboratory Pressure Test
The first step to building a correlation is to perform burst tests using equipment that allows for a constant increase in water pressure inside a tightly closed reservoir. The aim of this stage is to find the places of crack initiation, which is possible due to the speed of its propagation thanks to a high-speed camera.
Figure 2.
Crack propagation with average speed of (from connection of internal rib and out shell) on high-speed camera frames for reservoir no. 5.1.
Figure 2.
Crack propagation with average speed of (from connection of internal rib and out shell) on high-speed camera frames for reservoir no. 5.1.
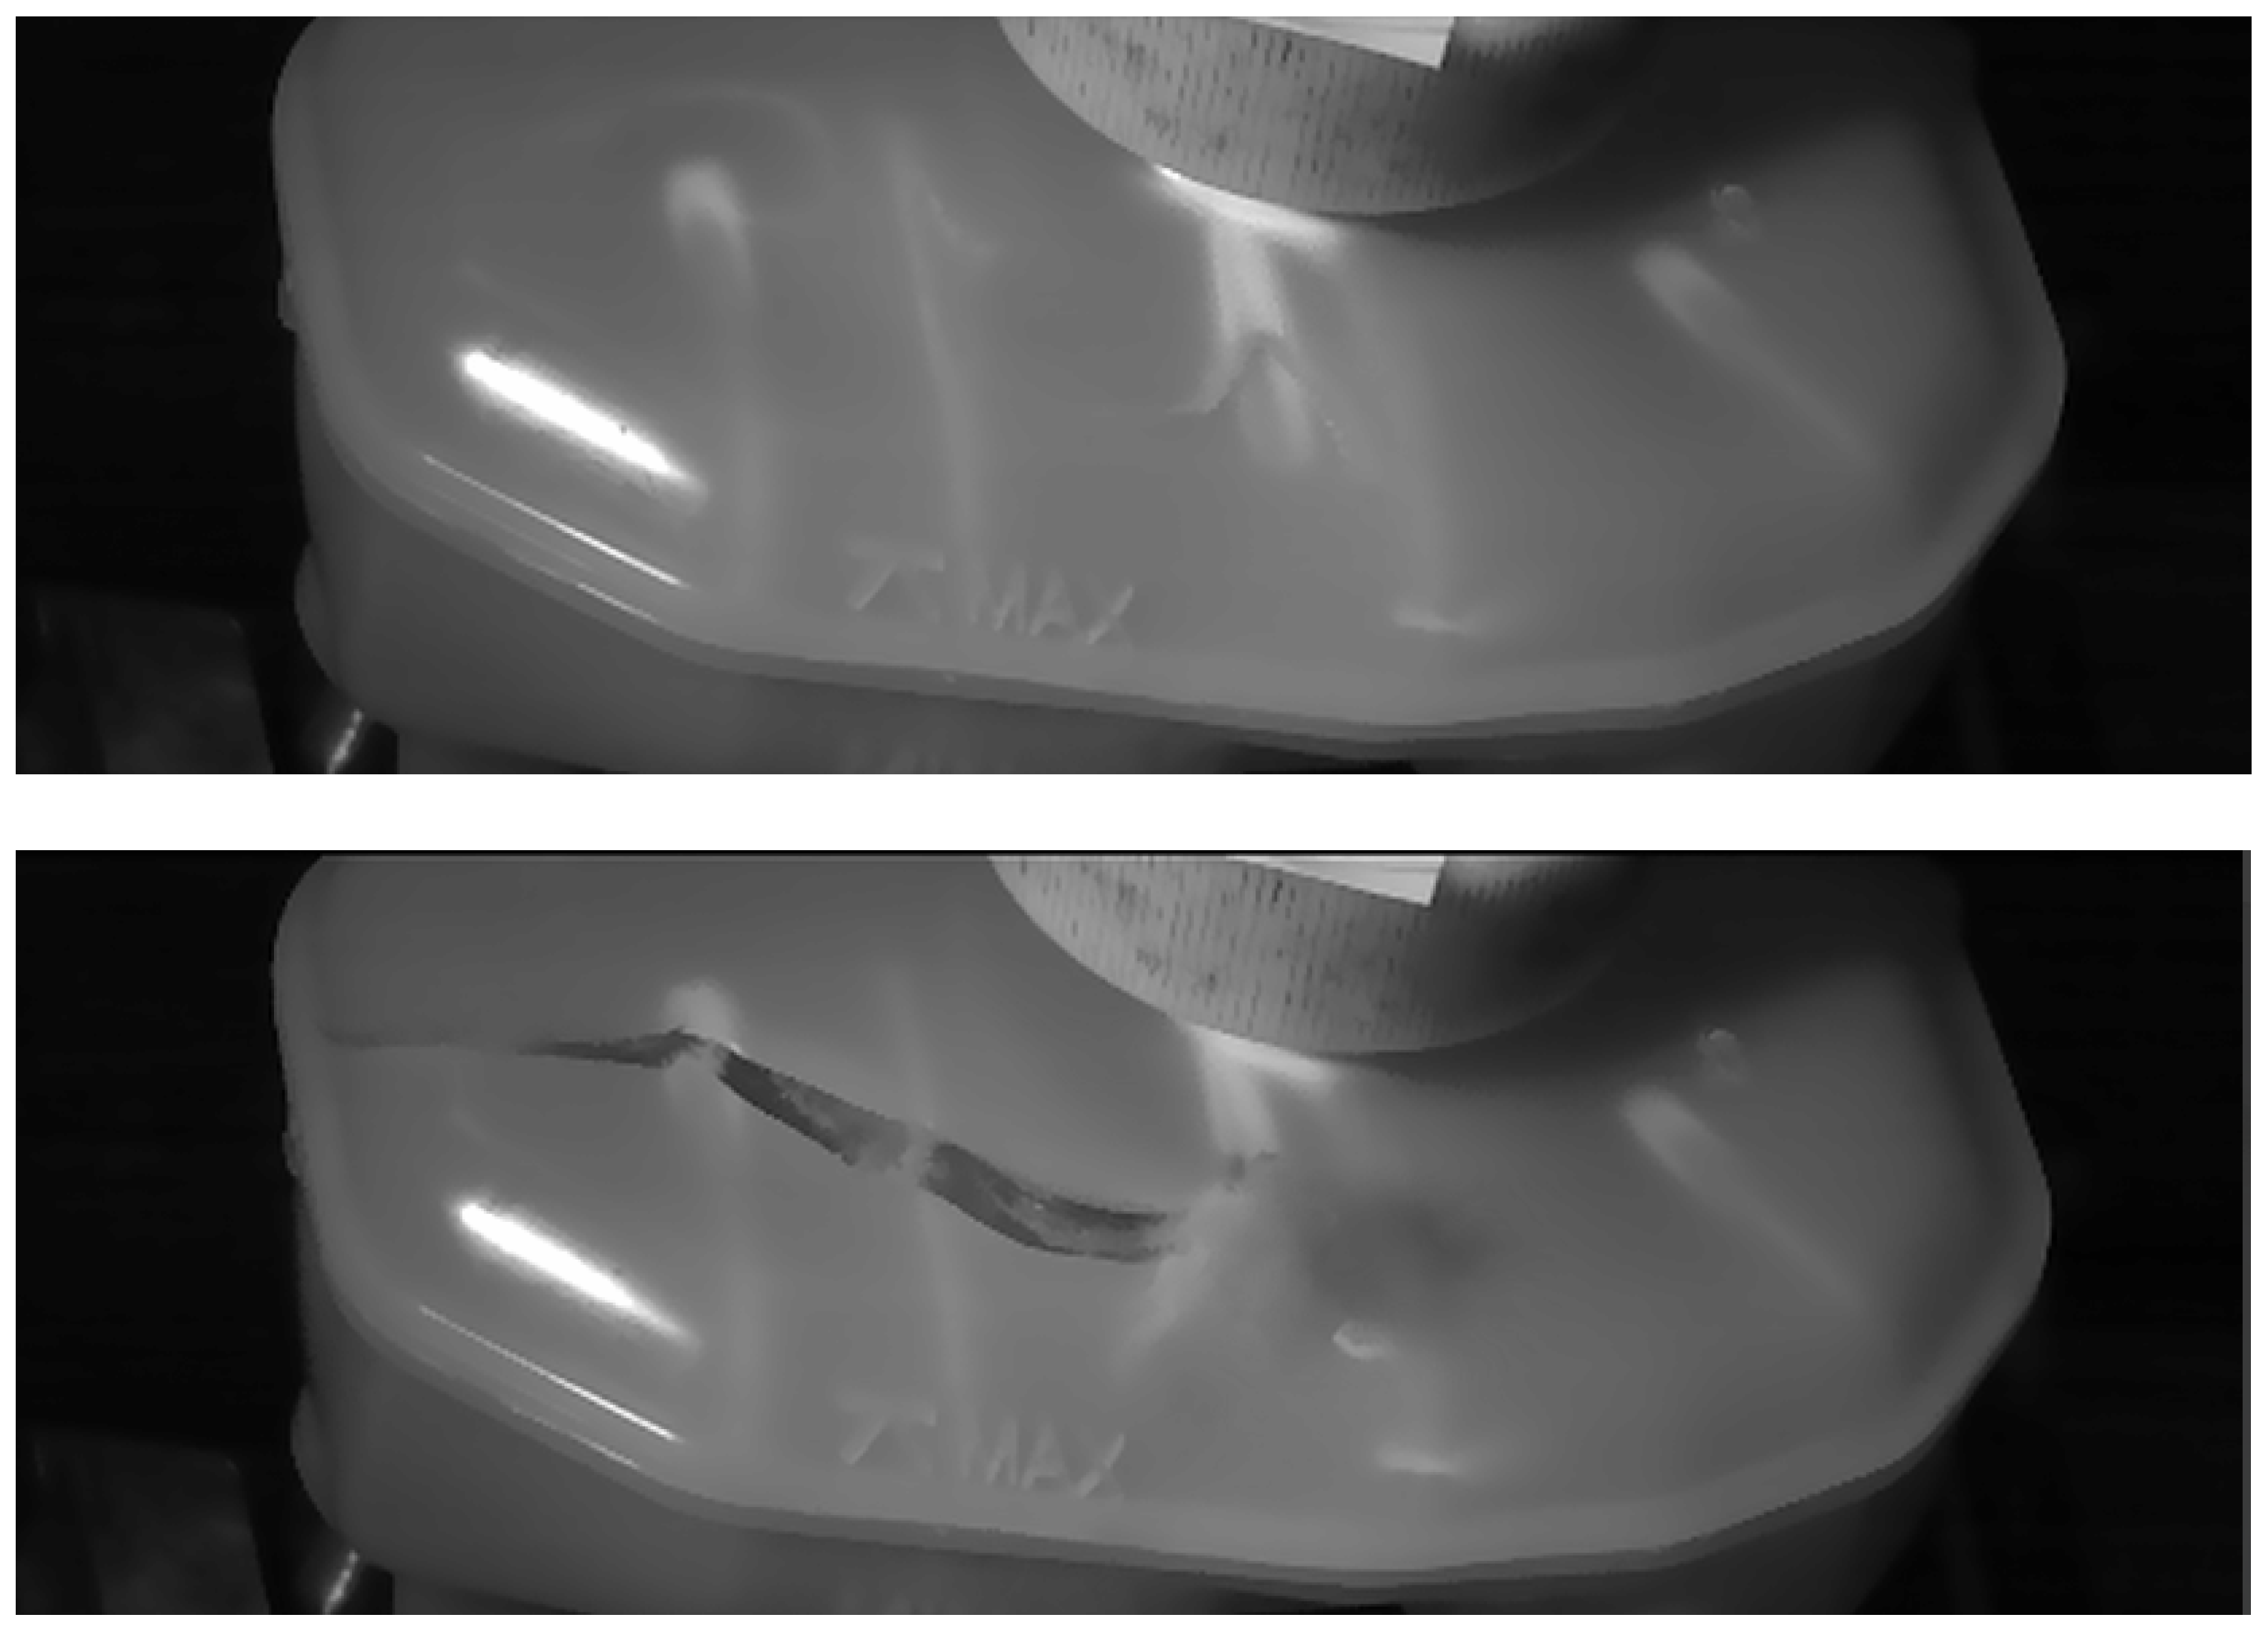
Figure 3.
Crack for reservoir no. 5.2.

3.2. Simulation Analysis
The second step it to find PEEQ and TRIAX parameters at high amount of reservoir points, including crack initiation spots and places which withstand the given load. Due to the repeatability of parameters in laboratory test, it’s reasonable to use static implicit simulation in Abaqus Finite Element Method (FEM) software in analysis.
Figure 4.
Triaxiality field for detected crack initiation spot in FEM analysis for reservoir no. 5.1.
Figure 4.
Triaxiality field for detected crack initiation spot in FEM analysis for reservoir no. 5.1.

4. PEAK Calibration
The methodology presented below is an original solution to the issue of including PEEQ and TRIAX parameters in a single PEAK parameter. The determined PEAK value is an individual limit for each material and test parameter (for which we perform calibration) beyond which crack initiation can be expected.
4.1. Data Comparison
For each of the reservoirs, the parameters PEEQ and TRIAX were read for the points that were crack initiation occurred (nok) and where the applied load still did not cause damage understood as a break in the continuity of the material (ok). This will allow you to isolate the safe operating range of the material. Due to the nature of the research and the state of current knowledge, it was important to look for points with the highest possible equivalent plastic strain PEEQ and Triaxiality TRIAX values. The places of reading the results where the crack occurred (marked as NOK) were clearly determined based on observations with a high-speed camera during each laboratory test. Places marked as OK were designated based on the overall assessment of the reservoir and finding points with high values of both parameters.
Table 2.
Full data (PEEQ & TRIAX at specified points) for simulated and tested reservoirs (rsv).
| RSV no | Result* | PEEQ | TRIAX |
|---|---|---|---|
| 1.1 | nok | 0.613 | 0.348 |
| ok | 0.452 | 0.316 | |
| ok | 0.385 | 0.527 | |
| 1.2 | nok | 0.634 | 0.289 |
| ok | 0.418 | 0.428 | |
| ok | 0.342 | 0.486 | |
| 1.3 | nok | 0.566 | 0.325 |
| ok | 0.327 | 0.470 | |
| ok | 0.326 | 0.327 | |
| 2.1 | nok | 0.553 | 0.583 |
| ok | 0.519 | 0.375 | |
| ok | 0.385 | 0.527 | |
| 2.2 | nok | 0.445 | 0.523 |
| ok | 0.478 | 0.401 | |
| ok | 0.386 | 0.485 | |
| 2.3 | nok | 0.624 | 0.300 |
| ok | 0.403 | 0.492 | |
| ok | 0.312 | 0.540 | |
| 3.1 | nok | 0.487 | 0.432 |
| ok | 0.364 | 0.695 | |
| ok | 0.325 | 0.647 | |
| 3.2 | nok | 0.398 | 0.713 |
| ok | 0.385 | 0.689 | |
| ok | 0.325 | 0.836 | |
| 3.3 | nok | 0.419 | 0.705 |
| ok | 0.289 | 0.946 | |
| ok | 0.304 | 0.774 | |
| 4.1 | nok | 0.695 | 0.202 |
| ok | 0.528 | 0.225 | |
| ok | 0.517 | 0.195 | |
| 4.2 | nok | 0.645 | 0.253 |
| ok | 0.579 | 0.217 | |
| ok | 0.474 | 0.284 | |
| 4.3 | nok | 0.822 | 0.178 |
| ok | 0.406 | 0.341 | |
| ok | 0.384 | 0.398 | |
| 5.1 | nok | 0.349 | 1.079 |
| ok | 0.281 | 0.936 | |
| ok | 0.295 | 0.973 | |
| 5.2 | nok | 0.343 | 0.983 |
| ok | 0.306 | 0.839 | |
| ok | 0.285 | 1.022 | |
| 5.3 | nok | 0.381 | 0.879 |
| ok | 0.327 | 0.794 | |
| ok | 0.388 | 0.802 |
* nok – crack nucleation place / ok – no crack nucleation place.
4.2. Mathematical Formulation of PEAK
The PEAK curve proposed below, together with the parameter , which is the limit value separating the places of crack initiation in the material from safe places, was determined on the basis of the previously presented data in accordance with the principle of minimizing the safety margin while maintaining all “nok” points above the proposed value.
Proposed parts of above equation have precisely defined task:
- - non-linear dependence on the basic parameter PEEQ;
- - asymptotic drop of isoline to the limit value for higher TRIAX;
- – lack of sensitivity for points with negative TRIAX values, which automatically receive negative values of PEAK.
For testes SABIC 83MF10 material and laboratory condition mentioned previously PEAK parameter could be estimated as: , , , and crack threshold .
Final equation takes form:
The raw data results together with the final curve defining the limits after exceeding which we can expect crack initiation can be visualized as below:
Figure 5.
curve with raw data measured on reservoirs.
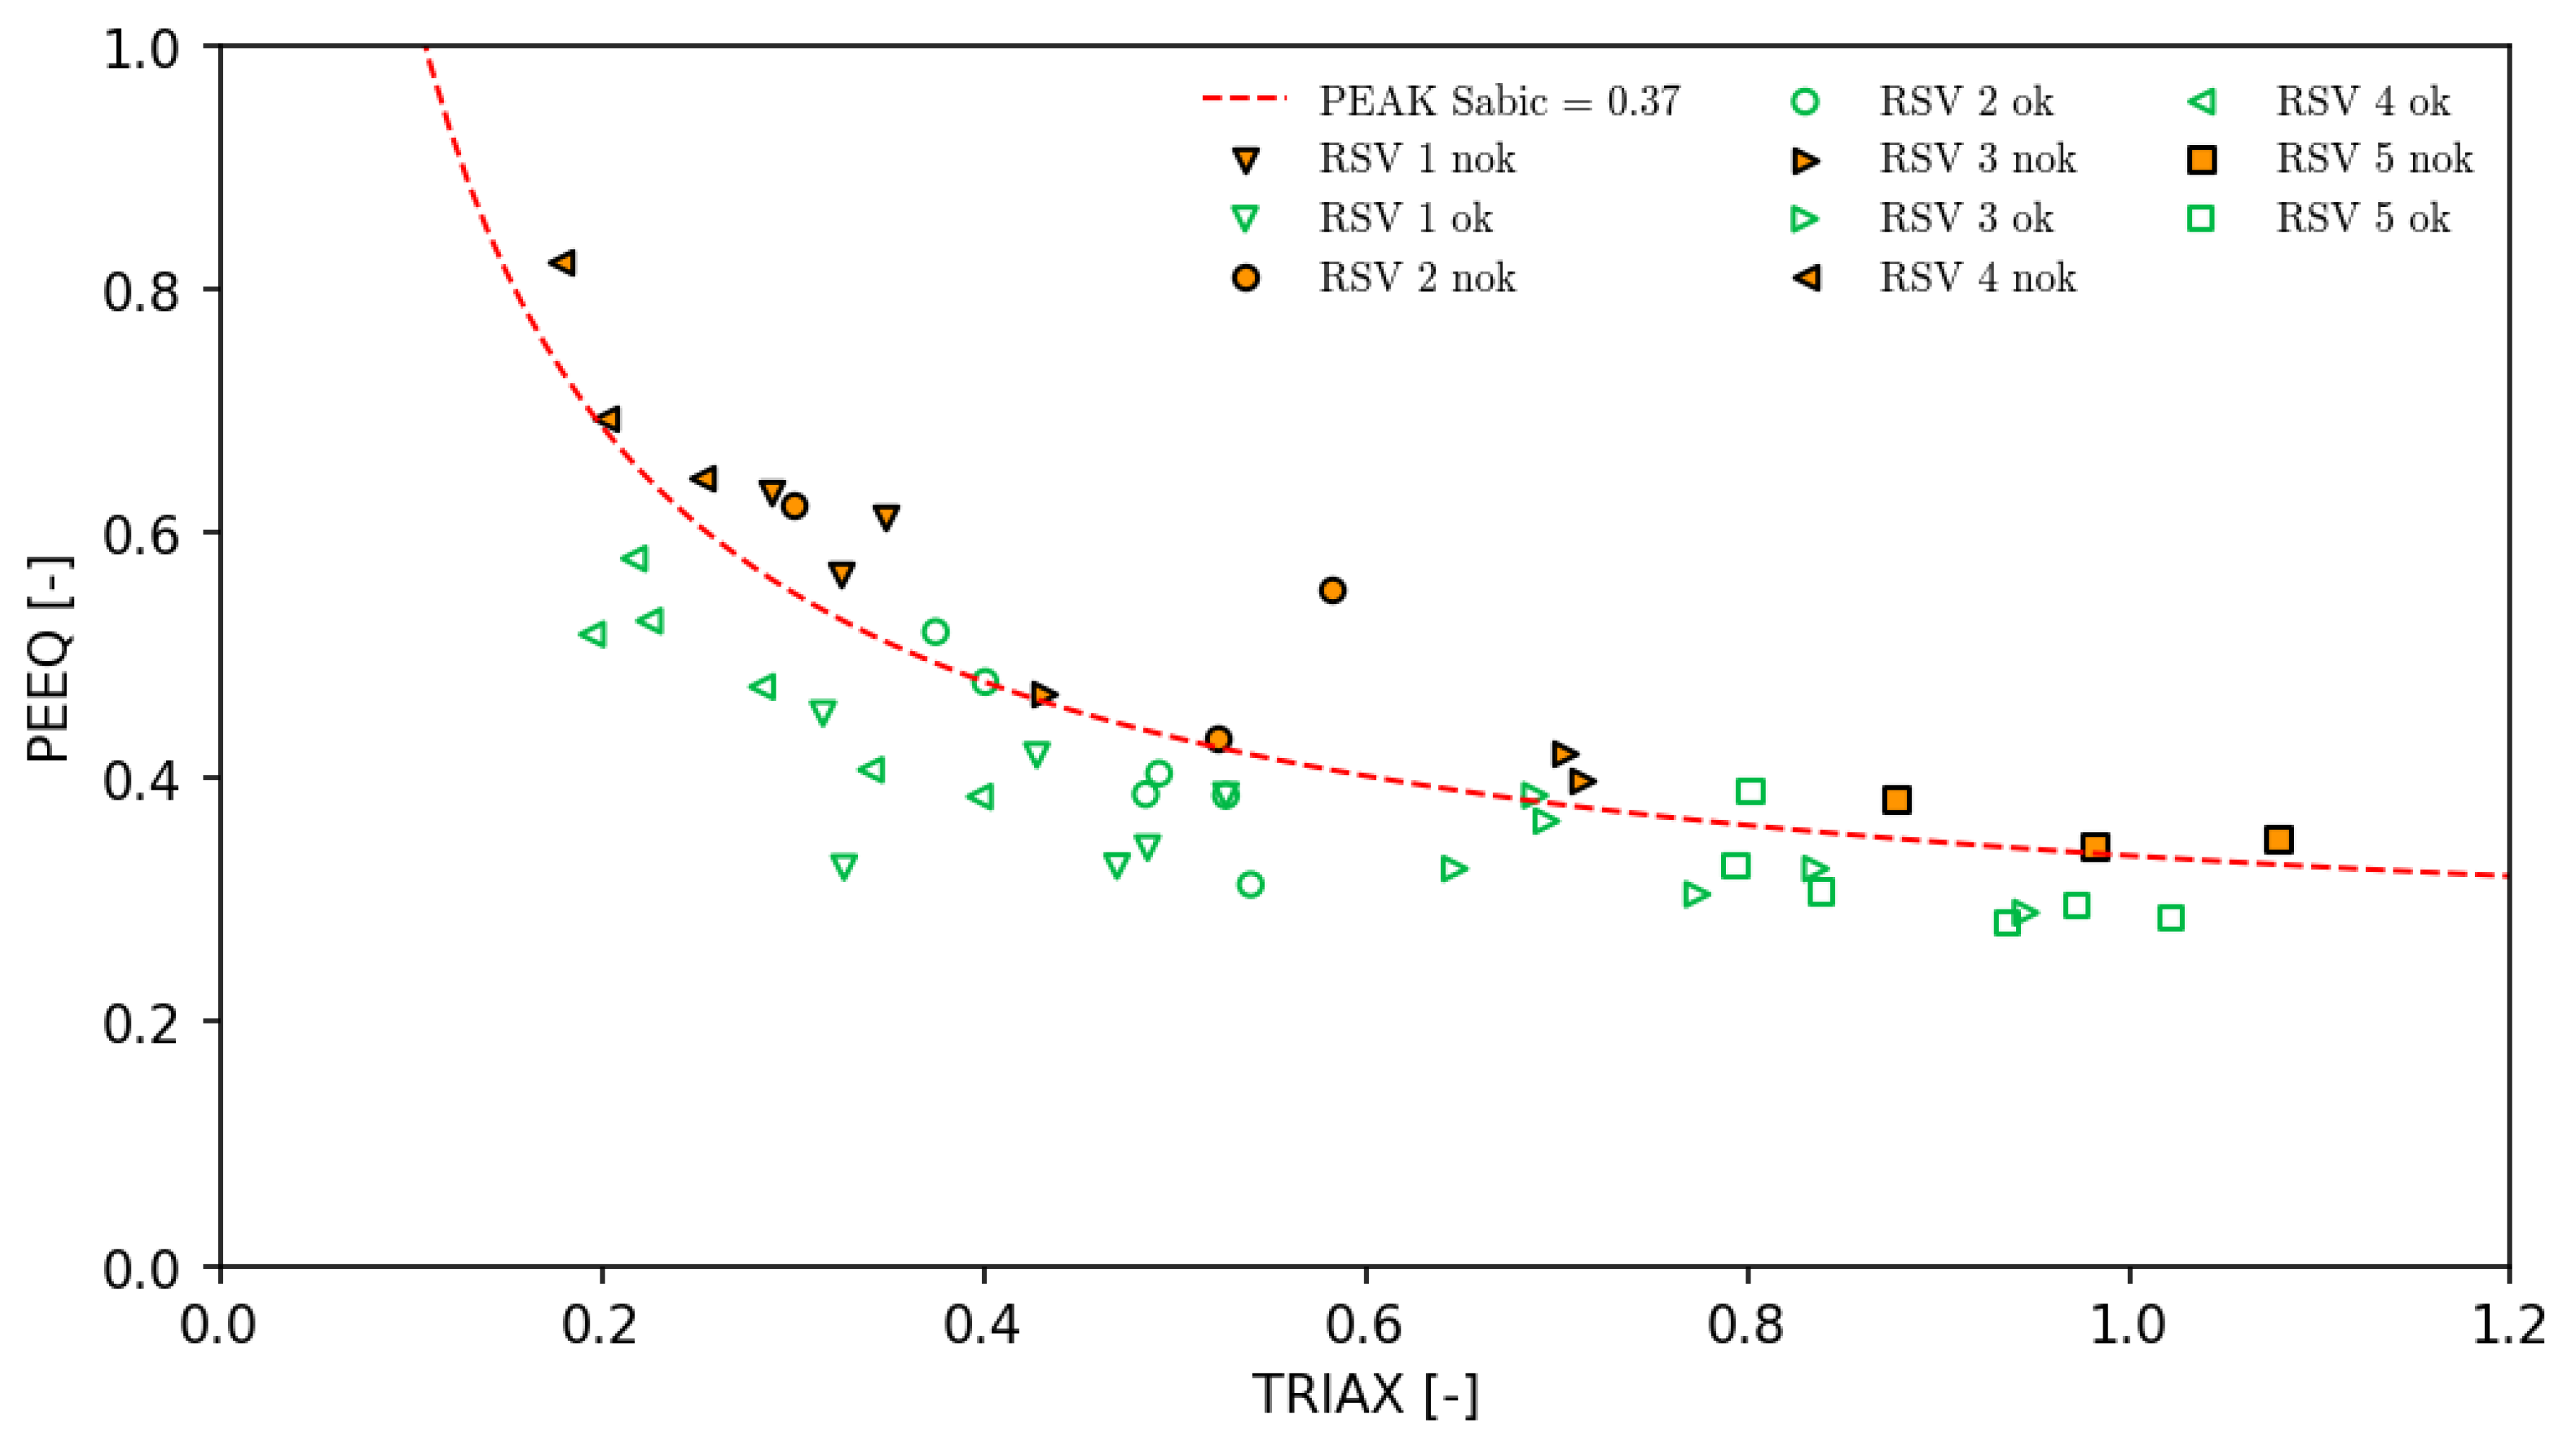
Due to the direct dependence of the PEAK parameter on the value of plastic strain PEEQ, its simple value results from the plasticity characteristics of the material. The lower the value of the yield strength and the flatter the yield curve, the faster the critical value of the PEAK parameter will be reached, suggesting the possibility of cracking. This is consistent with the standard use of a fracture mechanism called ductile damage when assessing the strength of polymeric materials, which depends linearly on the plastic strain to fracture value. The proposed PEAK parameter uses a similar characteristic, i.e., equivalent plastic strain PEEQ. The Young Modulus value does not have a direct impact on the crack initiation moment suggested by the PEAK methodology, but may indirectly cause additional stresses at the border of areas with non-uniform load levels. The method and parameters for the Sabic material presented in the article were obtained for directly defined material parameters such as Yield strength and Young Modulus.
4.3. PEAK’s Prediciton of Crack Initiation Pressure
The mere estimation of the limit curve taking into account the minimum safe factor is not a sufficient indicator of the ability of the proposed PEAK parameter to determine as close as possible to reality the pressure at which a tank filled with liquid will burst. It is important to determine the statistical percentage of simulation result utilization at the moment the PEAK parameter is exceeded (which is understood as the estimated moment of rupture) compared to the values obtained in the laboratory test. An additional checked function of the proposed parameter is its ability to predict the correct location of the first crack. For this purpose, data from laboratory tests was collected for other 5 types of reservoirs, 3 pieces each.
Table 3.
Simulation and laboratory data comparison.
| RSV no | Right place* | Lab result [bar] | Sim result [bar] | Utilization |
|---|---|---|---|---|
| 6.1 6.2 6.3 |
yes yes no |
17.8 18.9 18.0 |
17.4 |
97.8% 92.1% 96.7% |
| 7.1 7.2 7.3 |
yes yes yes |
13.5 14.0 14.1 |
12.3 |
91.1% 87.9% 87.2% |
| 8.1 8.2 8.3 |
yes no yes |
16.9 17.2 15.8 |
16.5 |
97.6% 95.9% 104.4% |
| 9.1 9.2 9.3 |
yes yes yes |
10.5 10.3 11.2 |
9.7 |
92.4% 94.2% 86.6% |
| 10.1 10.2 10.3 |
no no no |
21.4 22.7 20.9 |
18.2 |
85.0% 80.2% 87.1% |
* yes – right crack nucleation place prediction / no – wrong crack nucleation place prediction.
Based on the data obtained, we can see that using the PEAK method:
- the place of rupture was selected correctly in 66.7% of cases,
- the average utilization value reached 91.7% for all results and 90.8% excluding tank 8.3 from the analysis (due to a false positive result in this test),
- for 93.3% of tanks, the estimated result was obtained in the form of a lower result in the simulation than in laboratory tests with the highest possible utilization (close to 100% as possible).
Statistical analysis (for graphic see Figure 6, Figure 7 and Figure 8) estimate crucial factor need for making future predictions using the PEAK method:
- the obtained utilization results fit well into the normal distribution with parameter Mean = 0.9174 and Standard Deviation = 0.06225, as indicated by the Anderson-Darling parameter = 0.218 and p-value = 0.803,
- the probability of a false positive simulation result compared to the laboratory result, forecast in accordance with the above parameters, is 9.2%.
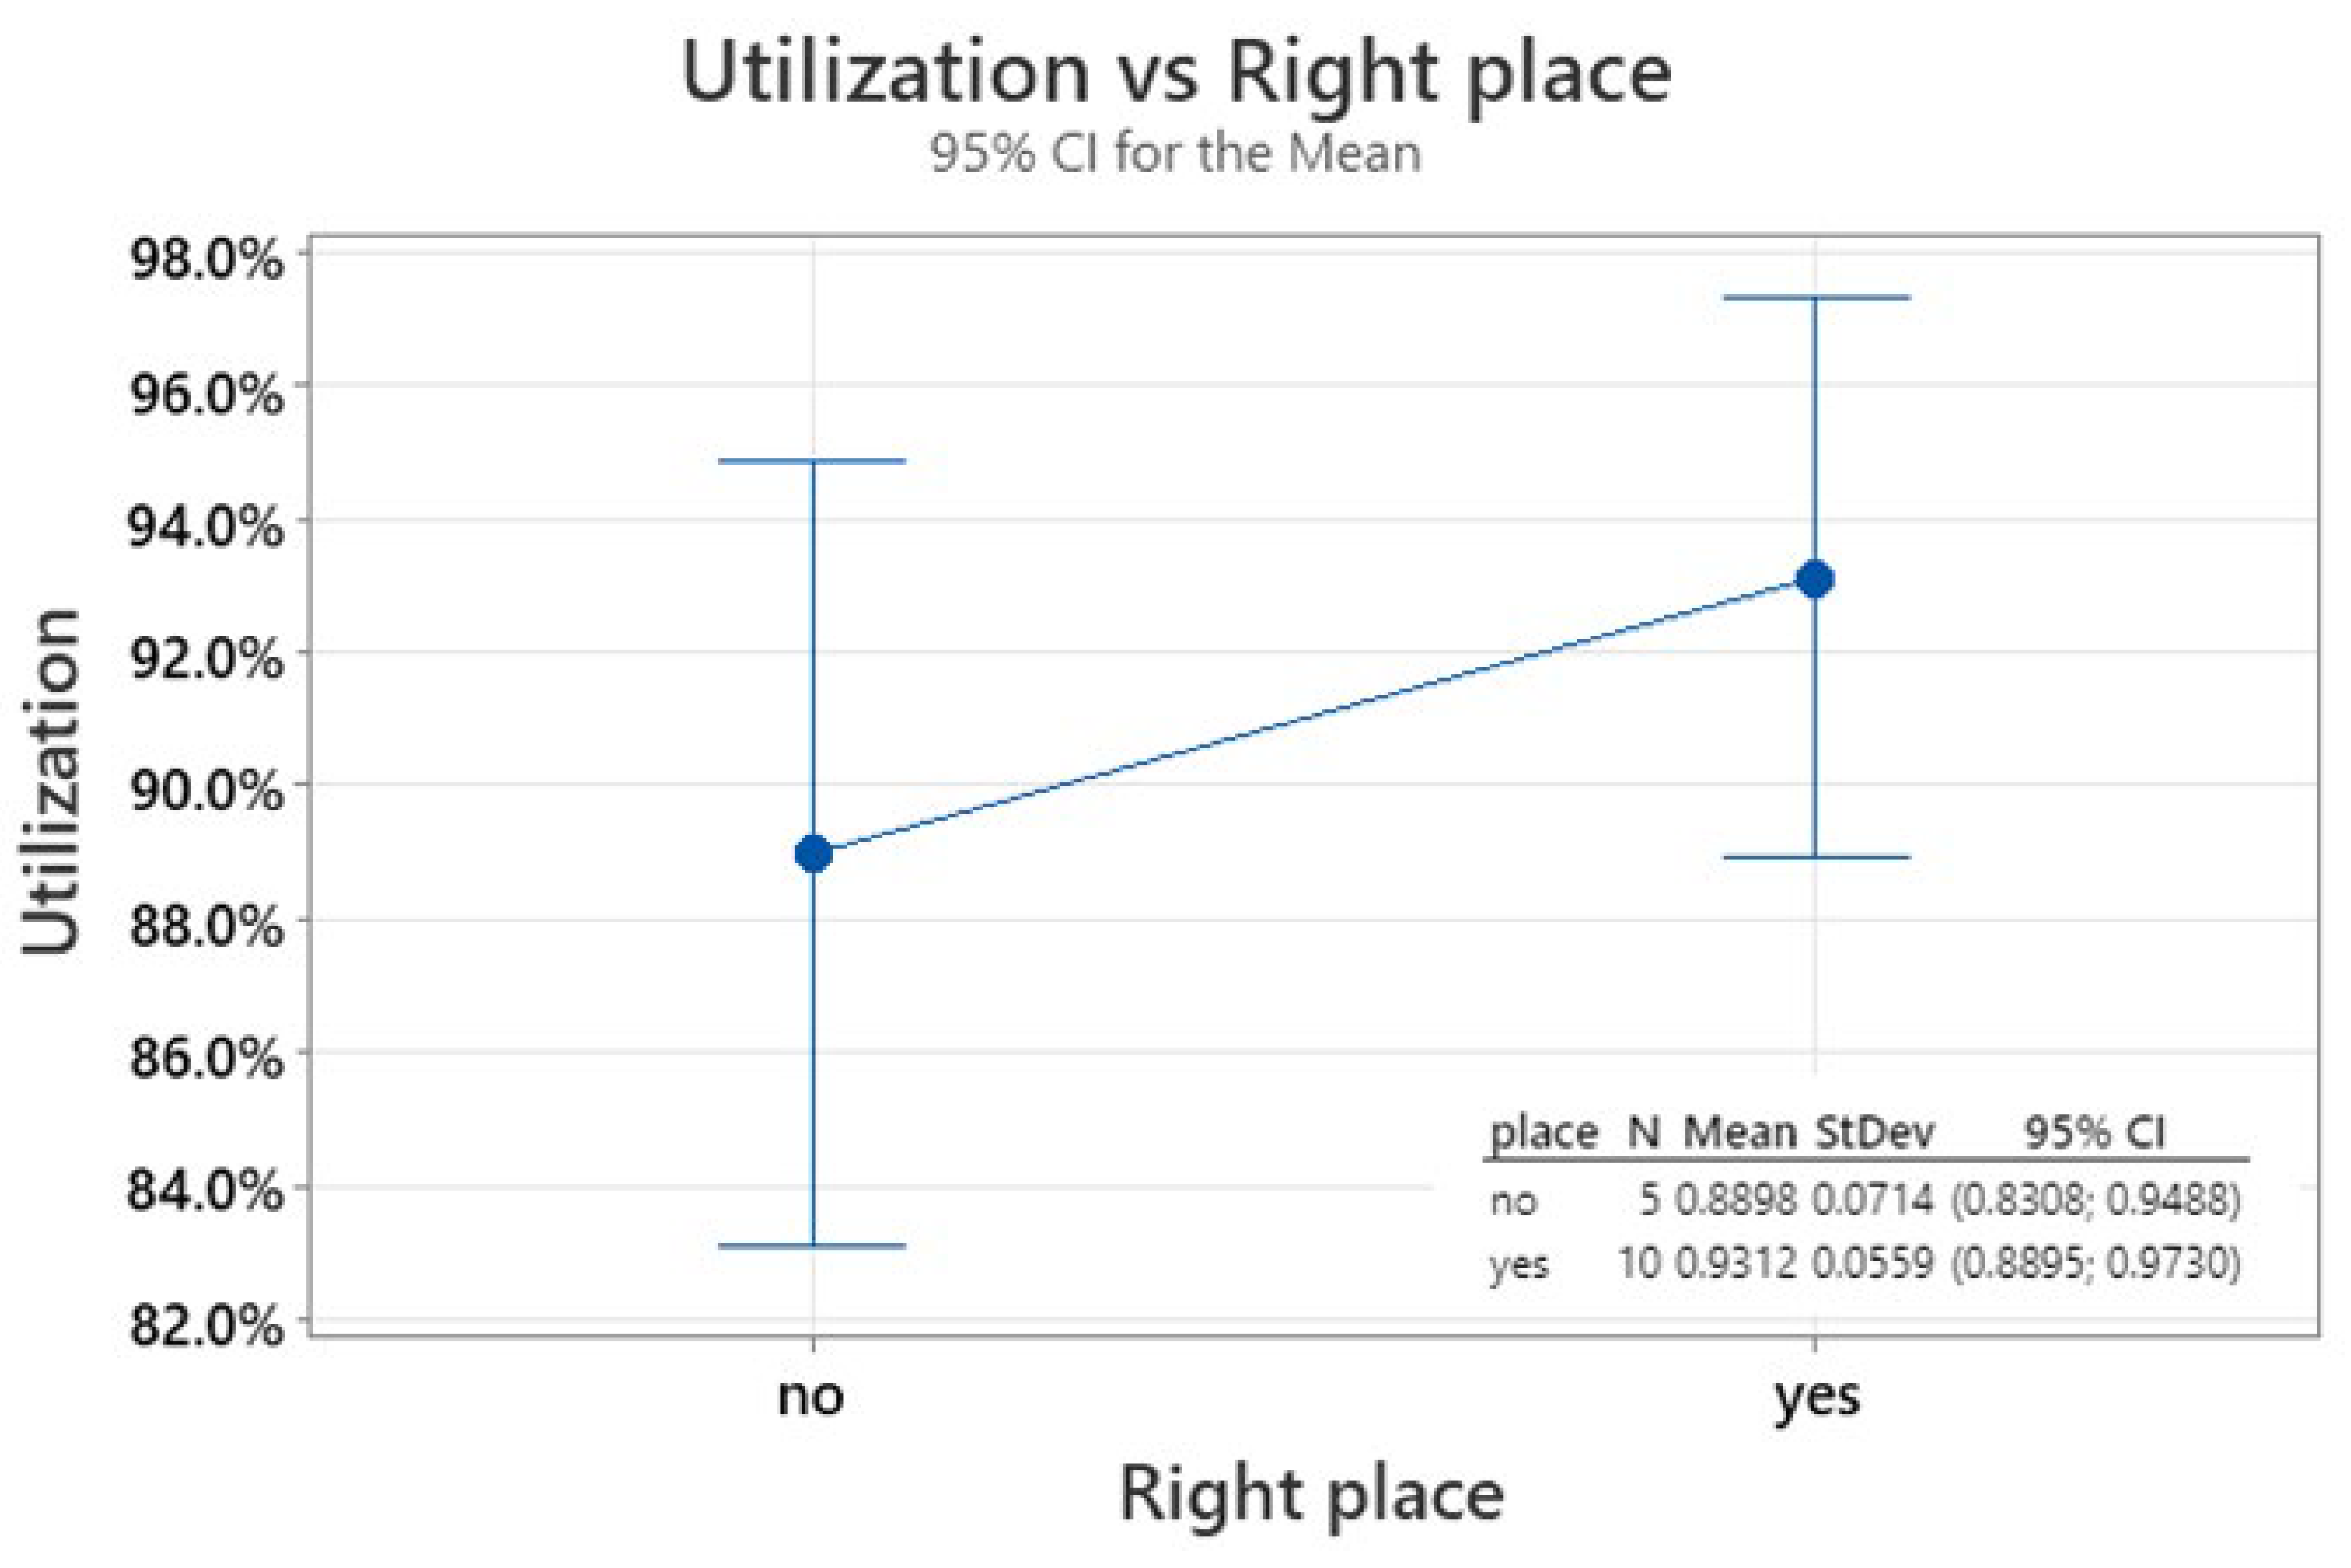
- The analysis of variance for different utilization indications depending on the correct (or not) place of crack initiation showed statistically significantly different results with a probability of approximately 76% (p-value = 0.237) (utilization for “yes”: Mean = 93%, Standard Deviation = 5.6 %, utilization for “no”: Mean = 89%, Standard Deviation = 7.1%).
5. Conclusions, Discussion and Areas for Further Research
The comprehensive study presented in this article underscores the pivotal role of polypropylene, a versatile polymeric material, in the automotive industry, particularly in the manufacturing of critical components like brake fluid reservoirs. Through a meticulous examination of the material’s properties, coupled with rigorous laboratory destruction tests and numerical simulations, this research has successfully delineated the boundaries of critical areas for crack initiation in polypropylene components. The introduction of the PEAK parameter, a novel approach to assessing the material’s resilience under varying states of strain (triaxiality), represents a significant advancement in the field of material science and engineering. The findings from the burst tests and FEM simulations have provided invaluable insights into the behavior of polypropylene under mechanical stress, facilitating the identification of crack initiation sites and the determination of the PEAK parameter for the Sabic 83MF10 material. The calibration of the PEAK parameter, through a detailed analysis of PEEQ and TRIAX values at critical points, has enabled the establishment of a reliable criterion for predicting crack initiation. This criterion not only enhances the accuracy of structural integrity assessments but also optimizes the design process by minimizing the safety margin, thereby contributing to cost-effective manufacturing. The validation of the PEAK parameter’s predictive capability, as evidenced by the high degree of correlation between simulation results and laboratory tests, underscores its potential as a powerful tool for the automotive industry. The ability to accurately predict the location and pressure of crack initiation in polypropylene components can significantly improve the reliability and safety of automotive parts, ultimately benefiting manufacturers and consumers alike. In conclusion, this research has made a substantial contribution to the understanding of polypropylene’s mechanical behavior and its application in the automotive sector. The development and validation of the PEAK parameter mark a significant step forward in the optimization of material selection and component design. Future studies focusing on the application of the PEAK parameter to other polymeric materials and component geometries could further expand its utility, paving the way for advancements in material science and engineering that cater to the evolving needs of the automotive industry and beyond.
The choice of a constant pressure increase in laboratory tests was practical due to the requirements of a previously developed test procedure, standardly performed at Robert Bosch. The selected value of allows to determine the specific pressure value at which the tank bursts without overestimating the results due to the physical inertia of the liquid and testing equipment, and clearly avoiding the significant impact of the creep and relaxation mechanism of the material from which the tank is made. The observations carried out so far allow us to conclude that an increase in the pressure rise rate (up to ) allows for obtaining cracking pressure results that are 0.5 to 1 bar higher. Due to the limitations of the material model used to calibrate the PEAK method, the value obtained in this article retains its ability to correctly predict the moment of rupture only for the specifically indicated test procedure (including the speed of pressure increase in the tank). If the test procedure is changed, it is necessary to re-validate the PEAK parameters. No significant change in the nature of crack propagation was observed (also using a high-speed camera) due to the indicated range of pressure increase in the tank.
Further research should focus on increasing the universality of PEAK parameters by including in material model used for tests characteristics such as:
- dependence of Young’s modulus, yield strength and hardening curve on the strain rate,
- taking into account the phenomena of material creep and relaxation and their impact on the formation of plastic deformations,
- material anisotropy and its influence on the yield strength and Young’s modulus.
Taking into account these parameters will make the PEAK parameter results independent of the currently used test procedure.
The findings from this study on the utilization of polypropylene in automotive components, particularly focusing on the development and validation of the PEAK parameter, open several avenues for further research and discussion. The following topics could significantly contribute to the advancement of material science and engineering, especially in the context of polymeric materials:
- Material Variability and the PEAK Parameter: Investigating how variations in polypropylene formulations (including different molecular weights, copolymers, and composite materials) affect the PEAK parameter. This could help in refining the parameter for broader applicability across various polypropylene types.
- Comparison with Other Polymeric Materials: Extending the application of the PEAK parameter to other polymeric materials used in the automotive industry, such as polyethylene (PE), polyamide (PA) and other polypropylene (PP) blends from different suppliers.
- Economic Analysis: Performing a comprehensive economic analysis to quantify the cost savings achieved by optimizing component design using the PEAK parameter. This could also include assessing the impact on the manufacturing process, such as reduced material waste and improved production efficiency.
- Integration with Advanced Simulation Tools: Further integrating the PEAK parameter with advanced simulation tools and methodologies, such as machine learning algorithms, to enhance the predictive accuracy and efficiency of component design and optimization processes.
By addressing these topics, future research can build on the foundational work presented in this article, driving innovation in the use of polymeric materials in the automotive industry and beyond.
Funding
This research was supported by Ministry of National Education, grant Implementation PhD VI
Data Availability Statement
The raw/processed data required to reproduce these findings cannot be shared at this time as the data also form part of an ongoing study acc. to grant Implementation PhD VI grant.
Acknowledgments
We thank the Robert Bosch Mirków laboratory department for assistance in endurance experiments.
Conflicts of Interest
The author declare no conflicts of interest. The funders had no role in the design of the study; in the collection, analyses, or interpretation of data; in the writing of the manuscript; or in the decision to publish the results.
References
- Stinson, Stephen (1987). “Discoverers of Polypropylene Share Prize”. Chemical & Engineering News. 65 (10): 30. [CrossRef]
- INEOS. (n.d.). Polypropylene Processing Guide. INEOS. Retrieved from https://www.ineos.com. 23.04.2024.
- Maddah, H. A. (2016). Polypropylene as a Promising Plastic: A Review. American Journal of Polymer Science, 6(1), 1-11. [CrossRef]
- Hossain, M. T., Shahid, M. A., Mahmud, N., Habib, A., Rana, M. M., Khan, S. A., & Hossain, M. D. (2024). Research and application of polypropylene: a review. Nano, 19(2). [CrossRef]
- Karger-Kocsis, J., & Bárány, T. (2019). Polypropylene Handbook: Morphology, Blends and Composites. SpringerLink. [CrossRef]
- Maier, C., & Calafut, T. (1998). Applications. In C. Maier & T. Calafut (Eds.), Polypropylene (pp. 87-107). William Andrew Publishing. ISBN: 9781884207587.
- Zienkiewicz, O. C., Taylor, R. L., & Zhu, J. Z. (2005). The Finite Element Method: Its Basis and Fundamentals (6th ed.). Elsevier. ISBN: 9780750663205.
- Xie, M., Gerstle, W. H., & Rahulkumar, P. (1995). Energy-based automatic mixed-mode crack-propagation modeling. Journal of Engineering Mechanics, 121(8), 914-923. [CrossRef]
- Bittencourt, T. N., Wawrzynek, P. A., Ingraffea, A. R., & Sousa, J. L. (1996). Quasi-automatic simulation of crack propagation for 2D LEFM problems. Engineering Fracture Mechanics, 55(2), 321-334. [CrossRef]
- Bouchard, P. O., Bay, F., & Chastel, Y. (2003). Numerical modelling of crack propagation: automatic remeshing and comparison of different criteria. Computer Methods in Applied Mechanics and Engineering, 192(35–36), 3887-3908. [CrossRef]
- Khoei, A. R., Azadi, H., & Moslemi, H. (2008). Modeling of crack propagation via an automatic adaptive mesh refinement based on modified superconvergent patch recovery technique. Engineering Fracture Mechanics, 75(10), 2921-2945. [CrossRef]
- Khoei, A. R., Yasbolaghi, R., & Biabanak, S. O. R. (2015). A polygonal finite element method for modeling crack propagation with minimum remeshing. International Journal of Fracture, 194, 123-148. [CrossRef]
- Liao, M., Deng, X., & Guo, Z. (2018). Crack propagation modelling using the weak form quadrature element method with minimal remeshing. Theoretical and Applied Fracture Mechanics, 93, 293-301. [CrossRef]
- Kabir, H., & Mohammadi Aghdam, M. (2021). A generalized 2D Bézier-based solution for stress analysis of notched epoxy resin plates reinforced with graphene nanoplatelets. Thin-Walled Structures, 169, 108484. [CrossRef]
- Șerban D-A, Coșa AV, Belgiu G, Negru R. Failure Locus of an ABS-Based Compound Manufactured through Photopolymerization. Polymers. 2022; 14(18):3822. [CrossRef]
- Choi J, Lee H, Lee H, Kim N. A Methodology to Predict the Fatigue Life under Multi-Axial Loading of Carbon Fiber-Reinforced Polymer Composites Considering Anisotropic Mechanical Behavior. Materials. 2023; 16(5):1952. [CrossRef]
- Lv B, Zhao Y, Li N, Yu Y, Wu Y, Gu M. Triaxial Mechanical Properties and Mechanism of Waterborne Polyurethane-Reinforced Road Demolition Waste as Road Bases. Polymers. 2022; 14(13):2725. [CrossRef]
- Ovalle, C., G. Boisot, and L. Laiarinandrasana. “Effects of Stress Triaxiality Ratio on the Heat Build-Up of Polyamide 11 Under Loading.” Mechanics of Materials 145 (2020): 103375. [CrossRef]
- Tiejun, W., Kishimoto, K. & Notomi, M. Effect of triaxial stress constraint on the deformation and fracture of polymers. Acta Mech Sinica 18, 480–493 (2002). [CrossRef]
- Jiangbo, S., Jun, S., Zengjie, D. et al. The Finite Analysis of Deformation and Stress Triaxiality of a Mixed I + II Mode Elastic-Plastic Crack Tip. International Journal of Fracture 87, 47–58 (1997). [CrossRef]
- https://www.sabic.com/en/products/polymers/polypropylene-pp/sabic-pp. 23.06.2024.
Figure 6.
Utilization data fitting to normal.
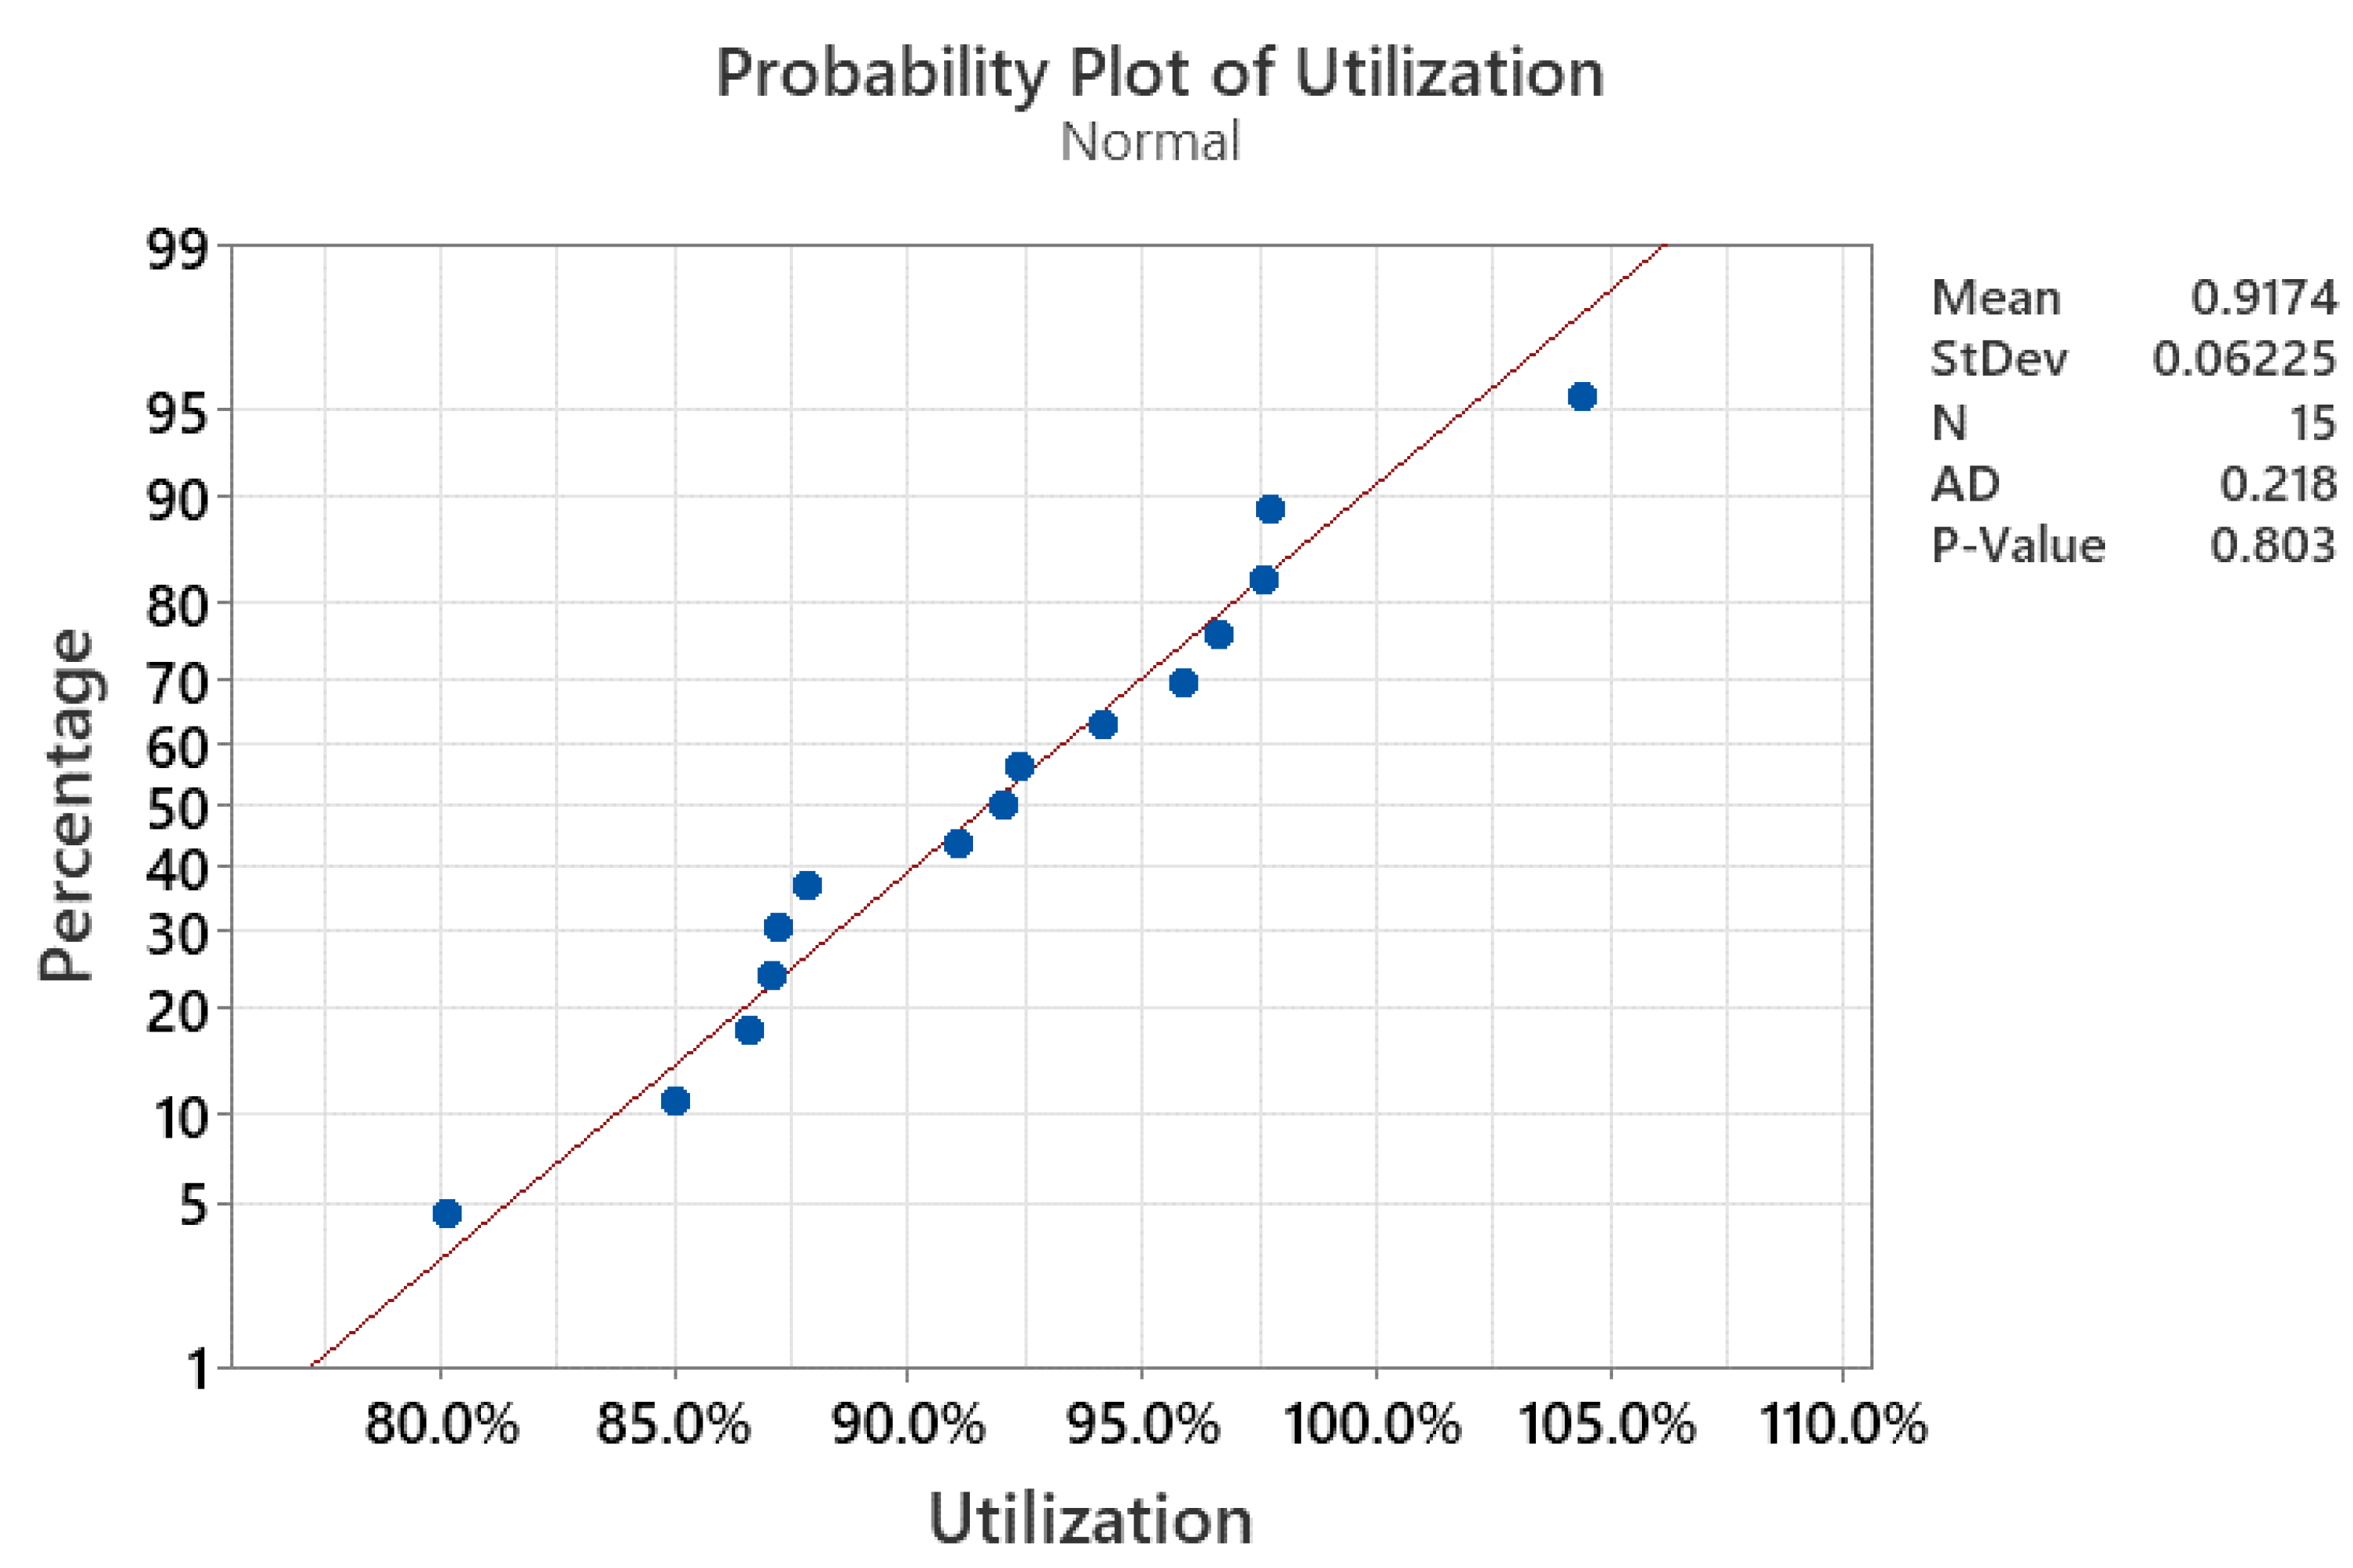
Figure 7.
Utilization distribution plot using normal distribution with risk of simulation false positive result estimation.
Figure 7.
Utilization distribution plot using normal distribution with risk of simulation false positive result estimation.

Figure 8.
Utilization mean range acc. to right prediction of crack initiation place.
Disclaimer/Publisher’s Note: The statements, opinions and data contained in all publications are solely those of the individual author(s) and contributor(s) and not of MDPI and/or the editor(s). MDPI and/or the editor(s) disclaim responsibility for any injury to people or property resulting from any ideas, methods, instructions or products referred to in the content. |
© 2024 by the authors. Licensee MDPI, Basel, Switzerland. This article is an open access article distributed under the terms and conditions of the Creative Commons Attribution (CC BY) license (http://creativecommons.org/licenses/by/4.0/).
Copyright: This open access article is published under a Creative Commons CC BY 4.0 license, which permit the free download, distribution, and reuse, provided that the author and preprint are cited in any reuse.


