Submitted:
16 July 2024
Posted:
17 July 2024
You are already at the latest version
Abstract
Back-care knowledge and behaviour may play a vital role in preventing musculoskeletal current and future discomfort and injuries. The aim of the current survey was to explore the level of knowledge regarding ergonomics and posture together with postural behaviour and the incidence of musculoskeletal pain (MSP) in university students in the northeast of England. A mixed methods survey was conducted on a convenience sample of 55 university students. The 32-item valid and reliable questionnaire contains questions on socio-demographics, MSP, knowledge regarding ergonomics and posture (8 closed ended and 8 open-ended items) as well as postural behaviour. Nearly 1.8%, 20% and 78.2% of the university students had poor, fair and good knowledge of ergonomics and posture respectively. Among the 37 students who carried a backpack, 51.4% were found to have poor postural behaviour, 37.8% had fair behaviour and 10.8% had good postural behaviour. Of the 18 students who did not carry a backpack, 55.6% were found to have poor postural behaviour, 27.8% had fair behaviour and 16.6% had good postural behaviour. 70.9% of the students experienced MSP with the most prevalent site of pain being the lower back region. The key themes that emerged from qualitative data (8 open-ended questions) were: “Comfortable posture”, “Correct spinal alignment”, “Spine support”, “less pain and injuries”, “Use knees not the back”, “Keep the object close to body”, “Hands on desk”, “Feet flat on floor” as well as “eyes at screen level”. The findings of this study can be used to develop targeted interventions aimed at educating university students about ergonomics and posture in order to prevent the incidence of MSP. Future research in this field with a large and more representative sample of the university students’ population is strongly recommended to fully understand their knowledge of ergonomics and posture, postural behaviour as well as incidence of MSP.
Keywords:
behaviour
; ergonomics
; posture
; musculoskeletal
; pain
; university
; students
; survey
1. Introduction
University students are generally unaware of the appropriate ergonomics principles needed at their computer workstations together with the negative effects of insufficient ergonomic knowledge on their health as well as any preventative strategies [1]. Sirajjuddin and Siddik [2] carried out a cross-sectional study to assess the knowledge of Computer Ergonomics amongst 177 Computer Science Engineering and Information Technology Students. The participants completed a valid and reliable questionnaire comprising 35 items related to knowledge about musculoskeletal disorders and its risk factors, sitting postures as well as positioning of the keyboard/ mouse, monitor and table. Through grouping the scores of the students’ level of knowledge into less than 40%, between 40 and 59%, between 60 and 79% as well as above 80%, the authors observed that 67.2% were unaware of the principles of ergonomics. However, Sirajjuddin and Siddik [2] solely assessed the knowledge of computer ergonomics amongst the students but not their postural behaviour. Further, the study sample was not representative of the university student population as students from other courses were not included.
On the other hand, Kanaparthy et al. [3] had earlier assessed the practice of ergonomics and posture amongst 134 dental students. Through the use of a close-ended survey, the participants were asked about their body postures whilst working in dentistry. Results demonstrated that 21.6% of the students scored less than 5 (poor practice), 67.16% scored between 5 and 7 (fair practice) and 11.19% scored between 8 and 10 (good practice). Furthermore, the authors observed that a low level of postural awareness was significantly associated with a low incidence of MSP (p<0.005). The authors concluded that educational programmes on ergonomics and correct posture were vital to improve knowledge as well as to reduce the incidence of MSP among dental students.
It is important to note that Kanaparthy et al. [3] focused solely on the assessment of postural behaviour. In addition, dental ergonomics might not be relevant to other university students such as those studying Computer Science, Art, Psychology, Business and so on. This reduces the external validity of the findings obtained from studies targeting only dental students. As a result, the generalisability of these results into the university student population is compromised. Furthermore, future research needs to include a much wider and more comprehensive picture such as the assessment of both knowledge and behaviour to further help students in understanding the risks for the development of MSP.
Through the combination of observational assessment (Rapid Upper Limb Assessment RULA) together with a self-administered questionnaire, Movahhed et al. [4] evaluated both the practice (RULA tool) and knowledge (questionnaire) of dental ergonomics principles in 103 undergraduate dental students. An occupational health specialist observed the postures of the 103 dental students for about 20 minutes and provided the scores in the RULA checklist. The proportion of the students’ levels of risk for developing musculoskeletal disorders, were as follows: 0% (Level 1); 34% (Level 2); 51.5% (Level 3) and 14.5% (Level 4). This indicated that 66% of students were at intermediate to high risk levels of developing musculoskeletal disorders and thus their postures needed to be improved as a matter of urgency. Because the RULA tool is linked to sitting posture only, other important postures undertaken by subjects when sleeping, lifting objects and carrying weight are not able to be assessed using the RULA scores.
Furthermore, Movahhed et al. [4] used an 18-item questionnaire to measure knowledge of the participants regarding the principles of dental ergonomics. The questionnaire consisted of multiple choice and true/false questions. A score was obtained for each question. A higher overall score (sum of scores of individual items) indicated a higher level of awareness of ergonomic principles. Results showed that the mean awareness score was 42.2 (unsatisfactory). Movahhed et al. [4] also reported that there was no significant association between the students’ knowledge of ergonomics and posture with their postural behaviour (r = 0.18, p = 0.07). However, the authors did not report any detailed information regarding the constructs measured in the instrument they used together with the coding system they employed to obtain the overall knowledge score of each student. Further, generalisability of these findings into all university students can be problematic as dental students are not representative of the target population.
Using a smaller sample size, Garbin et al. [5] examined the levels of knowledge and practice of both ergonomics and posture in dentistry in 69 undergraduate dental students. After taking photographs of each participant, the students completed the test of visual perception (TVP) developed by the researchers. This test comprised of Power Point slides that included images regarding compliance and non-compliance with ergonomics principles in dentistry. The scores of correct answers obtained from the TVP were classified as follows: 1-2 (inadequate), 3-4 (regular), 5-7 (satisfactory) and 8 (excellent). The results demonstrated that only 35% of the photographs were compliant with the optimal dental working posture (satisfactory) and 65.7% of the questions in the TVP test were answered correctly. Similarly, Cervera-Espert et al. [6] studied 336 dental students of which 96.4% were aware of ergonomics and posture but only 28.6% of the students were found to sit correctly in the dentist chair. Of note, dental students cannot be considered a representative sample of the university student population minimising therefore the external validity of the findings of these studies.
More recently, Rodanant and Promprakai [7] assessed the risk of developing musculoskeletal disorders in 56 undergraduate dental students while working by using a more comprehensive data collection method (photographs, RULA and a self-administered questionnaire). The authors noted that 64.3% of the students demonstrated an intermediate risk and 35.7% of students had a high risk of developing musculoskeletal disorders. Furthermore, 45% of the students (based on the questionnaire) reported that they were knowledgeable in the areas of ergonomics and posture. Rodanant and Promprakai [7], however, observed that there were no significant associations between the knowledge of ergonomics and the incidence of MSP. The questionnaire included only 2 open-ended questions asking the students whether or not they practice ergonomics whilst working together with the reasons for not applying that knowledge to clinical practice. This instrument did not include any items related to the knowledge regarding ergonomics and posture as well as postural behaviour in university students which was the aim of the current study.
On the other hand, Elsallamy et al. [8] assessed the knowledge and practice of ergonomics in dentistry among 479 dental students using a self-administered questionnaire. The authors assessed the students’ knowledge, regarding the ergonomics principles in dental clinics, using 16 close-ended items that were scored as 2 (Yes), 1 (to some extent) and 0 (No). The overall knowledge score ranged between 0 and 32 with 0 being lack of knowledge and 32 being high level of knowledge. Students who obtained a score of 24 and above (≥75% of the total score) were considered to have “good” knowledge. Participants who scored between 16 and 23 (50-75% of the total score) were considered to have “fair” knowledge. Respondents who scored below 16 (<50% of the total score) were considered to have “poor” knowledge.
Elsallamy et al. [8] also used 6 questions on a 5-point Likert scale (from Always to Never) to measure the students’ practice of the principles of ergonomics in dentistry. The 6 questions were scored as 4 (Always), 3 (Very often), 2 (Often), 1 (Rarely) and 0 (Never). The overall practice score ranged from 0 (lowest score) to 24 (highest score). The overall practice score was then classified into “good” (≥18) or “bad” (<18). The results revealed that only 25% of the students had “good” knowledge and 48.9% had a fair knowledge of ergonomics. In addition, 95.4% of the students were found to have poor practice of ergonomics. Because the ergonomics principles in dental clinics are not relevant to other university students who are studying courses that are different to dentistry, these findings cannot be applied to the general university student population.
Additionally, Joshi et al. [9] assessed the knowledge (self-administered questionnaire) and the behaviour (RULA method) of 60 students studying Agriculture and Technology on the ergonomics related to a computer workstation. A 3-point Likert scale (agree, disagree, undecided) questionnaire asked about the ergonomic workstation (Tilt tray- keyboard arrangement, Workstation backrest, height of table and chair, monitor position according to eye level, distance between the operator and the monitor), visual display terminal (computer screen and accessories) as well as the working posture (elbow angle, lumbar support). The results revealed that the majority of students did not have adequate knowledge regarding the positioning of computer workstations (angle, distance of monitors, etc…). Based on the RULA method, only 11.6 % of the students demonstrated an acceptable posture (RULA score 1-2; risk level 1).
Likewise, Kamaroddin et al. [10] investigated the computer ergonomics awareness among 60 university students from the Faculty of Computer Science and Mathematics in Malaysia. The students were given a questionnaire comprised of three sections. The first section asked whether the participants had attended a Human Computer Interaction course. The second section included closed ended questions on the respondents’ behaviour whilst working on computers (chair, keyboard, mouse, monitor and desk). The last section assessed the participants’ knowledge regarding the ergonomic factors presented in the second section through Likert scale questions (1=strongly disagree to 5=strongly agree). The authors observed that whilst all 60 participants knew and understood the principles of ergonomics, only 30 students actually practiced it.
Of note, Joshi et al. [9] and Kamaroddin et al. [10] were only interested in the computer workstation, therefore their findings cannot be applied to the knowledge of other ergonomic positions such as carrying backpacks and lifting weights. Furthermore, the study samples cannot be considered to be representative of the university student population as a whole as the participants were either studying Agriculture and Technology [9] or Computer Science and Mathematics [10].
Dolen and Elias [11] assessed the knowledge and practice of laptop ergonomics amongst 101 students within the school of Medicine and Health Sciences and 96 students within the Faculty of Economics and Management. The authors measured the participants’ knowledge by scoring a set of 24 dichotomous questions (yes/no) with score of 0 for the wrong answer and score of 1 for the correct answer. The respondents’ practice was measured by scoring a set of 40 Likert-scale questions. Based on the values of the mean score and standard deviation, the students’ knowledge and practice were classified as poor (score < Mean- S.D), moderate (scores = Mean+_S.D) and good level (scores > Mean +S.D) [12,13].
A total of 74.1% students were found to have a fair knowledge on laptop ergonomics with 15.8% having poor knowledge. Further, 70% of the students had a fair practice in laptop ergonomics and 16.8% had good practice. The mean knowledge level score amongst health students (18.5±2.98) was significantly higher than for the non-science students (p<0.05). This was expected as healthcare students might have learnt about ergonomic principles during their courses of study. The authors also documented that knowledge of ergonomics and posture as well as postural behaviour were not significantly associated with the incidence of MSP. However, Dolen and Elias [11] admitted that their study involved health science and non-science students from only two schools and therefore the study findings cannot be generalized to the general student population. In addition, laptop ergonomics were the only part of the ergonomics principles that were included in this study.
More recently, Jaafar et al. [14] explored the level of awareness regarding ergonomics amongst 246 engineering students. Using a 5 Likert scale questionnaire (from strongly disagree to strongly agree), the students answered whether or not they were aware of the benefits of ergonomics (5 items) as well as the negative health consequences of not practicing ergonomics principles (6 items). The results revealed that the students’ average knowledge score on the benefits of ergonomics was found to be 3.70 (high level). Additionally, the students were found to have a high level of awareness of the negative effect of not practicing ergonomics principles (mean score 4.23). However, Jaafar et al. [14] focused on the relationship between ergonomics and health and were not interested in the students’ level of knowledge and behaviour regarding ergonomics and posture. For instance, the data collection tool that the authors used lacked important items relating to posture such as body position when sleeping, sitting, lifting weight and carrying backpacks.
Much of the current literature, on knowledge regarding ergonomics and posture as well as postural behaviour in university students, remain narrow in their focus by dealing only with agriculture and Technology students [9], Computer Science and Mathematics students [10], Engineering students [11], and dental students [4,5,6,7,8]. Further, other studies pay particular attention only to knowledge [2], behaviour [3] or laptop use [11]. The generalisability of much published research on this issue is therefore problematic as the study samples were not representative of general university student populations.
In view of all that has been mentioned so far, one may suppose that the assessment of postural behaviour along with the knowledge of it could be an area for future research as this would help in understanding the risks of development of MSP amongst university students [2]. Furthermore, exploring university students’ knowledge regarding ergonomics and posture as well as postural behaviour could help in the design of educational programmes aiming to improve their knowledge and practice. Ergonomic education about proper body posture has been shown to be efficient in promoting healthy ergonomic behaviour, preventing chronic back pain and reducing the prevalence of musculoskeletal injuries [1,15].
There is a growing body of research regarding the epidemiology of MSP among university students. However, only 2 studies targeted students from different faculties and courses [11,16]. Hasan et al. [16] studied 400 medical students and 350 engineering and business students in Pakistan. The prevalence of MSP was higher amongst medical students (88.5%) compared to non-medical students (64.9%). This could be explained by the fact that medical students perform greater professional training than non-medical students [17]. Using a smaller sample size, Dolen and Elias [11] estimated the prevalence of MSP among 101 health students and 96 non-health students in Malaysia. The authors found that 67% of the students experienced MSP.
The remaining studies were narrow in focus by including university students from particular courses or schools. For instance, a recent study by Wami et al. [18] included 422 medicine and nursing students from Ethiopia. Results demonstrated that 69.4% of the students experienced MSP. Similar results were also obtained by Morais et al. [19] where 74.6% of the 792 Brazilian health students experienced MSP. It is important to note that both these studies [18,19] focused only on healthcare students. Thus, these findings might not be applicable to university students from other schools. This is because non-health students were not included and therefore the study samples were not representative of the general university student population.
Furthermore, Algarni et al. [20] included 469 medical students aged 19 to 29 years old from Saudi Arabia. The authors observed that 85.3% of the respondents experienced MSP. A lower prevalence was reported by Alshagga et al. [21] where 45.7% of the 232 Malaysian medical students had MSP in the past week and 65.1% in the past year. Although both studies targeted the same population, the sample size in the study conducted by Algarni et al. [20] was larger (469 compared to 232). This might have led to the variability in the prevalence between these two studies. Another reason could be attributed to the differences in the consideration of MSP onset adapted by researchers whether in the past 7 days, in the past 12 months or at any period of time [22].
In Ghana, Abledu and Offei [23] noted that 70.1% of the 157 nursing students reported having MSP in the previous 12 months whereas 44.6% of students experienced MSP in the past 7 days. Additionally, Singh et al. [24] conducted a study on 317 female Indian nursing students. The results revealed that 74.5 % of the students experienced MSP. Although male gender was lacking in the study by Singh et al. [24], their findings were earlier confirmed by Smith et al. [25] and Smith and Leggat [26]. Smith et al. [25] observed a 73.3% prevalence of MSP amongst 202 Korean nursing students. Similarly, Smith and Leggat [26] reported a high prevalence (80%) of MSP amongst 260 Australian nursing students.
Two studies examined the prevalence of MSP amongst dental students [27,28]. Movahhed et al. [27] included 177 Iranian dental students and MSP was reported by 82% and 90% of undergraduate and postgraduate students respectively. A lower prevalence of MSP (61%) was reported by Thornton et al. [28] who studied 590 dental students in the USA. A possible reason for this difference could be related to the differences in the ergonomic workstations between middle income countries and high-income countries. A good ergonomic workstation can reduce pressure on muscles and muscle activity leading to a reduction in the incidence of MSP [29,30].
Using a different study sample, Woo et al. [31] studied 503 Science and Technology students in Hong Kong. The authors observed that 49.9% of students had experienced MSP in the past 12 months. Similarly, Lorusso et al. [32] estimated the prevalence of MSP among 109 X-ray technology students. The results revealed that only 37% of the participants experienced MSP over the previous 12 months.
The comparison between the prevalence rates of MSP among university students from different countries cannot be easily performed due to several reasons. First, differences in the age of the sample, sample size, survey design, operational definitions and prevalence period might have led to variability in the MSP prevalence across the studies [33,34]. Second, some students may have had continuous pain while others may have had only occasional pain episodes [35]. Third, there is the possibility that due to cultural differences in pain perception, ethnic minorities believe that pain needs to be tolerated without complaining [36,37]. Fourth, psychosocial and physical characteristics may play an important role in the variations in MSP prevalence [35].
The high prevalence of MSP among university students highlights the need for prevention programmes to tackle this public health problem [19,38]. Educational research that aims to improve students’ posture might provide insight into the best way for teaching young people about their body and therefore help tackle the incidence of MSP in adult populations in the future [39]. In fact, researchers pay more attention to trials evaluating different treatments of MSP rather than primary prevention of MSP [40].
The MSP prevalence, healthcare costs and disability rates will continue to rise if no collaboration, between stakeholders such as researchers, clinicians, policy makers as well as people with MSP, is taken to find appropriate solutions [40]. For instance, education programmes can help students become aware of the difference between adequate and inadequate posture and therefore help to change their lifestyle behaviour [39]. Young adults constitute an important target population to focus upon in order to detect the musculoskeletal problems at an earlier stage [41]. Furthermore, MSP is still a major public health problem [42]. Therefore, the back-care knowledge and behaviour may play a vital role in preventing musculoskeletal current and future discomfort and injuries [43].
The location of musculoskeletal discomfort differed between different studies. For instance, Hasan et al. [16] studied 400 medical students as well as 350 engineering and business students in Pakistan. The authors noted that discomfort was experienced mostly in the neck in both medical (19.3%) and non-medical students (17.4%). In the USA, Thornton et al. [28] studied 590 dental students and observed that MSP was most commonly located in the neck region (61%). Conversely, Dolen and Elias [11] estimated the prevalence of MSP among 101 medical students and 96 non-health students (Economics and Management) in Malaysia. The most common site of pain was at the shoulder (46.2%). In Hong Kong, Woo et al. [31] also reported that amongst 503 Science and Technology students, shoulder pain (78.1%) was the most commonly reported pain.
On the other hand, Wami et al. [18] reported that lower back pain was the most commonly reported pain (54.0%) amongst 422 medicine and nursing students from Ethiopia. Similarly, Singh et al. [24] conducted a study on 317 female nursing students and noted that the most common site of pain was reported at lower back (58.7%). In Australia, Smith and Leggat [26] also noted that the most common site of pain was low back pain (59.2%) in a sample of 260 nursing students.
It is important to note that the study sample differed between different studies. This reflects the different task demands as well as clinical exposures of the university students from different courses and faculties. For instance, nursing students perform heavy tasks such as lifting weights and spine bending/twisting during the training period [44]. Dental students, however, works with limited and narrow area of the oral cavity of the patient resulting in prolonged static posture and overstretched muscles of the neck [45]. Students from the Science and Technology as well as Economics and management faculties may have different tasks that are more related to computer usage rather than lifting objects.
The aim of the current survey was to explore the level of knowledge regarding ergonomics and posture together with postural behaviour and the incidence of MSP in students at a university in the northeast of England. The objectives were: 1.To identify the level of knowledge regarding ergonomics and posture as well as postural behaviour among university students; 2.To evaluate the association between the level of knowledge regarding ergonomics and posture with the postural behaviour in university students; 3.To explore the incidence of MSP among university students; 4.To investigate the relationship between the level of knowledge regarding ergonomics and posture as well as postural behaviour with the incidence of MSP in university students. 5. To qualitatively assess the level of knowledge of university students with regards to ergonomics and posture.
2. Materials and Methods
2.1. Sampling
A convenience sampling technique was considered the most appropriate method to recruit the students for the survey. Compared to other sampling methods, a convenience technique was more feasible and less time consuming [46]. As indicated by Siedlecki et al. [47], although convenience sampling reduced the ability of the researcher to generalise the findings, it improved the internal validity of the study by having a homogeneous sample.
2.2. Sample Size
The sample size required for the present web-based survey was estimated using the G-power software based on the following assumptions. The statistical power of the study was assumed to be 80% (the chance to miss the true effect is 2 in 10). By considering the statistical significance to be 0.05, this suggests that the researcher accepted a 5% risk of rejecting the null hypothesis when it is in fact true. The research hypothesis was considered to be two-tailed hypothesis as currently there is no strong evidence to suggest that low levels of knowledge concerning ergonomics and posture as well as poor postural behaviour indicate a high incidence of MSP. For the effect size, Pearson correlation coefficient R=0.3 was used as the medium effect size. This is because theoretical correlation coefficients between the level of knowledge and postural behaviour, the level of knowledge and MSP as well as between the level of knowledge and postural behaviour in university students were not found in the literature. Therefore, the sample size required for the survey study was N=82. However, all the students at a university in the northeast of England were invited to take part in the survey to minimise bias that might be caused by possible drop-out rates.
2.3. Inclusion/Exclusion Criteria
Students at a university in the northeast of England whether males or females, full-time or part-time, attendance, flexible or distance learners as well as undergraduate or postgraduate students were included in the survey. No restrictions, on the age, type of course or school the students attended at the university, were applied.
2.4. Procedure
The researcher sent an email to the heads of departments of all the schools at a university in the northeast of England and kindly asked for their permission to the programme leaders at each department to act as gatekeepers. The programme leaders disseminated the participant information sheet including the link to the online survey to their students. The survey was initially made available on Microsoft Forms for one month. Due to the low response rate, the researcher extended the survey for additional 4 months. The programme leaders also sent 2 reminders to their students. The Participant Information Sheet consisted of details about the study such as the purpose, the use of data, eligibility criteria, clear instructions on how to complete the questionnaire and the participants’ rights. Students who agreed to participate in the survey were invited to open the link to a Microsoft Form Online Survey, which was provided at the end of the participant information sheet. By clicking on the link to the questionnaire, participants gave their consent to the study. It took participants approximately 10 minutes to complete the anonymous survey. The respondents received no compensation for their participation. Data collection was performed between June 2020 and October 2020.
2.5. Instrumentation
The Adult version of the Aristegui questionnaire [48] developed to measure the knowledge regarding ergonomics and posture as well as postural behaviour was used for data collection. The psychometric properties (validity and reliability) of the questionnaire have been established by Salman et al. [49]. The questionnaire has been shown to have very good validity and reliability for measuring the knowledge of ergonomics and posture, postural behaviour as well as the incidence of MSP in university students.
In total the questionnaire had 32 items. Four items comprised of sociodemographic data (age, gender, course of study and academic year), 3 items measured MSP (the presence of MSP, the location of MSP as well as the activity after which the participants experienced MSP), 1 item asked the participants whether they carry backpack or not, 16 items assessed the knowledge level (8 close-ended and 8 open questions) and 8 items on the postural behaviour. Figure 1 presents the valid and reliable questionnaire used in this survey.
2.6. Ethical Considerations
Ethical approval was obtained from the School of Health and Life Sciences Research Governance and Ethics Committee (Approval number: 286/18) at a university in the northeast of England, to conduct the survey study. The data was collected anonymously to ensure data protection, privacy and confidentiality. The link to the survey was included at the end of the participant information sheet. As the participant’s identity could not be associated to his/her responses, therefore any data collected was non-person identifiable. Furthermore, only the researcher and the allocated supervisors had access to the data collected. The responses of the survey were stored on a password protected University computer.
2.7. Study Variables
The current survey was conducted to collect both discrete and continuous data of both independent and dependent variables. The independent variables included age, gender, course of study and year of study. The dependent variables were the following: MSP (presence, location and daily-life activities), the overall knowledge score as well as the overall behaviour score for body posture when sleeping, picking up objects from the floor, taking an object from a high shelf, carrying a backpack, sitting at a desk, sitting on an armchair, sitting at the table and sitting down working on the computer.
2.8. Data Analysis
2.8.1. Quantitative Analysis
Coding of collected data was performed based on the recommendations of Fink [50]: dichotomous questions (1=yes, 2=no), multiple choice questions with only one answer correct (1=A, 2=B, 3=C, 4=all of the above, 5=none of the above) and multiple-choice questions where the participant can choose more than one response (each choice is treated as a separate variable and coded by 1=yes and 2=no).
The analysis was conducted using the Statistical Package for Social Sciences (SPSS) version 26 and alpha levels were set at p < 0.05 to indicate statistical significance. Descriptive statistics was conducted to summarise and report the data using frequencies and percentages for categorical variables whereas mean and standard deviation for continuous variables. The survey produced categorical (nominal, ordinal) as well as continuous data (ratio). Age (Qs 1) is considered to be an ordinal variable as it included 4 categories (18-23, 44-29, 30-35 and above 35).
Gender (Qs 2) with 2 categories (male/female) and the course of study (Qs 3) with 17 categories (Dietetics, Engineering, Computer Science, Project management, Sports therapy and rehabilitation, Interior Architecture and Design, Energy, Physiotherapy, Forensic Radiography, Occupational therapy, Global leadership and management, Operating department practice, Midwifery, Nursing, Low intensity psychological therapies, Psychology and PhD) were measured using nominal variables. Academic year (Qs 4) was considered to be an ordinal variable with 5 categories (Year 1, Year 2, Year 3, Year 4 and postgraduate).
The 3 items on MSP (Qs 5,6,7) were considered to be nominal variables since they are close-ended questions classified into categories. The 8 close-ended questions about the knowledge of ergonomics and posture (Qs 9,12,15,19,22,25,28,31) were also measured at a nominal level. Similarly, the 8 items measuring postural behaviour (Qs 8,11,14,18,21,24,27,30) were considered to be nominal variables.
2.8.1.1. Level of Knowledge of Ergonomics and Posture
The student’s knowledge level on each single question of the 8 items assessing knowledge (Qs 9,12,15,19,22,25,28,31) was evaluated by assigning a score of 0 to the wrong answer and score of 1 to the right answer. The overall score of knowledge was calculated by adding the total number of correct responses for the 8 items on knowledge. The minimum overall knowledge score was considered to be 0 and the maximum was 8. The higher the score, the better the student’s knowledge regarding ergonomics and posture. The overall knowledge score was grouped in three categories: poor (<50%), fair (50-70%) and good level (>70%) [3].
2.8.1.2. Postural Behaviour
The students’ postural behaviour was assessed by scoring each of the 8 questions on behaviour (Qs 8,11,14,18,21,24,27,30) as follows: 0 for wrong answer (incorrect choice/I don’t know), 1 for partially correct answer (one correct choice with other wrong choices) and 2 for completely correct response (only the correct choice). As some of the students do not carry backpacks, it was agreed among the supervisory research team (two supervisors) to independently score the overall postural behaviour for students who used a backpack (8 items, score out of 16) as well as the overall postural behaviour for students who did not use a backpack (7 items, score out of 14).
Thus, the overall score of behaviour (with backpack) could range between 0 and 16 whereas the overall score of behaviour (without backpack) could range from 0 to 14. The higher the overall score, the better the student’s postural behaviour. Similar to the criteria used for the overall knowledge score, the overall behaviour scores (with backpack and without backpack) were classified as follows: poor (<50%), fair (50-70%) and good level (>70%) [3].
2.8.1.3. Inferential Statistics
The chi-square test was conducted to test whether there was a significant correlation between the incidence of MSP, the location of MSP as well as the activity after which the participant experienced MSP with each of the independent variables (age, gender, course of study, academic year). The normality of the continuous variables was tested using the Kolmogorov-Shapiro test [51]. According to Bettany-Saltikov and Whittaker [52], a p-value >0.05 indicated a normal distribution of the data and parametric tests were used. However, a p-value <0.05 indicated that the data were skewed from the population and thus nonparametric tests were used.
The one-way Analysis of variance (ANOVA) test was conducted to investigate whether or not there was a significant difference in the overall behaviour score according to age, gender, course of study, academic year as well as presence of MSP. ANOVA is used to determine whether there are any statistically significant differences between the means of more than two independent groups on the same continuous, normally distributed dependent variable [51,52]. Post-hoc comparisons using the Tukey’s Honestly Significant Difference test [53] were not performed as statistically significant differences were not observed and some of the variables were at only 2 levels. Kim [54] states that the post-hoc test can only be used for groups with three or more levels.
The difference in the overall knowledge scores according to age, gender, course of study, academic year as well as presence of MSP was examined using the Kruskall-Wallis H test. The Kruskal-Wallis H test (the nonparametric equivalent of the one-way ANOVA test) is commonly used to determine if there are statistically significant differences between 2 or more groups of an independent variable on a continuous and not normally distributed dependent variable [51,52].
To examine the relationship between the overall knowledge score of ergonomics and posture with the overall postural behaviour, the Spearman rank test was conducted. Spearman’s correlation coefficient is used when one of the variables is ordinal (or continuous, not normally distributed) and the other is interval/ratio [52].
2.8.2. Qualitative Analysis
The qualitative part of the present survey comprised of 8 open-ended questions. These items aimed at exploring in more depth the university students’ level of knowledge regarding ergonomics and posture (Qs 10,13,16,20,23,26,29,32). These open-ended items were analysed using content analysis, a qualitative data analysis method, in order to draw inferences on the meaning of the responses provided by the participants [50]. Following Bengtsson’s [55] recommendations, the content analysis comprised of four stages: de-contextualisation, re-contextualisation, categorisation, and compilation (see Figure 2).
Firstly, the researcher familiarised herself with the data by reading the responses of the participants to the open-ended questions. The investigator then broke down the responses into meaning units which are the smallest units answering each question. For instance, the response “because I feel relaxed” was broken down into a meaning unit termed “relaxed”. Secondly, the researcher re-read the students’ responses together with the meaning units that were identified using coloured pencils. Almost no unmarked text remained as the responses were in the form of single words or phrases. During the third stage (categorisation), the researcher condensed the meaning units, without losing the content of the unit, in order to create categories and themes. For example, the meaning units “back is straight”, “spine not disturbed or twisted” and “spine to be straight” were grouped under the category “Spine is straight”. Lastly, the researcher examined the themes that emerged from the responses and quantified them using percentages. For instance, the theme “Less pain and injuries” emerged from the following categories: “Safe lifting”, “Less pressure” and “Keep the spine healthy”. By using a mixed approach (qualitative and quantitative), a wider and more comprehensive picture of the phenomena of interest was obtained [56].
2.8.2.1. Quality Assurance
As stated by Polit and Beck [57], four criteria ensure the quality of a qualitative research study. These criteria include credibility, transferability, dependability and confirmability. Credibility, which is similar to internal validity in quantitative research, reflects the degree to which the results are true. Transferability, synonymous to generalisability in quantitative studies, reflects the degree to which qualitative findings can be transferred to other contexts. Dependability, analogous of reliability in quantitative research, refers to the consistency and stability of findings over time. Confirmability is the degree to which the qualitative results can be confirmed by others.
Trustworthiness of qualitative data within the current survey was kept through several ways. Firstly, two researchers (the author and director of studies) independently coded the data to generate categories and themes. A comprehensive list of the categories and themes was obtained by merging the independent lists. Hence, audit trails allowed to increase the credibility, dependability, transferability and confirmability of the qualitative results. Secondly, the researcher and her director of studies quite often referred to raw data when interpreting the findings. This enabled the researchers to check for any incorrect interpretation after the analysis. Thirdly, codes were illustrated using quotations of participants in order to ensure accuracy. Fourthly, the interpretations of the meanings were also validated by the research team who agreed on conclusions. Another way was to go back to the respondents and show them the identified categories and themes (member checking) in order to achieve consensus [58]. However, this approach was not chosen due to practicality issues. Further, Bengtsson [55] claims that, whilst member checking, participants might have forgotten their responses due to the long period between data collection and data analysis.
Lastly, the researcher had no influence on the analysis and interpretation of qualitative findings. Elo et al. [59] recommend researchers to take into account their “pre-understanding” of the topic in order to minimize their influence on the research. This process is known as “reflexivity”. Before starting this doctorate project, the researcher had no background information on ergonomics or correct body posture. This is because the researcher is a pharmacist and the topic of interest in the current study was not included in the curriculum of her previous course of study. The learning materials, whilst studying Pharmacy, were mainly focused on treatment rather than prevention of diseases. Thus, the researcher had neither knowledge nor expertise in preventing the development of MSP. Another way of reflexivity included thinking about how the research may have influenced the researcher. Working on this research project has made the researcher realise the importance of education on principles of ergonomics and correct spine posture as well as its application in her daily life activities. Knowledge alone is not sufficient and it needs to be integrated with practice in order to improve one’s quality of life. The researcher has also come to realise how prevention is better than cure. Thus, the experiences in the study have changed the researcher’s postural behaviour into a healthier one in order to avoid future episodes of MSP and minimise any risk of injuries.
3. Results
3.1. Demographics
A total of 55 students completed the web-based survey. Table 1 demonstrated the details regarding basic demographic characteristics (age, gender, course of study and year of study) of the participants. Students aged between 24 and 29 years old comprised the highest proportion of respondents (43.6%, n=24). In terms of gender, the majority of the respondents were female (65.5%, n= 36). In this study, the subjects were studying the following courses: Nursing (32.7%, n=18), Dietetics (10.9%, n=6), Engineering (9.1%, n=5), Computer Science (9.1%, n=5), PhD (7.3%, n=4), Interior Architecture and Design (5.5%, n=3), Operating Department Practice (5.5%, n=3), Midwifery (3.6%, n=2), Project Management (1.8%, n=1), Sports therapy and rehabilitation (1.8%, n=1), Global Leadership and Management (1.8%, n=1), Low Intensity Psychological Therapies (1.8%, n=1), Psychology (1.8%, n=1) and Energy (1.8%, n=1). Overall, 60% were health students, 32.7% non-health students with 7.3% being PhD students. Regarding the academic year, most of the respondents were first year students (40%, n=22).
3.2. Knowledge about Ergonomics and Posture
Eight closed-ended items on the questionnaire (Qs 9,12,15,19,22,25,28,31) measured the participants’ knowledge of ergonomics and posture. Figure 3 illustrates that only 27.3% of the students chose “sleeping on the side” as the most appropriate sleeping posture. The majority of respondents (96.4%) chose “lifting objects by bending the knees and keeping the back straight” as the most adequate lifting posture. 87.3% of the subjects chose “carrying the backpack on both shoulders close to the body” as the most adequate posture when carrying weight.
The majority of participants (98.2%) answered that the use of a step is the most adequate posture when taking an object from a high shelf. Similarly, the majority of students chose sitting with the back straight (correct spinal alignment) as the most adequate posture when sitting at a desk (96.4%), when sitting on an armchair (92.7%) and when sitting at a table (92.7%). 89.1% of the subjects answered that the most adequate posture when sitting down working at the computer is the correct spinal alignment.
The distribution of the overall scores of participants’ knowledge of ergonomics and posture is displayed in Figure 4. Of the 55 respondents, 20% obtained the maximum score (8/8, all answers are correct), 58.2% scored 7 out of 8 (1 wrong answer), 10.9 % scored 6 out of 8 (6 correct answers), 9.10% scored 5 out of 8 (5 correct answers) and 1.8% scored 1 out of 8 (1 correct answer).
The participants’ level Knowledge of ergonomics and posture was grouped into three categories (see Table 2). Among the 55 respondents, 1 student (1.8%) had poor knowledge, 11 students (20%) had fair knowledge and 43 students (78.2%) had good knowledge.
The average score of the overall students’ knowledge of ergonomics and posture was 6.80 and the standard deviation was 1.145 (Table 3,). This standard deviation, which is a narrow variation in the scores of knowledge of university students, was in the range of 1 and 8. The Kolmogorov-Smirnov test for normality showed very strong evidence for the difference between the distribution of knowledge score and the normal distribution (Z=0.351, p=0.00 < 0.05). The histogram (Figure 5) also confirmed that the knowledge score was positively skewed (right skew) in the population. This means that one or a few scores are much higher than all other scores (Robinson and Stafford, 2006).
3.3. Relationship between the Knowledge of Ergonomics and Posture with Different Independent Variables (Age, Gender, Course of Study, Academic Year, MSP)
The Kruskal – Wallis H test (non-parametric counterpart for the One-Way ANOVA test), was conducted to identify any statistical evidence for the difference on the knowledge score according to age, gender, course of study, academic year as well as MSP. This test was chosen because the knowledge score was positively skewed (right skew) in the sample.
Table 4 displays the results of the Kruskal – Wallis H test. The results revealed no significant differences in the knowledge scores according to age (Kruskal Wallis H = 3.666, df=3, p=0.30), gender (Kruskal Wallis H =0.747, df=1, p=0.39), course of study (Kruskal Wallis H =21.026, df=16, p=0.18), academic year (Kruskal Wallis H =5.011, df=4, p=0.29), school (Kruskal Wallis H =1.945, df=1, p=0.16) and MSP (Kruskal Wallis H =0.352, df=1, p=0.55).
3.4. Postural Behaviour
A set of 8 items (Qs 8,11,14,18,21,24,27,30) on the questionnaire aimed at assessing the participants’ postural behaviour. From the data in Figure 6, it can be seen that 54.5 % of the students slept on the side. Almost half of the participants (43.6%) bent their knees and kept their back straight when picking up objects from the floor (43.6%). The majority of respondents (41.8%) carried their backpacks on both shoulders close to the body. Most of the participants (45.5%) and used a step when taking objects from a high shelf. Among the 55 respondents, the proportion of those who adopted correct spinal alignment when sitting was as follows: 27.3% when sitting at a desk, 36.4% when sitting on an armchair, 23.6% when sitting at a table and 32.7% when sitting down working at the computer.
The distribution of the overall scores of participants’ postural behaviour is displayed in Figure 7 (for students who carried backpack) and Figure 8 (for students who did not use backpack). In Figure 7, it is apparent that the highest proportion of students (14.5%) who carried backpack scored 9 out of 16. For the students who did not carry backpack, the score 6 out of 14 was recorded by 7.3% (Figure 8).
Based on the overall scores, the participants’ postural behaviour was classified into three categories: poor, fair and good. Table 5 presents a summary of descriptive statistics of these 3 categories. Among the 37 students who carried a backpack, 51.4% (n=19) were found to have poor postural behaviour, 37.8% (n=14) had fair behaviour and 10.8% (n=4) had good postural behaviour. Of the 18 students who did not carry a backpack, 55.6% (n=10) were found to have poor postural behaviour, 27.8% (n=5) had fair behaviour and 16.6% (n=3) had good postural behaviour. This indicates that the majority of students did not adopt a good posture.
For the students who carried a backpack (n=37), the average score of behaviour was 7.46 and the standard deviation was 3.380 (Table 6). The average score of behaviour for students who did not carry backpack (n=18) was 6.89 and the standard deviation was 3.628. The Kolmogorov-Smirnov test for normality of the distribution showed that the scores of behaviour were normally distributed in the population for students who carried backpack (Z=0.108, p=0.20 >0.05) and for students who did not carry backpack (Z=0.152, p=0.20 >0.05). This was also evident in Figure 9 and Figure 10 where both histograms have a bell-shaped curve.
3.5. Relationship between the Behaviour with Demographics and MSP
Table 7 presents the comparison of mean scores regarding postural behaviour by respondents’ characteristics and incidence of MSP. With regards to students who carried a backpack, the one-way ANOVA test identified no significant differences in the behaviour with age (F=1.495, df=3, p=0.23), gender (F=0.164, df=1, p=0.69), course of study (F=1.606, df=12, p=0.16), academic year (F=0.728, df=4, p=0.58), school (F=0.340, df=1, p=0.56) and MSP (F=6.251, df=1, p=0.20). This therefore means that variables such as age, gender, course of study, academic year, type of school and MSP had no impact on the students’ overall behaviour score of students who carried a backpack.
For the overall behaviour of students who did not carry backpack, the one-way ANOVA test identified no statistically significant differences in behaviour with age (F=0.964, df=3, p=0.45), gender (F=6.405, df=1, p=0.30), course of study (F=3.701, df=9, p=0.60), academic year (F=2.307, df=4, p=0.11), school (F=4.125, df=1, p=0.62) and MSP (F=0.899, df=1, p=0.36). This indicates that variables such as age, gender, course of study, academic year, type of school as well as MSP had no impact on the overall behaviour score of students who did not carry backpack.
3.6. Relationship between the Knowledge of Posture and Ergonomics with Postural Behaviour
The Spearman Rank test showed that the overall knowledge score was not statistically significantly associated with the overall behaviour score for students who carried a backpack (Spearman r=0.206, p=0.22, i.e>0.05) and for students who did not carry a backpack (Spearman r=0.031, p=0.90, i.e >0.05). This means that students with a higher overall knowledge score were not more likely to have higher overall behaviour scores thus indicating that better knowledge of ergonomics and posture was not associated with better postural behaviour amongst university students.
3.7. MSP
Among the 55 participants, 70.9% (n = 39) experienced MSP as presented in the pie chart below (Figure 11).
The results of the MSP location are set out in Figure 12. Low back pain was the most common pain experienced by respondents (41.8%) followed by neck and shoulder pain (20%), upper back pain (10.9%) and other pain (hips, knees and ankles) (3.6%).
The activities after which the participants experienced MSP are presented in Figure 13. Of the 55 respondents, 40% reported that they experienced pain after using the computer, 32.7% after sitting, 23.6% after carrying weight, 18.2 % after standing, 16.4 % after sleeping, 14.5 % after picking up objects from the ground, 12.7% after walking around, and 7.3% reported that they experienced MSP after doing other activities.
3.8. Relationship between Demographic Characteristics with the Incidence of MSP
A chi-square test was conducted to test whether or not there was a significant correlation between the incidence of MSP and the independent variables (age, gender, course of study, academic year). As can be seen from Table 8, there was no significant relationship between the incidence of MSP in university students with age (χ2 =2.275, p=0.52), gender (χ2 =2.383, p=0.12), course of study (χ2 =14.467, p=0.56) as well as the academic year (χ2 = 2.884, p=0.58). Although the type of school was not statistically significantly associated with the incidence of MSP (χ2 =3.569, p=0.06), the p-value was very close to 0.05 indicating a trend. This might be due to a type 2 error which means the study sample was relatively small to detect a significant relationship.
3.9. Relationship between Demographic Characteristics with the Location of MSP
As shown in Table 9, the Chi-square test demonstrated that neck and shoulder pain were not significantly associated with age (p=0.22), gender (p=0.57), course of study (p=0.35) and academic year (p=0.29). Similarly, no statistically significant correlation was found between upper back pain and age (p=0.38), gender (p=0.39), course of study (p=0.16) and academic year (p=0.77). Furthermore, there was no evidence of a significant association between low back pain and age (p=0.11), course of study (p=0.67) and academic year (p=0.55). Regarding the relationship between gender with low back pain, the p-value was found to be 0.09 (very close to 0.05). In other words, it may have been significant if there were more subjects.
The results revealed no statistically significant association between the type of school with neck and shoulder pain (p=0.30), upper back pain (p=0.38) as well as other pain (p=0.30). Again, for the relationship between the type of school and low back pain, the p-value was found to be 0.09 (very close to 0.05). This means it may have been significant if there were more subjects.
3.10. Relationship between the Location of MSP with the Activities of Daily Living
Table 10 displays the results of the association between the location of MSP with the activity after which the participant experienced MSP. The current study showed a significant relationship between computer use with neck and shoulder pain (p=0.01) as well as upper back pain (p=0.02). The results also revealed that low back pain was significantly associated with lifting objects (p=0.04), sitting (p=0.04) and standing (p=0.01). There was no significant relationship between low back pain and sleeping (p=0.09), carrying weight (p=0.09), computer use (p=0.06) and walking (p=0.09). However, the p-values were very close 0.05 indicating that a significant association between these variables might have been detected if the sample size was larger. Similar results were obtained for neck and shoulder pain and sleeping (p=0.05), neck and shoulder pain and sitting (p=0.09) as well as upper back pain and sitting (p=0.06).
5.6.6. Qualitative Findings
A total of 55 respondents answered all the 8 open-ended questions (no missing values) and the results are displayed below (see Table 11):
For Qs 10 “What is the reason for your choice of the most adequate sleeping posture?”, the responses were grouped first into categories then into 3 key themes “Comfortable position”, “Correct spine alignment” and “less pain and injuries”. The category “relaxed posture” was noted by 10.9%. For example: Because i feel it gives the body a better relaxation
With regard to Qs 13 “What is the reason for your choice of the most adequate posture when picking up objects from the ground?”, the three key themes “Use knees not the back”, “Keeping the object close to body” and “Spine support” strongly emerged from the data. The highest proportion of students raised constructs for the category “Keep back straight” (32.7%) such as: Not bending the back
When participants were asked “What is the reason for your choice of the most adequate posture when sitting at a desk?” (Qs 16), the responses indicated that the following were important reasons: “Comfortable posture” and “Spine support”. For 36.4%, “Straight back” was the rationale whereas 14.5 % of respondents did not know the reason. This was evident through many comments such as: no slouching or leaning; I simply do not know
Regarding Qs20 “What is the reason for your choice of the most adequate posture when carrying the backpack?”, two key themes emerged from the analysis: “Comfortable posture” and “Spine support”. A number of students (19%) reported the “Equal distribution of weight” whereas a higher proportion (20%) of the participants did not know the rationale. A few extracts of what the students answered can be seen below: Balanced weight; Not sure
For Qs23 “What is the reason for your choice of the most adequate posture when taking an object from a high shelf?”, the students’ responses lead to the following themes: “Spine alignment” and “Less pain and injuries”. The highest proportion (51%) of the participants reported “Less pain”. However, 16% of students did not know the reason. This was evident through many comments such as: The above posture is the safest to avoid any back injury; I don’t know
For Qs26 “What is the reason for your choice of the most adequate posture when sitting on an armchair?”, three key themes strongly emerged from the data: “Comfortable posture”, “Correct alignment”, and “Spine support”. The category “straight back” was identified by nearly half of the participants (40%). However, 9.1% of the respondents did not know the reason. For example: no curve to the back; I don’t know
Regarding Qs29 “What is the reason for your choice of the most adequate posture when sitting at a table?”, the responses led to the following key themes “Comfortable posture” and “Spine support”. Almost half of the students (43.6%) recognised the “spine support” whereas 16.4% of the participants did not know the reason. This was evidenced through many comments such as: no slouching or leaning; Not sure
The responses to the last open-ended question Qs32 “What is the reason for your choice of the most adequate posture when sitting down working at computer?” led to four key themes “Comfortable posture”, “correct alignment”, “spine support” and “eyes at screen level”. The “Straight back” was noted by 31% whereas 12.7% of the respondents did not know the reason, as demonstrated by: to keep your back straight; I don’t know
The seven open ended questions aimed to assess whether the students just guessed, or whether they really knew the in-depth reasons behind what they considered to be the best postures to avoid MSP. Kubinger et al., [60] state that the reliability and validity of scores obtained from closed ended questions can very easily be decreased by students guessing the right answers. Further, Bar-Hillel et al. [61] argue that the researcher computing the scores might not be able to differentiate between responses based on knowledge and answers based on guessing.
To the researcher’s knowledge, this is the first study to use a mixed methods approach (quantitative and qualitative) composing cartoon animations when evaluating the level of knowledge of ergonomics and posture in university students. After reviewing the literature, the researcher could not find any previous study with the same aim as the current survey. Therefore, it was not possible to compare the qualitative findings presented herein with others work.
In the current study, all 55 participants answered all the 8 open-ended questions leading therefore to no missing data. The key themes that emerged from the qualitative data provided by respondents were: “Comfortable posture”, “Correct spinal alignment”, “Spine support”, “less pain and injuries”, “Use knees not the back”, “Keep the object close to body”, “Hands on desk”, “Feet flat on floor” as well as “eyes at screen level”.
The themes that emerged are well matched with the elements of proper body mechanics. Maintaining the natural “S” curvature of the spine (correct spinal alignment) is important as excessive spinal rotation/flexion resulting from improper posture might lead to damaging the tissues of the neck and back and therefore to non-specific MSP [62]. A proper body’s weight distribution is supported by maintaining the natural spine curvature [63]. Injury occurs when the tissues are pushed over the limit due to uneven load distribution [64]. Furthermore, muscular weakness and skeletal misalignment anticipate pain and injuries [65]. When one set of muscles is weak, uneven muscle tension tends to pull the spine off balance causing aches and pains in muscles and joints [66].
Students who do not support their spine and rest their forearms on an armrest when sitting are more likely to put the spine in a more tensioned position with over flexion of the neck and excessive extension in the cervical spine [66]. Carb [63] and Homola [66] argue that leaning forward moves the back outward leading to reduced natural lumbar lordosis, a forward shift of weight distribution, compression of discs and vertebrae as well as the straining of joints and ligaments. The posterior body’s weight shift also affects the tibialis anterior muscle which is important for knee and hip function together with ankle and foot mobility [67]. Furthermore, Homola [66] recommends keeping the screen at eye level when sitting down working at the computer to avoid twisting the spine.
When the feet are not flat on the floor, the knees are overextended, and thus more pressure is placed on the knees and lower back [63]. Moreover, sitting with crossed legs and twisting the upper body to one side may result in a spinal deformation at a three-dimensional level [42]. This situation increases pressure on the spinal nerves extending from the spinal cord therefore causing MSP [68]. Further, sitting with crossed legs puts more strain on the nerves behind the knees leading to weakness in one foot [66].
Safran et al. [69] and Homola [66] recommend bending the knees and keeping the normal spine curvature when picking up objects. This is because the use of the knees (not the back) during lifting puts more stress on muscles rather than ligaments and discs [70]. Furthermore, Homola [66] emphasise that bending the back can cause slipping of lower lumbar vertebrae, spinal nerves compression, pain and sometimes damage. Spinal ligaments which are soft tissues that prevent excessive movement of joints, come under greater pressure, become overstretched and may tear [64].
Additionally, Lewit [71] states that forward bending of the back when carrying heavy weights can cause tension in the upper fixators of the shoulder girdle which should normally be behind the centre of gravity of the body. Keeping the object as close as possible to the body when lifting objects from the floor is an important way of reducing lumbar stress [72]. This is because holding an object far from the body puts more force on the spine by shifting most of the force of the object into the front part of the lumbar discs [73]. As a result, the discs become at a high risk of herniation [74].
Moreover, loading the weight on one shoulder or by one hand, leads to asymmetrical activity in muscles, promoting a lateral spinal inclination, changes in shoulder level together with the occurrence of musculoskeletal discomfort at the shoulder, neck and back level [75]. In addition, this situation increases the pressure on the intervertebral disc situated on the same side of the weight therefore rotation of the vertebral column occurs [76]. Further, McGill [65] argues that placing the backpack close to the body can reduce the torso forces required to move the load. Carrying the backpack far from the body (low back position) increases the pressure on the shoulders due to lower frictional forces [77]. This may lead to a forward trunk lean and therefore shoulder and low back strain [78]. The deviation in spinal alignment occurs in order to counterbalance the weight on the back [78] as well as to stabilise the centre of gravity of the body over the feet [79].
An inadequate sleeping posture can lead to lateral spinal inclination resulting therefore in spinal injuries [80]. Sleeping positions which are different from a side posture can lead to more pressure on the intervertebral discs and the joints [81]. Improper sleeping positions can also reduce disc hydration which is directly related to the amount of pressure on the intervertebral discs [81]. For example, prone sleeping (on the abdomen) results in excessive extension of the vertebral column [66]. In contrast, lateral sleeping (on side) with bent knees is considered to be the most comfortable because this position leads to greater spinal movements responsible for strengthening muscles supporting the back [66]. This sleeping position helps maintain the proper body alignment (natural spine curvatures) and therefore balance the body weight on the intervertebral discs and facet joints [80].
The results also revealed that a number of students did not know the rationale behind considering good posture when carrying a backpack (20%), taking objects from a high shelf (16%), sitting at a desk (14.5%), on an armchair (9.1%) and at a table (16.4%). This demonstrates that the respondents might lack sufficient and in-depth knowledge regarding ergonomics and posture. Future research in this field with a large and more representative sample of university students’ population is strongly recommended to confirm these findings or not
4. Discussion
The current study was a web-based survey designed to determine the level of knowledge regarding ergonomics and posture together with postural behaviour as well as the presence of MSP in students at a university in the northeast of England. This study was highly original by taking a holistic approach (mixed method) to studying the level of knowledge of ergonomics and posture. Furthermore, this is the first study, to the author’s knowledge, to measure both knowledge regarding ergonomics and posture as well as postural behaviour amongst university students from different courses. Most of the studies previously conducted in this area focused on university students from limited disciplines in other areas.
4.1. Level of Knowledge of Ergonomics and Posture
The survey findings identified that 1.8%, 20% and 78.2% of the university students who participated in the current study had poor, fair and good knowledge of ergonomics and posture respectively. This finding supports previous research studies [6;10]. Cervera-Espert et al. [6] reported that 96.4% of dental students were aware of ergonomics and posture. Similarly, Kamaroddin et al. [10] noted that all the students from the Faculty of Computer Science and Mathematics (n=60, 100%) knew the principles of ergonomics. However, the level of knowledge in the above-mentioned studies was not classified into categories. Thus, it is not clear whether or not this level can be considered to be poor, fair or good knowledge which was done in the current study.
On the other hand, Elsallamy et al. [8] studied 479 dental students and noted that 25% of the students had good knowledge and 48.9% had fair knowledge. Further, Dolen and Elias [11] conducted a study to assess the knowledge of laptop ergonomics amongst 101 students from the school of Medicine and 96 students from the Faculty of Economics and Management. The authors observed that 15.8% of the students had poor knowledge, 74.1% had fair knowledge and 10.12% had good knowledge. The majority of students had fair knowledge in the study by Dolen and Elias [11] whereas most of the respondents had good knowledge in the current study. The discrepancy in findings may be related to the variability in the questions adopted in this study. Dolen and Elias [11] measured the students’ knowledge using dichotomous questions (yes/no) whereas the current study employed multiple choice questions. Dichotomous test items can be less accurate in measuring the knowledge level because they are more susceptible to guessing than multiple choice items [81]. Further, multiple choice questions can provide a relatively broad representation of the topic of interest increasing therefore the validity of the data collection tool [81]. Thus, multiple choice items are considered to be a more valid and reliable means of assessment of the students’ level of knowledge regarding ergonomics and posture. Taken together, it is not clear whether or not the percentages reported by Dolen and Elias [11], Cervera-Espert et al. [6] and Kamaroddin et al. [10] reflect the actual level of the students’ knowledge.
Sirajjudin and Siddik [2] did not classify the university students’ (177 Computer Science Engineering and Information Technology students) knowledge level into poor, fair or good. The authors grouped the knowledge scores based on the number of correct answers out of the total score. This was performed as follows: first group (<40%), second group (40-59%), third group (60-79%) and fourth group (80% and above). Sirajjudin and Siddik [2] observed that no student was in the first group, 64 subjects were in the second group, 59 students in the third group and 11 students in the fourth group. In contrast, the overall knowledge score was grouped according to different criteria in the current study. The overall knowledge score was grouped in three categories: poor (<50%), fair (50-70%) and good level (>70%) [3]. Thus, it was not possible to compare the findings from both studies.
The differences in knowledge level across the different studies might be related to numerous factors such as the variability in the sample size, the study sample, the different instruments used to assess knowledge as well as the cut-off points and criteria adopted by each researcher when categorizing the knowledge into poor, fair and good levels of knowledge. It is important to note that the current survey was the only study including university students from a wide variety of courses and schools at the university. This suggests that the study sample in the current study, in comparison with all previous studies, can be considered to be more representative of the target population.
4.1.1. Relationship between Knowledge with Demographic Characteristics
Consistent with the literature [6,10], the current study found that the overall knowledge scores on ergonomics and posture among university students were not statistically significantly different between males and females (p=0.387). This suggests that gender might have no impact on the level of knowledge of university students. Additionally, none of the previous studies directly investigated the association between the students’ knowledge of ergonomics and posture with their age. The current study demonstrated that knowledge scores did not differ significantly amongst the four age categories (p>0.05).
Dolen and Elias [11] observed that there was a statistically significant difference (p<0.001) in the mean knowledge scores between medical students (n=101) and students from the Faculty of Economics and Management (n=96). Dolen and Elias [11] noted that medical students were more likely to obtain a higher knowledge score compared to non-medical students. This may be attributed to the fact that medical students are expected to learn anatomy, ergonomics as well as posture in their curriculum, in comparison with the non-medical students.
Contrary to expectations, the current survey did not find a significant difference in the mean knowledge scores between health and non-health students (p=0.163) although the mean knowledge score was found to be higher among health compared to non-health students. The reason for this is not clear but it may be linked to the smaller sample size in the current study (n=55) and the difference in the samples. As a result, a type 2 error might have occurred. This means that the present study did not have the statistical power required to detect a statistically significant difference in knowledge regarding ergonomics and posture between health and non-health students. Dolen and Elias [11] included 101 students from the School of Medicine whereas the current study included only 2 students, 1 from the physiotherapy and 1 from the Sports therapy and rehabilitation, who are supposed to learn ergonomics and posture during their courses.
In agreement with the findings by Movahhed et al. [4], the present study did not detect a significant difference in the knowledge score according to year of study (p=0.29). On the other hand, this is dissimilar to the study conducted by Cervera Espert et al. [6] who reported that the level of ergonomics knowledge significantly decreased in the last academic year and in the postgraduate period. A plausible reason for this discrepancy could be related to the fact that Cervera Espert et al. [6] focused solely on dental students. The results obtained from dental students cannot be generalised to all university students due to the reduced external validity.
4.2. Postural Behaviour
The current study demonstrated that almost half the students (51%) had poor postural behaviour, 38% had fair behaviour and 11% had good behaviour. These results are consistent with previous research [3,9,11]. Kanaparthy et al. [3] studied 134 dental students and observed that 11.19% had “good” behaviour. Using a different tool (RULA scores), Joshi et al. [9] also reported that 11.6 % of university students demonstrated good posture. Further, Dolen and Elias [11] noted that only 16.8% of the students (101 from the school of Medicine and Health Sciences and 96 from the Faculty of Economics and Management) demonstrated good practice of ergonomics principles. Although the majority of the students were knowledgeable about ergonomics and posture, it would appear that the students did not apply and practice this knowledge within their lives. Therefore, it is suggested to clearly understand the barriers that prevented students from practicing “good” postural behaviour. This may be best achieved by using a qualitative study where participants can take part in an interview or a focus group.
In contrast, “good” postural behaviour observed within this investigation was higher than that reported by Elsallamy et al. [8] (5%) and lower that observed in earlier studies [5,6,10]. Cervera-Espert et al. [6] studied 336 dental students and found that only 28.6% of the students sat correctly in the dentist chair. Similarly, Garbin et al. [5] who used photographs on 69 undergraduate dental students, found that 35% of photographs were satisfactory. Moreover, Kamaroddin et al. [10] investigated the ergonomics awareness of 60 university students (Computer Science and Mathematics) and observed that 50% of the students practiced good posture. These differences can be related to the differences in the criteria used to classify behaviour across different studies. For instance, Elsallamy et al. [8] classified behaviour into only good (≥75%) or bad (<75%). Garbin et al. [5] used the term “satisfactory” and Kamaroddin et al. [10] used the term “good posture”. Another possible reason for this variability might be the difference in the study sample. Contrary to the present study, none of the above-mentioned studies were broad in their focus and included students from all the university schools. The study sample in the present study can be considered more representative of the general university student population compared to previous studies.
4.2.1. The Relationship between Postural Behaviour with Demographic Characteristics
In concordance with earlier findings [4,6], the current study found that postural behaviour did not differ significantly between males and females (p>0.05). This outcome is in contrast to that of Aghahi et al. [82] who reported a significant relationship between gender and higher REBA (Rapid Entire Body Assessment) scores. Males scored more than females indicating a higher risk of MSP and poor posture. Females were more likely to adopt better posture than males.
No significant difference in the postural behaviour according to the academic year of study was observed in the present survey. This finding is in accordance with research by Movahhed et al. [4] where no significant relationship between the academic year of study and the RULA score was found.
When investigating the relationship between postural behaviour with age, the present study did not demonstrate significant differences in behaviour between different age categories. However, Aghahi et al. [82] reported a significant relationship between older age and higher REBA scores (poor posture). Younger students were more likely to adopt an acceptable posture. It could be related to the “amnesia effect” as with age, students may start to forget previous information they had learnt about posture. In accordance with the study by Dolen and Elias [11], the current survey also did not find significant differences in postural behaviour between health and non-health university students.
4.3. Association between Knowledge of Ergonomics and Posture with Postural Behaviour
When investigating the relationship between the students’ knowledge of ergonomics and posture with their postural behaviour, this study demonstrated that knowledge scores were insignificantly associated with the behaviour scores (with backpack and without backpack) (p>0.05). This result is in agreement with the findings of Movahhed et al. [4] where no significant correlation was found between the RULA score and the knowledge score (p>0.05). This means that students with higher knowledge scores were not more likely to have higher behaviour scores. This suggests that a good level of knowledge regarding one’s health might not warrant an improvement in a healthy lifestyle [83].
In addition to a lack or low level of knowledge, poor health behaviours may also be attributed to low motivation and negative health beliefs [84]. Several theories have attempted to explain health behaviours. For instance, the Health Belief Model [85] and the Theory of Reasoned Action [86] state that one’s beliefs about health contribute directly to one’s health behaviour. On the other hand, The Integrated Theory of Health Behaviour Change (ITHBC) [87] emphasizes that health behaviour is the result of both knowledge and beliefs.
In the same way as the Integrated Theory of Health Behaviour Change, the Social Cognitive Theory [88] purports that enhanced knowledge and beliefs can improve self-efficacy and therefore behaviour. Hence, it can be concluded that university students are more likely to adopt healthy behaviours when they have good knowledge together with positive beliefs about that particular behaviour.
4.4. Incidence and Location of MSP
In the current study, the majority of university students experienced MSP (70.9%) indicating an urgent need to tackle this public health problem since students are our future workers. However, this does not necessarily mean that the reported pain has been continuous. Some students may have had only episodes of consecutive pain while others may have experienced continuous pain. The finding, in the current survey, is in agreement with previous studies which were conducted amongst university students in Ethiopia (69.4%) [18], Brazil (74.6%) [19], Pakistan (88.5%) [16], Saudi Arabia (85.3%) [20], Ghana (70.1%) [23], Malaysia (67% and 65.1% respectively) (11;21], Iran (82%) [27], India (74.5%) [24], USA (61%) [28], Korea (73.3%) [25] and Australia (80%) [26].
In contrast, Woo et al. [31] documented a lower prevalence (49.9%) of MSP amongst 503 Science and Technology students in Hong Kong. Further, a study by Lorusso et al. [32] included 109 X-ray technology students in Italy and found a 37% prevalence of MSP over the previous 12 months among the respondents. A possible explanation for this inconsistency could be related to differences in the operational definition of MSP onset adopted by researchers as pain could be experienced in the past 7 days, in the past 12 months or at any period of time [22].
The study results demonstrated that low back pain was the most common pain (41.8%) experienced by university students who participated in the current study. This finding broadly supports the work of earlier studies in this area of research [18,24,26] (54.0%, 58.7% and 59.2% respectively). However, the results of the current study do not support the results of other previous studies which found that university students suffered mostly from neck pain [16,28] (19.3% and 61% respectively) and shoulder pain [11,31] (46.2% and 78.1% respectively). This discrepancy in pain location between the different studies could be attributed to the differences in the sample as well as the tasks performed by university students in these studies which varied based on the type of course they attend. Further studies with a large and more representative sample of university students, need to be undertaken in order to draw conclusions about the general population.
In the current study, a significant association was observed between low back pain and sitting (p=0.04), lifting (p=0.04) as well as standing (p=0.01). A recent meta-analysis by Swain et al. [89] included 41 studies investigating the relationship between different body postures and low back pain. The results from the meta-analyses revealed a positive association between low back pain with sitting, bending/twisting, carrying a heavy physical load as well as standing. Corlett [90] argues that sitting for long periods of time may predict the onset of developing low back pain. This is because prolonged sitting can increase intra-discal stress [91] and lumbar stiffness as well as decrease efficiency of the lower back muscles [92].
Furthermore, the present study confirms the findings by Halonen et al. [93] who prospectively studied a large cohort using data from the Swedish longitudinal occupational survey of Health study between 2010 and 2016. Using a study sample of 17,962, the authors noted that lifting objects predicted the occurrence of low back pain. The torsional and cumulative compressive pressure commonly associated with lifting contributes to the development of low back pain [94].
The current survey detailed that computer use was significantly associated with neck and shoulder pain (p=0.01) as well as with upper back pain (p=0.02). The prolonged strain and pressure put on muscles, ligaments, tendons and discs by using computers may explain the development of MSP among computer users [95]. Contrary to expectations, this study did not find a significant correlation between computer use and low back pain (p=0.06). The reason for this is not clear but it may be attributed to the small sample size in the present study. An increased possibility of type 2 error is associated with the small study sample. This means the null hypothesis suggesting no significant association between computer use and low back pain was falsely accepted in this study. If more subjects had participated, the study may have had sufficient statistical power to detect a significant correlation between computer use and low back pain.
4.4.1. The Relationship between the Incidence of MSP with Demographic Characteristics
In the current study, there was no statistically significant relationship between the presence of MSP in university students and age (p=0.52). This result has previously been described by Dolen and Elias [11] who did not find a significant association between MSP and age (p>0.05). This suggests that students with older age are not more likely to experience MSP and vice versa. A possible explanation for this might be that MSP is a multifactorial condition and therefore can result from a combination of confounding elements rather than one single risk factor.
Additionally, the study results showed no significant relationship between the presence of MSP in university students and gender (p=0.12). This finding concurs with that reported by Dolen and Elias [11] who studied 101 health and 96 non-health students. In contrast, Aghahi et al. [82] reported a strong and significant association between MSP and gender (males more than females, p = 0.001) in 199 dental students. This can be attributed to the fact that the study by Aghahi et al. [82] focused solely on dental students, thus the sample cannot be generalised to all university students.
Dolen and Elias [11] demonstrated that the frequency of MSP was significantly higher among non-health students compared to health students (p= 0.009). This differs from the findings presented within the current study where there were no significant relationships between the presence of MSP in university students with the course of study (p=0.56) and type of school (p=0.06). Healthcare students were not less likely to experience MSP. However, there was a trend in the results as the p-value was very close to 0.05. A possible explanation for this might be that a type 2 error may have occurred. This means that the present study, due to the small sample size, did not have the statistical power required to detect a significant difference in MSP between health and non-health students.
Additionally, the current study did not find a statistically significant relationship between the presence of MSP in university students with the year of study (p=0.58). The year of study did not predict the onset of MSP. In reviewing the literature, no previous studies investigating the association between MSP and academic year were found despite conducting a comprehensive search.
4.5. The Relationship between Knowledge of Ergonomics and Posture with Incidence of MSP
In this study, no statistically significant differences in the scores of knowledge on ergonomics and posture, between students with MSP and students without MSP was found. This outcome is broadly consistent with earlier studies [4,7,11]. This indicates that students with a low level of knowledge on ergonomics and posture are not more likely to experience MSP. This may be explained by the fact that knowledge alone, if not put into practice, might not be sufficient to prevent MSP. Awareness needs to be applied and theoretical instructions need to be combined with practical demonstrations [4].
4.6. Association between Postural Behaviour with MSP
Contrary to expectations, the current study found that students without MSP were not more likely to adopt better postures compared to those with MSP (p>0.05). This study supports evidence from previous investigations by Dolen and Elias [11] and Aghahi et al. [82] who did not find a significant association between behaviour regarding ergonomics and posture with the prevalence of MSP among university students.
On the other hand, this finding is not consistent with that obtained by Kanaparthy et al. [3] who reported a significant relationship between good postural practice and the incidence of MSP among students. Kanaparthy et al. [3] suggested that “good” postural behaviour might be a protective factor for the occurrence of MSP. Kim et al. [96] argue that poor postural habits can increase pressure and stress on disks, muscles and tendons resulting in MSP.
The inconsistency in findings may be related to the different samples and type of items used. Kanaparthy et al. [3] asked dental students about their postural behaviour whilst working in dentistry. However, the current study included university students from different Faculties and courses together with the constructs that were related to the respondents’ postural behaviour during their activities of daily living (sleeping, sitting, lifting objects and taking objects from high shelf).
4.7. Limitations and Future Recommendations
The generalisability of the results from the current study is subject to certain limitations and thus the findings need to be interpreted with caution. First, the present survey involved a total sample of 55 university students which is generally considered small to improve the external validity of the findings. The required sample size was justified using power calculations described above and was supposed to be 64. Therefore, type 2 error (accepting the null hypothesis when it is false) was more likely to occur as the sample size was small [97].
Second, the respondents were recruited using a convenience (non-random) sampling technique. Random sampling allows an equal chance for all the subjects in the target population to be selected and therefore a more representative sample would have been used. As a result, the study findings obtained from a representative sample could be generalised to the entire population [98].
Third, the current survey involved a sample of university students aged above 18 years old where the gender was not balanced (65.5% females and 34.5% males). In addition, the participants were distributed across different schools at a university in the northeast of England with 60% being healthcare students and the rest being non-healthcare students. Finally, the responses of participants reflected their opinion of their behaviour. Whether this reflects their actual behaviour is not known.
In spite of its limitations, this survey was conducted on students at a university in the northeast of England. This setting was considered to be the ideal setting for the target population. In addition, the current study used a valid and reliable tool to measure the knowledge of ergonomics and body posture, postural behaviour as well as the incidence of MSP in university students. This demonstrates high internal validity for the current study.
Future research in this field with a large and more representative sample of the university students’ population is strongly recommended to fully understand their knowledge of ergonomics and posture, postural behaviour as well as incidence of MSP. In addition, the inclusion of standing posture in future instruments is also required as the Adult version of the Aristegui questionnaire used in the present study was lacking of that feature.
5. Conclusions
The purpose of the current survey was to explore the knowledge of university students with regard to ergonomics and posture, the students’ postural behaviour as well as the incidence of MSP. The most obvious finding to emerge from this study is that more than seventy percent of the participants have a good level of knowledge on ergonomics and posture. Although these students knew the most adequate postures, the second major finding was that less than a quarter of them put this knowledge into practice. The current study results have also shown that a high proportion of students experienced MSP with the most prevalent site of pain being the lower back region. This study is highly original in that it is the first comprehensive investigation for understanding the extent to which university students know and practice acceptable back postures. The findings from the current study can be used to develop targeted interventions aimed at educating university students about ergonomics and posture in order to prevent the incidence of MSP.
Author Contributions
Conceptualisation, M.S., J.B.-S., G.K. and G.A.R.; Methodology, M.S., J.B.-S., G.K. and G.A.R.; Software, M.S.; Validation, M.S. and J.B.-S.; Formal analysis, M.S.; Investigation, M.S.; Resources, M.S.; Data curation, M.S., J.B.-S. and G.K.; Writing—original draft: M.S.; Writing— review and editing, M.S., J.B.-S., G.K. and G.A.R.; Visualisation, M.S.; Supervision, J.B.-S., G.K. and G.A.R.; Project administration, M.S. and J.B.-S. All authors have read and agreed to the published version of the manuscript.
Funding
This research received no external funding.
Institutional Review Board Statement
The study was conducted in accordance with the Declaration of Helsinki and approved by the Research Ethics Committee of the School of Health and Life Sciences at Teesside University, Middlesbrough, UK in 20 October 2019 (approval number: 286/18).
Informed Consent Statement
Informed consent was obtained from all subjects involved in the study.
Data Availability Statement
The datasets generated during and/or analyzed during the current study are available from the corresponding author upon reasonable request.
Conflicts of Interest
The authors declare no conflicts of interest.
References
- Bowman, P.J.; Braswell, K.D.; Cohen, J.R.; Funke, J.L.; Landon, H.L.; Martinez, P.I.; Mossbarger, J.N. Benefits of laptop computer ergonomics education to graduate students. Open J. Ther. Rehabil. 2014, 2, 42923–42928. [CrossRef]
- Sirajudeen, M.S.; Siddik, S.S.M. Knowledge of Computer Ergonomics among Computer Science Engineering and Information Technology Students in Karnataka, India. Asian J. Pharm. Res. Heal. 2017, 9, 64–70. [CrossRef]
- Kanaparthy, A.; Kanaparthy, R.; Boreak, N. Postural awareness among dental students in Jizan, Saudi Arabia. J. Int. Soc. Prev. Community Dent. 2015, 5, 107–111. [CrossRef]
- Movahhed, T.; Dehghani, M.; Arghami, S.; Arghami, A. Do dental students have a neutral working posture? J. Back Musculoskelet. Rehabil. 2016, 29, 859–864.
- Garbin, A.Í.; Garbin, C.A.S.; Diniz, D.; Yarid, S. Dental students’ knowledge of ergonomic postural requirements and their application during clinical care. European Journal of Dental Education 2011, 15, 31-35. [CrossRef]
- Cervera-Espert, J.; Pascual-Moscardó, A.; Camps-Alemany, I. Wrong postural hygiene and ergonomics in dental students of the University of Valencia (Spain) (part I). Eur. J. Dent. Educ. 2018, 22, 48–56. [CrossRef]
- Rodanant, P.; Promprakai, T. Ergonomic risk assessment from working postures in fourth year undergraduate dental students at Mahidol University. Mahidol Dental Journal 2019, 39, 63-70.
- El-Sallamy, R.M.; Atlam, S.A.; Kabbash, I.; Abd El-fatah, S.; El-Flaky, A. Knowledge, attitude, and practice towards ergonomics among undergraduates of Faculty of Dentistry, Tanta University, Egypt. Environ. Sci. Pollut. Res. 2018, 25, 30793–30801. [CrossRef]
- Joshi, P.; Karki, I.; Sharma, P. Computer workstation ergonomics: Knowledge testing of State Agricultural Universities (SAU) students. Journal of Human Ecology 2015, 49, 335-339. [CrossRef]
- Kamaroddin, J.H.; Abbas, W.F.; Aziz, M.A.; Sakri, N.M.; Ariffin, A. Investigating ergonomics awareness among university students. In Proceedings of the 2010 International Conference on User Science and Engineering (i-USEr), Shah Alam, Malaysia, 13–15 December 2010; p. 296.
- Dolen, A.P.; Elias, S.M. Knowledge and Practice of Laptop Ergonomics and Prevalence of Musculoskeletal Symptoms among University Students. Asia Pac. Environ. Occup. Health J. 2016, 2, 8–18.
- Srisaard, B. Basic Research, 2nd edition, Suveeriyasan Press, Bangkok, 1992.
- Suchat, P. Social Research Methodology, 10th edition, Sieng-chieng Press, Bangkok, 1997.
- Jaafar, R.; Akmal, A.; Libasin, Z. Awareness of Ergonomics Among the Engineering Students. J. Intelek. 2020, 15, 220–226. [CrossRef]
- Yossria, E.; Mohammed, H.E.; Mohammed, A.H. Relation between body mechanics performance and nurses’ exposure of work place risk factors on the low back pain prevalence, Journal of Nursing Education and Practice 2019, 9. [CrossRef]
- Hasan, M.M.; Yaqoob, U.; Ali, S.S.; Siddiqui, A.A. Frequency of musculoskeletal pain and associated factors among undergraduate students. Case Reports in Clinical Medicine. 2018, 7, 131-145. [CrossRef]
- Radcliffe, C.; Lester, H. Perceived stress during undergraduate medical training: a qualitative study. Medical education 2003, 37, 32-38. [CrossRef]
- Wami, S.D.; Mekonnen, T.H.; Yirdaw, G.; Abere, G. Musculoskeletal problems and associated risk factors among health science students in Ethiopia: a cross-sectional study. Journal of Public Health 2020, 1-7. [CrossRef]
- Morais, B.X.; Dalmolin, G.d.L.; Andolhe, R.; Dullius, Angela Isabel dos Santos; Rocha, L.P. Musculoskeletal pain in undergraduate health students: prevalence and associated factors. Revista da Escola de Enfermagem da USP 2019, 53. [CrossRef]
- Algarni, A.D.; Al-Saran, Y.; Al-Moawi, A.; Bin Dous, A.; Al-Ahaideb, A.; Kachanathu, S.J. The prevalence of and factors associated with neck, shoulder, and low-back pains among medical students at university hospitals in central Saudi Arabia. Pain research and treatment 2017. [CrossRef]
- Alshagga, M.A.; Nimer, A.R.; Yan, L.P.; Ibrahim, I.A.A.; Al-Ghamdi, S.S.; Al-Dubai, S.A.R. Prevalence and factors associated with neck, shoulder and low back pains among medical students in a Malaysian Medical College. BMC research notes 2013, 6, 244. [CrossRef]
- McBeth, J.; Jones, K. Epidemiology of chronic musculoskeletal pain. Best practice & research Clinical rheumatology 2007, 21, 403-425.
- Abledu, J.K.; Offei, E.B. Musculoskeletal disorders among first-year Ghanaian students in a nursing college. African health sciences 2015,15, 444-449. [CrossRef]
- Singh, A.; Devi, Y.S.; John, S. Epidemiology of musculoskeletal pain in Indian nursing students. International Journal of Nursing Education 2010, 2, 6-8.
- Smith, D.R.; Choe, M.; Chae, Y.R.; Jeong, J.; Jeon, M.Y.; An, G.J. Musculoskeletal symptoms among Korean nursing students. Contemporary nurse 2005,19,151-160. [CrossRef]
- Smith, D.R.; Leggat, P.A. Musculoskeletal disorders among rural Australian nursing students. Australian Journal of Rural Health 2004,12, 241-245. [CrossRef]
- Movahhed, T.; Dehghani, M.; Arghami, S.; Arghami, A. Do dental students have a neutral working posture? Journal of back and musculoskeletal rehabilitation 2016, 29, 859-864.
- Thornton, L.J.; Barr, A.E.; Stuart-Buttle, C.; Gaughan, J.P.; Wilson, E.R.; Jackson, A.D.; Wyszynski, T.C.; Smarkola, C. Perceived musculoskeletal symptoms among dental students in the clinic work environment. Ergonomics 2008, 51, 573-586. [CrossRef]
- Sun, Y.; Nimbarte, A.D.; Motabar, H. Physical risk factors associated with the work-related neck/cervical musculoskeletal disorders: A review. Industrial and Systems Engineering Review 2017, 5, 44-60. [CrossRef]
- Wahlstrom, J. Ergonomics, musculoskeletal disorders and computer work. Occupational medicine 2005, 55,168-176. [CrossRef]
- Woo, E.H.; White, P.; Lai, C.W. Musculoskeletal impact of the use of various types of electronic devices on university students in Hong Kong: An evaluation by means of self-reported questionnaire. Manual therapy 2016, 26, 47-53. [CrossRef]
- Lorusso, A.; Vimercati, L.; L’Abbate, N. Musculoskeletal complaints among Italian X-ray technology students: a cross-sectional questionnaire survey. BMC research notes 2010, 3, 114. [CrossRef]
- Hoy, D.; March, L.; Brooks, P.; Blyth, F.; Woolf, A.; Bain, C.; Williams, G.; Smith, E.; Vos, T.; Barendregt, J.; Murray, C.; Burstein, R.; Buchbinder, R. The global burden of low back pain: estimates from the Global Burden of Disease 2010 study. Annals of the Rheumatic Diseases, 2014, 73, 968-974. [CrossRef]
- Calvo-Muñoz, I.; Gómez-Conesa, A.; Sánchez-Meca, J. Prevalence of low back pain in children and adolescents: a meta-analysis. BMC pediatrics 2013, 13, 1-12. [CrossRef]
- Weleslassie, G.G.; Meles, H.G.; Haile, T.G.; Hagos, G.K. Burden of neck pain among medical students in Ethiopia. BMC musculoskeletal disorders 2020, 21, 1-9. [CrossRef]
- Cleland, J.A.; Palmer, J.A.; Venzke, J.W. Ethnic differences in pain perception. Physical therapy reviews 2005, 10, 113-122. [CrossRef]
- Edwards, C.L.; Fillingim, R.B.; Keefe, F. Race, ethnicity and pain. Pain 2001, 94, 133-137.
- Aggarwal, N.; Anand, T.; Kishore, J.; Ingle, G.K. Low back pain and associated risk factors among undergraduate students of a medical college in Delhi. Education for health (Abingdon, England) 2013, 26, 103-108. [CrossRef]
- Dugan, J.E. Teaching the body: a systematic review of posture interventions in primary schools. Educational Review 2018, 70, 643-661. [CrossRef]
- Foster, N.E.; Anema, J.R.; Cherkin, D.; Chou, R.; Cohen, S.P.; Gross, D.P.; Ferreira, P.H.; Fritz, J.M.; Koes, B.W.; Peul, W. Prevention and treatment of low back pain: evidence, challenges, and promising directions. The Lancet 2018, 391, 2368-2383. [CrossRef]
- Qidwai, W.; Ishaque, S.; Shah, S.; Rahim, M. Adolescent lifestyle and behaviour: A survey from a developing country. PloS one 2010, 5, e12914. [CrossRef]
- Lis-Sochocka, M.; Chylinska-Wrzos, P.; Wawryk-Gawda, E.; Bulak, K.; Jodlowska-Jedrych, B. Back pain and physical activity: Students of the Medical University of Lublin. Current Issues in Pharmacy and Medical Sciences 2015, 28, 278-282. [CrossRef]
- Cardon, G.; Balague, F. Low back pain prevention’s effects in schoolchildren. What is the evidence? European spine journal 2004,13, 663-79.
- Mitchell, T.; O’Sullivan, P.B.; Burnett, A.F.; Straker, L.; Rudd, C. Low back pain characteristics from undergraduate student to working nurse in Australia: a cross-sectional survey. International journal of nursing studies 2008, 45, 1636-1644. [CrossRef]
- Chitara, V.; Nishita, D. Prevalence of Neck Pain among Students in Dentistry. International Journal of Health Sciences and Research 2017, 7, 192-194.
- Polit, D.F.; Beck, C.T. Nursing research: Generating and assessing evidence for nursing practice. Lippincott Williams & Wilkins 2008.
- Siedlecki, S.L.; Butler, R.S.; Burchill, C.N. Survey design research: a tool for answering nursing research questions. Clinical nurse specialist 2015, 29, E1-E8.
- Aristegui, R.G. The Effectivity of an Educational Plan on Postural Habits and Prevention of Back Pain in the Children of San Sebastian. Ph.D. Thesis, University of Pais Vasco, Leioa, Spain, 2015.
- Salman, M.; Bettany-Saltikov, J.; Kandasamy, G.; Aristegui Racero, G. Development of a Novel Pictorial Questionnaire to Assess Knowledge and Behaviour on Ergonomics and Posture as Well as Musculoskeletal Pain in University Students: Validity and Reliability. Healthcare 2024, 12, 324. [CrossRef]
- Fink, A. How to conduct surveys: a step-by-step guide, sixth edition. SAGE, Los Angeles 2016.
- Field, A. Discovering statistics using SPSS: Book plus code for E version of text. SAGE Publications Limited 2009.
- Bettany-Saltikov, J.; Whittaker, V.J. Selecting the most appropriate inferential statistical test for your quantitative research study. Journal of Clinical Nursing 2014, 23, 1520-1531. [CrossRef]
- Hayter, A.J. A proof of the conjecture that the Tukey-Kramer multiple comparisons procedure is conservative. The Annals of Statistics 1984, 61-75. [CrossRef]
- Kim, H.Y. Statistical notes for clinical researchers: post-hoc multiple comparisons. Restorative dentistry & endodontics 2015, 40, 172-176.
- Bengtsson, M. How to plan and perform a qualitative study using content analysis. Nursing Plus Open 2016, 2, 8-14. [CrossRef]
- Curry, L.A.; Nembhard, I.M.; Bradley, E.H. Qualitative and mixed methods provide unique contributions to outcomes research. Circulation 2009, 119, 1442-1452. [CrossRef]
- Polit, D.; Beck, C.T. Essentials of nursing research: Appraising evidence for nursing practice 8th edition. Lippincott Williams & Wilkins, Philadelphia 2014.
- Burnard, P. A method of analysing interview transcripts in qualitative research. Nurse education today 1991, 11, 461-466. [CrossRef]
- Elo, S.; Kääriäinen, M.; Kanste, O.; Pölkki, T.; Utriainen, K.; Kyngäs, H. Qualitative content analysis: A focus on trustworthiness. SAGE open 2014, 4.
- Kubinger, K.D.; Holocher-Ertl, S.; Reif, M.; Hohensinn, C.; Frebort, M. On Minimizing Guessing Effects on Multiple-Choice Items: Superiority of a two solutions and three distractors item format to a one solution and five distractors item format. International Journal of Selection and Assessment 2010, 18, 111-115. [CrossRef]
- Bar-Hillel, M.; Budescu, D.; Attali, Y. Scoring and keying multiple choice tests: A case study in irrationality. Mind & Society 2005, 4, 3-12. [CrossRef]
- Ambusam, S.; Omar, B.; Joseph, L.; Deepashini, H. Effects of document holder on postural neck muscles activity among computer users: a preliminary study. Journal of research in health sciences 2015, 15, 213-217.
- Carb, G.J. The Science of Sitting Made Simple: How to Look and Feel Better with Good Posture in Ten Easy Steps. Posture Press 2008.
- McGill, S. Low back disorders: evidence-based prevention and rehabilitation. Human Kinetics 2015.
- Egoscue, P.; Gittines, R. Pain Free at Your PC: Using a Computer Doesn’t Have to Hurt. Bantam 2009.
- Homola, S. The Chiropractor’s Self-Help Back and Body Book. First edition, Hunter House Publishers, Canada 2002.
- Paterson, J. E-Book Teaching Pilates for Postural Faults, Illness and Injury: a practical guide. Elsevier Health Sciences 2008.
- Hamberg-van Reenen, H.; Ariëns, G.; Blatter, B.; Twisk, J.; Van Mechelen, W.; Bongers, P. Physical capacity in relation to low back, neck, or shoulder pain in a working population. Occupational and environmental medicine 2006, 63, 371-377.
- Safran, M.; Zachazewski, J.E.; Stone, D.A. Instructions for Sports Medicine Patients E-Book. 2nd edition, Elsevier Health Sciences, United Kingdom 2011.
- Straker, L.M. A review of research on techniques for lifting low-lying objects: 2. Evidence for a correct technique. Work 2003, 20, 83-96.
- Lewit, K. Manipulative therapy: Musculoskeletal medicine. Elsevier Health Sciences 2009.
- Bendix, T.; Eid, S. The distance between the load and the body with three bi-manual lifting techniques. Applied Ergonomics 1983, 14, 185-192. [CrossRef]
- Karahan, A.; Bayraktar, N. Determination of the usage of body mechanics in clinical settings and the occurrence of low back pain in nurses. International journal of nursing studies 2004, 41, 67-75. [CrossRef]
- Seidler, A.; Bolm-Audorff, U.; Siol, T.; Henkel, N.; Fuchs, C.; Schug, H.; Leheta, F.; Marquardt, G.; Schmitt, E.; Ulrich, P.T.; Beck, W.; Missalla, A.; Elsner, G. Occupational risk factors for symptomatic lumbar disc herniation; a case-control study. Occupational and environmental medicine 2003. 60, 821-830. [CrossRef]
- Drzał-Grabiec, J.; Snela, S.; Rachwał, M.; Podgórska, J.; Rykała, J. Effects of carrying a backpack in an asymmetrical manner on the asymmetries of the trunk and parameters defining lateral flexion of the spine. Human factors 2015, 57, 218-26. [CrossRef]
- Kroemer, K.H. Fitting the Human: Introduction to Ergonomics. CRC Press Taylor and Francis Group, Boca Raton 2008.
- Mackie, H.W.; Stevenson, J.M.; Reid, S.A.; Legg, S.J. The effect of simulated school load carriage configurations on shoulder strap tension forces and shoulder interface pressure. Applied Ergonomics 2005, 36,199-206. [CrossRef]
- Filaire, M.; Vacheron, J.J.; Vanneuville, G.; Poumarat, G. Influence of the mode of load carriage on the static posture of the pelvic girdle and the thoracic and lumbar spine in vivo. Surgical and Radiologic Anatomy 2001, 23, 27-31. [CrossRef]
- Bloom, D.; Woodhull-Mcneal, A.P. Postural adjustments while standing with two types of loaded backpack. Ergonomics 1987, 30,1425-1430. [CrossRef]
- Leilnahari, K.; Fatouraee, N.; Khodalotfi, M.; Sadeghein, M.A.; Kashani, Y.A. Spine alignment in men during lateral sleep position: experimental study and modeling. Biomedical Engineering Online 2011, 10, 1-11. [CrossRef]
- Brame, C. 2013. Writing good multiple choice test questions. Retrieved from Vanderbuilt University Center for Teaching website: https://cft.vanderbilt.edu/guides-subpages/writing-good-multiple-choice-test-questions.
- Aghahi, R.H.; Darabi, R.; Hashemipour, M.A. Neck, back, and shoulder pains and ergonomic factors among dental students. Journal of education and health promotion 2018, 7, 40.
- Happell, B.; Stanton, R.; Hoey, W.; Scott, D. Knowing is not doing: The relationship between health behaviour knowledge and actual health behaviours in people with serious mental illness. Mental Health and Physical Activity 2014, 7, 198-204. [CrossRef]
- Roberts, S.H.; Bailey, J.E. Incentives and barriers to lifestyle interventions for people with severe mental illness: a narrative synthesis of quantitative, qualitative and mixed methods studies. Journal of advanced nursing 2011, 67, 690-708. [CrossRef]
- Rosenstock, I.M.; The health belief model and preventive health behavior. Health education monographs 1974, 2, 354-386. [CrossRef]
- Ajzen, I. Perceived behavioral control, self-efficacy, locus of control, and the theory of planned behavior. Journal of Applied Social Psychology 2002, 32, 665-683.
- Ryan, P. Integrated Theory of Health Behavior Change: background and intervention development. Clinical nurse specialist CNS 2009, 23, 161-70.
- Bandura, A. Health promotion by social cognitive means. Health education & behavior 2004, 31, 143-164. [CrossRef]
- Swain, C.T.; Pan, F.; Owen, P.J.; Schmidt, H.; Belavy, D.L. No consensus on causality of spine postures or physical exposure and low back pain: a systematic review of systematic reviews. Journal of Biomechanics 2020, 102, 109312. [CrossRef]
- Corlett, E.N. Background to sitting at work: research-based requirements for the design of work seats. Ergonomics 2006, 49, 1538-1546. [CrossRef]
- Nachemson, A.L. Disc pressure measurements. Spine 1981, 6, 93-97. [CrossRef]
- Beach, T.A.; Parkinson, R.J.; Stothart, J.P.; Callaghan, J.P. Effects of prolonged sitting on the passive flexion stiffness of the in vivo lumbar spine. The Spine Journal 2005, 5, 145-154. [CrossRef]
- Halonen, J.I.; Shiri, R.; Magnusson Hanson, L.L.; Lallukka, T. Risk and Prognostic Factors of Low Back Pain: Repeated Population-based Cohort Study in Sweden. Spine 2019, 44, 1248-1255.
- Plamondon, A.; Gagnon, M.; Desjardins, P. Validation of a 3D segment model to estimate the net reaction forces and moments at the L5/S1 joint. Proceedings of the Canadian Society for Biomechanics VIIIth biennial conference 1994, 196.
- Kumar, S. Theories of musculoskeletal injury causation. Ergonomics 2001, 44, 17-47.
- Kim, D.; Cho, M.; Park, Y.; Yang, Y. Effect of an exercise program for posture correction on musculoskeletal pain. Journal of physical therapy science 2015, 27, 1791-1794. [CrossRef]
- Columb, M.; Atkinson, M. Statistical analysis: sample size and power estimations. Bja Education 2016,16, 159-161. [CrossRef]
- Sharma, B. A focus on reliability in developmental research through Cronbach’s Alpha among medical, dental and paramedical professionals. Asian Pacific Journal of Health Sciences 2016, 3, 271-278.
Figure 1.
The adult version of the Aristegui questionnaire.
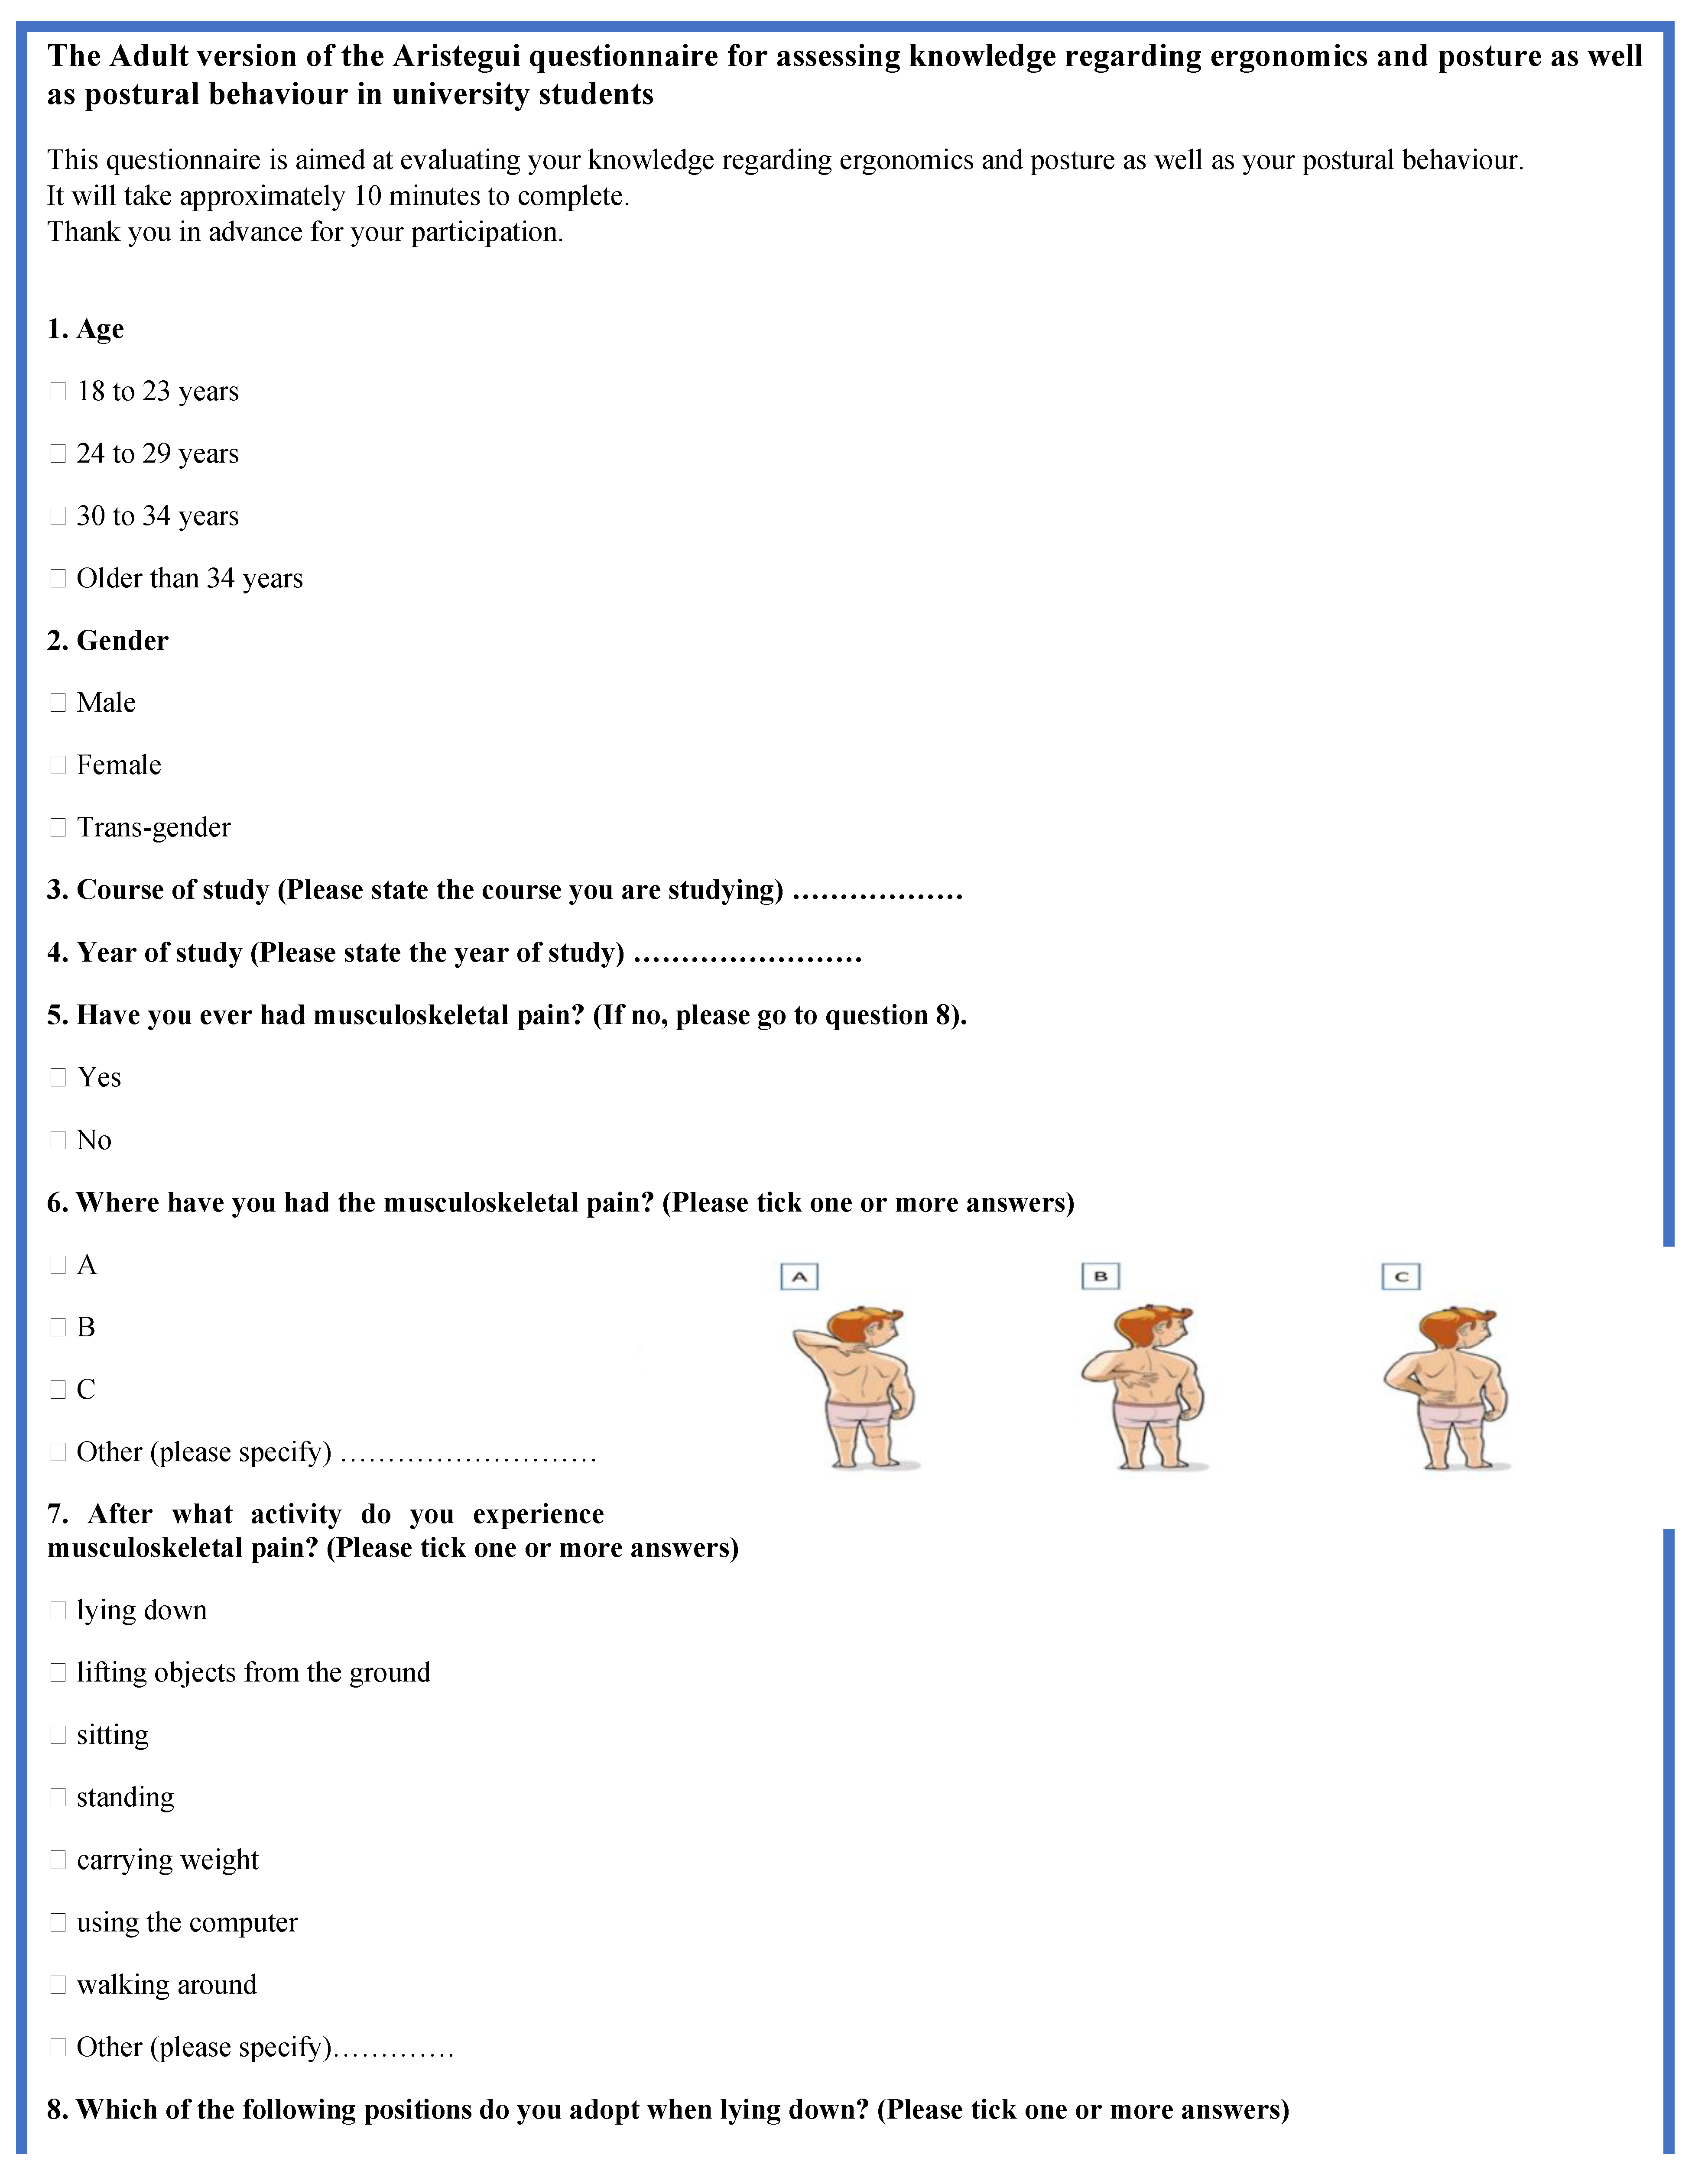
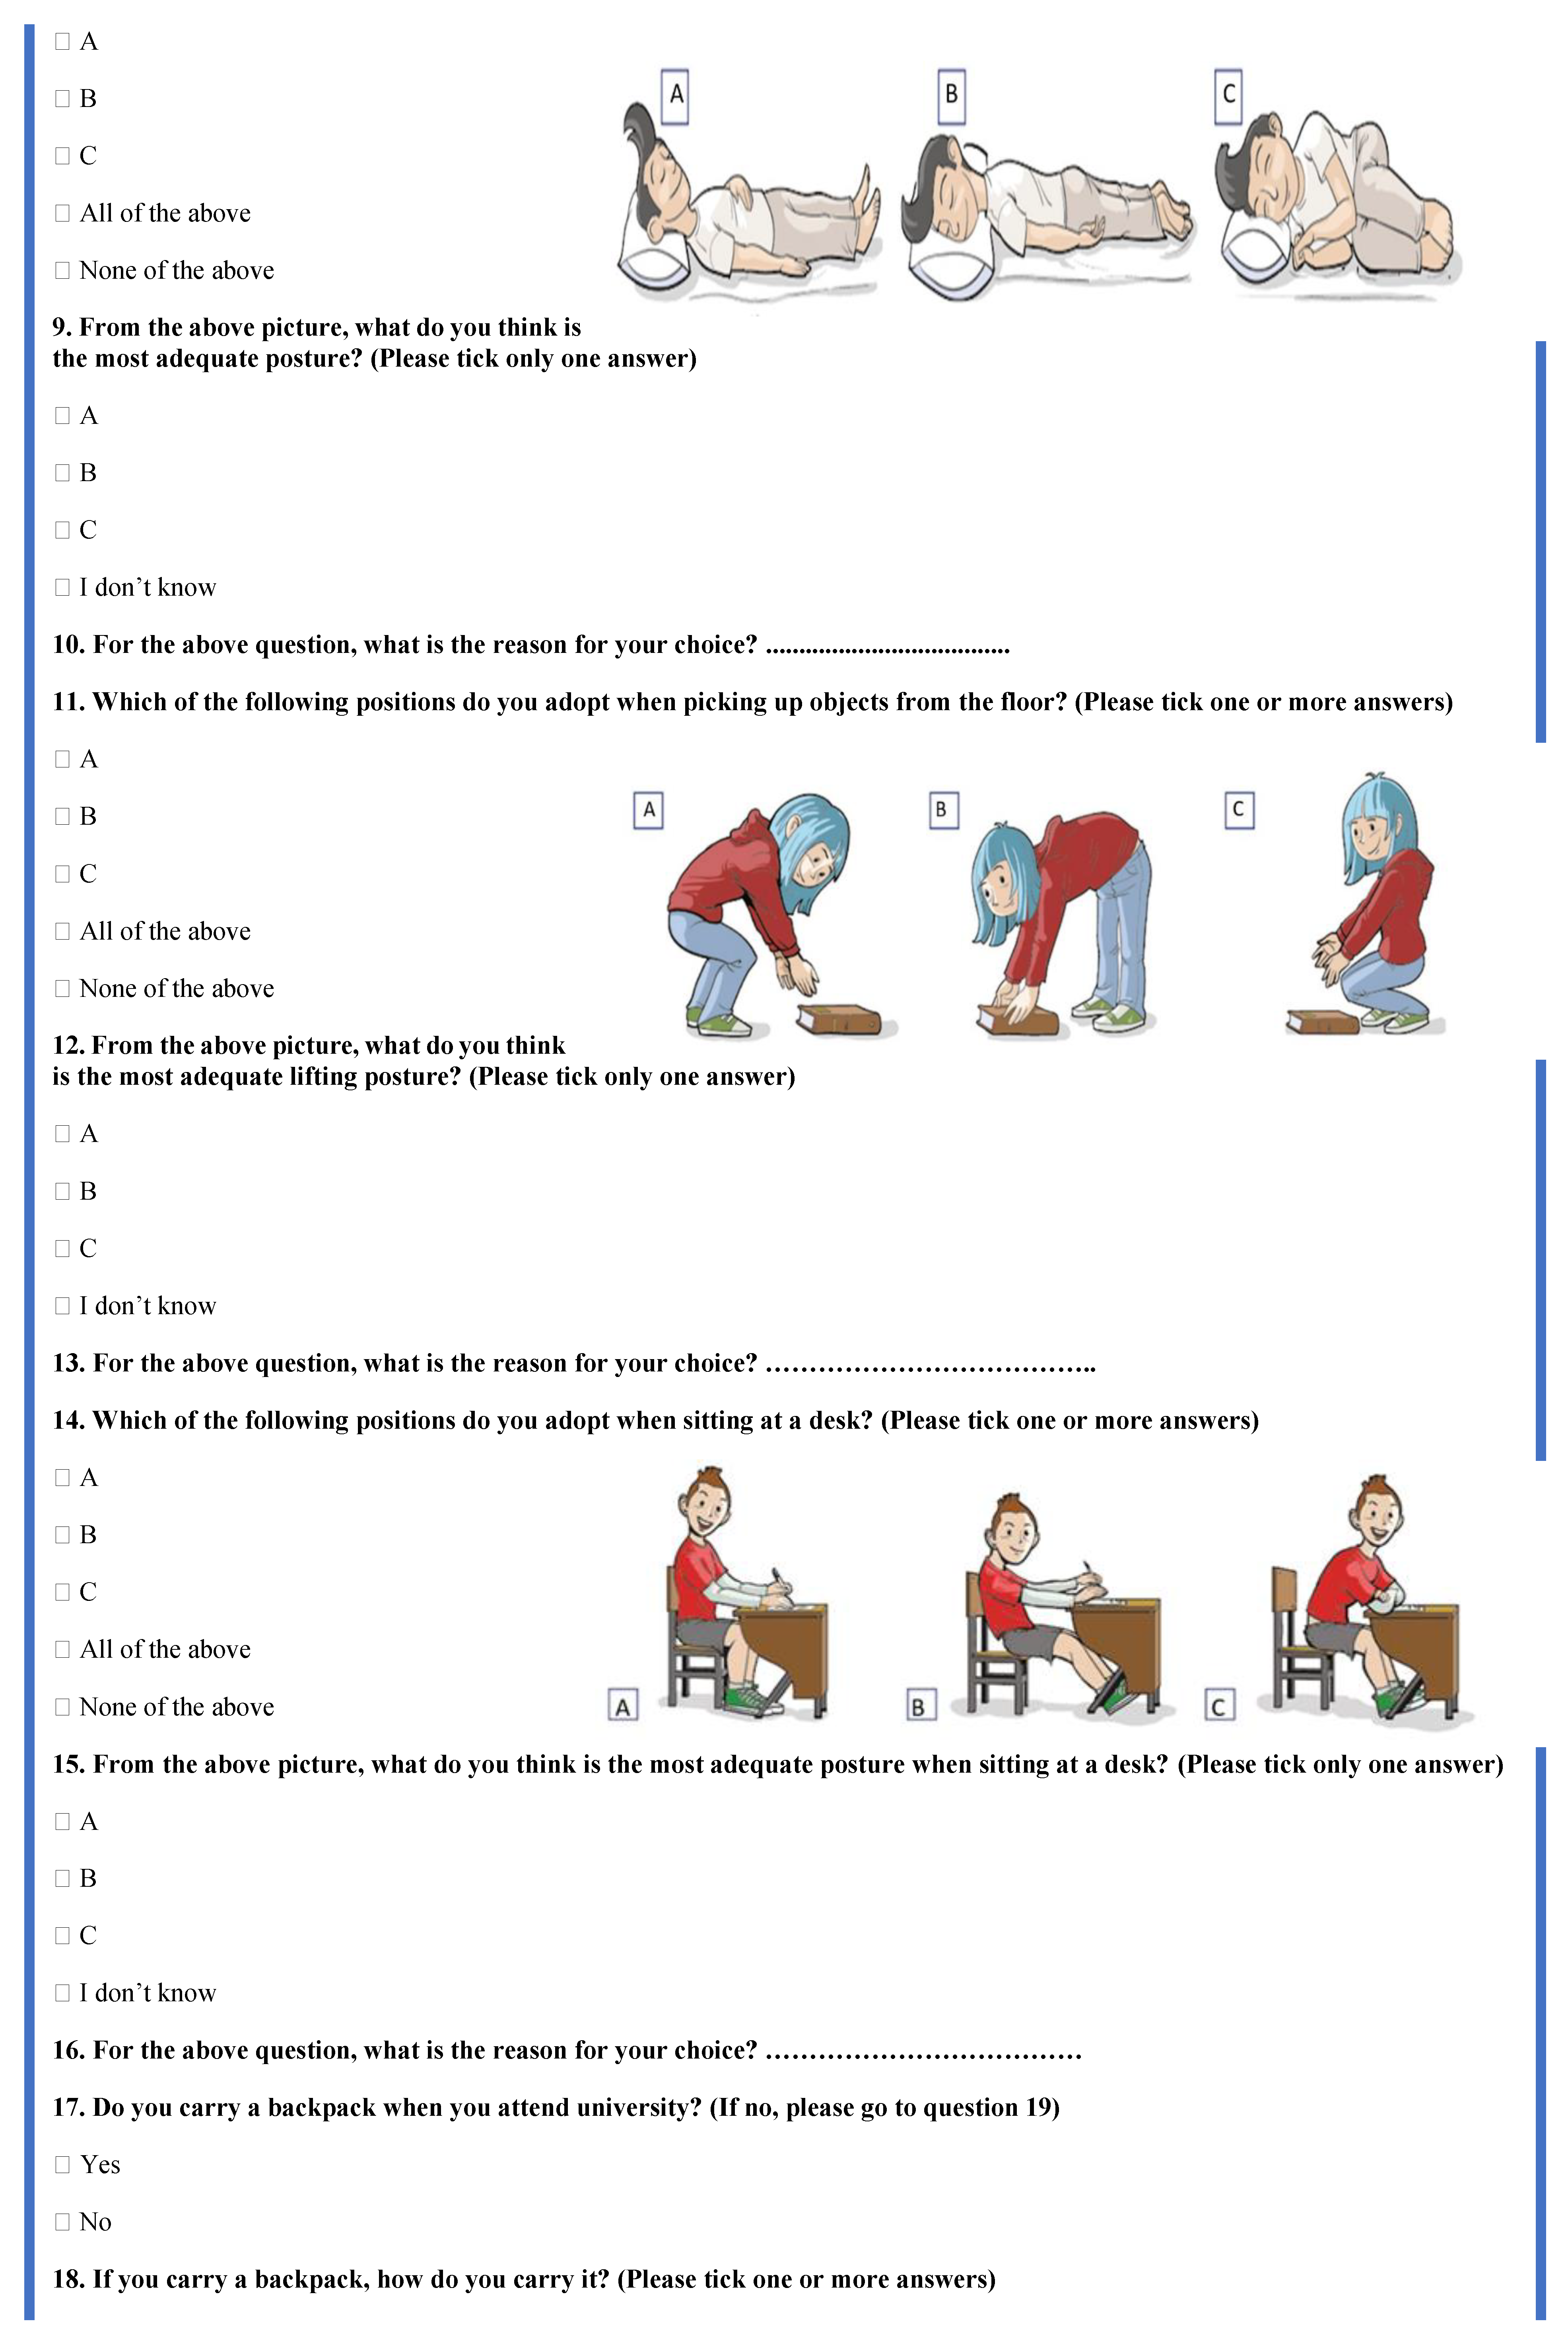
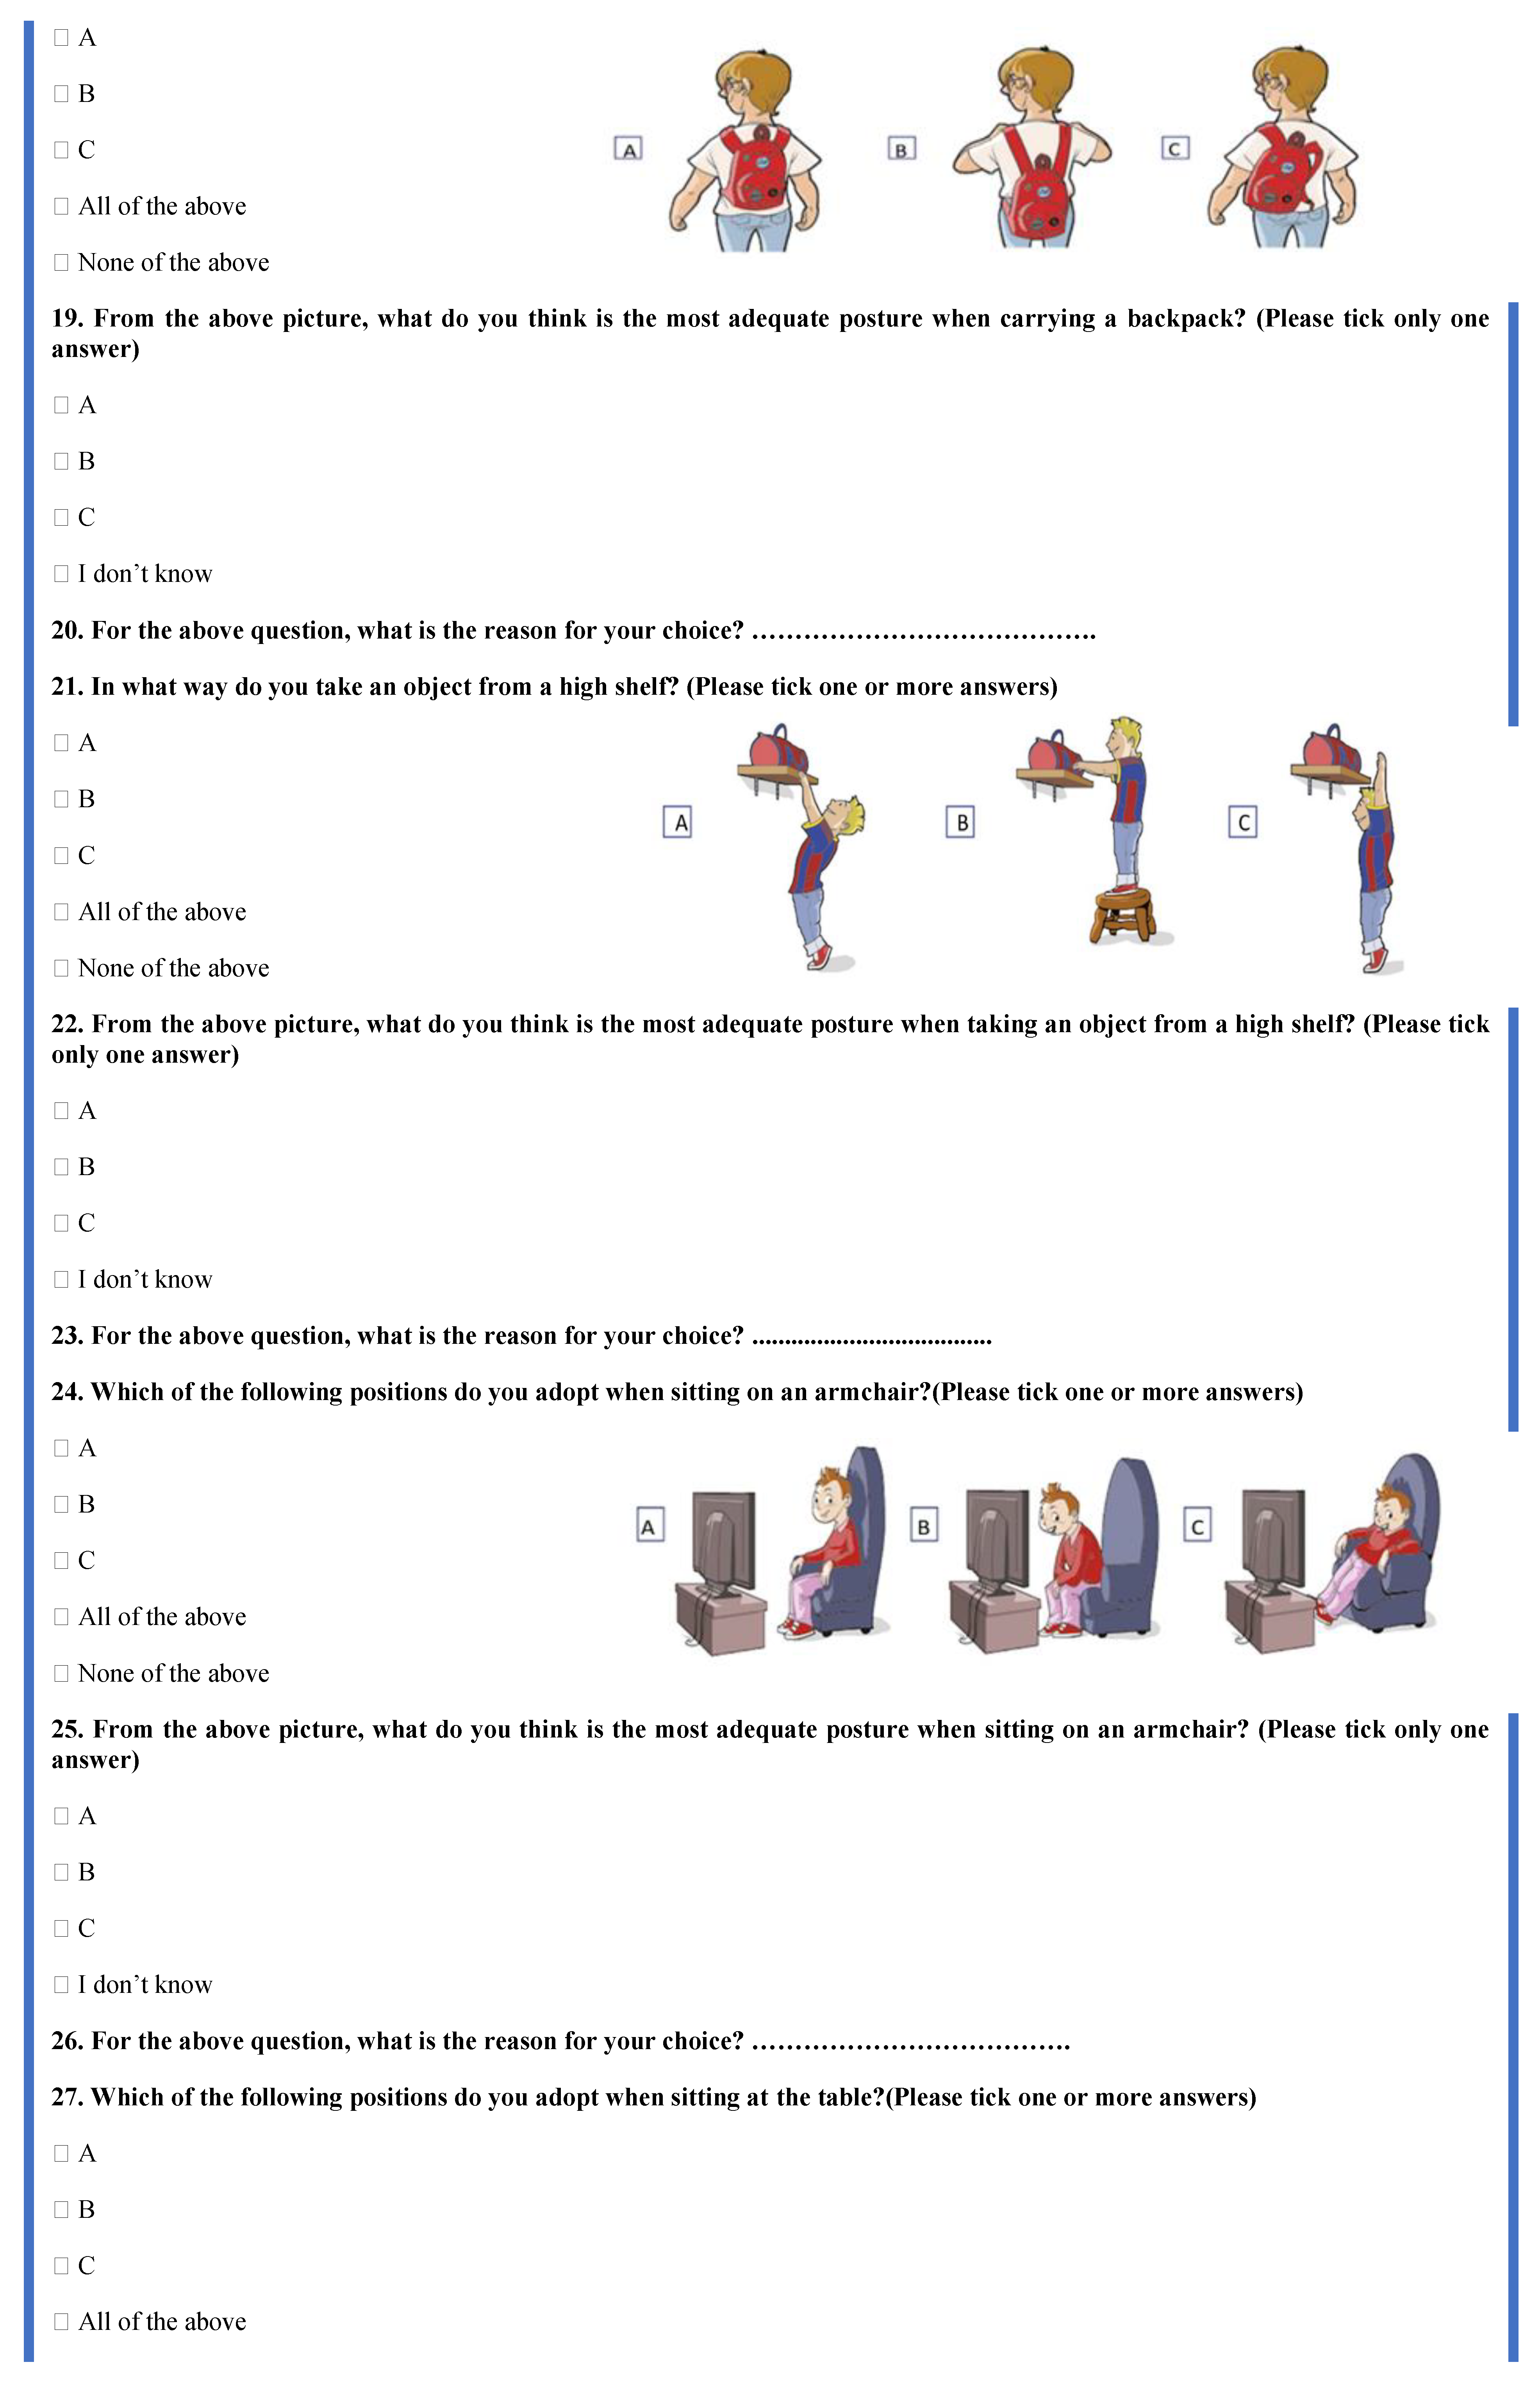
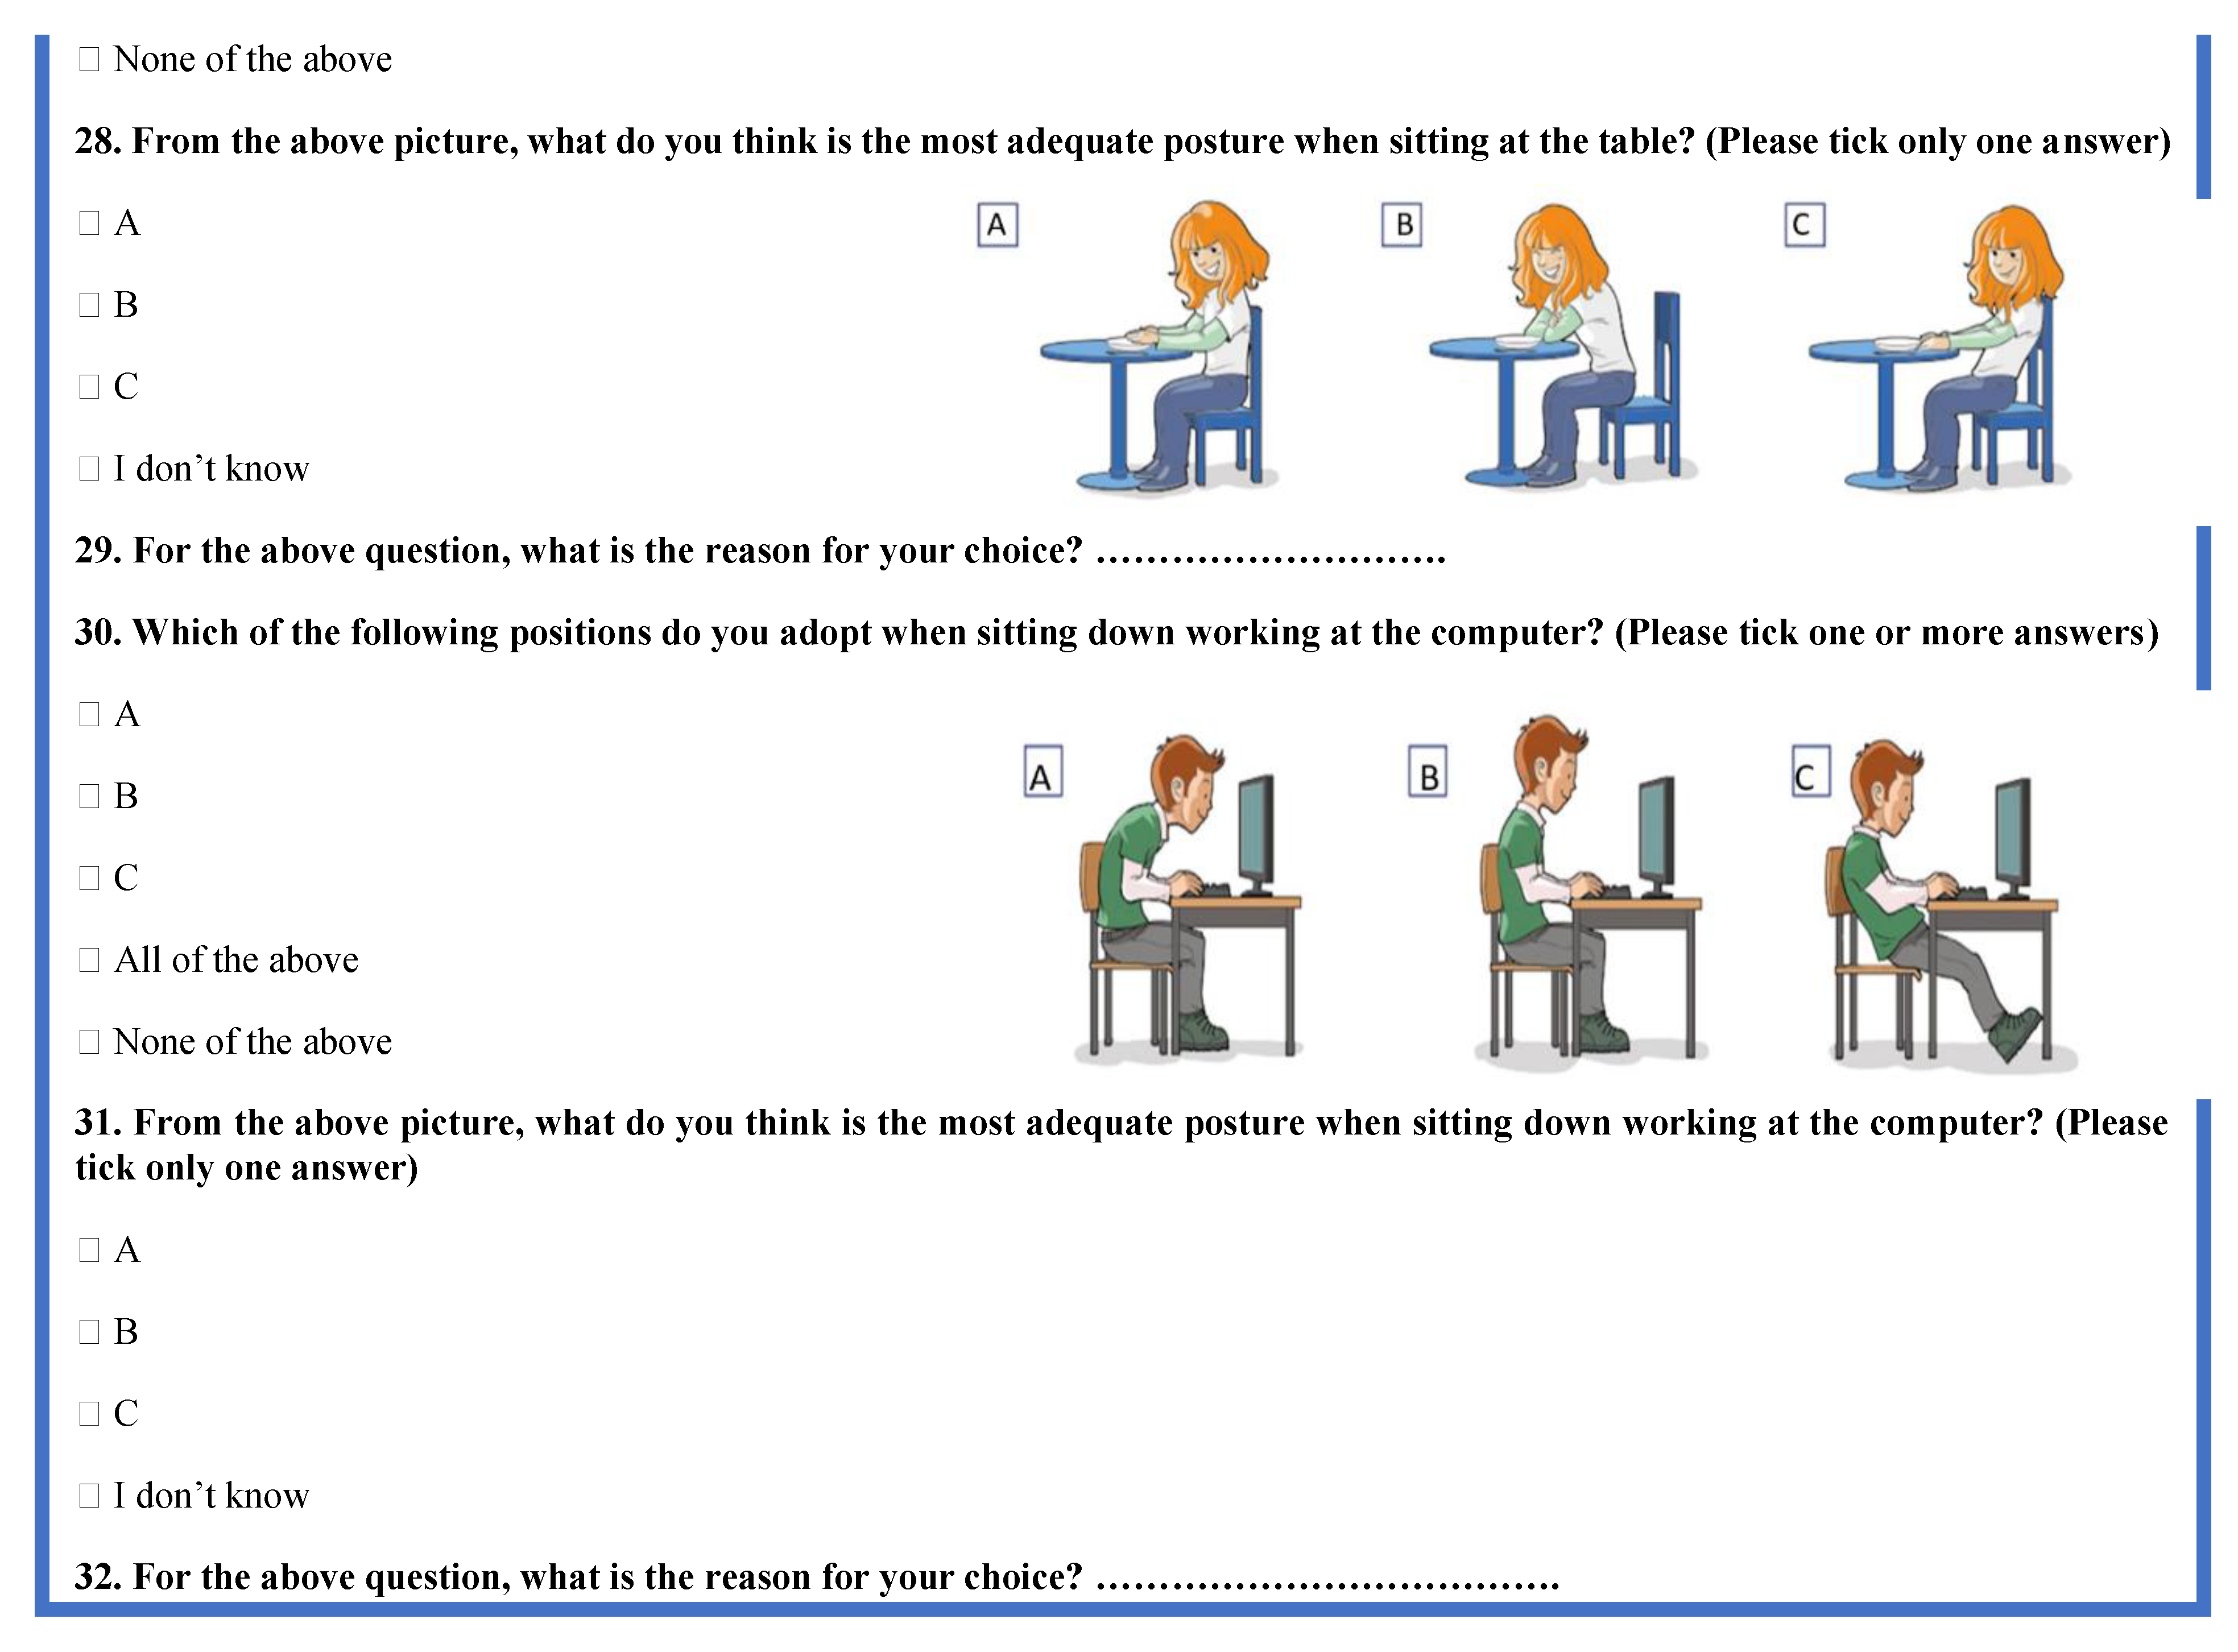
Figure 2.
Stages of content analysis.
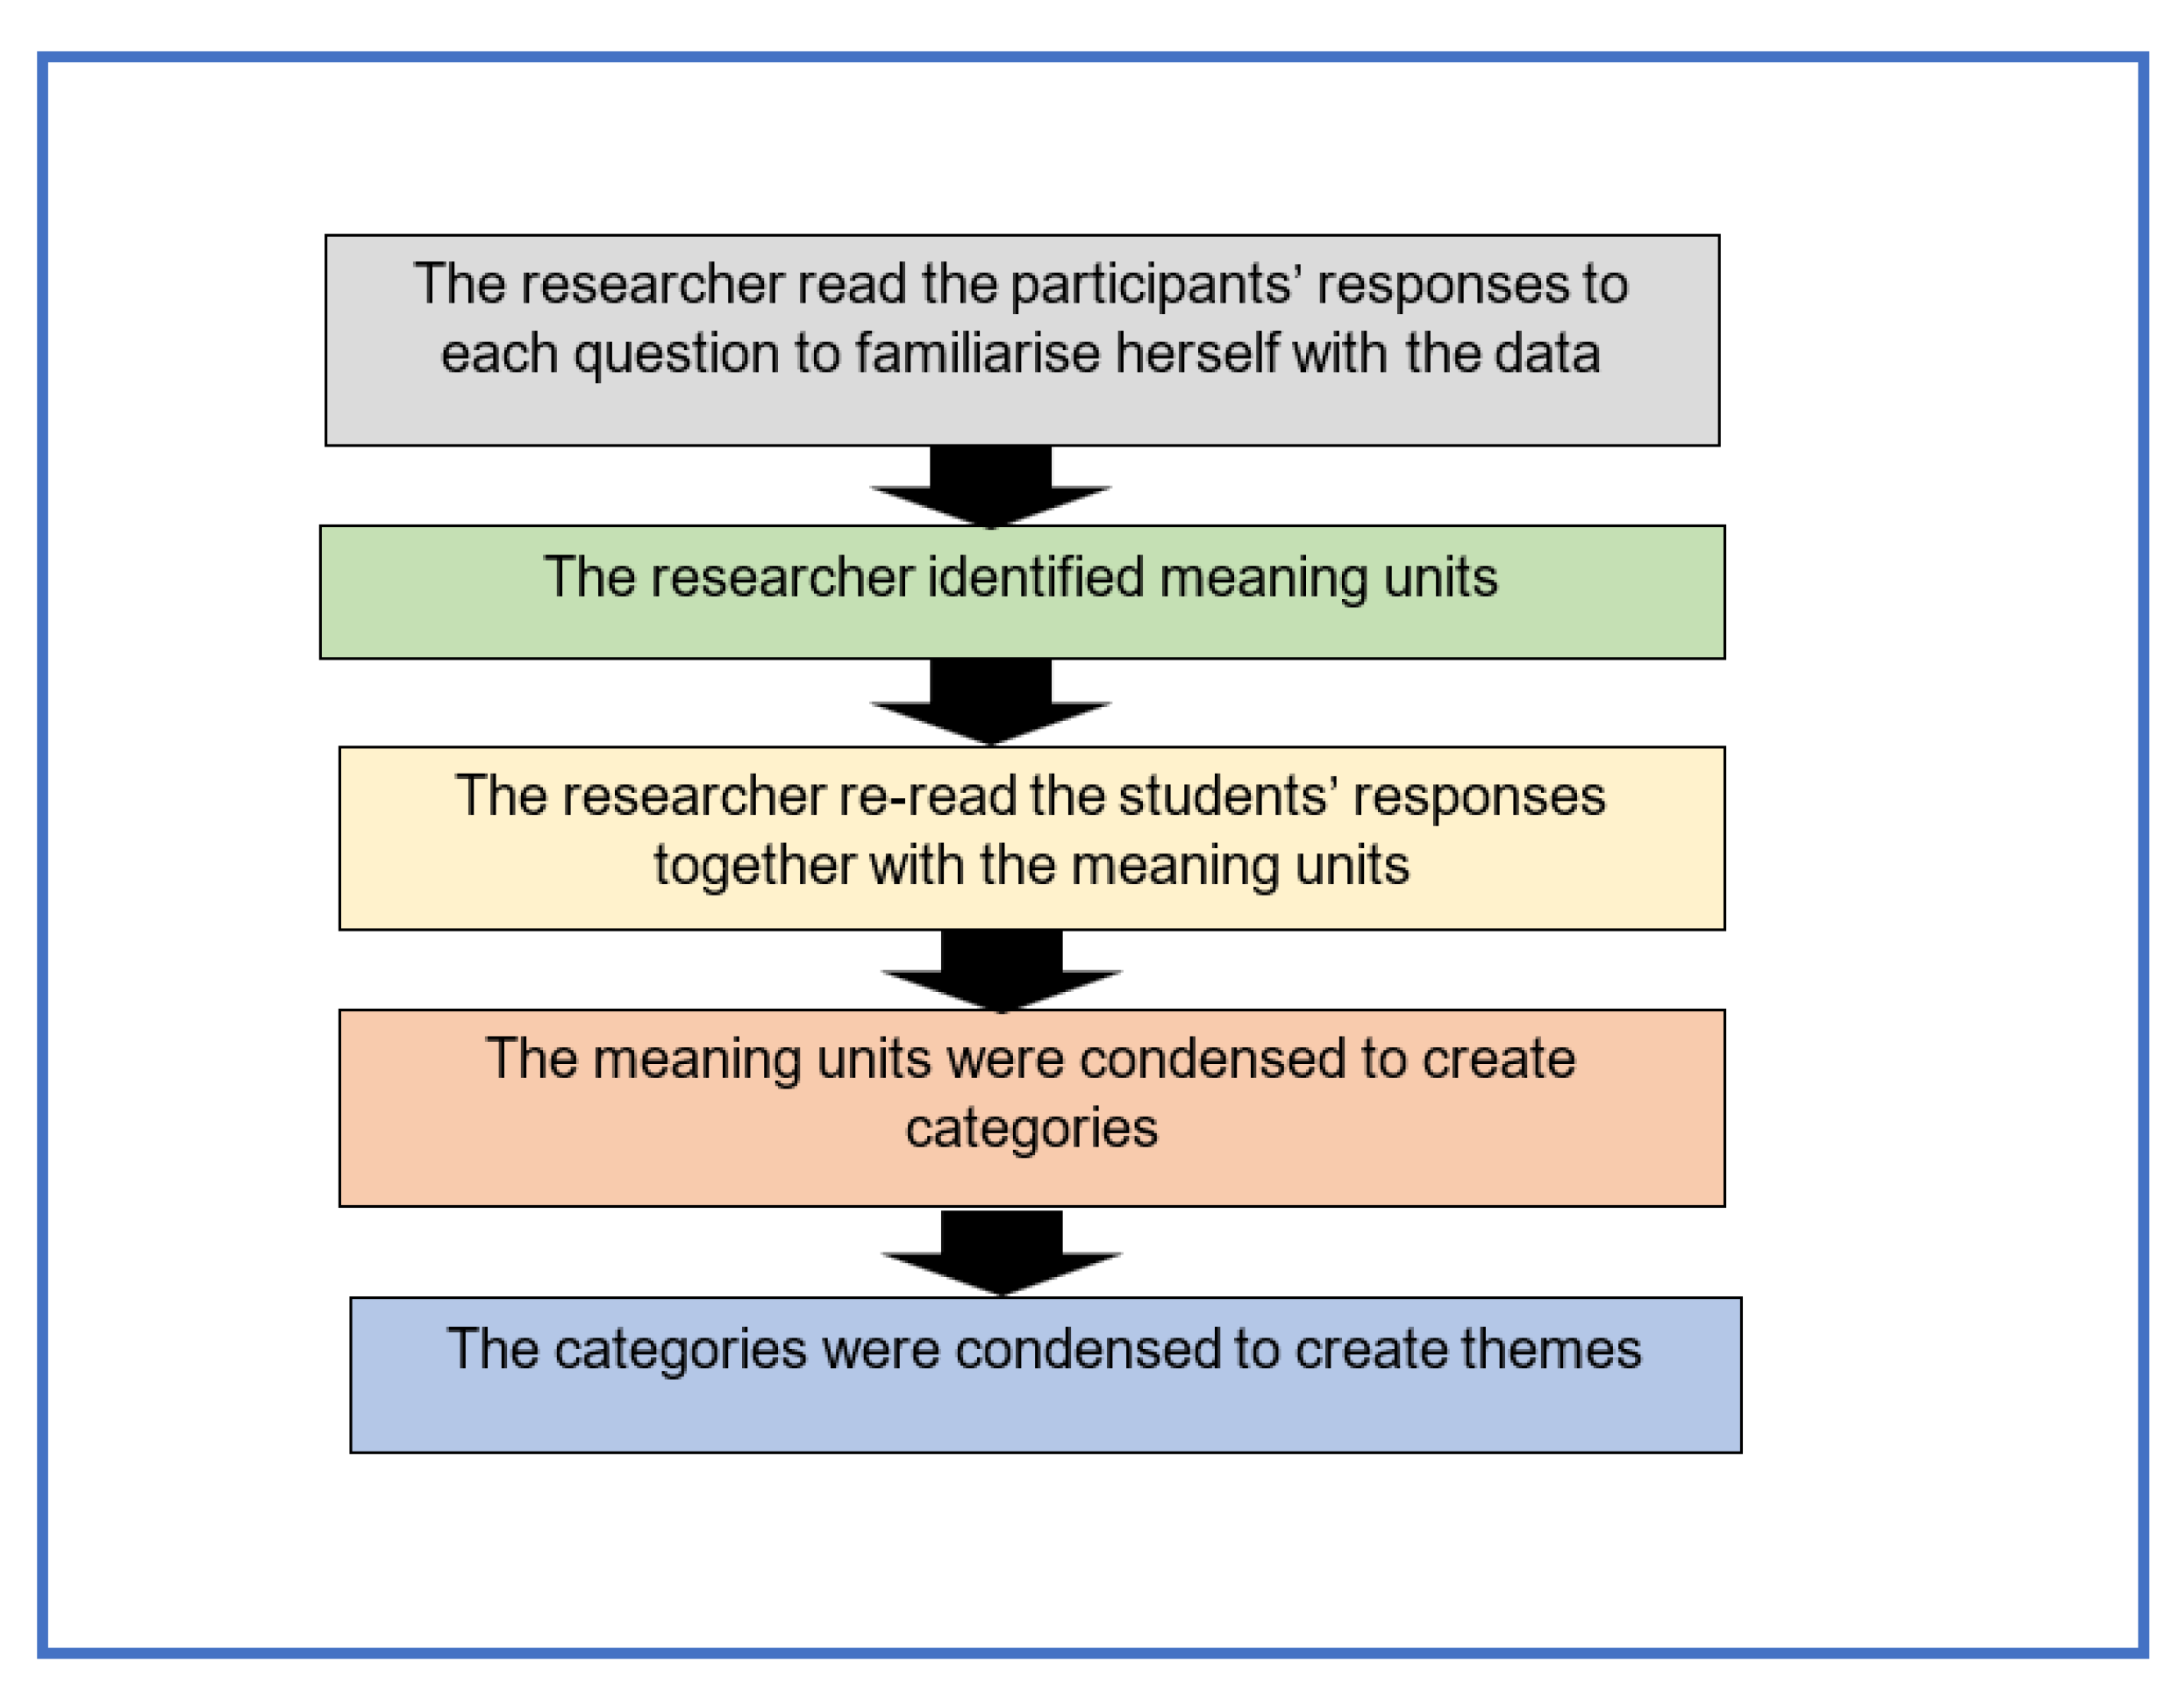
Figure 3.
Knowledge of ergonomics and posture.
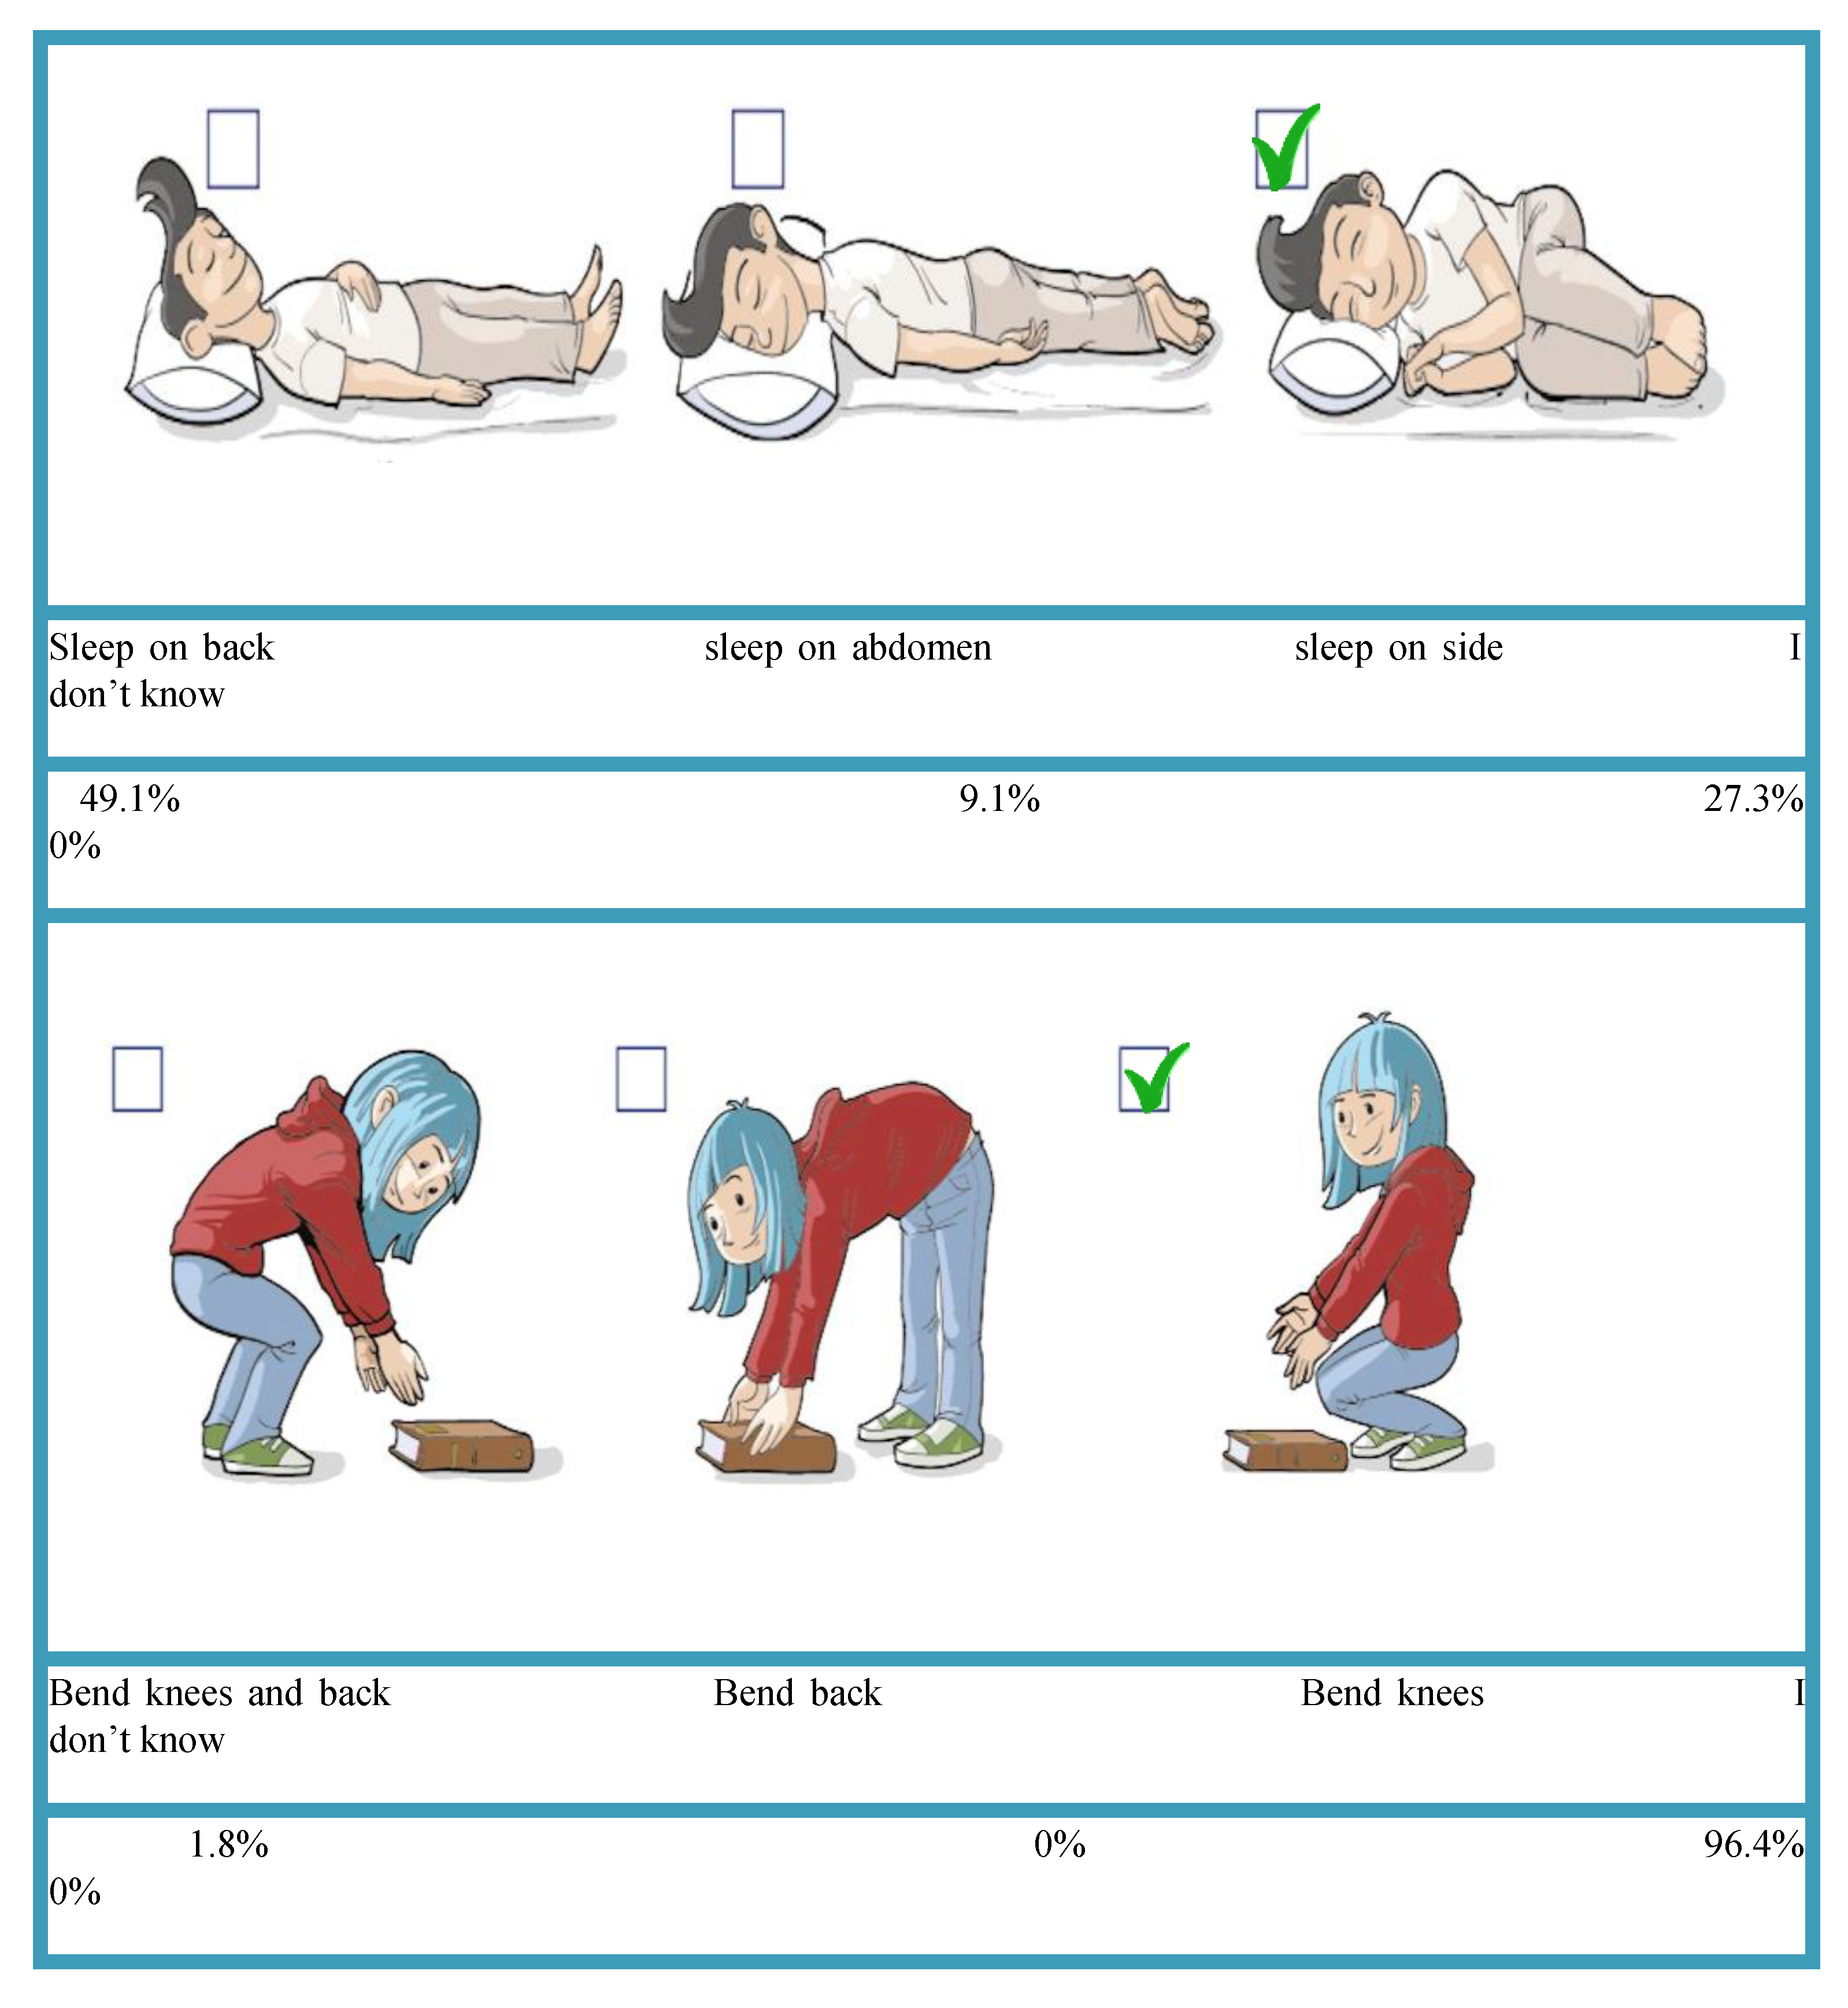
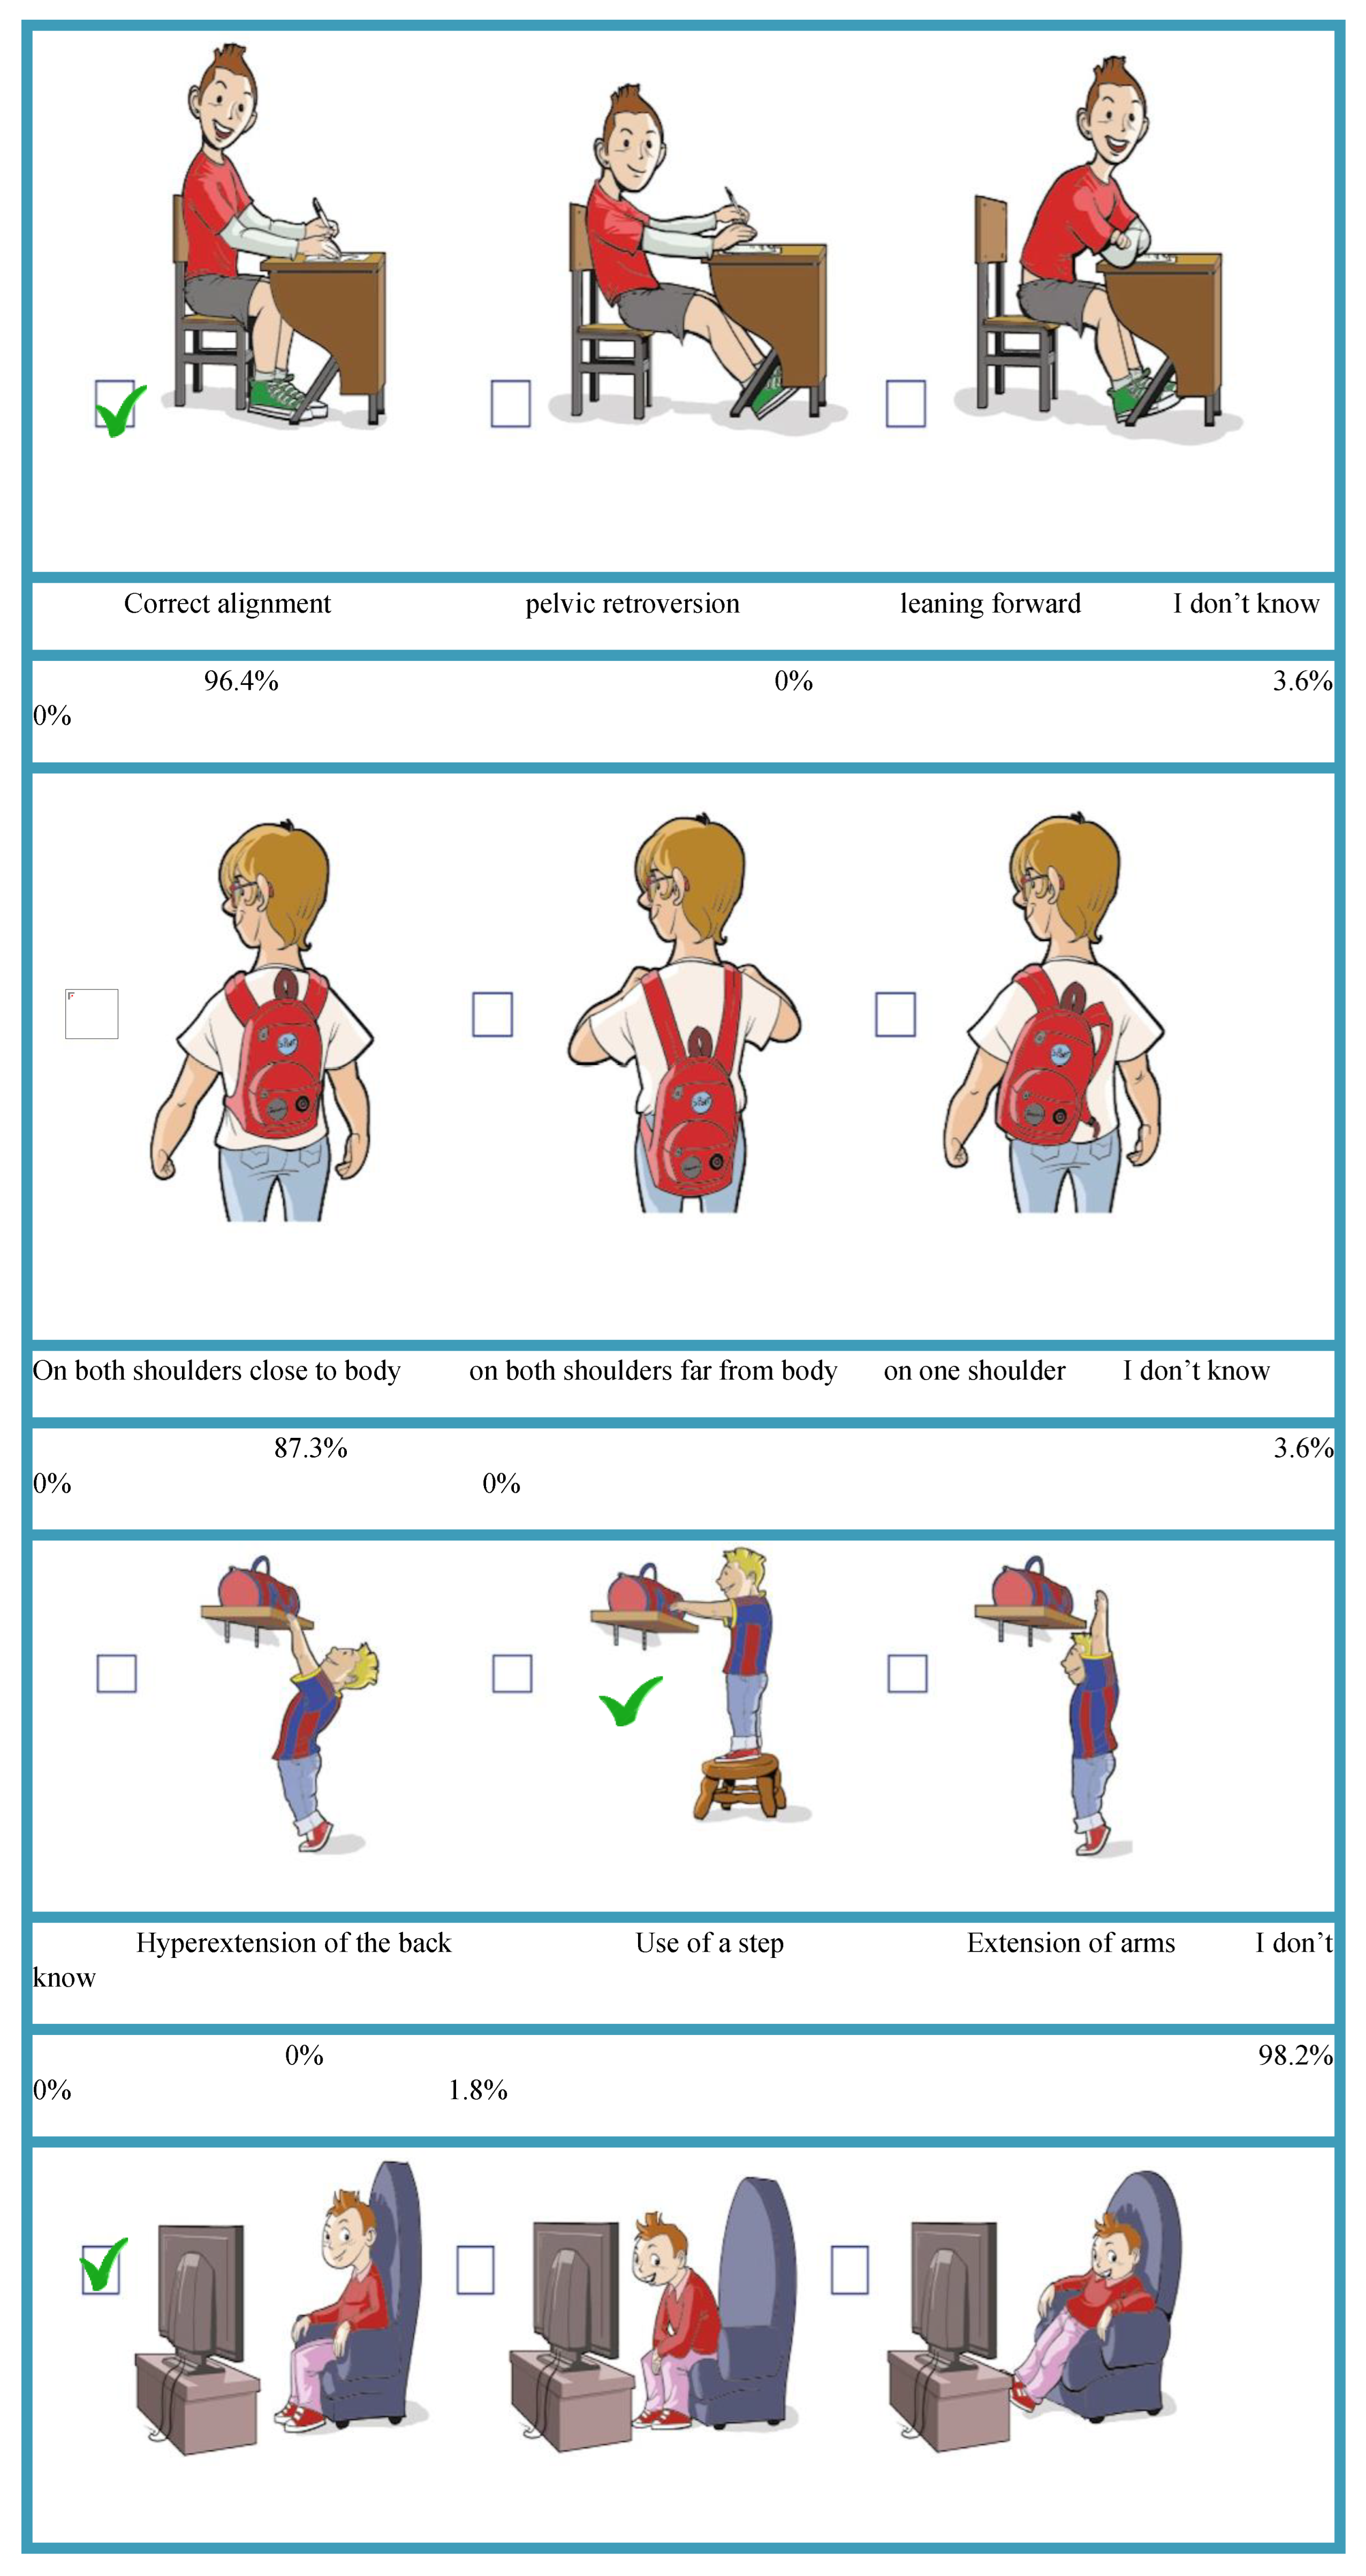
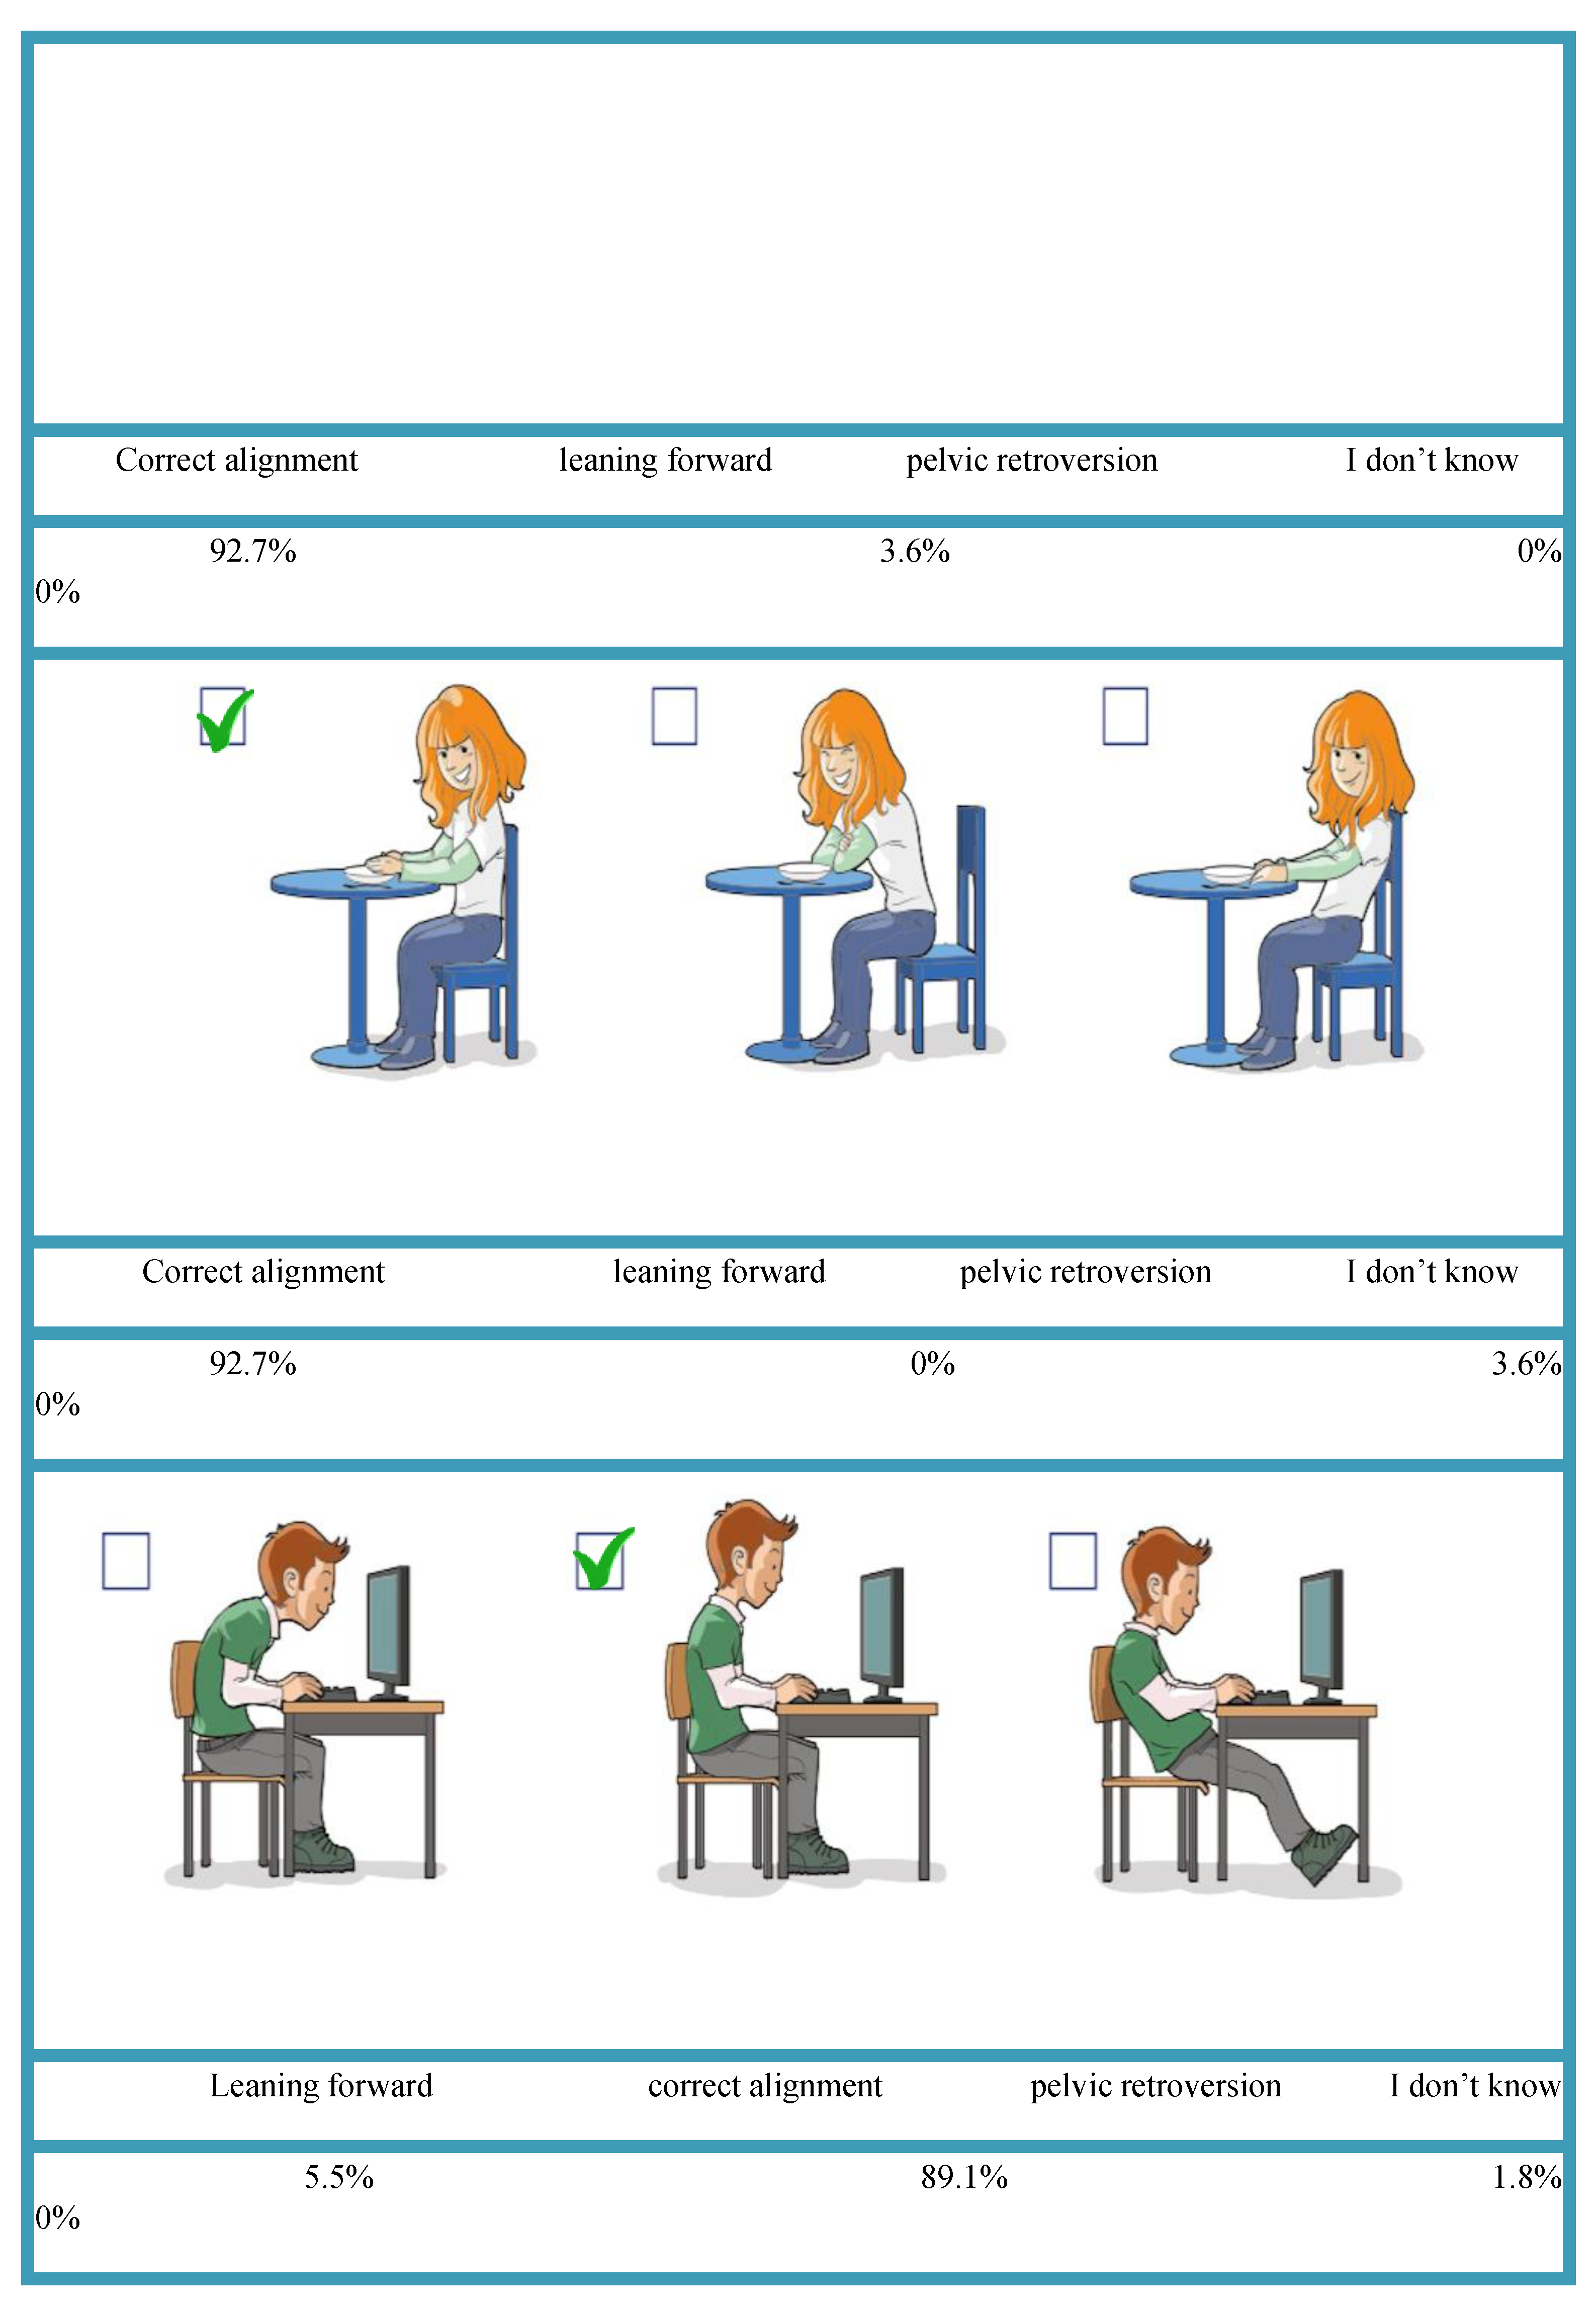
Figure 4.
Overall scores of participants’ knowledge.
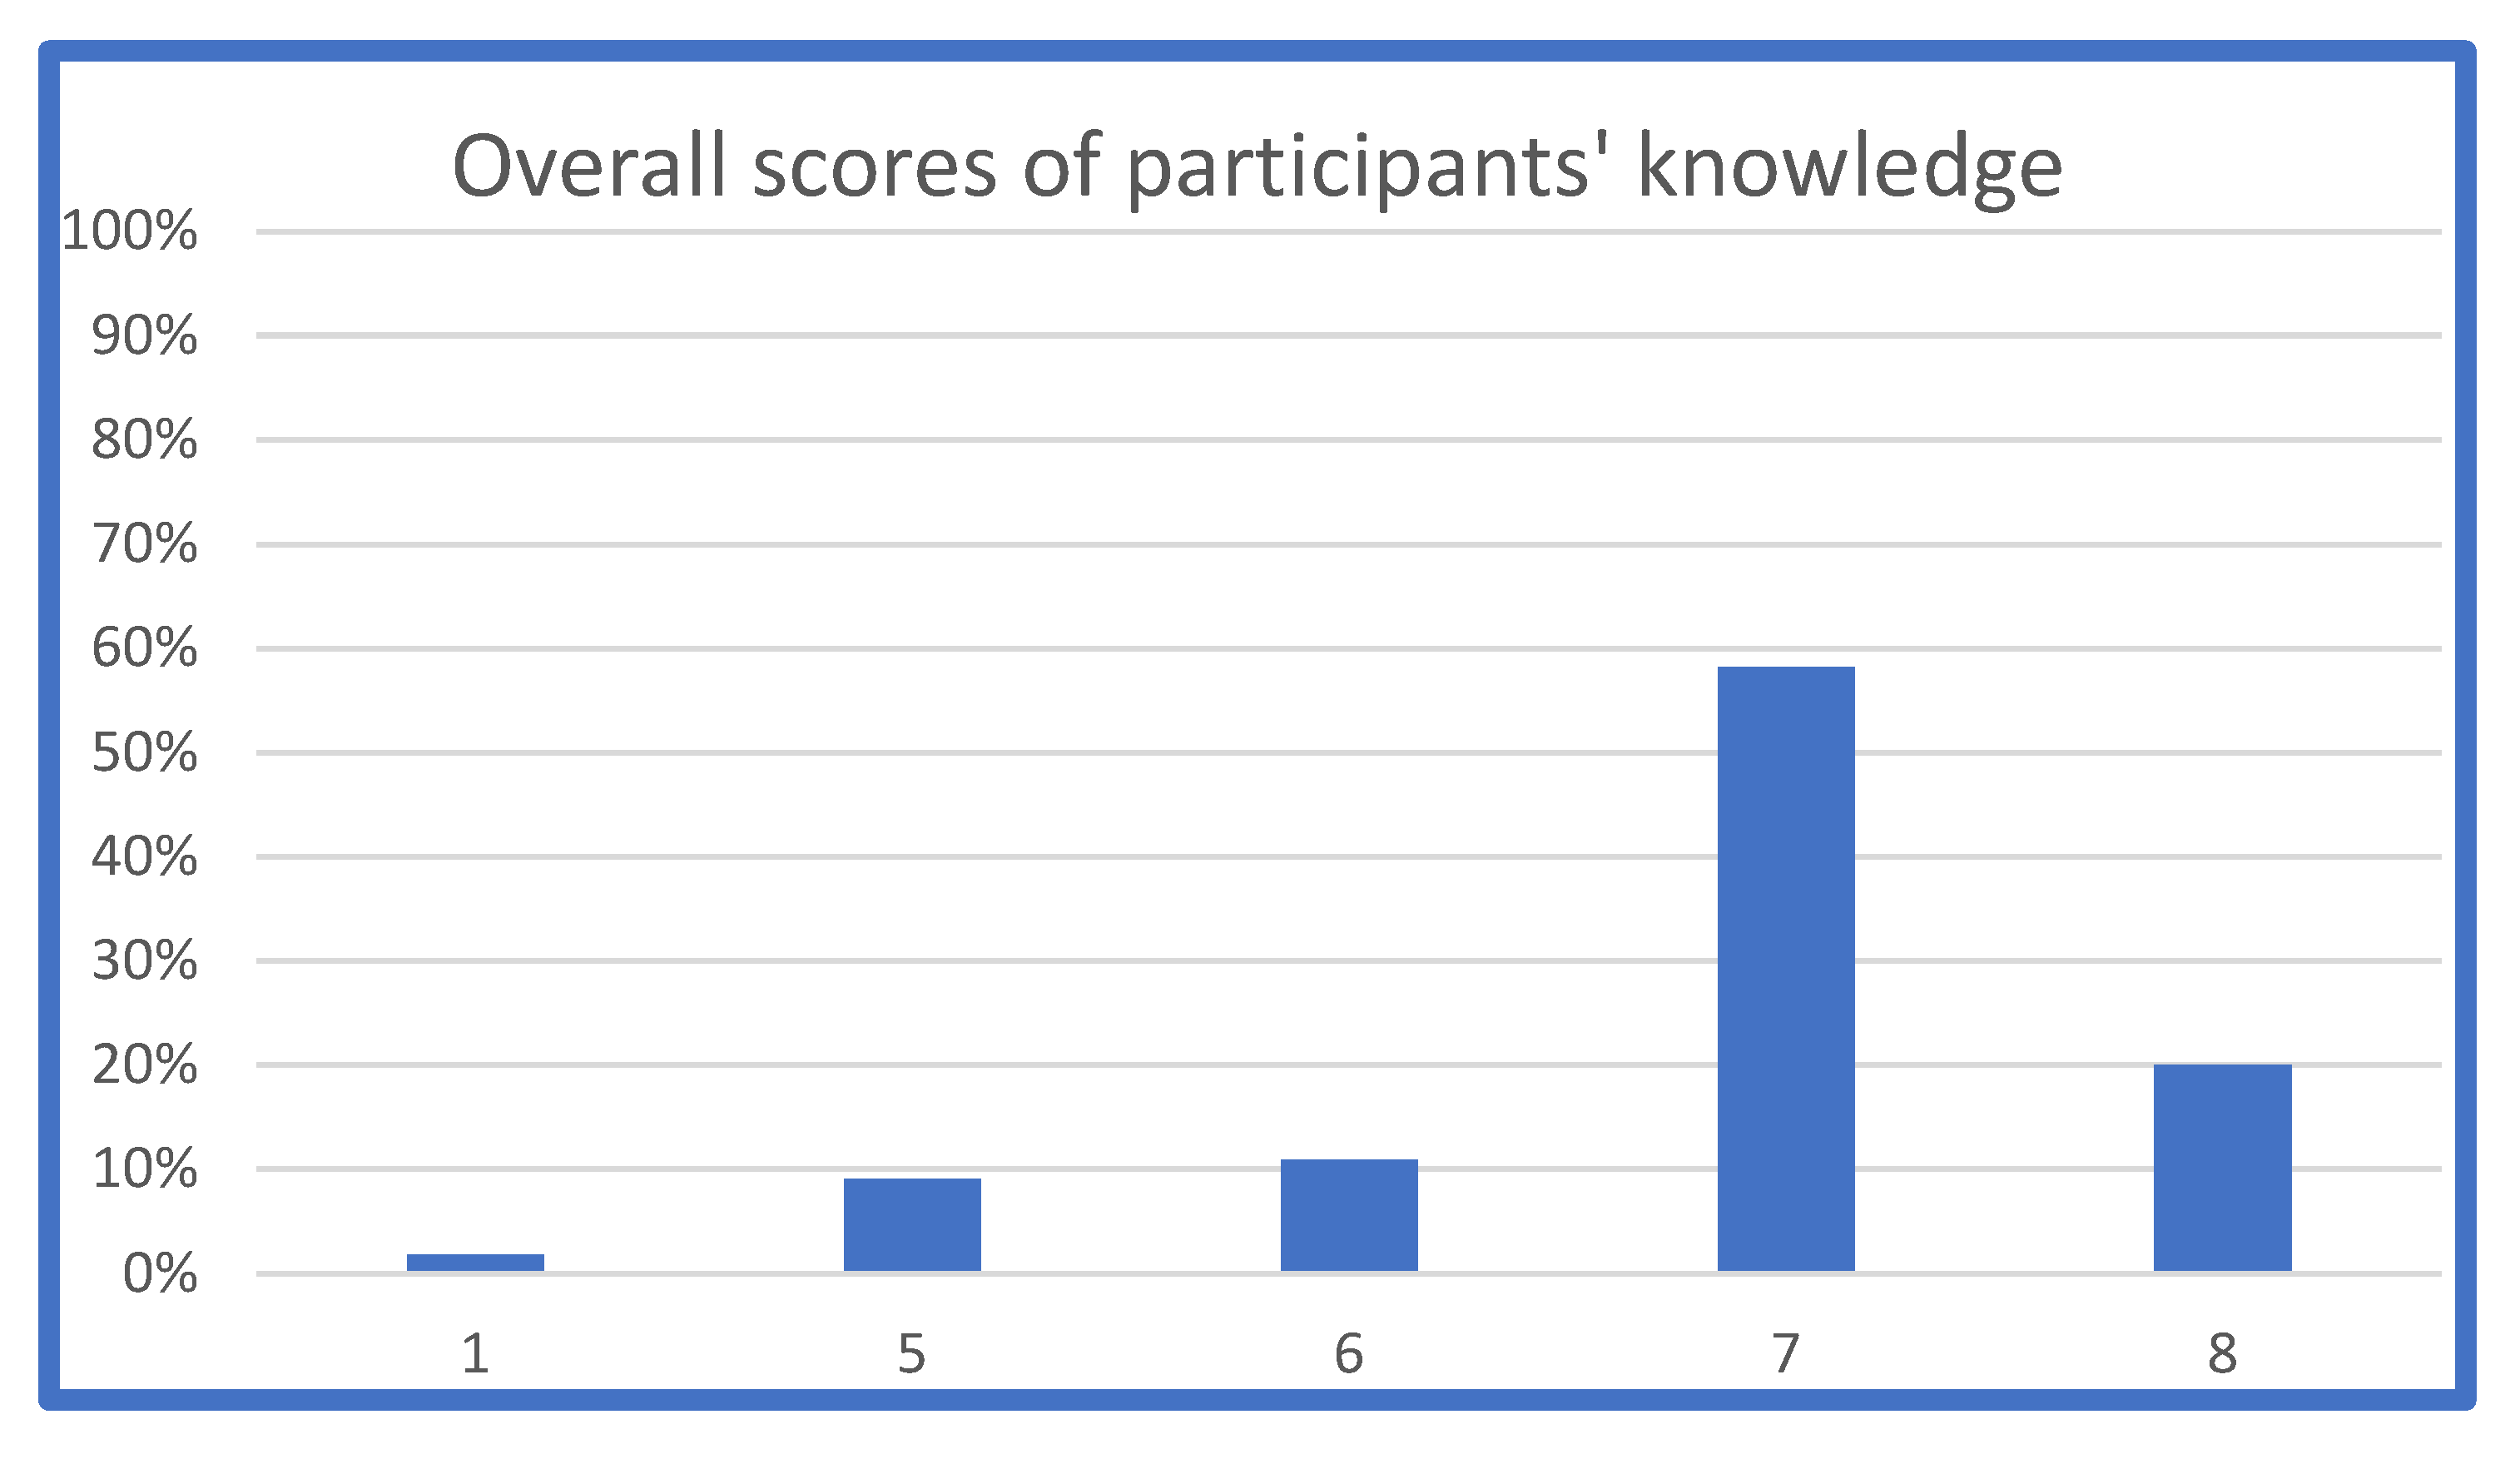
Figure 5.
Distribution of the overall knowledge scores.
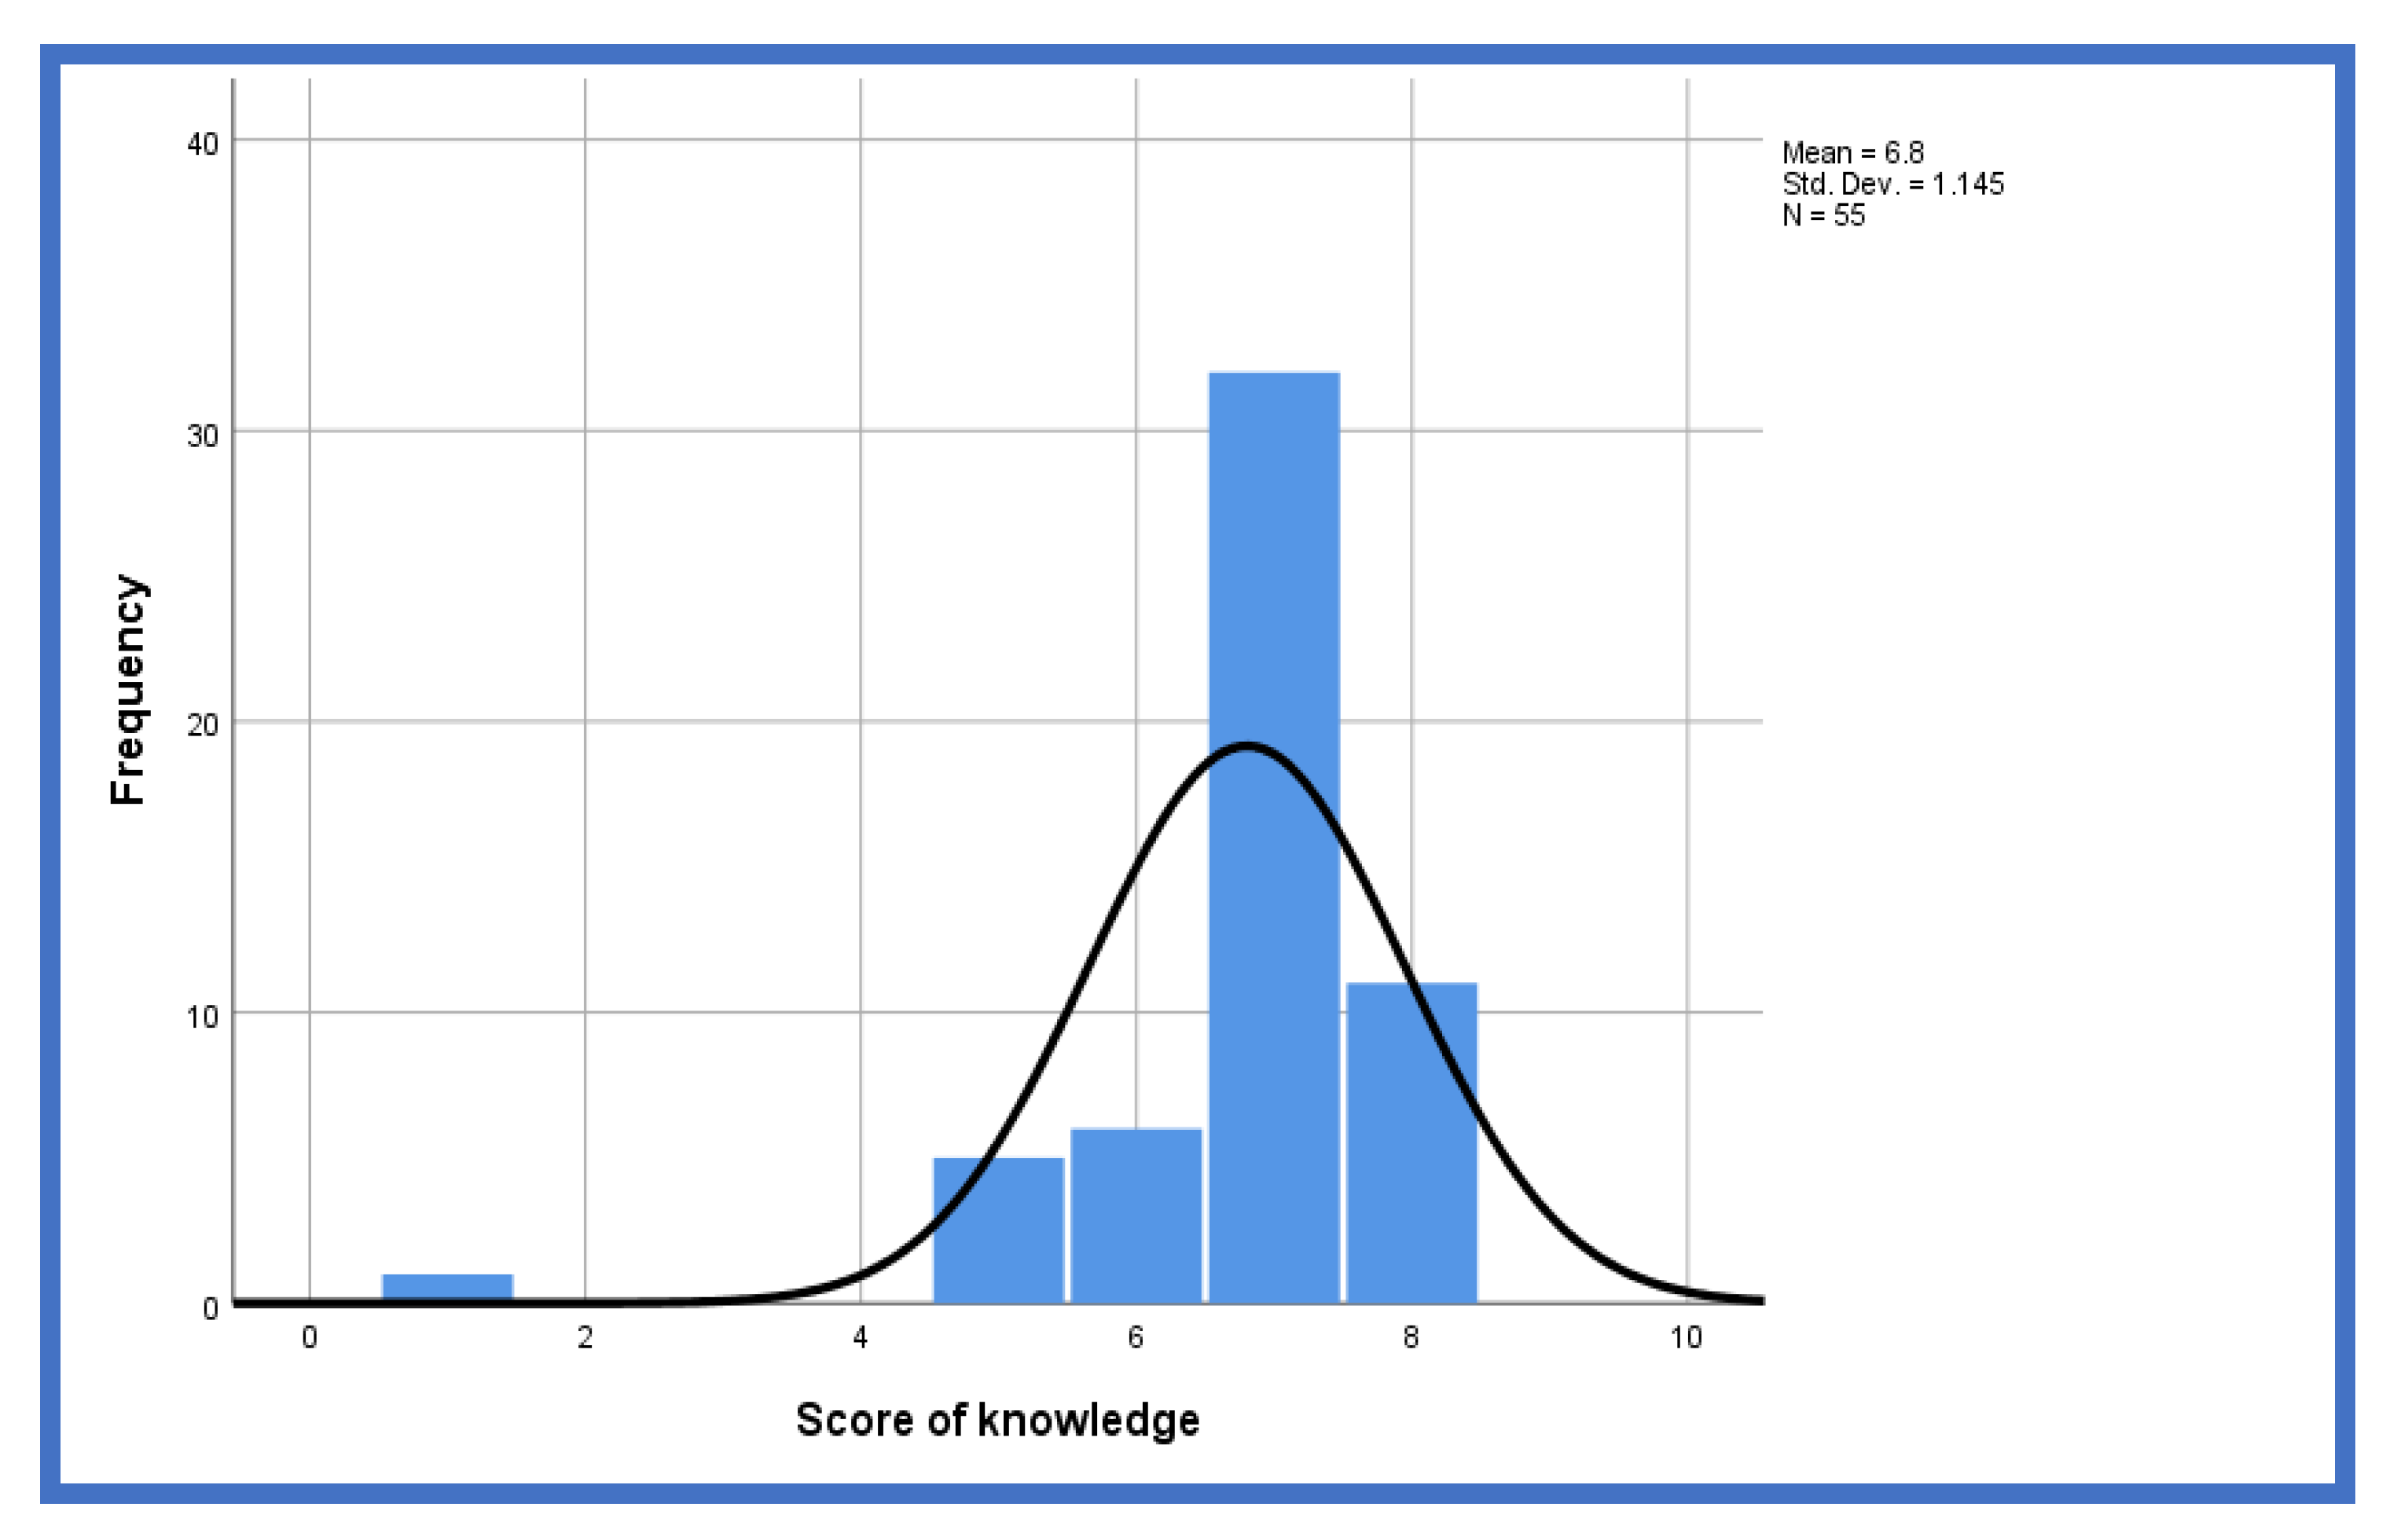
Figure 6.
Participants’ postural behaviour.
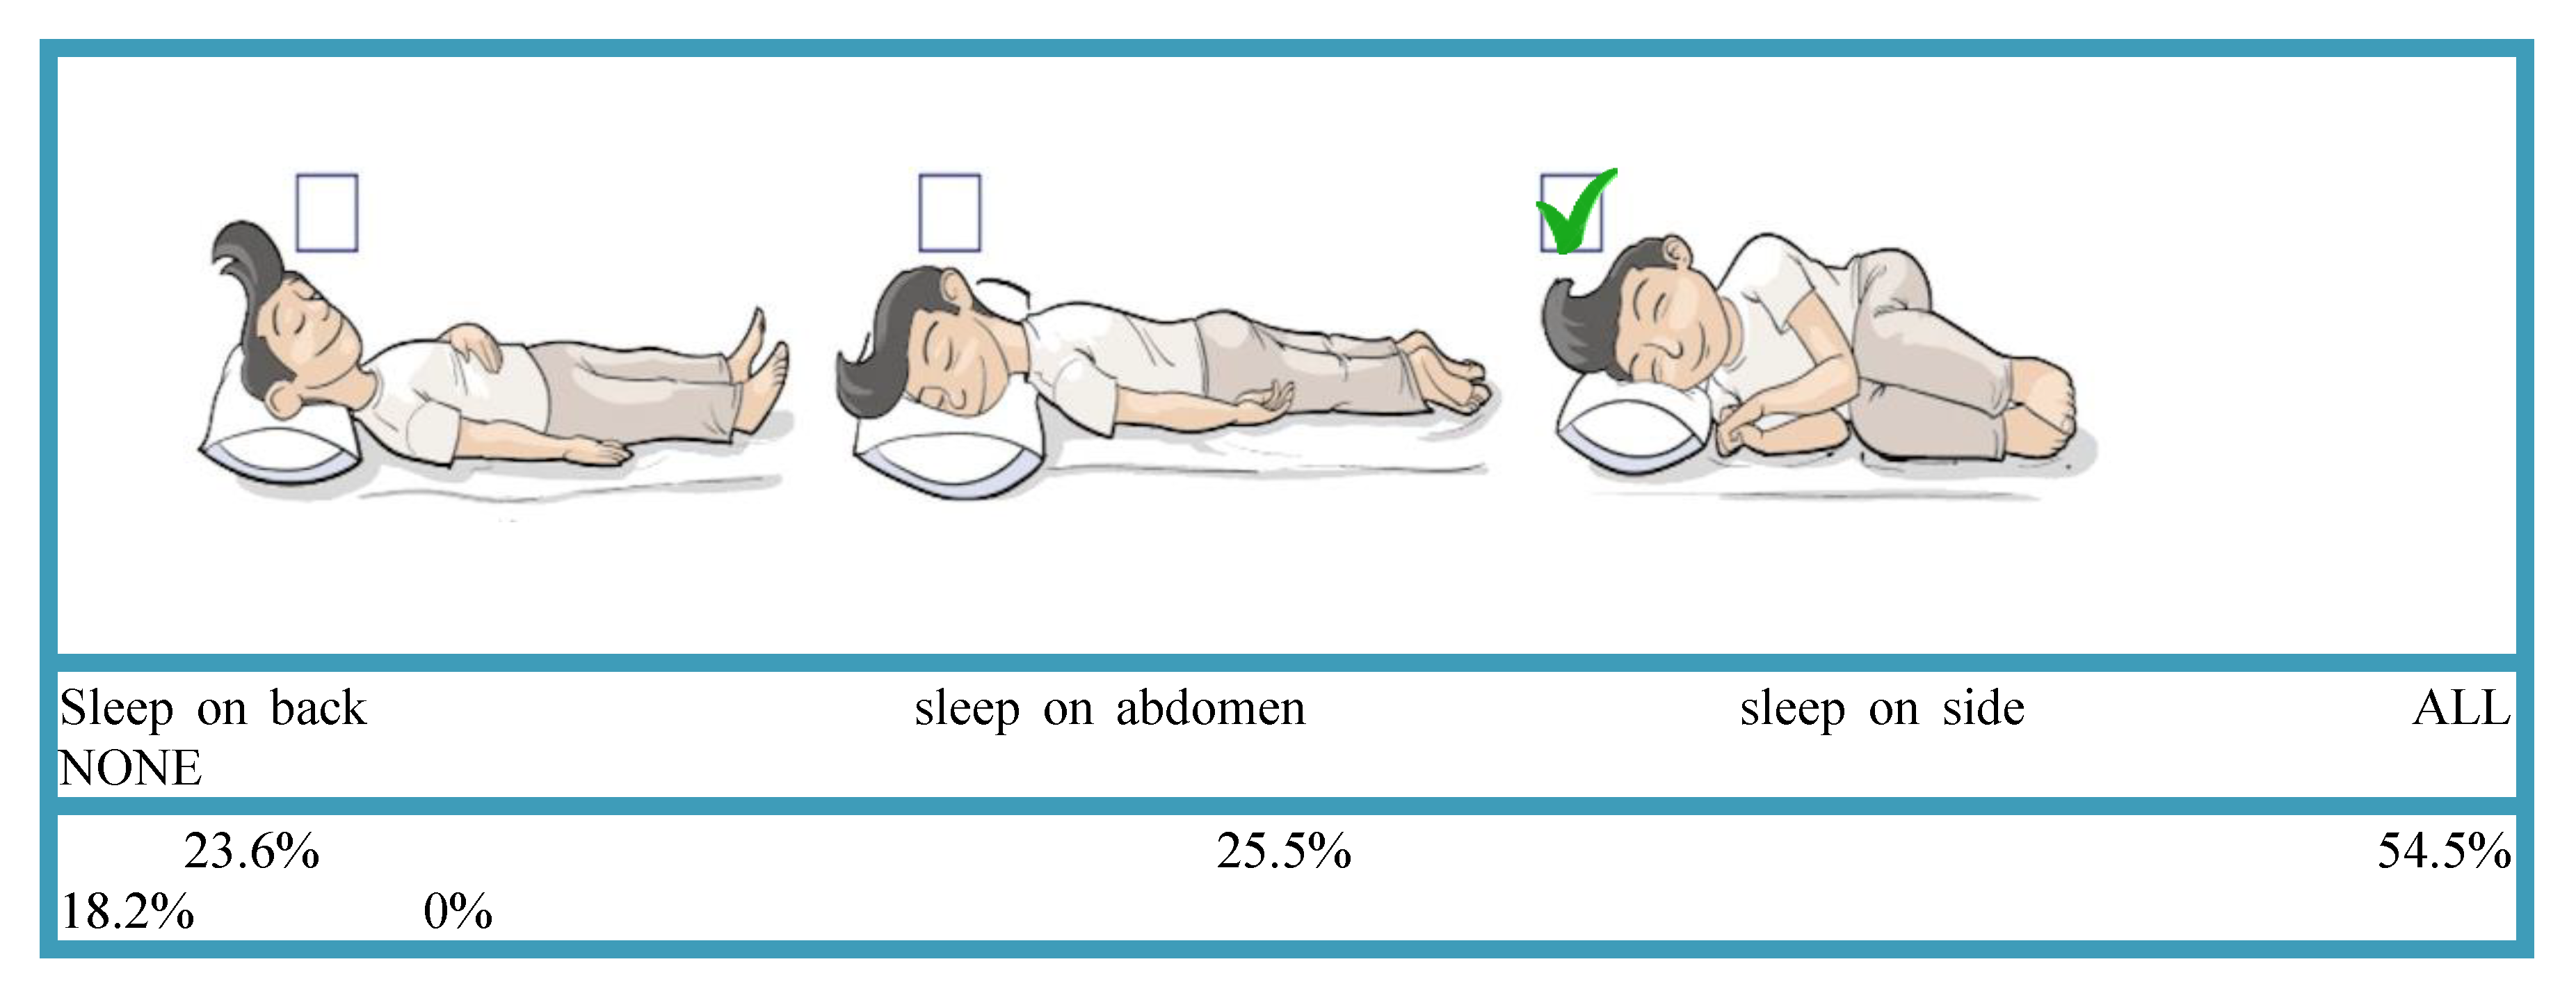
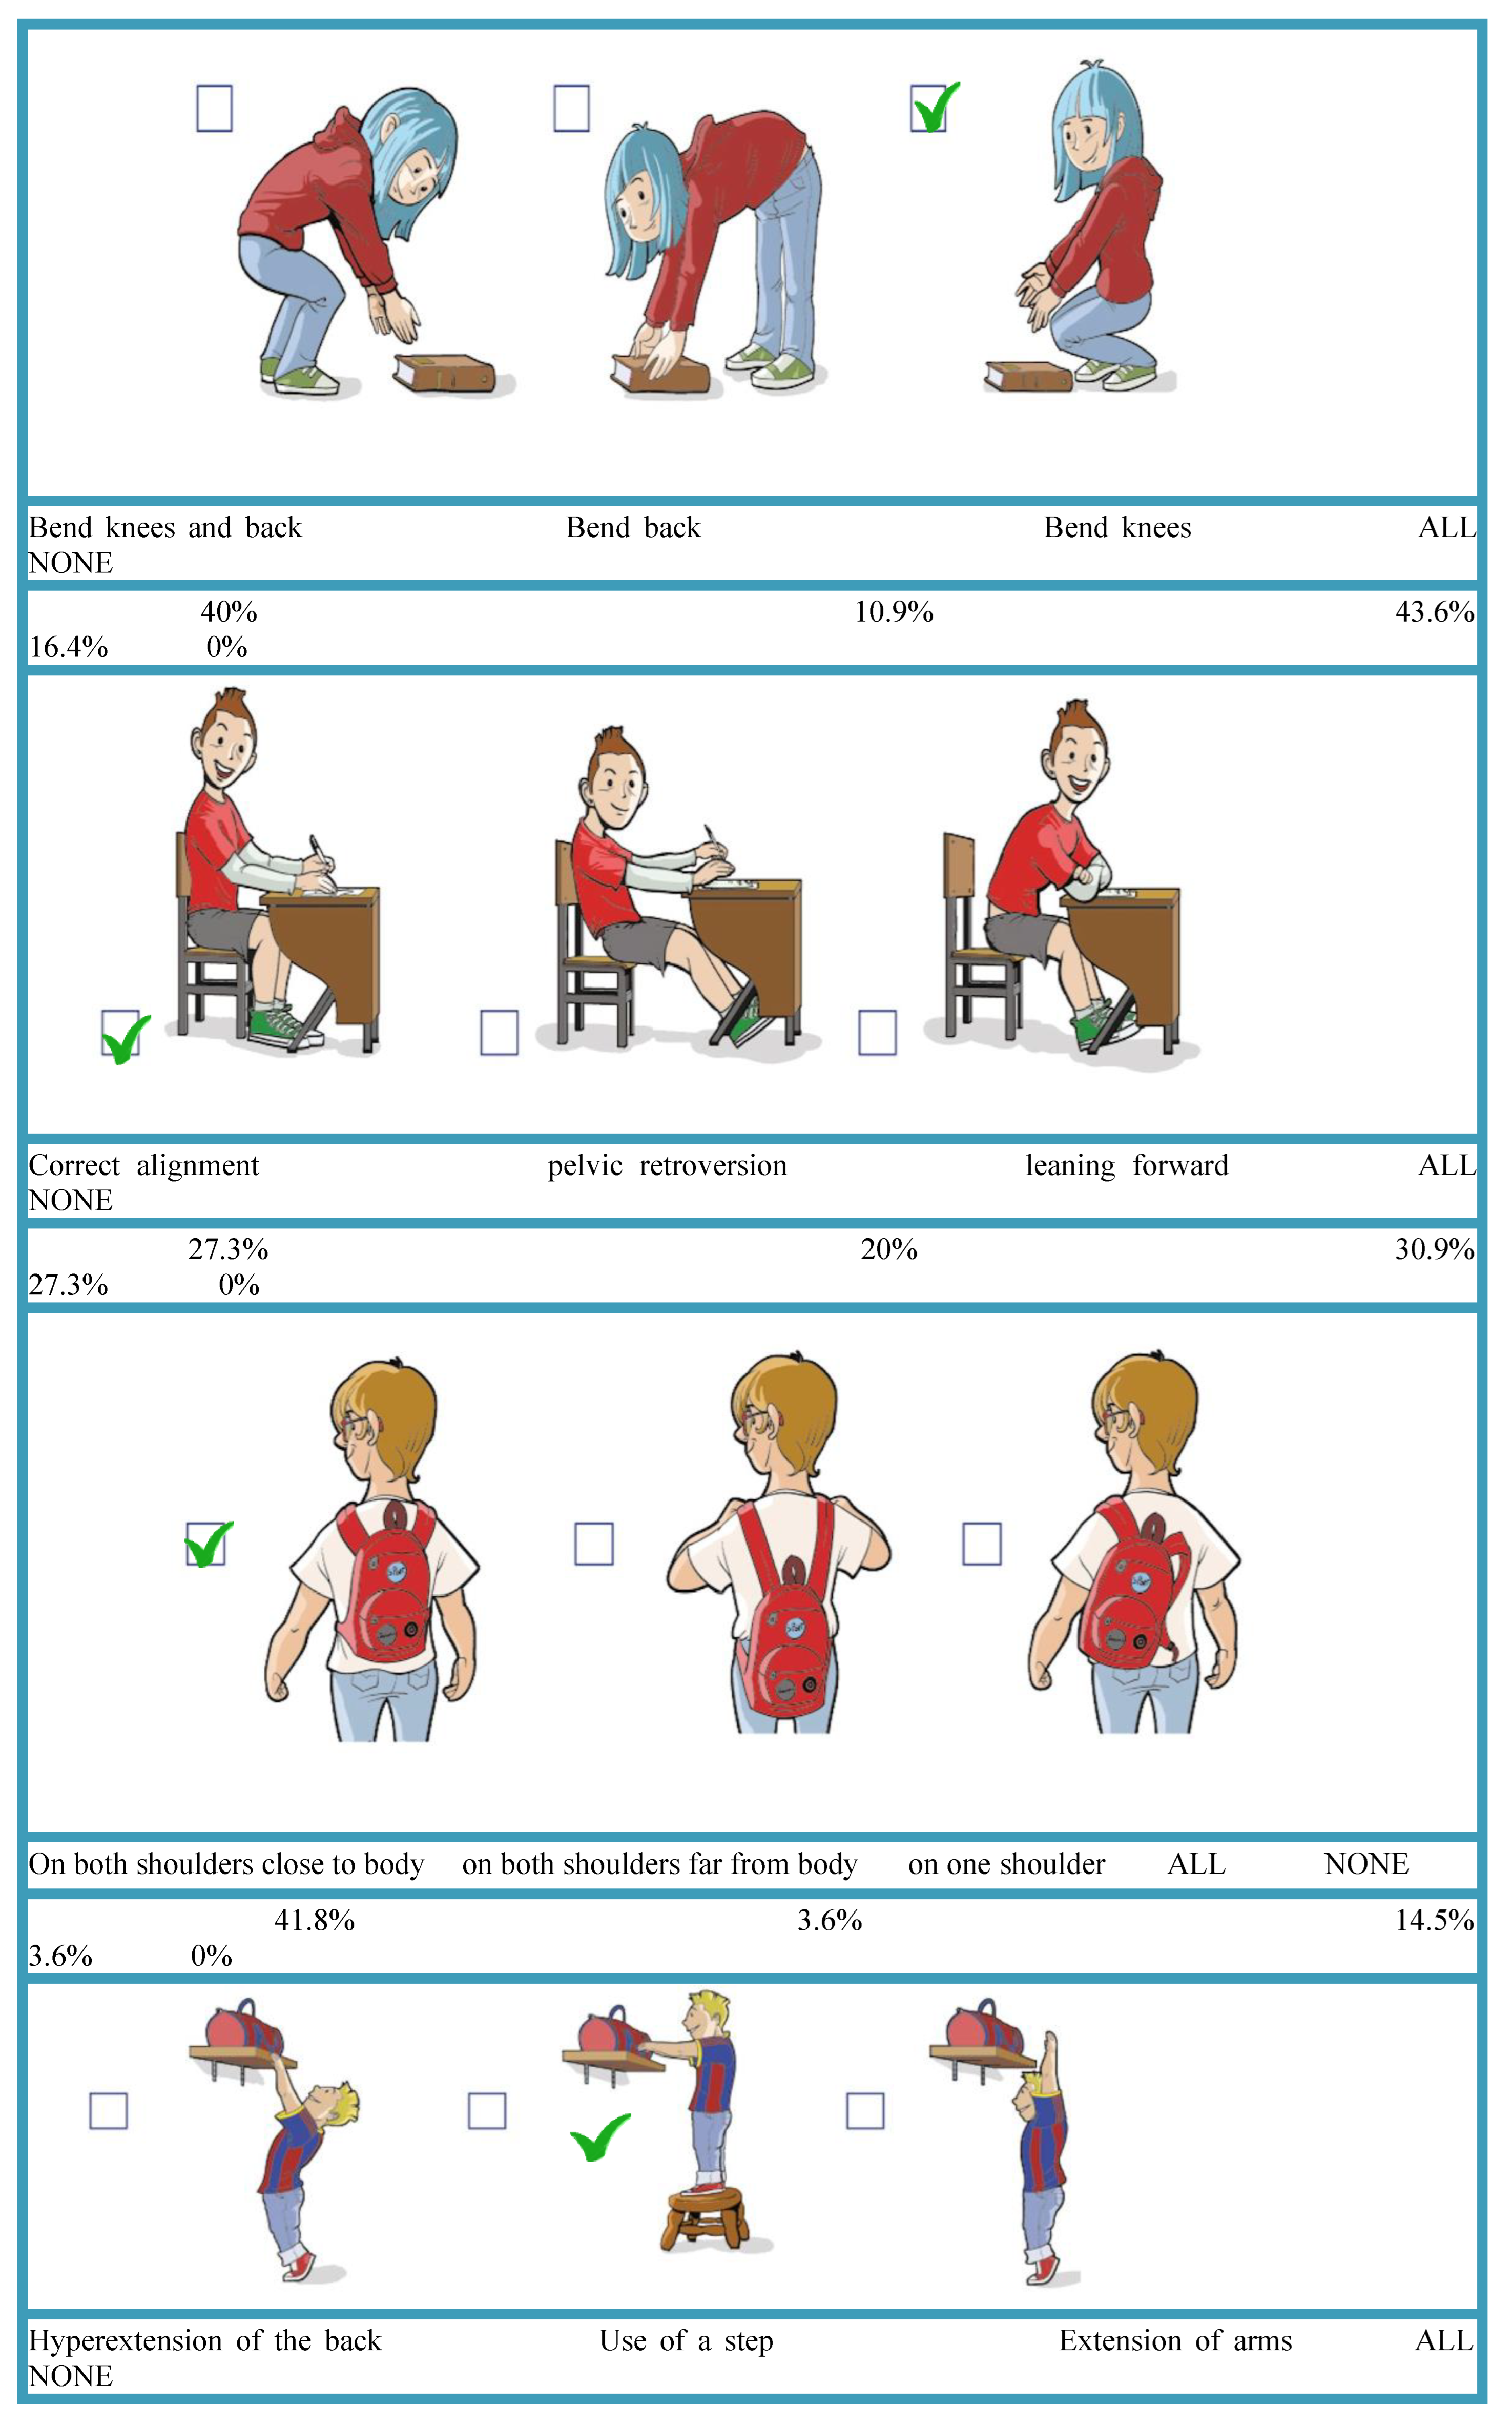
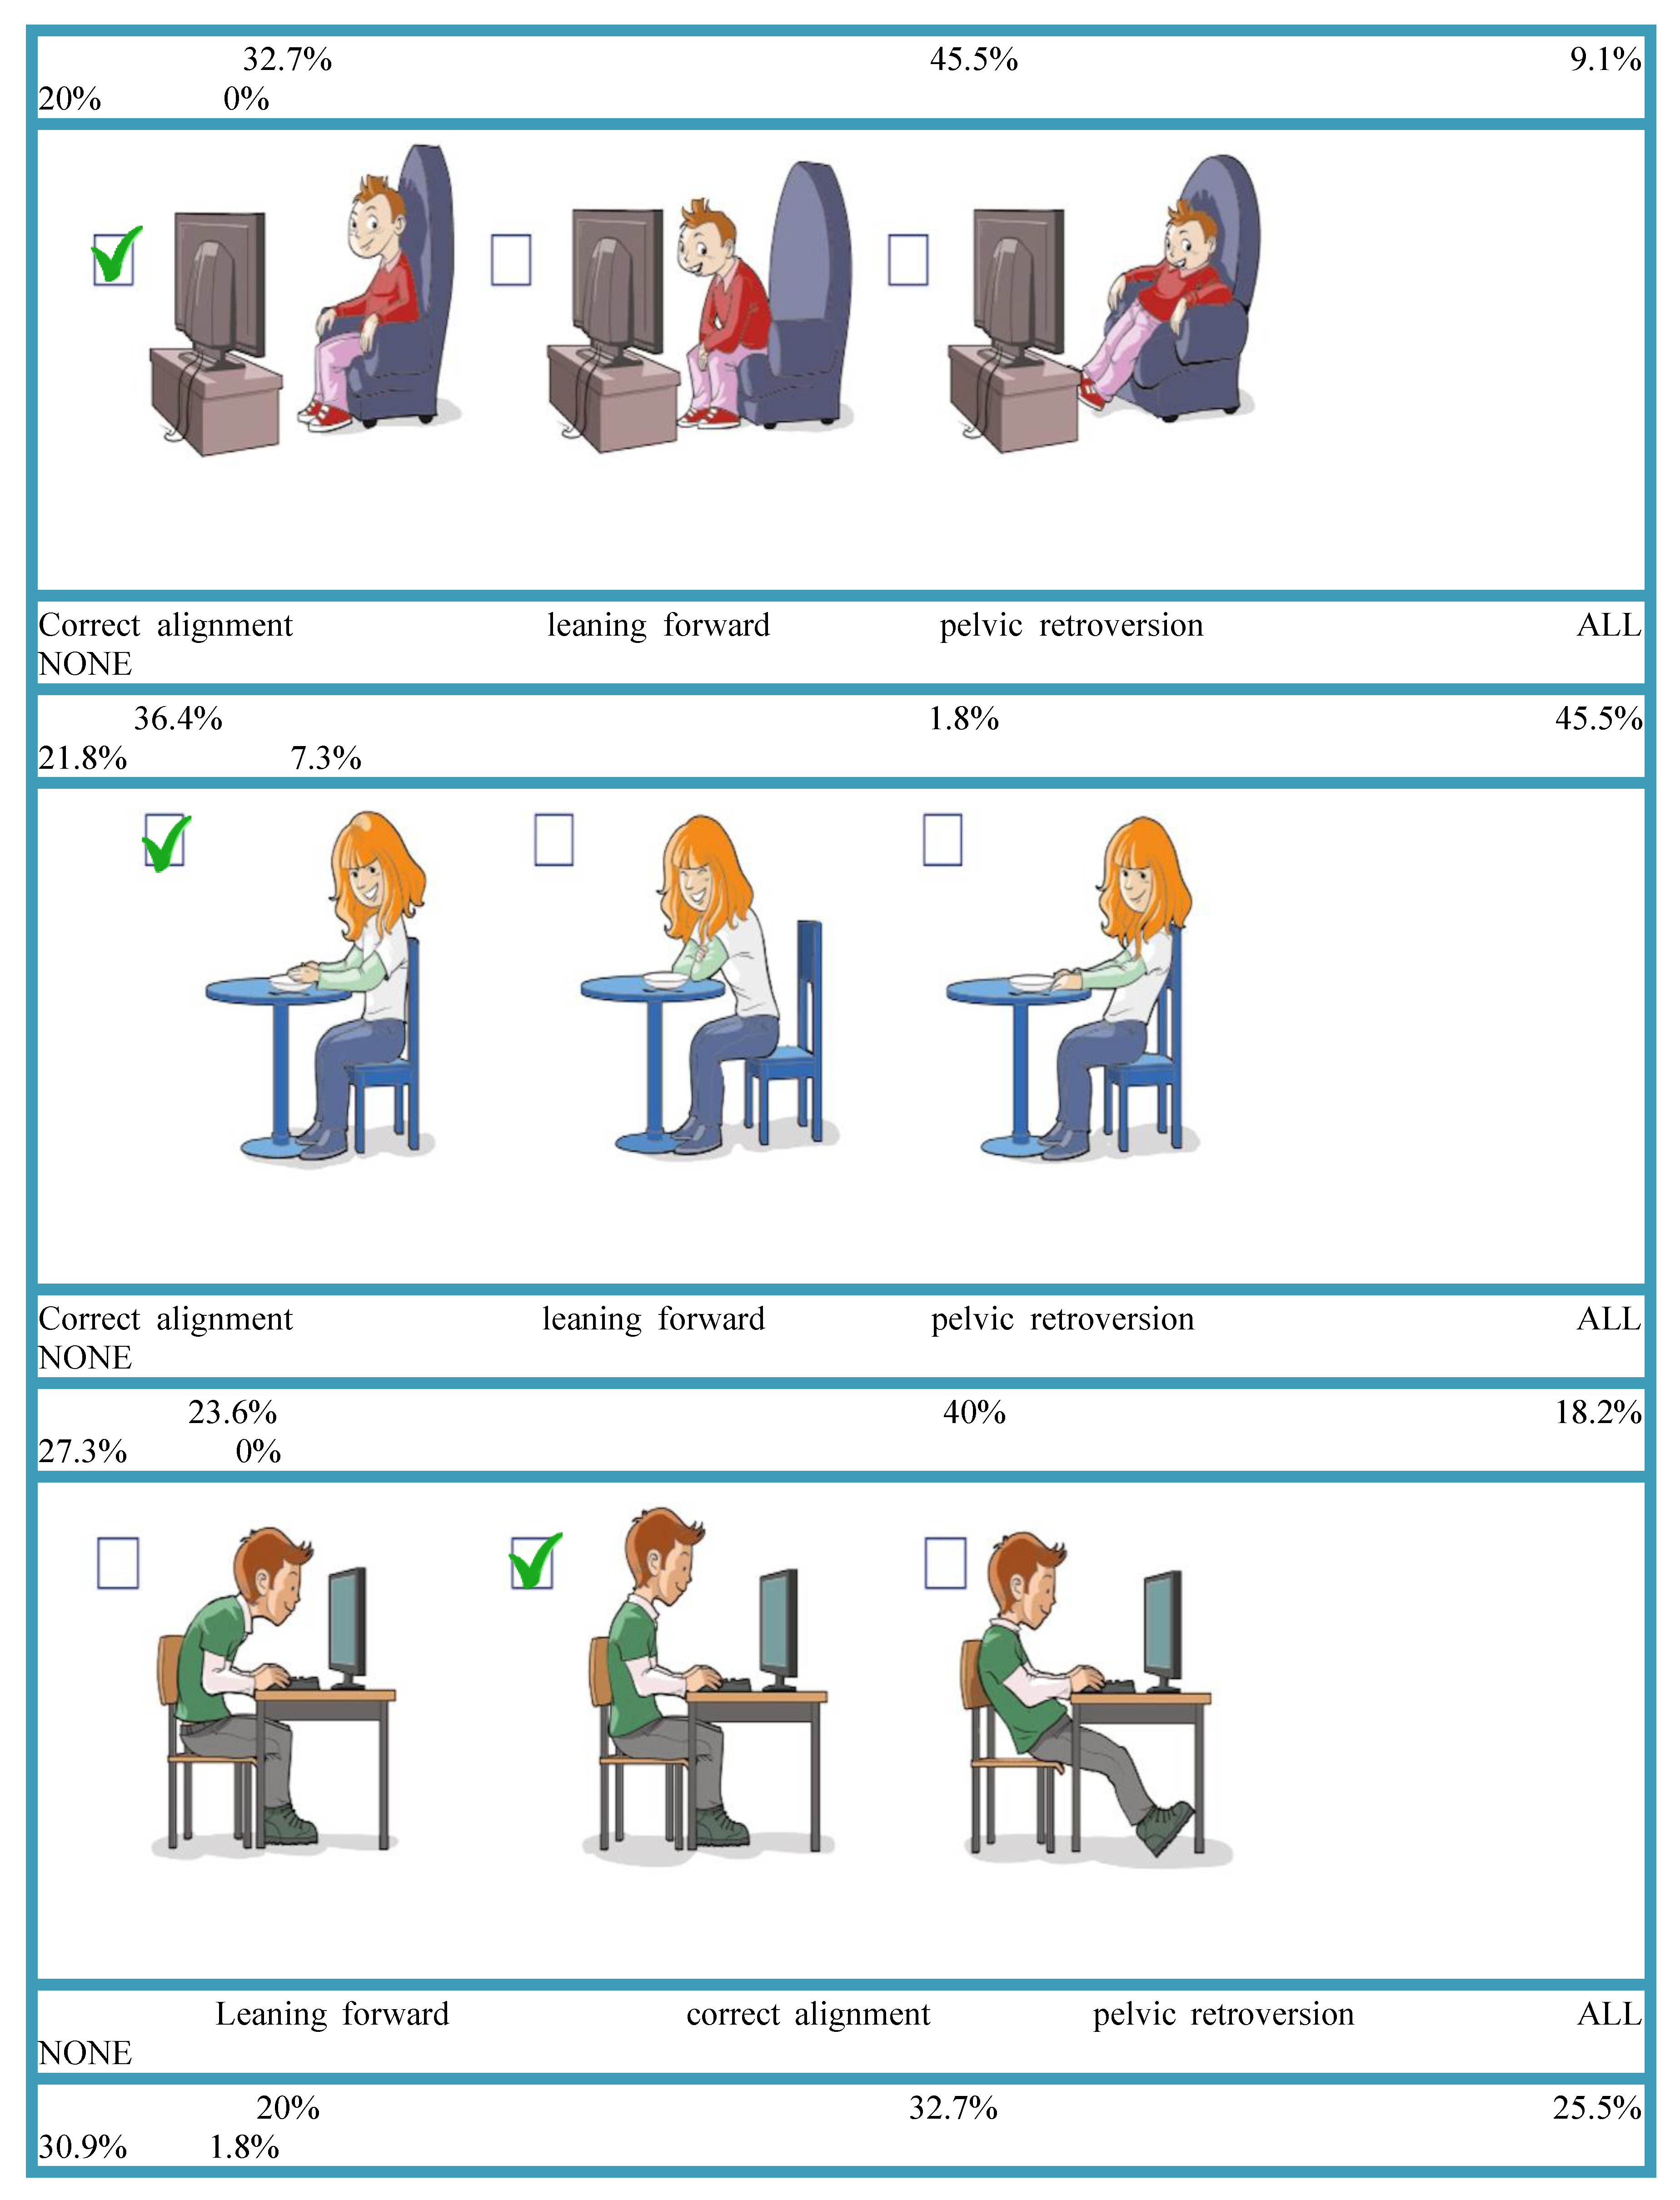
Figure 7.
Overall scores of postural behaviour (participants who carried backpack).
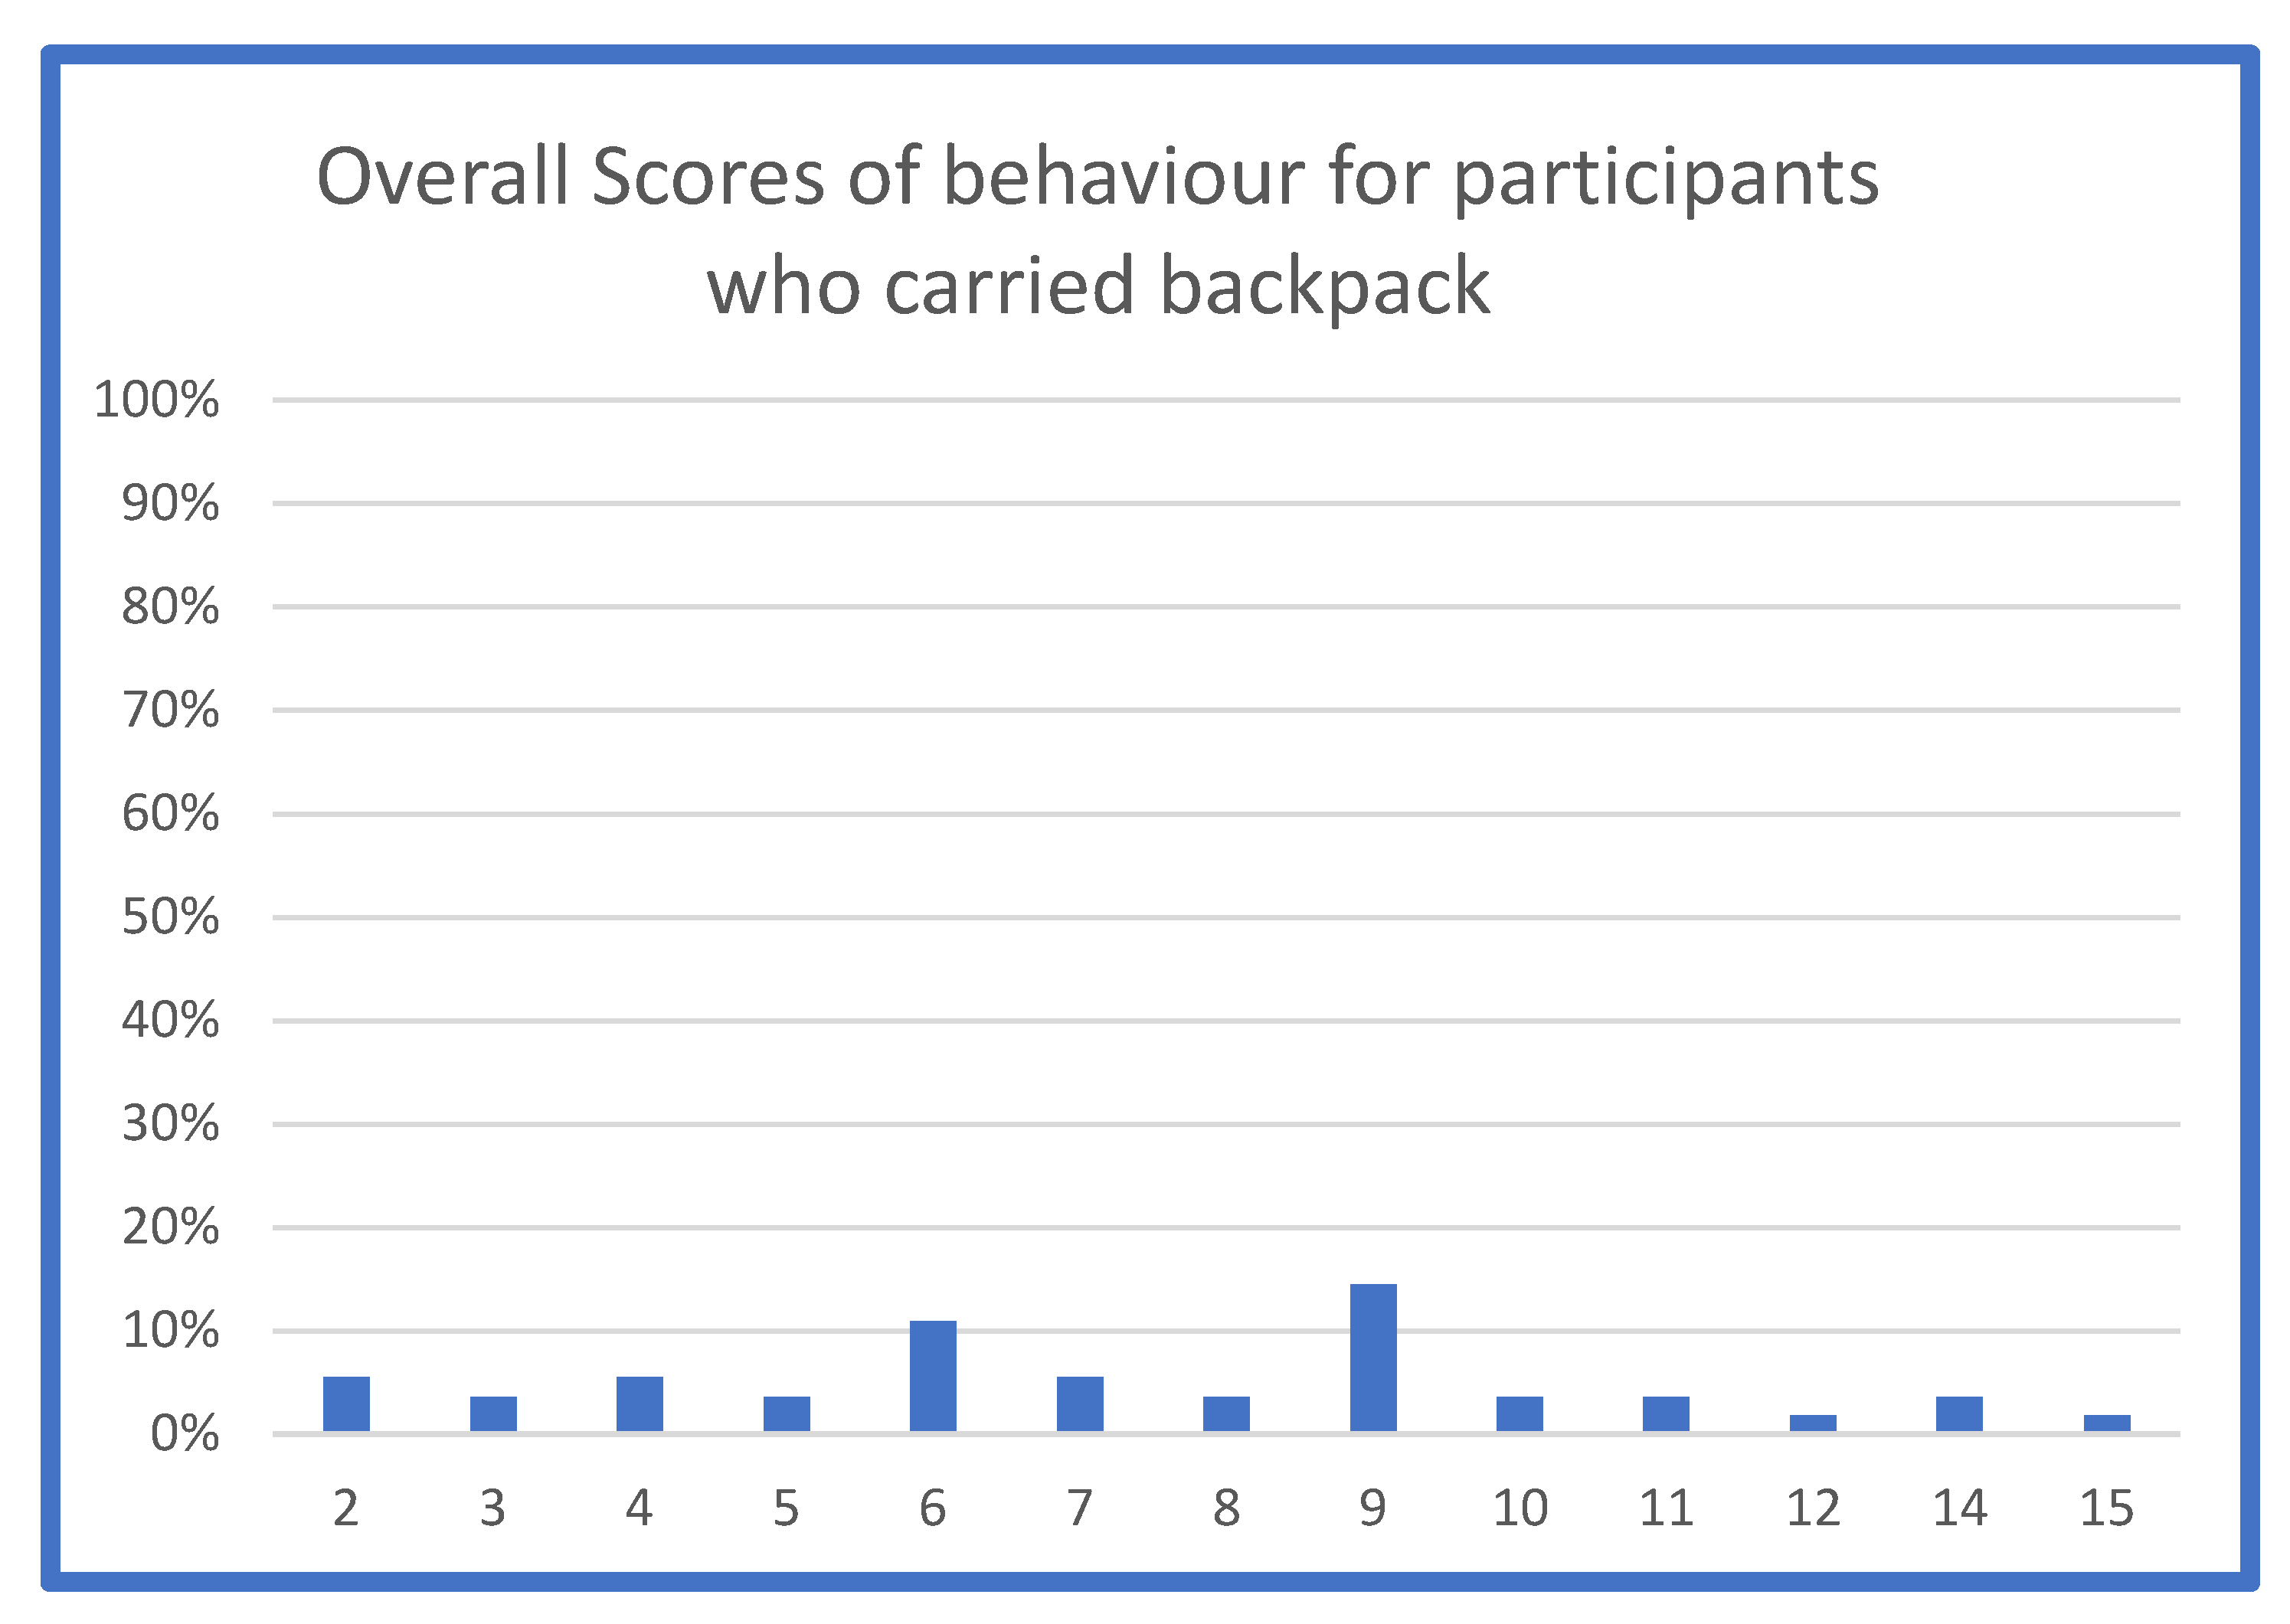
Figure 8.
Overall scores of postural behaviour (participants who did not carry backpack).
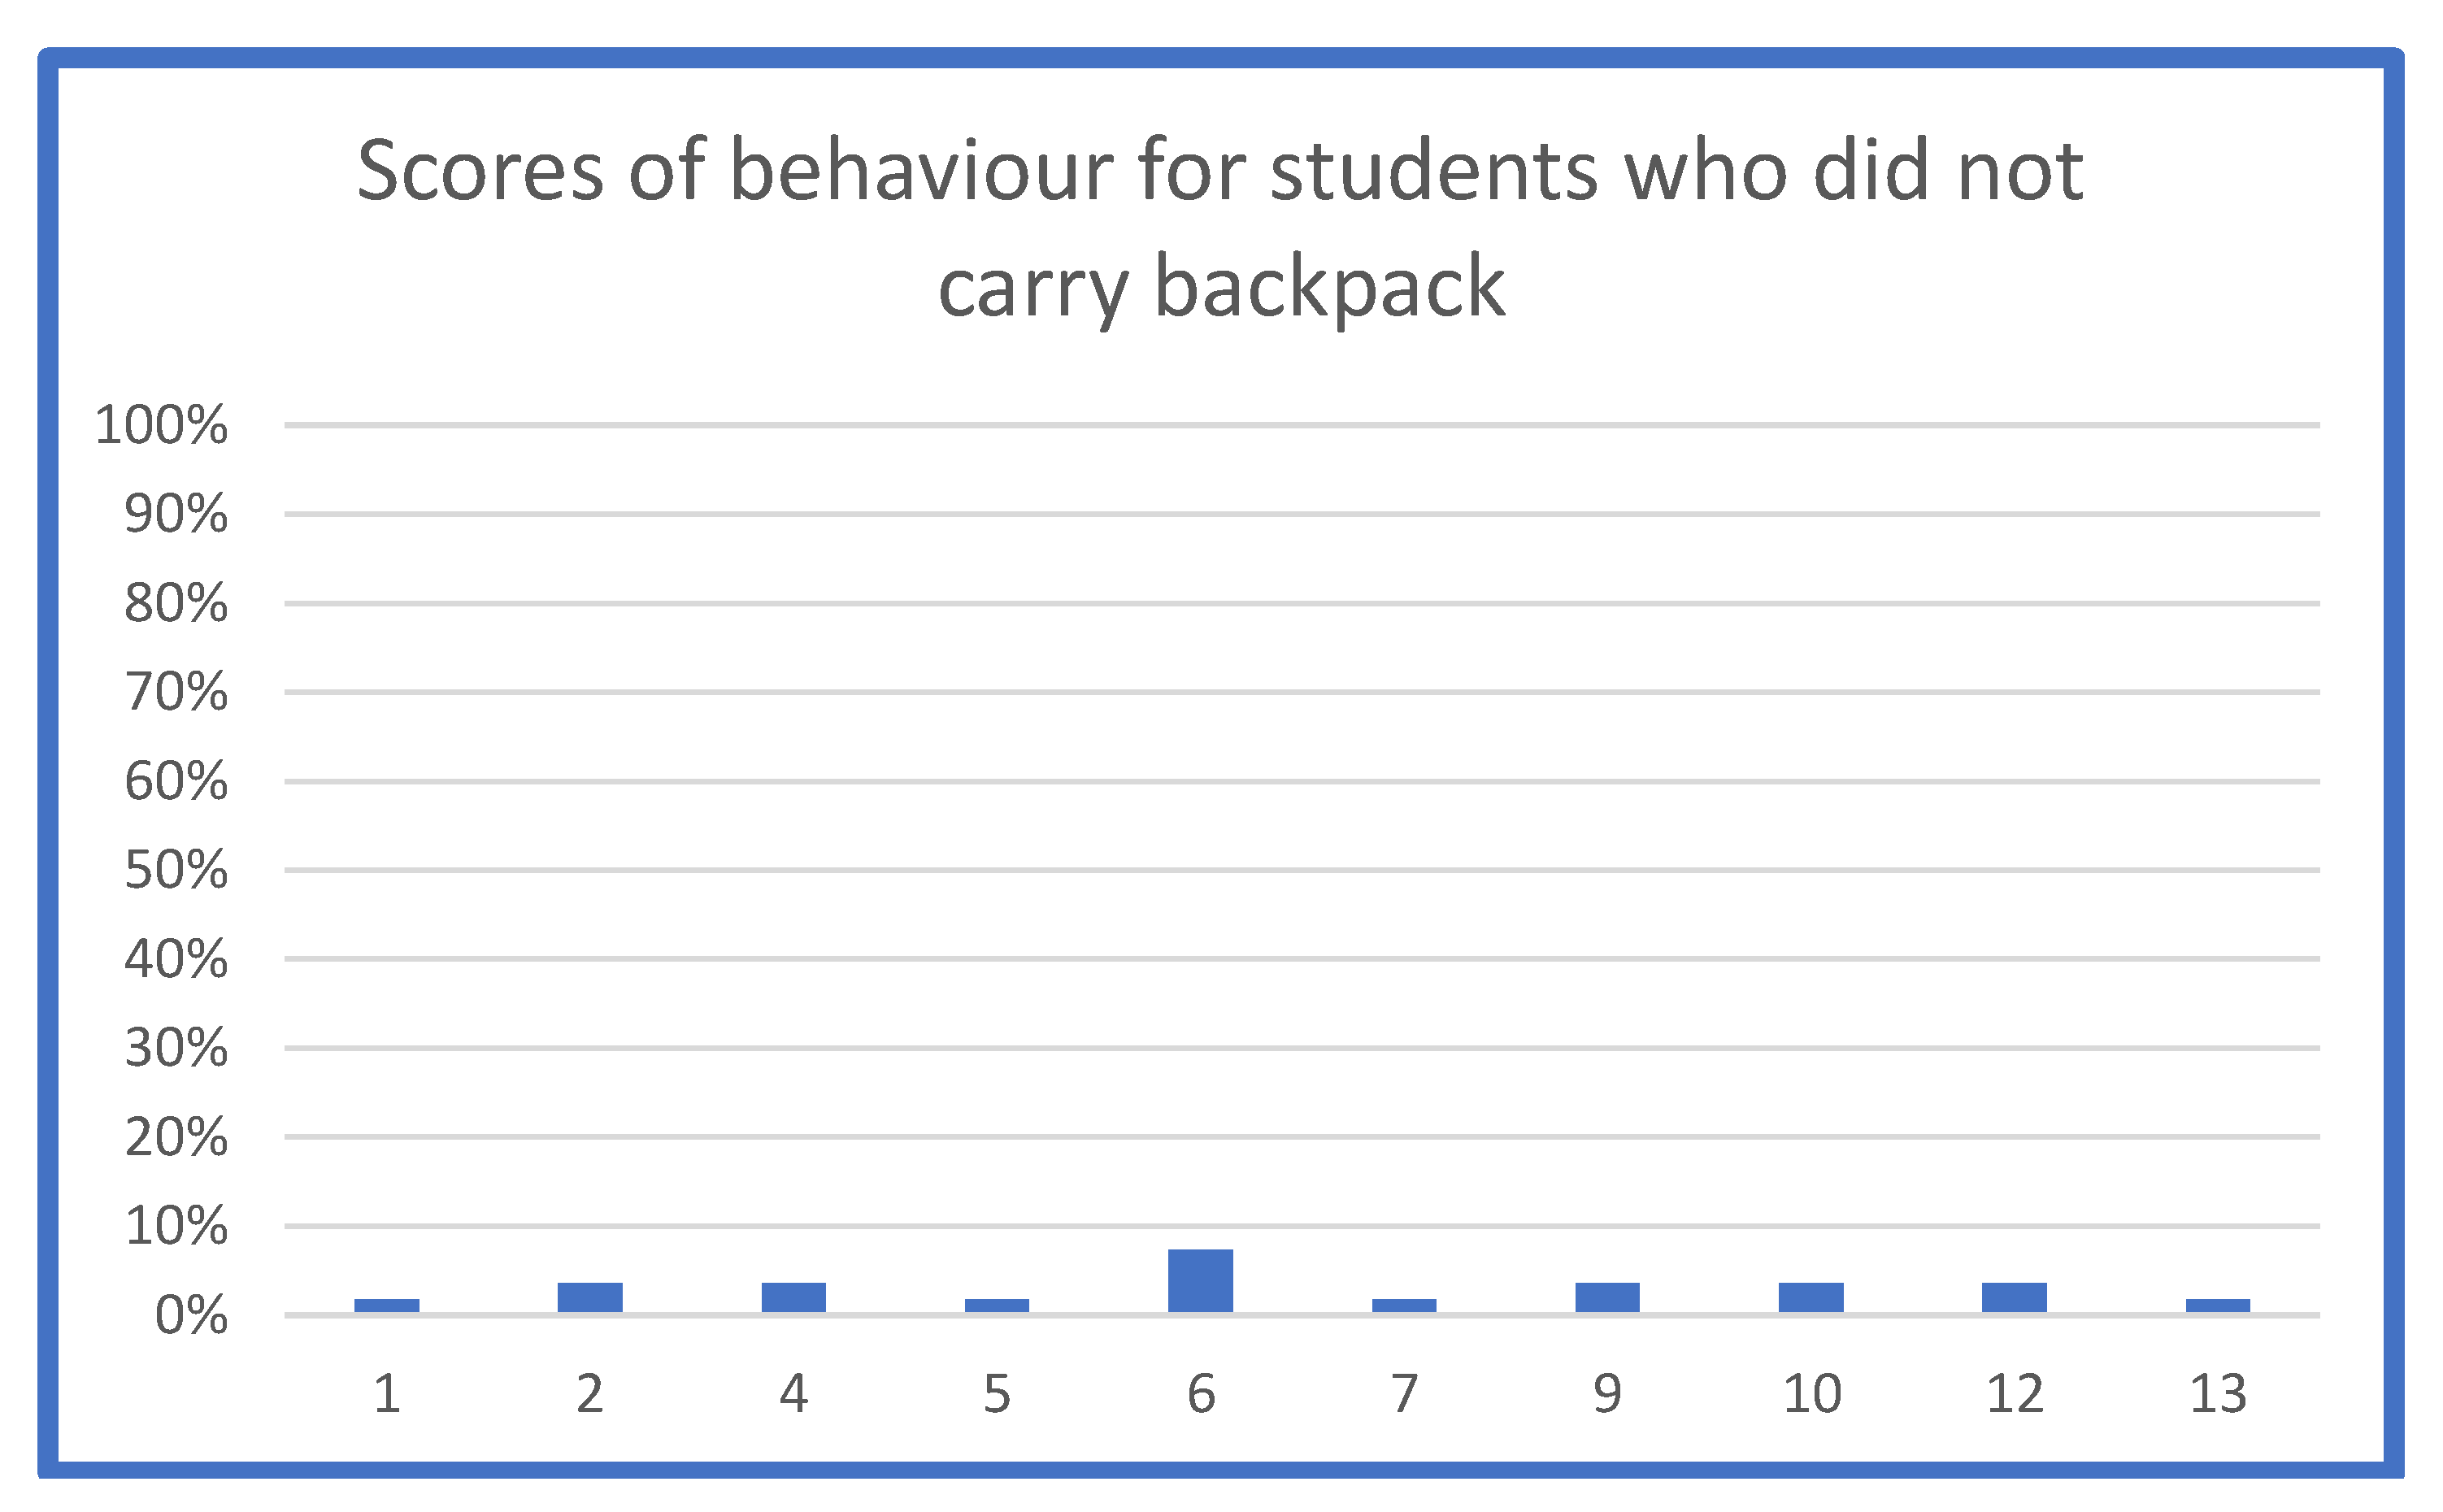
Figure 9.
Distribution of scores of behaviour (students who carried backpack).
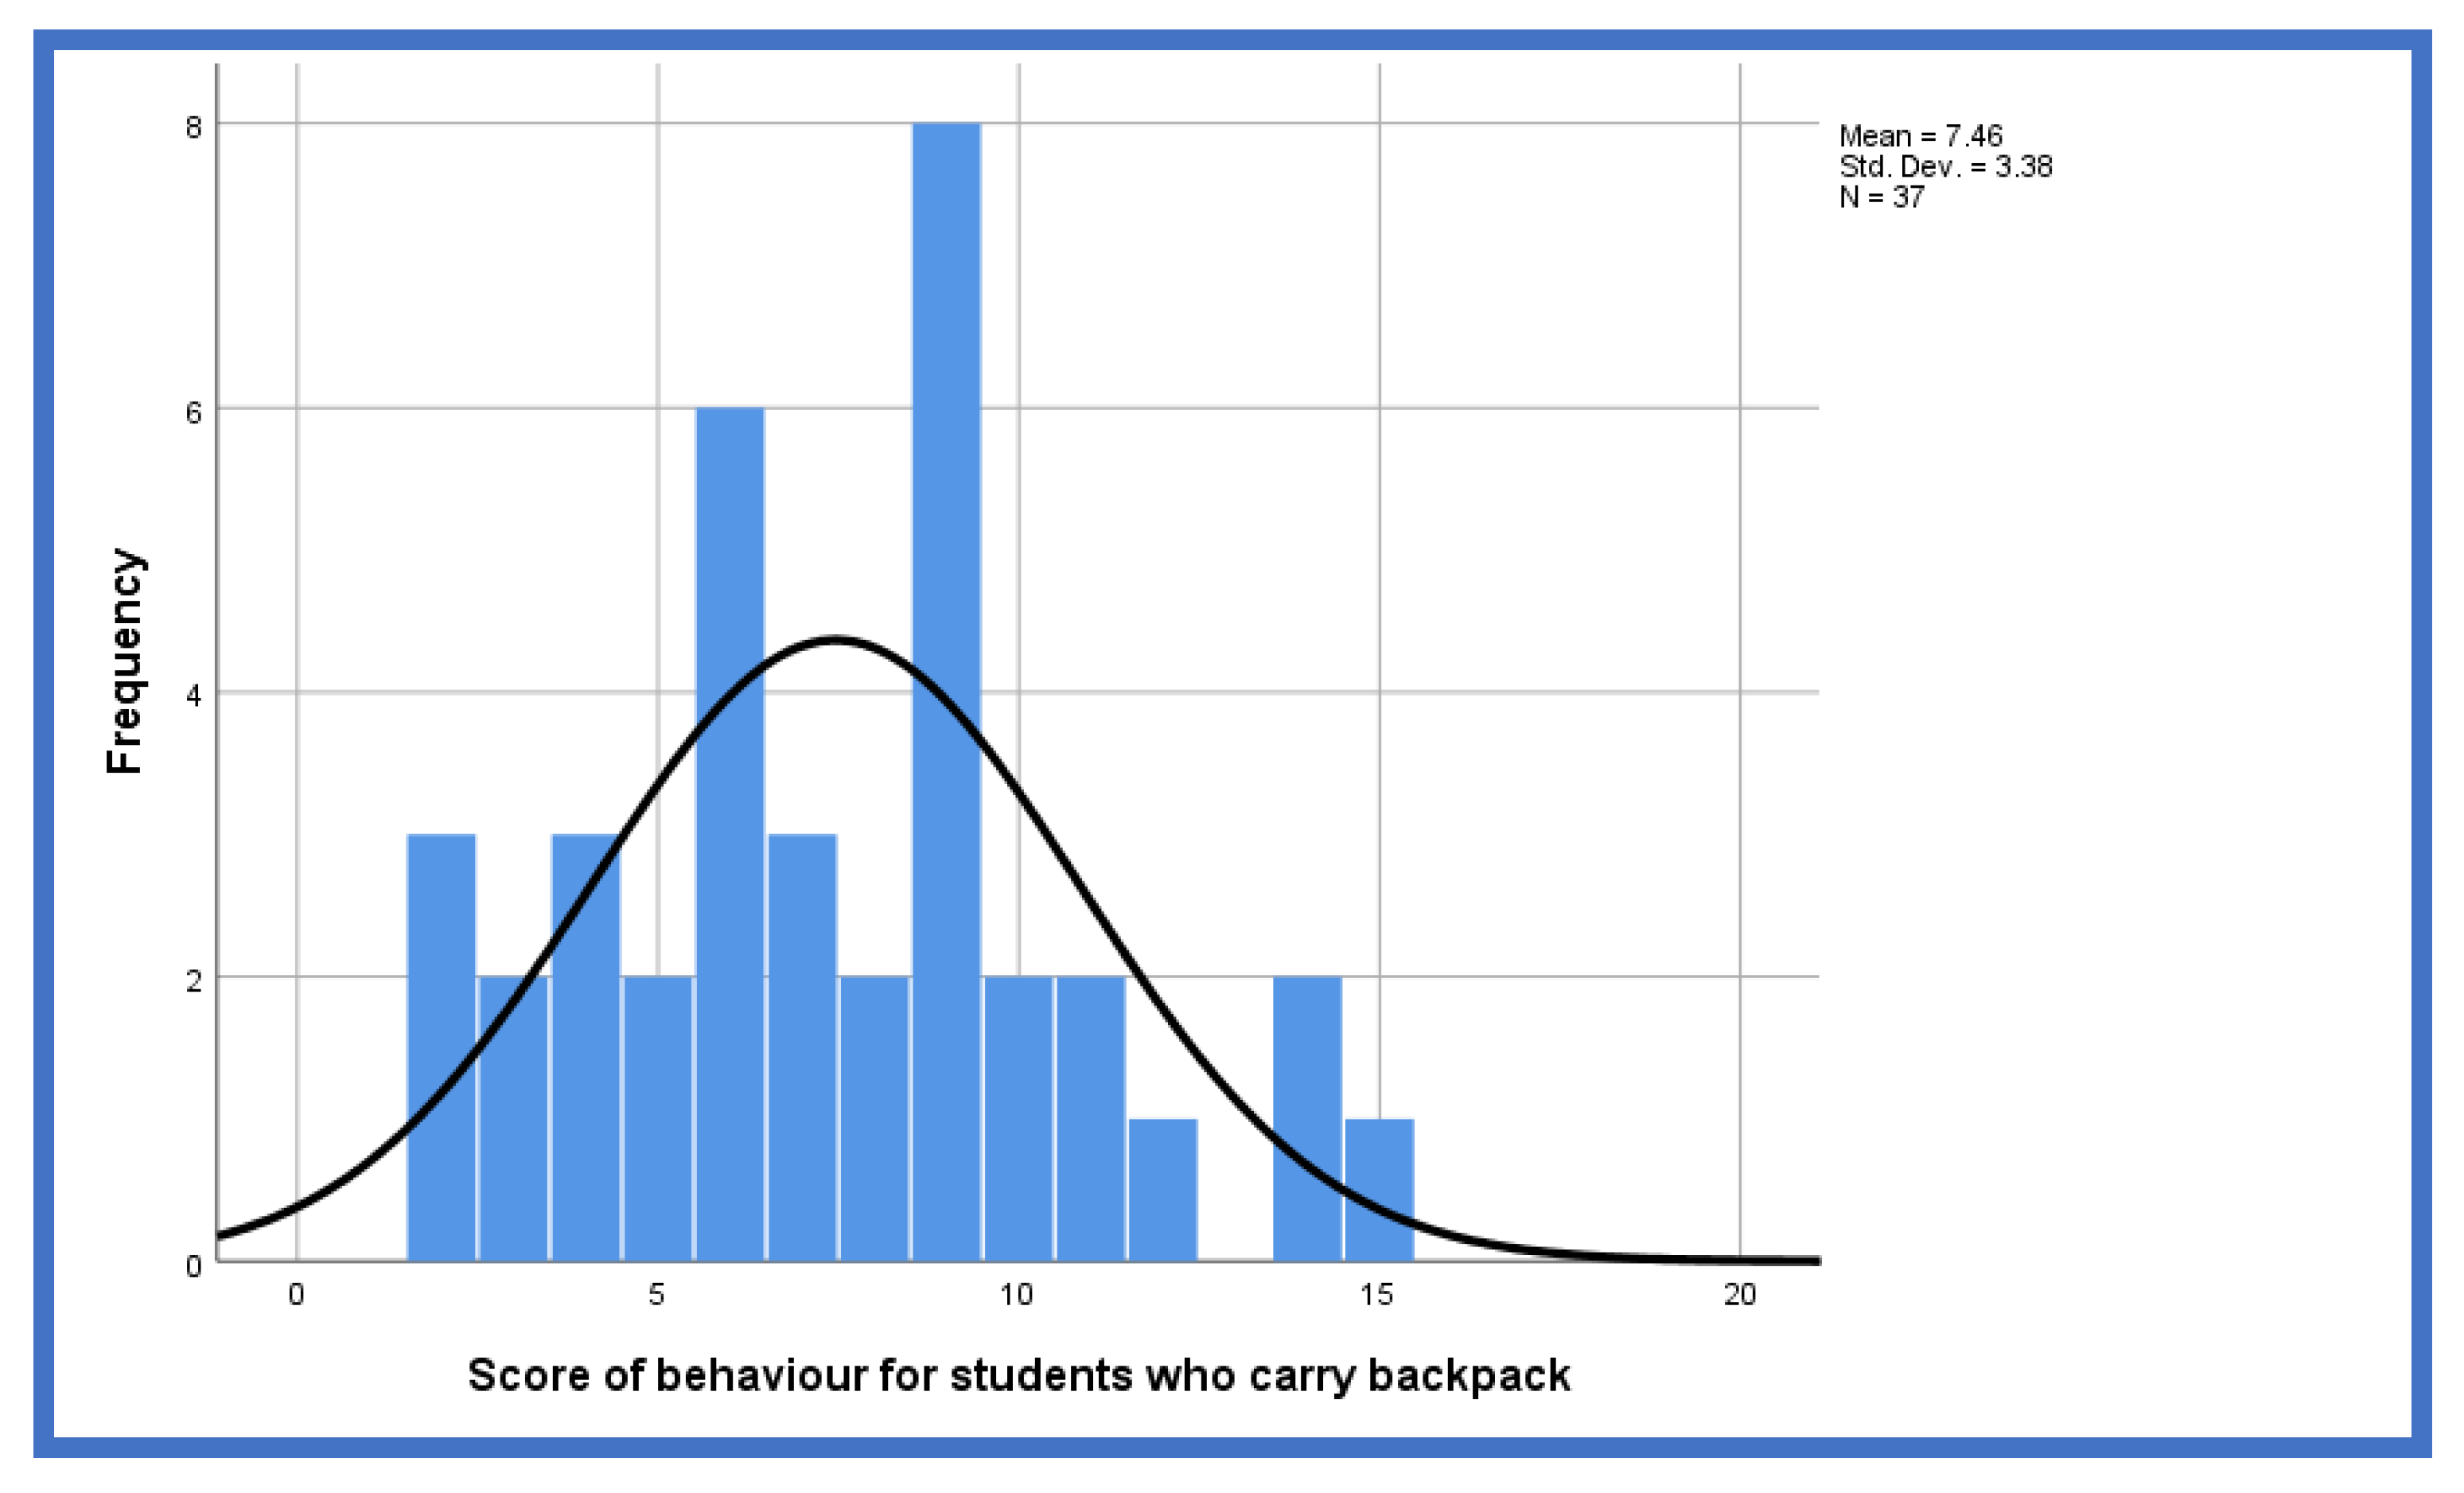
Figure 10.
Distribution of scores of behaviour (students who did not carry backpack).
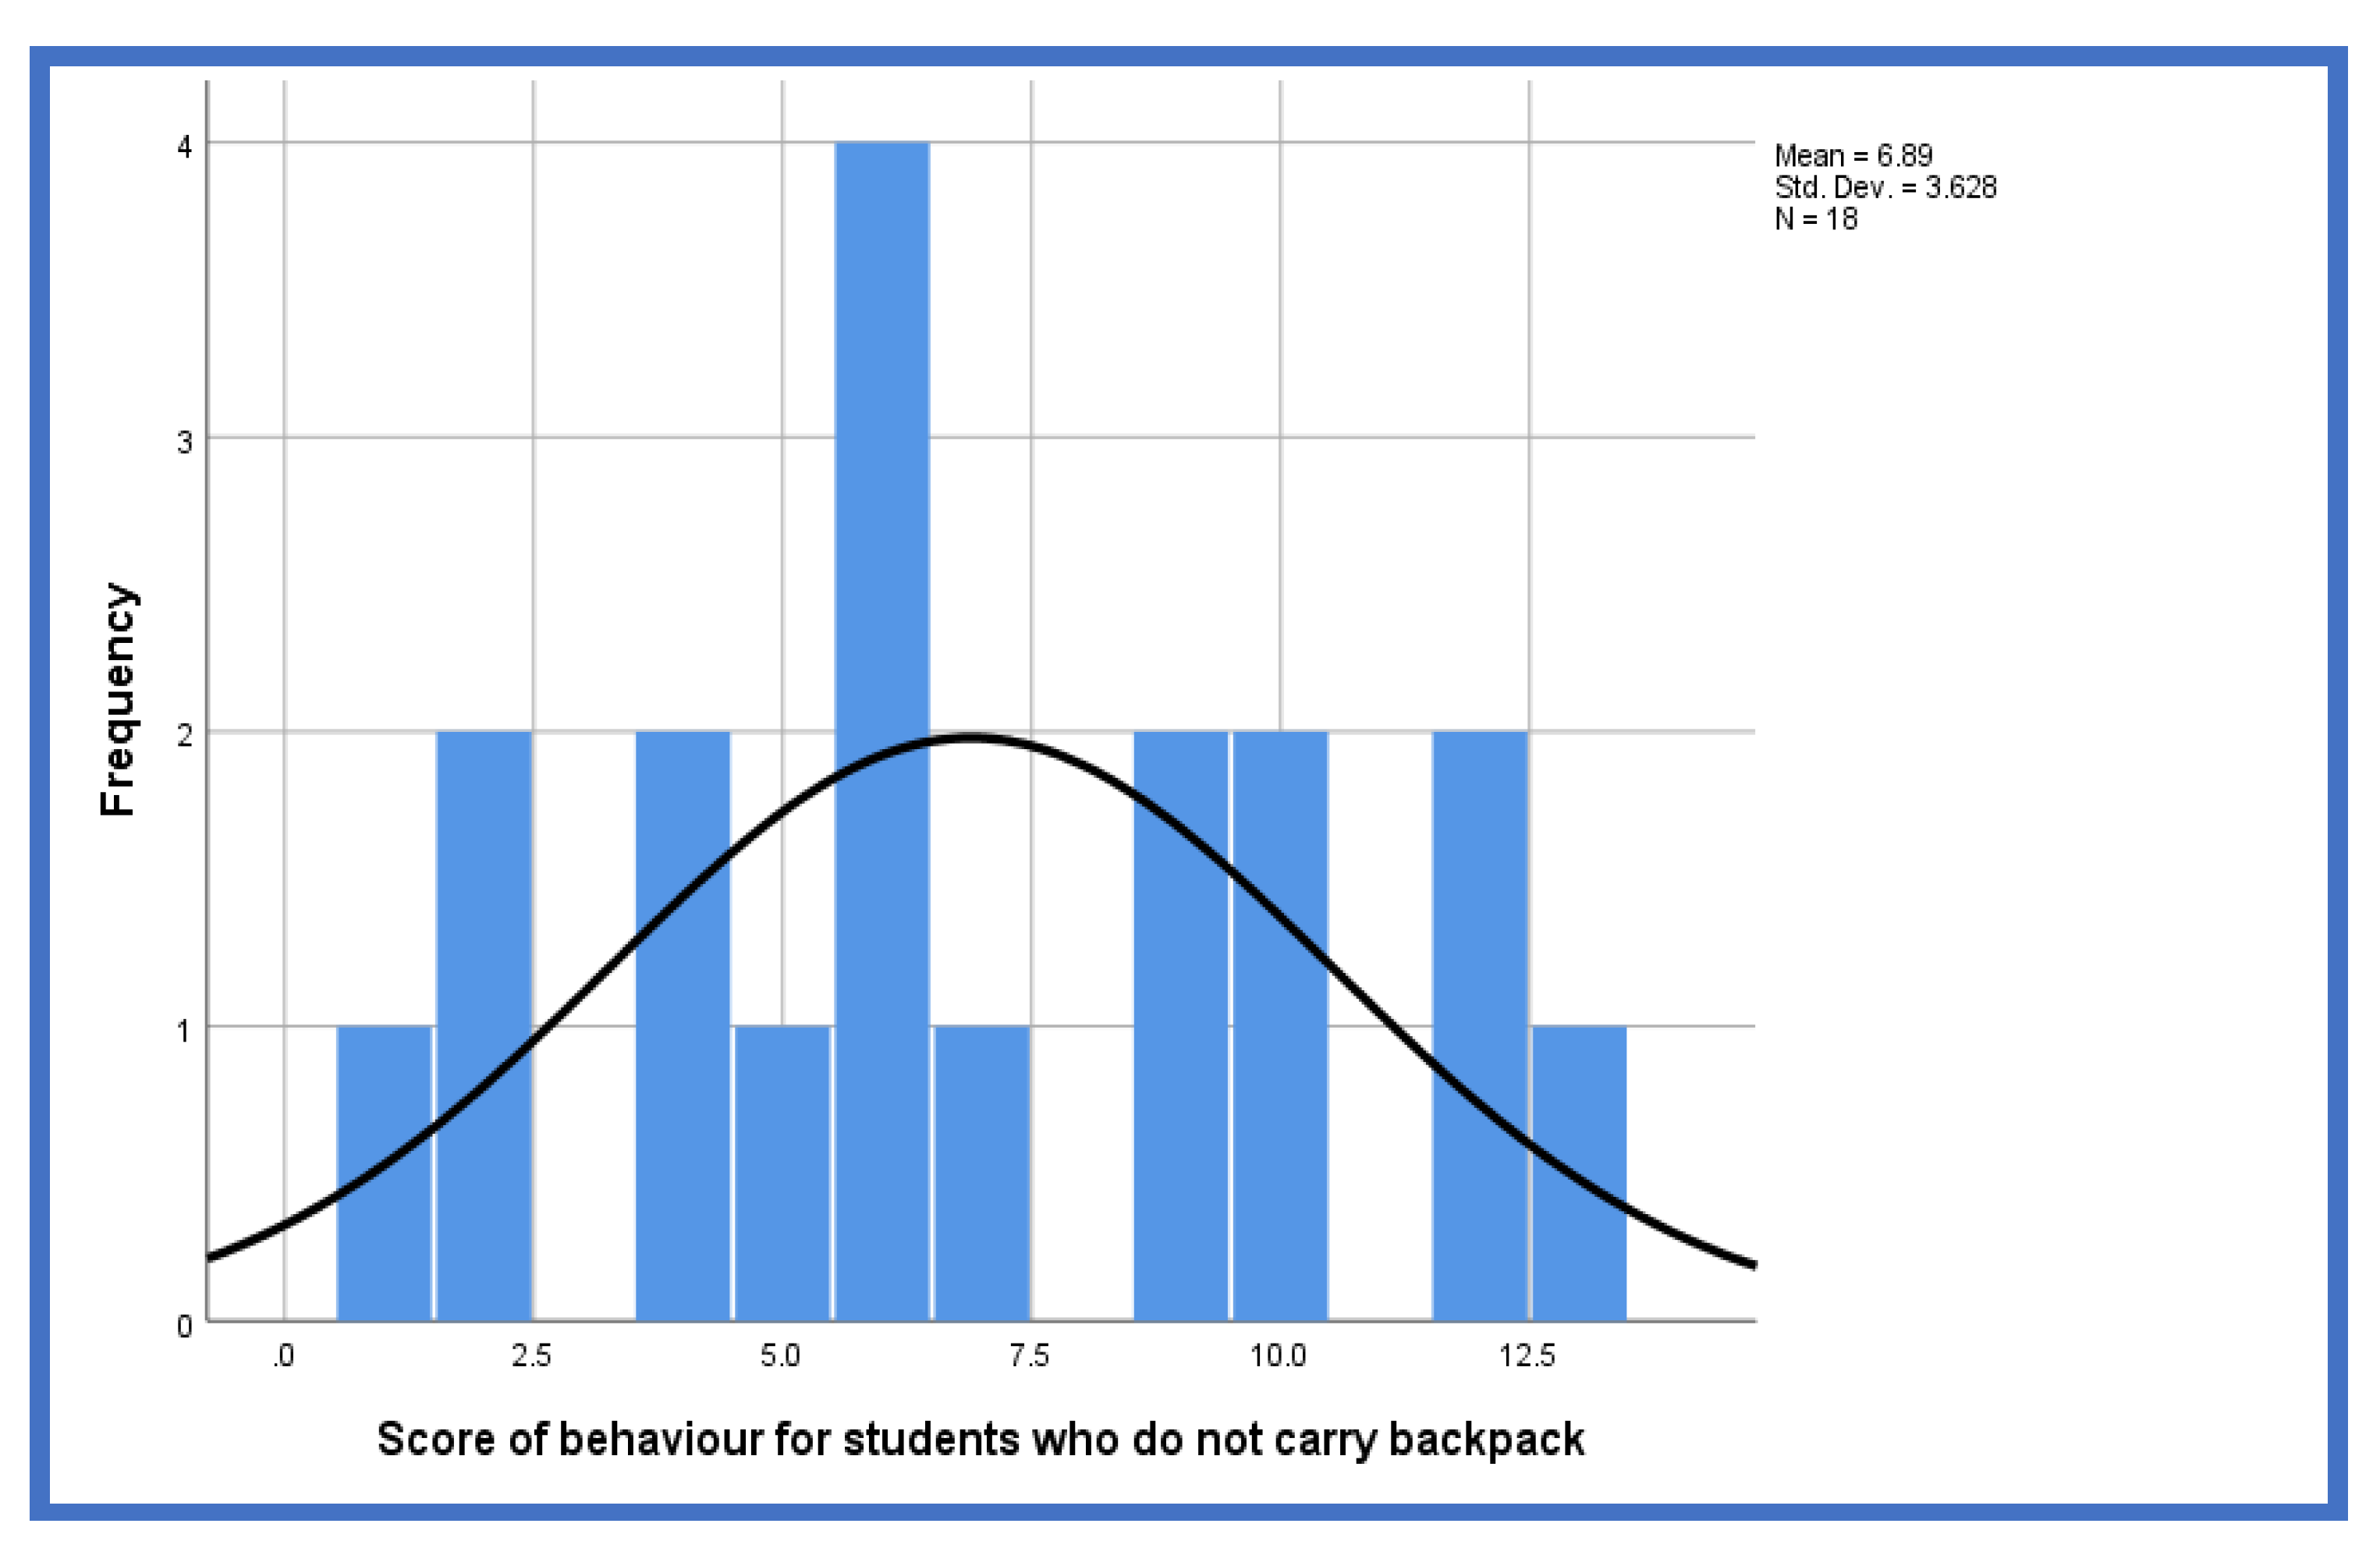
Figure 11.
Presence of MSP.
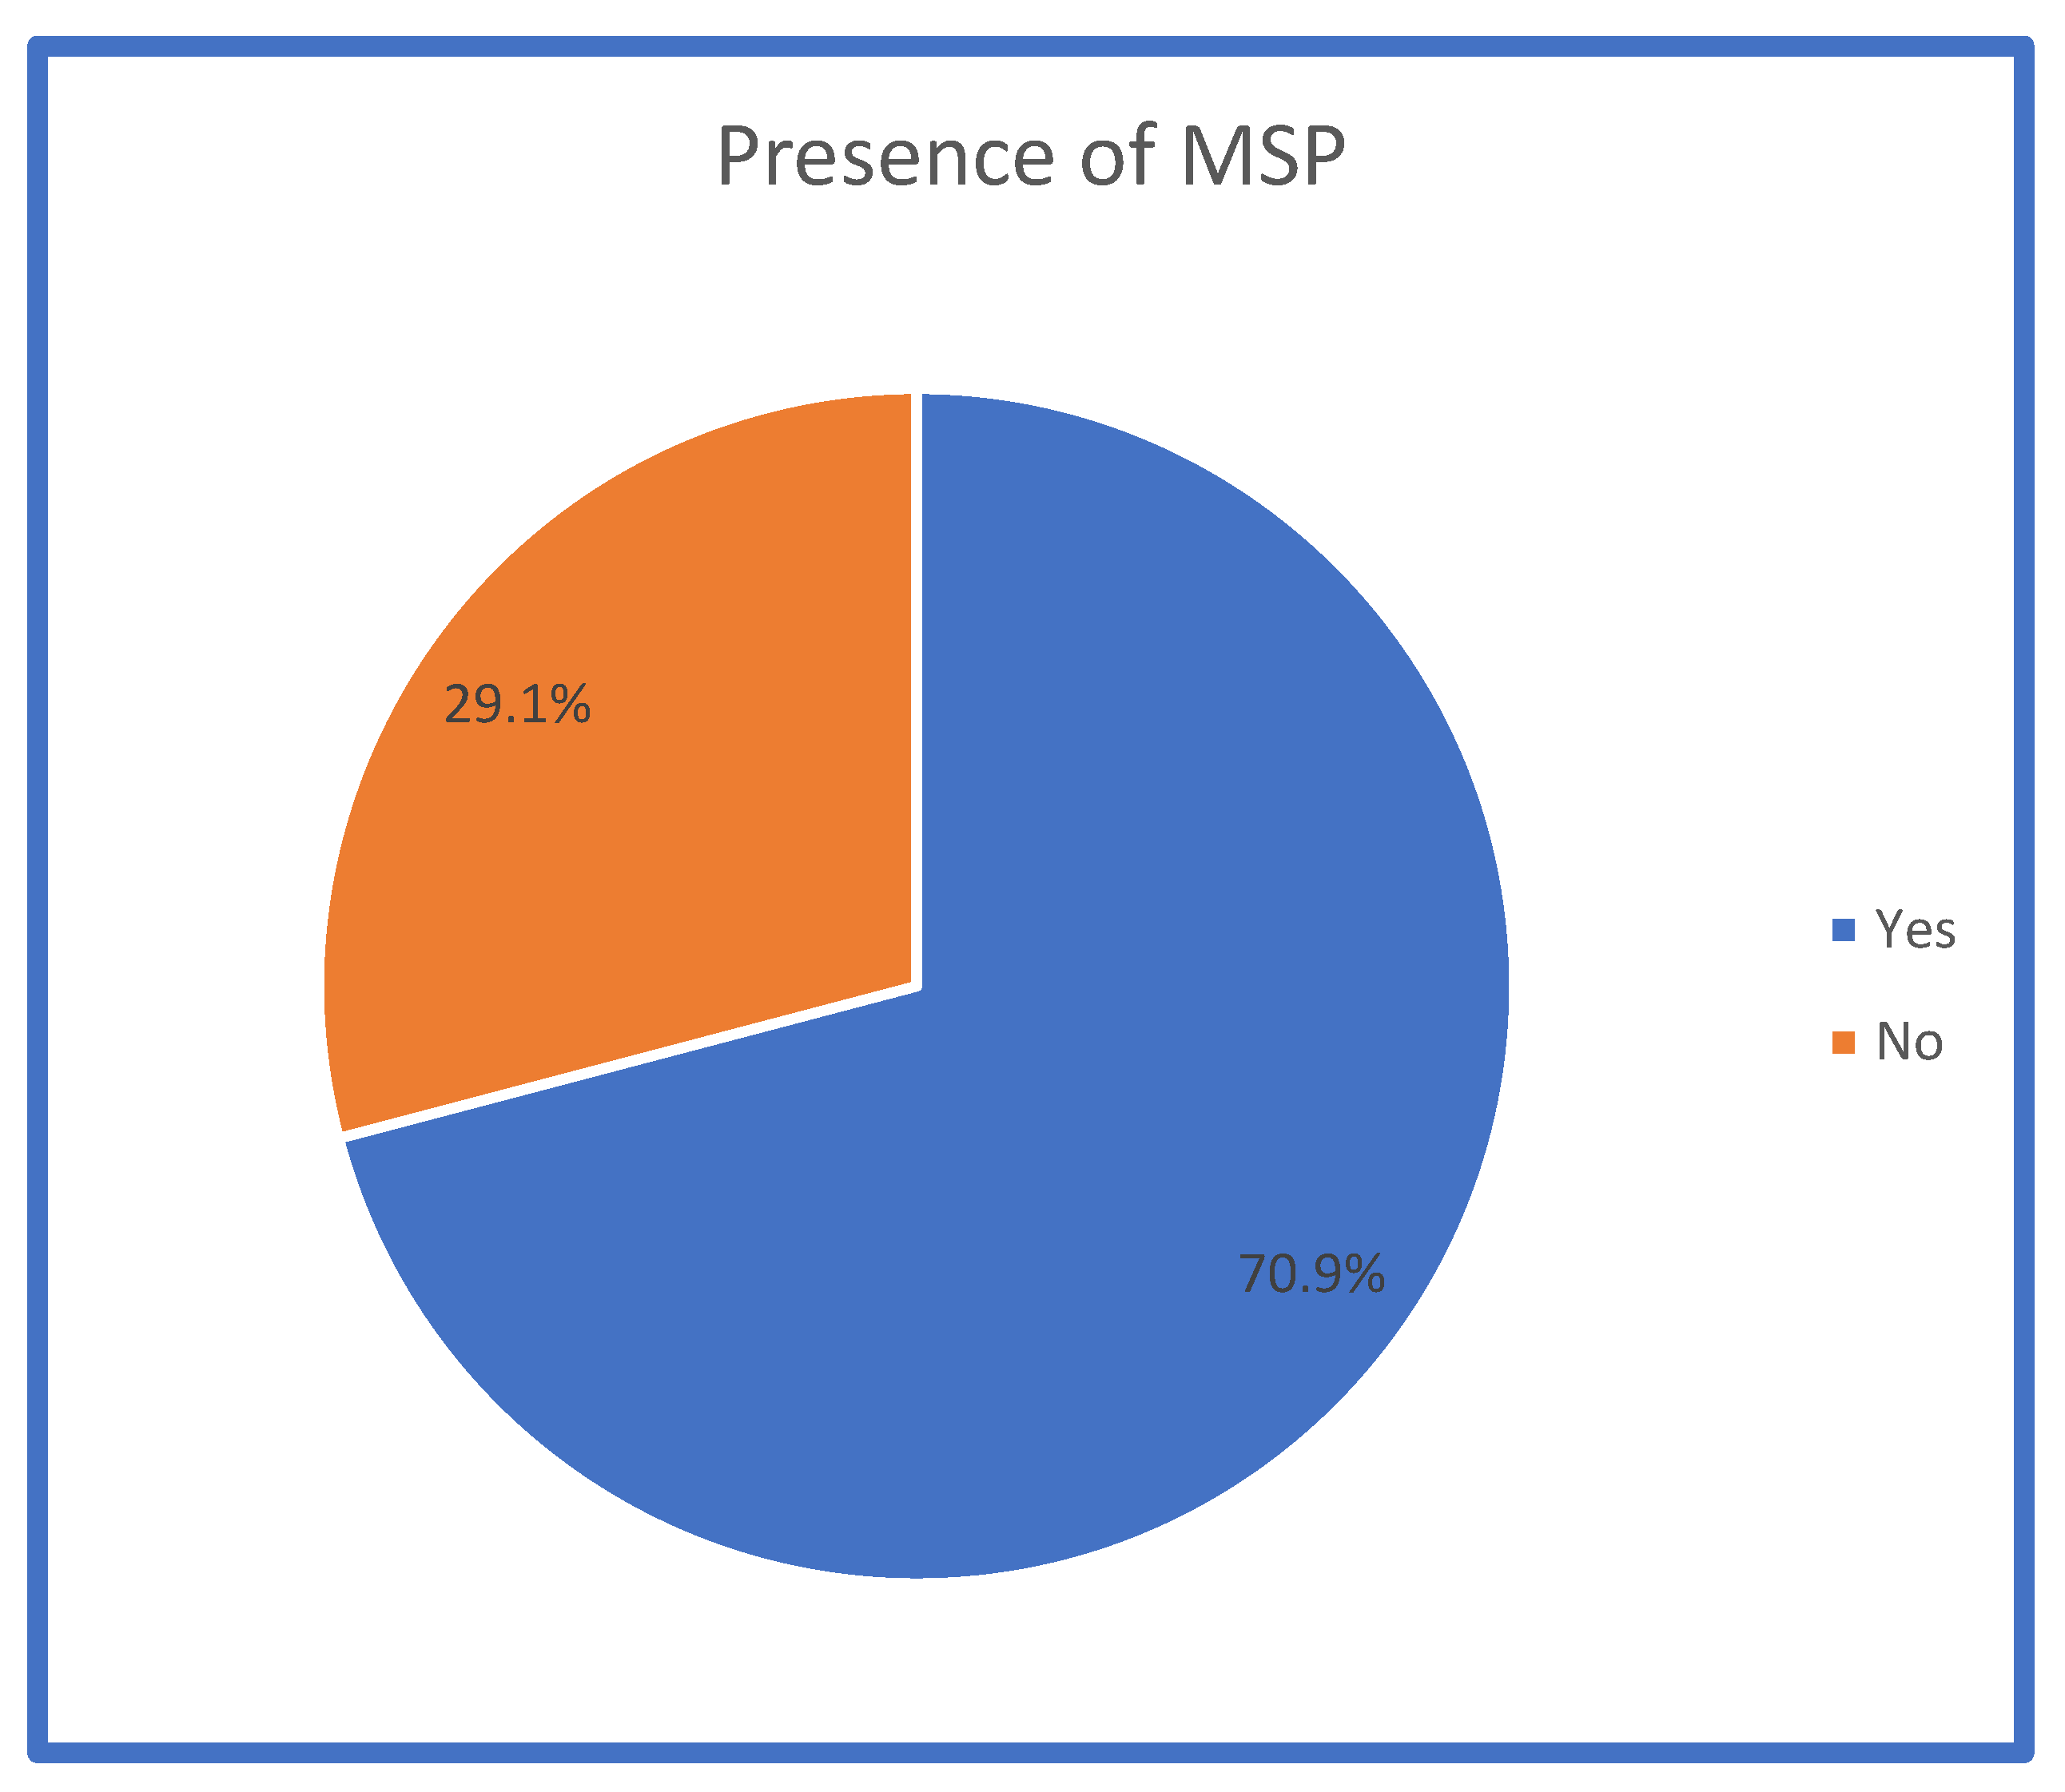
Figure 12.
Location of MSP.
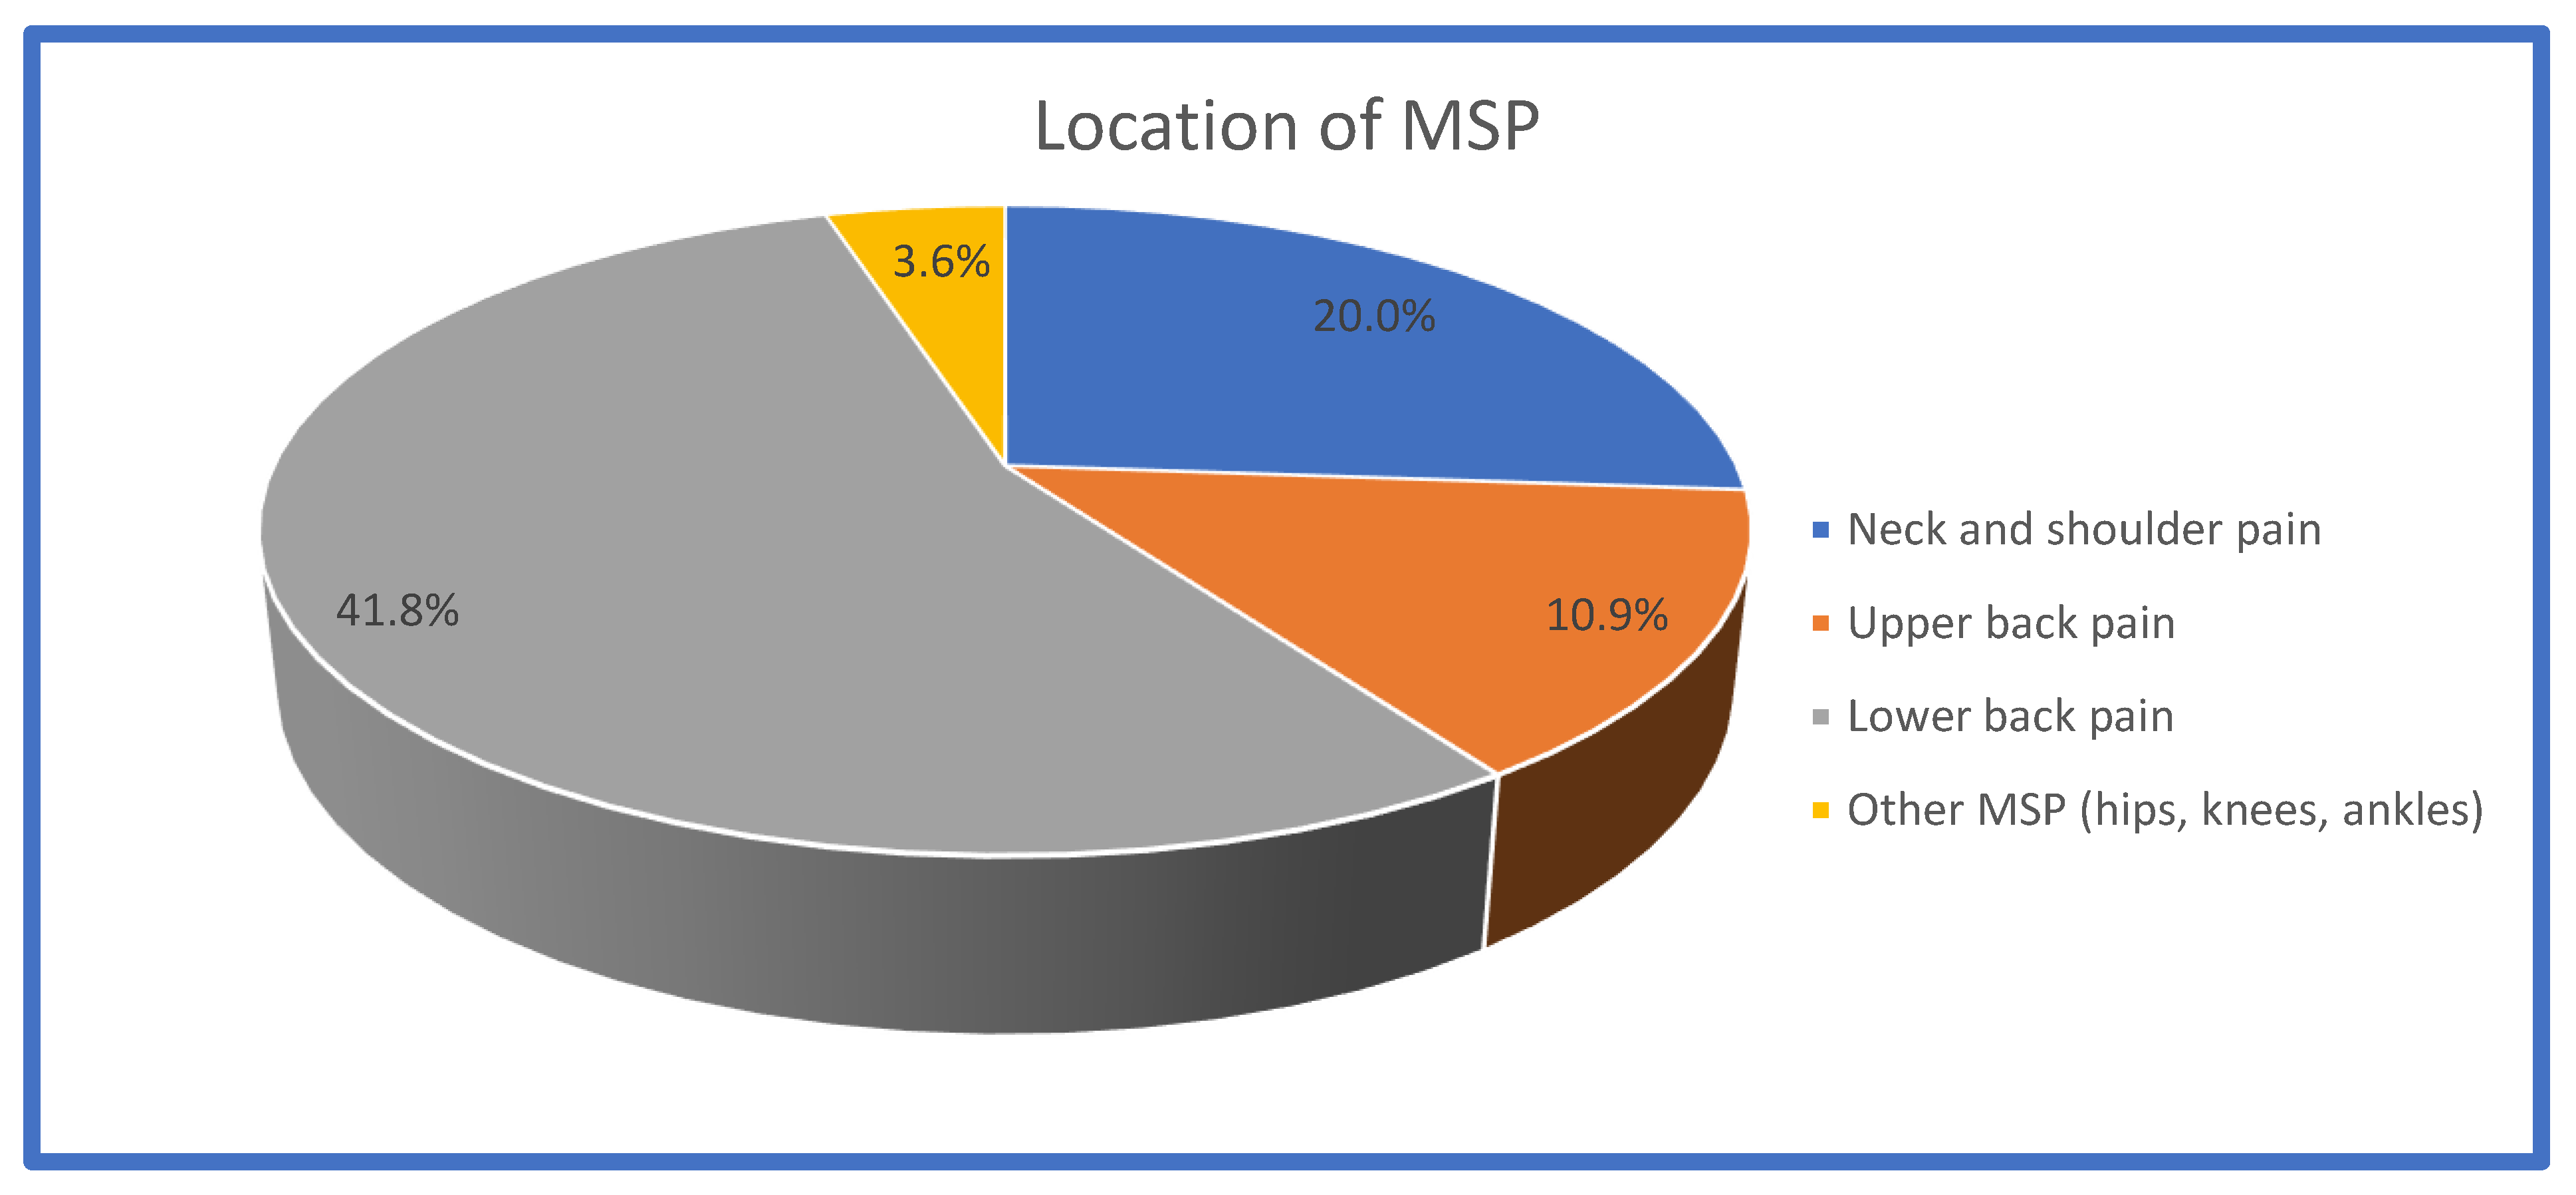
Figure 13.
Activities after which participants experienced.
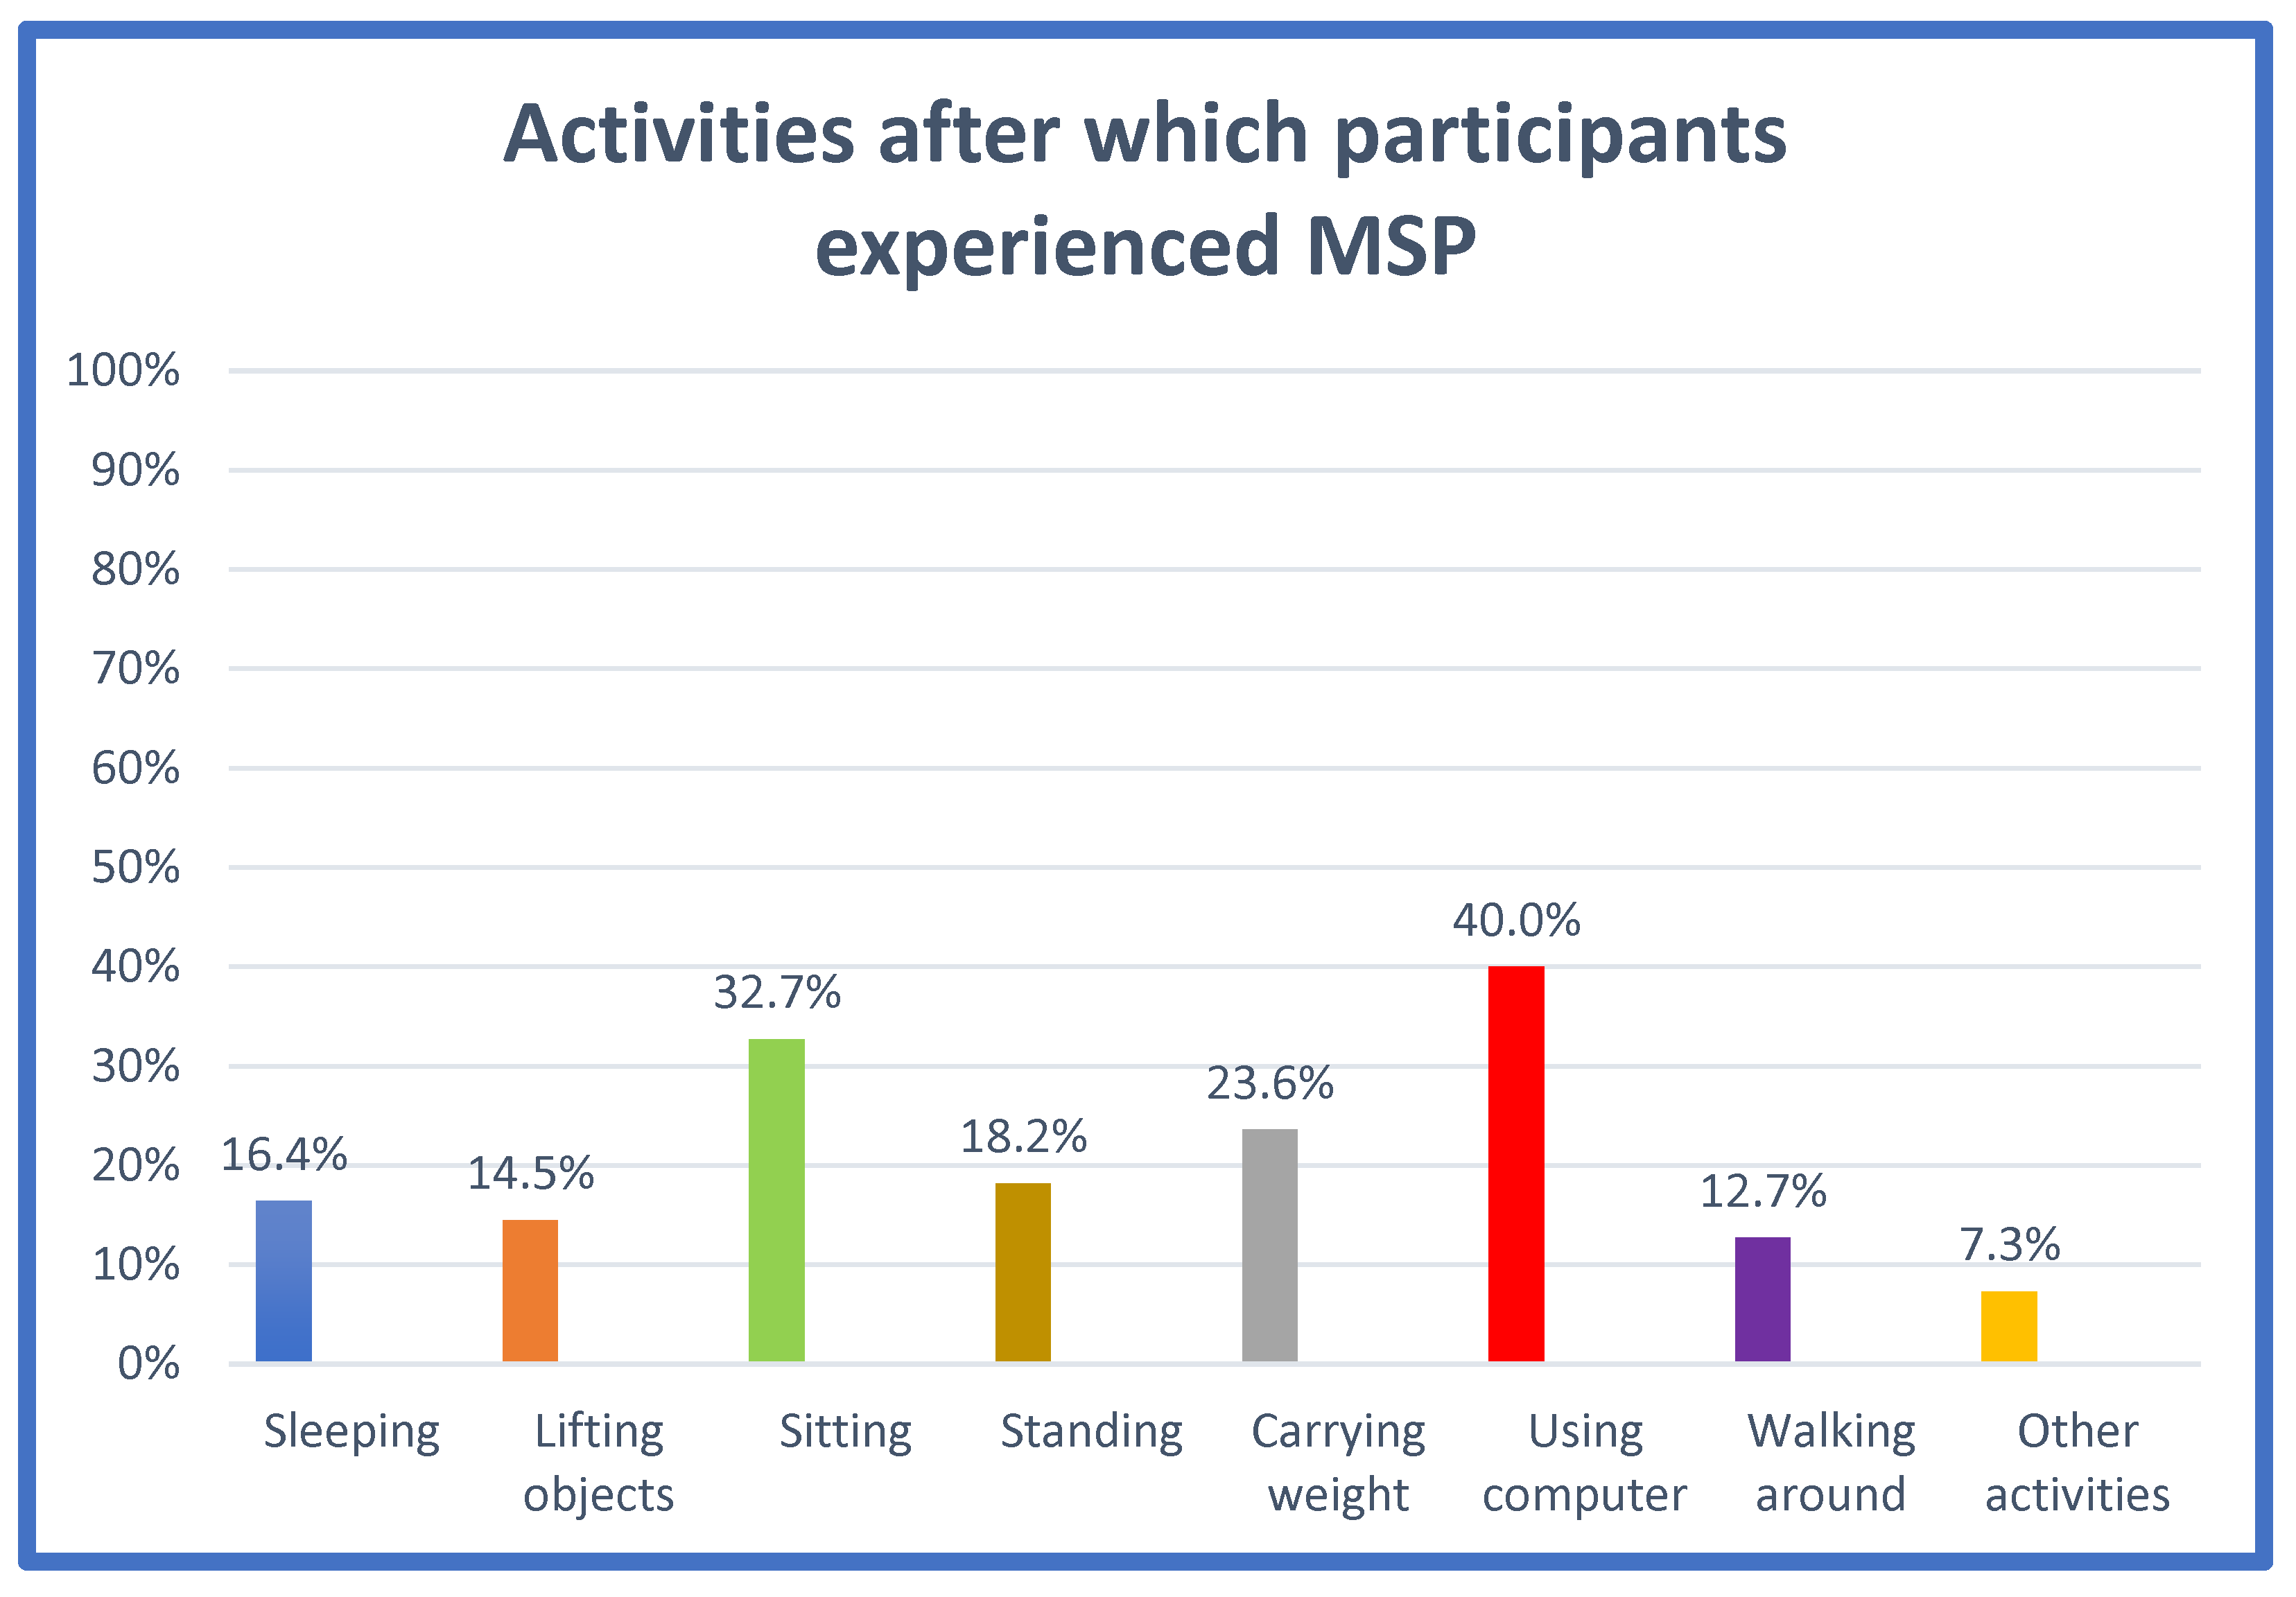

Table 1.
Demographic characteristics of participants (N=55).
| Variable | Frequency (N) | Percentage (%) |
|---|---|---|
|
Age 18-23 years 24-29 years 30-34 years > 34 years Total |
10 24 7 14 55 |
18.2 43.6 12.7 25.5 100.0 |
|
Gender Male Female Total |
19 36 55 |
34.5 65.5 100.0 |
|
Course of study Dietetics Engineering Computer Science Project management Sports therapy and rehabilitation Interior Architecture and Design Energy Physiotherapy PhD Forensic Radiography Occupational therapy Global leadership and management Operating department practice Midwifery Nursing Low intensity psychological therapies Psychology Total |
6 5 5 1 1 3 1 1 4 1 1 1 3 2 18 1 1 55 |
10.9 9.1 9.1 1.8 1.8 5.5 1.8 1.8 7.3 1.8 1.8 1.8 5.5 3.6 32.7 1.8 1.8 100.0 |
|
Year of study Year 1 year 2 Year 3 Year 4 Postgraduate Total |
22 18 8 5 2 55 |
40.0 32.7 14.5 9.1 3.6 100.0 |
Table 2.
Overall scores of participants’ knowledge of ergonomics and posture.
| Overall Scores of Knowledge | Frequency (N) | Percentage (%) |
|---|---|---|
| Poor knowledge |
1 | 1.8 |
| Fair knowledge |
11 | 20.0 |
| Good knowledge | 43 | 78.2 |
Table 3.
Measures of location and goodness of fit for knowledge scores.
| N | Mean | SD. | Min. | Max. | Kolmogorov-Smirnov Z | p-Value | |
|---|---|---|---|---|---|---|---|
| Knowledge score | 55 | 6.80 | 1.145 | 1 | 8 | 0.351 | 0.00 |
| *SD=standard deviation; Min=minimum bound of confidence interval; Max=maximum bound of confidence interval | |||||||
Table 4.
Relationship between the knowledge of ergonomics and posture with different independent variables (age, gender, course of study, academic year, MSP).
Table 4.
Relationship between the knowledge of ergonomics and posture with different independent variables (age, gender, course of study, academic year, MSP).
| Variables | N | Mean Rank | P Value |
|---|---|---|---|
|
Age 18-23 24-29 30-34 >34 |
10 24 7 14 |
28.50 26.40 21.86 33.46 |
0.30 |
|
Gender Male Female |
19 36 |
25.71 29.21 |
0.39 |
|
Course of study Dietetics Forensic Radiography Occupational therapy Global leadership and management Operating department practice Midwifery Nursing Low intensity psychological therapies Psychology Engineering Computer Science Project management Sports therapy and rehabilitation Interior Architecture and Design Energy Physiotherapy phD |
6 1 1 1 3 2 18 1 1 5 5 1 1 3 1 1 4 |
32.50 50.00 50.00 28.50 28.50 28.50 26.67 28.50 1.00 37.10 29.00 4.00 28.50 12.17 4.00 28.50 33.13 |
0.18 |
|
Academic year year 1 year 2 year 3 year 4 postgraduate |
22 18 8 5 2 |
30.80 23.33 31.13 23.00 39.25 |
0.29 |
|
School Health Non health |
33 17 |
27.32 21.97 |
0.16 |
|
MSP Yes No |
39 16 |
27.27 29.78 |
0.55 |
Table 5.
Overall scores of postural behaviour.
| Behaviour of Participants Who Carried Backpack | Behaviour of Participants Who Did Not Carry Backpack | |||
|---|---|---|---|---|
| Frequency (N) | Percentage (%) | Frequency (N) | Percentage (%) | |
| Poor | 19 | 51.4 | 10 | 55.6 |
| Fair | 14 | 37.8 | 5 | 27.8 |
| Good | 4 | 10.8 | 3 | 16.6 |
| Total | 37 | 100 | 18 | 100 |
Table 6.
Measures of location and goodness of fit for the scores of behaviour for participants who carried backpack and who did not carry backpack.
Table 6.
Measures of location and goodness of fit for the scores of behaviour for participants who carried backpack and who did not carry backpack.
| Measures of Location | Goodness of Fit | |||||||
|---|---|---|---|---|---|---|---|---|
| N | Mean | SD | Min | Max | Kolmogorov –Smirnov Z | P value | ||
| Behaviour scores (participants who carried backpack) | 37 | 7.46 | 3.380 | 2 | 15 | 0.108 | 0.20 | |
| Behaviour scores (participants who did not carry backpack) |
18 |
6.89 |
3.628 |
1 |
13 |
0.152 |
0.20 |
|
Table 7.
Comparison of mean scores regarding the postural behaviour by respondents’ characteristics and incidence of MSP.
Table 7.
Comparison of mean scores regarding the postural behaviour by respondents’ characteristics and incidence of MSP.
| Postural Behaviour | ||||||
|---|---|---|---|---|---|---|
| Students Who Carried Backpack Students Who Did Not Carry Backpack | ||||||
| F | DF | P-VALUE | F | DF | P-VALUE | |
| AGE | 1.495 | 3 | 0.23 | 0.964 | 3 | 0.45 |
| GENDER | 0.164 | 1 | 0.69 | 6.045 | 1 | 0.30 |
| COURSE | 1.606 | 12 | 0.16 | 3.701 | 9 | 0.60 |
| YEAR | 0.728 | 4 | 0.58 | 2.307 | 4 | 0.11 |
| SCHOOL | 0.340 | 1 | 0.56 | 4.125 | 1 | 0.62 |
| MSP | 6.251 | 1 | 0.20 | 0.899 | 1 | 0.36 |
Table 8.
Relationship between presence of MSP and age, gender, course of study and academic year.
| Age |
Gender | Course of Study | Academic Year | School | |
|---|---|---|---|---|---|
|
MSP presence |
2.275 (.52) |
2.383 (.12) |
14.467 (.56) |
2.884 (.58) |
3.569 (.06) |
| *χ2 stands for Chi square value; (p-value) | |||||
Table 9.
Relationship between location of MSP and age, gender, course of study and year of study.
| Age |
Gender | Course of Study | Year of Study | School | |
|---|---|---|---|---|---|
|
Neck and shoulder pain Upper back pain Lower back pain Other pain (hips, knees and ankles) |
4.397 (.22) 3.064 (.38) 5.973 (.11) 14.232 (.35) |
0.3222 (.57) 0.711 (.39) 2.867 (.09) 1.095 (.29) |
17.535 (.35) 21.618 (.16) 13.032 (.67) 9.023 (.91) |
4.897 (.29) 1.819 (.77) 3.046 (.55) 4.266 (.37) |
1.092 (.30) 0.778 (.38) 2.911 (.09) 1.073 (.30) |
| Chi square values; (p-values) | |||||
Table 10.
Relationship between location of pain and activity after which participants experienced the pain.
Table 10.
Relationship between location of pain and activity after which participants experienced the pain.
| Neck and Shoulder Pain | Upper Back Pain | Lower Back Pain | Other Pain | |
|---|---|---|---|---|
|
Sleeping |
4.019 (.05) |
1.318 (.25) |
2.731 (.09) |
0.406 (.52) |
|
Lifting objects |
2.340 (.13) | 1.913 (.17) | 4.236 (.04)* | 0.353 (.56) |
|
Sitting |
2.973 (.09) | 3.524 (.06) | 4.093 (.04)* | 1.010 (.32) |
|
Standing |
0.764 (.38) | 0.010 (.92) | 7.323 (.01)* | 0.461 (.49) |
| Carrying weight | 1.234 (.27) | 2.593 (.11) | 2.721 (.09) | 0.642 (.42) |
|
Computer use |
6.136 (.01)* |
5.269 (.02)* |
2.441 (.06) |
1.384 (.24) |
|
Walking |
2.005 (.16) | 0.094 (.78) | 2.890 (.09) | 2.596 (.11) |
| Other activities | 1.078 (.29) | 0.528 (.47) | 1.952 (.16) | 5.619 (.50) |
| Chi square values; p-values | ||||
Table 11.
Content analysis of the open-ended questions.
| Questions | Themes and Categories | Percentage |
|---|---|---|
| Qs10. What is the reason for your choice of the most adequate sleeping posture? |
Comfortable position recovery position relaxed posture foetal posture Correct spinal alignment spine is straight correct alignment Less pain and injuries Less pressure on spine Equal distribution of body weight |
10.9% 25.5% 1.8% 12.7% 12.7% 5.5% 3.6% |
| Qs13. What is the reason for your choice of the most adequate posture when picking up objects from the ground? |
Use knees not back Bend knees Use legs Keep back straight Keep objects close to body Load is close to the body Less pain and injuries Prevent pain and injuries Less pressure on spine Even distribution of weight |
10.9% 14.5% 32.7% 1.8% 3.6% 20% 21.8% |
| Qs16.What is the reason for your choice of the most adequate posture when sitting at a desk |
Comfortable posture Comfortable Good posture Correct spine alignment Straight back Spine support Back support Less pain and injuries avoid pain Hands on desk Elbows rest on desk Feet flat on floor Feet on floor |
7.3% 29.1% 36.4% 5.5% 18.2% 1.8% 1.8% |
| Qs23. What is the reason for your choice of the most adequate posture when taking an object from a high shelf? |
Less pain and injuries Less pain Spine alignment Spine is straight |
51% 33% |
| Qs26. What is the reason for your choice of the most adequate posture when sitting on an armchair |
Comfortable posture Comfortable Better posture Correct spine alignment Straight back Spine alignment Spine support Back support Less pain and injuries Avoid pain Less pressure and strain Better for joints |
10.9% 31% 40% 1.8% 10.9% 1.8% 9.1% 1.8% |
| Qs 29. What is the reason for your choice of the most adequate posture when sitting at a table |
Comfortable posture Better posture comfortable Spine support Straight back Back support Good for back Less pain and injuries Less pressure and strain Prevent pain Good for joints Equal distribution of body weight |
21.8% 5.5% 43.6% 16.4% 1.8% 5.5% 1.8% 1.8% 1.8% |
| Qs32. What is the reason for your choice of the most adequate posture when sitting down working at computer |
Comfortable posture Comfortable Good posture Correct spine alignment Back straight Spine alignment Spine support Back support Less pain and injuries Avoid pain Hands on desk Elbows rest on desk Feet flat on floor Feet on floor Screen at eye level Eyes at same level with screen |
5.5% 25.5% 31% 1.8% 12.7% 9.1% 3.6% 3.6% |
Disclaimer/Publisher’s Note: The statements, opinions and data contained in all publications are solely those of the individual author(s) and contributor(s) and not of MDPI and/or the editor(s). MDPI and/or the editor(s) disclaim responsibility for any injury to people or property resulting from any ideas, methods, instructions or products referred to in the content. |
© 2024 by the authors. Licensee MDPI, Basel, Switzerland. This article is an open access article distributed under the terms and conditions of the Creative Commons Attribution (CC BY) license (http://creativecommons.org/licenses/by/4.0/).
Copyright: This open access article is published under a Creative Commons CC BY 4.0 license, which permit the free download, distribution, and reuse, provided that the author and preprint are cited in any reuse.


