
Submitted:
16 July 2024
Posted:
17 July 2024
You are already at the latest version
Abstract
(1) Background: The aim of this investigation is to determine the effect of archwires’ deflection on the temperature transitions driving the austenite to martensite transformation (and vice versa) and the force released by NiTi and CuNiTi orthodontic wires. (2) Methods: Round cross-section archwires have been investigated. The calorimetric approach has been used for measuring transition temperatures occurring in the unstressed (e.g. undeflected) state of the wires. Static Thermo-mechanical analysis in a temperature controlled wet environment has been performed in the range of temperature between 5°C and 55°C for measuring temperature transitions occurring in highly deflected archwires in conjunction with the force released by these wires. (3) Results: Plateau forces investigated in Part I and those reported in the literature describes the wire’s behaviour only at deflection levels close to the end point of the force plateau extension detected at 37°C. Upon heating or cooling, the austenite finish (Af) transition temperature and the martensite start (Ms) temperature largely depends on the deflection level for both NiTi and CuNiTi. (4) Conclusions: The plateau force levels at 37°C, broadly reported in the literature, only represent the lower boundary force that a superelastic wire releases at 37°C above its elastic limit. For both NiTi and CuNiTi, plateau force levels at 37°C can be predicted by the static TMA profile matching the end point of the force plateau extension. Transition temperatures in largely deflected wires are significantly higher than those determined through the calorimetric approach.
Keywords:
NiTi
; CuNiTi
; Superelasticity
; Experimental design
; Bending
; Plateau force
; Mechanical and thermal measurements
; Transition temperatures
1. Introduction
Transition temperatures of superelastic wires allows to establish the alloy state and therefore the properties as a function of temperature of the oral cavity [1,2]. Only from orthodontic wires with an Austenite finish (Af) temperature lower or close to the average temperature of the oral cavity the superelastic behaviour can be expected [3,4]. On the other hand, important thermal excursions occur following the ingestion of particularly hot or cold food and/or drinks, cigarette smoke, etc (Table 1). From a practical point of view, this means that each superelastic NiTi wire will be able to express a very wide range of forces depending on its deflection, its thickness, and the temperature of the oral cavity which, despite being on average value of 35°C, it is very susceptible to variations [5,6,7,8,9].
Differential scanning calorimetry (DSC) represents the most popular tool for determining temperature phase transitions occurring in unstressed orthodontic wires [1,10,11].
Both chemical composition of superelastic archwires, such as NiTi and CuNiTi, and the technological process for producing and activating (i.e. training) these wires, largely affect phase transition temperatures [2,8]. Unfortunately, very little is known on temperature transition of superelastic archwire in highly deflected state. Table 2 reports literature data on transition temperatures of biomedical (i.e. orthodontic) and engineering NiTi and CuNiTi showing testing conditions.
Dynamic thermo-mechanical analysis (DTMA) is the preferred approach for determining temperature-dependent mechanical properties of smart alloys [17,21,22]. This investigation technique, applying a small amplitude mechanical signal (e.g. stress or strain), distinguishes the storage modulus (in phase response) and the loss modulus (out of phase response) as a function of temperature. This approach finds its historical origin for investigating transition temperatures of viscoelastic polymers and tissues [23]. However, limited literature data is available for superelastic orthodontic wires undergoing bending (Table 2), especially those simultaneously investigating both DSC and DTMA. Rodrigues et al. [2] have recently carried out DSC and TMA in bending on NiTi orthodontic wires, but the phase transition temperatures in the stressed state of the superelastic wire have not been determined. However, comparing the DSC and TMA profiles [2] as a function of the temperature sweep (10° to 40°C), it can be easily observed that Af and Ms temperatures occurring via TMA are higher than the Af and Mf values that can be distinguished through the DSC profile. Similar differences for Af and Mf temperatures can be observed from DSC and TMA of NiTi orthodontic wires [13]. Af temperatures measured through TMA, higher than those measured through DSC, have also been reported by Kusy et al. [12].
It is worth to point out that literature data on transition temperatures comparing DSC and DTMA profiles [2,12,13] is limited to small deflection of superelastic wires. This limit arises from the capability of the employed DTMA apparatus to apply large deflections such as those occurring in clinical practice. In particular, Kusy and Whitley [12] determined transition temperatures through storage modulus temperature profiles using the preload of 5 g and the dynamic amplitude of 5 µm. Higher deflection levels, up to 750 µm or 2 mm, have been employed by Rodrigues et al. [2] or Nespoli et al. [13], respectively. However, transition temperatures at the above reported deflection levels have not been computed. Therefore, the only available systematic DTMA investigating superelastic orthodontic wire undergoing bending is the research carried out by Kusy and Whitley [12].
On the other hand, by using TMA in bending through conventional bending tests and by observing Young’s modulus variation as a function of temperature, Laino et al. [8] reported a significant higher increase of the Af temperature for NiTi and CuNiTi wires having DSC transition temperatures close to those of the wires previously documented [12]. The NiTi wire analysed by [8] and by [12] have the same geometry, and it has been deflected at the same frequency (e.g. 1 Hz), the only difference is the reaction force being about three folders higher [8] than that reported by [12]. A similar observation can be drawn for the CuNiTi35 wire investigated by both [8] and [9]. Therefore, it seems that the deflection level largely affects Af temperature.
Literature data on tensile DTMA of orthodontic wires is even more limited than that reported for bending (Table 2). The work carried out by Kusy and Wilson [16] can be considered has a pioneering investigation of an active NiTi wire for determining transition temperatures. However, another source of data can be found among non-biomedical NiTi wires undergoing tensile DMTA. Lahoz & Puértolas [17] examined the effect of the training stress on temperature transitions, and Af temperature of stressed wires is significantly higher than that recorded through DSC. A similar observation is reported by Florian et al. [18]. Interestingly, Ms and Af temperatures determined through tensile stress vs strain curves (Table 2) remarkably increase as the stress increases [15,19]. Moreover, electrical resistivity measurements suggest the shift toward higher temperature level of the whole temperature transition range as the deflection of orthodontic NiTi wire is increased [20].
Bending properties of superelastic archwires largely depends on the temperature level and on the phase transition temperatures [2,8,24,25,26,27]. In Part I of this investigation it has been shown that the plateau force levels detected at 37°C, including those broadly reported in the literature, may represent a single block puzzle of the force scenario that a superelastic wire releases during the orthodontic treatment. In fact, once the wire is bent and clinically applied, no further deflection occurs, at least not in the daily attitudes. Part I shows that the effect of a temporary heating (e.g. hot food or drink ingestion) produces a significant force increase (up to 50%) whose magnitude depends on the deflection level. A significant force increase (higher than 50%) for NiTi orthodontic wires after a temporary heating up to 50°C has also been observed by Iijima et al. [1]. It will be shown that the Ms and the Af temperatures remarkably increase as the deflection level of the superelastic wire increases, and these temperature play a fundamental role in the load that a deflected archwire is capable to transfer to teeth.
To the authors’ knowledge, data on temperature transitions occurring in superelastic orthodontic wires, deflected up to 2.5 mm, are missing. Within this investigation, we employed a temperature sweep test on stressed superelastic wires for measuring temperature transitions occurring at different deflection levels. The first null hypothesis is that there is no significant difference in phase transitions temperatures between unstressed and stressed orthodontic archwires. The second null hypothesis is that archwires’ force variations, measured through mechanical static temperature sweep tests, differ from those measured through classic bending tests at fixed temperature levels, broadly reported in the literature [1,2,24,25,26,27].
2. Materials and Methods
NiTi and CuNiTi archwires with a round cross-section were investigated. Forestadent Biostarter® NiTi round archwires (Forestadent®, Bernhard Foerster GmbH), and CuNiTi archwires (Sweden & Martina S.p.a. Padova, Italy) were investigated. Archwires composition and dimension were reported in Table 3.
Differential Scanning Calorimetry (DSC) was performed with the equipment DSC 2910 (TA Instruments, Inc. New Castle, DE USA) reported in Figure 1a. The mean weight values of NiTi and CuNiTi wires ranged between 5.09 mg and 5.85 mg. Calorimetric properties mainly depends on the chemical composition. Five NiTi specimens and five CuNiTi were investigated. A linear temperature ramp of 10 °C/min was used to heat and cool specimens between 0°C and 80°C. Data were analysed through Universal Analysis software (TA Instruments software, New Castle, DE USA) for determining the temperature levels at which the phase transition occurred. Through the heating cycle, austenite start temperature (As) and austenite finish temperature (Af) were distinguished using the intercept method of the tangent lines around the endothermal peak as reported in Figure 1b. Similarly, through the cooling cycle, martensite start temperature (Ms) and martensite finish temperature (Mf) were determined by the cross-points of the tangents line around the exothermal peak.
Static thermo-mechanical analysis (Static TMA) was carried out using the Three Point Bending (3PB) configuration. Tests were performed using the Instron dynamometric machine 5566 equipped with a 10N loading cell. The span was set at 14 mm. Specimen with a length of 18 mm were obtained from the end portions of each archwire having the minimal curvature. Thermal conditioning was achieved through a water bath heated or cooled by a Peltier system (Figure 1c). Force variation between 5°C and 55°C, through heating and cooling at a rate of 2.5 °C/min, were measured at discrete deflection levels (0.25, 0.5, 1.0, 1.5, 2.0 and 2.5, mm) for the NiTi and the CuNiTi round archwires. Five specimens for NiTi group and five specimen for the CuNiTi group were used. Transition temperatures in the stressed state of the wires were computed using the intercept method of the tangent lines as depicted in Figure 1d.
Temperature levels during the heating (As and Af) and cooling (Ms and Mf) cycles at which temperature and stress-induced phase-transition occurred were determined using KaleidaGraph (Synergy Software, Perkiomen Ave, Reading PA) as depicted in Figure 1d.
The Origin2018 software (OriginLab Corp., Northampton, US) was used for analysing thermomechanical properties through analysis of variance (e.g. two way ANOVA) at a p value of 0.05 followed by the Tukey’s post hoc test.
3. Results
Figure 2 reports the heat flow recorded on NiTi and CuNiTi wires heated and cooled at rate of 10°C/min. A single endothermic peak during heating, and a single exothermic peak during cooling can be observed from both NiTi and CuNiTi archwires. Through the heating and cooling cycles, phase transition temperatures were determined. Figure 2 extension was limited in the range 5°C to 45°C for better distinguish the intercept method.
Figure 3 and Figure 4 shows the temperature dependence of NiTi and CuNiTi wires having the cross-section of 0.016” deflected at discrete levels (i.e. 0.5, 1.0, 1.5, 2.0, and 2.5 mm). A strong dependence of the force on the temperature level can be observed. For both NiTi and CuNiTi orthodontic wires, the force released after a given deflection largely increases as temperature increases from 10°C to 50°C, and this increase is higher at low deflections. Even in a restricted temperature range (13°C - 39°C), corresponding to temperature variation in the oral environment due to the speech/breath attitude (Table 1), the effect of temperature on the force released by super-elastic wires is evident. In particular, during heating and for a deflection of 0.5 mm, a force increase of about 300% has been measured for both NiTi and CuNiTi wires.
For discrete deflections between 1.5 mm and 2.5 mm, force levels as a function of temperature are almost similar. A force increase of about 100% was measured as temperature is increased for both NiTi and CuNiTi wires. A remarkable difference can be observed between NiTi and CuNiTi concerning the temperatures at which transitions occurs during heating and cooling. In fact, at a given deflection lower than 1.5 mm, CuNiTi force-temperature transition points are shifted at temperature levels higher than those of the NiTi wire. Temperature transitions as a function of the deflection level are reported in Table 4. The overall two-way ANOVA results and statistical differences among the mean values according to the Tukey’s post hoc test are reported in Table 5 and Figure 5, respectively.
4. Discussion
Bending properties of superelastic archwires largely depends on the temperature level [2,8,24,25,26,27]. In Part I of this investigation it has been shown that the alloy type and the archwire’s dimension are the main tools for tailoring forces to be released to teeth by elastic archwires. However, temperature variation (e.g. temporary heating) and the deflection level largely affect the force that a superelastic archwire releases to teeth.
4.1. Phase Transition Temperatures of Unstressed NiTi and CuNiTi Archwires
Thermograms and measurements of temperature transitions occurring in the unstressed NiTi and CuNiTi archwires using the calorimetric approach are reported in Figure 2 and Table 4, respectively. A single endothermic peak during heating, and a single exothermic peak during cooling can be observed from both NiTi and CuNiTi archwires (Figure 2). Thus suggesting that solid phase transformation from austenite to martensite occurs without the formation of an intermediate phase.
Upon heating, the As and the Af temperatures can be determined through the intercept method (i.e. the tangent method). The Af temperature (Figure 2a) detected for the NiTi Biostarter wire 25.0°C (±1.9) is consistent with the Af value of 23.6°C reported by Brauchli et al. for a similar wire produced by the same manufacturer [28]. Interestingly, As, Af, Ms and Mf temperature transitions (Figure 2a and Table 3) are very close to those (19.4°C, 22.7°C, 20.8°C and 17.7°C, respectively) reported by Rodrigues et al. [2], while they fall within the range of temperatures (11.2°C, 32.2°C, 29.5°C and 8.8°C, respectively) documented by Kusy and Whitley [12]. Little is known on DSC temperature transitions for the investigated CuNiTi wire (Figure 2b and Table 3). However, among the variety of data available for CuNiTi wires, those known as CuNiTi27 and CuNiTi35 present very similar As and Af temperatures [8,12,29].
In clinical practice, Af is considered the most important temperature, and the Af value of a super-elastic arch wire is often reported by the producer of the wire [30], and the superelastic effect of an applied orthodontic wire is observed if this temperature is lower than the oral temperature [31,32,33]. In particular, using the intercept method around the endothermic peak occurring through the heating step (Figure 2), the Af temperatures of NiTi and CuNiTi are 25.0 (±1.9) °C and 29.7 (±1.8) °C, respectively. These temperature levels, lower than the mean temperature occurring in clinical condition (Table 1), would suggest that these wires are in the austenitic phase. Instead, as it will be later shown, a different scenario can be drawn for the Af temperature of deflected NiTi and CuNiTi wires.
4.2. Effect of the Deflection Level on Af and Ms Temperatures
By using temperature sweep between 5°C and 55°C on stressed NiTi and CuNiTi (Figure 3 and Figure 4), a different scenario can be drawn for the Af and Ms temperatures measured through DSC (Table 4). For both investigated wires, Af and Ms temperatures largely depend on the stress level and it significantly increases (p<0.05) as the deflection level (i.e. the stress state of the wire) increases. Interestingly, for each type of wire (Figure 5), the As and the Mf temperature are almost independent of the deflection level. For the NiTi wire, As and Mf are slightly higher than those measured through DSC, however differences are not statistically significant. Instead, for the CuNiTi, As and Mf values of deflected wires are significantly higher (p<0.05) than those measured through DSC.
For both NiTi and CuNiTi wires, Table 5 suggests that at the 0.05 level, both the population means of transition type (i.e. As, Af, Ms, Mf) and the population means of deflection are significantly different. Moreover, for both archwires, the interaction between Transition Type and Deflection is significant.
Therefore, according to the above results, the first null hypothesis is rejected; temperature transitions measured on deflected wires through heating and cooling sweep tests largely differ from those measured through DSC.
The main limitation of the adopted approach for determining Ms and Af as a function of the level of deflection are the maximum (55°C) and the minimum (5°C) temperatures that the employed equipment is capable to provide. The upper limit prevented to determine Ms and Af at higher level of deflection, especially for the CuNiTi wire. However, the overlapping of the force released profiles for deflection levels higher than 1.5 mm (Figure 4), suggests that end extremes for Ms and Af are close to 55°C, respectively. Further research is needed to assess Ms and As values at high deflection levels for NiTi and CuNiTi archwires. These temperatures are of paramount importance for assessing the structure state of the superelastic alloy applied into the human body.
4.3. Effect of Temperature on the Force Released by NiTi and CuNiTi Wires
Unfortunately, to the authors’ knowledge, no experiments investigating the effect of heating and cooling scans on highly deflected superelastic wires (Figure 3 and Figure 4), in real static condition, have been previously carried out. Indeed, this kind of test may better explore temperature effects on the force released by superelastic wires simulating the clinical condition. In fact, an applied wire, deflected at a given amount, almost preserves its configuration (deflection) during the daily temperature variation of the oral cavity, thus suggesting a static condition. Instead, all literature data concerning temperature dependence of the force plateau level is merely based on a quasi-static loading and unloading bending test at a fixed temperature level. Concerns related to this latter approach are evident from the load vs deflection curves, reported for many wires, at temperature close to or lower than Mf. These curves show a residual deflection upon unloading of the wire preventing the detection of a plateau region [1,2,25], thus suggesting a null force released by the wire at that temperature. This residual displacement is an effect of the loading stage, and its extension increases as the maximum deflection level increases [2,26]. Figure 6a shows the load vs deflection curve for the CuNiTi wire tested at 20°C. Testing temperature is close to Mf, therefore at the beginning of the loading stage, the wire is in the martensitic state, and at about 1.2 mm a plastic deformation takes place A wire applied in the oral cavity at a given configuration is no further deflected. Therefore, it is questionable that such a residual deflection may occur in clinical practice. Literature data based on DTMA (Table 1), including those in Figure 3, suggests that a superelatic wire has the ability to elastically react to deflection even at very low temperature levels. Therefore, quasi-static loading and unloading bending test at low temperature failed to provide the plateau level.
On the other hand, at body temperature, the force level largely differs if this temperature occurs after heating or cooling [1]. The scenario concerning the force released by a superelastic wire as suggested by Figure 3 and Figure 4 is much more complex than that reported in the literature. Is there any relationship between force data reported in Figure 3 and Figure 4 and the load plateau levels reported in the literature for similar NiTi and CuNiTi wires? The following literature data on NiTi wires has been retrieved and adapted according to the different experimental methodology, as reported in Figure 7. Load plateau values of the same type of wire [26,30] are converted in Newton and the previously discussed 100% increase [34,35], ascribed to the passive self-ligating brackets, is considered (see Part I). Load plateau values [11] of a similar wire, produced by the same manufacturer of our investigated NiTi wires, but with a rectangular cross-section (0.016x0.022), are adapted considering the ratio between the second moment of area as described in Part I. Force plateau values [2] for a similar NiTi wire, but with a square cross-section (length=0.016’’), are adapted considering the ratio between the second moment of area. Force plateau values [24] of a similar wire, produced by the same manufacturer of our investigated NiTi wires, are converted in Newton and a reduction of 9% is applied for accounting the lower span length as discussed in Part I of this investigation. Force plateau detected by Ijima et al. [1], on a wire having a similar Af temperature, where adapted considering differences in the second moment of area.
The deflection level (Figure 3) at which the heating and cooling temperature scans better accommodates the above literature data is the one occurring at 0.50 mm (Figure 7) and it represents the end point of the unloading plateau (Figure 6b). All plateau force levels detected at 37°C [1,2,11,30,36], including those reported in Part I of this investigation, fall within the range of forces detected at the deflection of 0.5 mm (Figure 7).
Instead, plateau levels observed at temperature values lower or higher than 37°C [2,11,24,26] largely differ from the range of values suggested by the thermomechanical profile at the deflection of 0.50 mm. However, it can be observed that those occurring at temperature lower than 37°C are below the themomechanical profile, while those measured at temperature higher than 37°C fall above the themomechanical profile. This is not a coincidence. At temperature levels lower or higher than 37°C the end point of the plateau extension decreases or increases, respectively [2,11]. Therefore, thermomechanical profiles different from that reported in Figure 7 (e.g. those at D=0.25 mm and D=1.0 mm of Figure 3), corresponding to the profile deflected at the plateau end point at a temperature different than 37°C, should be considered for describing plateau levels occurring at testing temperature lower or higher than 37°C, respectively.
Nevertheless, plateau levels reported in Figure 7, occurring at testing temperature close to or lower than 20°C [2,11,26], represent an underestimation as testing temperature is close to Mf and plastic deformation takes place during the loading cycle (Figure 6a). It is also worth to observe that literature data, based on loading and unloading bending tests at a fixed temperature (e.g. 37°C), suggest that the plateau extension increases as the maximum deflection level is increased [11,24,25]. Among the start, the middle and the end points of the load plateau extension occurring upon unloading, only the end point can be considered independent of the maximum deflection occurring in the loading stage [11].
Our results suggest that the plateau force levels detected at 37°C for NiTi wires, and those documented in the literature, seems to describe the wire’s behaviour only at the deflection level corresponding to the end point of the force plateau extension. This result is also corroborated by the static TMA profile shown for CuNiTi (Figure 8b). Once the a superelastic wire is applied, in stable condition (i.e. neglecting displacements occurring in a single day attitudes), the force developed by the wire will depend on deflection, temperature and direction. This force falls within the static cooling and heating profiles reported in Figure 8. The released force increases only up to a certain limit of deflection (D=1.5 mm for both type of wires); above this limit, the force seems to be independent of the deflection amount (as suggested by the overlapping of the thermomechanical profiles above this limit).
In summary, according to the above results, the second null hypothesis is rejected. Archwires’ force variations measured through temperature sweep tests may predict those occurring through classic bending tests at 37°C. However, further research is recommended for further supporting rejection of the second null hypothesis at temperature levels different from 37°C.
4.4. Clinical Outcames and the Effect of Oral Temperature Variation on NiTi and CuNiTi Orthodontic Wires
The proposed static TMA approach investigates the behavior of superelastic orthodontic wires, encompassing a simple, comprehensive and reproducible setup expected to aid in the future optimization of orthodontic treatments. Through this approach, the wire is kept deflected at a constant level while being heating and cooled. This in vitro methodology better describes the clinical orthodontic treatment. In fact, once the wire is engaged into the brackets, it preserves its bent configuration. No further deflection occurs, at least not in the daily attitudes. No stress-induced martensite (SIM) occurs, and the SIM phase eventually produced during the engagement of the wire into the brackets disappears as a hot drink or food is ingested as an effect of the shape memory recovery. In fact, in Part I of this investigation, it has been shown that by introducing a hold deflection signal in conjunction with a temporary heating, superelastic NiTi and CuNiTi wires release a force up to 50% higher than that measured through quasi-static bending tests. Iijima et al. [1] found a similar result. For CuNiTi wires, Kusy & Whitley [12] documented a force increase by more than 40% as a consequence of the ingestion of a hot drink. However, they concluded that this increase remains constant until temperature is reduced below room temperature, close to 0°C (being this temperature lower than Ms for CuNiTi27). Below the plateau end level, our results are consistent with the finding of Kusy & Whitley [12], but we also suggest that for highly deflected wires Ms is higher than 37°C.
For a superelastic wire in the stable condition the released load depends on both temperature and deflection. Among transition temperatures, Af and Ms are more sensitive to deflection.
Our results suggest a new scenario for the superelastic effect (i.e. the release of a constant force during the orthodontic treatment) reported over the past half century. Once the wire is applied, and its structure stabilizes as a consequence of a temporary heating, the released force will depend on both deflection and temperature levels. The broadly reported plateau force levels at 37°C represent just a single block puzzle of the force scenario occurring at a specific deflection level, as depicted in Figure 8.
It is worth to note that the effect of e temporary heating on the released force (reported in Part 1), as well as maximum load detected through static TMA (Figure 3 and Figure 4), returns a structure to a load close to the loading plateau. Thus suggesting that the upper plateau of classic bending tests represents the upper boundary limit for the force released by the wire. Higher attention should be given to the loading plateau.
5. Conclusions
A new insight is provided for the behavior of superelastic orthodontic wires. The following conclusion may be drawn:
- -
- The proposed static TMA approach encompasses a simple, comprehensive and reproducible setup expected to aid in the future optimization of orthodontic treatments.
- -
- By using static TMA, the force released by superelastic wires and transition temperatures are straightforward addressed.
- -
- The plateau force levels at 37°C only represent the lower boundary force that a superelastic wire releases at 37°C.
- -
- For both NiTi and CuNiTi, plateau force levels at 37°C can be predicted by the static TMA profile matching the end point of the force plateau extension.
- -
- Once the wire is applied, and its structure stabilizes, the released force depends on both deflection and temperature levels.
- -
- The released force increases by increasing the deflection level only up to a certain limit of deflection, above this limit, the force is independent of the deflection amount.
- -
- The austenitic finish (Af) and martensitic start (Ms) temperatures steeply increase as the deflection level increases.
- -
- Temporary heating or cooling returns a wire’s structure more plentiful of austenitic phase or martensitic phase, respectively. Thus affecting the magnitude of the force released by the wire.
- -
- At fixed deflection and temperature levels, the released force may span between two extremes according to the type and magnitude of the temporary thermal event. The higher the relative difference between the fixed temperature level and the transition temperatures (Mf<As<T<Ms<Af), the higher will be the extension of the range over which the force may span.
- -
- At deflection levels lower than 1.0 mm, the force released by CuNiTi wires spans over a range wider than that of the NiTi wire. The opposite occurs for deflection levels higher than 1.5 mm.
Author Contributions
Conceptualization, R.D.S., A.G.; methodology, A.G., R.D.S..; investigation A.G., R.D.S.; resources, V.D. and M.S.; data curation, A.G. and R.D.S.; writing—original draft preparation, R.D.S. and V.D.; writing—review and editing, A.G. and R.D.S.; supervision, R.D.S. All authors have read and agreed to the published version of the manuscript.
Funding
This research received no external funding.
Institutional Review Board Statement
Not Applicable.
Informed Consent Statement
Not Applicable.
Data Availability Statement
Raw measurements and the analyzed datasets are available from the authors on reasonable request.
Acknowledgments
The authors wish to thank Prof. Alberto Laino and Prof. Sandro Rengo of the University Federico II of Naples for useful discussions.
Conflicts of Interest
The authors declare no conflicts of interest.
References
- Iijima, M.; Ohno, H.; Kawashima, I.; Endo, K.; Mizoguchi, I. Mechanical Behavior at Different Temperatures and Stresses for Superelastic Nickel–Titanium Orthodontic Wires Having Different Transformation Temperatures. Dental Materials 2002, 18, 88–93. [CrossRef]
- Rodrigues, P. F. ; Fernandes, F. B. ; Magalhães, R. ; Camacho, E. ; Lopes, A. ; Paula, A. S. ; Basu R. ; Schell, N. Thermo-mechanical characterization of NiTi orthodontic archwires with graded actuating forces. Journal of the mechanical behavior of biomedical materials 2020, 107, 103747.
- Stoyanova-Ivanova, A.; Georgieva, M.; Petrov, V.; Andreeva, L.; Petkov, A.; Georgiev, V. Effects of Clinical Use on the Mechanical Properties of Bio-Active®(BA) and TriTanium®(TR) Multiforce Nickel-Titanium Orthodontic Archwires. Materials 2023, 16(2), 483. [CrossRef]
- Shaw, J. Thermomechanical Aspects of NiTi. Journal of the Mechanics and Physics of Solids 1995, 43, 1243–1281. [CrossRef]
- Longman, C.M.; Pearson, G.J. Variations in tooth, surface temperature in the oral cavity during fluid intake. Biomaterials. 1987 Sep 1;8(5):411-4.
- Airoldi, G.; Riva, G.; Vanelli, M.; Garattini, G. Oral environment temperature changes induced by cold/hot liquid intake. American Journal of Orthodontics and Dentofacial Orthopedics, 1997, 112.1: 58-63.
- Moore, R. Intra-Oral Temperature Variation over 24 Hours. The European Journal of Orthodontics 1999, 21, 249–261. [CrossRef]
- Laino, G.; De Santis, R.; Gloria, A.; Russo, T.; Quintanilla, D.S.; Laino, A.; Martina, R.; Nicolais, L.; Ambrosio, L. Calorimetric and Thermomechanical Properties of Titanium-Based Orthodontic Wires: DSC-DMA Relationship to Predict the Elastic Modulus. J Biomater Appl 2012, 26, 829–844. [CrossRef]
- Choi, J.E.; Waddell, J.N.; Lyons, K.M.; Kieser, J.A. Intraoral pH and temperature during sleep with and without mouth breathing. Journal of oral rehabilitation. 2016 May;43(5):356-63.
- Bradley, T.G.; Brantley, W.A.; Culbertson, B.M. Differential Scanning Calorimetry (DSC) Analyses of Superelastic and Nonsuperelastic Nickel-Titanium Orthodontic Wires. Am J Orthod Dentofacial Orthop 1996, 109, 589–597. [CrossRef]
- Fischer-Brandies, H.; Es-Souni, M.; Kock, N.; Raetzke, K.; Bock, O. Transformation Behavior, Chemical Composition, Surface Topography and Bending Properties of Five Selected 0.016" x 0.022" NiTi Archwires. J Orofac Orthop 2003, 64, 88–99. [CrossRef]
- Kusy, R.P.; Whitley, J.Q. Thermal and mechanical characteristics of stainless steel, titanium-molybdenum, and nickel-titanium archwires. American journal of orthodontics and dentofacial orthopedics 2007, 131(2), 229-237.
- Nespoli, A.; Passaretti, F.; Szentmiklósi, L.; Maróti, B.; Placidi, E.; Cassetta, M.; Tian, K.V. Biomedical NiTi and β-Ti Alloys: From Composition, Microstructure and Thermo-Mechanics to Application. Metals 2022, 12(3), 406.
- Sakima, M.T.; Dalstra, M.; Melsen, B. How does temperature influence the properties of rectangular nickel–titanium wires?. The European Journal of Orthodontics 2006, 28(3), 282-291.
- Miyazaki, S.; Otsuka, K.; Suzuki, Y. Transformation pseudoelasticity and deformation behavior in a Ti-50.6 at% Ni alloy. Scripta Metallurgica 1981, 15(3), 287-292.
- Kusy, R.P.; Wilson, T.W. Dynamic mechanical properties of straight titanium alloy arch wires. Dental Materials 1990, 6(4), 228-236.
- Lahoz, R.; Puértolas, J.A. Training and two-way shape memory in NiTi alloys: influence on thermal parameters. Journal of alloys and compounds 2004, 381(1-2), 130-136.
- Florian, G.; Gabor, A.R.; Nicolae, C.A.; Rotaru, A.; Marinescu, C.A.; Iacobescu, G.; Rotaru, P. Physical and thermophysical properties of a commercial Ni–Ti shape memory alloy strip. Journal of Thermal Analysis and Calorimetry 2019, 138, 2103-2122.
- Silva, P.C.; Grassi, E.N.; Araújo, C.J.; Delgado, J.M.; Lima, A.G. NiTi SMA Superelastic Micro Cables: Thermomechanical Behavior and Fatigue Life under Dynamic Loadings. Sensors 2022, 22(20), 8045.
- Santoro, M.; Beshers, D.N. Nickel-titanium alloys: stress-related temperature transitional range. American Journal of Orthodontics and Dentofacial Orthopedics 2000, 118(6), 685-692.
- Deng, Z.; Huang, K.; Yin, H.; Sun, Q. Temperature-dependent mechanical properties and elastocaloric effects of multiphase nanocrystalline NiTi alloys. Journal of Alloys and Compounds 2023, 938, 168547.
- Agarwal, N.; Ryan Murphy, J.; Hashemi, T.S.; Mossop, T.; O’Neill, D.; Power, J.; Brabazon, D. Effect of Heat Treatment Time and Temperature on the Microstructure and Shape Memory Properties of Nitinol Wires. Materials 2023, 16(19), 6480.
- Ronca, D.; Gloria, A.; De Santis, R.; Russo, T.; D’Amora, U.; Chierchia, M.; Ambrosio, L. Critical analysis on dynamic-mechanical performance of spongy bone: the effect of an acrylic cement. Hard Tissue 2014, 3(1), 9-16.
- Tonner, R.I.; Waters, N.E. The Characteristics of Super-Elastic Ni-Ti Wires in Three-Point Bending. Part I: The Effect of Temperature. Eur J Orthod 1994, 16, 409–419. [CrossRef]
- Yanaru, K.; Yamaguchi, K.; Kakigawa, H.; Kozono, Y. Temperature-and deflection-dependences of orthodontic force with Ni-Ti wires. Dental materials journal 2003, 22(2), 146-159.
- Lombardo, L.; Toni, G.; Stefanoni, F.; Mollica, F.; Guarneri, M. P.; Siciliani, G. The effect of temperature on the mechanical behavior of nickel-titanium orthodontic initial archwires. The Angle Orthodontist 2013, 83(2), 298-305.
- Sabbagh, H.; Janjic Rankovic, M.; Martin, D.; Mertmann, M.; Hötzel, L.; Wichelhaus, A. Load Deflection Characteristics of Orthodontic Gummetal® Wires in Comparison with Nickel–Titanium Wires: An In Vitro Study. Materials 2024, 17(2), 533. [CrossRef]
- Brauchli, L.M.; Keller, H.; Senn, C.; Wichelhaus, A. Influence of bending mode on the mechanical properties of nickel-titanium archwires and correlation to differential scanning calorimetry measurements. American Journal of Orthodontics and Dentofacial Orthopedics 2011, 139(5), e449-e454.
- Biermann, M.C.; Berzins, D.W.; Bradley, T.G. Thermal analysis of as-received and clinically retrieved copper-nickel-titanium orthodontic archwires. The Angle Orthodontist 2007, 77(3), 499-503.
- Lombardo, L.; Marafioti, M.; Stefanoni, F.; Mollica, F.; Siciliani, G. Load Deflection Characteristics and Force Level of Nickel Titanium Initial Archwires. Angle Orthod 2012, 82, 507–521. [CrossRef]
- Kusy, R.P. A Review of Contemporary Archwires: Their Properties and Characteristics. Angle Orthod 1997, 67, 197–207. [CrossRef]
- Lombardo, L.; Arreghini, A.; Al Ardha, K.; Scuzzo, G.; Takemoto, K.; Siciliani, G. Wire Load-Deflection Characteristics Relative to Different Types of Brackets. Int Orthod 2011, 9, 120–139. [CrossRef]
- Bartzela, T.N.; Senn, C.; Wichelhaus, A. Load-Deflection Characteristics of Superelastic Nickel-Titanium Wires. Angle Orthod 2007, 77, 991–998. [CrossRef]
- Wilkinson, P. D.; Dysart, P. S.; Hood, J. A.; Herbison, G. P. Load-deflection characteristics of superelastic nickel-titanium orthodontic wires. American journal of orthodontics and dentofacial orthopedics 2002, 121(5), 483-495.
- Nucera, R.; Gatto, E.; Borsellino, C.; Aceto, P.; Fabiano, F.; Matarese, G.; Cordasco, G. Influence of bracket-slot design on the forces released by superelastic nickel-titanium alignment wires in different deflection configurations. The Angle Orthodontist 2014, 84(3), 541-547.
- Nakano, H.; Satoh, K.; Norris, R.; Jin, T.; Kamegai, T.; Ishikawa, F.; Katsura, H. Mechanical Properties of Several Nickel-Titanium Alloy Wires in Three-Point Bending Tests. Am J Orthod Dentofacial Orthop 1999, 115, 390–395. [CrossRef]
Figure 1.
Methodologies for determining transition temperature of superelastic archwires in the unstressed condition (a) and in the stressed condition (c). Transition temperatures in the unstressed state of the wires were computed using the intercept method of the tangent lines around the endothermal and exothermal peaks (b). Transition temperatures in the stressed state of the wires were computed using the intercept method of the tangent lines (d).
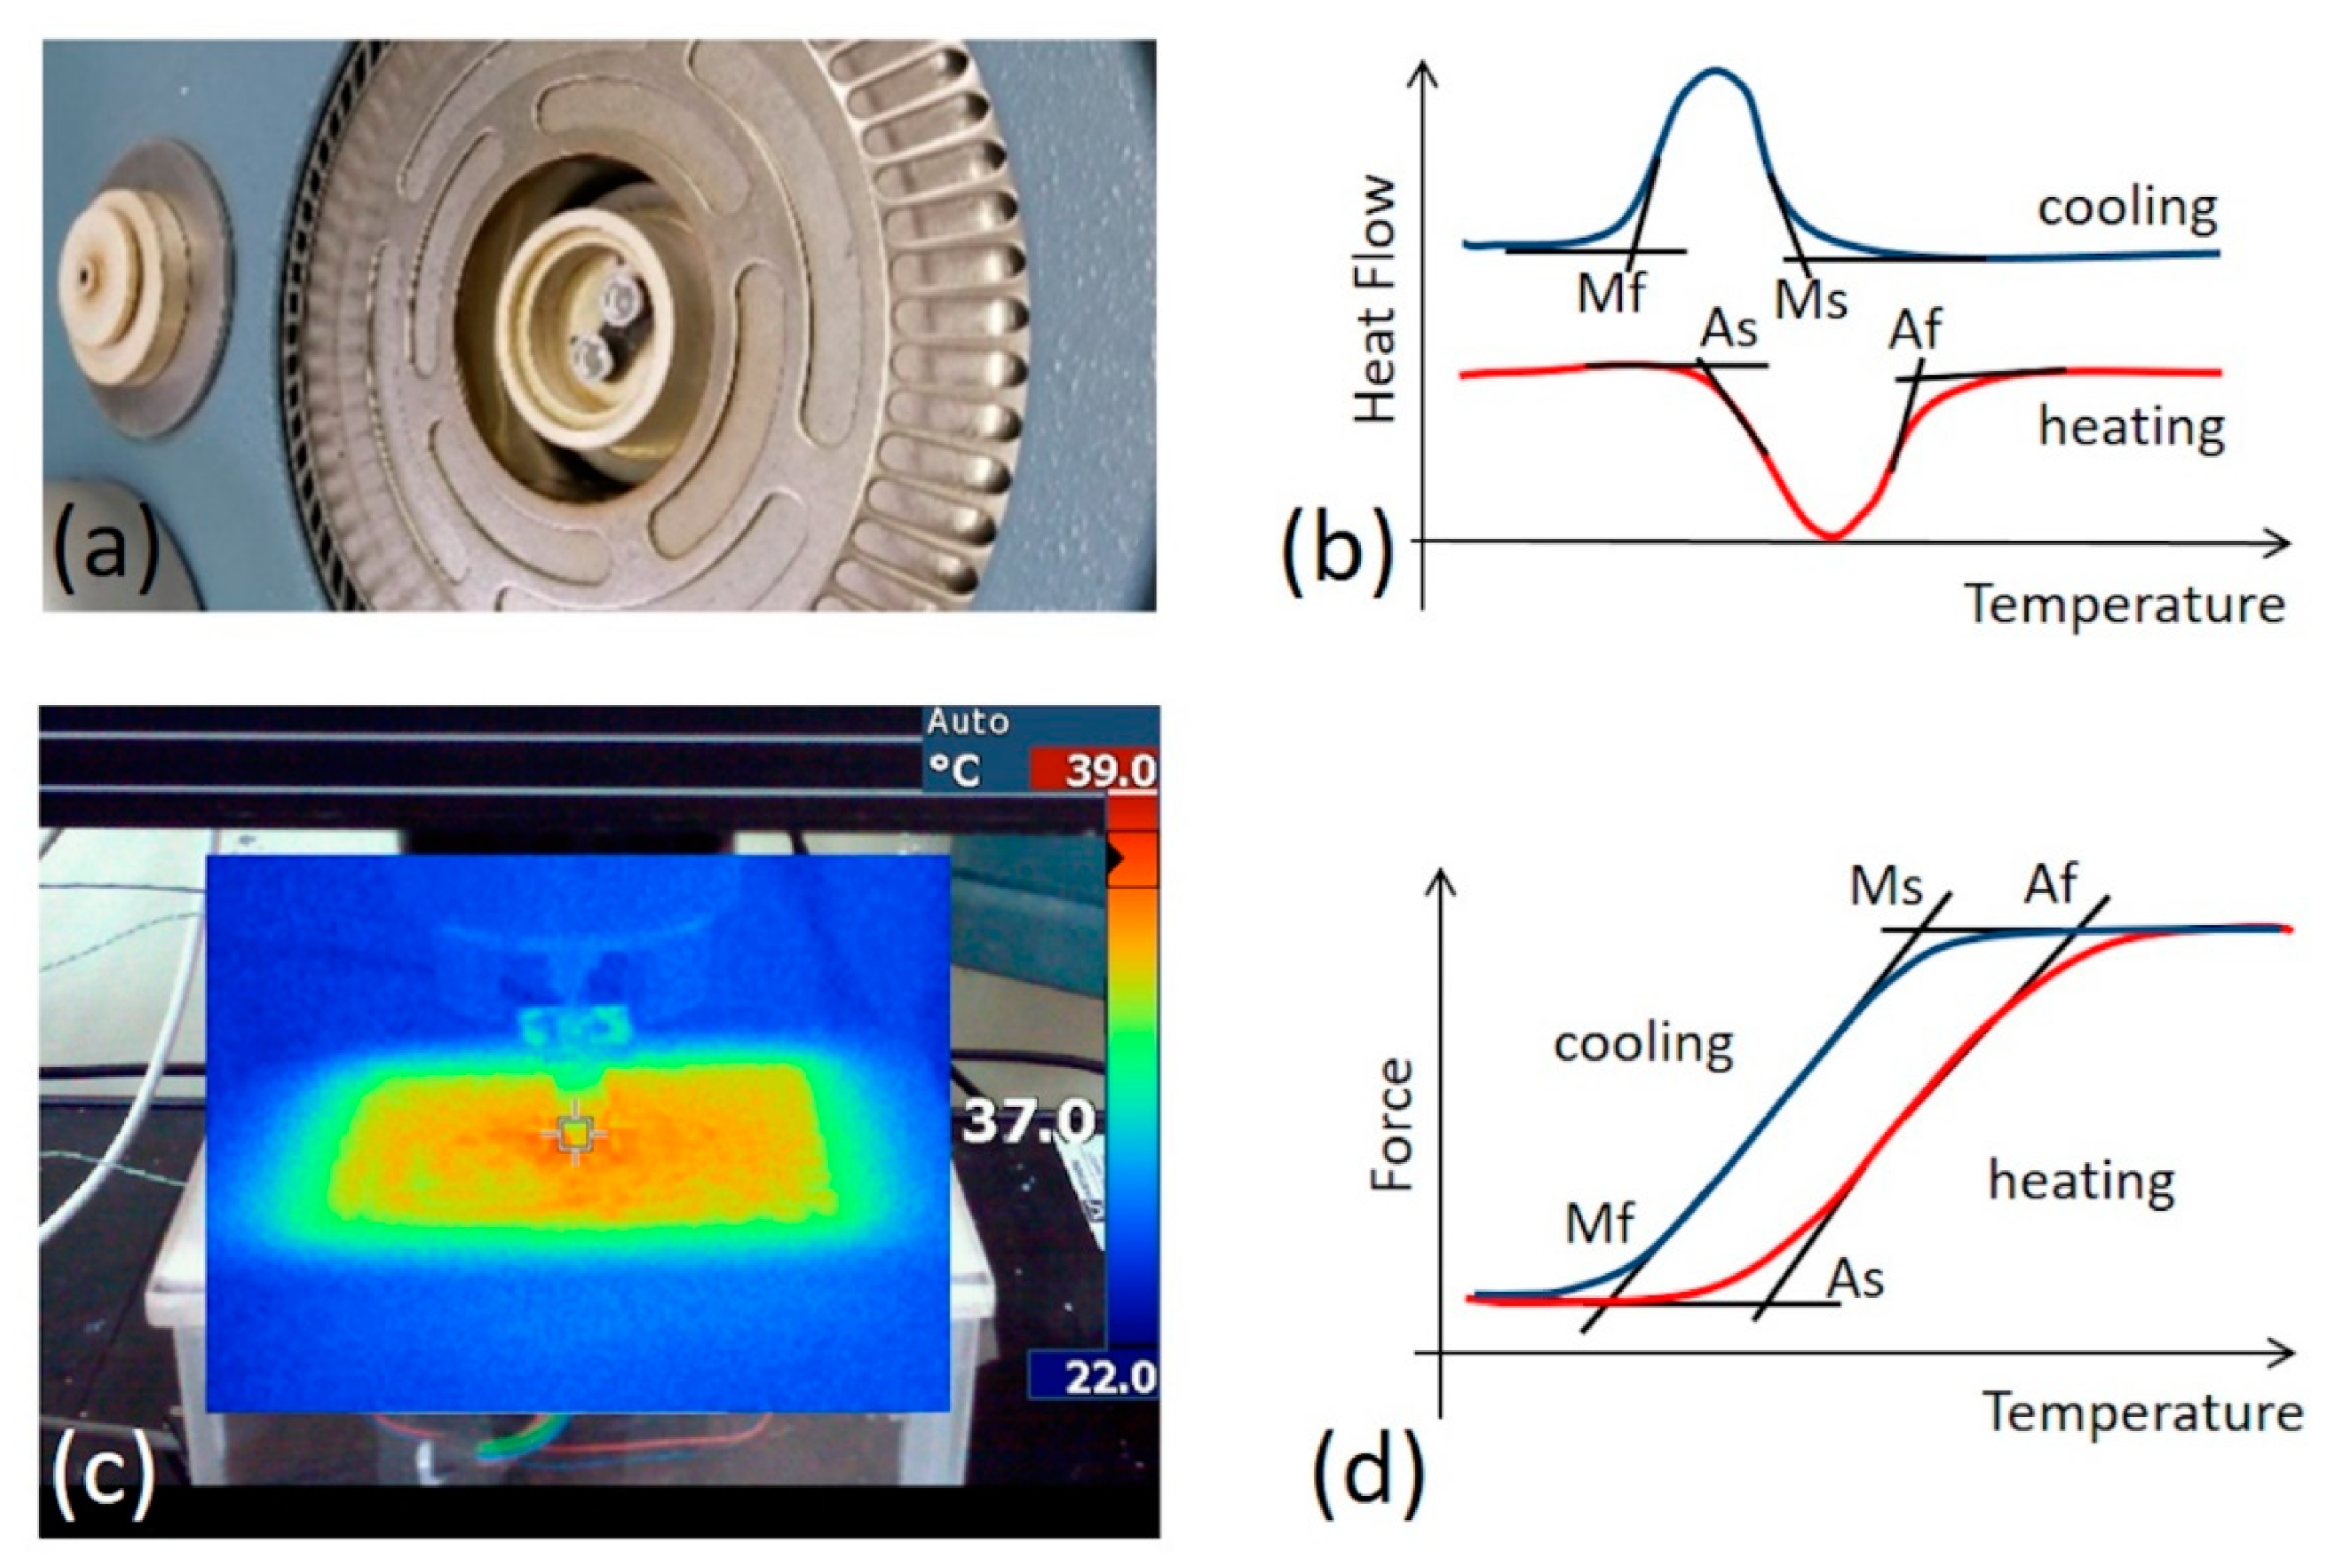
Figure 2.
Typical heat-flow vs temperature profiles of (a) NiTi and (b) CuNiTi wires during heating and cooling, showing temperature transitions defined through the intercept method.
Figure 2.
Typical heat-flow vs temperature profiles of (a) NiTi and (b) CuNiTi wires during heating and cooling, showing temperature transitions defined through the intercept method.
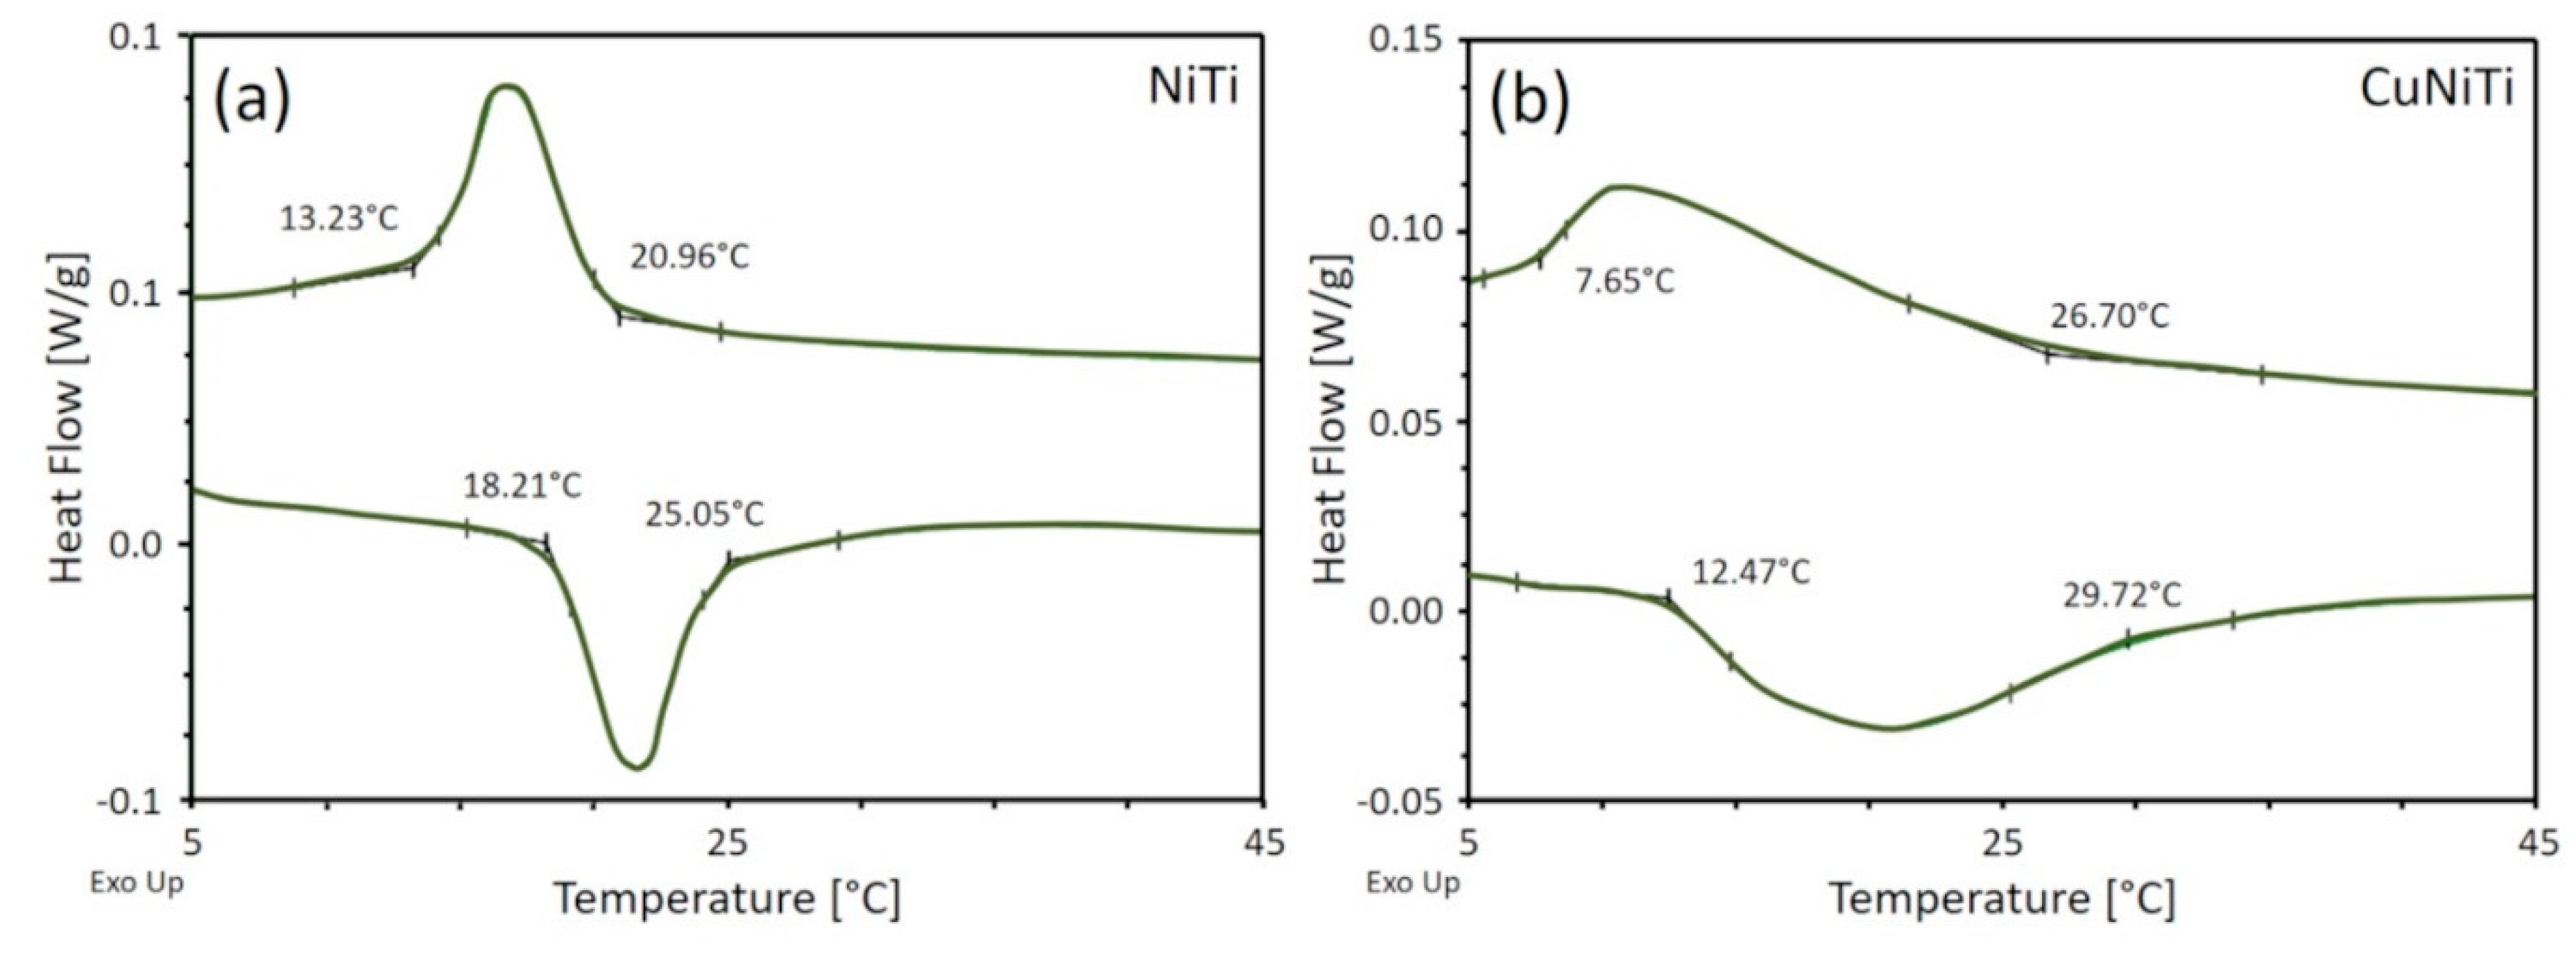
Figure 3.
Typical force-temperature behaviour of NiTi wires with the round cross-section of 0.016” at discrete deflection levels of (a) 0.25 mm, (b) 0.50 mm, (c) 1.00 mm, (d) 1.50 mm, (e) 2.00 mm, (f) 2.5 mm showing the computation of transition temperature during heating (red profiles) and cooling (blu profiles). All force temperature profiles are superimposed in (g).
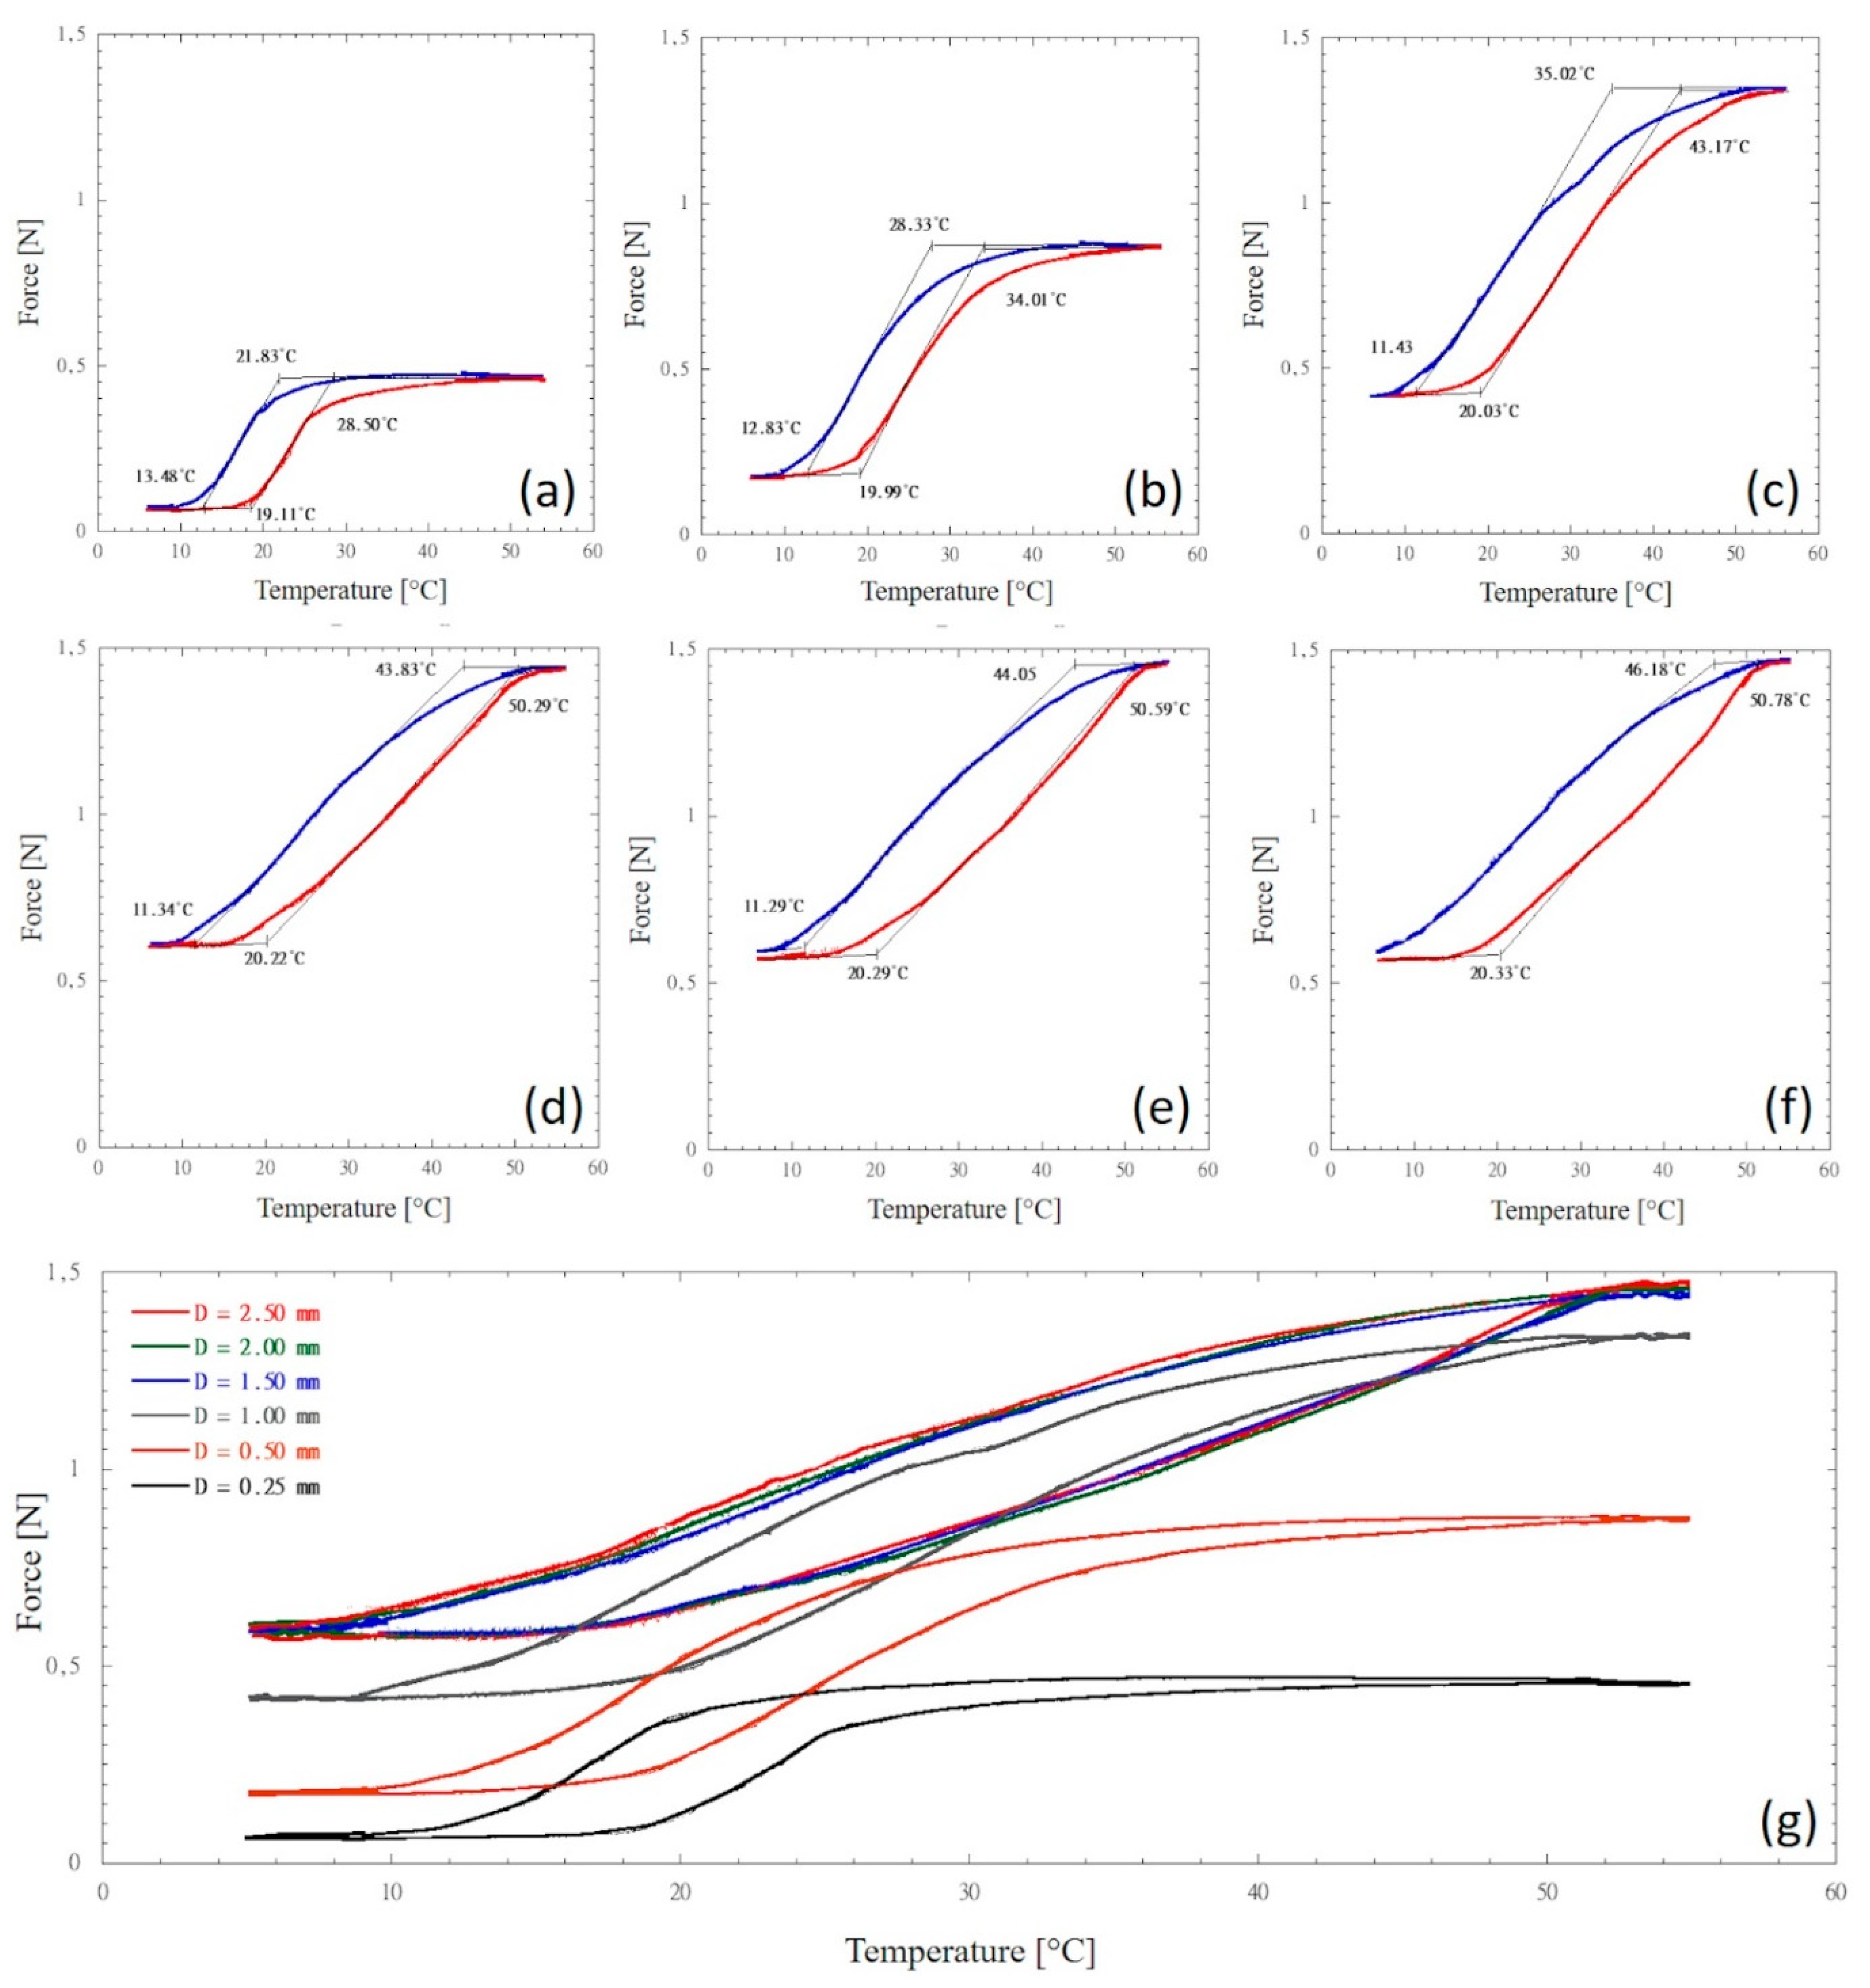
Figure 4.
Typical force-temperature behaviour of CuNiTi wires with the round cross-section of 0.016” at discrete deflection levels of (a) 0.25 mm, (b) 0.50 mm, (c) 1.00 mm, (d) 1.50 mm, (e) 2.00 mm, (f) 2.5 mm showing the computation of transition temperature during heating (red profiles) and cooling (blu profiles). All force temperature profiles are superimposed in (g).
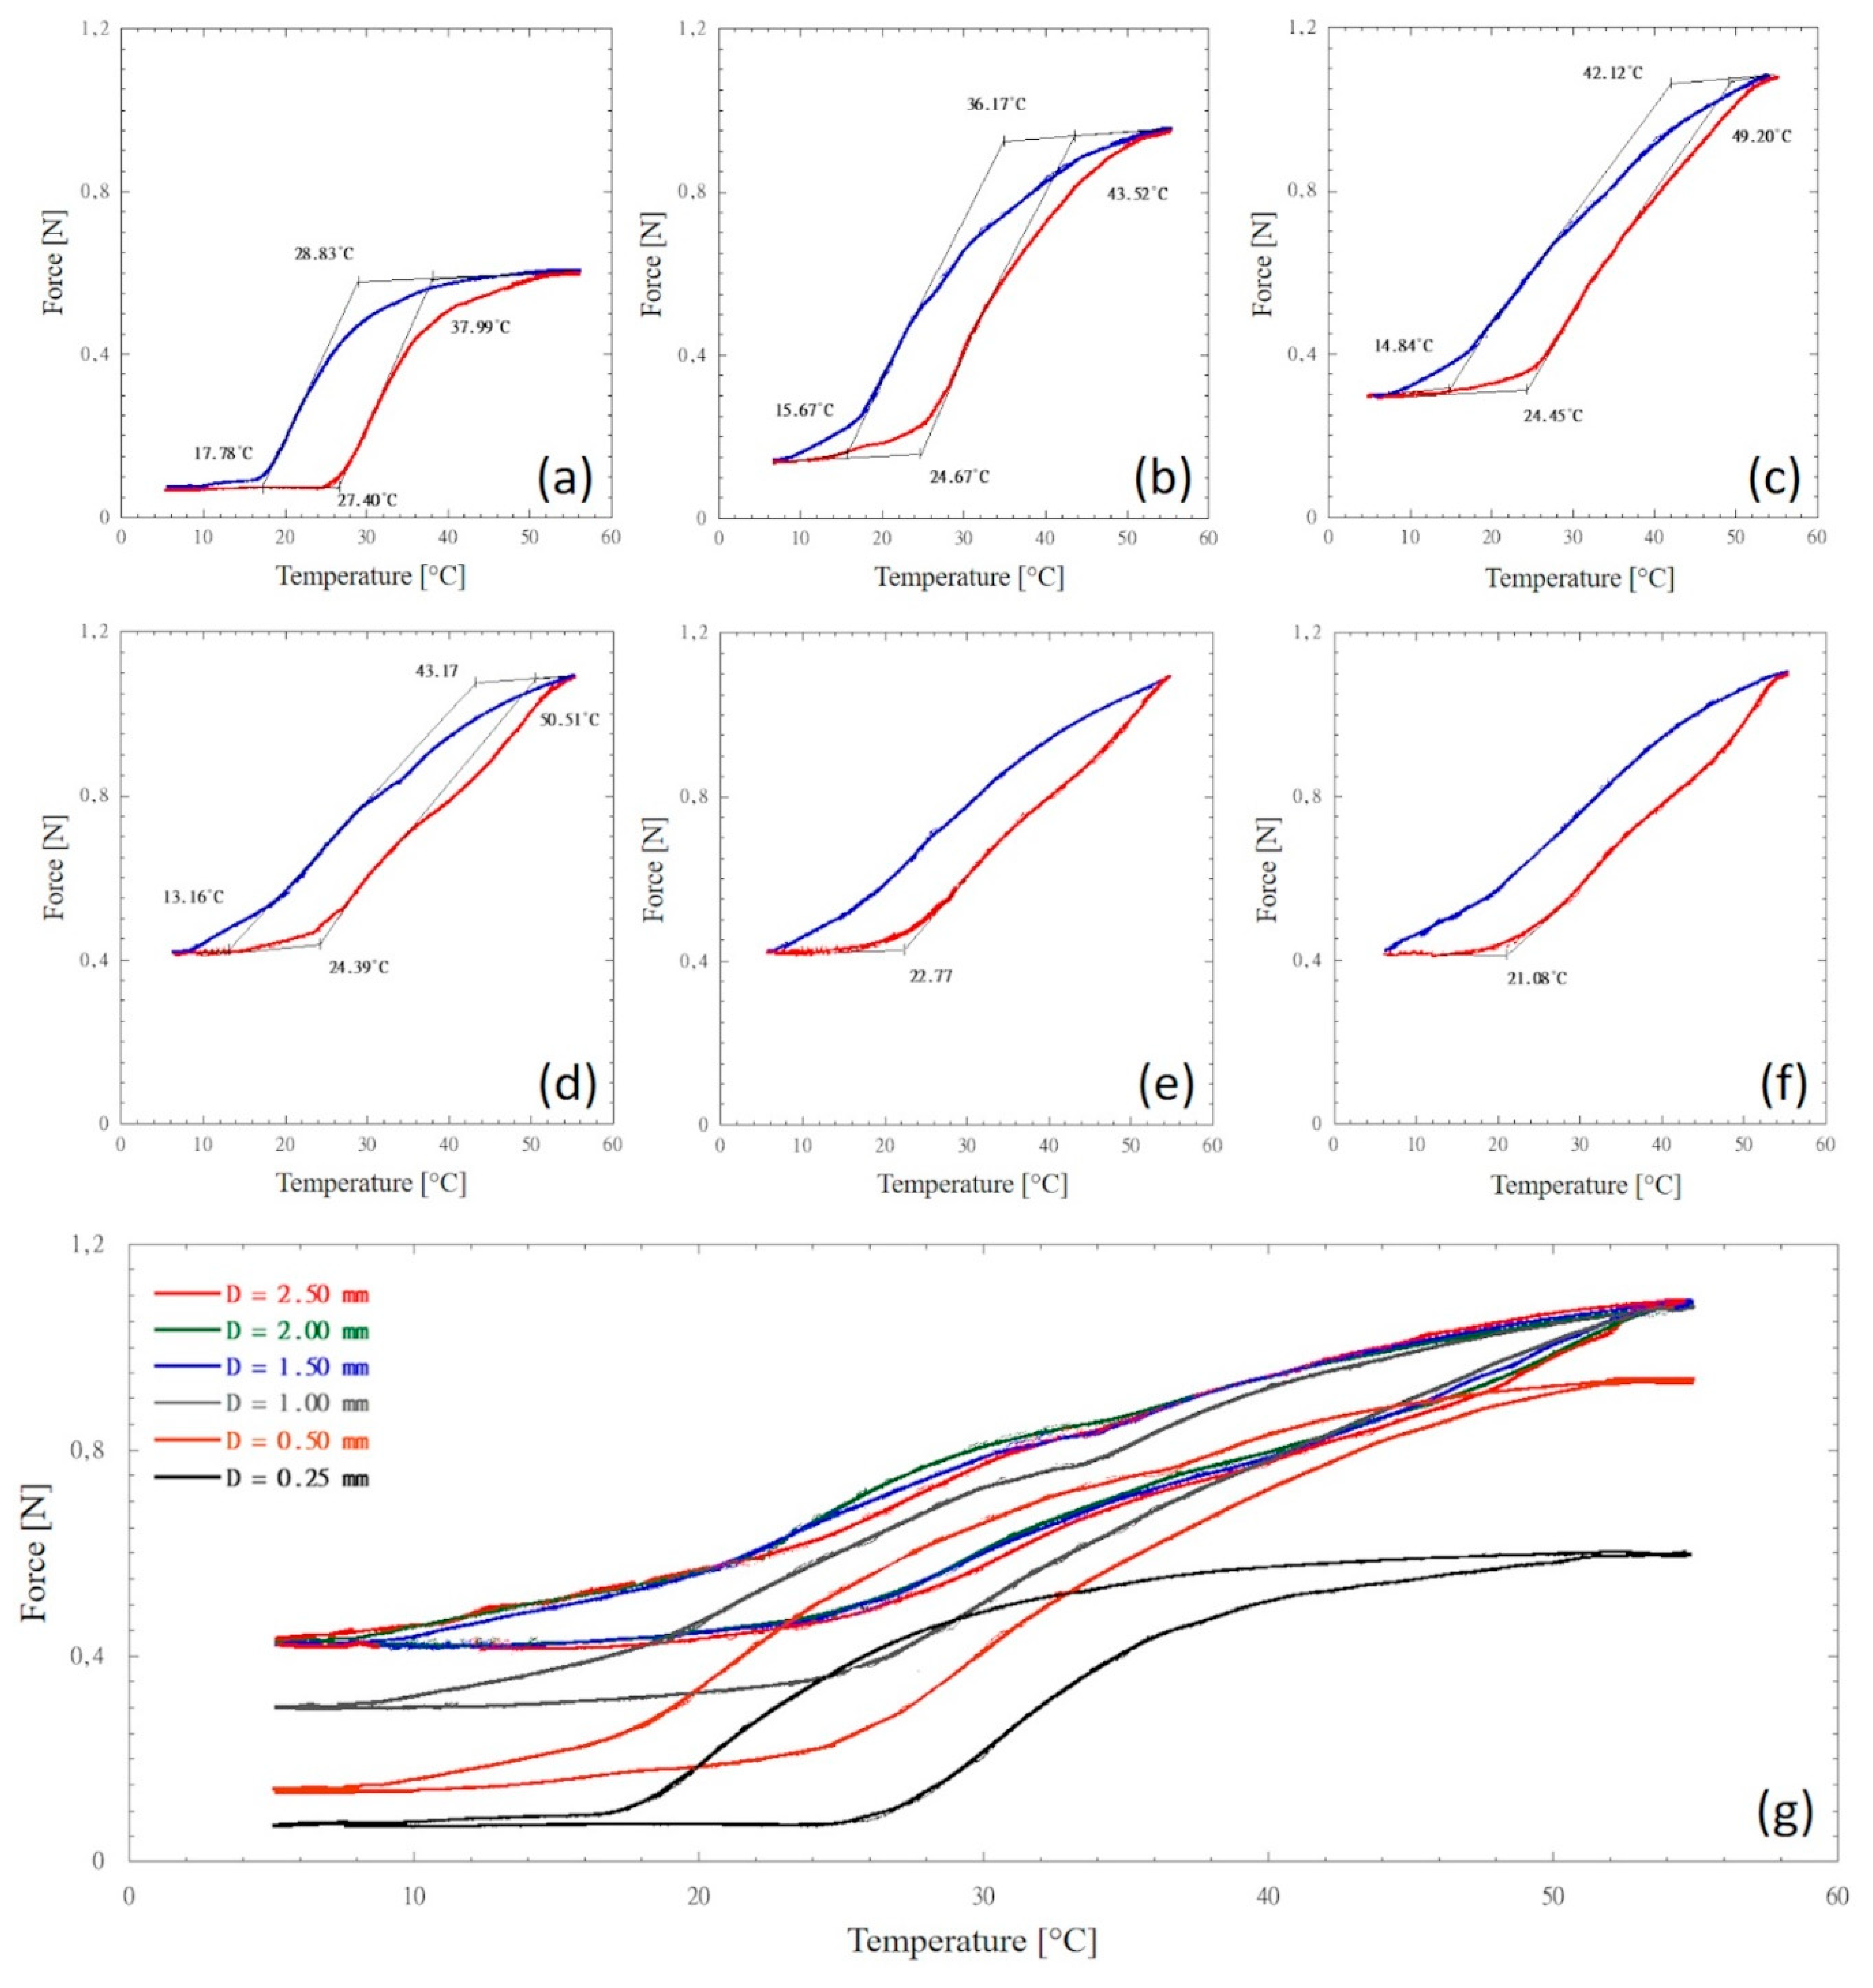
Figure 5.
Transition temperatures distribution as a function of the deflection level for (a) NiTi and (b) CuNiTi. Significant differences among the population means of transition type (i.e. As, Af, Ms, Mf) according to Tukey’s post hoc test are denoted with *.
Figure 5.
Transition temperatures distribution as a function of the deflection level for (a) NiTi and (b) CuNiTi. Significant differences among the population means of transition type (i.e. As, Af, Ms, Mf) according to Tukey’s post hoc test are denoted with *.
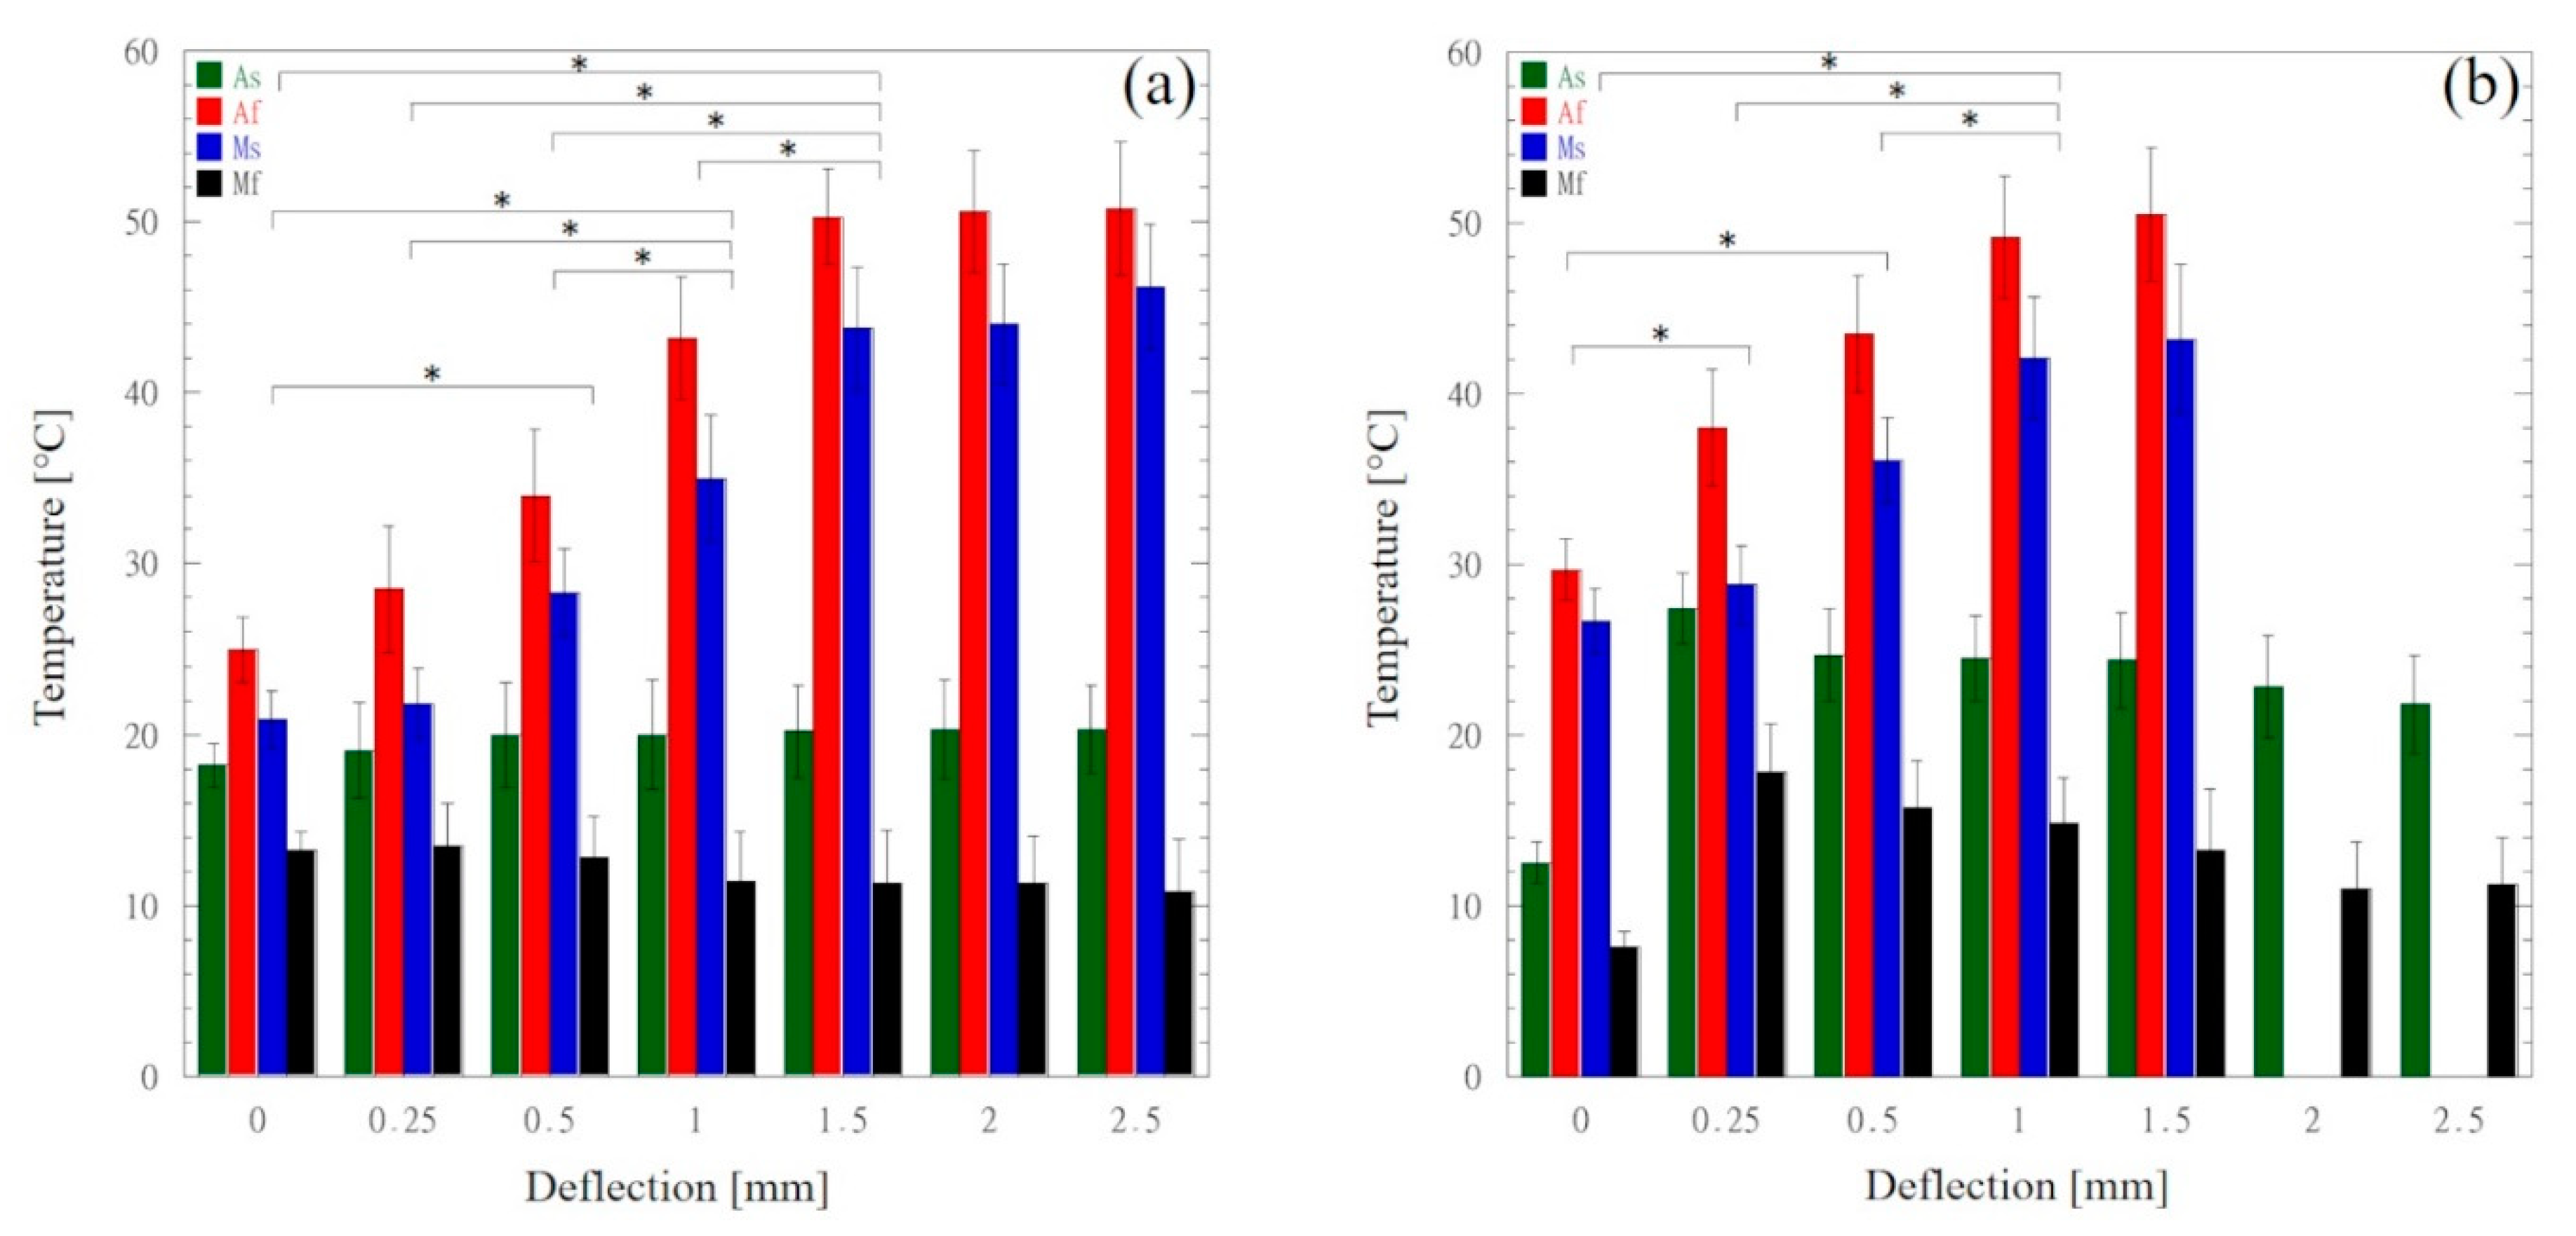
Figure 6.
Loading and unloading curves of CuNiTi at 20°C (a) and NiTi at 37°C (b) superimposed with transition temperature profiles.
Figure 6.
Loading and unloading curves of CuNiTi at 20°C (a) and NiTi at 37°C (b) superimposed with transition temperature profiles.
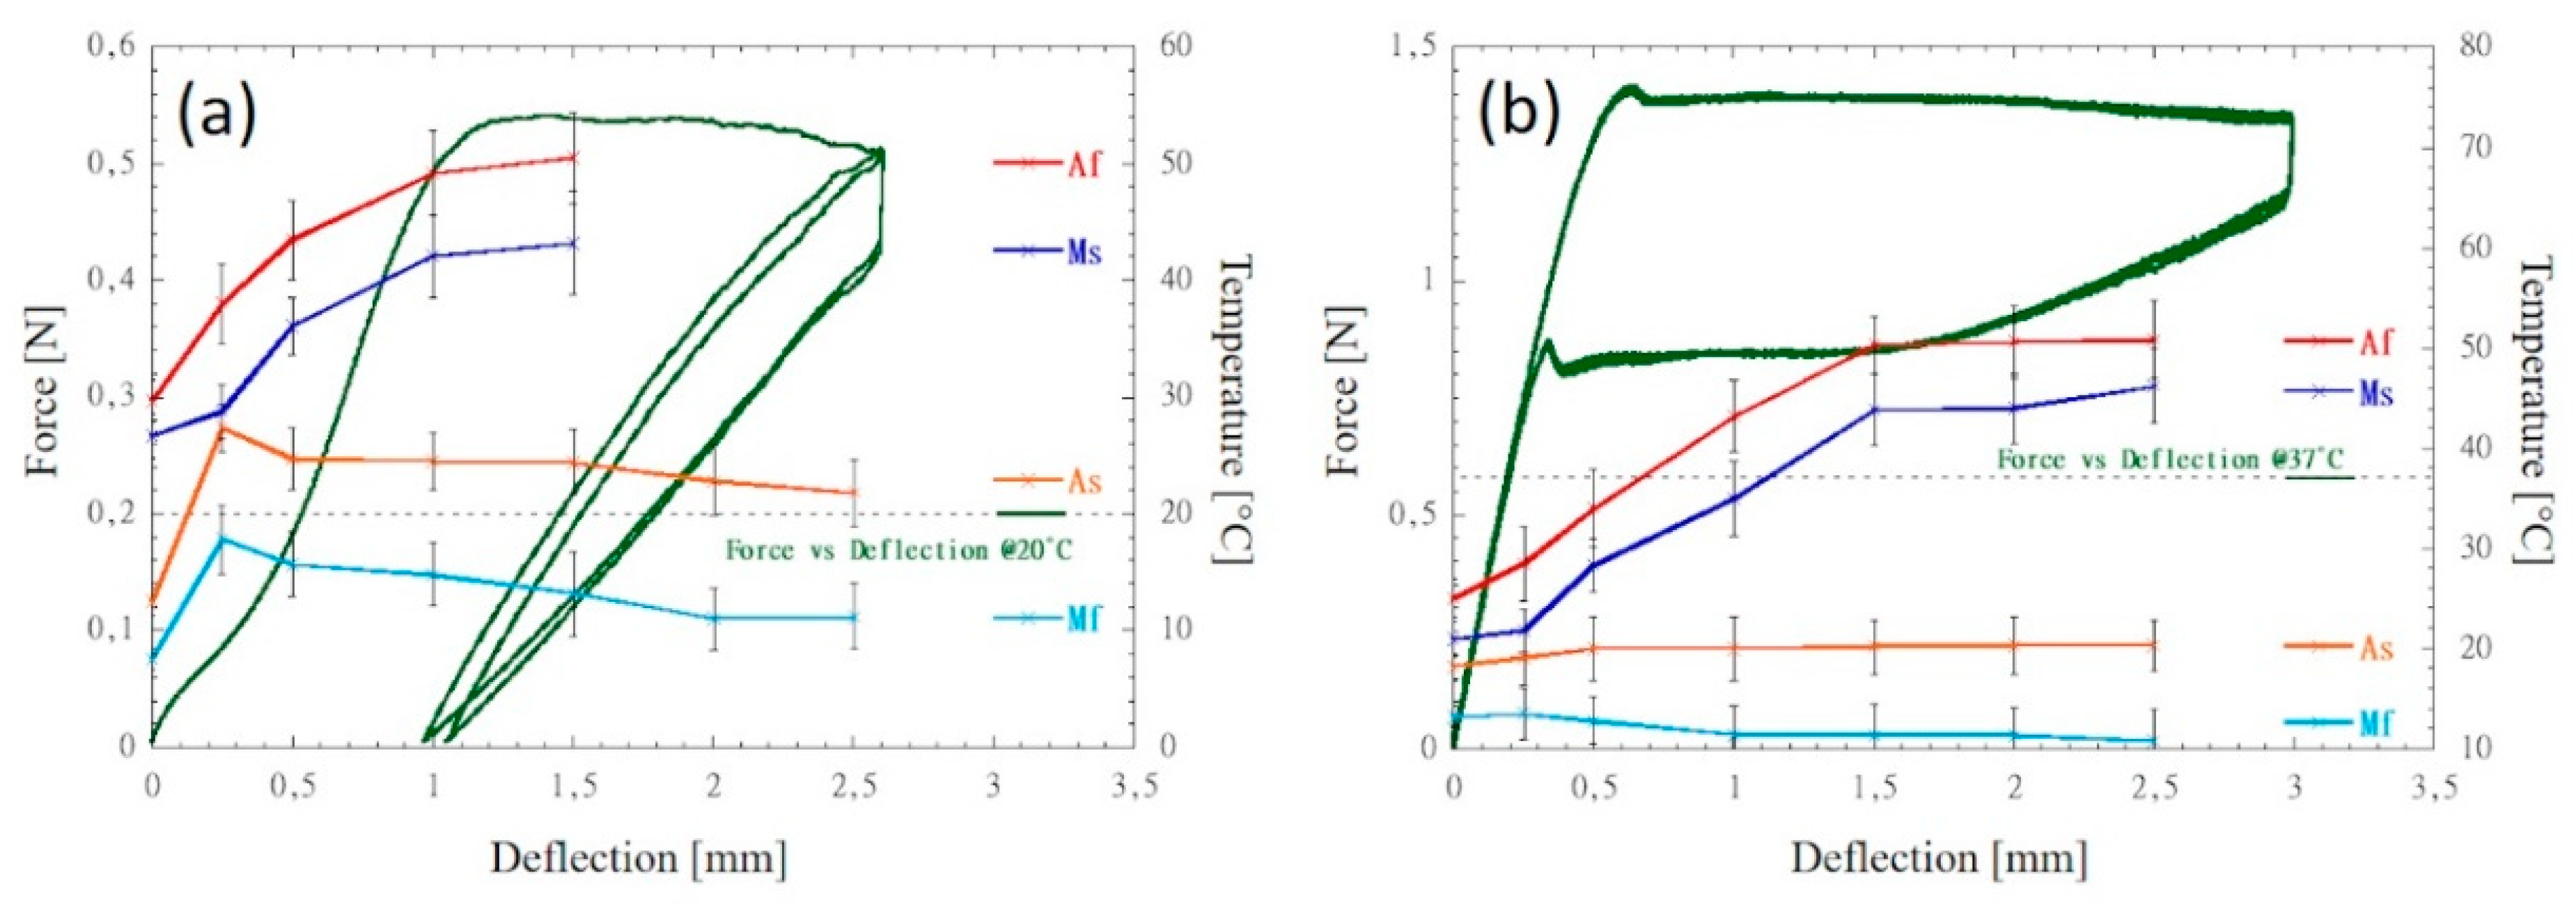
Figure 7.
Relationship between force plateau levels reported in the literature and the thermo-mechanical profile detected at the deflection level of 0.50 mm (i.e. the end point deflection level of the plateau extension). The inset graph represents an enlargement occurring at 37°C.
Figure 7.
Relationship between force plateau levels reported in the literature and the thermo-mechanical profile detected at the deflection level of 0.50 mm (i.e. the end point deflection level of the plateau extension). The inset graph represents an enlargement occurring at 37°C.
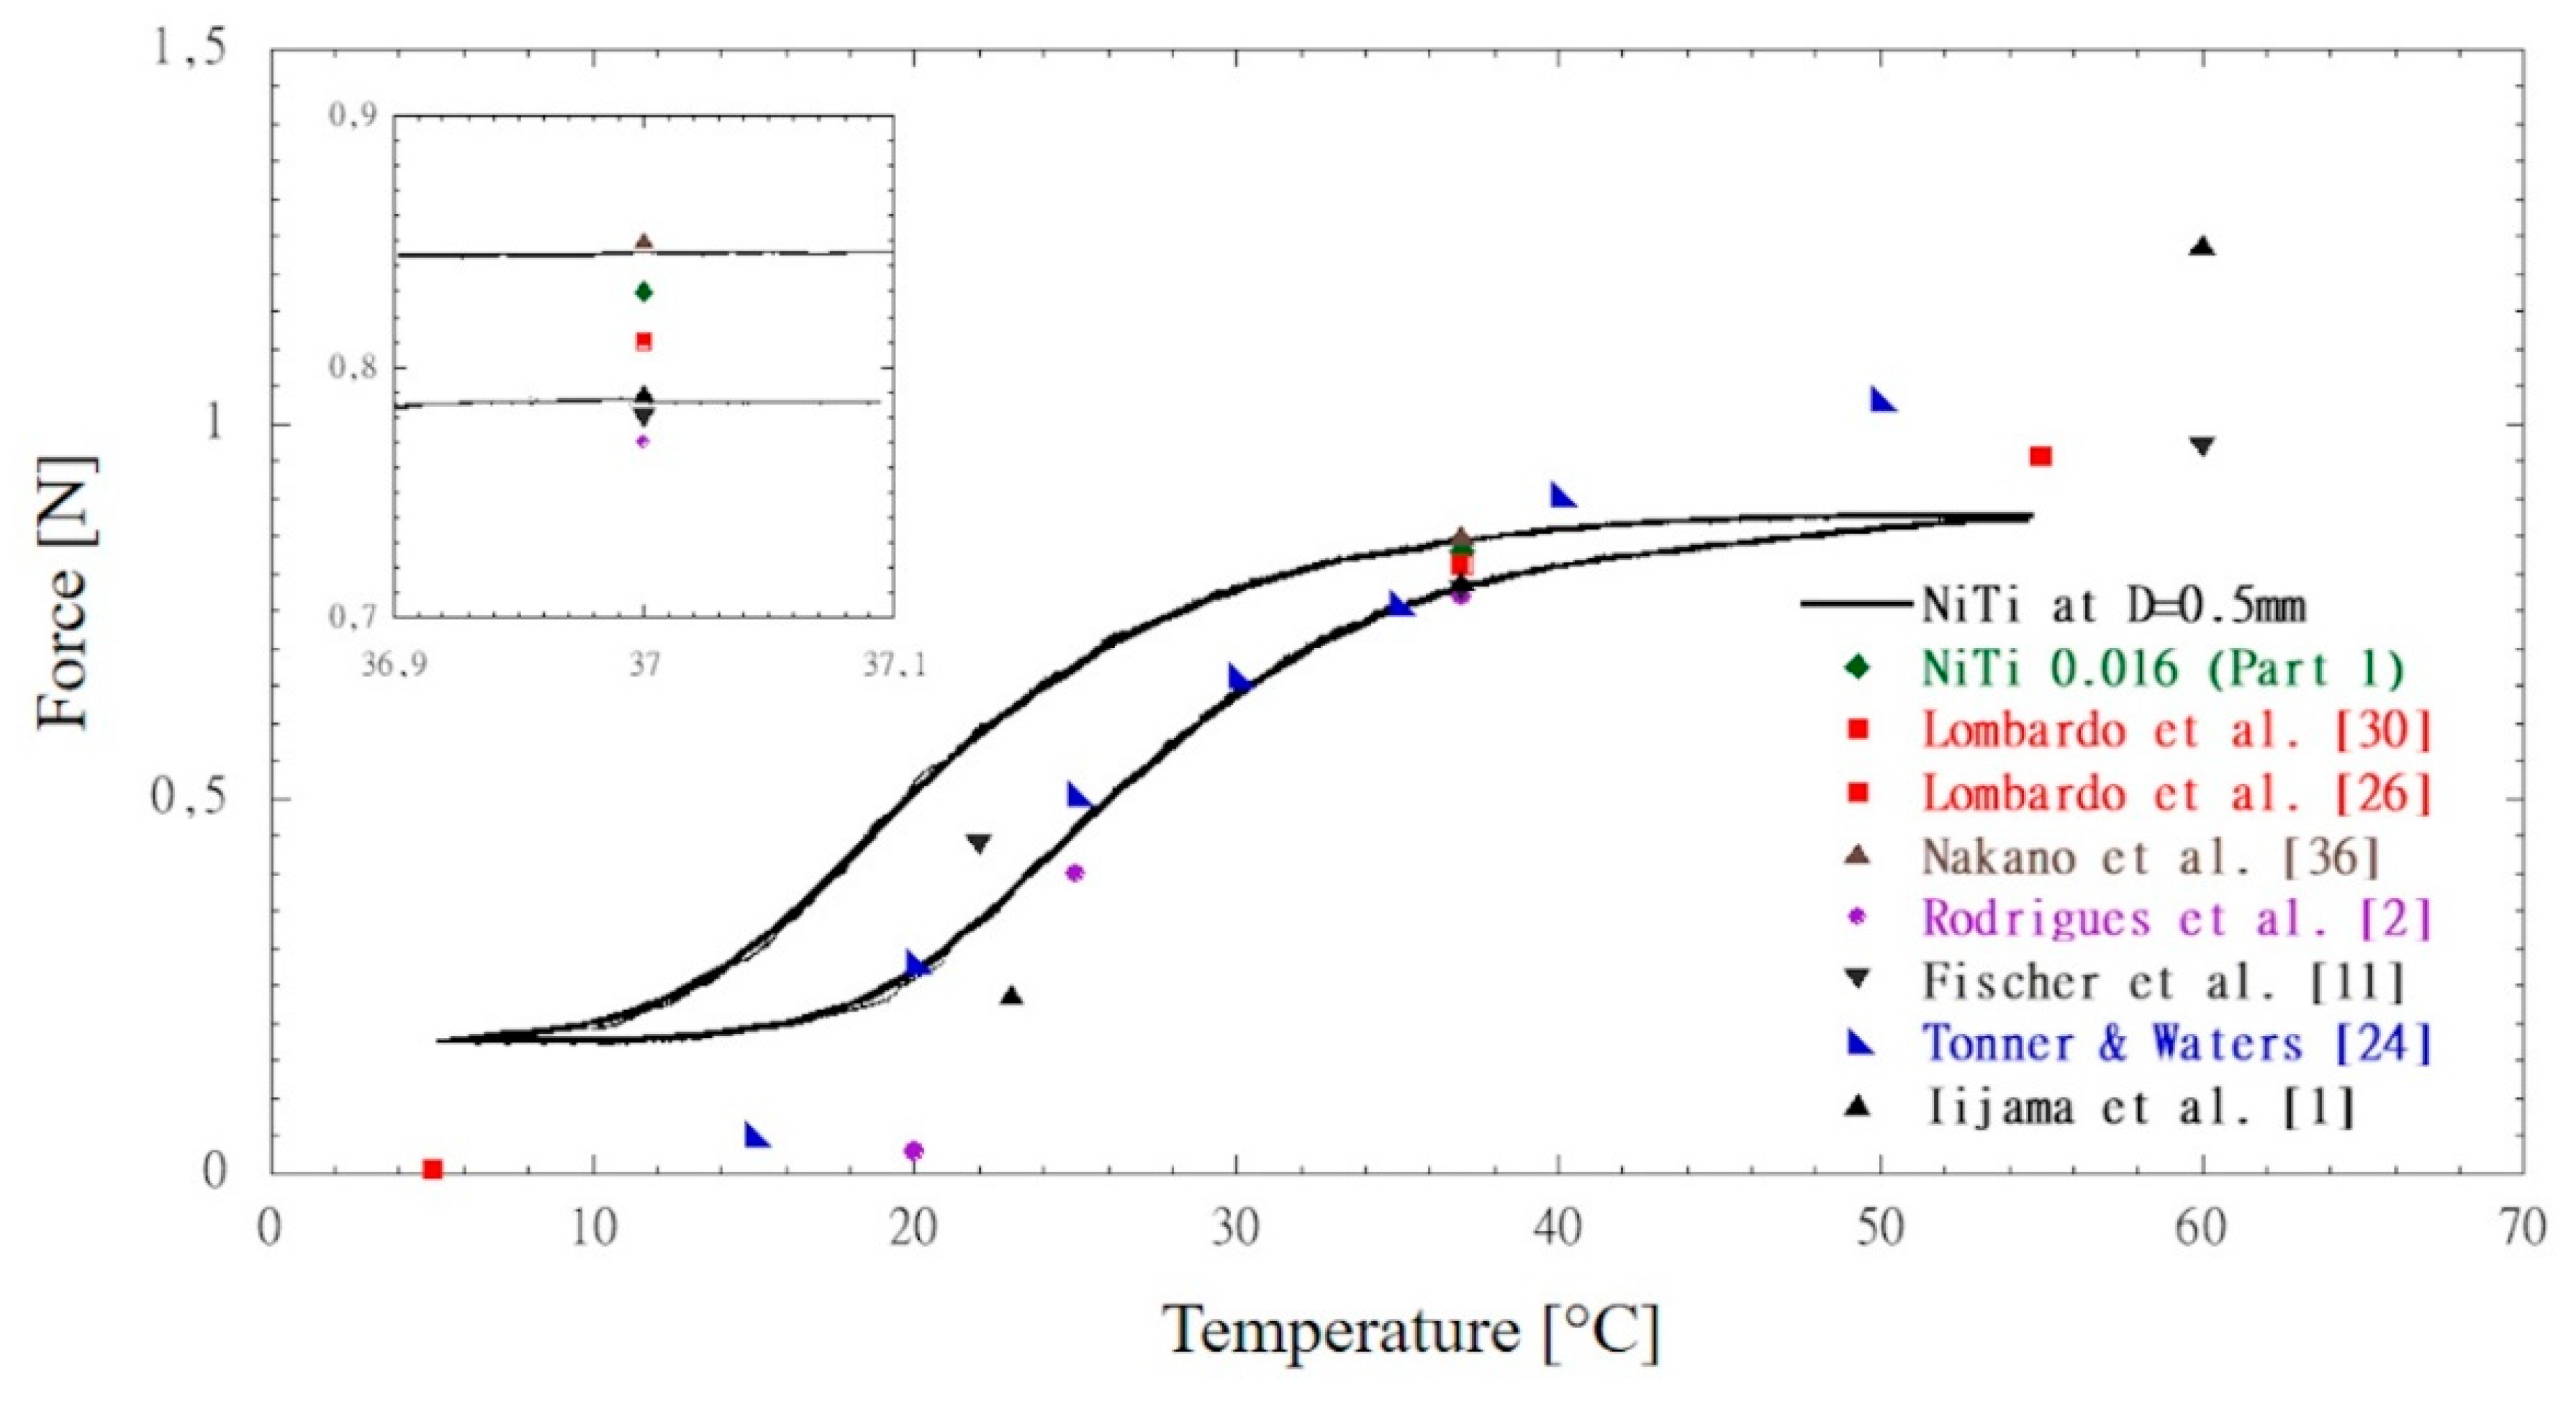
Figure 8.
Static TMA loads recorded at 37°C and superimposed to unloading and loading plateau detected through quasi-static bending test for NiTi (a) and CuNiTi (b).
Figure 8.
Static TMA loads recorded at 37°C and superimposed to unloading and loading plateau detected through quasi-static bending test for NiTi (a) and CuNiTi (b).
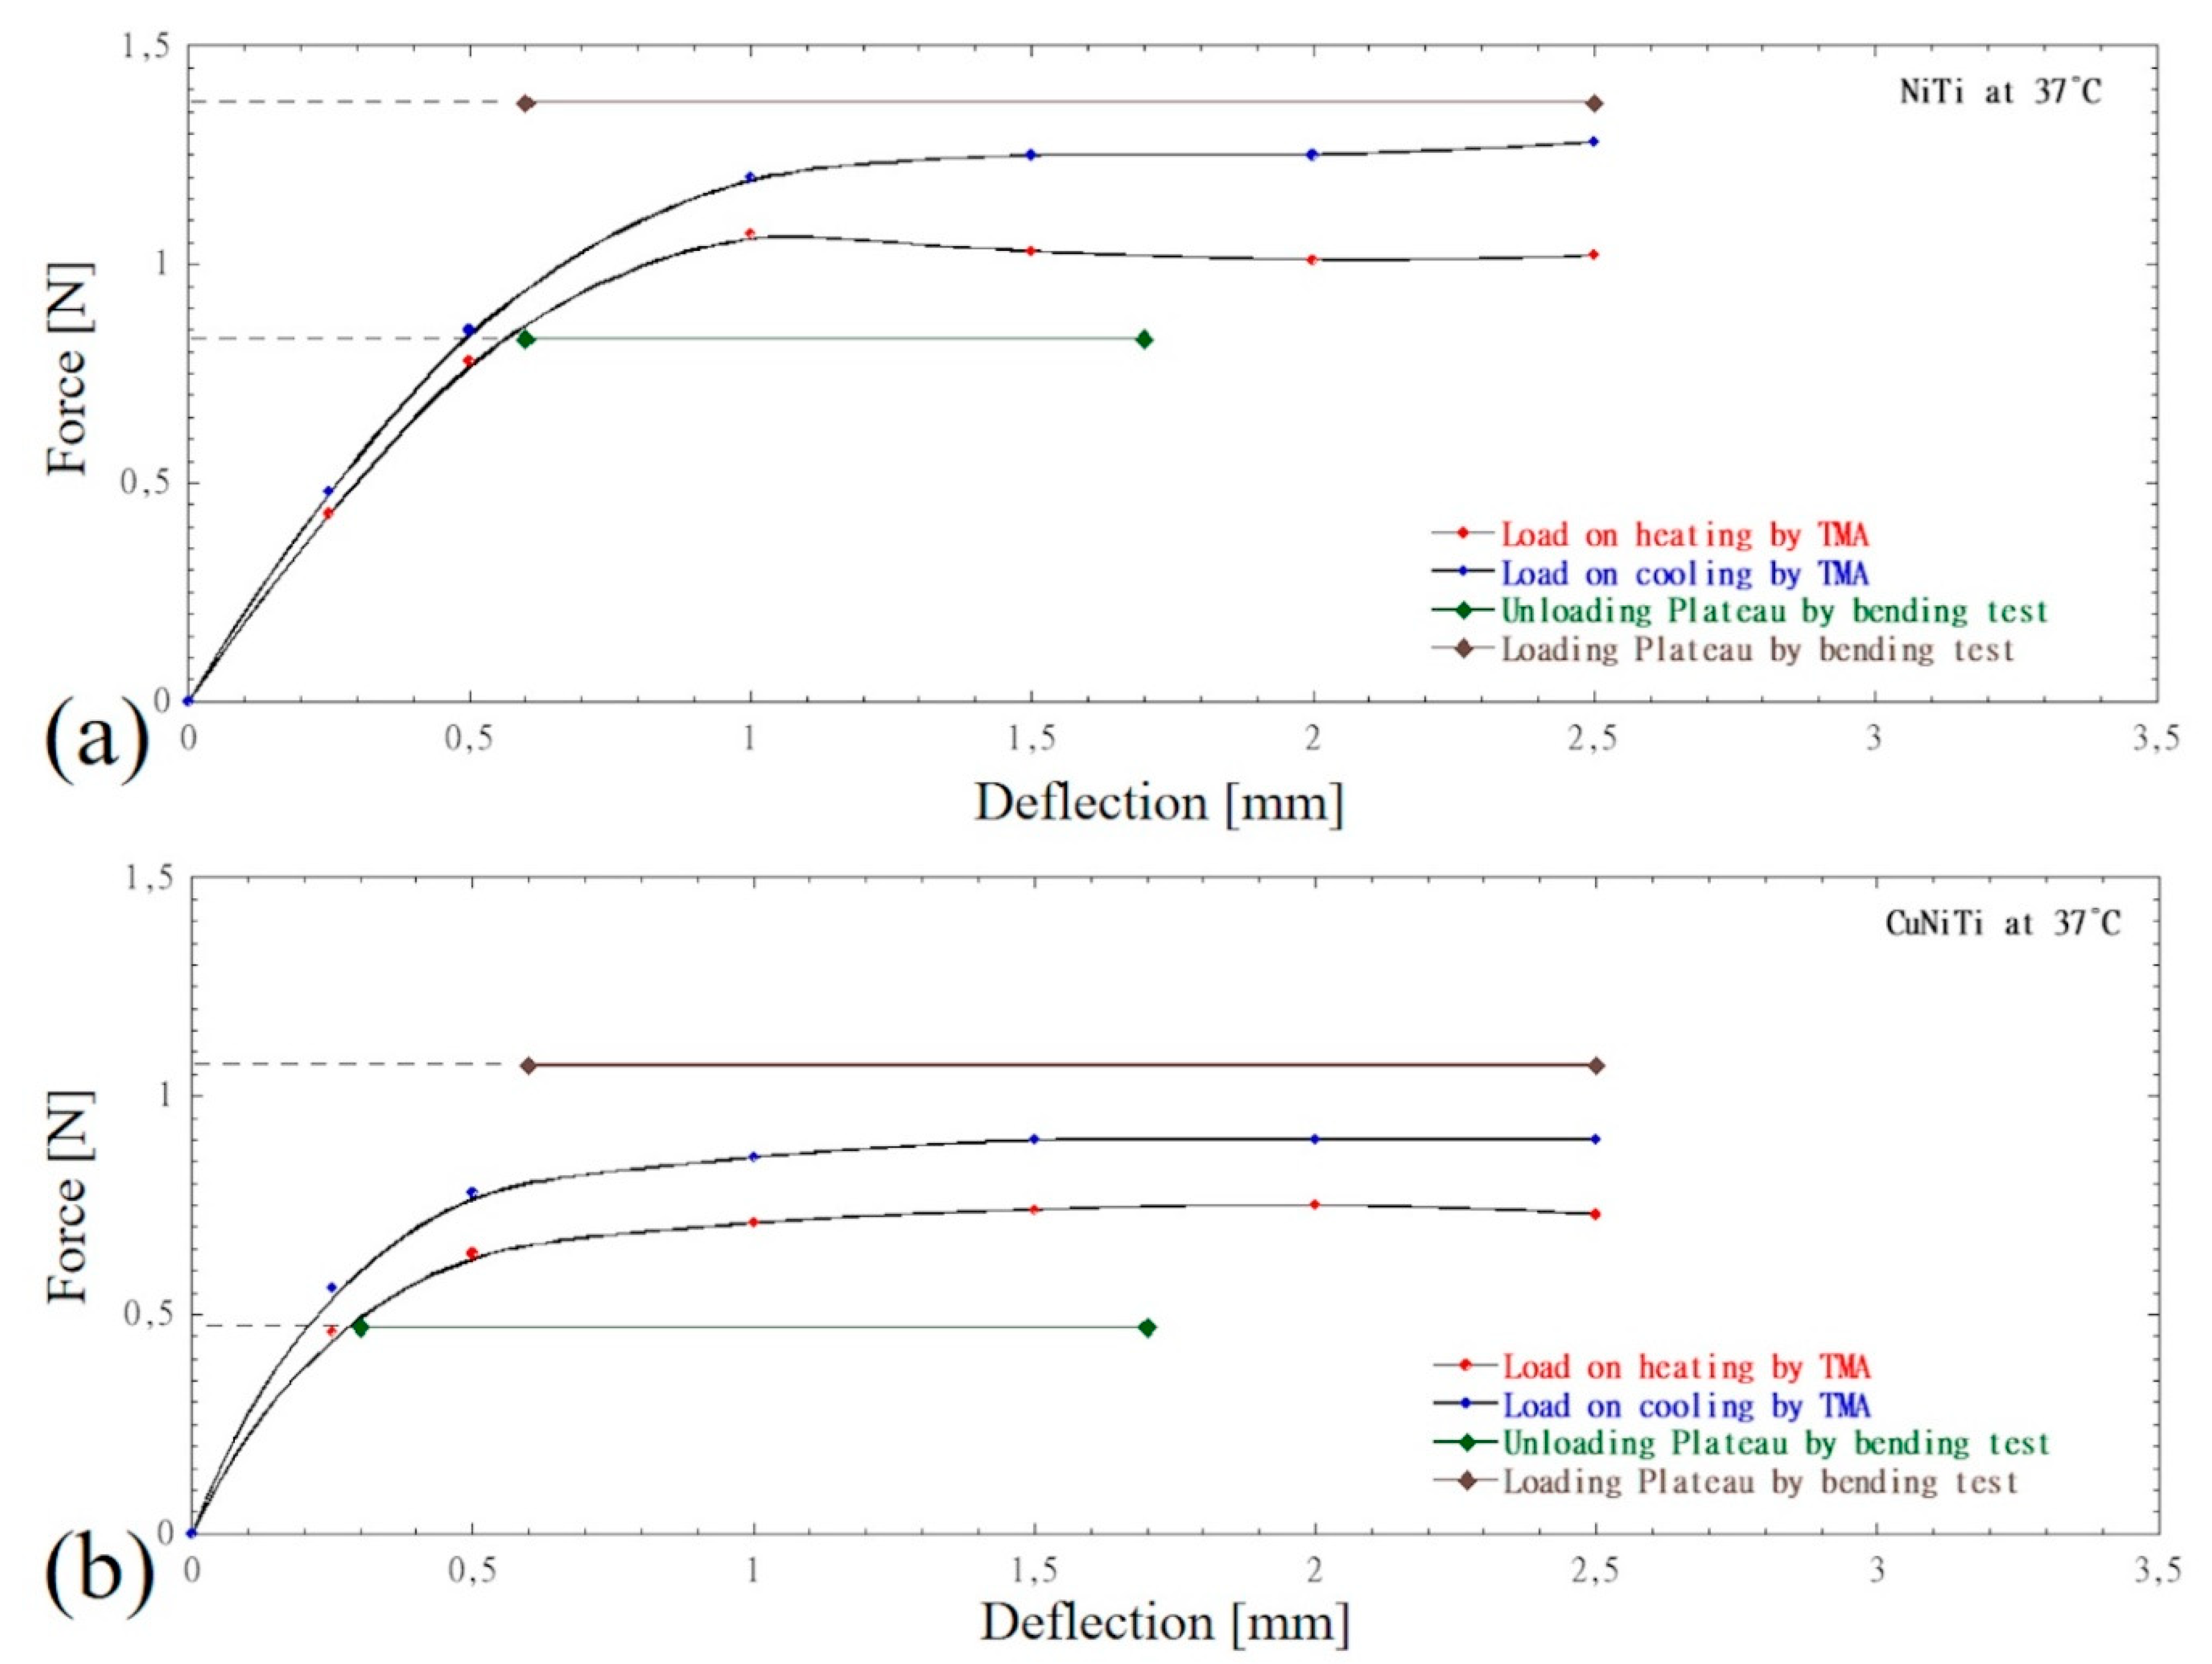

Table 1.
Intra-oral temperature mean levels, peaks and ranges observed over a varieties of attitudes at different locations in the oral cavity. All temperature values are expressed in °C.
Table 1.
Intra-oral temperature mean levels, peaks and ranges observed over a varieties of attitudes at different locations in the oral cavity. All temperature values are expressed in °C.
| Tooth location | Mean temperature | Temperature range | Speech/breath temperature range | Peak temperature after cold drink | Peak temperature after hot drink | Ref. |
|---|---|---|---|---|---|---|
| Upper Front | 33.1 | 29.9-36.8 | 68 | 5 | ||
| Upper Posterior | 34.6 | 55 | 5 | |||
| Upper | 10 | 55 | 6 | |||
| Lower | 15 | 53 | 6 | |||
| Upper Incisor | 34.9 | 33.2-35.8 | 6 | 58 | 7 | |
| Upper Premolar | 35.6 | 34.6-36.2 | 8 | 54 | 7 | |
| Lower incisor | 35.5 | 26-37 | 5 | 50 | 8 | |
| Upper incisor | 33.2 | 32-35 | 13-39 | 9 |
Table 2.
Literature data on transition temperatures of biomedical and engineering NiTi and CuNiTi showing testing conditions.
Table 2.
Literature data on transition temperatures of biomedical and engineering NiTi and CuNiTi showing testing conditions.
| Smart Alloy | Test | Temperature range [°C] | Length or Span length [mm] | Observed property | Deflection or Load | Observed Transitions | Reference |
|---|---|---|---|---|---|---|---|
| CuNiTi & NiTi orthodontic wires (0.406x0.559mm2) |
DTMA in Bending | -20 ÷ 80 | 5 | Storage modulus | 5 g preload 5 µm dynamic amplitude (max force amplitude 40g) | As, Af, Ms, Mf | [12] Kusy & Whitley (2006) |
| CuNiTi & NiTi orthodontic wires (0.392x0.559mm2) |
TMA Stress vs strain in Bending | 10 ÷ 55 | 16 | Young’s modulus | 1Hz loading unloading cycles up to 0.5 mm | As, Af | [8] Laino et al. (2010) |
| NiTi graded orthodontic wire (0.4x0.4 mm2) |
DTMA in Bending | 5 ÷ 40 | 9 | Strain | 0.10 to 0.75 mm | - | [2] Rodrigues et al. (2020) |
| Commercial & orthodontic NiTi (0.43x0.64mm2) | DTMA in Bending | -90 ÷ 120 | 10 | Strain | 2 mm | - | [13] Nespoli et al. (2022) |
| NiTi orthodontic wires (0.483x0.635mm2) | Stress vs strain in Bending (Mode II) | 30 ÷ 40 | 5 | Force Energy loss |
steps of 0.2 mm up to 4 mm |
- | [14] Sakima et al. (2006) |
| NiTi (φ=0.35 mm) |
Stress vs strain in Tension | -195 ÷ 10 | 16 | Stress and Electrical resistivity | Strain rate of 5.2x10⁻⁴sec-1 |
Af, Ms | [15] Miyazaki et al. (1981) |
| NiTi orthodontic wires (φ=0.406 mm) |
DTMA in Tension | -120 ÷ 200 | L/A ≥ 3.6 cm-1 | Storage modulus | 20 g preload Dymamic load at 11Hz |
As, Af | [16] Kusy and Wilson (1990) |
| Commercial shape memory NiTi wire (φ=0.279 mm) |
DTMA in Tension | -65 ÷ 45 | 15 | Strain | 15 N | As, Af, Ms, Mf | [17] Lahoz & Puértolas (2004) |
| Flexinol NiTi strips (2.52x0.52 mm2) | TMA in Tension | -50 ÷ 200 | 35 | Storage & loss modulus | 18 N | As, Af, Ms, Mf | [18] Florian et al. (2019) |
| Commercial smart NiTi cable and wire (φ=0.35 mm) | Stress vs strain in Tension | 35 ÷ 85 | 12.6 | Stress | 7.5% maximum strain; strain rate of 0.5%/min | Af, Ms | [19] Silva et al. (2022) |
| CuNiTi & NiTi orthodontic wires (0.432x0.635mm2) |
Bent at 1mm and 6mm | 5 ÷ 60 | 10 | Relative electrical resistivity | 1 mm and 6 mm | Mf ÷ Af range | [20] Santoro & Beshers (2000) |
Table 3.
Investigated NiTi and CuNiTi archwires.
| Tested archwires Alloy | Cross-section | Size [inches] | Size [mm] |
|---|---|---|---|
| NiTi | Round | .016 | 0.406 |
| CuNiTi | Round | .016 | 0.406 |
Table 4.
Temperature transitions occurring during heating and cooling according to TMA (Figure 3 and Figure 4) and DSC (Figure 2) approaches. The symbol * means that Ms values have been determined by considering the plateau level of the heating cycle. The symbol – means that it has not been possible to determine a plateau reference, and temperature is higher than 50°C.
| Heating phase | Cooling phase | |||||
|---|---|---|---|---|---|---|
| Test | Alloy | Deflection [mm] | As [°C] | Af [°C] | Ms [°C] | Mf [°C] |
| DSC | NiTi | 0 | 18.2 (±1.3) | 25.0 (±1.9) | 20.9 (±1.7) | 13.2 (±1.1) |
| CuNiTi | 0 | 12.5 (±1.2) | 29.7 (±1.8) | 26.7 (±1.9) | 7.6 (±0.9) | |
| TMA | NiTi | 0.25 | 19.1 (±2.8) | 28.5 (±3.7) | 21.8 (±2.1) | 13.5 (±2.5) |
| 0.5 | 20.0 (±3.1) | 34.0 (±3.9) | 28.3 (±2.6) | 12.8 (±2.4) | ||
| 1.0 | 20.0 (±3.2) | 43.2 (±3.6) | 35.0 (±3.7) | 11.4 (±2.9) | ||
| 1.5 | 20.2 (±2.7) | 50.3 (±3.8) | 43.8 (±3.6) | 11.3 (±3.1) | ||
| 2.0 | 20.3 (±2.9) | 50.6 (±3.6) | 44.0 (±3.5) | 11.3 (±2.8) | ||
| 2.5 | 20.3 (±2.6) | 50.8 (±3.9) | 46.2 (±3.7) | 10.8 (±3.1)* | ||
| CuNiTi | 0.25 | 27.4 (±2.1) | 38.0 (±3.4) | 28.8 (±2.3) | 17.8 (±2.9) | |
| 0.5 | 24.7 (±2.7) | 43.5 (±3.4) | 36.1 (±2.5) | 15.7 (±2.8) | ||
| 1.0 | 24.5 (±2.5) | 49.2 (±3.6) | 42.1 (±3.6) | 14.8 (±2.7) | ||
| 1.5 | 24.4 (±2.8) | 50.5 (±3.9) | 43.2 (±4.4) | 13.2 (±3.6) | ||
| 2.0 | 22.8 (±3) | - | - | 11.0 (±2.7)* | ||
| 2.5 | 21.8 (±2.9) | - | - | 11.2 (±2.8)* | ||
Table 5.
Overall two-way ANOVA results for the transition temperature reported in Table 3.
Table 5.
Overall two-way ANOVA results for the transition temperature reported in Table 3.
| NiTi | DF | Sum of Squares | Mean Square | F Value | P Value |
|---|---|---|---|---|---|
| Transition Type | 3 | 17744,62936 | 5914,87645 | 680,66161 | 0 |
| Deflection | 6 | 3453,89886 | 575,64981 | 66,2436 | 0 |
| Interaction | 18 | 3768,61314 | 209,3674 | 24,09321 | 0 |
| Model | 27 | 24967,14136 | 924,70894 | 106,41201 | 0 |
| Error | 112 | 973,268 | 8,68989 | -- | -- |
| Corrected Total | 139 | 25940,40936 | -- | -- | -- |
| CuNiTi | |||||
| Transition Type | 4 | 1604,0748 | 401,0187 | 47,28852 | 0 |
| Deflection | 6 | 2467,08551 | 411,18092 | 48,48685 | 0 |
| Interaction | 18 | 1081,86315 | 60,10351 | 7,08746 | 6,42516E-11 |
| Model | 28 | 18634,96141 | 665,53434 | 78,48046 | 0 |
| Error | 92 | 780,18352 | 8,48026 | -- | -- |
| Corrected Total | 120 | 19415,14493 | -- | -- | -- |
Disclaimer/Publisher’s Note: The statements, opinions and data contained in all publications are solely those of the individual author(s) and contributor(s) and not of MDPI and/or the editor(s). MDPI and/or the editor(s) disclaim responsibility for any injury to people or property resulting from any ideas, methods, instructions or products referred to in the content. |
© 2024 by the authors. Licensee MDPI, Basel, Switzerland. This article is an open access article distributed under the terms and conditions of the Creative Commons Attribution (CC BY) license (http://creativecommons.org/licenses/by/4.0/).
Copyright: This open access article is published under a Creative Commons CC BY 4.0 license, which permit the free download, distribution, and reuse, provided that the author and preprint are cited in any reuse.


