
Submitted:
16 July 2024
Posted:
16 July 2024
You are already at the latest version
Abstract
(1) Background: A wide literature based on loading and unloading bending tests has been carried out over the half past century for assessing the force released by superelastic wires. The aim of this investigation is not only to characterize a broadly described superelastic NiTi and a novel CuNiTi archwire, but also to provide novel insights into the load vs deflection profiles. A harmonic scenario for superelastic wires will be shown as temperature is kept constant at 37°C. However, a completely different picture will be highlighted as a temporary heating step up to 50°C is introduced within the force vs deflection profiles. (2) Methods: A variety of NiTi and a novel CuNiTi round and rectangular cross-section archwires have been investigated. Static 3-point bending tests up to a deflection level of 3.0 mm have been carried out for detecting the unloading force plateau levels occurring at 37°C. A hold deflection step of 5 min at deflection levels occurring along the unloading plateau extension is introduced. The effect of a temporary heating up to 50°C on the force plateau level released by the investigated wires is analyzed. (3) Results: Mechanical profiles suggest that the plateau force levels detected at 37°C are consistent with those broadly reported in the literature, but they only represent a single block puzzle of the force scenario that a superelastic wire releases during the orthodontic treatment. (4) Conclusions: Once a superelastic wire is bent and clinically applied, the effect of a temporary heating up to 50°C (e.g. hot food or drink ingestion) produces a significant plateau force increase whose magnitude depends on the deflection level. The highest force increase of about 50% and 40% have been detected at deflection levels located at the beginning of the unloading plateau extension for NiTi and CuNiTi wires, respectively.
Keywords:
NiTi
; CuNiTi
; Superelasticity
; Experimental design
; Bending
; Plateau force
; Mechanical and thermal measurements
1. Introduction
The wires used in orthodontics can be divided into two major categories: elastic wires and superelastic wires. Elasticity is the property of a body to deform under the action of external forces and to resume, in whole or in part, its shape when those forces cease. The behavior of elastic wires can be represented by a straight line on a force vs deflection graph because there is a relationship of direct proportionality between these two quantities: as the force increases, the deflection of the wire proportionally increases and vice versa [1,2]. Superelasticity, on the other hand, has been defined as an overcoming of Hooke's law: the behavior of superelastic wires is represented by a very first elastic linear region and then by a plateau because, once exceeded a certain value, the deflection increases while keeping the load constant and vice versa [3,4,5,6,7]. For each wire, it is possible to identify a loading and an unloading curve that correspond respectively to the clinical phase in which the wire is bent to be engaged in the brackets and to the phase in which, in the attempt to recover this deformation, it exerts a force on the teeth by moving them. This force spans between 50 g and 500 g, depending on the geometry of the wire [8,9]. What clinicians are most interested in is the unloading phase because it is the one that guides them in the choice of the wire according to the phase of the treatment that they are about to begin. For example, in the initial stages, especially if the teeth are very misaligned, wires that are too stiff and therefore have to undergo significant forces in order to enter the slots, would release equally significant forces with damage to the teeth and gums. On the contrary, the superelastic wires, made of nickel-titanium (NiTi), are able to release primarily lower forces but, above all, constant forces over a wide range of deflections (plateau) [8]. Once achieved alignment and levelling, a rigid wire is instead preferable to realize the class correction or the closure of the extraction spaces, because the superelastic one would have excessive available space in the slot [9].
Superelasticity is a consequence of the ability of NiTi, the material from which these wires are made, to assume two different crystal structures [10], typical of austenite and martensite, and to pass from one to the other through a phase transition in the solid state, induced by temperature, stress or both [11]. The austenitic phase, with higher modulus of elasticity and in which the wire releases greater forces, is more stable at high temperatures, the martensitic phase, with lower Young's modulus, is more stable at low temperatures [7], but the transformation from one phase to another does not occur at a precise temperature, but rather over a temperature range. It is possible to identify, during cooling, a start temperature (Ms) and an finish temperature (Mf) for the martensitic phase transition; during heating, a start temperature (Af) and an end temperature (As) for the austenitic phase transition [11,12,13]. The knowledge of the transition temperatures of these alloys allows to establish their state and therefore the properties as a function of the temperature of the oral cavity [14,15]. Obviously, only from NiTi wires with an austenitic end temperature lower or close to the average temperature of the oral cavity we can expect a superelastic behavior [9,16]. Not only that, it is also important to know the direction in which the temperature of the wire has been reached, since heating and cooling curves do not overlap [17,18]. Differential scanning calorimetry represents the most popular tool for determining temperature phase transitions occurring in unstressed (e.g. un-deflected) orthodontic wires [11,14,19]. However, in clinically practice, this information prevents to properly define if the archwire is working in the martensitic or austenitic phase, as an applied wire is always in a deflected state. On the other hand, both chemical composition of superelastic archwires, such as NiTi and copper-Ni-Ti (CuNiTi), and the technological process for producing and activating (i.e. training) these wires, largely affect phase transition temperatures and the unloading force plateau [20,21,22,23,24]. Therefore, assessing mechanical properties of superelastic orthodontic archwires represents a compelling need if an optimal and controlled clinical effect of these wires is desired [18,23]. From a practical point of view, this means that each superelastic NiTi wire will be able to express a very wide range of forces depending on its deflection, its thickness, but also and above all, on the temperature of the oral cavity which, despite being on average value of 35°C, it is very susceptible to large variations [25]. The amount of force released by superelastic orthodontic wires is of paramount importance to choose the most suitable one for a given treatment phase, i.e. the best synthesis of effectiveness and respect for biology. The traditional arch and bracket design is still largely based on the practicality and anatomy of crowns, not roots. No currently available orthodontic appliance is able to achieve ideal loading proportions during alignment [26]. In fact, not all teeth respond to stress in the same way, obviously larger healthy teeth or teeth with bigger roots offer greater resistance to displacement, and in addition, certain biological variables such as bone turnover, quality and quantity change depending on the site.
Standard bending tests have been widely explored for determining the amount of force that an archwire is capable to release [3,8,9,11]. Bending is one of the elementary stresses that a body can be subjected to and it consists in the application of forces transversal to the axis of the bending beam, in the case of the 3-point bending (3-PB), this force is positioned at an equal distance from the supports spanning over the length L (span length). Unfortunately, data reported in the literature concerning the plateau force level of superelastic wires using the standard 3-PB test is not always the result of a standardized span length condition. On the other hand, for transferring in vitro data to clinics, the span length plays a significant role. The span length representing the distance of three frontal adjacent teeth has been commonly adopted by several authors [14,20] and by us. However, the resulting plateau force cannot be transferred to three adjacent teeth located in the posterior region of the oral cavity because this distance increases. Although standard 3-PB test is the most adopted approach for obvious reproducibility reasons, modified 3-PB test (including the bracket and ligating system) have been introduced as it better describes the clinical scenario [20]. Figure 1 shows the bending moment distribution along the wire’s axis and reaction forces and moment occurring at the supports for the standard 3-Pb and modified 3-Pb test.
The aim of this investigation is not only to characterize a largely described superelastic NiTi and a novel CuNiTi archwire, but also to provide novel insights into the load vs deflection profiles.
Another goal is to provide tools for clinicians to estimate and transfer the results obtained with the 3-PB standard to clinical conditions. An harmonic scenario for superelastic wires will be shown as temperature is kept constant at 37°C. However, a completely different picture is depicted as a temporary heating up to 50°C is introduced within the force vs deflection profiles.
2. Materials and Methods
A variety of NiTi and CuNiTi archwires were investigated. Forestadent Biostarter® NiTi round archwires, Forestadent Biotorque® rectangular NiTi archwires (Forestadent®, Bernhard Foerster GmbH), CuNiTi round and CuNiTi rectangular archwires (Sweden & Martina S.p.a. Padova, Italy) were investigated. Archwires composition and dimension were reported in Table 2. Second moment of area for circular (IC) and rectangular (IR) cross sections were computed according to the following equations [27]:
where r is the radius of the round cross-sectional wires, while b and h are the base and the height dimensions of the rectangular cross-section, respectively. These dimensions correspond to the lengths of rectangular archwire’s cross-section in the edgewise and the ribbonwise directions, respectively.
Mechanical bending tests were carried out using the Standard 3-PB configuration (i.e. Model I of Figure 1). Tests were performed using the Instron dynamometric machine 5566 equipped with a 10N loading cell. The span was set at 14 mm. Specimen with a length of 18 mm were obtained from the end portions of each archwire where the curvature was minimal. Five specimens for each arch-wire reported in Table 1 were investigated. Thermal conditioning was achieved through a water bath heated or cooled by a Peltier system (Figure 2a). Temperature levels were collected in conjunction with mechanical signals by using K-type thermocouples. Force-deflection behaviour of NiTi and CuNiTi wires, deflected up to 3.0 mm at a rate of 3.0 mm/min, were collected at 37°C for three consecutive load-unload cycles (Figure 2b). The load plateau extension during the unloading cycle was determined (Figure 2c) by considering the ± 10% force variation at the plateau start (Ps) and plateau end (Pe) points.
For investigating the effect of the span length on archwires bending properties, 20 NiTi specimens and 20 CuNiTi specimens with round cross-section (φ=.016’’) were randomly divided in four groups and tested at the span lengths of 10 mm, 12 mm, 14 mm and 16 mm.
In order to investigate the effect of a temporary heating upon the behavior of superelastic wires through the unloading stage, a hold deflection signal of 5 minutes was introduced (Figure 2e and 2f). 20 NiTi specimens and 20 CuNiTi specimens with round cross-section (φ=.016’’) were randomly divided in four groups and tested using the hold deflection signal positioned at 2.0 mm, 1.5 mm, 1.0 mm and 0.5 mm. Each specimen underwent four cycles (Figures 2d, 2e, 2f) through the sequence (d) (e) (d) (f).
The temporary heating of wires at about 50°C (Figure 2f) was achieved by injecting 10 mL of distilled water, pre-heated at 60°C, at the location of the middle span cross-section, where the bending moment is maximum (Figure 1). The following relation was used for computing the maximum stress (σmax) occurring at the edge of the middle cross-section of the bent wire:
where M is the bending modulus, F the load in the middle section of the wire, L is the span length, c is the distance between the neutral axis and the extreme wire’s cross-section (c=r or c=h/2 for round or rectangular cross-section, respectively). For the simply supported beam (i.e. Model I, standard 3-Pb test of Figure 1a) we have that [27]:
where D is the deflection in the middle span of the beam, and E is the Young’s modulus. The above equations are valid within small strain (ε<5%). Deflection level at which ε<5% are reported in Table 1. The Origin2018 software (OriginLab Corp., Northampton, US) was used for analysing thermomechanical properties through analysis of variance (e.g. two way ANOVA) at a p value of 0.05 followed by the Tukey’s post hoc test.
3. Results
Load-deflection profiles of NiTi wires at 37°C during loading and unloading cycles, up to the deflection of 3.0 mm, are shown in Figures 3a and 3b for rectangular and round cross-section, respectively.
Load-deflection profiles of CuNiTi wires at 37°C during loading and unloading cycles, up to the deflection of 3.0 mm, are shown in Figures 4a and 4b for rectangular and round cross-section, respectively.
Different regimes can be distinguished through the profiles of the loading and unloading cycle. For each wire, an almost linear behavior is observed at the beginning of the loading cycle. The steepness of this linear region represents the stiffness of the specific wire (i.e. alloy type and second moment of area). Stiffness values are reported in Table 2, while figure 5a shows the linear regression of stiffness values as a function of the second moment of area. For both NiTi and CuNiTi linear regression values, using the method of least squares, are higher than 0.99. Therefore, as expected, for both NiTi and CuNiTi wires, a high degree of correlation exists between stiffness (Table 2) and the second moment of area (Figure 5).
A force overshoot follows the starting linear region, and a negative slope is recognized for each investigated wire (Figure 3 and Figure 4) before an almost horizontal plateau occurs extending up to the deflection level end (i.e. 2.0 mm).

Table 2.
Properties measured through the load vs deflection curves at 37°C of NiTi and CuNiTi superelastic wires. In each row, properties are ascended sorted according to the second moment of area (Table 1). For each mechanical property, different superscript letters indicate significant statistical difference among the mean values (p<0.05) according to the Tukey’s post hoc test.
| Property | Alloy | .014 | .025 x .014 | .016 | .025 x .019 | .014 x .025 | .019 x. 025 |
|---|---|---|---|---|---|---|---|
| Loading steepness [N/mm] |
NiTi | 1.69 (0.04)a | 2.97 (0.10)b | 3.01 (0.13)b | 5.91 (0.19)c | 8.05 (0.28)d | 12.19 (0.47)e |
| CuNiTi | 1.62 (0.05)a | 2.51 (0.12)b | 2.71 (0.09)b | 5.22 (0.18)c | 7.12 (0.27)d | 10.80 (0.41)e | |
| Loading plateau force [N] | NiTi | 0.88 (0.05)a | 1.32 (0.09)b | 1.38 (0.11)b | 2.49 (0.19)c | 3.08 (0.24)d | 4.37(0.36)e |
| CuNiTi | 0.75 (0.06)a | 0.90 (0.09)a | 1.08 (0.12)e | 1.83 (0.15)f | 2.37 (0.21)c | 3.89 (0.34)e | |
| Unloading steepness [N/mm] |
NiTi | 0.14 (0.01)a | 0.19 (0.02)b | 0.25 (0.02)c | 0.77 (0.08)d | 0.99 (0.15)e | 1.69 (0.14)f |
| CuNiTi | 0.14 (0.01)a | 0.17 (0.01)b | 0.24 (0.03)c | 0.65 (0.06)d | 0.79 (0.08)d | 1.53 (0.15)f | |
| Unloading plateau force [N] | NiTi | 0.52 (0.03)a | 0.81 (0.05)b | 0.83 (0.06)b | 1.19 (0.09)c | 1.48 (0.12)d | 1.87 (0.16)e |
| CuNiTi | 0.37 (0.04)f | 0.48 (0.03)a | 0.47 (0.04)a | 0.81 (0.05)b | 1.08 (0.09)c | 1.39 (0.14)d |
* Numbers into brackets represent the standard deviation.
As the deflection direction is inverted (i.e. the beginning of the unloading cycle), a steep force reduction occurs for all investigated wires (Figure 3 and Figure 4). A smoother force reduction follows the starting steep unloading region.
For each wire, the slope of this region is lower than the starting linear region in the loading cycle. Figure 5a and 5b shows show the dependence of the stiffness and loading plateau on the wire’s geometry (second moment of area), respectively. For all investigated wire, an almost constant force can be detected upon unloading (super-elasticity) following the previous force reduction region. Overall two-way ANOVA results, considering material type and geometry (second moment of area) as independent variables and the unloading plateau force as the dependent variable, are reported in Table 3. At the probability level of 0.05, both the population means of material type (i.e. NiTi and CuNiTi) and the population means of geometry (i.e. the second moment of area) are significantly different. Moreover, for both archwires, the interaction between material type and geometry is significant.
This plateau force level depends on the type of alloy and on the wire’s cross-section. Using equation 2, the stress corresponding to the plateau levels detected for all NiTi and all CuNiTi wires are 204.2 MPa (± 18.7 MPa) and 136.5 MPa (± 17.1 MPa), respectively. Plateau force levels are reported in Table 2, while Figure 5b shows the linear regression of plateau force values as a function of the second moment of area.
For both NiTi and CuNiTi linear regression values, using the method of least squares, are higher than 0.99. For both NiTi and CuNiTi wires, a high degree of correlation exists between the load plateau levels (Table 2) and the second moment of area. These results are consistent with the almost constant values of the stress previously observed for both investigated type of wires. For a given wire’s cross-section, during the unloading phase, plateau force levels for CuNiTi wires are significantly lower (p<0.05) than NiTi wires. Similarly to the loading cycle, the end of the plateau upon unloading is followed by a force overshoot before a linear force reduction occurs up to the axes origin (Figure 3 and Figure 4). For each NiTi and CuNiTi wire, this last region of the unloading cycle overlaps with the starting linear region upon the loading cycle.
Figure 6 shows unloading plateau force values detected at the span lengths of 10, 12, 14 and 16 mm. For both NiTi and CuNiTi linear regression values, using the method of least squares, are about 0.99.
Figures 7a and 7b report load vs deflection curves of 0.016 round CuNiTi wires presenting a hold period of 5 min at the deflection level of 2.5 mm and 2.0 mm, respectively. For the baseline (blue curves) temperature is kept constant at 37±1°C. A temporary heating signal with a temperature peak value up to about 50°C is introduced at the beginning of the hold period (red curves).
Figure 8a and 8b presents force vs time profiles of 0.016 round CuNiTi wires undergoing a hold period of 5 min at a deflection level of 2.5 mm and 2.0 mm, respectively. For the baseline (blue curves), temperature is kept constant at 37±1°C, while temporary heating with a peak at about 50°C is introduced at the beginning of the hold period (red curves). For both Figures 8a and 8b the first cycle, occurring within 2 min, is the one determined by the mechanical signal reported in figure 2d. The almost constant force plateau occurring during loading can be distinguished at the top of the first cycle. The second cycle (between 120 s and 550 s) for the base line and for the temporary heating curves are determined by the signals reported in Figures 2e and 2f, respectively. Temporary heating reaches a peak temperature of about 50°C and a complete cooling to 37°C occurs within 3 min (Figure 8). An almost constant force plateau can be observed at the end of the hold period.
For both wires and at any investigated displacement level, the plateau occurring after temporary heating at the end of the 5 min deflection hold step is significantly higher (Table 4) than the respective base line (p<0.05).
Profiles similar to those shown in Figure 8 have been detected for both NiTi and CuNiTi round wires at the deflection levels of 2.0 mm, 1.5 mm, 1.0 mm and 0.5 mm.
Figure 9 shows the effect of the temporary heating signal on the force level as a function of the hold deflection level.
Overall two-way ANOVA results for each wire is reported in Table 4. The material plateau level state (i.e. baseline and plateau occurring after temporary heating) and the deflection level are the independent variables while the recorded load is the dependent variable.
For each wire, at the probability level of 0.05, both the population means of Plateau level state (i.e. baseline and plateau occurring after temporary heating) and the population means of Deflection level are significantly different. Moreover, for both archwires, the interaction between plateau level state and deflection is significant.
4. Discussion
Foldability of archwires achieved through bending is the main technological approach adopted by clinicians for tailoring forces to be released to teeth for their realignment [1,6,7]. Therefore, bending tests have been largely explored for determining the amount of force that an archwire is capable to release [3,8,9,11]. Bending properties of elastic archwires are almost independent of the temperature level over a wide range of temperature, including the range of temperature occurring in the oral environment [3,4,11]. Instead, bending properties of superelastic archwires largely depends on the temperature level [11,20,21,22]. The alloy type and the archwire’s dimension are the main tools for tailoring forces to be released to teeth by elastic archwires; for conventional elastic wires, properties measured through mechanical testing in an air environment at room temperature are representative of those occurring in the oral environment [5,11]. Instead, temperature dependence of superelastic archwires drastically increases both the set-up complexity and the number of experimental tests for determining archwires’ forces in vitro [14,15,24,29,30].
4.1. Load vs Deflection Curves at 37°C
All load vs deflection curves (Figure 3 and Figure 4) during loading and unloading of NiTi and CuNiTi wires, having different cross-sections, show a similar qualitative profile as schematized in Figure 2c. An almost linear behavior is observed at the beginning of the loading cycle. The steepness of this linear region represents the stiffness (i.d. F/D) of the specific wire’s alloy and cross-section (in terms of the second moment of area). Obviously, a high degree of correlation exists between stiffness (Table 2) and the second moment of area (Figure 5a). In fact, from equations 3 and 4, stiffness is proportional to the second moment of area. At the beginning of this linear region, both NiTi and CuNiTi are in the austenitic phase (as DSC transition temperatures, presented in part II, of unstressed wires are lower than testing temperature). This linear behavior extends up to the point Y (Figure 2c), above which force gradients reduces up to the overshoot point A, where a following negative slope is recognized for each investigated wire (Figure 3 and Figure 4). This overshoot point is widely documented in the literature of superelastic wires undergoing through both 3-Pb tests [9,15,20,23], and tensile tests on NiTi strips [31]. However, this phenomenon is poorly described in the literature, and a rationale for its occurrence is missing. It will be shown in Part II of this investigation that Af and Ms temperatures rapidly increase as NiTi and CuNiTi wires are stressed. As this temperatures approach and overpass the testing temperature (i.e. T=37°C), temperature driven austenitic to martensitic transformation (T<Ms<Af) occurs in conjunction with SIM. This transformation determines an elongation of the material [32]. As a consequence, a negative slope follows point A (Figure 2d). For all the investigated wires (Figure 3 and Figure 4), as the deflection is further increased, the stress-induced martensitic (SIM) transformation, described over the half past century [15,23,28,29,33], proceeds in conjunction with temperature driven transformation. The higher the level of deflection achieved through the loading phase, the greater the amount of martensite that is transformed (of course, there is a limit over which the SIM transformation ends and the behavior will be that of a classic martensitic alloy up to the break point [34]).
As the deflection direction is inverted (point C of figure 2d, that is the beginning of the unloading cycle), a steep force reduction occurs for all investigated wires (Figure 3 and Figure 4). This phenomenon has also been widely documented by the literature of superelastic wires undergoing mode I and mode II (Figure 1) 3-Pb tests [9,15,20,23]. Interestingly, tensile tests on NiTi strips do not show this steep force reduction at the beginning of the unloading cycle [31]. Therefore, this phenomenon can be ascribed to friction occurring on the supports of the 3-Pb test (Figure 1). At the beginning of the loading cycle, friction is perpendicular to the loading force, thus providing no contribution to the loading force. As bending increases up to point C, the wire is highly deflected, and the direction of friction provides a significant contribution to the developing force. As the direction of the deflection is inverted (loading to unloading cycle), friction immediately inverts its direction. As a consequence, a steep reduction is observed from C to D. This result is further corroborated by 3-Pb modified bending tests (tests including the bracket systems at the bending supports). In fact, load vs deflection curves for 3-Pb modified bending tests (Figure 1b) show an extended region over which the steep force reduction occurs [20,30,35,36], and friction largely affects the magnitude of both activation and deactivation plateau [23,35,37]. Nevertheless, the experiments reported in Figure 3 and Figure 4 show that the amount of force reduction due to friction (C to D segment) accounts for about 10% and 25% of the force measured in the activation and in the deactivation plateau, respectively. Therefore, it is suggested that the activation and the deactivation plateau may be overestimated and underestimated, respectively. Further research is needed for clarifying the effect of friction on the force measured on highly deflected wires, and its impact in clinical conditions.
A smoother force reduction follows the starting steep unloading region (D to E). For each wire, the slope of this region is lower than the starting linear region in the loading cycle. This slope decreases (Figure 3 and Figure 4) as the wire’s dimension decreases. The slope of this region is ascribed to an alloy reach of martensitic phase, stress induced through the loading cycle. For all the investigated wire, an almost constant force can be detected upon unloading (superelasticity) between the points Ps (Plateau start) and Pe (plateau end). This plateau force level depends on the type of alloy and on the wire’s cross-section. Plateau force levels are reported in Table 2, while figure 6b shows the linear regression of unloading plateau force values as a function of the second moment of area.
Similarly to the loading cycle, the end of the plateau upon unloading (point Pe of Figure 2c) is followed by a force overshoot before a linear force reduction occurs up to the axes origin (Figure 3 and Figure 4). Again, this behaviour can be ascribed to temperature values of Ms and Af. It will be shown in part II of this investigation that both Ms and Af decrease as the deflection level reduces. Once testing temperature becomes higher than Af (Ms<Af<T), the temperature driven martensitic to austenitic transformation occurs in conjunction with stress-driven transformation. For each NiTi and CuNiTi wire, this last region of the unloading cycle overlaps with the starting linear region upon the loading cycle.
4.2. Effect of the Second Moment of Area on Unloading Plateau Force Levels
For both NiTi and CuNiTi linear regression values, using the method of least squares, are higher than 0.99. For both NiTi and CuNiTi wires, a high degree of correlation exists between the load plateau levels (Table 2) and the second moment of area. This result is consistent with the almost constant stress values computed for all NiTi and all CuNiTi wires (204.2 MPa ± 18.7 MPa and 136.5 MPa ± 17.1 MPa, respectively). This constant stress level further corroborates the feature of superelasticity being the stress driven transformation occurring along the deactivation plateau. The inversely proportionality between unloading plateau force and the second moment of area has a significant clinical relevance. If plateau force level are known for a specific superelastic wire, plateau force levels for similar archwires (i.e. same alloy type composition, same technological heat treatment-training and same manufacturer), differing only for the geometry of the cross-section, can be estimated by considering the ratio of the second moment of area. To corroborate this result, we retrieved plateau force levels reported in the literature measured for at least three different geometries of similar superelastic wires [20,30].
Figure 10 shows a very good linear correlation for measurements performed by Lombardo et al. [20], and a good correlation for unloading force levels reported by Sabbagh et al. at a deflection of 2 mm [30]. However, the above reported inverse proportionality is not supported by the force levels detected at the deflection of 1 mm [30]. A possible reason is that this deflection level for the NiTi wire is close to the end point of the unloading plateau extension (Figure 3b), therefore it is close to the overshoot point. At this level of deflection, the wire is largely sensitive to temperature variation since testing temperature is close to Ms and Af temperatures (data will be shown in Part II). Therefore, small temperature variation may largely affect the corresponding force level.
4.3. Effect of the Span Length on Unloading Plateau Force Levels
The span length (L, Figure 1) represents an obvious important parameter for clinicians. We used a span length of 14 mm, as this distance clinically represents the distance of three frontal adjacent teeth, and this span distance is commonly adopted by several authors through both standard and modified 3-Pb tests [14,20]. However, L is not standardized, and literature data report force values detected over a wide range of span lengths (from 5 mm to 16 mm). Within this range, the ratio between L and the wire’s thickness is largely higher than 12, thus allowing to neglect the shear stress. It is expected that, at a given deflection, the force will reduce as L is increased since the bending moment (Figure 3 and eq. 4) reduces as L increases. Obviously, equations 3 and 4 are valid for deflection levels lower than the limit DL (Table 1), but this is true for permanently homogeneous materials. For superelastic wires this limit is further reduced as SIM occurs at deflection levels lower than DL.
Results reported in figure 6 suggest that an inverse proportionality exists between the span length and the unloading plateau force levels, but we expected a higher incidence. Unfortunately, to the author’s knowledge, research investigating the effect of the span length on unloading plateau force levels is missing. In clinical practice L spans aver a large range, therefore a tool for estimating force levels is of paramount importance. Further research is needed for investigating the effect of the span length on the plateau force level.
4.4. Comparison of the Force Plateau Levels Detected at 37°C with Literature Data
The 3-PB bending behavior of NiTi and CuNiTi wires at 37 °C (Figure 3 and Figure 4), has been widely explored for determining the force plateau level occurring in superelastic orthodontic wires. For both NiTi and CuNiTi wires, an increase in the thickness of the wire corresponds to an increase in the force required to bend it (loading phase) and, in the same way, also an increase in the force released by the wire to recover the initial shape (unloading phase). For each investigated orthodontic wire, the force plateau level (Table 2) significantly increases (p<0.05) as the cross-section dimension of the wire increases. While, for each investigated archwires’ geometry, the force plateau level of NiTi wires is significantly higher (p<0.05) than CuNiTi wires. These results corroborate previous investigation reported in the literature. In fact, force plateau level in the unloading phase detected at 37°C for the NiTi and CuNiTi wires are consistent with literature data. Specifically, Sabbagh et al. [30] has tested the same NiTi round archwire with the diameter of 0.014’’ using the 3-PB test at 37°C, and the force plateau level of 0.73 N has been measured. Apparently, this value differs from the plateau force reported in Table 3 (0.51 N). Instead, the difference arises from the different span length. Instead, Sabbagh et al. [30] used a span length of 10 mm. Therefore, the span length reduction produces a proportional increase for the measured force level. Of course, the span length is another important parameter affecting the force released by an applied orthodontic wire, because the distance of three adjacent teeth differs from the incisal to the posterior region of the oral environment.
The force plateau level 0.83(±0.03) N (Table 3) measured for the 0.016 inch NiTi wire is slightly higher than the force (0.67±0.11N) measured by Bartzela et al. [21] on the same wire using the same span length, but a highly reduced deflection rate (0.1 mm/min). This slight difference in the measured force levels can be ascribed to the deflection rate. The dependence of the force reaction of superelastic orthodontic wires on the deformation rate is documented [5], and even for quasi-static bending test, it is recognized that the force levels slightly increase by increasing the deflection rate [38]. Nakano et al. [22] has investigated the 0.016’’ NiTi wire (i.e. Titanol, manufactured by Forestadent®) representing the previous version of the Biostarter® reported in Table 2. The resulting reaction force, 87 gf (0.85 N), at the deflection of 1 mm is consistent with the plateau force reported for the 0.016’’ NiTi wire (Table 3). Instead, Lombardo et al. [20], investigating the same 0.014’’ and 0.016’’ NiTi wires through a modified 3-PB test including the passive self-ligating bracket system, report plateau force levels of 107.6 gf (105.5 N) and 174.9 gf (171.6 N), respectively. Apparently, these values are largely different from those reported in Table 3. Although the standard 3-PB (Figure 1a) is the most adopted approach for obvious reproducibility reasons, the modified 3-PB test (including the passive self-ligating bracket system) better describes the clinical scenario, by producing plateau force level 100% higher than those measured through standard 3-PB tests [35,36]. Therefore, results for NiTi wires (Table 3) are consistent with those reported by Lombardo et al. [20], but the capability of results from standard 3-PB test to estimate the deactivation force occurring in vivo remains a concern. Interestingly, similar deactivation forces have been measured through the modified 3-PB test regardless of type for passive self-ligating brackets [37,39,40], while deactivation forces largely depend on the ligation system that engages the wire in the slot of conventional brackets [39,41]. Therefore, force values measured through standard 3-PB test can be used to estimate only those that occur when passive self-ligating brackets are involved.
Unfortunately, previous literature concerning load vs deflection characteristics of the CuNiTi wire that we investigated is missing. However, a wide literature is available for similar orthodontic wires tested in similar conditions. In particular, for the 0.016 inch CuNiTi wire, the plateau level (Table 3) of 0.47±0.02 N is consistent with the force level detected at a deflection of 2.0 mm for a similar CuNiTi wire (Af=27°C similar to our investigated wires) tested at 37°C in the air environment [22]. While the plateau force of the CuNiTi wire with dimension of 0.014 x 0.025 is consistent with the force detected for a similar wire with dimension of 0.016 x 0.022 [23].
For both NiTi and CuNiTi wires, a high degree of correlation exists between the load plateau levels (Table 3) and the second moment of area of the investigated wires’ cross-sections (Figure 6b). This correlation is obviously expected for the stiffness (Figure 6a), as classic mechanics reports that, at a fixed deflection level, the force is proportional to the second moment of area, and it has been proved for a vast variety of orthodontic wires [42]. Instead, beyond point A of figure 2d, this correlation (i.e. the force plateau level of Figure 5b) is not expected after an extended deflection up to 3.0 mm, involving temperature and stress driven transformations altering the Young’s modulus in equation 4. However, this result is also supported by literature data investigating extended deflections (Figure 10). Nevertheless, this correlation provides a useful tool for estimating the force plateau level of superelastic wires, made of the same alloy, produced through the same trading technique, but differing for the cross-section geometry.
4.4. Effect of a Temporary Heating on the Unloading Plateau Force
The above harmonic scenario reported for the unloading plateau force level of both NiTi and CuNiTi completely changes as a temporary temperature increase of the wire is concerned (Figure 8). It is worth to note that if a hold deflection step (e.g. 2.0 mm or 1.5 mm) is introduced and temperature is kept constant at 37°C, the force released by the wire is constant all over the hold deflection step (baseline curves in blue color of Figure 8). Baseline force values reported in Figure 9 (blue color bars) as a function of the investigated deflection level are consistent with force vs deflection profiles of 0.016 round wires reported in Figures 3b and 4b, thus corroborating the scenario of superelastic wires described by the force vs deflection profiles at 37°C.
If a temporary heating up to 50°C occurs (e.g. simulating hot food or drink ingestion) at the beginning of the hold deflection step (red curves in Figure 8), the wire’s force increases and then this force reduces to a force plateau level as temperature returns to 37°C. This force plateau is significantly higher than that recorded in the absence of a temporary heating event (blue curves of Figure 8). This result suggests that part of the SIM produced during the loading cycle at 37°C is transformed into austenite by a temporary heating, thus increasing the force released by the superelastic wire.
This in vitro approach better describes the clinical orthodontic scenario. In fact, once the wire is engaged into the brackets, it preserves its bent configuration. No further deflection occurs, at least not in the daily attitudes. Therefore, if the SIM produced during the loading cycle at 37°C is transformed into austenite by a temporary heating, no further SIM is produced, as the wire preserves its bent configuration at the given deflection level. Our results suggest a new scenario for the improperly emphasized superelastic effect (i.e. the release of a constant force during the orthodontic treatment) reported over the past half century. The broadly documented plateau force levels detected at 37°C represent just a single block puzzle of the force scenario occurring at a specific deflection level. In Part II of this investigation, it will be shown that the unloading plateau only represents the lower boundary force that a superelastic archwire exerts. Our results suggest that a force increase of about 50% and 40% (Figure 9) takes place for deflection levels located at the beginning (Ps of Figure 2c) of the unloading plateau extension detected for NiTi and CuNiTi 0.016 round wires (Figures 3b and 4b), respectively. It will be shown in Part II of this investigation that the above increase of the unloading plateau force, occurring after a temporary heating, is consistent with temperature transition values measured for highly deflected NiTi and CuNiTi wires.
5. Conclusions
A new insight is provided for the behavior of superelastic orthodontic wires. Within the limitation of this investigation, the following conclusion may be drawn:
- Unloading plateau force levels detected at 37°C are consistent with literature data, and they represent the clinical scenario of the force released by NiTi and CuNiTi wires until temperature is kept constant at 37°C.
- At a constant temperature of 37°C, unloading plateau force levels of similar superelastic wires, differing only for the cross-section geometry, can be estimated by considering the second moment of area.
- The plateau force levels detected at 37°C, including those broadly reported in the literature, only represent a single block puzzle of the force scenario that a superelastic wire releases during the orthodontic treatment.
- Once the wire is bent and clinically applied, no further deflection occurs, at least not in the daily attitudes. The effect of a temporary heating (e.g. hot food or drink ingestion) produces a significant force increase whose magnitude depends on the deflection level.
- After a temporary heating increasing temperature up to about 50°C, the highest force increases of about 50% and 40% have been detected at deflection levels located at the beginning of the unloading plateau extension for NiTi and CuNiTi wires, respectively.
Supplementary Materials
The following supporting information can be downloaded at the website of this paper posted on Preprints.org, Figure S1: Force vs deflection curves at different span length for NiTi wires; www.mdpi.com/xxx/s2, Figure S2: Force vs deflection curves at different span length for CuNiTi wires.
Author Contributions
Conceptualization, R.D.S., A.G..; methodology, A.G., R.D.S.; investigation A.G., M.S.,T.R., R.D.S.; resources, V.D. and M.S.; data curation, A.G., T.R. and R.D.S.; writing—original draft preparation, R.D.S.; writing—review and editing, R.D.S., A.G., M.S., T.R. and V.D.; supervision, R.D.S. All authors have read and agreed to the published version of the manuscript.
Funding
This research received no external funding.
Institutional Review Board Statement
Not Applicable.
Informed Consent Statement
Not Applicable.
Data Availability Statement
Raw measurements and the analyzed datasets are available from the authors on reasonable request.
Acknowledgments
The authors wish to thank Prof. Alberto Laino and Prof. Sandro Rengo of the University Federico II of Naples for useful discussions. The authors also wish to acknowledge Dr. Giorgio Oliva of the University Federico II of Naples for assisting in the statistical analysis.
Conflicts of Interest
The authors declare no conflicts of interest.
References
- Kusy, R.P. A Review of Contemporary Archwires: Their Properties and Characteristics. Angle Orthod 1997, 67, 197–207. [Google Scholar] [CrossRef]
- Kotha, R. S.; Alla, R. K.; Shammas, M.; Ravi, R. K. An overview of orthodontic wires. Trends Biomater Artif Organs 2014, 28(1), 32–36. [Google Scholar]
- Khier, S.E.; Brantley, W.A.; Fournelle, R.A. Bending Properties of Superelastic and Nonsuperelastic Nickel-Titanium Orthodontic Wires. Am J Orthod Dentofacial Orthop 1991, 99, 310–318. [Google Scholar] [CrossRef]
- Parvizi, F.; Rock, W.P. The Load/Deflection Characteristics of Thermally Activated Orthodontic Archwires. Eur J Orthod 2003, 25, 417–421. [Google Scholar] [CrossRef]
- De Santis, R.; Dolci, F.; Laino; A., Martina, R.; Ambrosio, L.; Nicolais, L. The Eulerian buckling test for orthodontic wires. The European Journal of Orthodontics 2008, 30(2). 190-198.
- Kuntz, M. L.; Vadori, R.; Khan, M. I. Review of superelastic differential force archwires for producing ideal orthodontic forces: an advanced technology potentially applicable to orthognathic surgery and orthopedics. Current osteoporosis reports 2018, 16, 380–386. [Google Scholar] [CrossRef]
- Pious, N. ; Krishnan, R. V. ; Patni, V. ; Mhatre, A. Review of Superelastic Archwires in Orthodontics. Trends in Biomaterials & Artificial Organs 2021, 35(1), 91-94.
- Lombardo, L.; Arreghini, A.; Al Ardha, K.; Scuzzo, G.; Takemoto, K.; Siciliani, G. Wire Load-Deflection Characteristics Relative to Different Types of Brackets. Int Orthod 2011, 9, 120–139. [Google Scholar] [CrossRef] [PubMed]
- Stoyanova-Ivanova, A.; Georgieva, M.; Petrov, V.; Andreeva, L.; Petkov, A.; Georgiev, V. Effects of Clinical Use on the Mechanical Properties of Bio-Active®(BA) and TriTanium®(TR) Multiforce Nickel-Titanium Orthodontic Archwires. Materials 2023, 16(2), 483.
- Brantley, W.A. Evolution, Clinical Applications, and Prospects of Nickel-Titanium Alloys for Orthodontic Purposes. J World Fed Orthod 2020, 9, S19–S26. [Google Scholar] [CrossRef]
- Laino, G.; De Santis, R.; Gloria, A.; Russo, T.; Quintanilla, D.S.; Laino, A.; Martina, R.; Nicolais, L.; Ambrosio, L. Calorimetric and Thermomechanical Properties of Titanium-Based Orthodontic Wires: DSC-DMA Relationship to Predict the Elastic Modulus. J Biomater Appl 2012, 26, 829–844. [Google Scholar] [CrossRef] [PubMed]
- Šittner, P.; Heller, L.; Pilch, J.; Curfs, C.; Alonso, T.; Favier, D. Young’s Modulus of Austenite and Martensite Phases in Superelastic NiTi Wires. J. of Materi Eng and Perform 2014, 23, 2303–2314. [Google Scholar] [CrossRef]
- Meling, T.R.; Odegaard, J. The Effect of Short-Term Temperature Changes on Superelastic Nickel-Titanium Archwires Activated in Orthodontic Bending. Am J Orthod Dentofacial Orthop 2001, 119, 263–273. [Google Scholar] [CrossRef]
- Iijima, M.; Ohno, H.; Kawashima, I.; Endo, K.; Mizoguchi, I. Mechanical Behavior at Different Temperatures and Stresses for Superelastic Nickel–Titanium Orthodontic Wires Having Different Transformation Temperatures. Dental Materials 2002, 18, 88–93. [Google Scholar] [CrossRef] [PubMed]
- Rodrigues, P. F.; Fernandes, F. B.; Magalhães, R.; Camacho, E.; Lopes, A.; Paula, A. S.; Basu, R.; Schell, N. Thermo-mechanical characterization of NiTi orthodontic archwires with graded actuating forces. Journal of the mechanical behavior of biomedical materials 2020, 107, 103747. [Google Scholar] [CrossRef]
- Shaw, J. Thermomechanical Aspects of NiTi. Journal of the Mechanics and Physics of Solids 1995, 43, 1243–1281. [Google Scholar] [CrossRef]
- Sehitoglu, H.; Hamilton, R.; Maier, H.J.; Chumlyakov, Y. Hysteresis in NiTi Alloys. J. Phys. IV France 2004, 115, 3–10. [Google Scholar] [CrossRef]
- Assawakawintip, T.; Santiwong, P.; Khantachawana, A.; Sipiyaruk, K.; Chintavalakorn, R. The Effects of Temperature and Time of Heat Treatment on Thermo-Mechanical Properties of Custom-Made NiTi Orthodontic Closed Coil Springs. Materials 2022, 15(9), 3121. [Google Scholar] [CrossRef] [PubMed]
- Bradley, T.G.; Brantley, W.A.; Culbertson, B.M. Differential Scanning Calorimetry (DSC) Analyses of Superelastic and Nonsuperelastic Nickel-Titanium Orthodontic Wires. Am J Orthod Dentofacial Orthop 1996, 109, 589–597. [Google Scholar] [CrossRef] [PubMed]
- Lombardo, L.; Marafioti, M.; Stefanoni, F.; Mollica, F.; Siciliani, G. Load Deflection Characteristics and Force Level of Nickel Titanium Initial Archwires. Angle Orthod 2012, 82, 507–521. [Google Scholar] [CrossRef]
- Bartzela, T.N.; Senn, C.; Wichelhaus, A. Load-Deflection Characteristics of Superelastic Nickel-Titanium Wires. Angle Orthod 2007, 77, 991–998. [Google Scholar] [CrossRef]
- Nakano, H.; Satoh, K.; Norris, R.; Jin, T.; Kamegai, T.; Ishikawa, F.; Katsura, H. Mechanical Properties of Several Nickel-Titanium Alloy Wires in Three-Point Bending Tests. Am J Orthod Dentofacial Orthop 1999, 115, 390–395. [Google Scholar] [CrossRef] [PubMed]
- Fischer-Brandies, H.; Es-Souni, M.; Kock, N.; Raetzke, K.; Bock, O. Transformation Behavior, Chemical Composition, Surface Topography and Bending Properties of Five Selected 0.016" x 0.022" NiTi Archwires. J Orofac Orthop 2003, 64, 88–99. [CrossRef]
- Tonner, R.I.; Waters, N.E. The Characteristics of Super-Elastic Ni-Ti Wires in Three-Point Bending. Part I: The Effect of Temperature. Eur J Orthod 1994, 16, 409–419. [CrossRef]
- Moore, R. Intra-Oral Temperature Variation over 24 Hours. The European Journal of Orthodontics 1999, 21, 249–261. [Google Scholar] [CrossRef]
- Viecilli, R.F.; Burstone, C.J. Ideal Orthodontic Alignment Load Relationships Based on Periodontal Ligament Stress. Orthod Craniofac Res 2015, 18 Suppl 1, 180–186. [Google Scholar] [CrossRef]
- Beer F.P.; Johnston E.R.; DeWalf J.T. Bending. In Mechanics of solids (second edition). McGraw-Hill publishing. ISBN 88-386-6045-X. 2002, 213-218.
- Yanaru, K.; Yamaguchi, K.; Kakigawa, H.; Kozono, Y. Temperature-and deflection-dependences of orthodontic force with Ni-Ti wires. Dental materials journal 2003, 22(2), 146–159. [Google Scholar] [CrossRef] [PubMed]
- Lombardo, L.; Toni, G.; Stefanoni, F.; Mollica, F.; Guarneri, M. P.; Siciliani, G. The effect of temperature on the mechanical behavior of nickel-titanium orthodontic initial archwires. The Angle Orthodontist 2013, 83(2), 298–305. [Google Scholar] [CrossRef]
- Sabbagh, H.; Janjic Rankovic, M.; Martin, D.; Mertmann, M.; Hötzel, L.; Wichelhaus, A. Load Deflection Characteristics of Orthodontic Gummetal® Wires in Comparison with Nickel–Titanium Wires: An In Vitro Study. Materials 2024, 17(2), 533.
- Deng, Z.; Huang, K.; Yin, H.; Sun, Q. Temperature-dependent mechanical properties and elastocaloric effects of multiphase nanocrystalline NiTi alloys. Journal of Alloys and Compounds 2023, 938, 168547. [Google Scholar] [CrossRef]
- Florian, G.; Gabor, A. R.; Nicolae, C. A.; Rotaru, A.; Marinescu, C. A.; Iacobescu, G.; Rotaru, P. Physical and thermophysical properties of a commercial Ni–Ti shape memory alloy strip. Journal of Thermal Analysis and Calorimetry 2019, 138, 2103–2122. [Google Scholar] [CrossRef]
- Miyazaki, S.; Otsuka, K.; Suzuki, Y. Transformation pseudoelasticity and deformation behavior in a Ti-50.6 at% Ni alloy. Scripta Metallurgica, 1981, 15(3), 287-292. [CrossRef]
- Silva, P. C.; Grassi, E. N.; Araújo, C. J.; Delgado, J. M.; Lima, A. G. NiTi SMA Superelastic Micro Cables: Thermomechanical Behavior and Fatigue Life under Dynamic Loadings. Sensors 2022, 22(20), 8045. [Google Scholar] [CrossRef] [PubMed]
- Wilkinson, P. D.; Dysart, P. S.; Hood, J. A.; Herbison, G. P. Load-deflection characteristics of superelastic nickel-titanium orthodontic wires. American journal of orthodontics and dentofacial orthopedics 2002, 121(5), 483–495. [Google Scholar] [CrossRef] [PubMed]
- Nucera, R.; Gatto, E.; Borsellino, C.; Aceto, P.; Fabiano, F.; Matarese, G.; Cordasco, G. Influence of bracket-slot design on the forces released by superelastic nickel-titanium alignment wires in different deflection configurations. The Angle Orthodontist 2014, 84(3), 541–547. [Google Scholar] [CrossRef] [PubMed]
- Rino Neto, J.; Queiroz, G. V.; Paiva, J. B. D.; Ballester, R. Y. Does self-ligating brackets type influence the hysteresis, activation and deactivation forces of superelastic NiTi archwires? Dental Press Journal of Orthodontics 2013, 18, 81–85. [Google Scholar] [CrossRef]
- Nishikori, K.; Iwamoto, T. Effect of Deflection Rate on Bending Deformation Behavior of Fe-based Shape Memory Alloy. Applied Mechanics and Materials 2014, 566, 116–121. [Google Scholar] [CrossRef]
- Baccetti, T.; Franchi, L.; Camporesi, M.; Defraia, E.; Barbato, E. Forces produced by different nonconventional bracket or ligature systems during alignment of apically displaced teeth. The Angle Orthodontist 2009, 79(3), 533–539. [Google Scholar] [CrossRef] [PubMed]
- Fansa, M.; Keilig, L.; Reimann, S.; Jäger, A.; Bourauel, C. The Leveling Effectiveness of Self-ligating and Conventional Brackets for Complex Tooth Malalignments. J Orofac Orthop 2009;70:285–96. [CrossRef]
- Kasuya, S.; Nagasaka, S.; Hanyuda, A.; Ishimura, S.; Hirashita, A. The effect of ligation on the load–deflection characteristics of nickel–titanium orthodontic wire. The European Journal of Orthodontics 2007, 29(6), 578–582. [Google Scholar] [CrossRef] [PubMed]
- Tonner, R. I. M. ; Waters, N. E. The characteristics of super-elastic Ni-Ti wires in three-point bending. Part II: intra-batch variation. European Journal of Orthodontics, 1994, 16; 5; 421-425. [CrossRef]
Figure 1.
Bending moment distribution along the wire’s axis and reaction forces and moment occurring at the supports for the standard 3-Pb and modified 3-Pb tests.
Figure 1.
Bending moment distribution along the wire’s axis and reaction forces and moment occurring at the supports for the standard 3-Pb and modified 3-Pb tests.
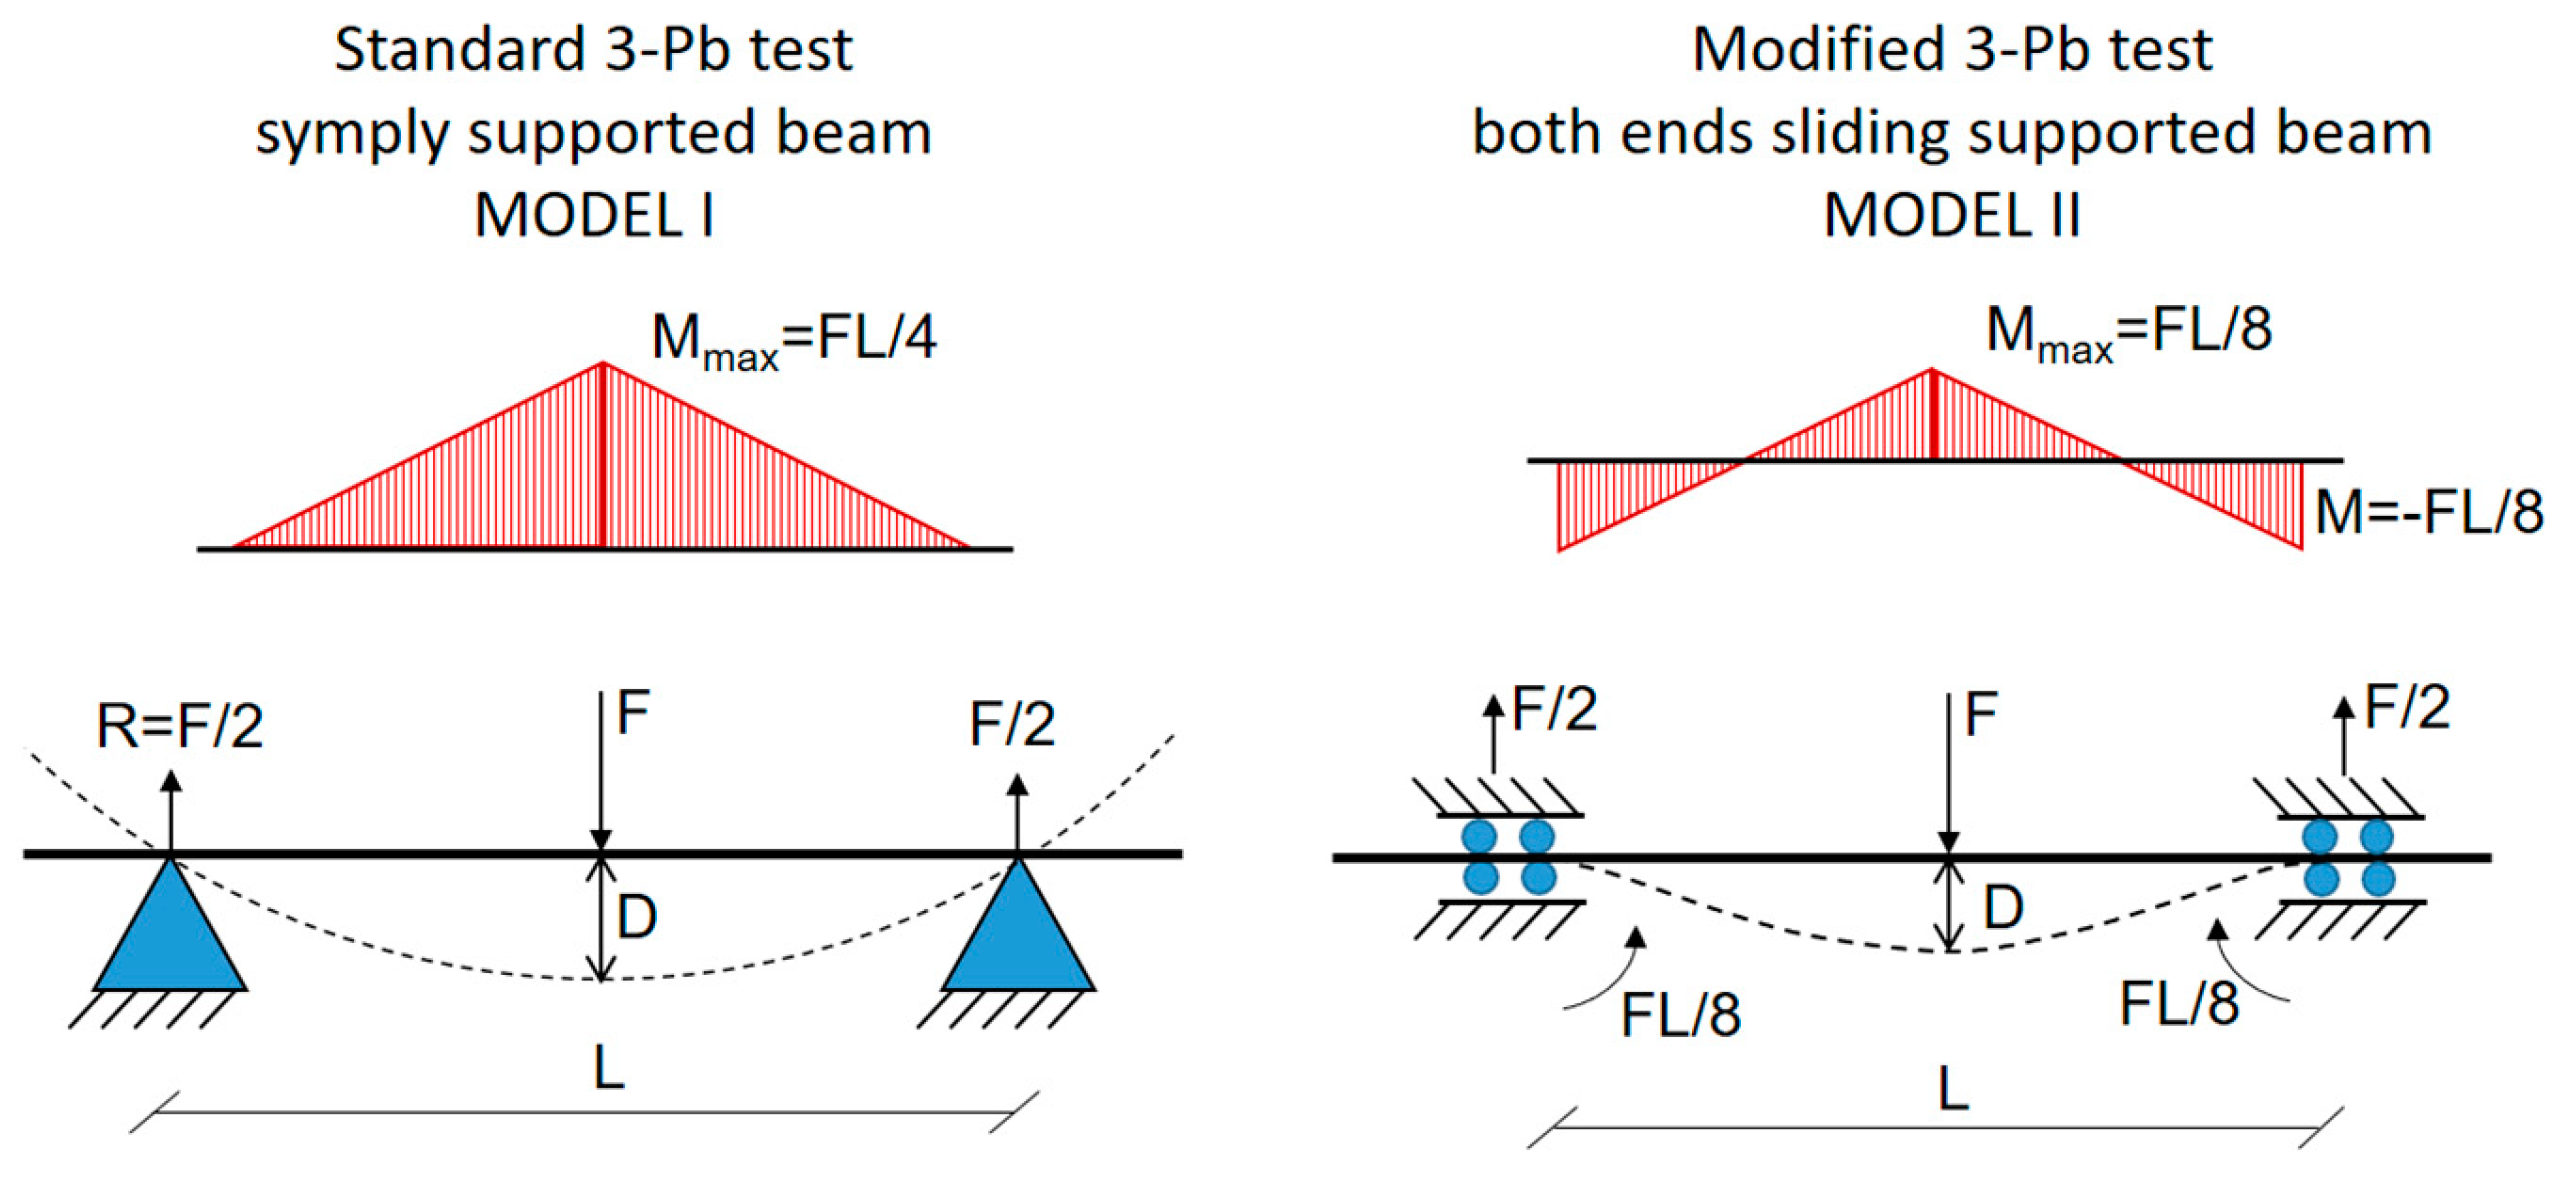
Figure 2.
3-Pb test set-up: (a) equipment and temperature distribution around the water bath heated or cooled by a Peltier system; (b) three consecutive load-unload cycles of 3.0 mm/min at 37°±1°C; (c) investigated Force vs Deflection properties; temperature and deflection timed signals (d) single cycle at 37°C, (e) hold mechanical signal of 5 minutes at 37°C, (f) hold mechanical signal of 5 minutes introducing a temporary local heating up to 50°C. Each specimen underwent four cycles (Figures 2d, 2e, 2f) through the sequence (d) (e) (d) (f).
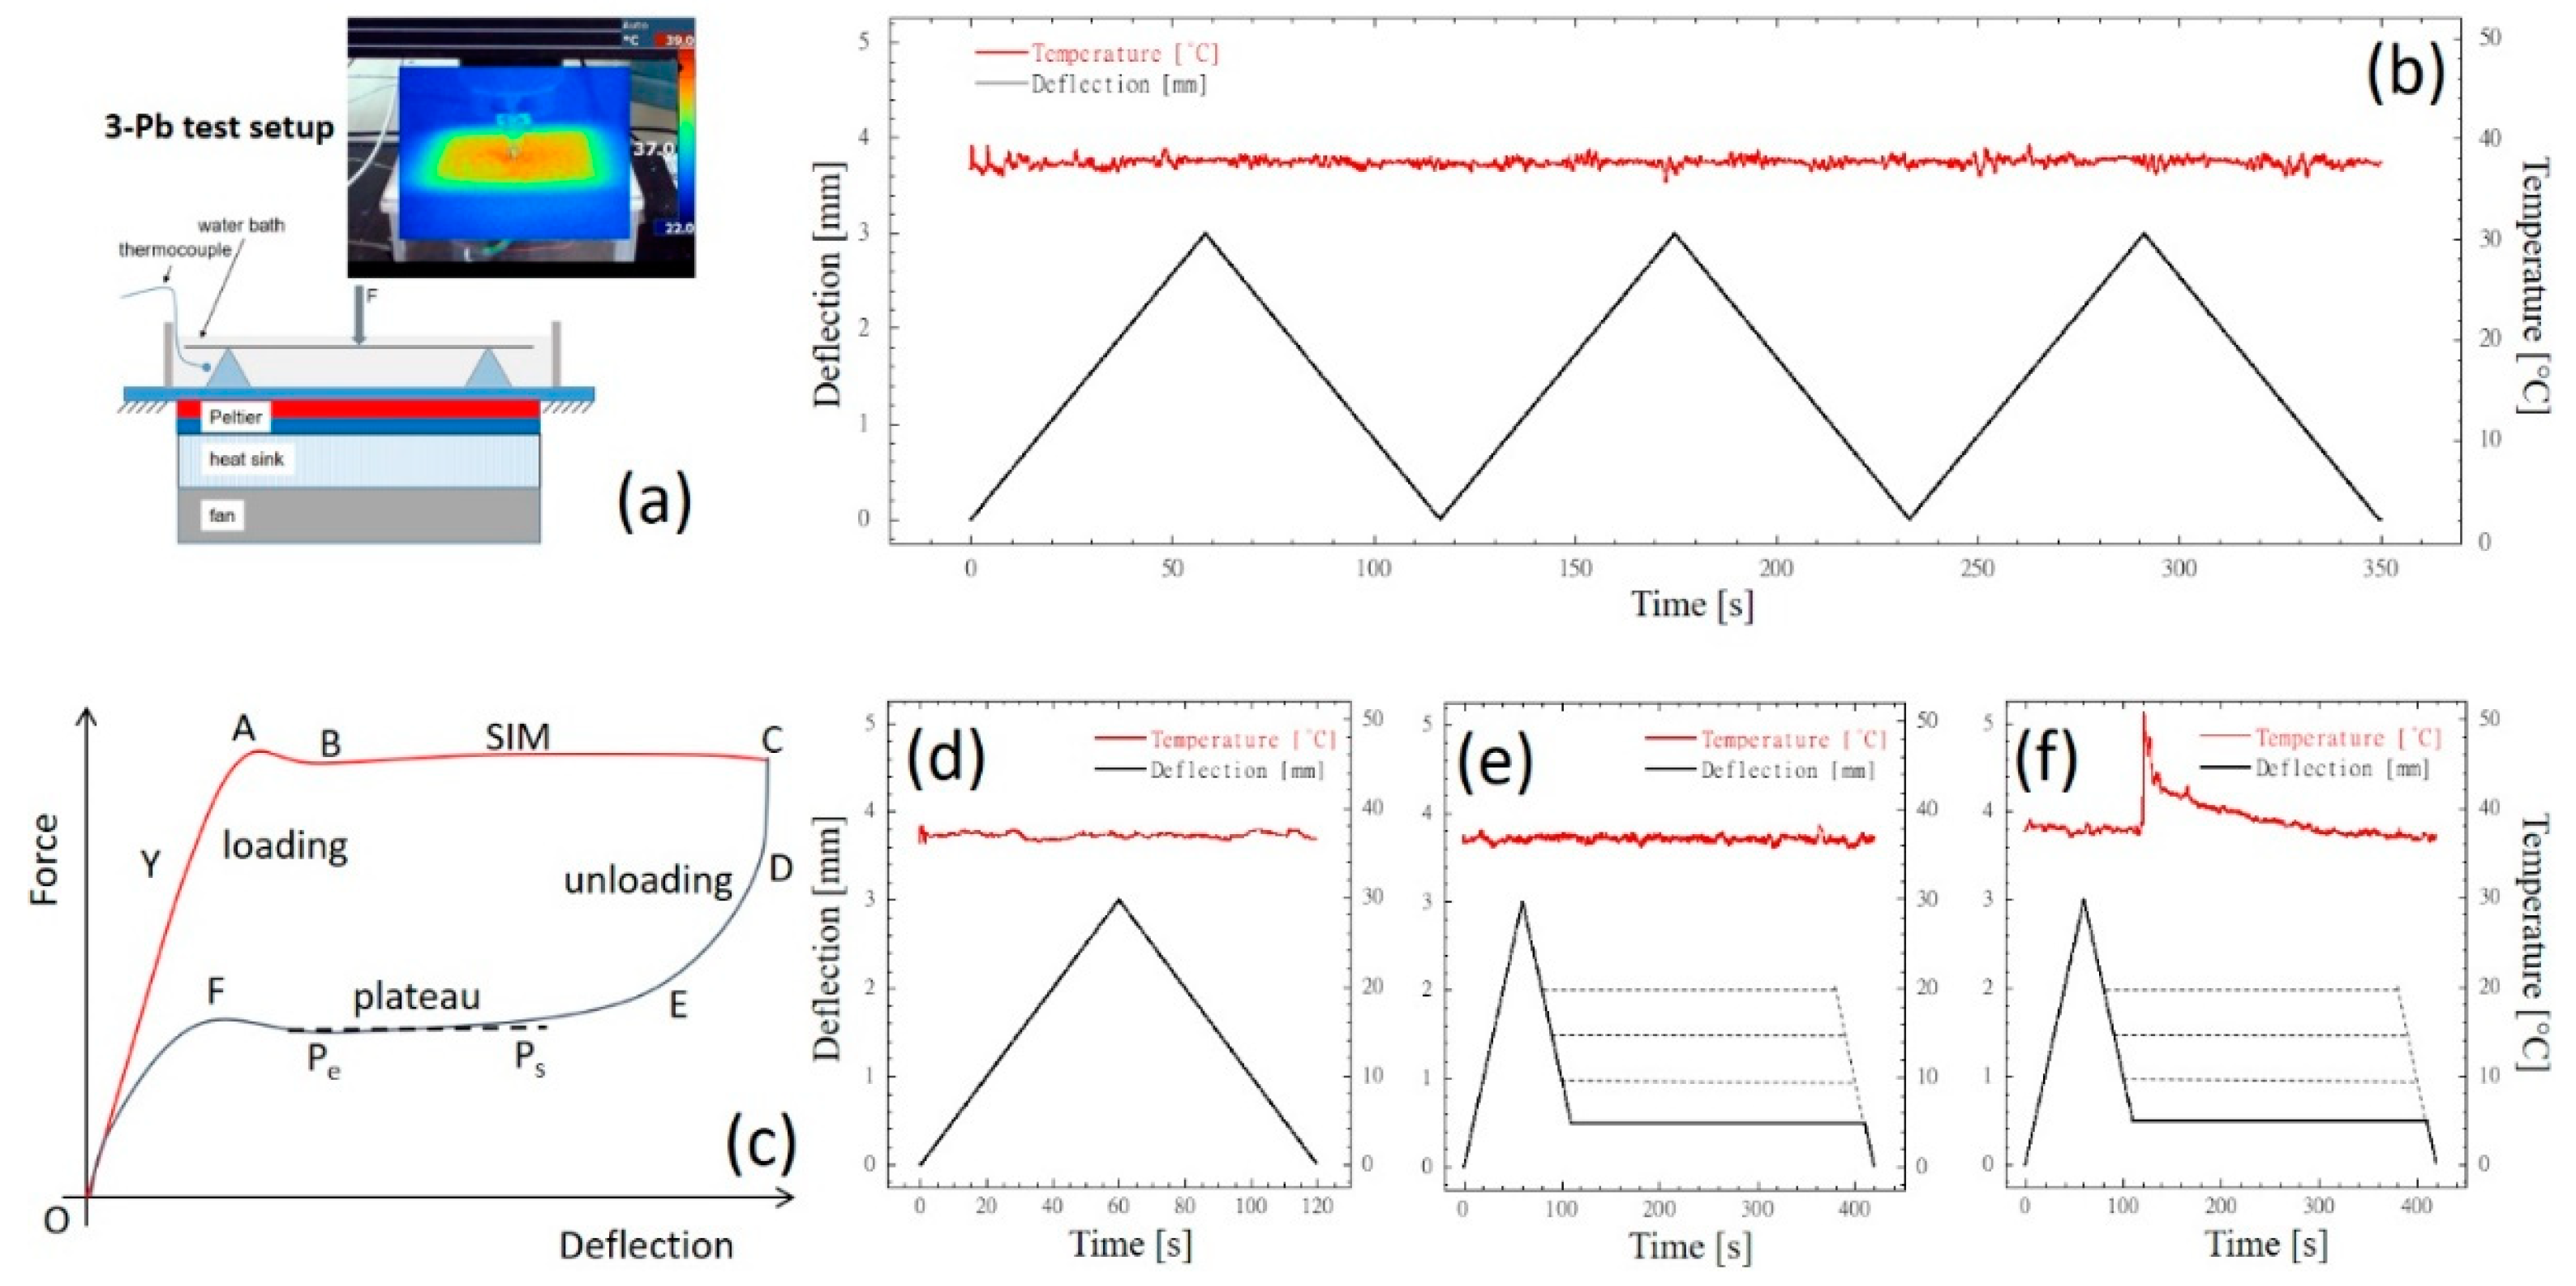
Figure 3.
Typical force-deflection profiles of (a) rectangular and (b) round NiTi wires during loading and unloading cycles up to the deflection of 3.0 mm at the temperature level of 37°C.
Figure 3.
Typical force-deflection profiles of (a) rectangular and (b) round NiTi wires during loading and unloading cycles up to the deflection of 3.0 mm at the temperature level of 37°C.
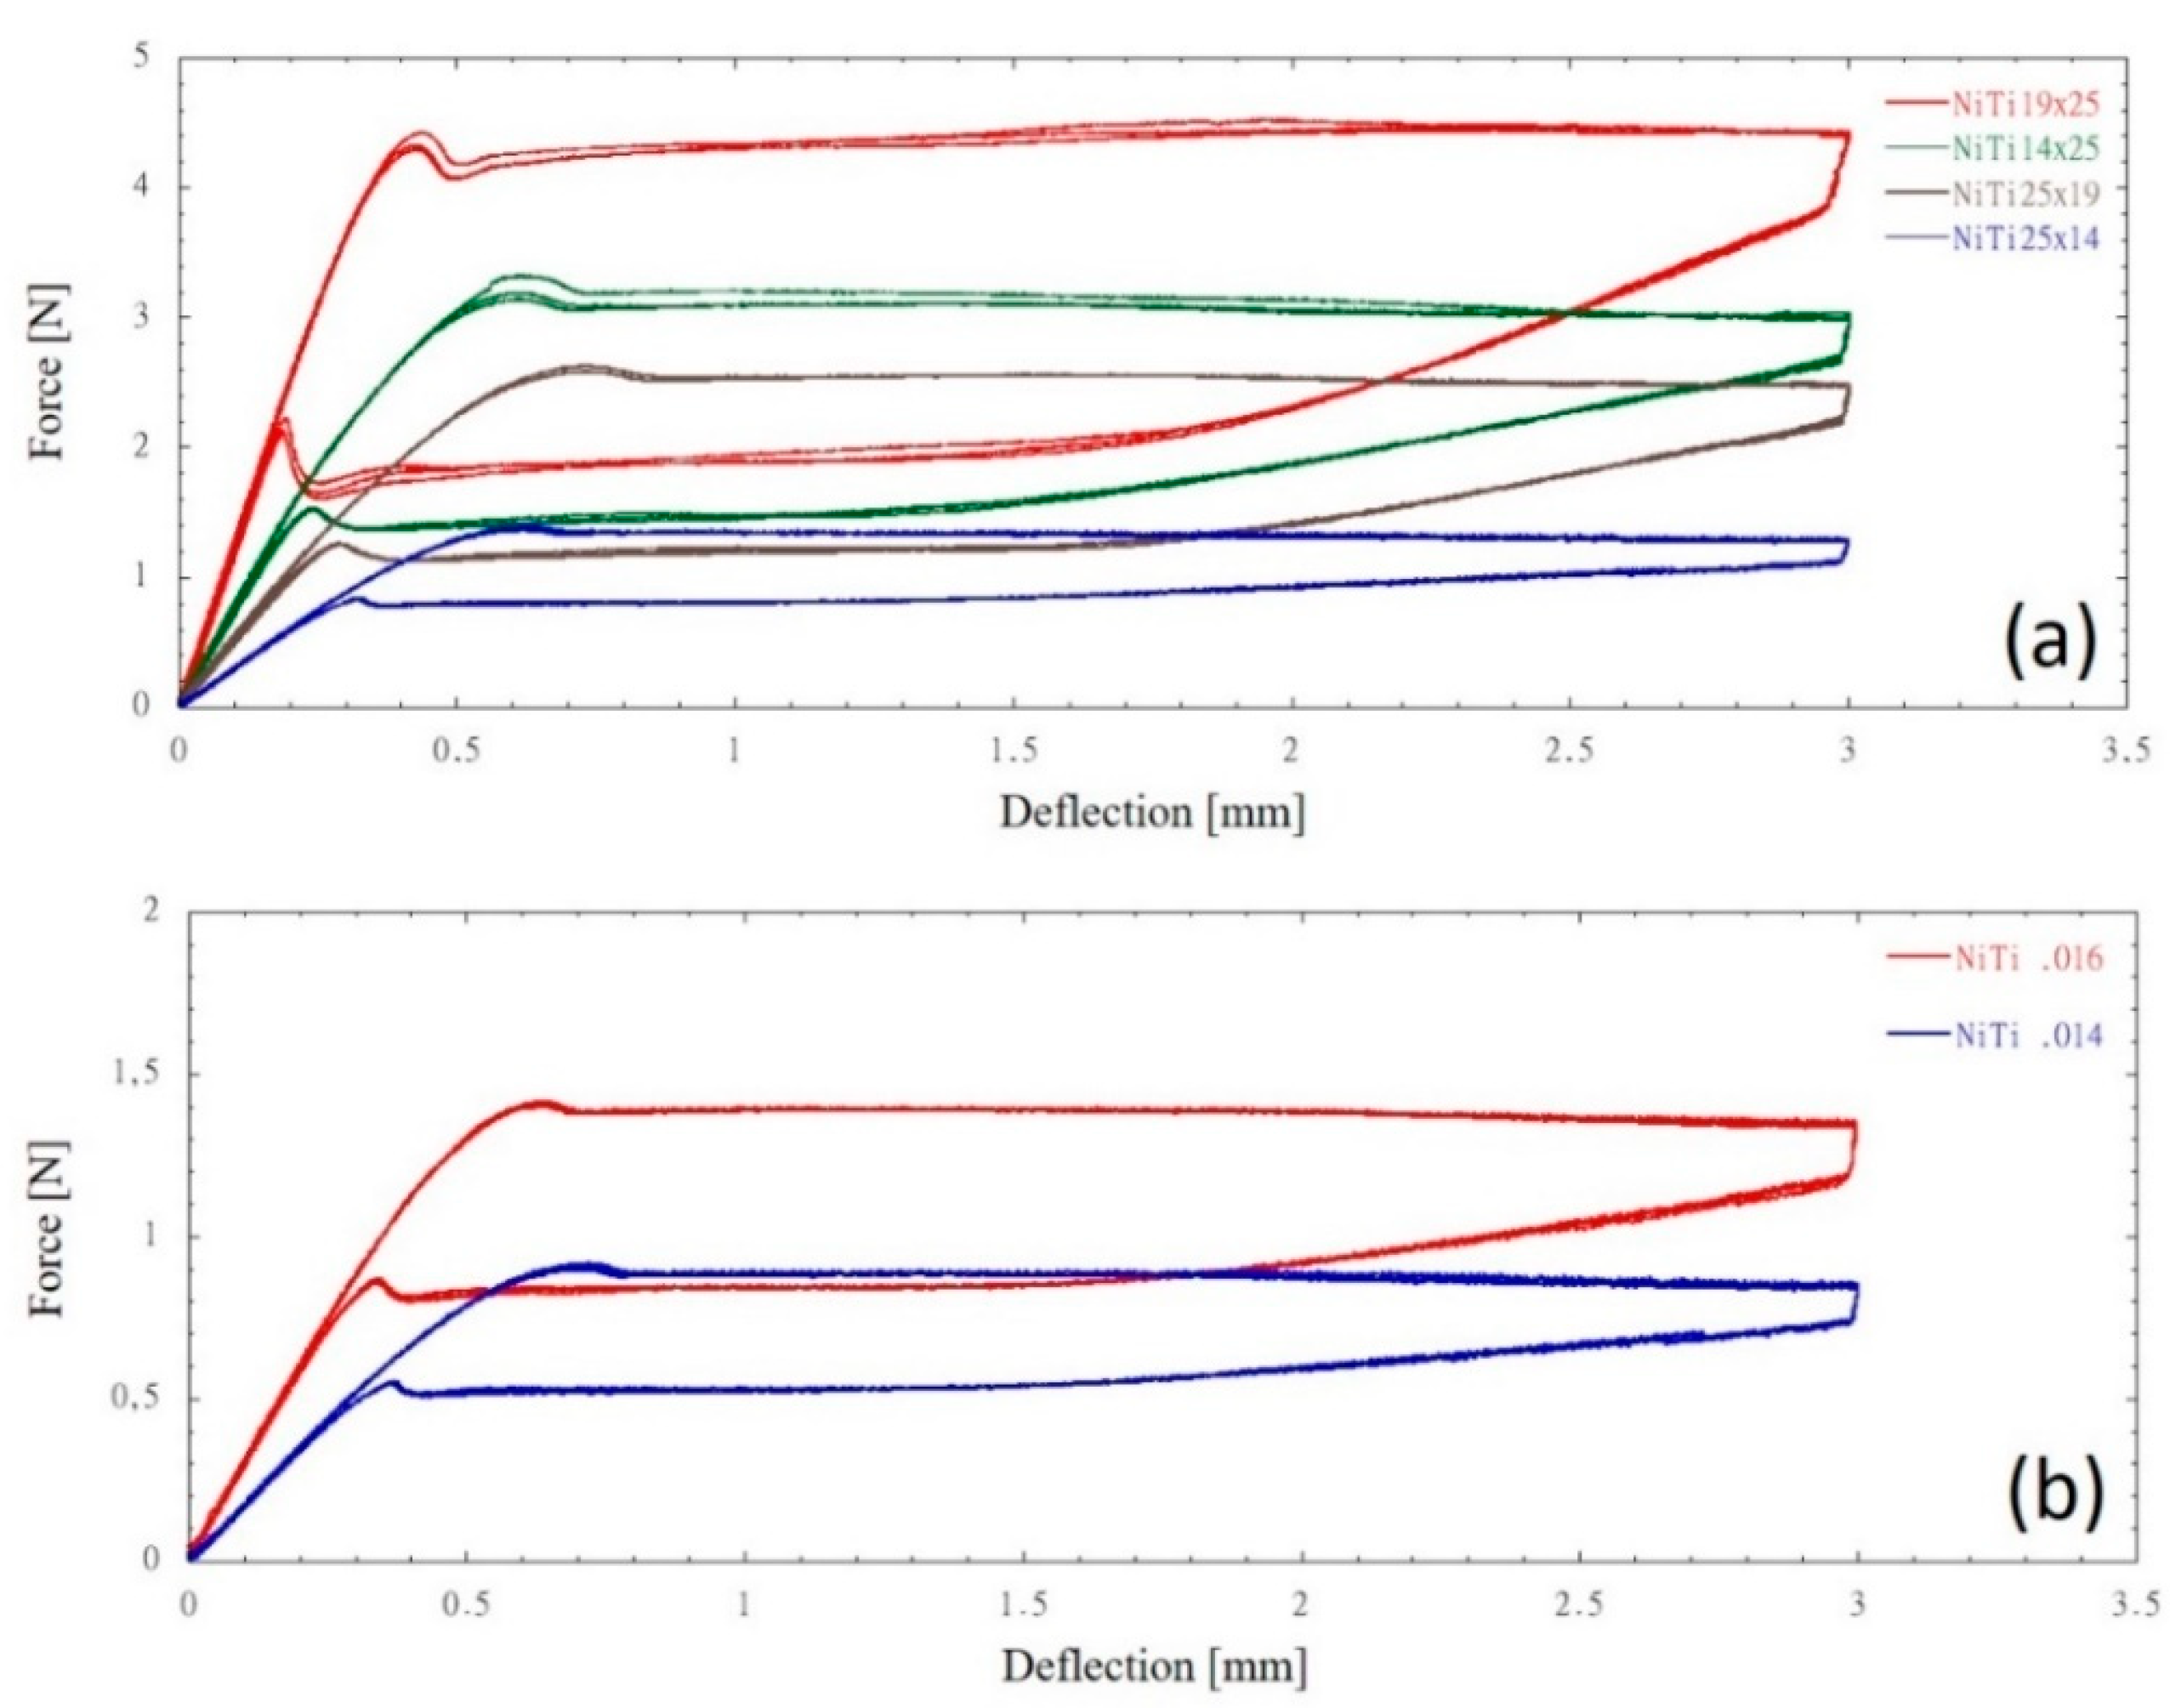
Figure 4.
Typical force-deflection profiles of (a) rectangular and (b) round CuNiTi wires during loading and unloading cycles up to the deflection of 3.0 mm at the temperature level of 37°C.
Figure 4.
Typical force-deflection profiles of (a) rectangular and (b) round CuNiTi wires during loading and unloading cycles up to the deflection of 3.0 mm at the temperature level of 37°C.
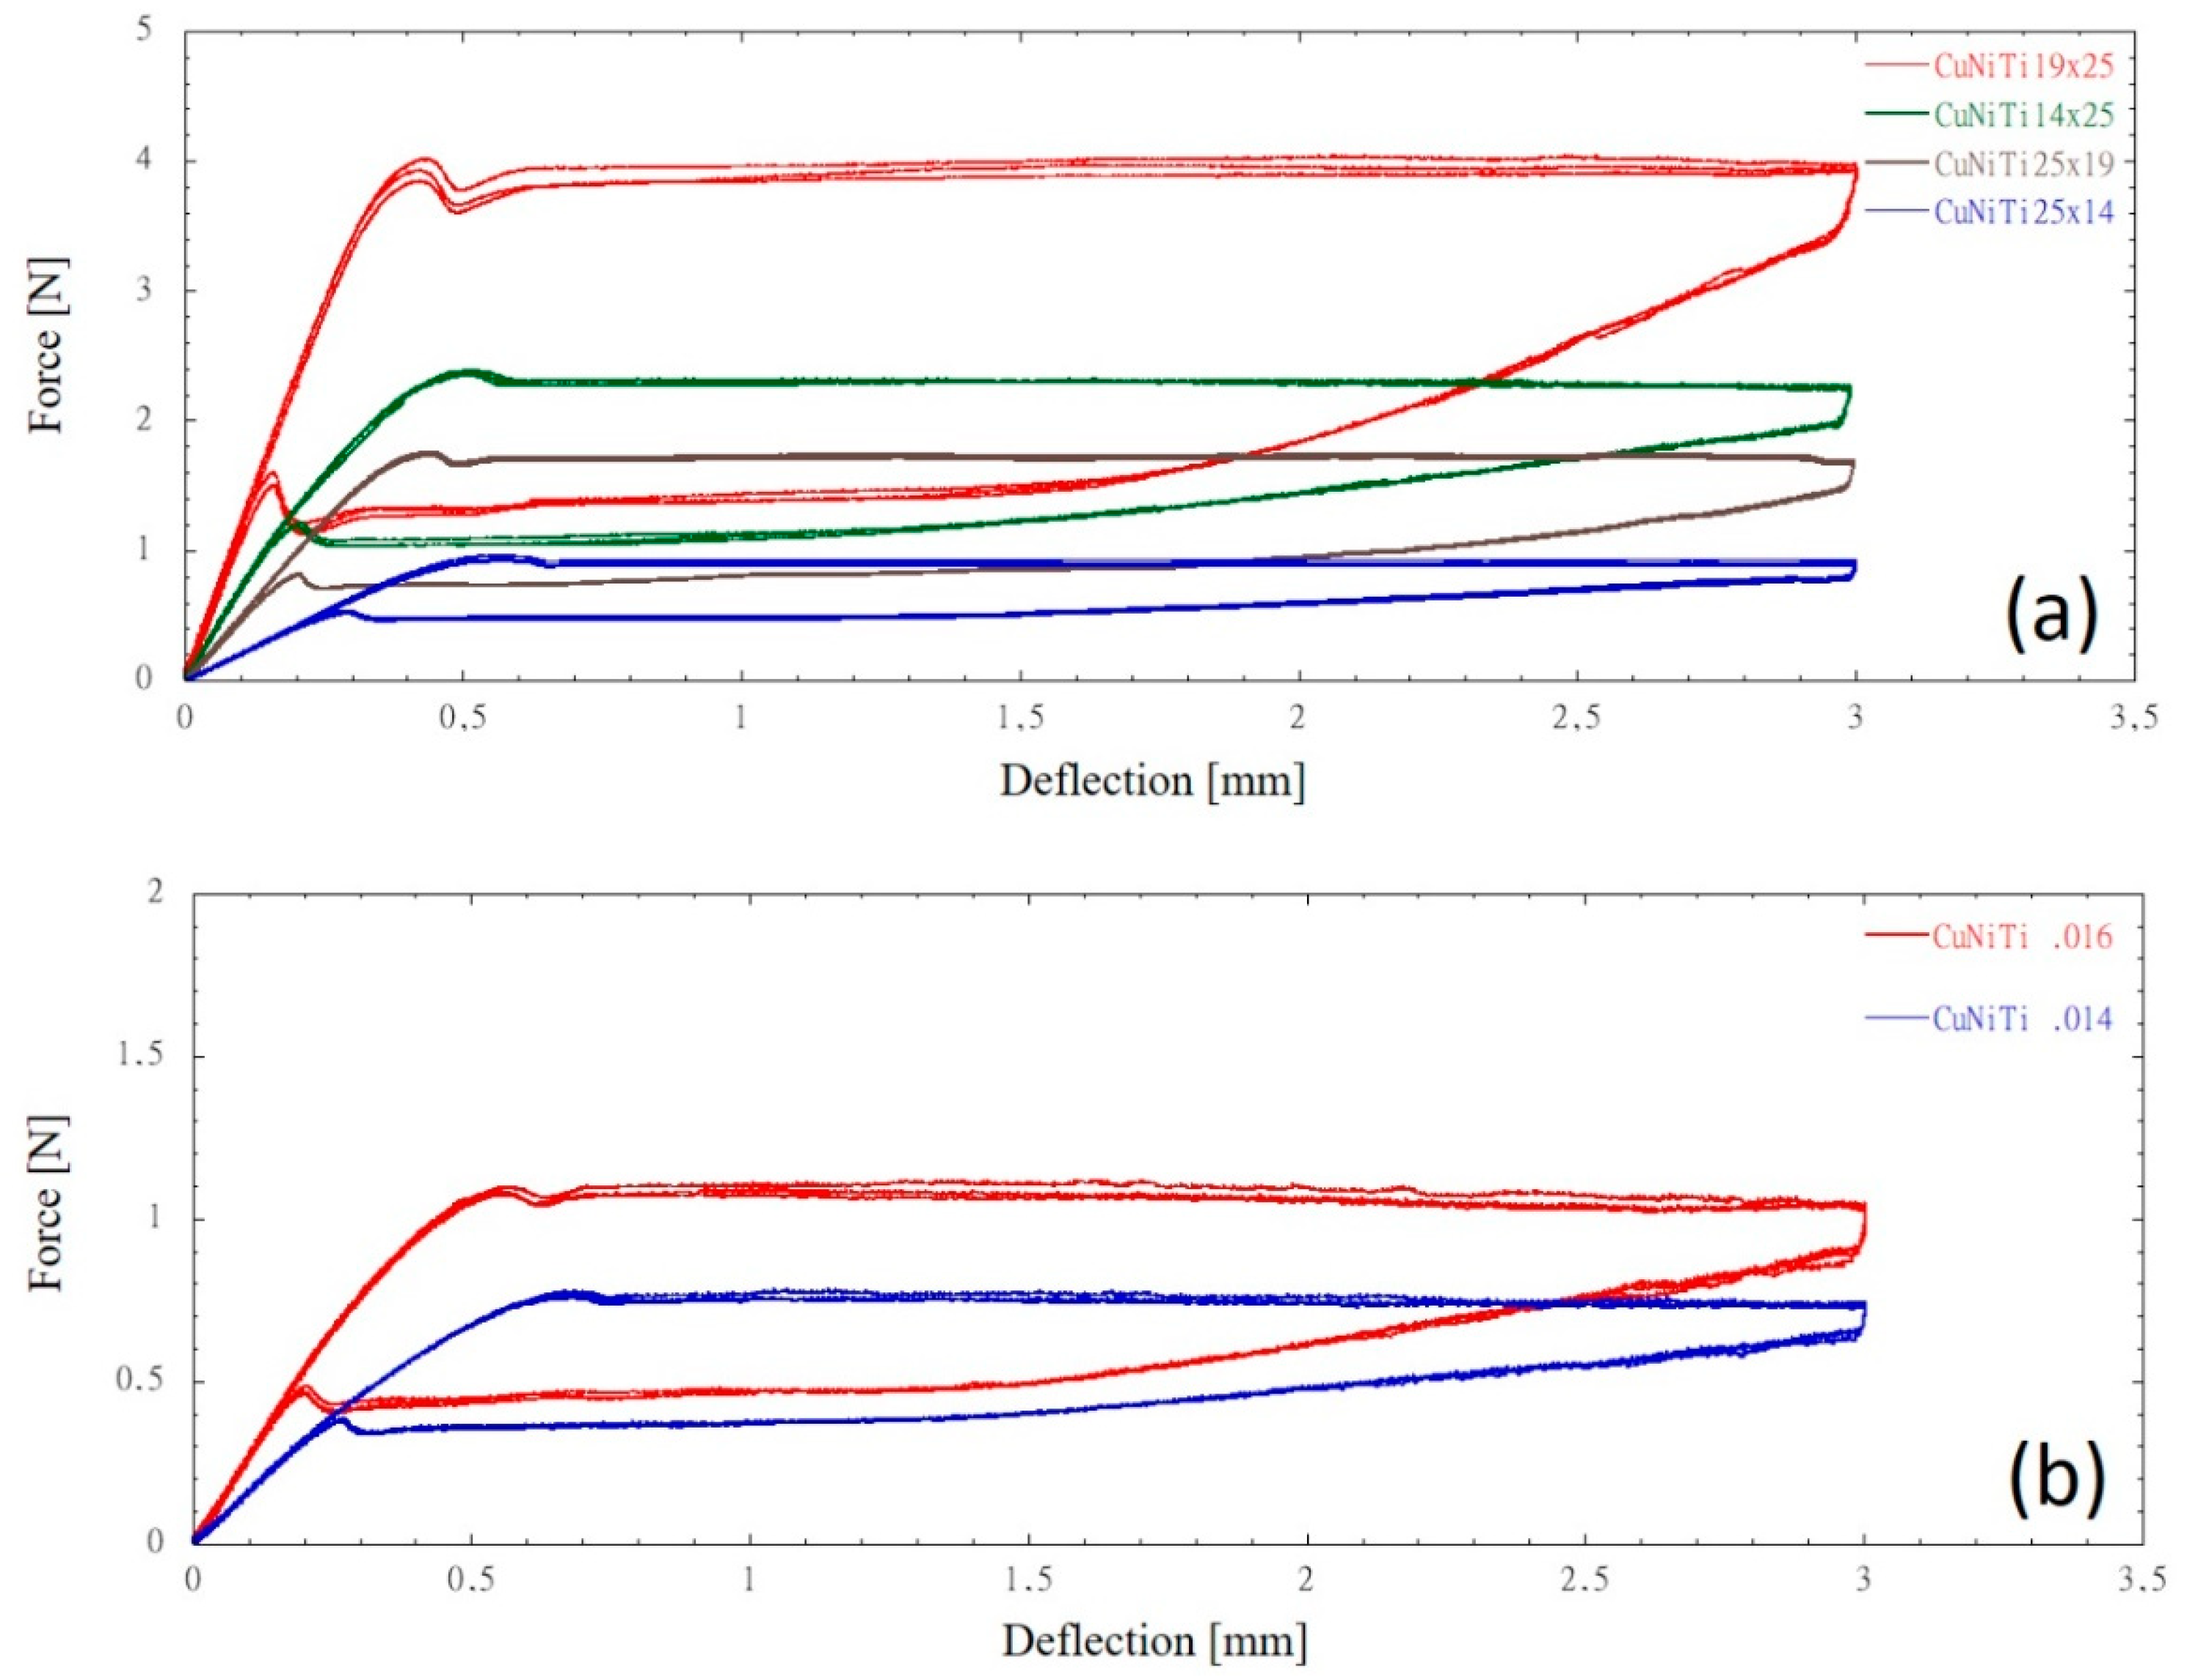
Figure 5.
Linear regression of stiffness (a) and unloading force plateau (b) values as a function of the second moment of area. For both NiTi and CuNiTi linear regression values, using the method of least squares, are higher than 0.99.
Figure 5.
Linear regression of stiffness (a) and unloading force plateau (b) values as a function of the second moment of area. For both NiTi and CuNiTi linear regression values, using the method of least squares, are higher than 0.99.
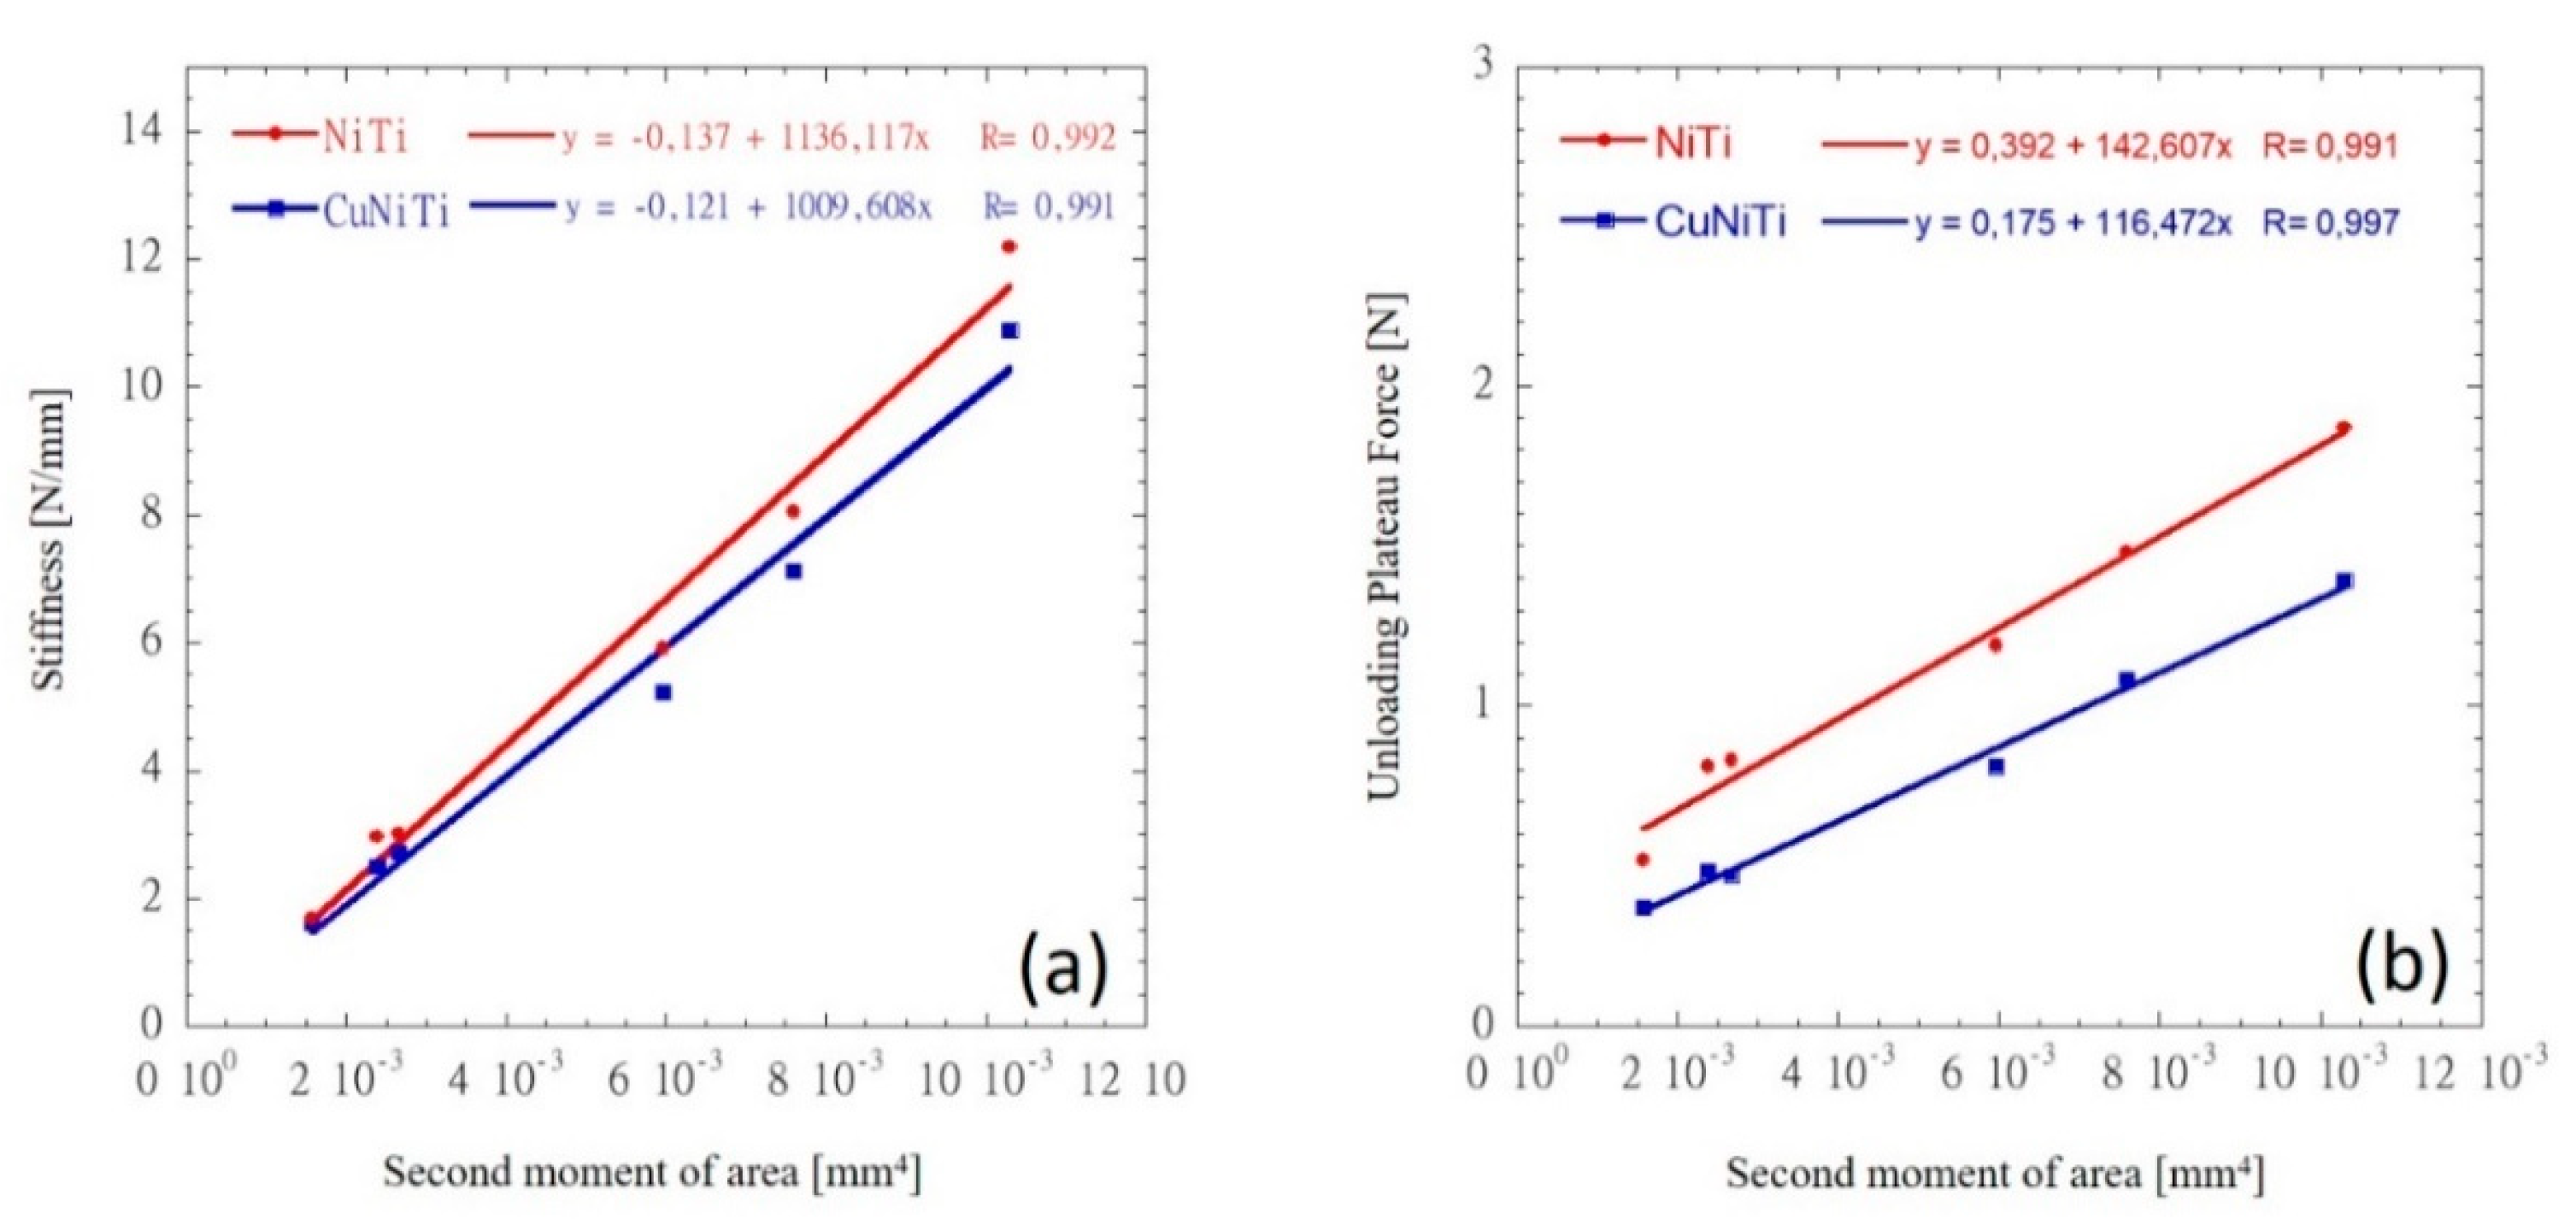
Figure 6.
Load vs deflection curves at the investigated span length of 10, 12, 14 and 16 mm for the 0.016 round NiTi and CuNiTi wires. For both NiTi and CuNiTi linear regression values, using the method of least squares, are about 0.99.
Figure 6.
Load vs deflection curves at the investigated span length of 10, 12, 14 and 16 mm for the 0.016 round NiTi and CuNiTi wires. For both NiTi and CuNiTi linear regression values, using the method of least squares, are about 0.99.
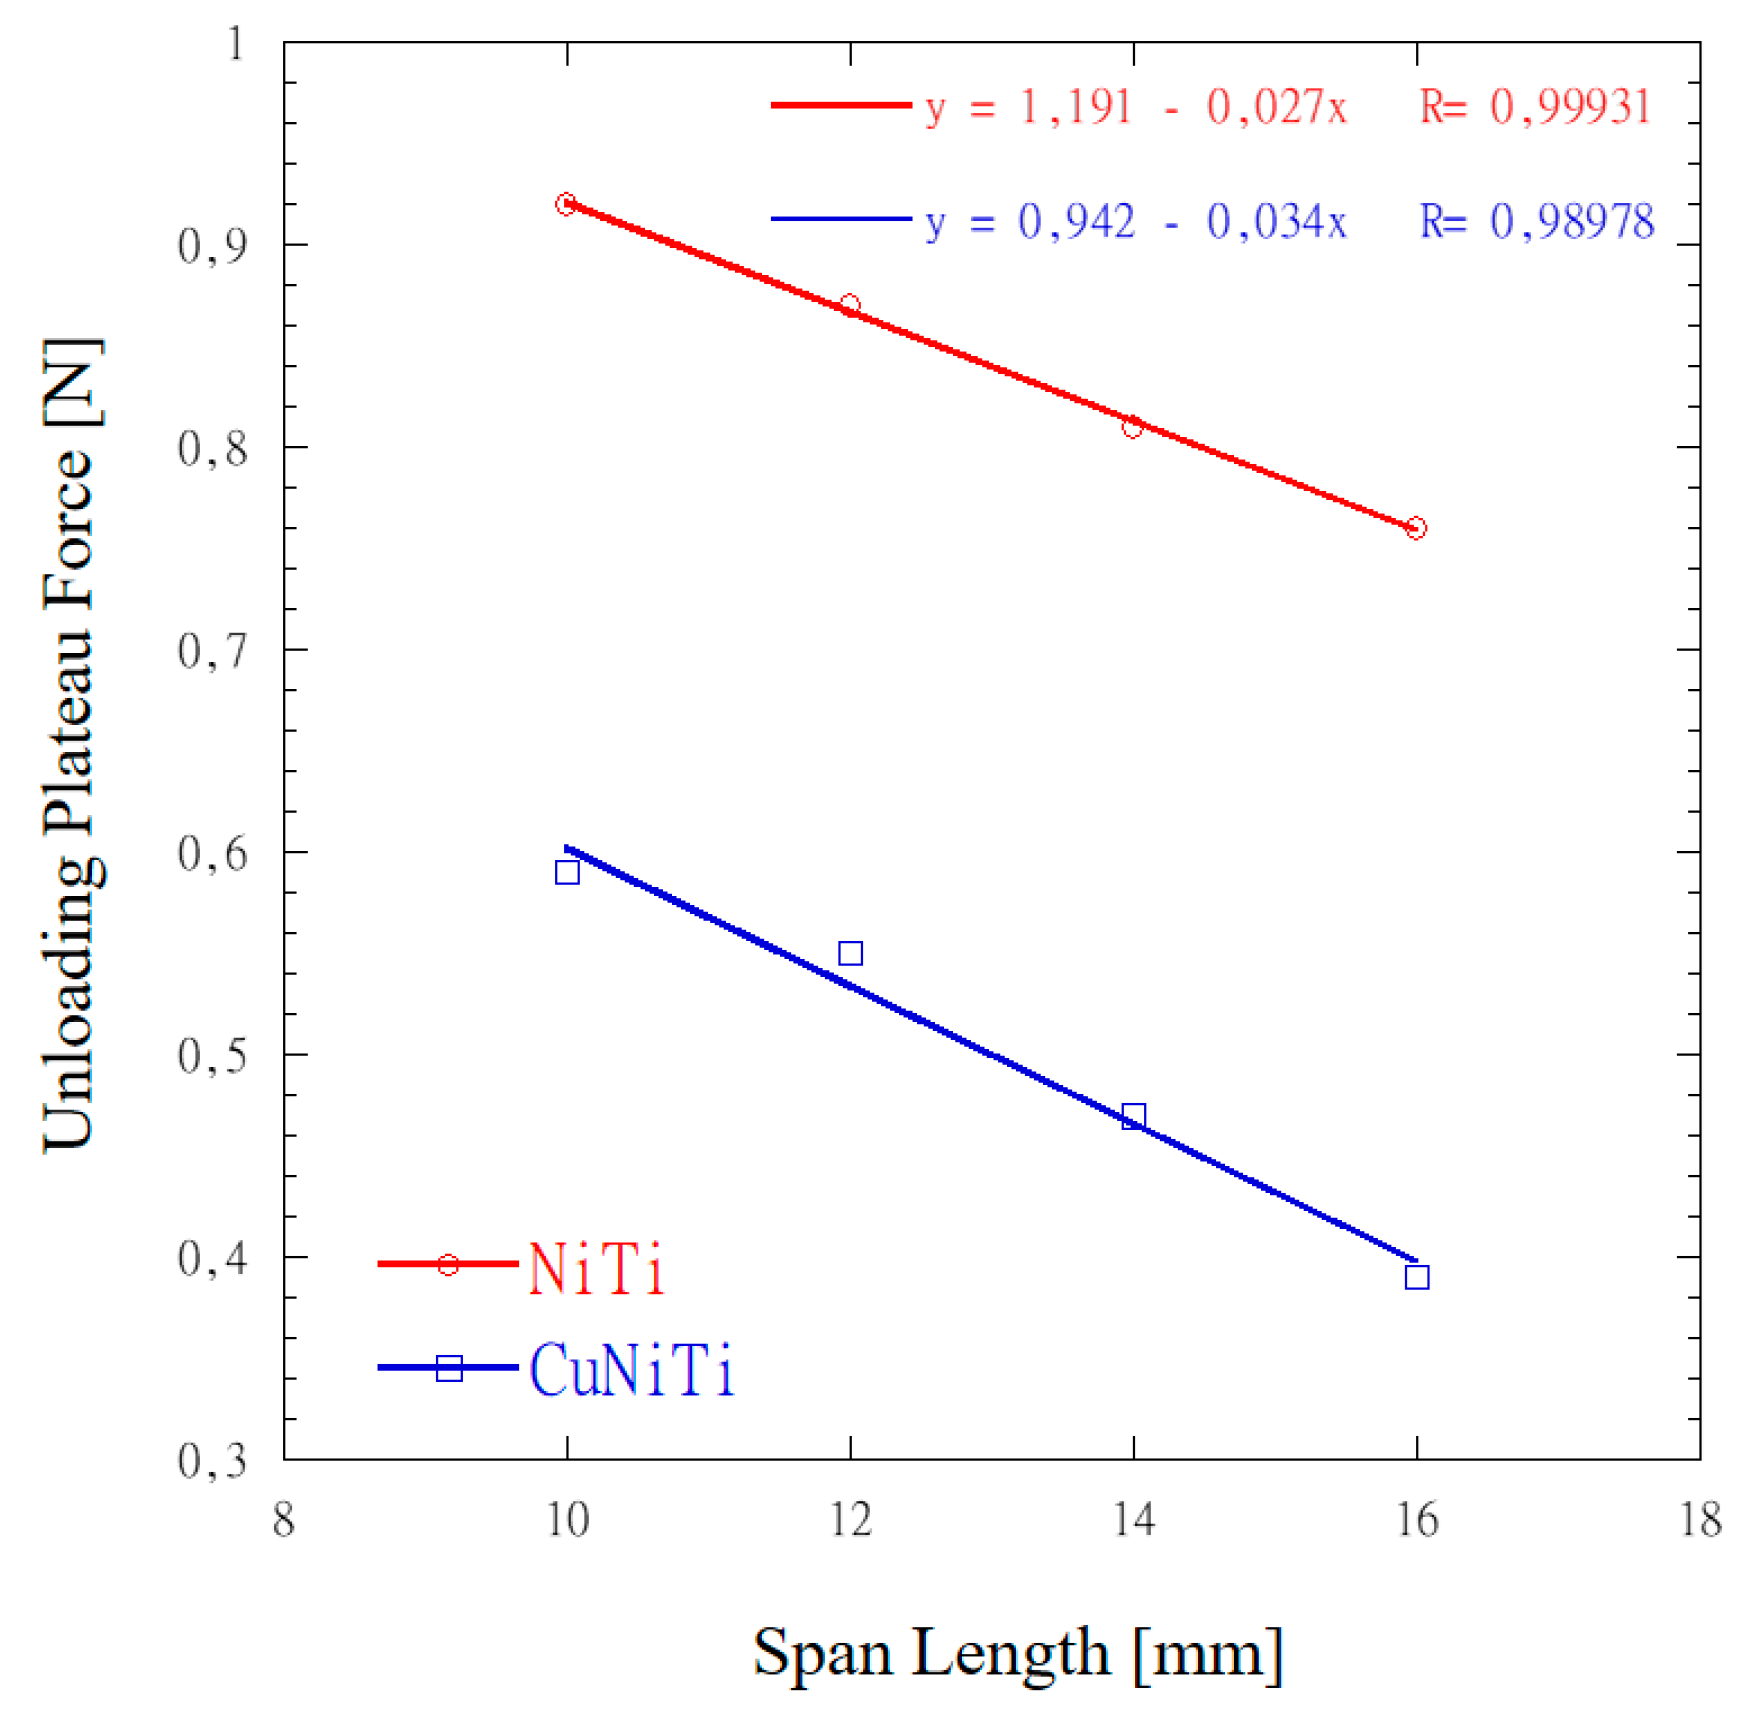
Figure 7.
Force vs deflection curves of 0.016 round CuNiTi wires presenting an hold period of 5 min at a deflection level of (a) 1.5 mm and (b) 2.0 mm. For the baseline (blue curves) temperature is kept constant at 37±1°C. A temporary heating signal is introduced at the beginning of the hold period (red curves).
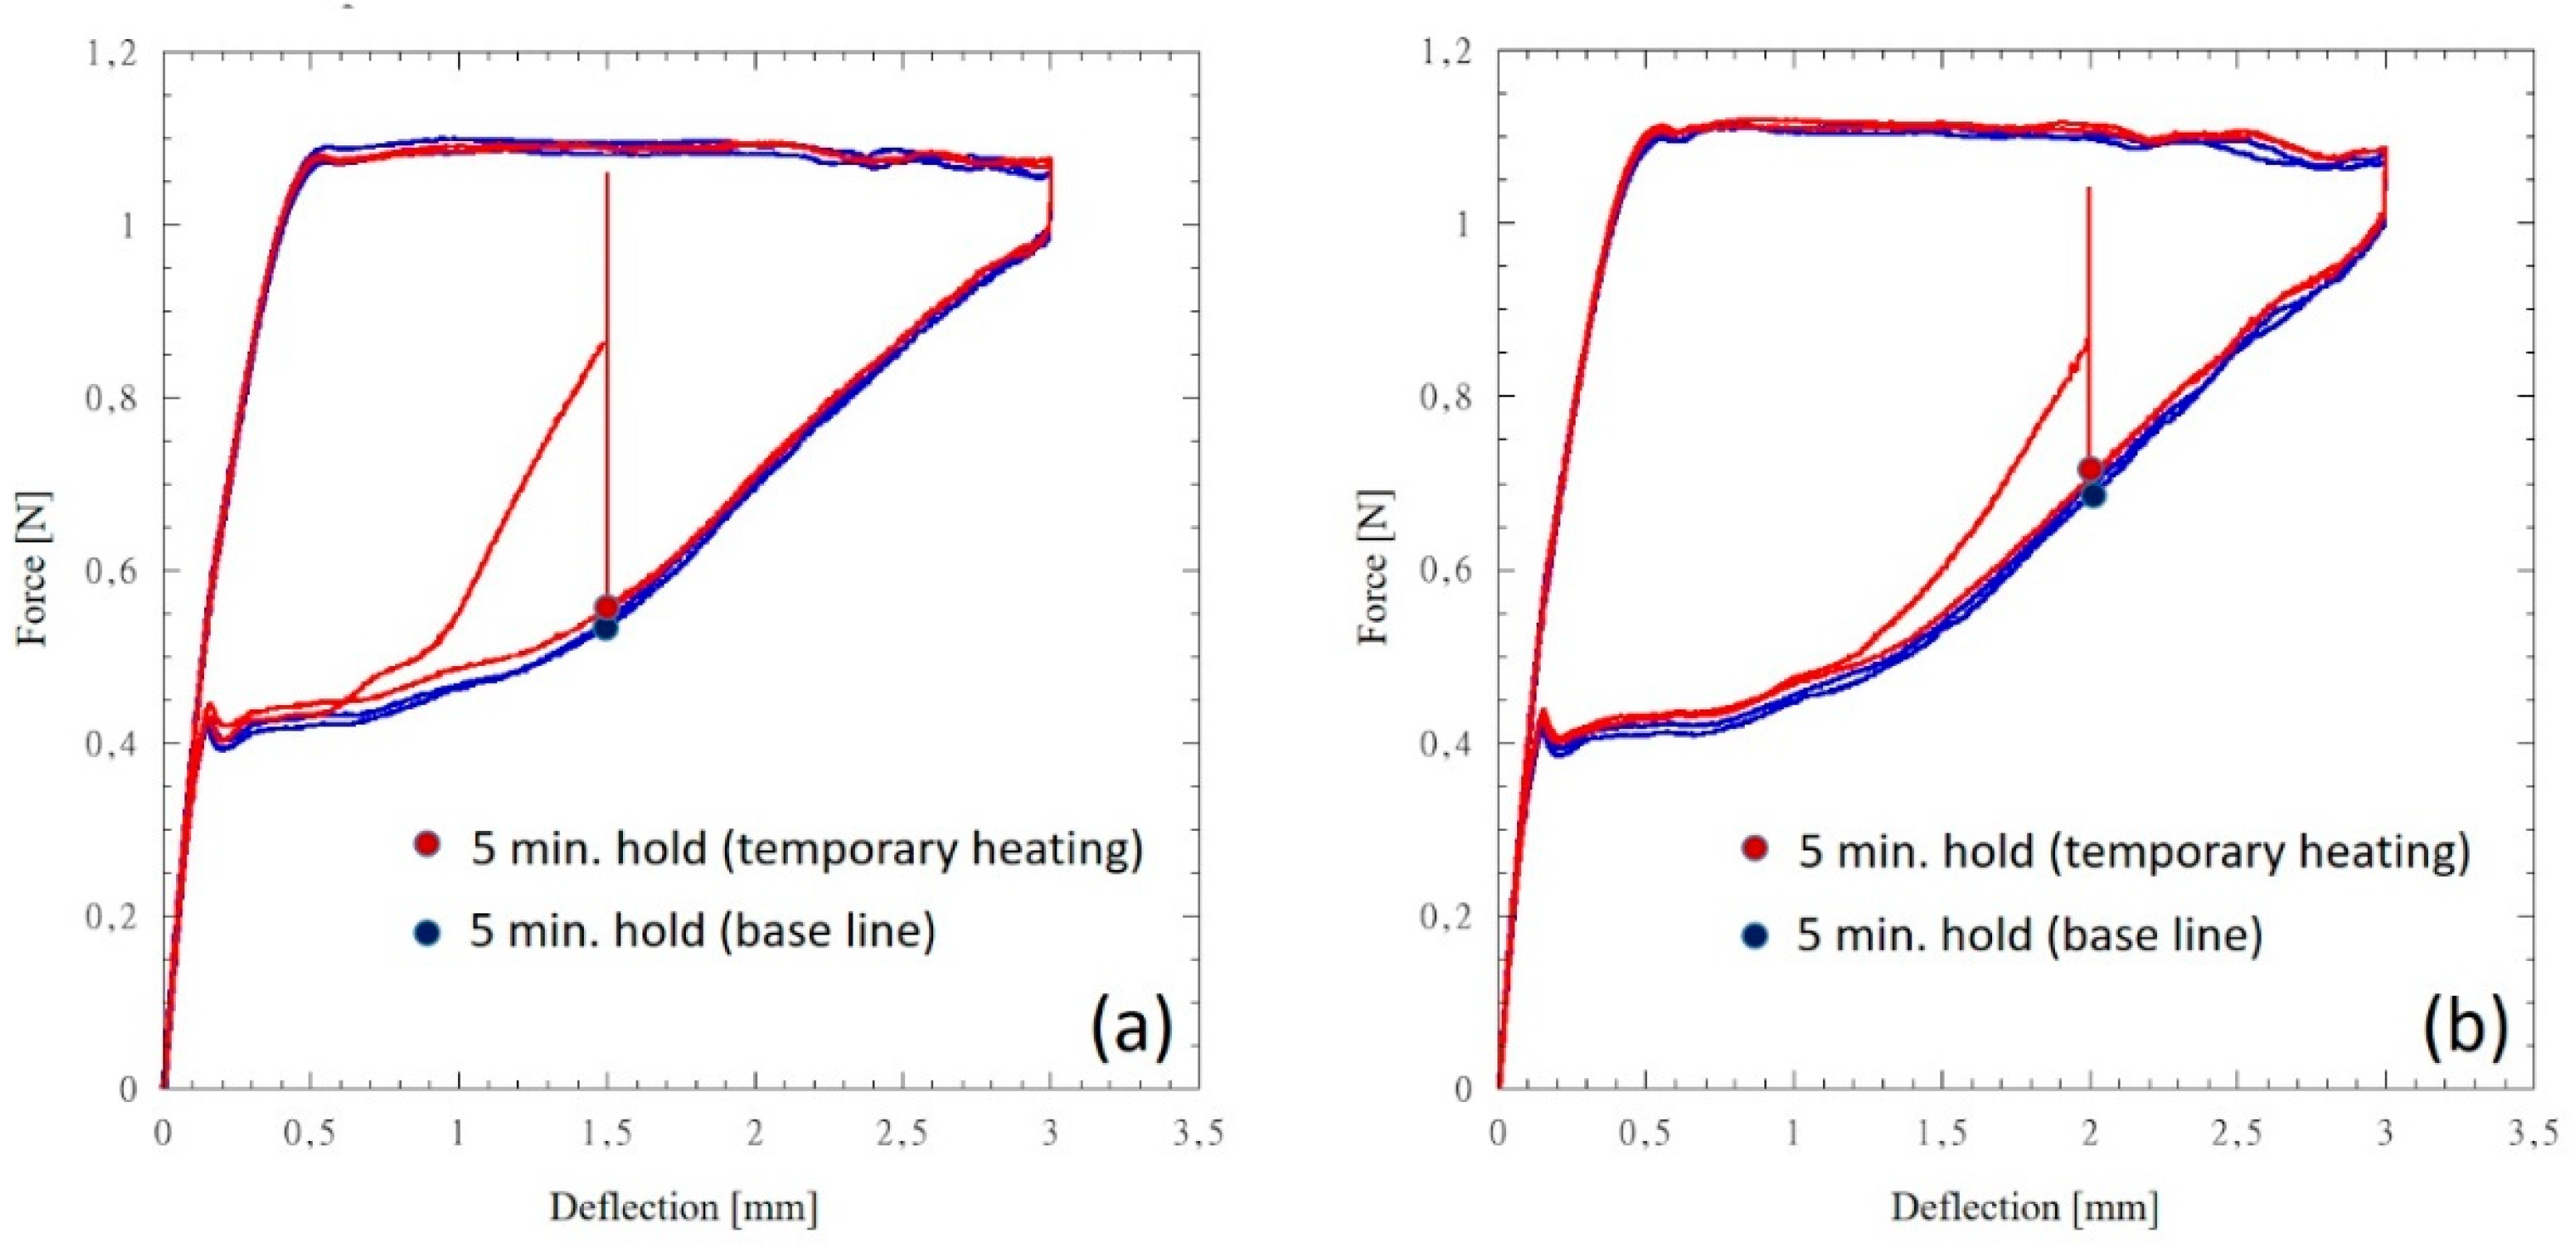
Figure 8.
Force vs time profiles of 0.016 round CuNiTi wires presenting an hold period of 5 min at a deflection level of (a) 2.0 mm and (b) 1.5 mm. For the baseline (blue curves) temperature is kept constant at 37°C. A temporary heating signal is introduced at the beginning of the hold period (red curves).
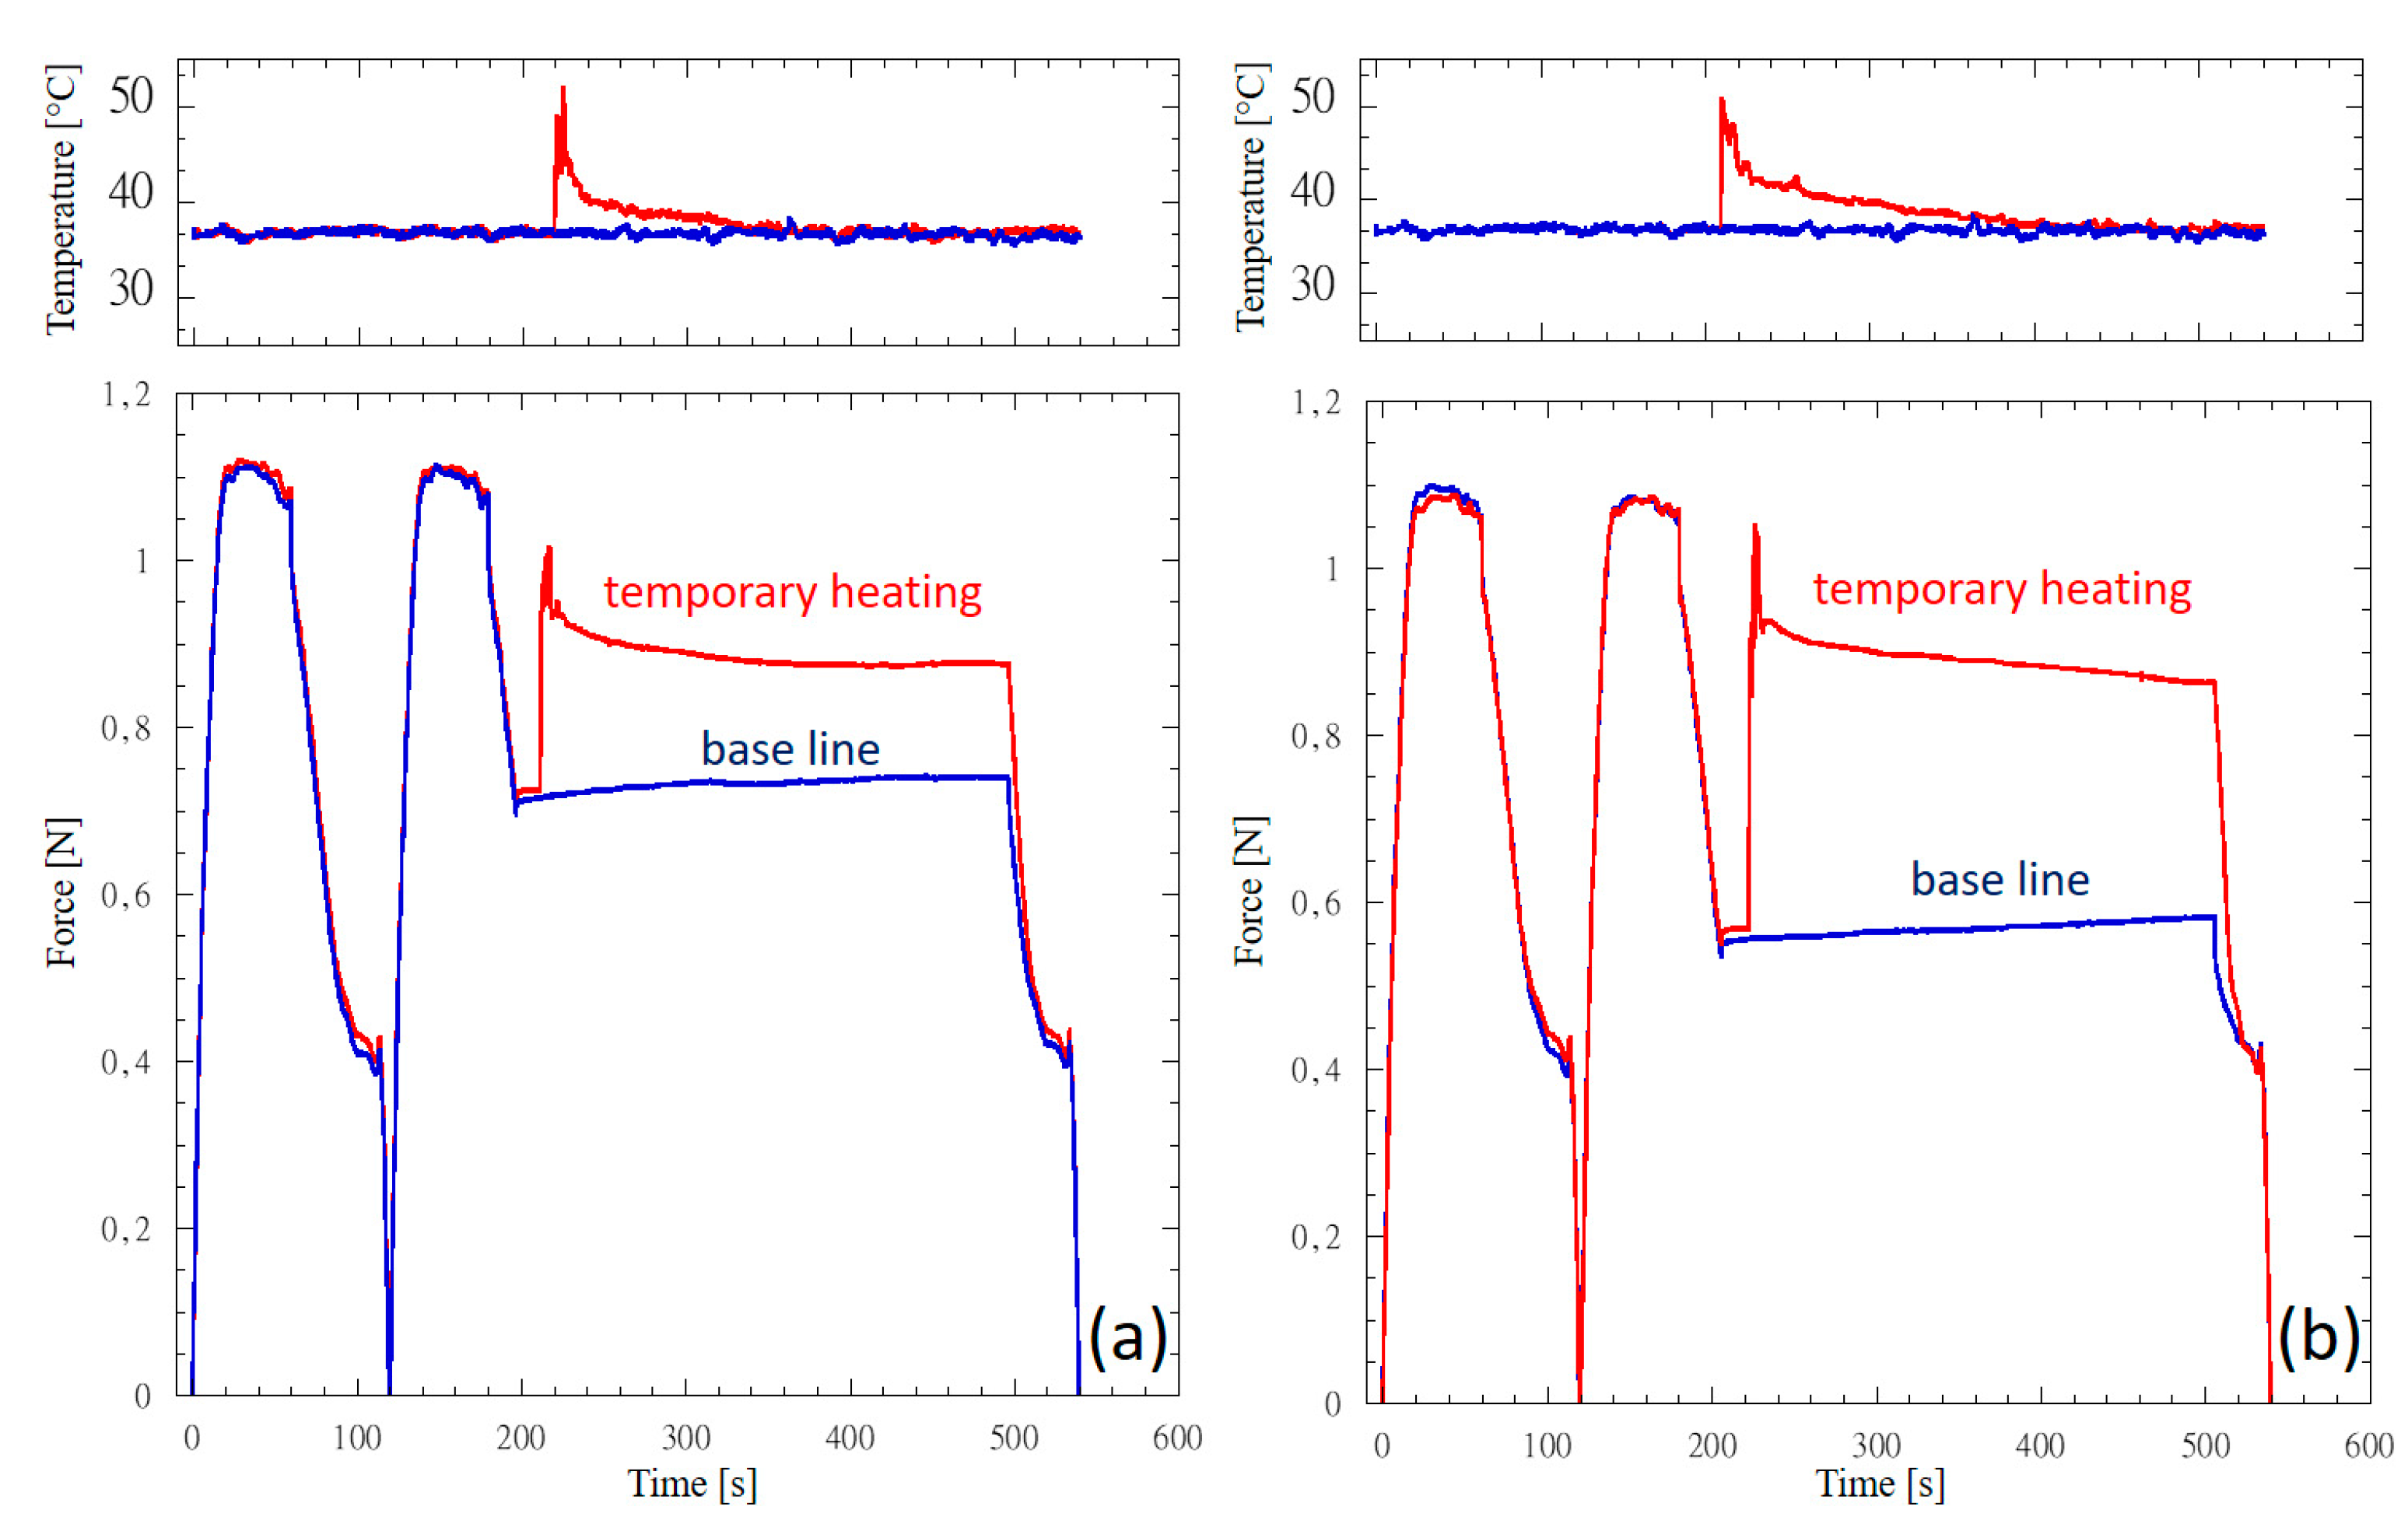
Figure 9.
Plateau occurring after the temporary heating at the end of the 5 min displacement hold step (red bars) and plateau occurring at 37°C (baseline) during the 5 min displacement hold step for (a) NiTi and (b) CuNiTi wires.
Figure 9.
Plateau occurring after the temporary heating at the end of the 5 min displacement hold step (red bars) and plateau occurring at 37°C (baseline) during the 5 min displacement hold step for (a) NiTi and (b) CuNiTi wires.

Figure 10.
linear regression of unloading plateau force measured for at least three different geometries by (a) Lombardo et al. [20] and loads measured by (b) Sabbagh et al. at a deflection of 2.0 mm [30] as a function of the second moment of area.
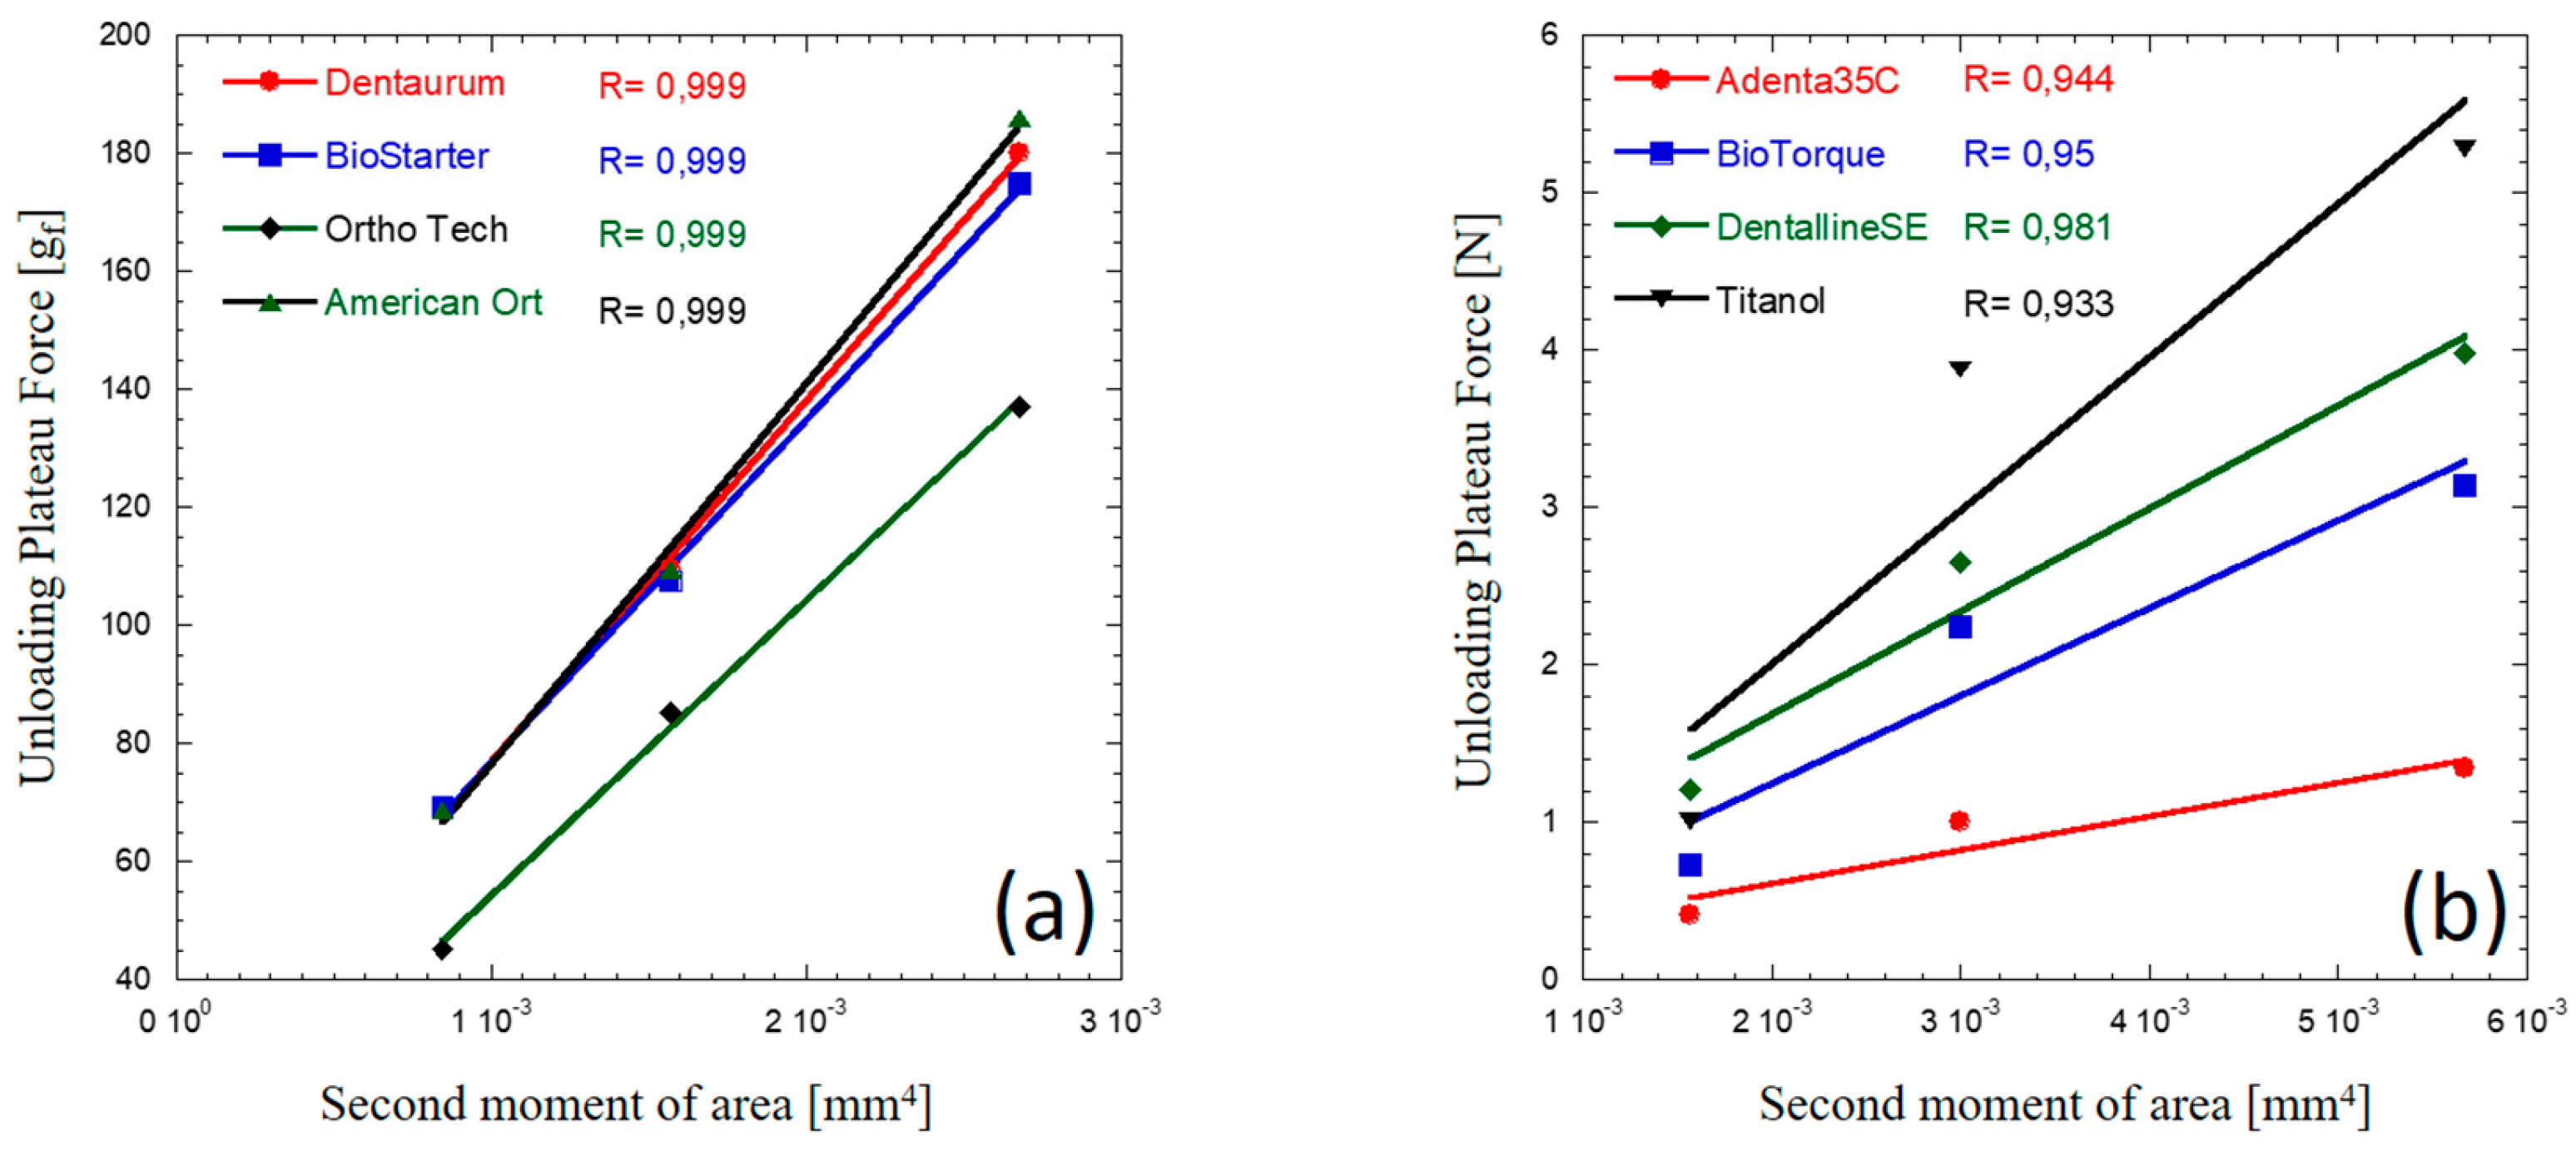
Table 1.
Investigated NiTi and CuNiTi wires and their geometrical properties.
| Alloy | Cross-section | Size [inches] |
φ [mm] or b x h [mm2] |
Second moment of area [10-3 mm4] | DL [mm] |
|---|---|---|---|---|---|
| NiTi | Round | .014 | 0.356 | 1.58 | 4.59 |
| NiTi | Round | .016 | 0.406 | 2.67 | 4.02 |
| NiTi | Rectangular | .014 x .025 | 0.356 x 0.635 | 7.60 | 2.57 |
| NiTi | Rectangular | .019 x .025 | 0.483 x 0.635 | 10.31 | 2.57 |
| NiTi | Rectangular | .025 x .014 | 0.635x 0.356 | 2.395 | 4.59 |
| NiTi | Rectangular | .025 x.019 | 0.635 x 0.483 | 5.96 | 3.38 |
| CuNiTi | Round | .014 | 0.356 | 1.58 | 4.59 |
| CuNiTi | Round | .016 | 0.406 | 2.67 | 4.02 |
| CuNiTi | Rectangular | .014 x .025 | 0.356 x 0.635 | 7.60 | 2.57 |
| CuNiTi | Rectangular | .019 x .025 | 0.483 x 0.635 | 10.31 | 2.57 |
| CuNiTi | Rectangular | .025 x .014 | 0.635x 0.356 | 2.395 | 4.59 |
| CuNiTi | Rectangular | .025 x.019 | 0.635 x 0.483 | 5.96 | 3.38 |
Table 3.
Two-way ANOVA results for NiTi and CuNiTi unloading plateau reported in Table 2.
Table 3.
Two-way ANOVA results for NiTi and CuNiTi unloading plateau reported in Table 2.
| DF | Sum of Squares | Mean Square | F Value | P Value | |
|---|---|---|---|---|---|
| Material | 1 | 1,81977 | 1,81977 | 1058,07025 | 0 |
| Geometry | 5 | 9,52858 | 1,90572 | 1108,04257 | 0 |
| Interaction | 5 | 0,15062 | 0,03012 | 17,51483 | 9,2189E-10 |
| Model | 11 | 11,87712 | 1,07974 | 627,79346 | 0 |
| Error | 47 | 0,08083 | 0,00172 | -- | -- |
| Corrected Total | 58 | 11,95795 | -- | -- | -- |
Table 4.
Overall two-way ANOVA results for NiTi and CuNiTi loads occurring before and after the temporary heating.
Table 4.
Overall two-way ANOVA results for NiTi and CuNiTi loads occurring before and after the temporary heating.
| NiTi | DF | Sum of Squares | Mean Square | F Value | P Value |
|---|---|---|---|---|---|
| Plateau level state | 1 | 0,676 | 0,676 | 589,10675 | 0 |
| Deflection | 3 | 0,04994 | 0,01665 | 14,5069 | 3,86598E-6 |
| Interaction | 3 | 0,03034 | 0,01011 | 8,81336 | 2,09903E-4 |
| Model | 7 | 0,75628 | 0,10804 | 94,15251 | 0 |
| Error | 32 | 0,03672 | 0,00115 | -- | -- |
| Corrected Total | 39 | 0,793 | -- | -- | -- |
| CuNiTi | DF | Sum of Squares | Mean Square | F Value | P Value |
| Plateau level state | 1 | 0,57432 | 0,57432 | 529,76776 | 0 |
| Deflection | 3 | 0,26428 | 0,08809 | 81,25809 | 4,66294E-15 |
| Interaction | 3 | 0,03861 | 0,01287 | 11,87211 | 2,17733E-5 |
| Model | 7 | 0,87721 | 0,12532 | 115,59405 | 0 |
| Error | 32 | 0,03469 | 0,00108 | -- | -- |
| Corrected Total | 39 | 0,9119 | -- | -- | -- |
Disclaimer/Publisher’s Note: The statements, opinions and data contained in all publications are solely those of the individual author(s) and contributor(s) and not of MDPI and/or the editor(s). MDPI and/or the editor(s) disclaim responsibility for any injury to people or property resulting from any ideas, methods, instructions or products referred to in the content. |
© 2024 by the authors. Licensee MDPI, Basel, Switzerland. This article is an open access article distributed under the terms and conditions of the Creative Commons Attribution (CC BY) license (http://creativecommons.org/licenses/by/4.0/).
Copyright: This open access article is published under a Creative Commons CC BY 4.0 license, which permit the free download, distribution, and reuse, provided that the author and preprint are cited in any reuse.


