
Submitted:
13 July 2024
Posted:
15 July 2024
You are already at the latest version
Abstract
Research on White Etching Cracks (WEC) apparent in multiple bearing applications has identified various drivers to cause them. Lubricants, Electricity combined with contact mechanics are proven to catalyze WEC significantly. However, none of them is solely causing WEC by its own, instead combinations discretize whether WEC appears or not. Hence, the WEC topic appears to be multidimensional, making WEC still unpredictable. The current paper is about a systematic study by the use of a DGBB test rig on how lubricant chemicals combined with electricity and by varying oil flow and pressure lead to WEC. It becomes evident, that even WEC critical conditions turn to be WEC free by simply increasing the oil flow and decrease the contact pressure.
Keywords:
white etching cracks (WEC)
; lubrication
; electricity
; DGBB test rig
1. Introduction
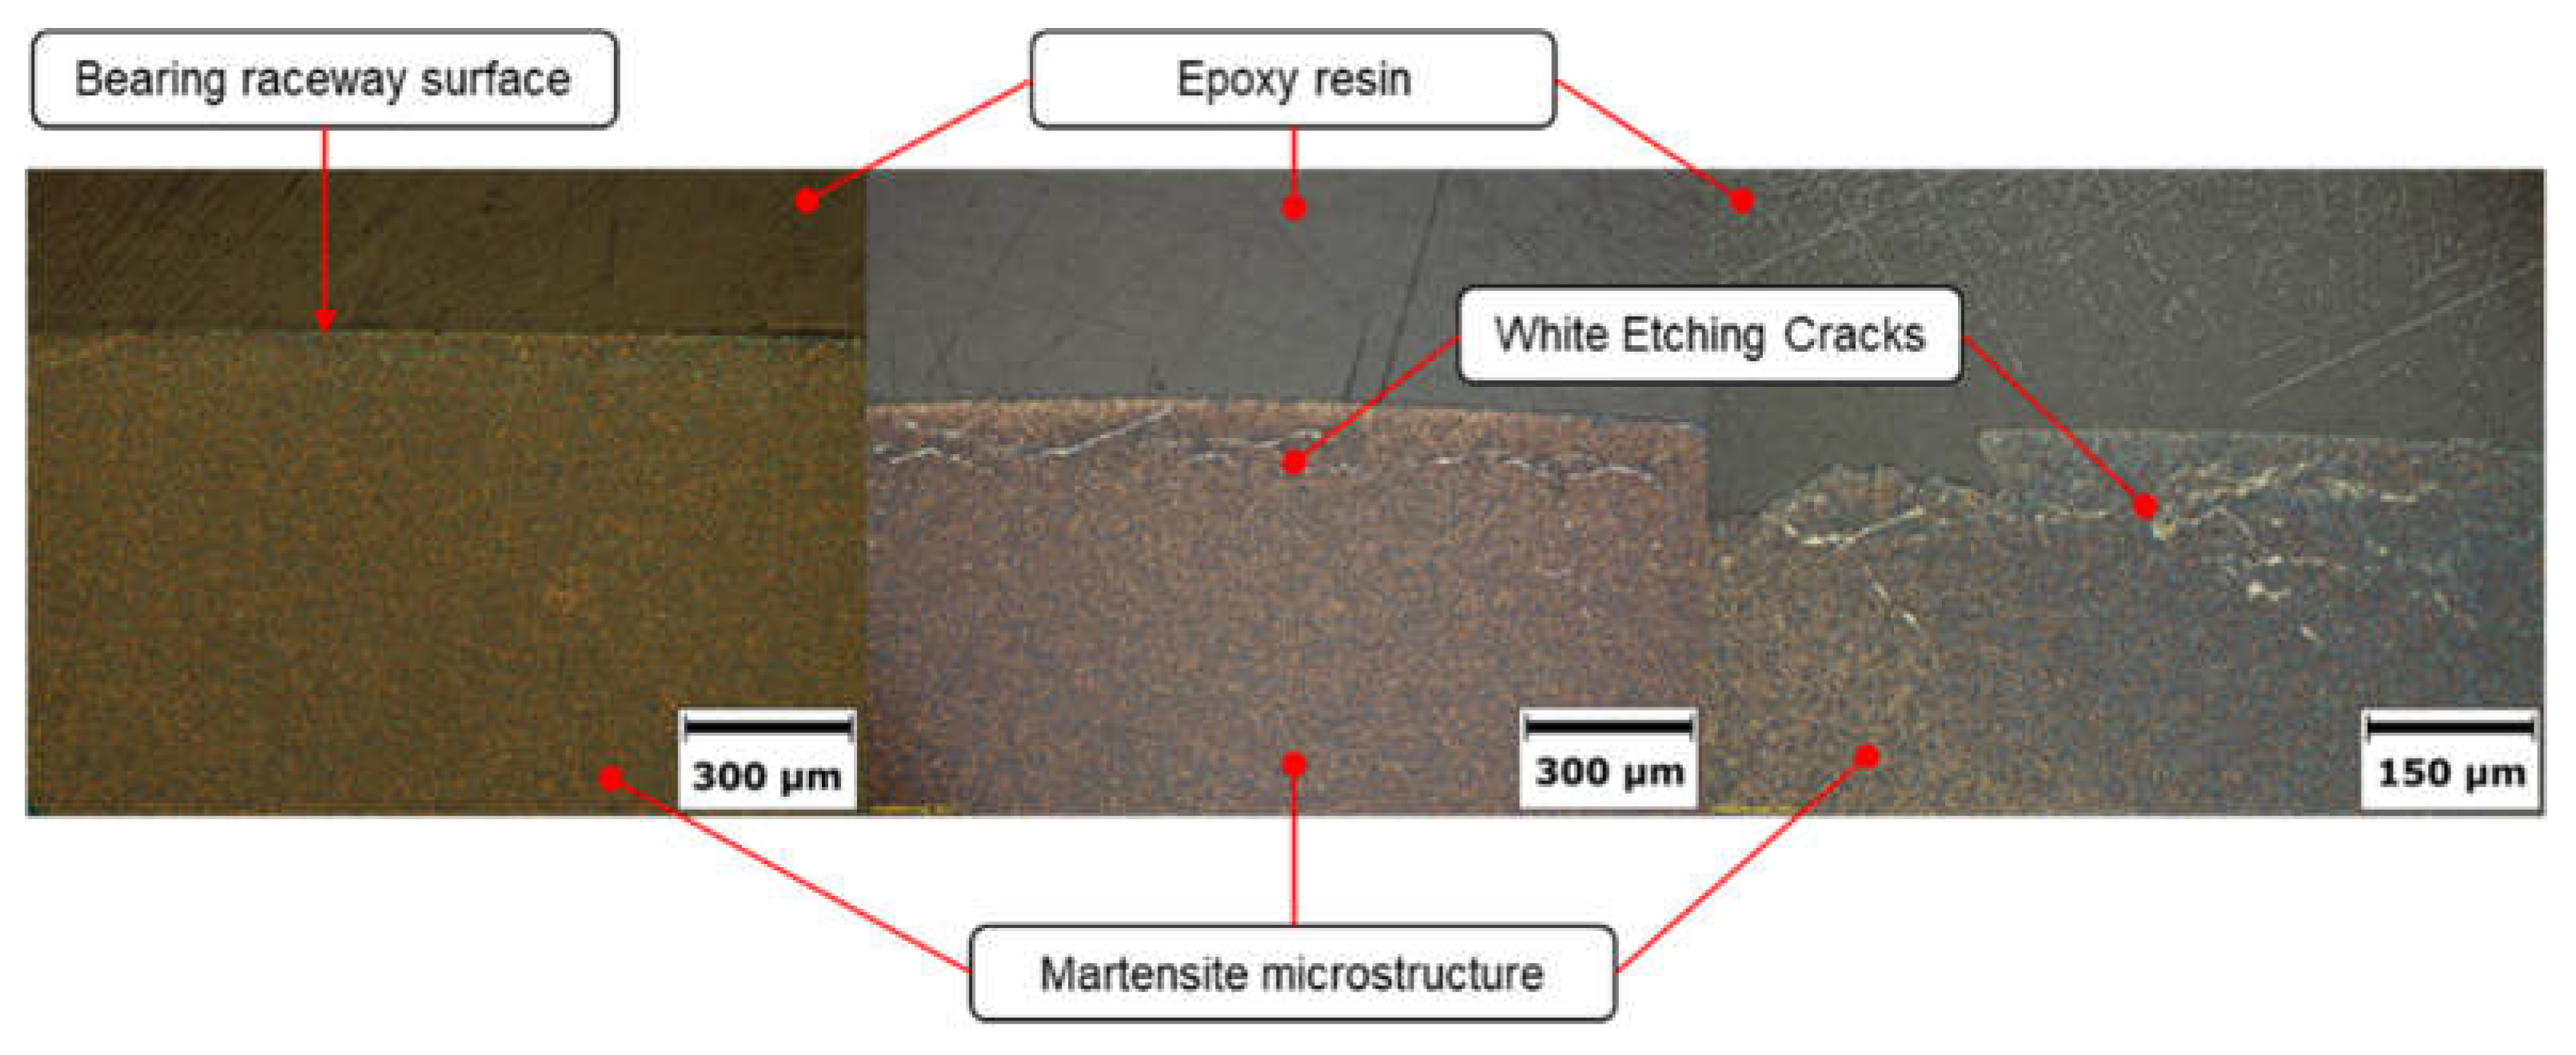
White Etching Crack (WEC) failures are on a long way through history until now. The name White Etching Crack originates from its appearance apparent in the subsurface of a steel exposed to specific mechanical loading. After a metallographic preparation, WEC appear as white decorated flanks adjacent to crack networks after contrast etching with Nital (3% Nitric Acid in ethanol) and examined with a light microscope (see Figure 1).
As much as this topic has attracted researches worldwide, until today a concise understanding is still missing. Even before the WEC topic came into the global attention, it is reasonable to assume that it was always present in the past as a hidden phenomenon. The history of WEC makes it difficult to record, how the perception of traditional wear changed in a way to realize, that WEC is a separate topic in material degradation [1]. A first observation of “White Etching” was reported in 1966 [2]. After a long period of silence, a serie of activities started in the early 1980-90’s. However, at that time researchers were not aware of white etching cracks as a specific topic. All the studies before were focusing on material and surface material breakdown with respect to the mechanical load under boundary lubrication (see for example [3]). Nevertheless, a very detailed study of the material response versus different scenarios of load, e.g. contact pressure, tangential slip, could show, that subsurface crack networks appear as a consequence of load and slip, however not decorated by white matter [4]. Until that research was finished, WEC was not realized as a specific failure. The change in perception of WEC began in the midth of the 90’s last century by the steep increase in wind power installation, especially the generator bearings, later the planetary stage and main bearings. WEC came up at the same time as a wave of field returns from the components life cycle in automotive applications namely in the belt tensioner and generator bearings, but also wheel bearings. As the failures started to last more and more upon industry, slowly the perception of WEC as a separate topic, else than what is known in material science, came up. However, the tendency to treat WEC in a classical sense by contact mechanics was still very strong. Numerous trials were made to bring the phenomenon down to parameter test rigs, especially those, reflecting the dimensions used in reality. First successes came up when bearings under rolling contact conditions were brought to WEC failures as reported by [5]. Years after [4] a concise report was published by Manieri, Stadler, Morales-Espejel and Kadiric treating the topic on how materials, exposed to mechanical impact, are subjected to WEC [6]. A numerical approach was published by [7,8,9] gave a broad overview about the status of WEC research related to Wind Turbine Gearboxes. The connection between WEC and an electrification of bearings due to electrical stray currents is also repeatedly found in literature as in [10,11,12]. Lubricants, with or without being connected to electricity and contact mechanics are reported extensively as f. e. in [13,14,15].
This paper is about the influence of a set of lubricants with respect to the formation of White Etching Cracks in combination with electricity, varying the contact pressure and the oil volume flow by use of a DGBB test rig, extending a study that has been published earlier by the authors (see [16,17]). The paper is structured as follows: Section 2 is presenting the experimental setup comprising the test rig with all relevant parameters. Section 3 presents the major results. Section 4 is about the interpretation and the discussion of the results.
2. Materials and Methods
Figure 3 shows the test rig components schematically.
The shaft is connected via a magnetic coupling to an electric servomotor type AM3052 (Beckhoff Automation GmbH) which can be accelerated up to 5500 rpm. The mounted bearings are inside the bearing block within the pressure chamber (see Figure 2).
An circulation is used to supply the bearings with oil. From the oil inlet the lubricant is evenly distributed between both bearings. After leaving the bearing block through the oil outlet, the oil is collected in the oil sump. A 60 µm and a 10 µm filter are installed in the lubrication circuit to a avoid particles, harming the bearings. Under operation, a micro gear pump type mzr-6355 (HNP Mikrosysteme GmbH, Schwerin) is transporting the lubricant back to the oil inlet. A volume flow up to 144 ml min-1 is possible. A mass flow meter type SITRANS F C MASS 2100 1.5 (Siemens AG, München) is installed in the lubrication circuit to monitor the volume flow.
The two ball test bearings, type FAG 6203-C C3 are mounted on a shaft within the pressure chamber. It is possible to apply pressures up to 5 bar and to visualize the bearing under operation throughout a Viewing Window by a High Speed Camera.
Both test bearings are placed inside plastic cups to electrically isolate them from the bearing block. Holes in the cups and housing are available for temperature sensors and electrodes to record the temperature and to apply an electric current (see Figure 4).
Figure 5 schematically presents the electrical setup, used for the electrification of the bearings. Current of up to 15 V can be applied by a DC power supply. The circuit is connected in such a way, that the positive pole is attached to the motor-side bearing and the negative pole to the front-end bearing. As a result, when voltage is applied and a lubricating film is present, the outer ring of the front ball bearing is the cathode and the inner ring is the anode. At the motor-side bearing, the situation is opposite.
The resistor R is used to adjust the current in the system. The electrical load on the bearings is established by electrodes attached to the outer rings of the bearings. The electrical circuit between the inner rings of the bearings is closed by the shaft. The voltage is measured parallel to the resistance and the bearings. In this way, the current in the system can be calculated. In addition, an oscilloscope is connected parallel to the shaft, in order to detect electrical discharges. A 75 kΩ resistor is installed to keep the current below 0,2 mA to protect the bearings from damage caused by the passage of high currents.
Electrification is carried out as a characteristic voltage curve similar to what is already reported by [14]: during 200 seconds, the voltage at the DC power supply (black) was increased in small increments and the voltage drop upon the two ball bearings (red) was measured. In addition, records from the oscilloscope are shown during the recording of the characteristic voltage curve (see Figure 6)
The curve implies that the manually increased voltage at the DC power supply rises more steeply compared to the voltage at the test bearing. The difference between the two curves is due to the voltage drop across the installed 75 kΩ resistor.
After 160 seconds at a voltage of 11.5 V at the DC power supply, the voltage at the bearing shows a different progression than the DC power supply voltage, which continuously is increased step by step. From this point onwards, electrical discharges occur in the bearings since the insulating effect of the lubricant in the lubrication gap is no longer sufficient.
At the beginning, only a few discharges are observed. However, due to the high voltages in this area, the energy of the breakdowns is high. With increasing voltage at the power supply, the number of discharges increase significantly. At the same time, the voltage amplitudes of the breakdowns and hence the energy of the discharges decrease. Therefore, a total of four different voltage-dependent areas can be defined during the electrification. In the so called Ohmic region, the voltage increases linearly without any discharges. In the second section, incidental breakdowns appear and the amplitude of the discharges are reaching a maximum. In the third phase, the frequency of the breakdowns increases, but the amplitude decreases until, in the fourth phase, the amplitude reaches a minimum and the discharge frequency reaches a maximum.
For all tests the voltage was always set to 15 V in order to have discharges during the experiments. These electrical discharges can be observed “in-situ” by the oscilloscope. The discharges are also visible in the voltage recording of the test rig being installed parallel to the roller bearings in the electrical circuit. Although the recording rate is only 1 Hz, the discharges are visible in the recording, even though the breakdown frequency is far higher. It is not possible to observe the individual discharges precisely with the low sampling rate, but it is possible to assign the discharge areas from the voltage measured parallel to the bearing setup (see Figure 7).
After the running-in time of 2.3 h, the voltage at the DC power supply was set to 15 V. Immediately, high frequency electrical discharges were visible at the oscilloscope. The electrical discharge condition appeared to be constant, but started to change after 3.5 h running time. The discharge frequency decreased, and the discharge amplitude increased. This means, that the system is moving to the Ohmic area, presented in Figure 6. After a running time of 5 h, the electrical test condition stabilized and only a few discharges were visible at the oscilloscope. This is also visible in the voltage apparent at the bearing (see Figure 7). The bearing voltage stabilized at a value of approximately 11 V. This increased voltage drop at the bearing setup means that the electrical resistance of the bearing setup has increased. After a running time of 8 h, the electrical systems changed back to high frequency discharges until at a running time of 10 h the discharge frequency decreased. Just before the test run was terminated, the electrical discharge frequency increased again due to the spalling at the bearing.
The change in the frequency of the discharges and the fluctuation in the voltage shows that the electrical resistance at the bearings change several times during operation.
The resistance at the bearing setup can be calculated using Ohm’s law with the premise that the current in the system is the same at the resistor and at the bearing setup. The fixed 75 kΩ resistor is multiplied by the voltage , measured at the bearing setup, and divided by the measured voltage at the resistor
The resulting resistance is smoothened, to see better the course of the resistance. The whole procedure is presented in Figure 8.
The lubricants being used are listed below:
| ZnDTP | Zinc-2-ethylhexyldithiophospate, commercial Antiwear/Extreme Pressure Additive | 2 % p.w. |
| PMMA | Polymethylmethacrylate, commercial as Viscosity Index Improver | 5% p.w. |
| BoAE | Boronic Acid Ester, commercial as Antiwear/Extreme Pressure Additive | 2 % p.w |
| DCHA | Dicyclohexylamine as Vapour Based Anti Corrosion Additive | 2% p.w. |
| PAO | Poly-alpha-Olefine ISO VG 46, commercial Baseoil | ad to 100% p.w. |
Blendings
- ZnDTP + PMMA
- ZnDTP
- PMMA
- PAO
- ZnDTP + DCHA
- ZnDTP + BoAE
To examine bearing damages and structural changes, it is important to carry out a metallographic preparation. By analysing the raceway surfaces and the structure, conclusions can then be drawn about the impact of the mechanical load and other factors. The work steps performed are shown in Figure 9:
After the bearing has been removed from the bearing test rig, it is cleaned and the cage is removed. This first step leaves only the balls, the inner ring and outer ring. After halving the rings, the parts can be examined and photographed using a stereo microscope. This step allows to search for pitting, fluting and other surface defects on the raceways of the balls and the rings. Next, a shoulder is cut off from the halved rings. The resulting half rings and balls are embedded in epoxy resin in a way through which the structure under the raceway can be viewed. Since structural changes can occur at different depths in the structure, the raceway is removed layer by layer at 100 µm intervals by grinding and polishing. To analyse the structure, each layer is grounded, polished and etched with 3% alcoholic nitric acid (Nital). A sample treated in this way can then be viewed under a light microscope. With the bearing raceway being approximately 1 mm wide, this procedure was repeated at least 10 time for each bearing being tested.
Figure 10 shows three pictures of bearing raceways at different states. The left picture was taken from a new bearing. The middle picture was taken after a test run without a bearing failure. In this picture, the raceway is not in the centre. It is rather shifted to one side. The axial preload force is responsible for this shift. If the bearing would be loaded in radial direction, the raceway would be in the centre. The right picture presents a bearing surface after a bearing failure caused by WEC.
Figure 11 presents one picture without a structure anomaly (left) and two pictures with WEC (middle without - and right - with spalling).
3. Results
The following Section presents test rig results under electrical impact (see Figure 6 and Figure 7): Tests 1 – 5 are keeping contact pressure, oil flow and speed constant while varying chemistry with WEC –yes/no as the outcome. Test 6 as an increased oil volume flow, while keeping speed, axial load and Chemistry known to end up in WEC. Tests 7 and 8 represent the results by reducing the load at a low oil volume, constant speed and pressure by use of the low reference oil. Test 9 shows the results, that appear by varying the oil flow from low to high at constant speed, high axial force and low reference oil The constant tests were accompanied by recording the temperature (see Figure 4) as well as the resistance at the bearing (see Figure 5 and Figure 6). The maximum axial load is set to 1800 N equal to 3781 MPa for the inner ring and 3109 MPa for the outer ring. For the bearing lifetime, calculation formula
is used, with Lna as the modified life, a1, a2 and a3 as parameters related to lifetime probability (a1), a2 and a3 to material and lubrication. L10 is calculated according to ISO 281 as probability of 90% of the population to survive (with Cr as the dynamic load capacity, P as the contact pressure and p10 as the exponent related to the contact (as 10 for point contact).
The adjustment to the nominal hours is given by
with n as the rotational speed in min-1. The result is the extended modified lifetime Lnm, which equals to 380 hours As a steel AISI 52100 martensitic heat treated, roughness 0.0223 µm for the inner ring, 0.0325 µm for the outer ring and 0.0094 µm for the balls, Youngs modulus 210 GPa, Poisson number 0.3, retained austenite 10-12%. The typical film height is calculated to 2.23 µm, minimum 0.1 µm indicating a full film lubrication regime.
The high reference runs were switched off after a running time of at least 160 h. The time to stop differ because the shutdown was done manually. A minimum runtime of 160 h was chosen because this is approximately 10 times the runtime of the Low Reference run (PAO + ZnDTP + PMMA) and it can be assumed that after this time no more WECs would not have occurred even not proven.
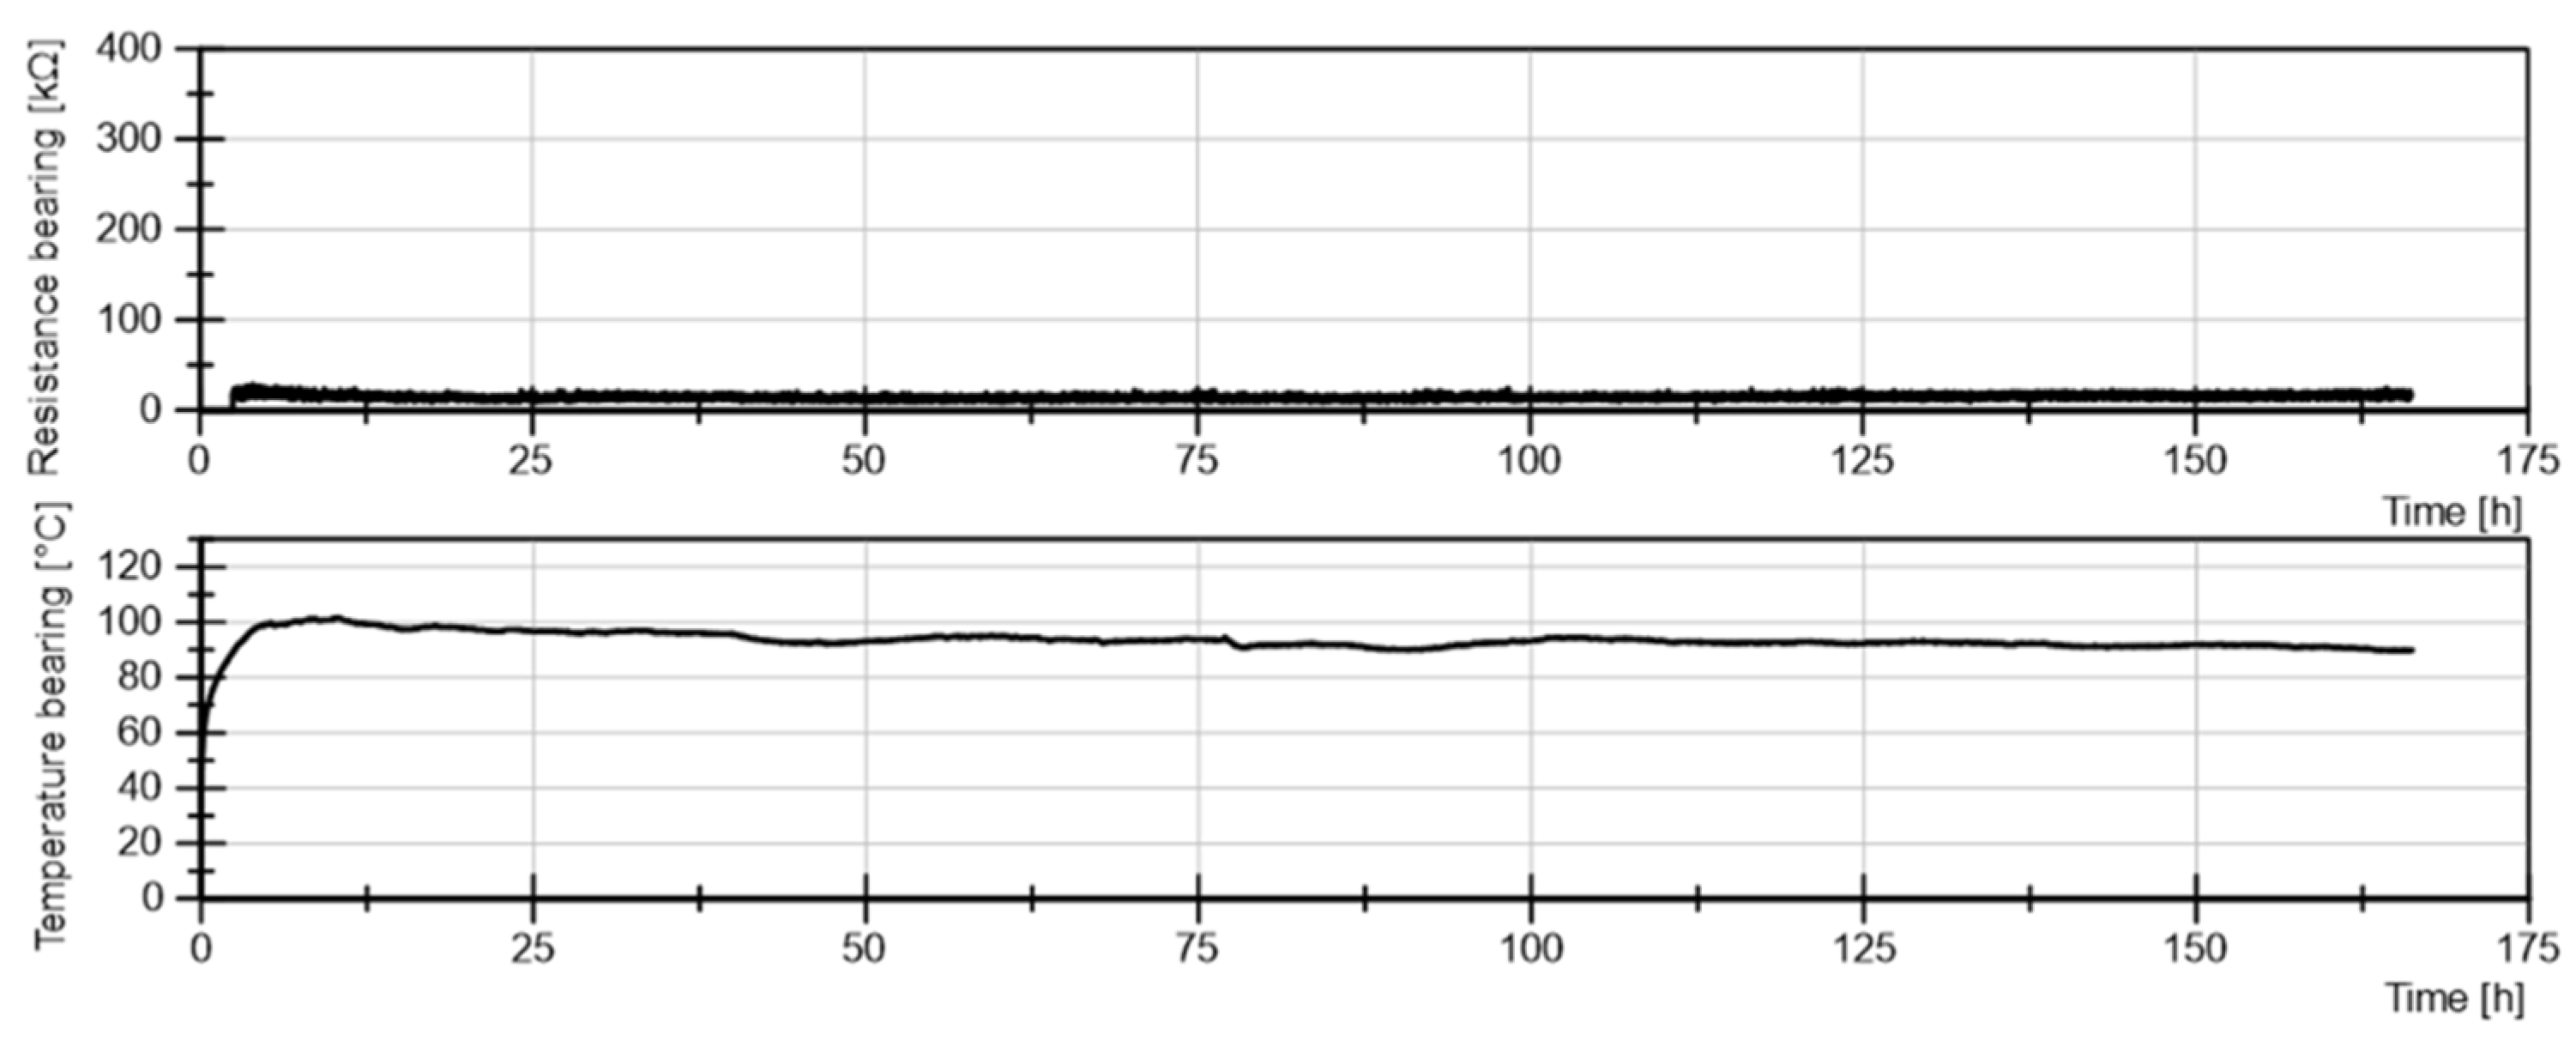
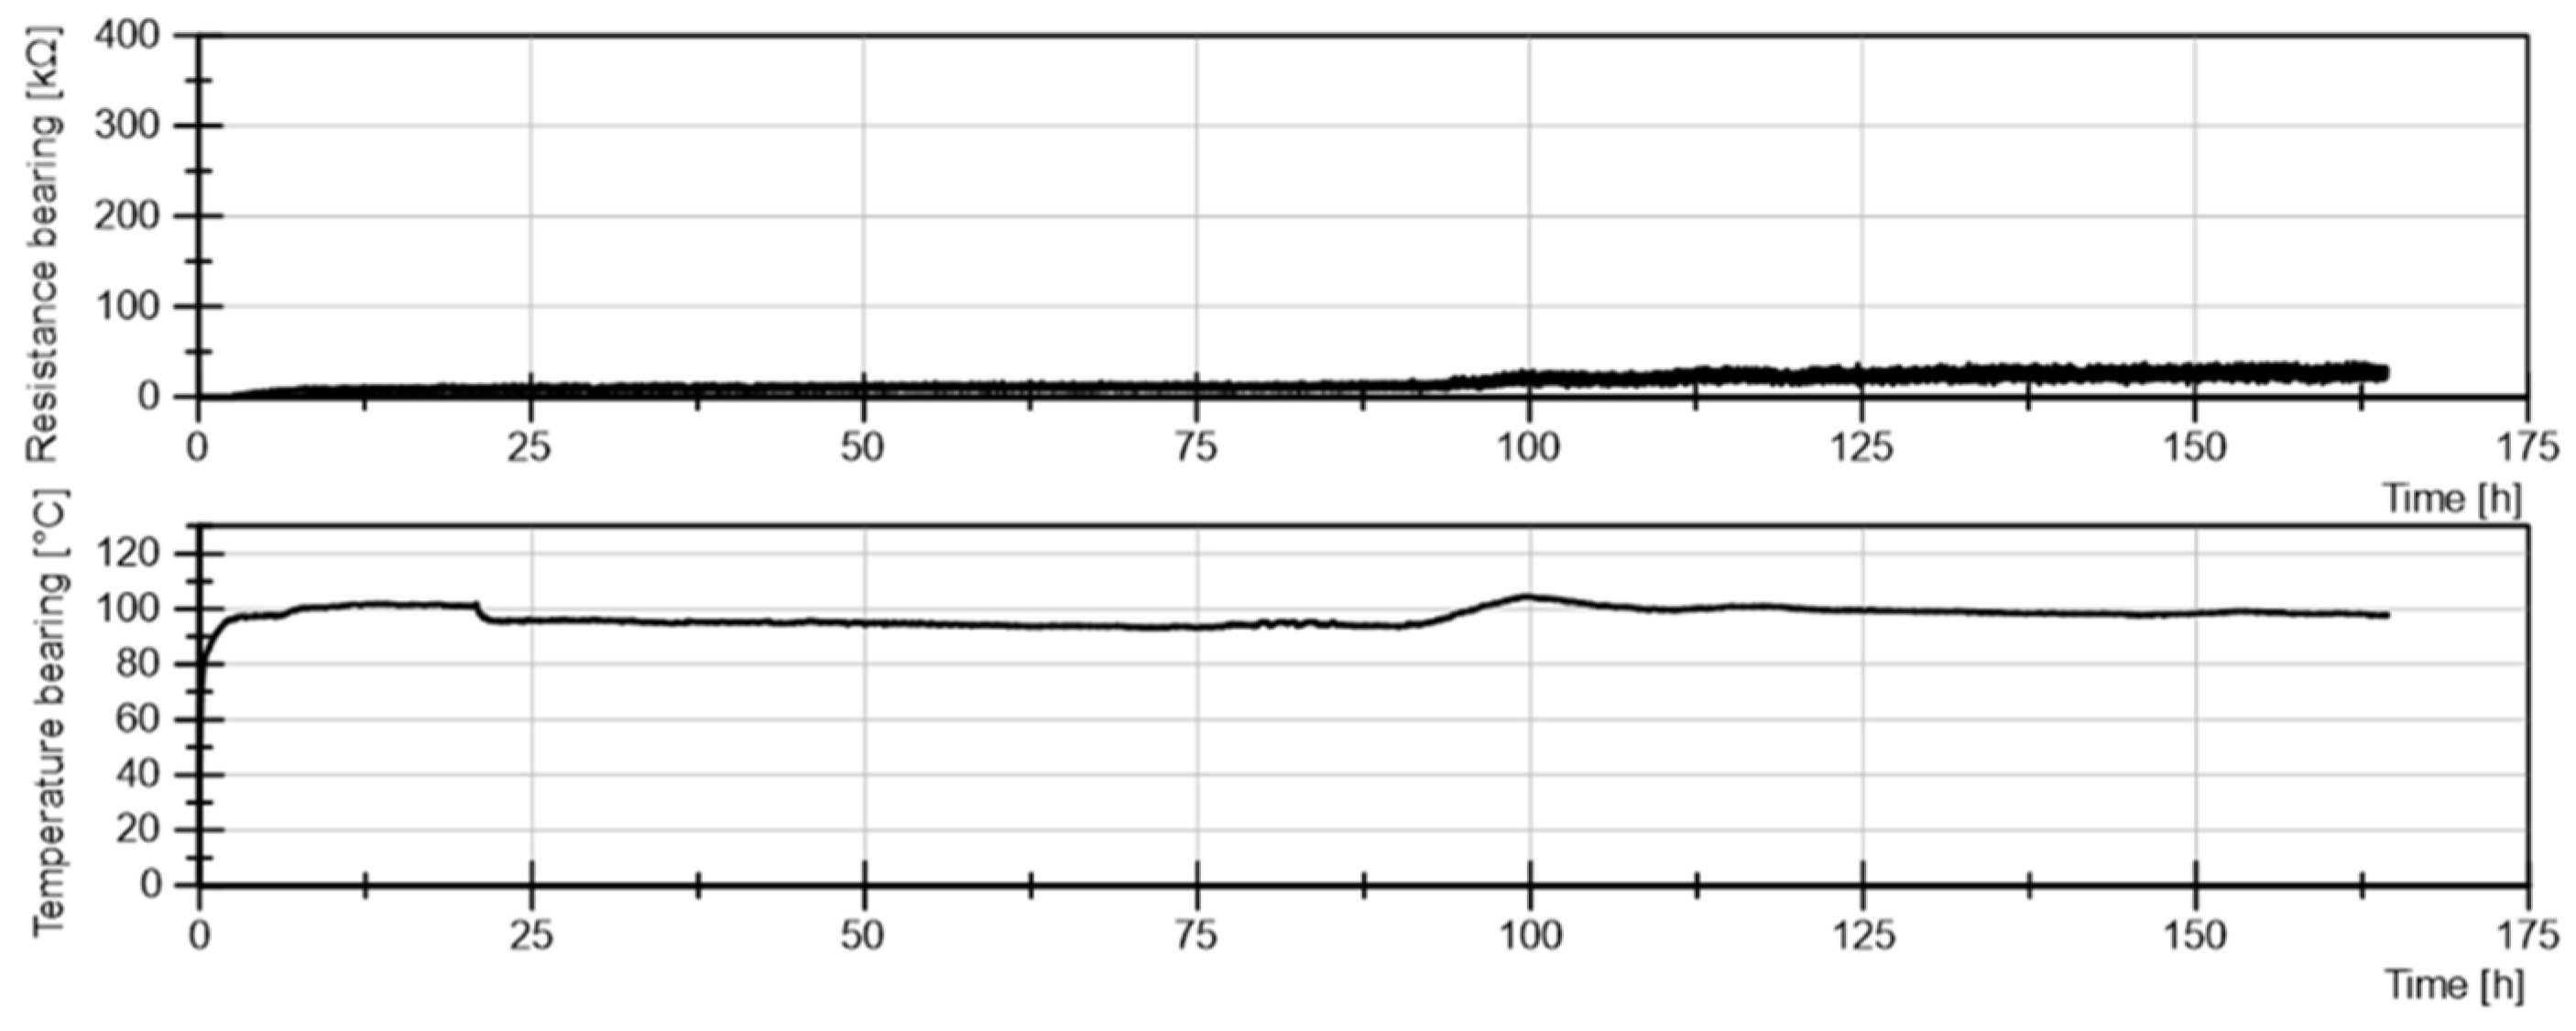
Test 1: Result: no WEC
Axial Load 1800N, 4500 rpm, 4ml /minute
Lubricant: Poly-〈-olefine (viscosity at 40°C 48 mm2/s)
Figure 12.
Test 1: Result for PAO (pure Baseoil) with the temperature graph and the resistance at the bearing.
Figure 12.
Test 1: Result for PAO (pure Baseoil) with the temperature graph and the resistance at the bearing.
Test 2: Result: no WEC
Axial Load 1800N, 4500 rpm, 4ml /minute
Lubricant: Poly-〈-olefine (viscosity at 40°C 48 mm2/s, 95 % per weight ) and PMMA (5% per weight)
Figure 13.
Test 2: Result for PAO (Baseoil) and PMMA as viscosity Index improver with the temperature graph and the resistance at the bearing.
Figure 13.
Test 2: Result for PAO (Baseoil) and PMMA as viscosity Index improver with the temperature graph and the resistance at the bearing.
Test3: Result: WEC
Axial Load 1800N, 4500 rpm, 4ml /minute
Lubricant: Poly-〈-olefine (viscosity at 40°C 48 mm2/s, 98 % per weight ) and ZnDTP (2% per weight)
Figure 14.
Test 3: Result for PAO (Baseoil) and ZnDTP as Anti-Wear Additive with the temperature graph and the resistance at the bearing.
Figure 14.
Test 3: Result for PAO (Baseoil) and ZnDTP as Anti-Wear Additive with the temperature graph and the resistance at the bearing.
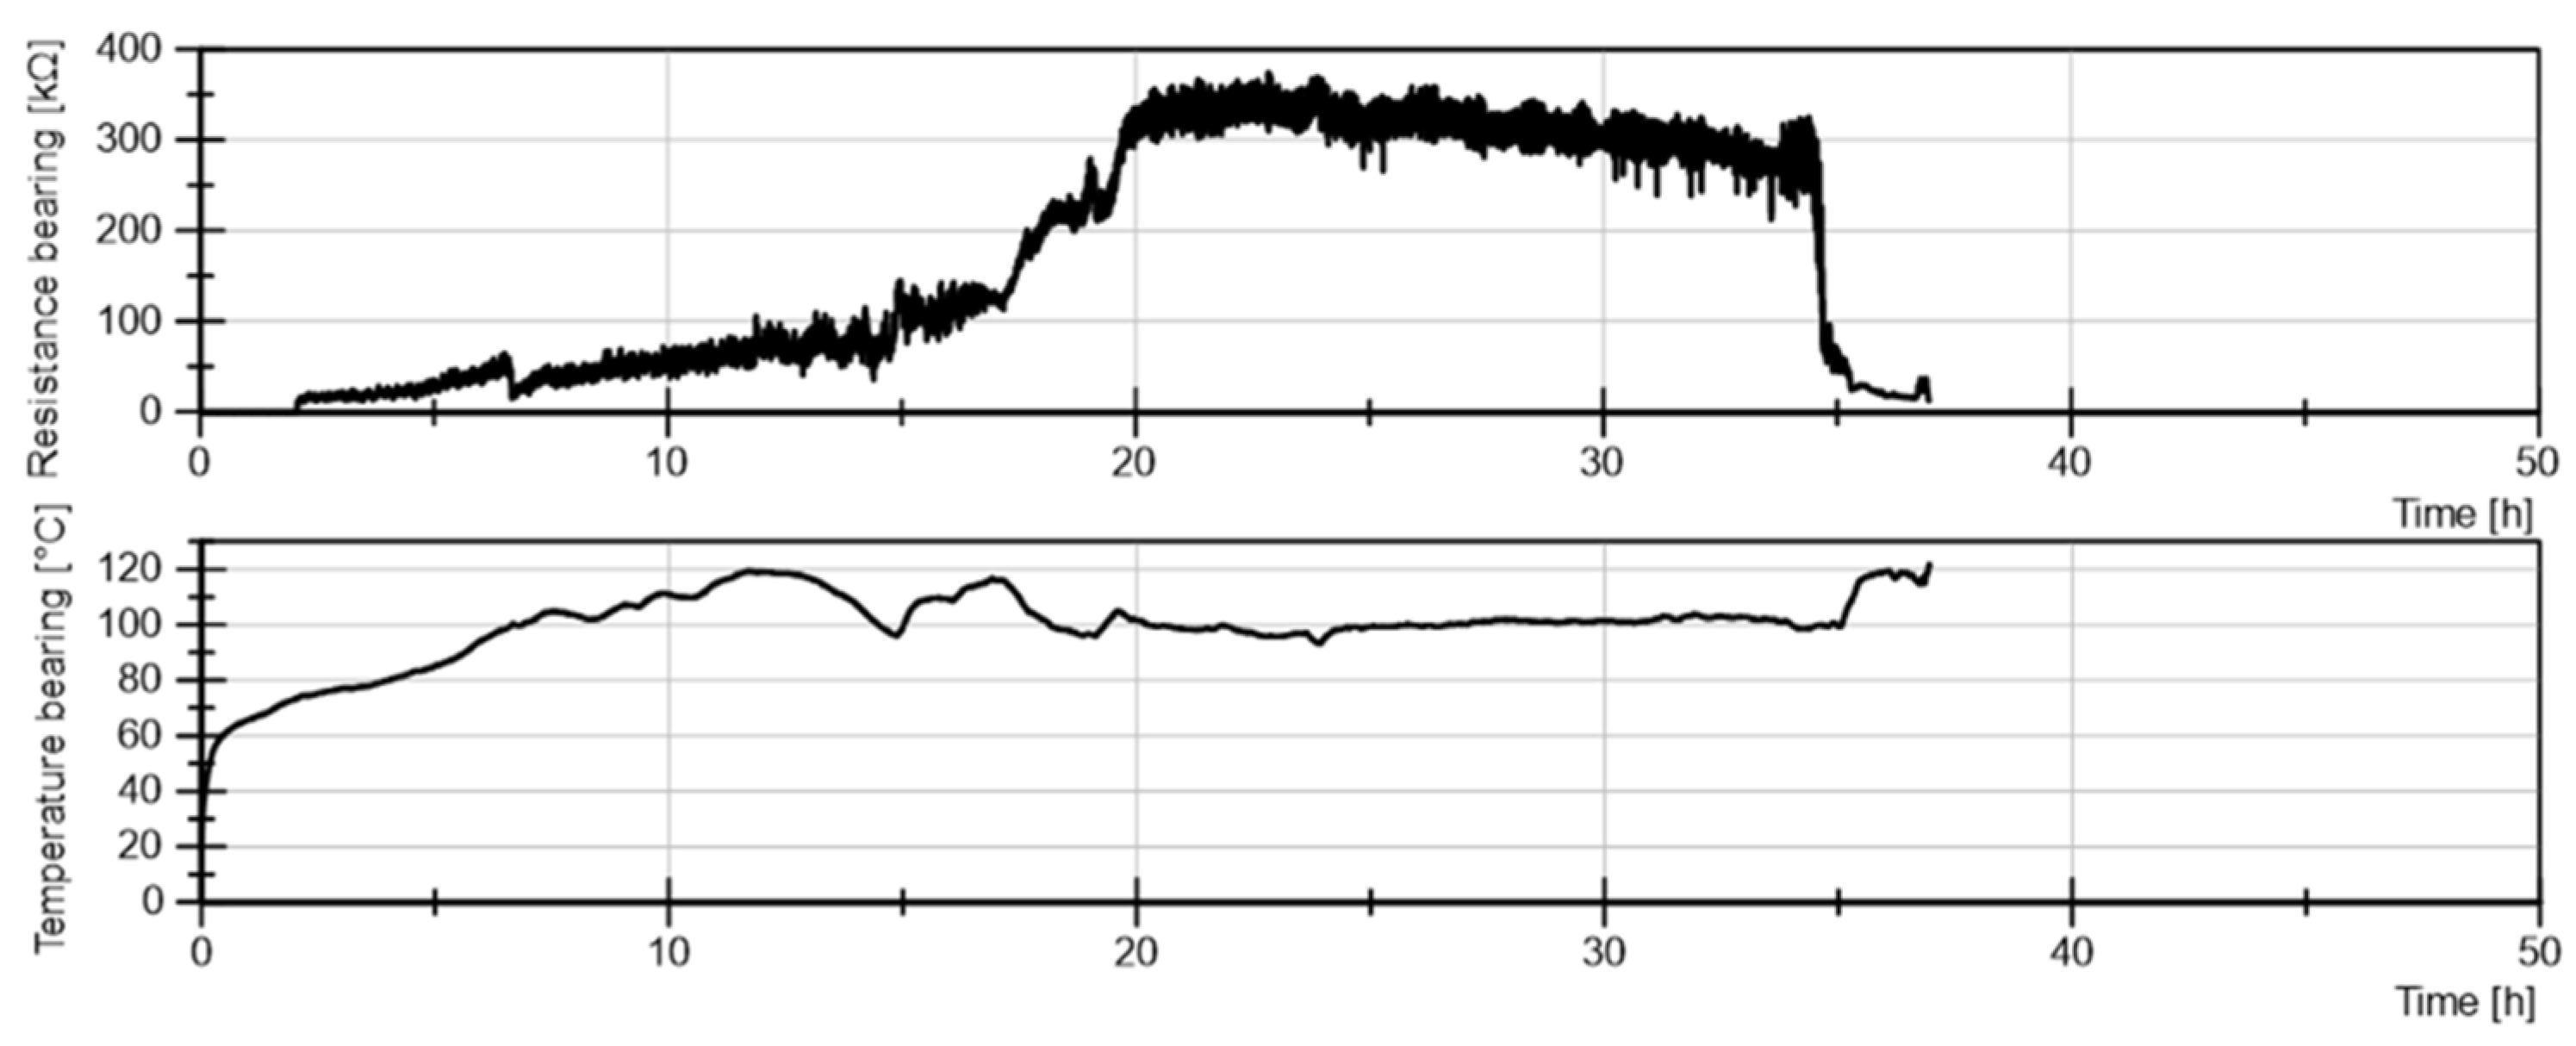
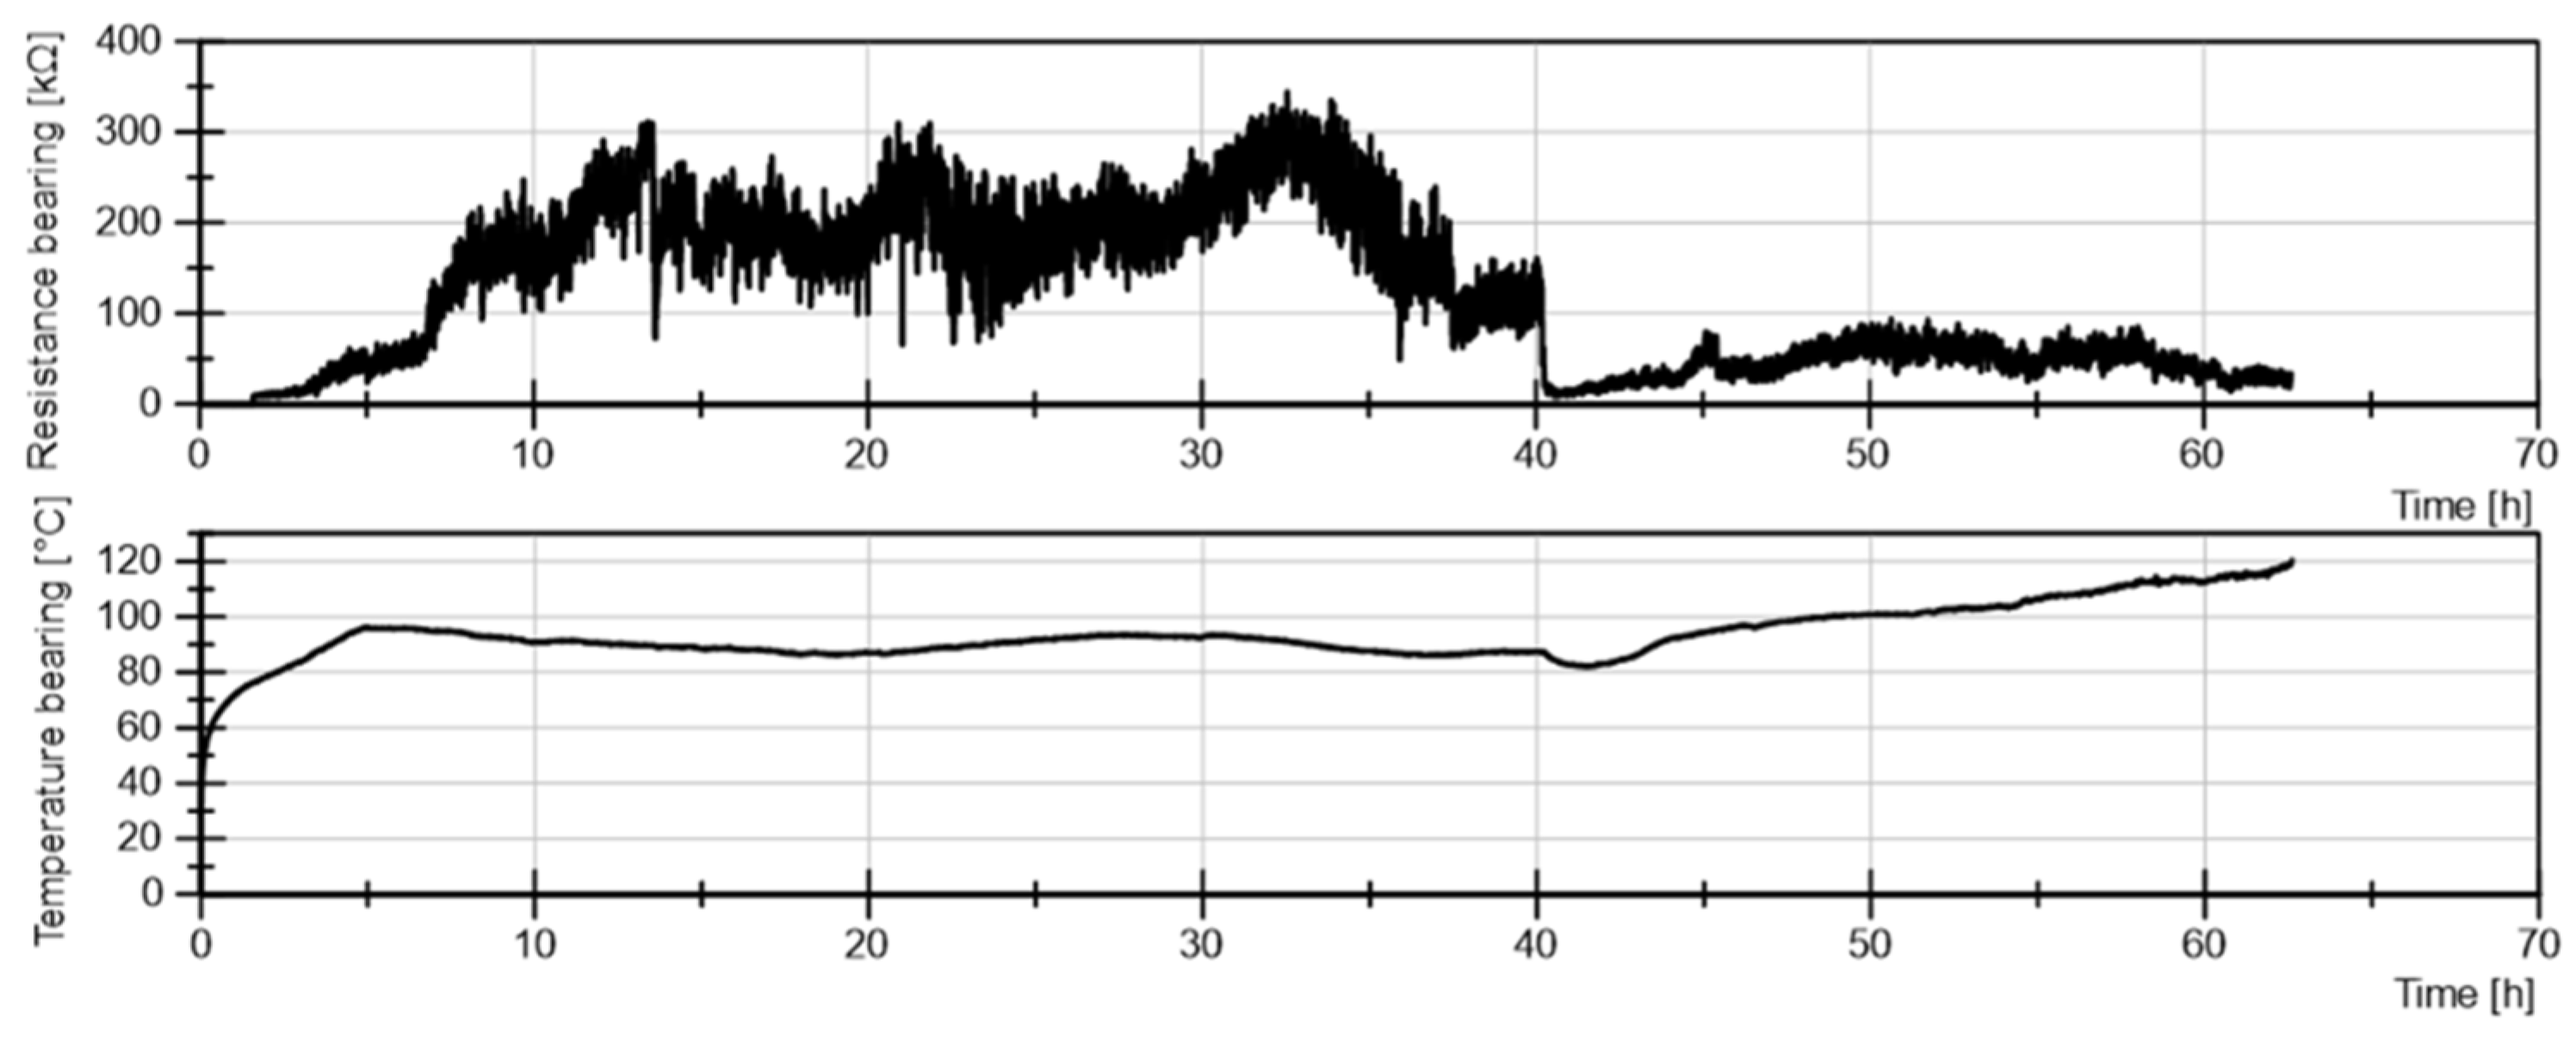
Test 4: Result: WEC
Axial Load 1800N, 4500 rpm, 4ml /minute
Lubricant: Poly-〈-olefine (viscosity at 40°C 48 mm2/s, 93 % per weight, ZnDTP (2% per weight) and PMMA (5% per weight)
Figure 15.
Test 4: Result for PAO (Baseoil),ZnDTP as Anti-Wear Additive and PMMA with the temperature graph and the resistance at the bearing.
Figure 15.
Test 4: Result for PAO (Baseoil),ZnDTP as Anti-Wear Additive and PMMA with the temperature graph and the resistance at the bearing.
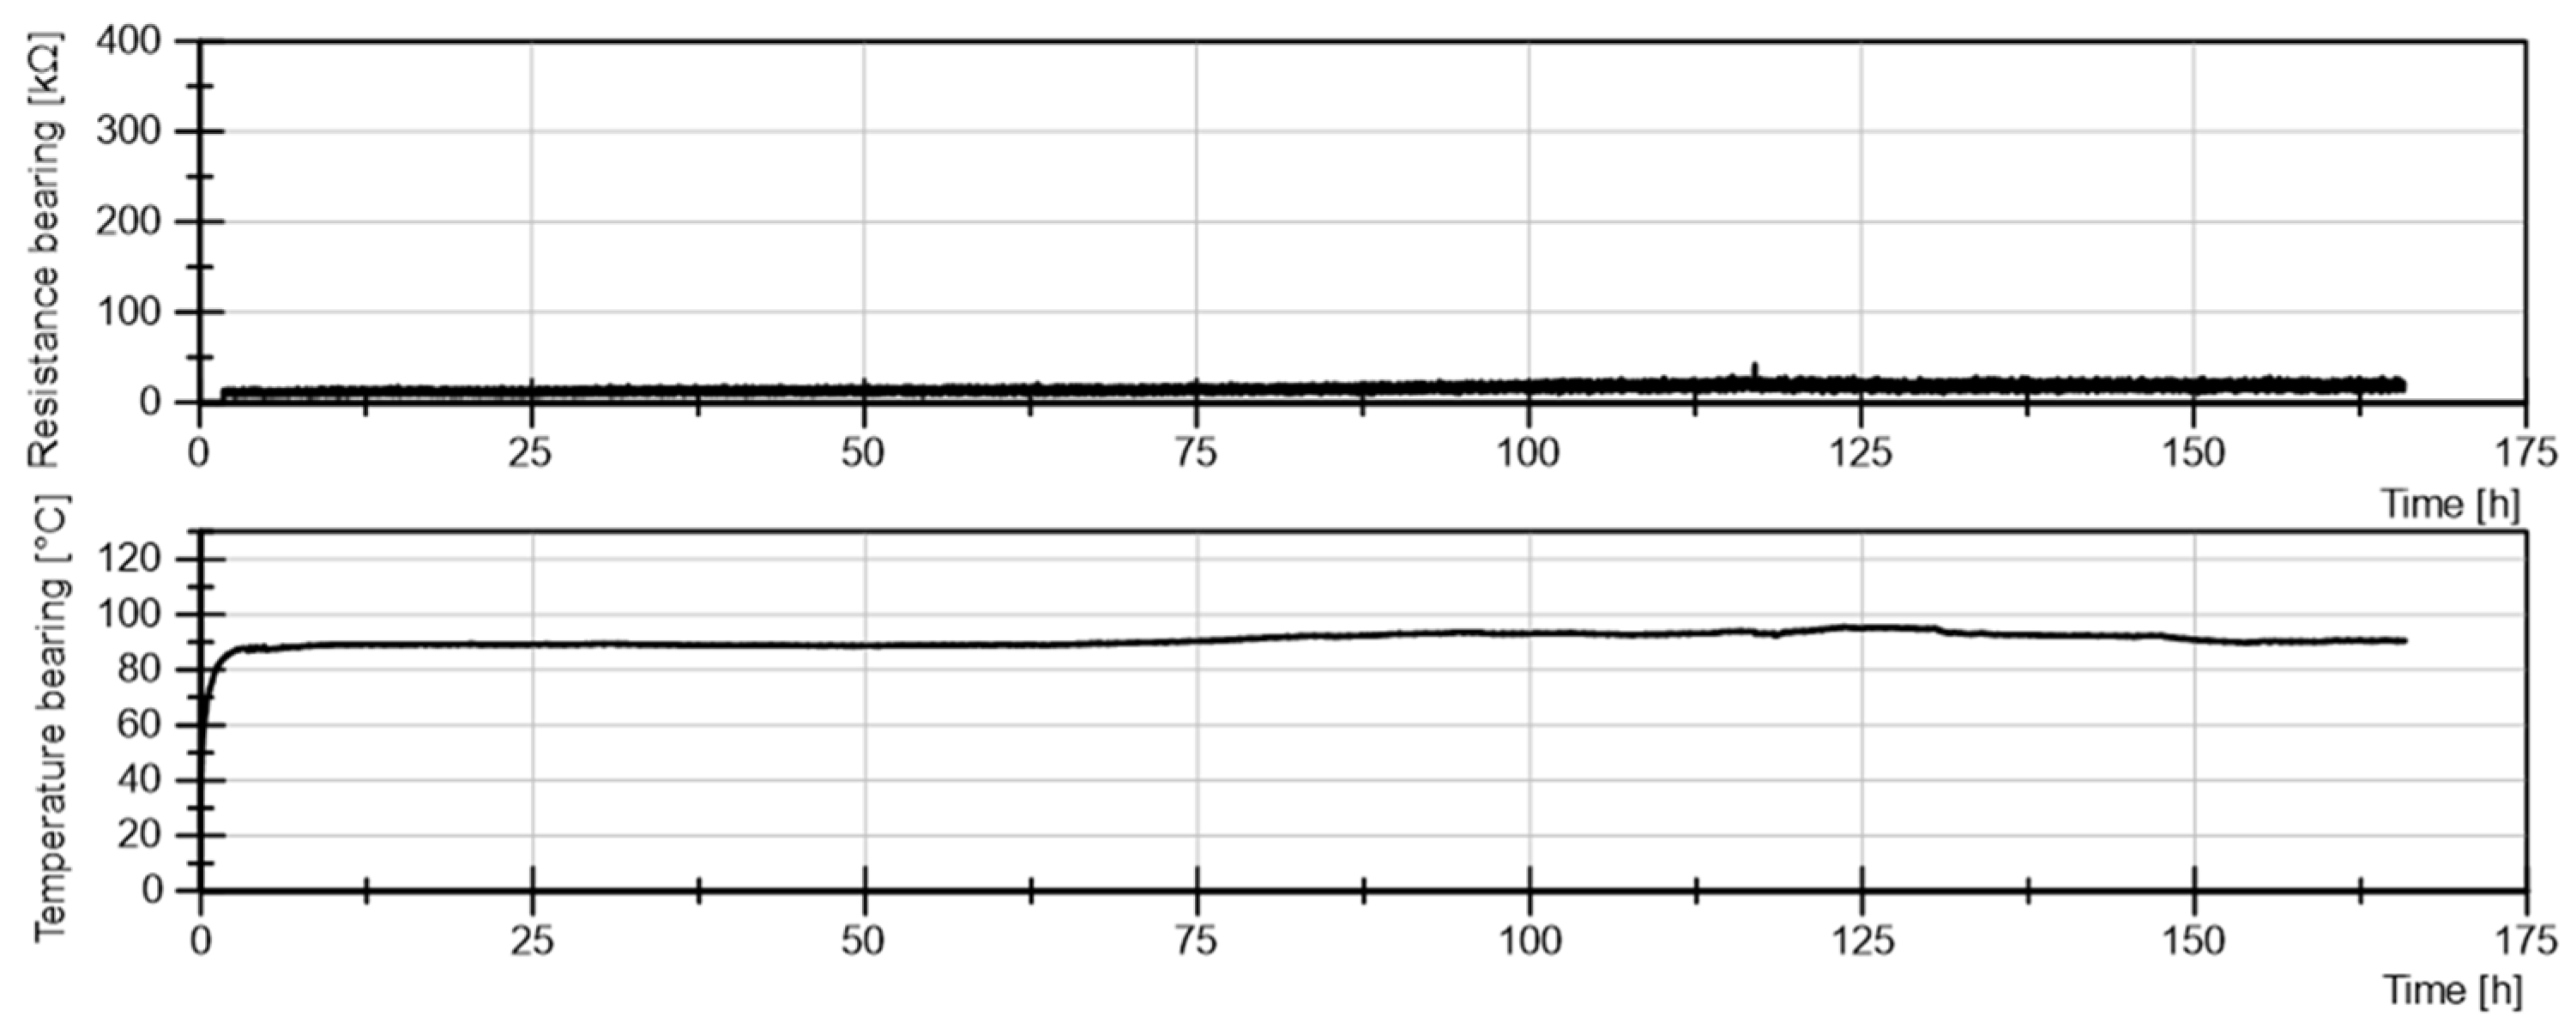
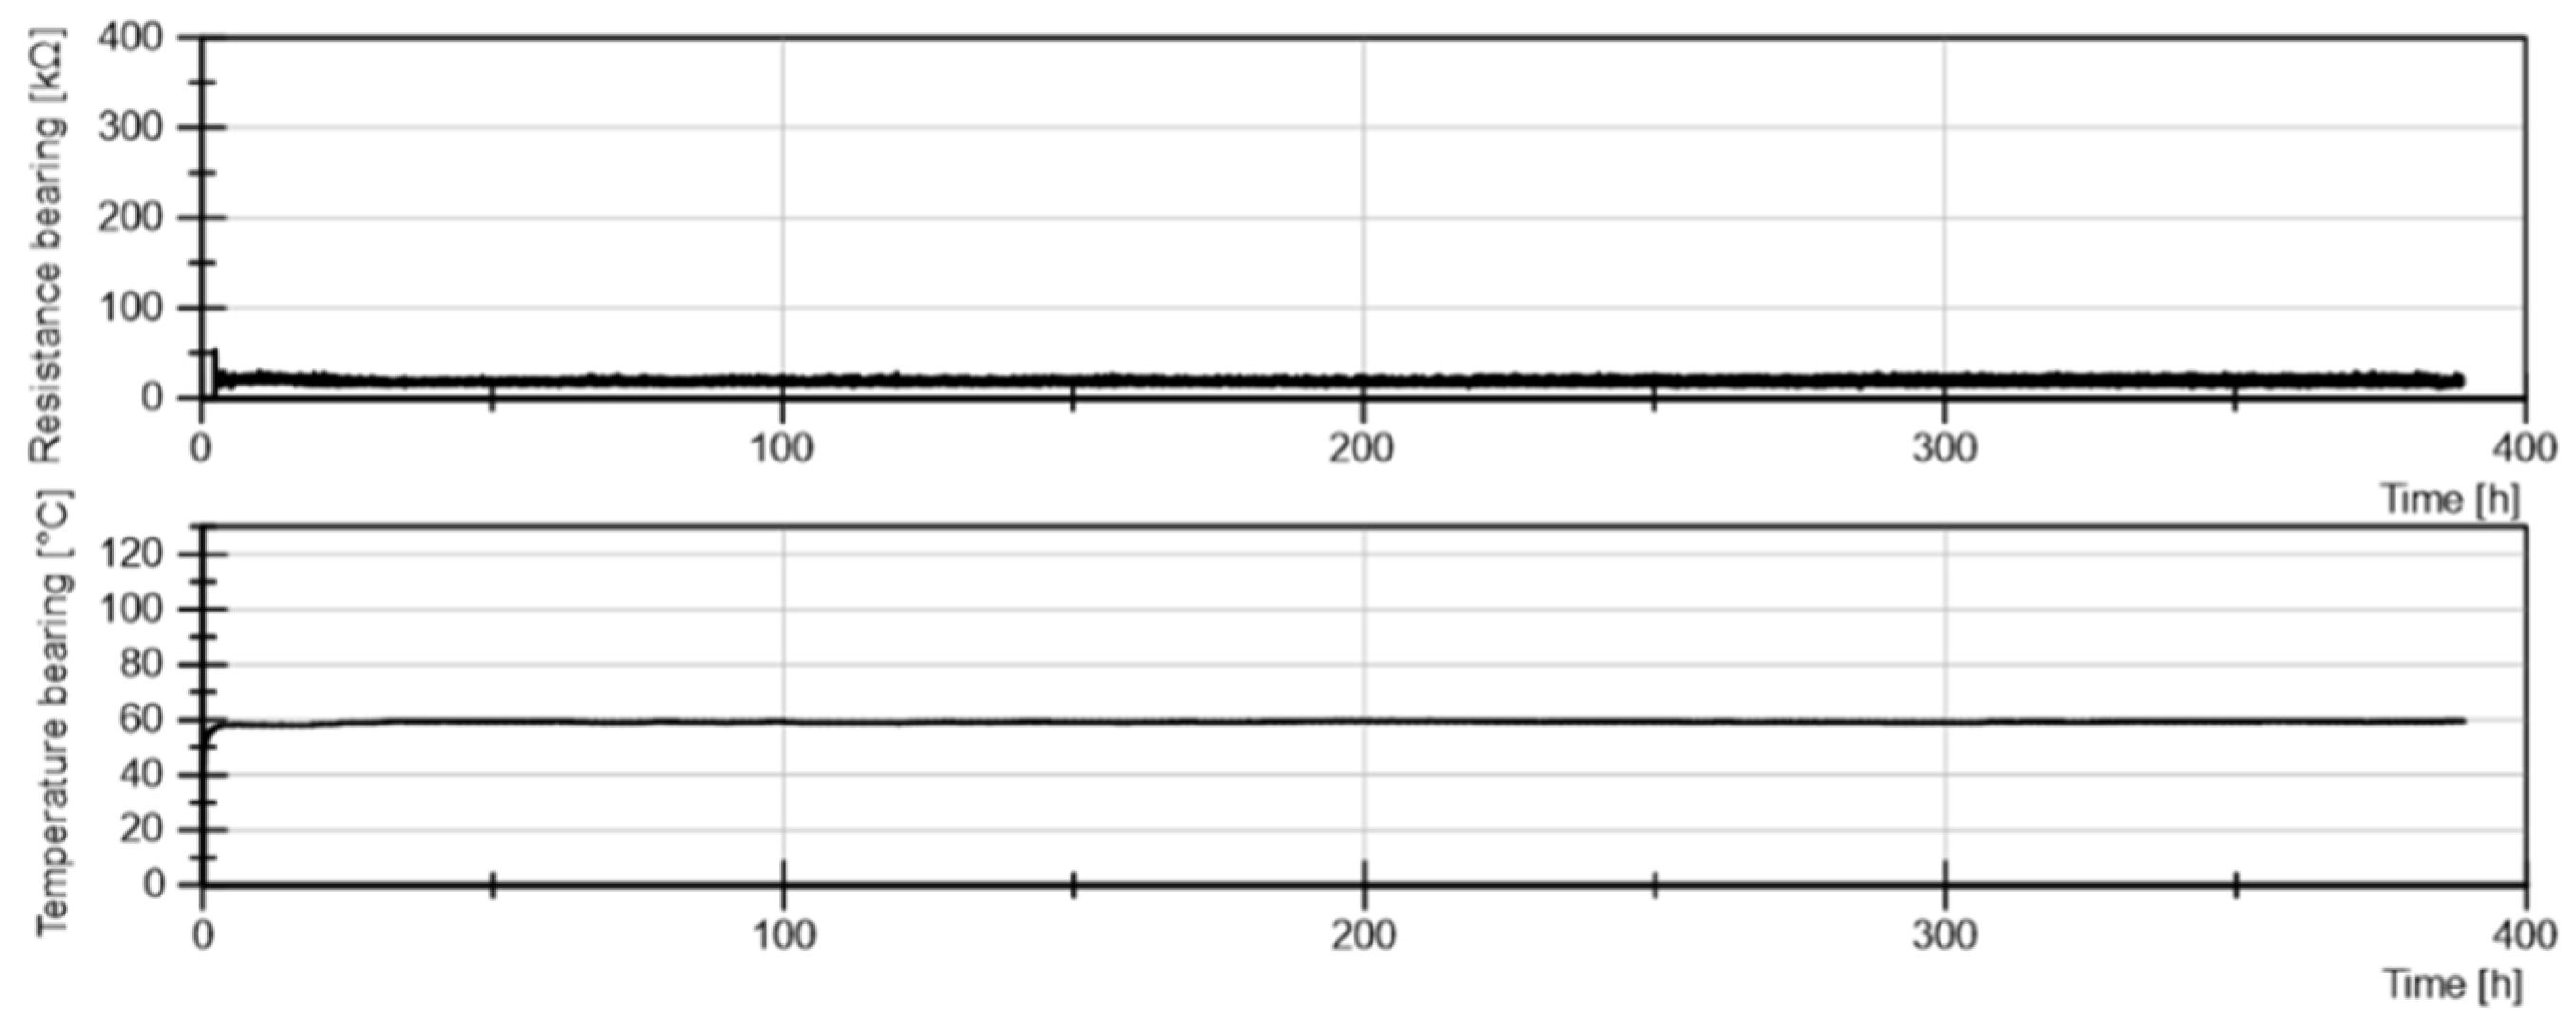
Test 5: Result: no WEC
Axial Load 1800N, 4500 rpm, 4ml /minute
Lubricant: Poly-〈-olefine (viscosity at 40°C 48 mm2/s, 96 % per weight, and Boron Acid Ester (2% per weight) and ZnDTP (2% per weight)
Figure 16.
Test 5: Result for PAO (Baseoil),ZnDTP as Anti-Wear Additive and Boron Acid Ester + with the temperature graph and the resistance at the bearings.
Figure 16.
Test 5: Result for PAO (Baseoil),ZnDTP as Anti-Wear Additive and Boron Acid Ester + with the temperature graph and the resistance at the bearings.
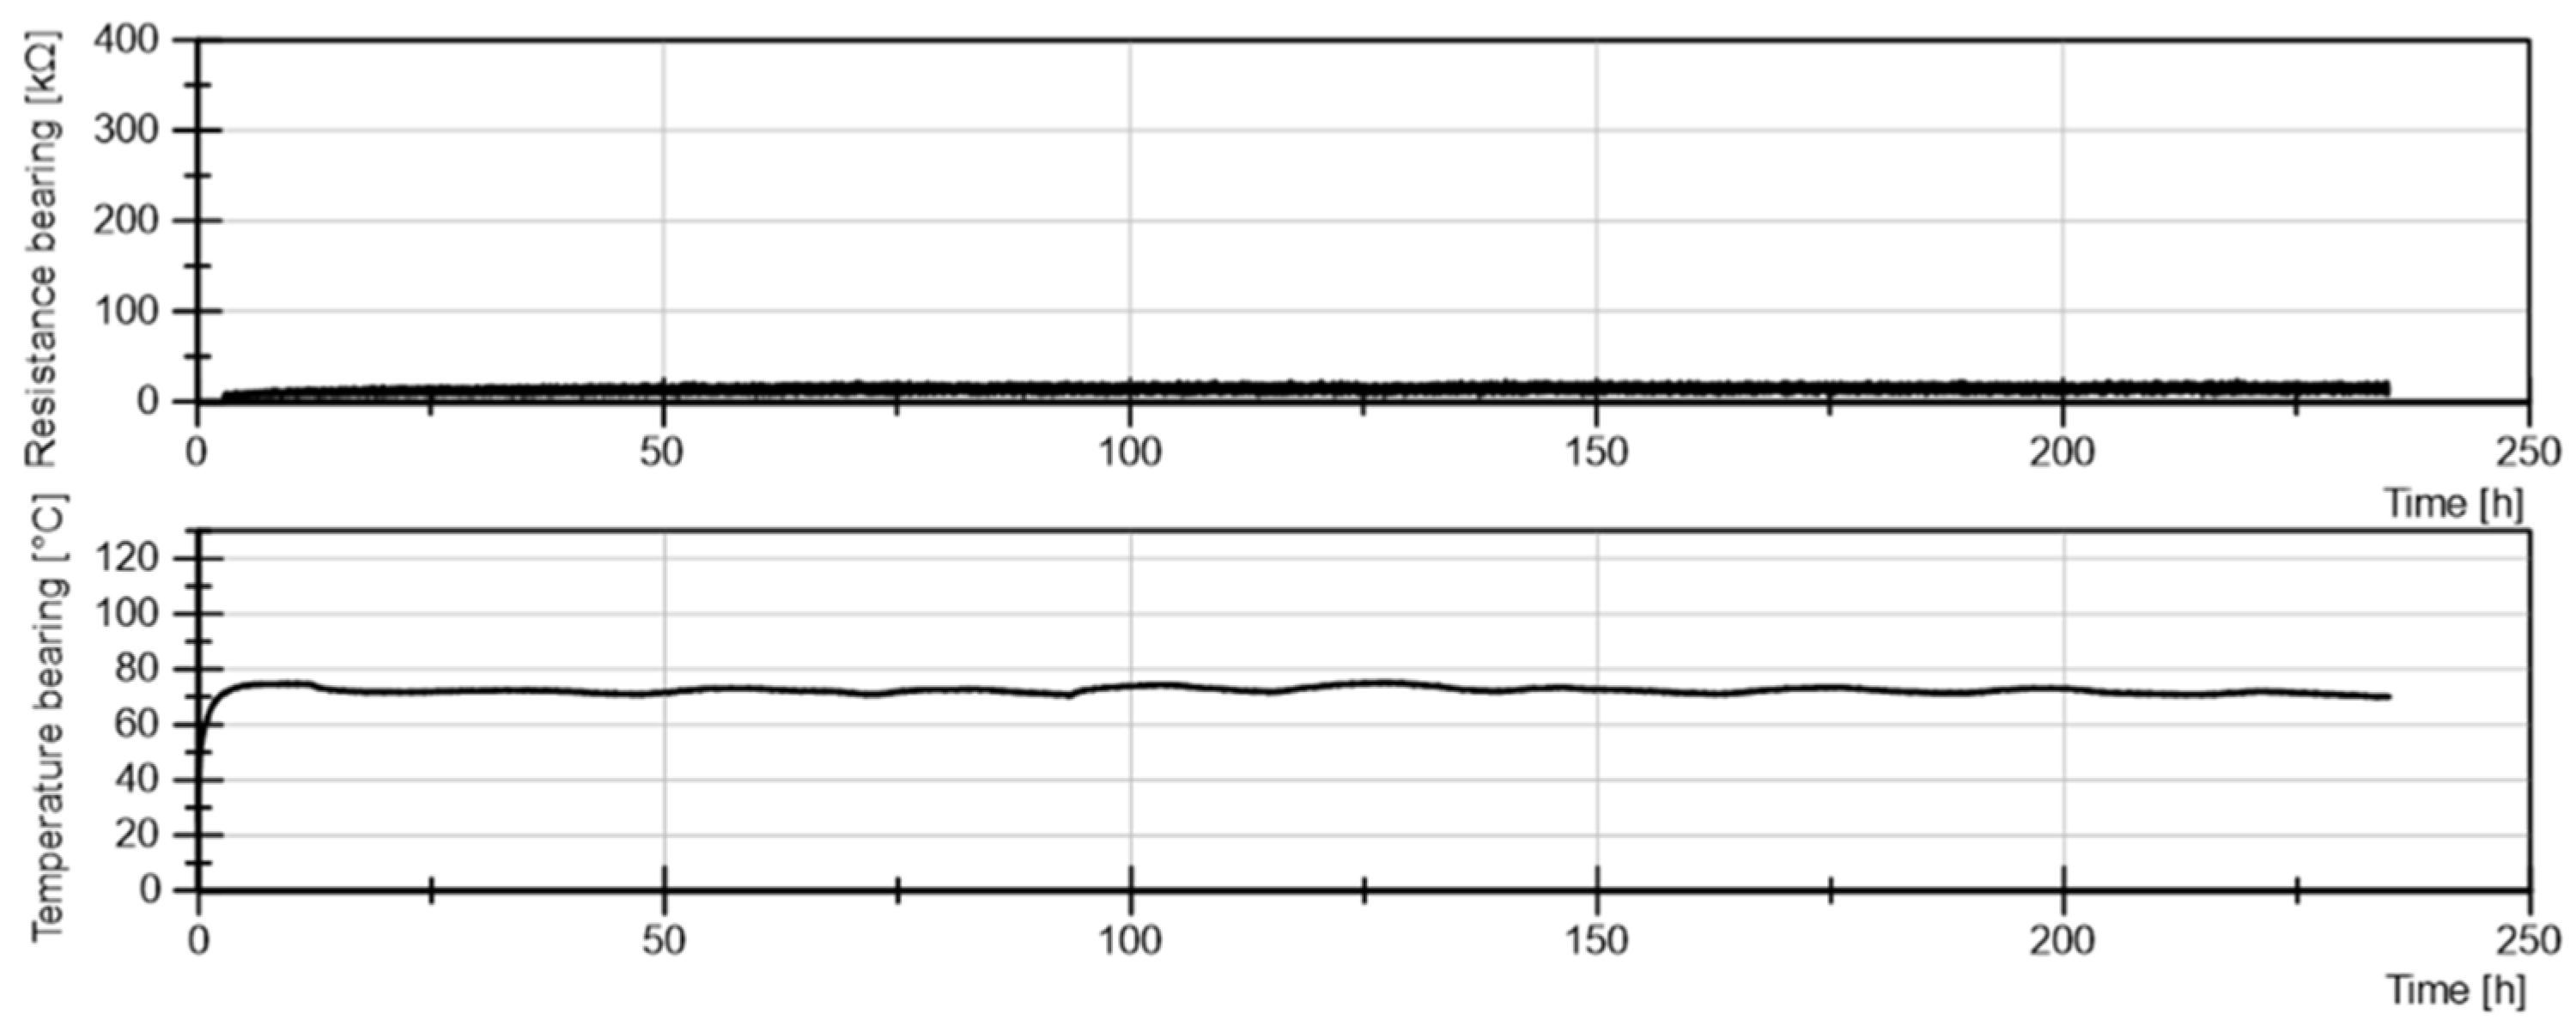
Test 6: Increase of the oil flow:Result: no WEC
Axial Load 1800N, 4500 rpm, 40ml /minute
Lubricant: Poly-〈-olefine (viscosity at 40°C 48 mm2/s, 93 % per weight, ZnDTP (2% per weight) and PMMA (5% per weight)
Figure 17.
Test 6: Result for PAO (Baseoil),ZnDTP as Anti-Wear Additive and PMMA with the temperature graph and the resistance at the bearing at an increased oil flow.
Figure 17.
Test 6: Result for PAO (Baseoil),ZnDTP as Anti-Wear Additive and PMMA with the temperature graph and the resistance at the bearing at an increased oil flow.
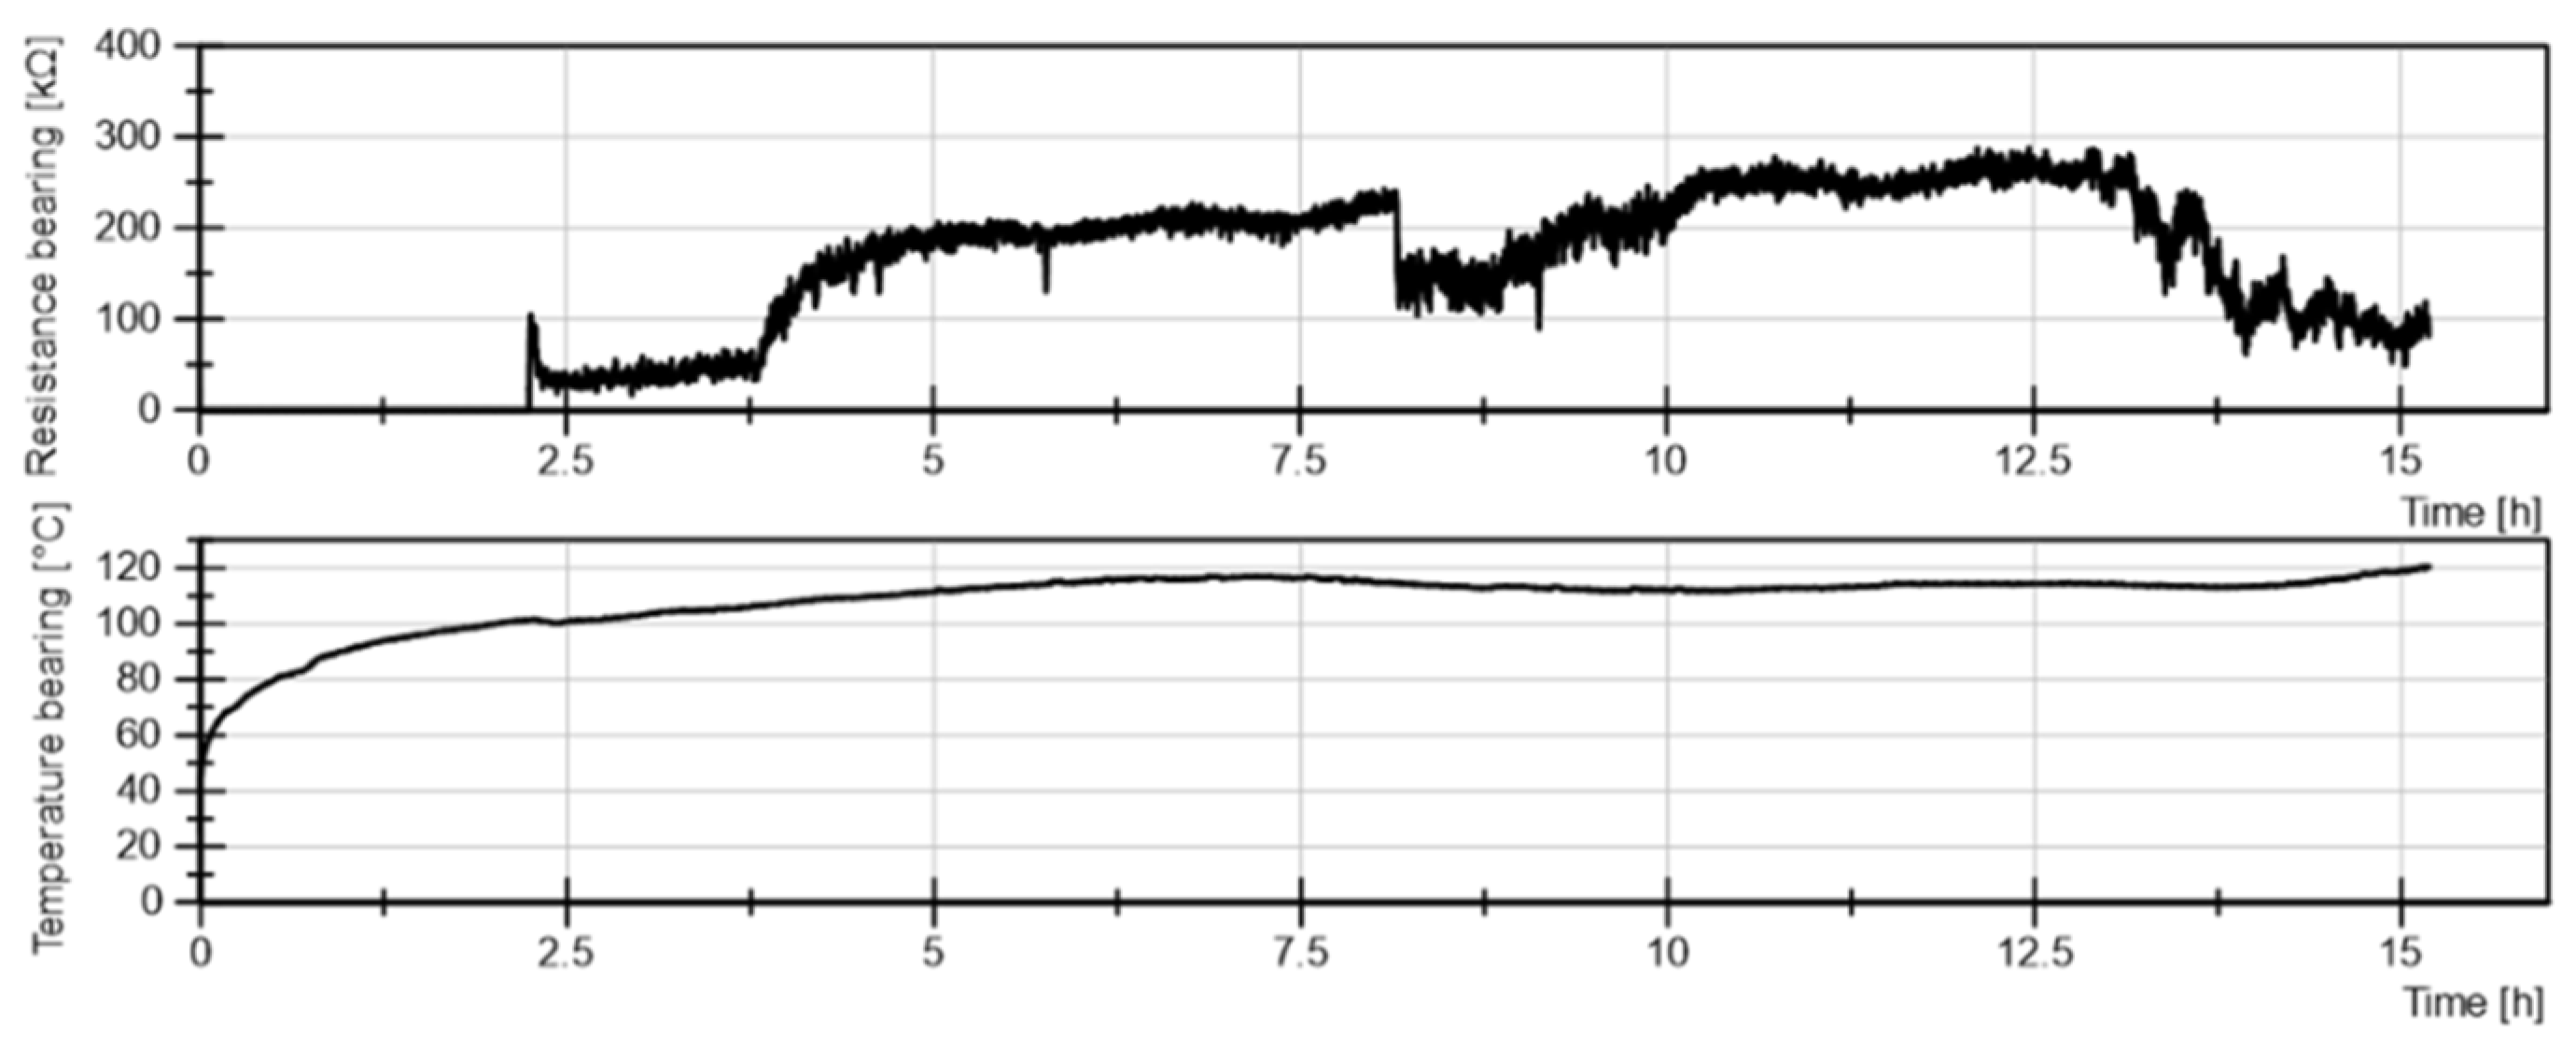
Test 7: Reducing load to 1200 N: Result: WEC
Axial Load 1200N, 4500 rpm, 4ml /minute
Lubricant: Poly-〈-olefine (viscosity at 40°C 48 mm2/s, 93 % per weight, ZnDTP (2% per weight) and PMMA (5% per weight)
Figure 18.
Test 7:Result for PAO (Baseoil),ZnDTP as Anti-Wear Additive and PMMA with the temperature graph and the resistance at the bearing at lower 1200 N axial load.
Figure 18.
Test 7:Result for PAO (Baseoil),ZnDTP as Anti-Wear Additive and PMMA with the temperature graph and the resistance at the bearing at lower 1200 N axial load.
Test 8: Reducing load to 800 N: Result: no WEC
Axial Load 800 N, 4500 rpm, 4ml /minute
Lubricant: Poly-α-olefine (viscosity at 40°C 48 mm2/s, 93 % per weight, ZnDTP (2% per weight) and PMMA (5% per weight)
Figure 19.
Test 8: Result for PAO (Baseoil),ZnDTP as Anti-Wear Additive and PMMA with the temperature graph and the resistance at the bearing at 800 N axial load.
Figure 19.
Test 8: Result for PAO (Baseoil),ZnDTP as Anti-Wear Additive and PMMA with the temperature graph and the resistance at the bearing at 800 N axial load.
Test 9: Starting with low oil flow (4 ml/min) then increasing to 40 ml/min: Result: no WEC
Axial Load 1800N, 4500 rpm, 4ml /minute at start for 12 hours, then increase to 40 ml/min for the remaining time.
Lubricant: Poly-α-olefine (viscosity at 40°C 48 mm2/s, 93 % per weight, ZnDTP (2% per weight) and PMMA (5% per weight)
Figure 20.
Test 9: Result with PAO-ZndtP-PMMA as the lubricant started with 4ml/min oil flow, then increasing to 40ml/min at 1800N.
Figure 20.
Test 9: Result with PAO-ZndtP-PMMA as the lubricant started with 4ml/min oil flow, then increasing to 40ml/min at 1800N.

4. Discussion
The tests are reflecting different dimensions related to the appearance of White Etching Cracks, keeping the speed constant as well as the electrical impact. The worsest combination, which is represented by the lubricant containing PAO (Baseoil), ZnDTP and PMMA gave repetitively WEC failures in short time from a pressure range of 1800 N and 1200 N with an oil flow of 4 ml/min. The failure was gone by reducing the load to 800 N and, at 1800 N by the increase of the oil volume flow. The mixture of PAO baseoil with ZnDTP lead to WEC as well under the most critical conditions (1800 N load and 4 ml/minute oil flow). WEC could not be detected by the use of a mixture of the boronic acid ester with PAO and pure base oil even under the most critical conditions (1800 N, 4 ml/min). All tests having failed by WEC are showing the occurrence of an additional resistance at the bearing, while all tests not leading to WEC didn’t. A similar pattern was observed by monitoring the temperature. In tendence, all tests leading to WEC failure are showing an ascent in the temperature at the beginning, however accommodating constant in the course of the test. It becomes evident, that even WEC critical conditions turn to be WEC free by simply increasing the oil flow and decrease the contact pressure. As an important aspect it comes out, that the pre-stages of WEC formation are accompanied by the formation of an additional resistor apparent at the bearings. This resistor stays a while before collapsing. It is to say, that this phenomenon is not related to the formation of reaction layers as it fades away by simply increasing the oil flow. Therefore it is more likely that transient molecular aggregations (Clusters) are the cause and the creation of WEC is caused by an uptake of charging upon the Cluster surface. The initiation of WEC would then be caused at that “silent” charging phase, while the collapse reflects the outbreak of WEC. The hypotheses behind are part of a recent study [18].
5. Conclusions
Research on White Etching Cracks (WEC) apparent in multiple bearing applications has identified various drivers to cause them. Lubricants, Electricity combined with contact mechanics are proven to catalyze WEC significantly. However, none of them is solely causing WEC by its own, instead combinations discretize whether WEC appears or not. Hence, the WEC topic appears to be multidimensional, leading to the consequence that easy binary laws are missing making WEC still unpredictable. The current paper is about a systematic study by the use of a DGBB test rig on how lubricant chemicals combined with electricity and by varying oil flow and pressure lead to WEC. The current results become important for the use of bearings under electrical exposure like within Wind Power Installation and E-Mobility.
Author Contributions
Conceptualization, M.Z. and W.H..; methodology, M.Z.; validation, M.Z.; formal analysis, M.Z..; investigation, M.Z.; resources, C.S.; data curation, M.Z.; writing—original draft preparation, W.H.; writing—review and editing, M.Z.; visualization, M.Z.; supervision, E.S; W.H..; project administration, E.S.; funding acquisition, E.S. ; W.H. All authors have read and agreed to the published version of the manuscript.
Funding
This research was funded by the German Research Centre, Julich, at the Section of the Bavarian Ministry of Economics.
Data Availability Statement
The data are available at manuel.zuercher@gmx.de.
Conflicts of Interest
The authors declare no conflicts of interests.
References
- 2007, ISO 281:. Rolling bearings — Dynamic load ratings and rating life. s.l.: ISO , 2007.
- D. Scott, B. Loy and G. H. Mills. Paper 10: Metallurgical Aspects of Rolling Contact Fatigue. Proceedings of the Institution of Mechanical Engineers, Conference Proceedings. 1966, Vols. vol. 181, no. 15, pp. 94–103. [CrossRef]
- Wang, Q.J., Netzel, J., Sadeghi, F.[ed.].The Advancing Frontier of Engineering Tribology s.l.: STLE/ASME, 1999.
- Ilg, U. Einfluß von Normal-/Gleitbeanspruchung auf Gefüge und Eigenspannungsänderungen von Wälzelementen unterschiedlicher Eigenspannungszustände. Forschungsvereinigung Antriebstechnik. Heft 103: Forschungsvereinigung Antriebstechnik, 1981. p. 188, Abschlussbericht.
- Ruellan A, Kleber X, Ville F, Cavoret J, Liatard B. [ed.] Part J Proceedings of the Institution of Mechanical Engineers. 2015.Understanding white etching cracks in rolling element bearings: Formation mechanisms and influent tribochemical drivers. Journal of Engineering Tribology. 2015;229(8). pp. 886-901. [CrossRef]
- Francesco Manieri, Kenred Stadler, Guillermo E. Morales-Espejel, Amir Kadiric. The origins of white etching cracks and their significance to rolling bearing failures. International Journal of Fatigue. Volume 120: International Journal of Fatigue, 2019. pp. 107-133. [CrossRef]
- Leimann, O.D. Calculation Method to Evaluate the Risk of WEC Occurrence in. Bearing World Journal Vol. 5 (2020): s.n., 2020. pp. 19-39.
- Zepeng Liu, Long Zhang. A review of failure modes, condition monitoring and fault diagnosis methods for large-scale wind turbine bearings. Measurement. ISSN 0263-2241, 2020, Vol. 149. [CrossRef]
- Fernando José López-Uruñuela, Beatriz Fernández-Díaz, Francesco Pagano, Ainara López-Ortega, Bihotz Pinedo, Raquel Bayón, Josu Aguirrebeitia. Broad review of “White Etching Crack” failure in wind turbine gearbox bearings: Main factors and experimental investigations. International Journal of Fatigue. ISSN 0142-1123, 2021, Vol. 145, ISSN 0142-1123. [CrossRef]
- Joerg Loos, Iris Bergmann & Matthias Goss. Influence of Currents from Electrostatic Charges on WEC Formation in Rolling Bearings. Tribology Transactions, 59:5. 2016, pp. 865-875. [CrossRef]
- Loos, J., Bergmann, I., Goss, M. Influence of High Electrical Currents on WEC Formation in Rolling Bearings. Tribology Transactions. Engineering Material Science, 2021. [CrossRef]
- B. Gould, Nicholas Demas, R. Erck, M. Lorenzo-Martin, O. Ajayi, A. Greco. The effect of electrical current on premature failures and microstructural degradation in bearing steel. International Journal of Fatigue. Materials Science, Engineering, 2021, Vol. 145. [CrossRef]
- Richardson AD, Evans MH, Wang L, Wood RJK, Ingram M, Meuth B. The Evolution of White Etching Cracks (WECs) in Rolling Contact Fatigue-Tested 100Cr6 Steel. Tribology Letters; 66(1):6. 2018. [CrossRef]
- Smelova, V., Schwedt, A., Wang, L., Holweger, W., Mayer, J. Microstructural changes in White Etching Cracks (WECs) and their relationship with those in Dark Etching Region (DER) and White Etching Bands (WEBs) due to Rolling Contact Fatigue (RCF). International Journal of Fatigue. 2017. [CrossRef]
- Evans, M. White structure flaking failure in bearings under rolling contact fatigue. Faculty of Engineering and the Environment, University of Southampton. SO17 1 BJ Southampton: s.n., 2013. Doctoral Thesis.
- Esmaeili, Kamran & Zuercher, M & Wang, Ling & Harvey, Terry & Holweger, Walter & White, Neil & Schlücker, E. A study of white etching crack bearing failure detection using electrostatic sensing in wind turbine gearboxes. International Journal of Condition Monitoring. 8. 82-88. 2018, pp. 82-88. [CrossRef]
- Esmaeli, K. Influence of electrical discharges on white etching crack formation and their detection using electrostatic sensing technique. National Centre of Advanced Tribology, University of Southampton. SO17 1 BJ Southampton: s.n., 2021. Thesis.
- Holweger, W., et al. A Validated Computational Study of Lubricants under White Etching Crack Conditions Exposed to Electrical Fields. Lubricants 2023, 11, 45. 2023. [CrossRef]
Figure 1.
Evolving White Etching Cracks as Subsurface Feature under Operation.
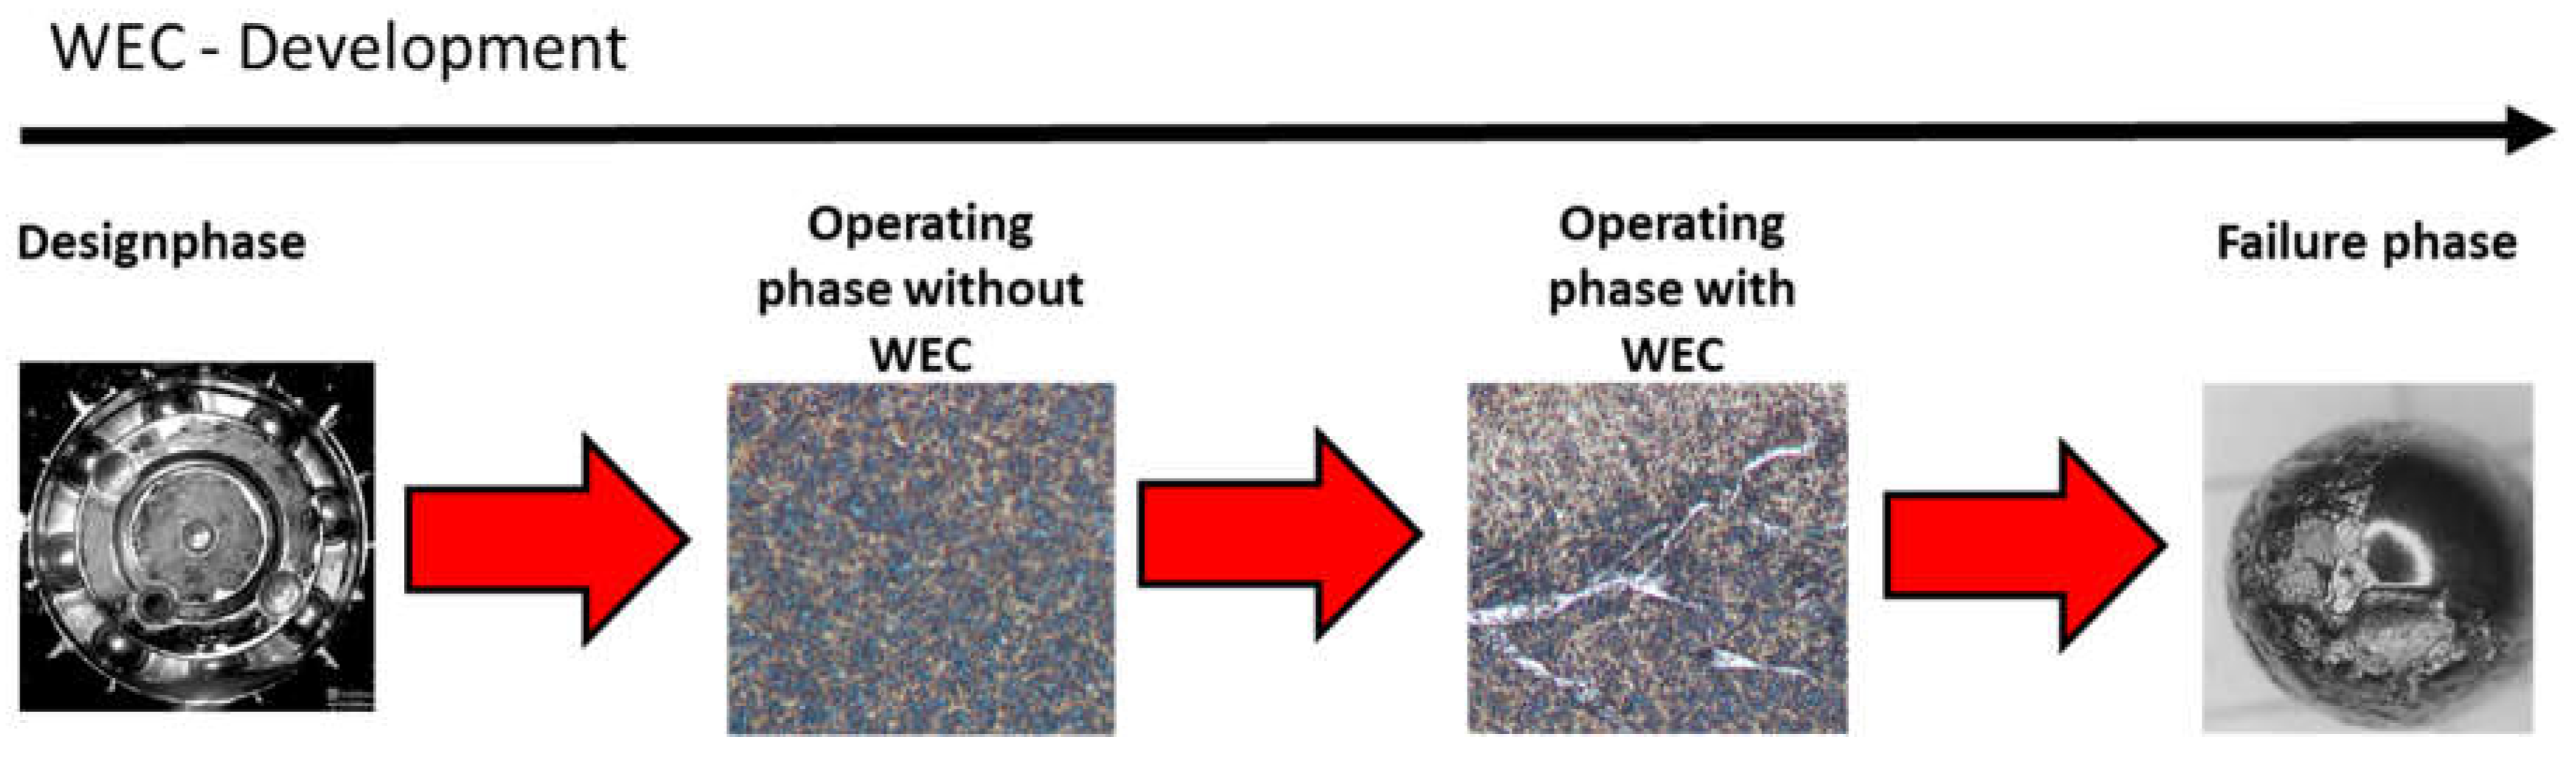
Figure 2.
Test Rig.
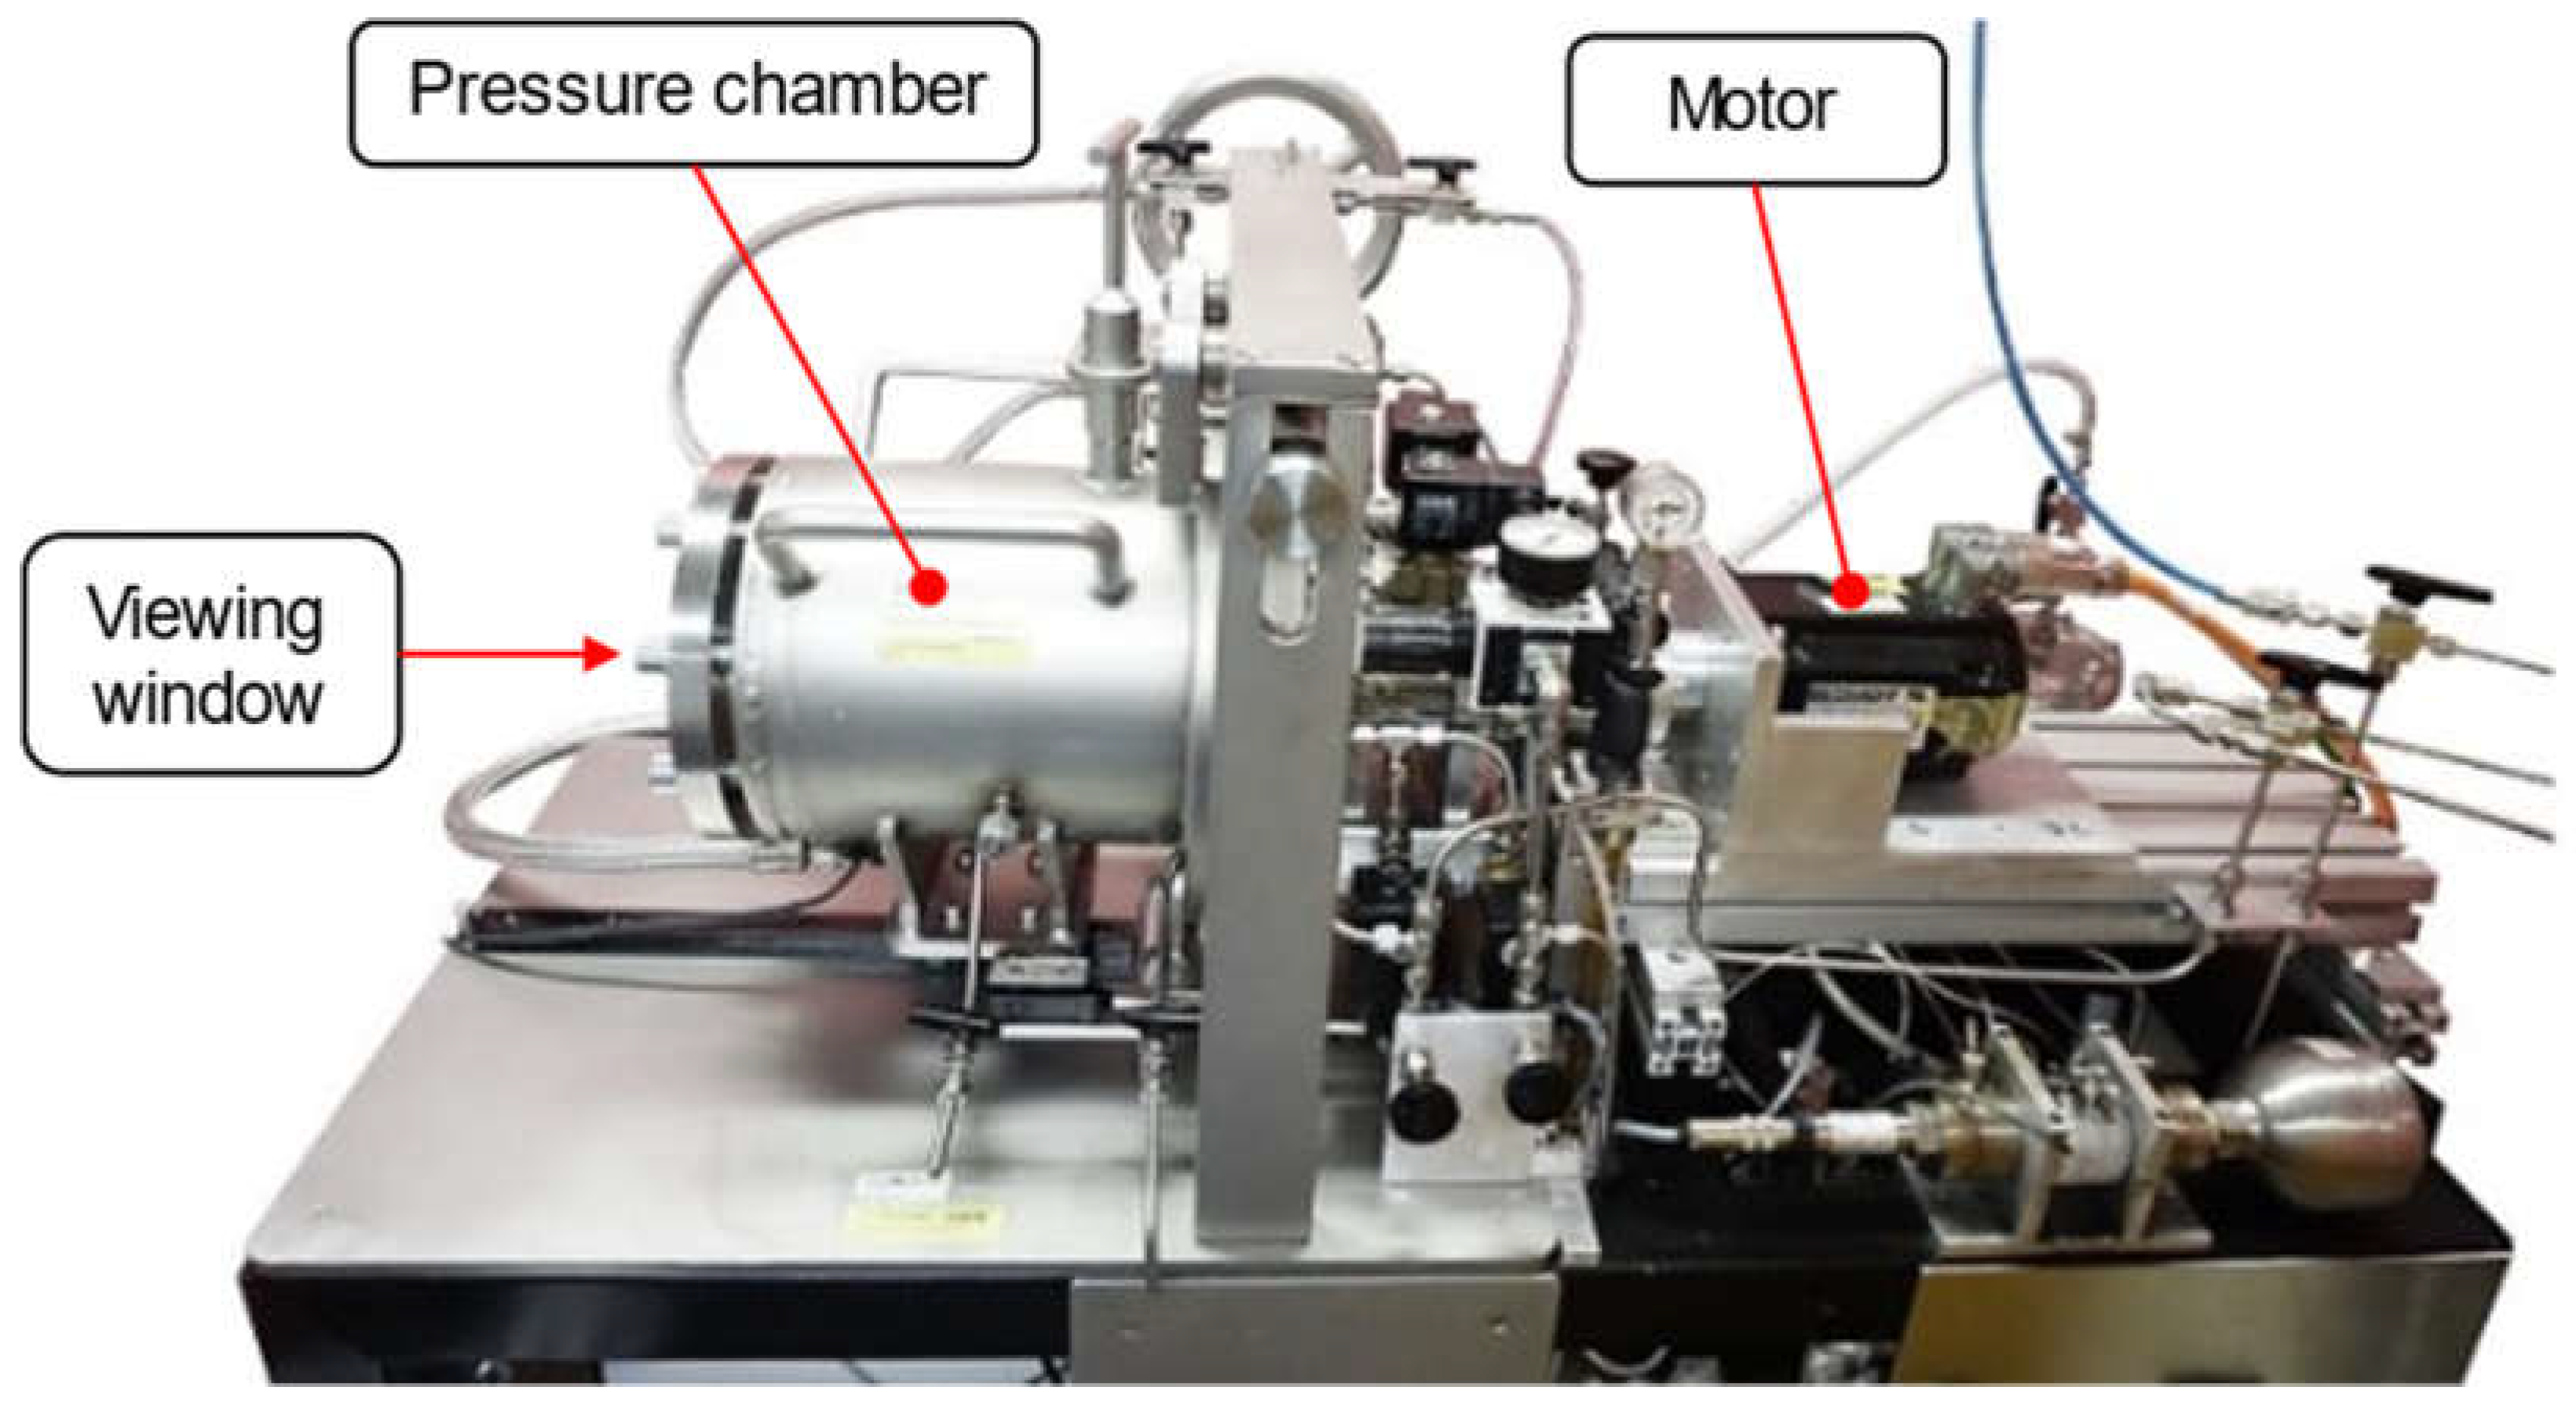
Figure 3.
Schematic Representation of the Test Rig and its elements.

Figure 4.
Bearing Setup within the Pressure Chamber comprising the Oil inlet and Sensor adjustments.
Figure 4.
Bearing Setup within the Pressure Chamber comprising the Oil inlet and Sensor adjustments.
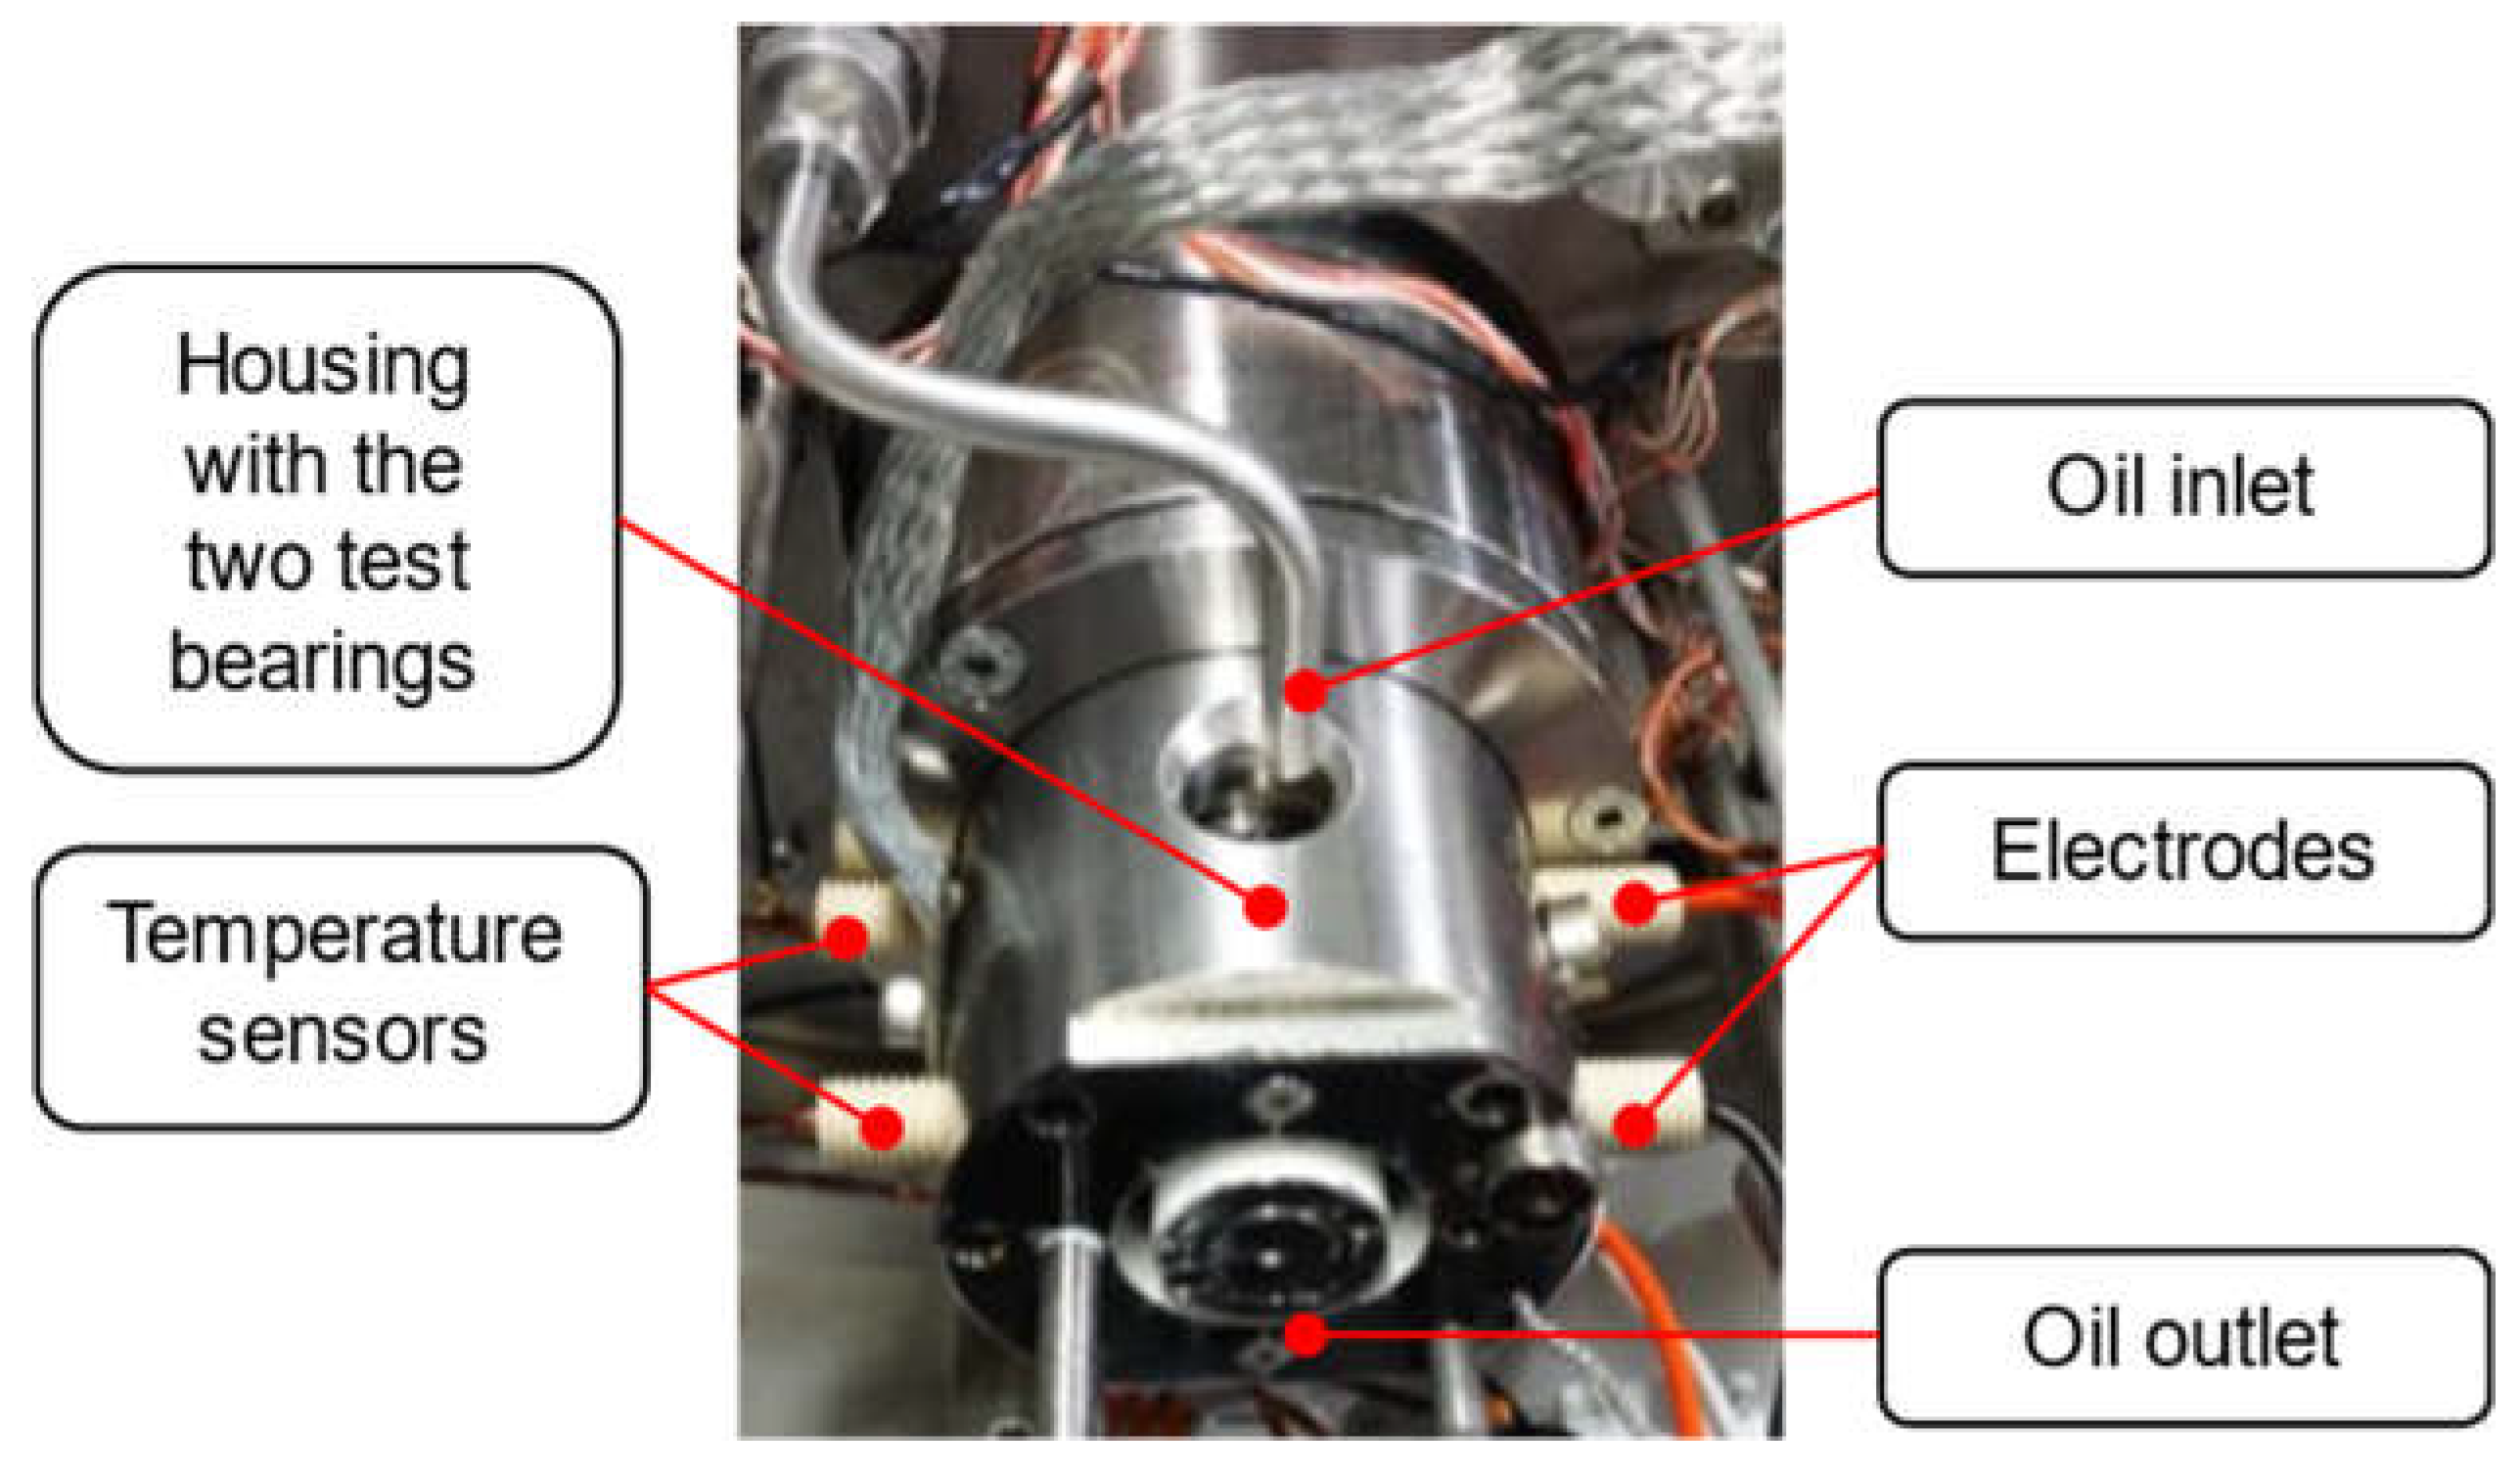
Figure 5.
Schematic Representation of the electrical circuit for artificial charging the bearings.
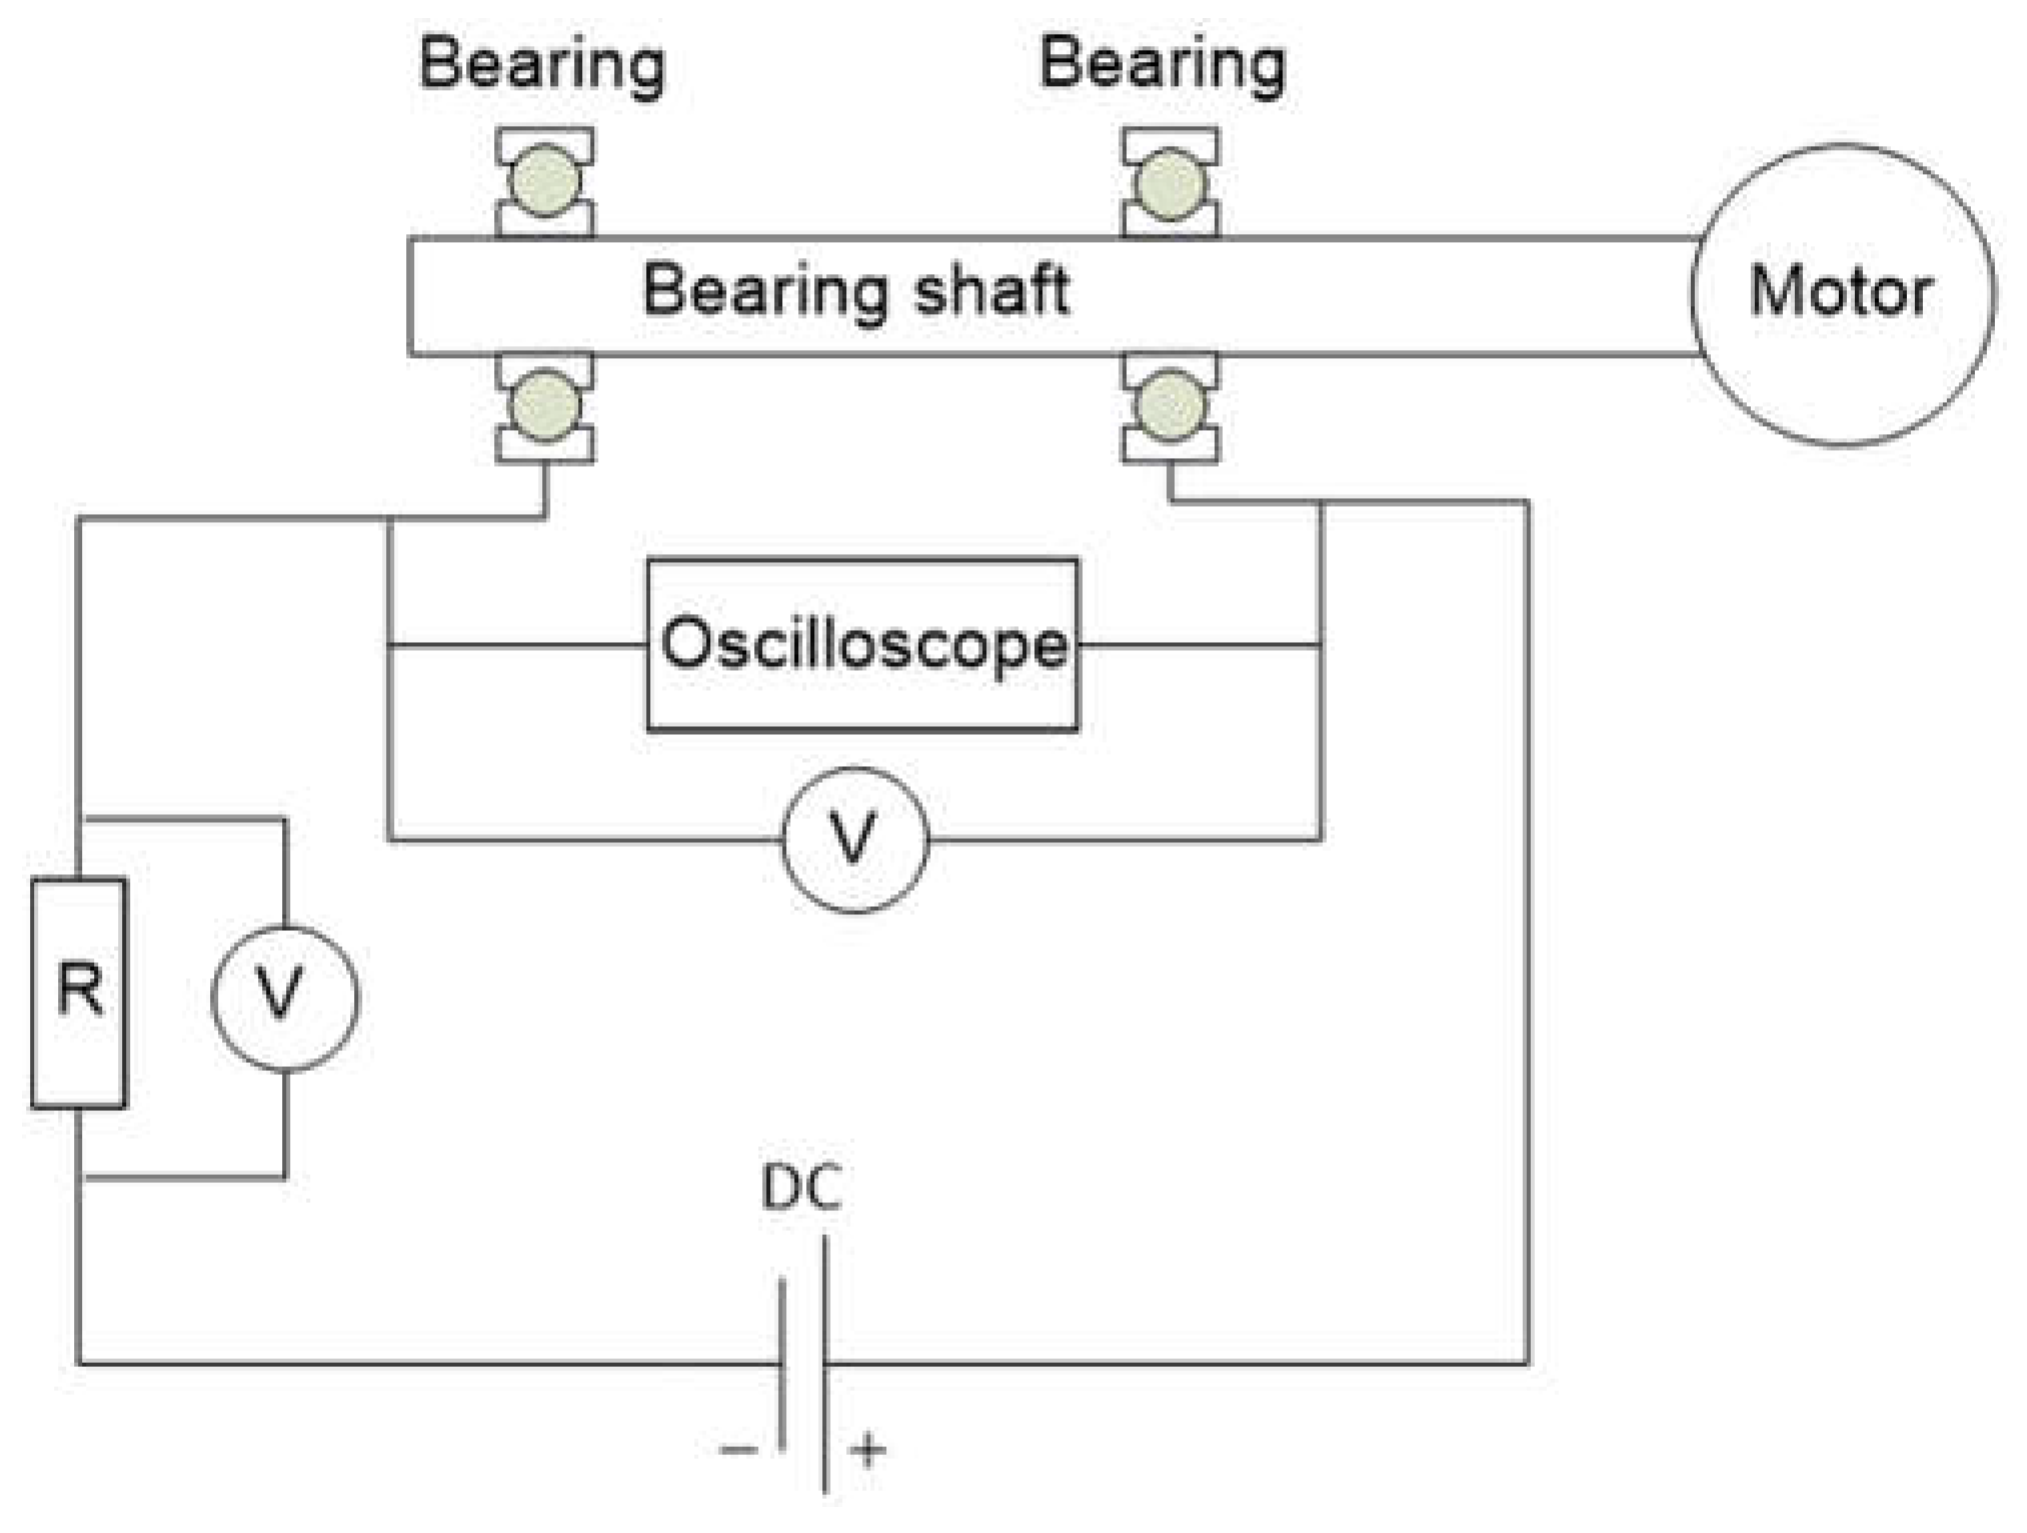
Figure 6.
Voltage Recording at the Bearing.
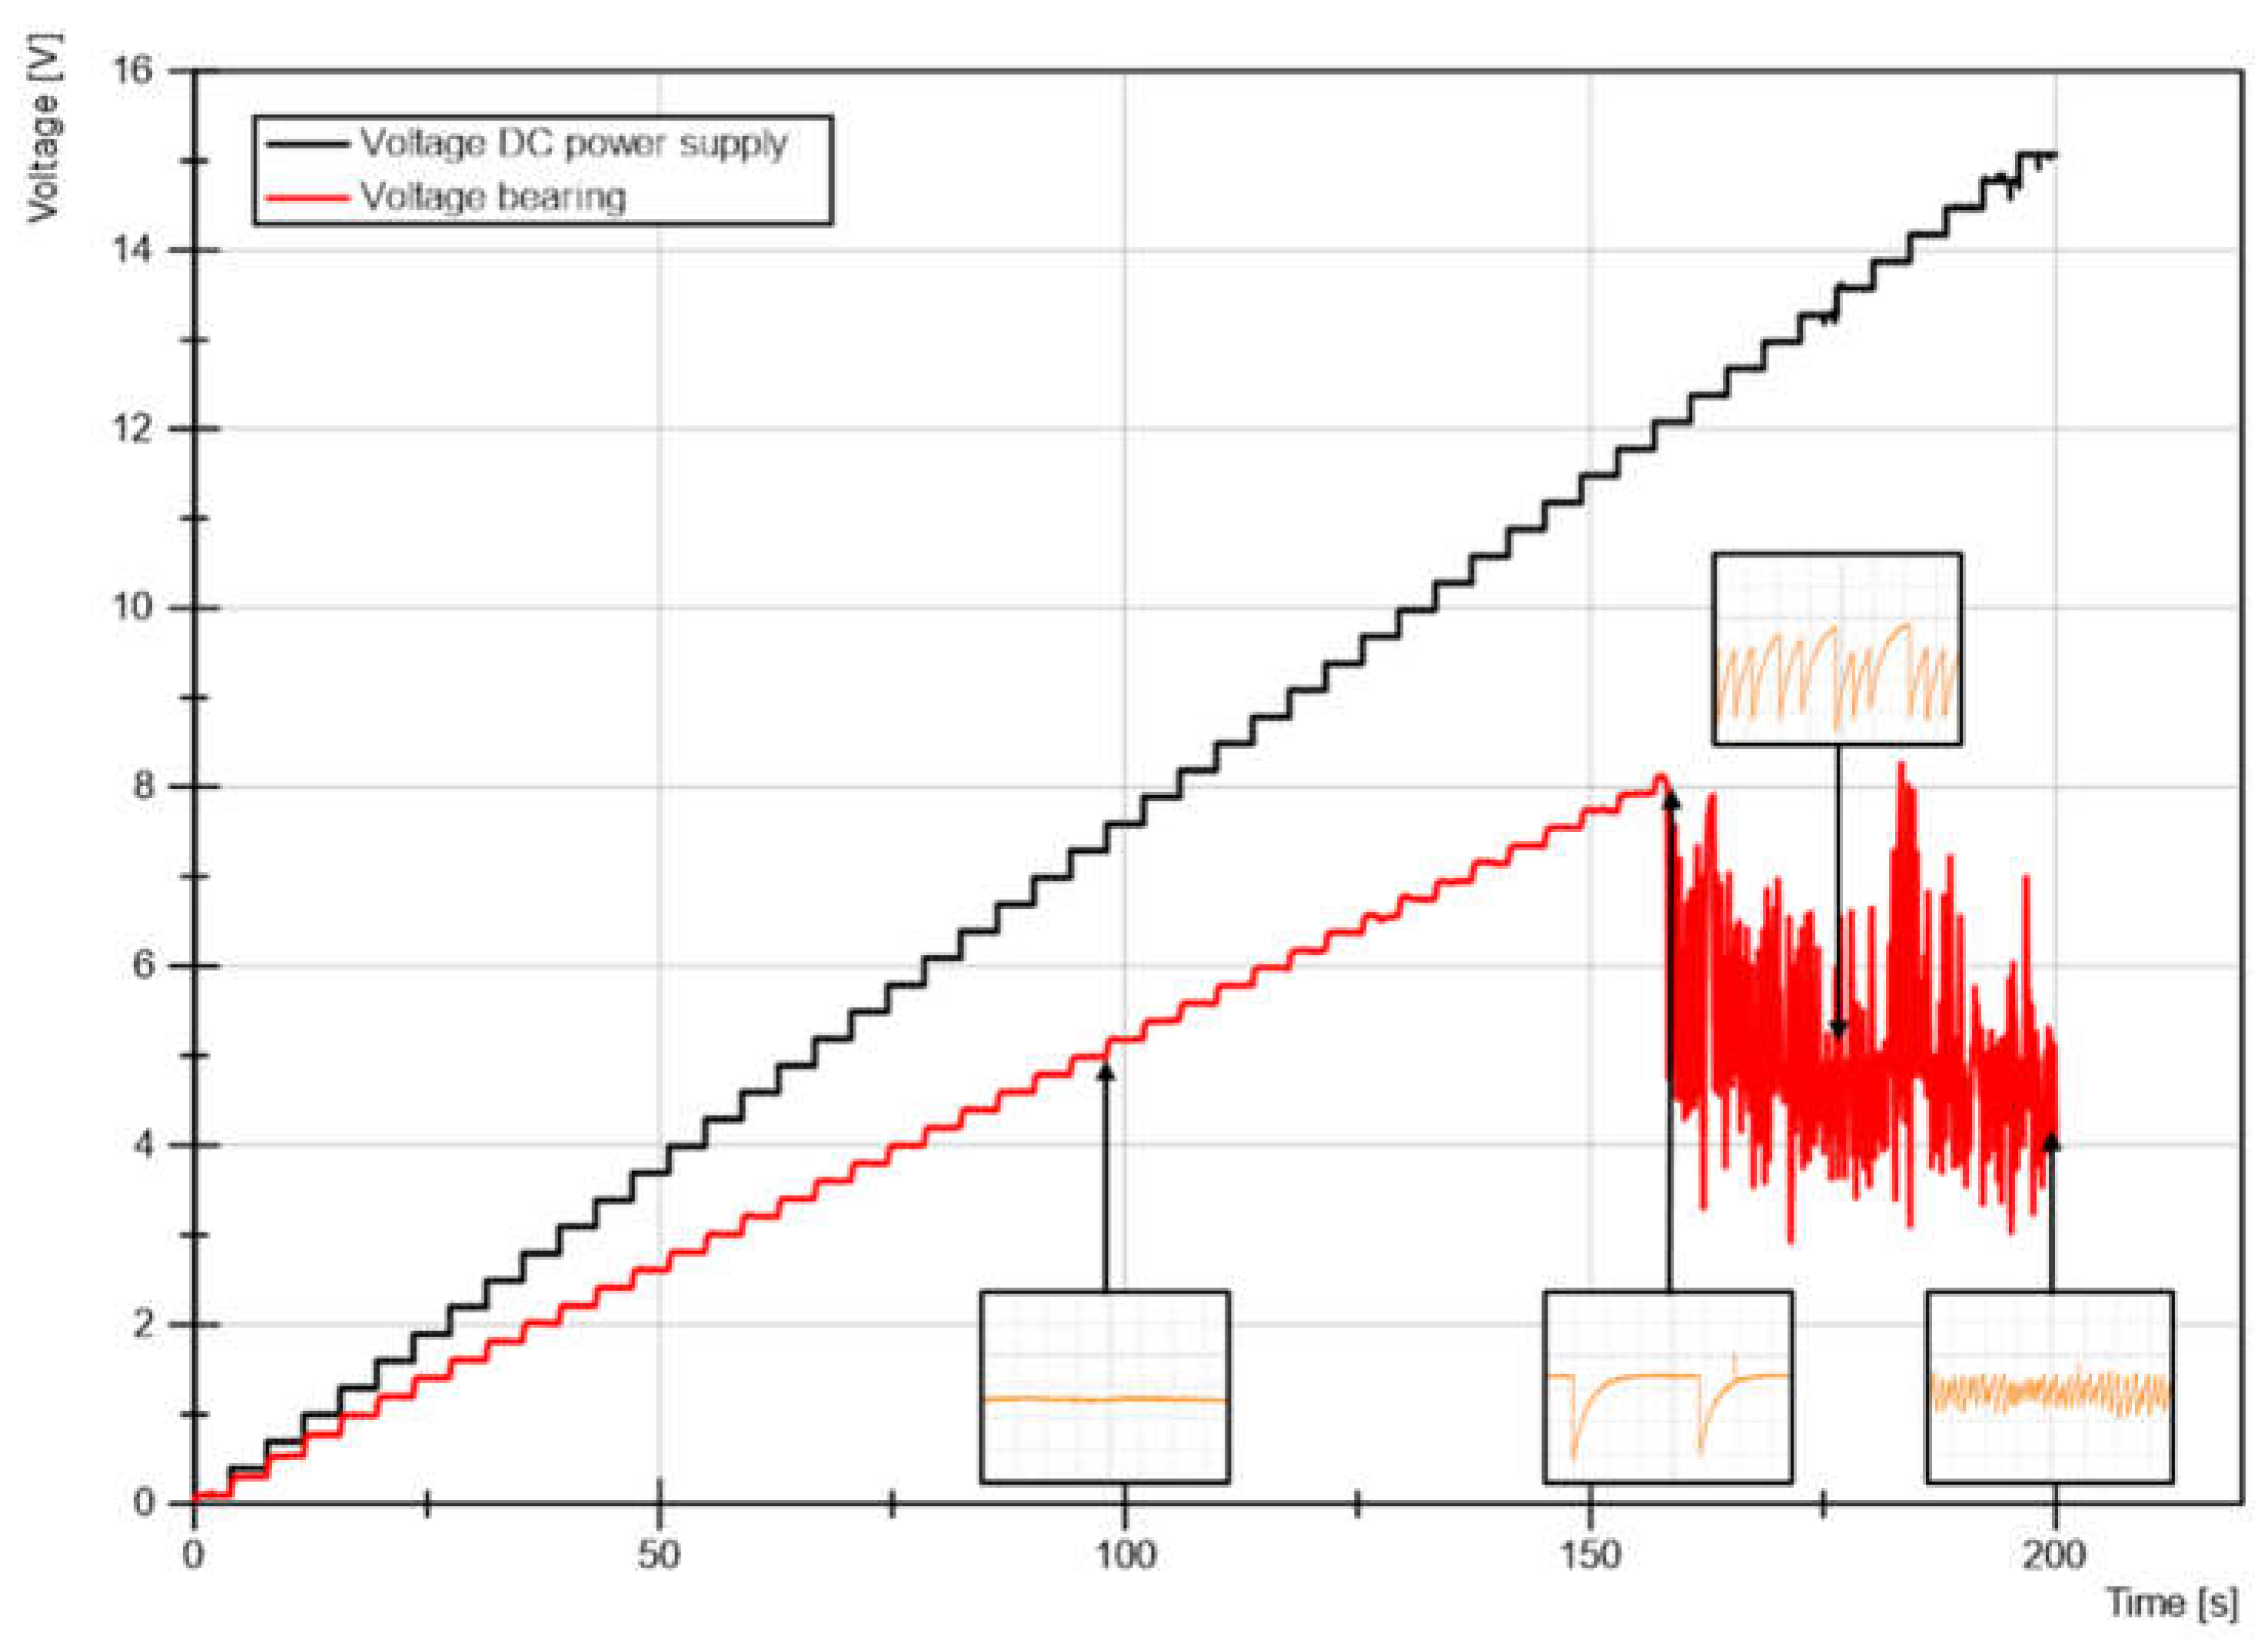
Figure 7.
A recording of the voltage present at the bearings applying 15 V.
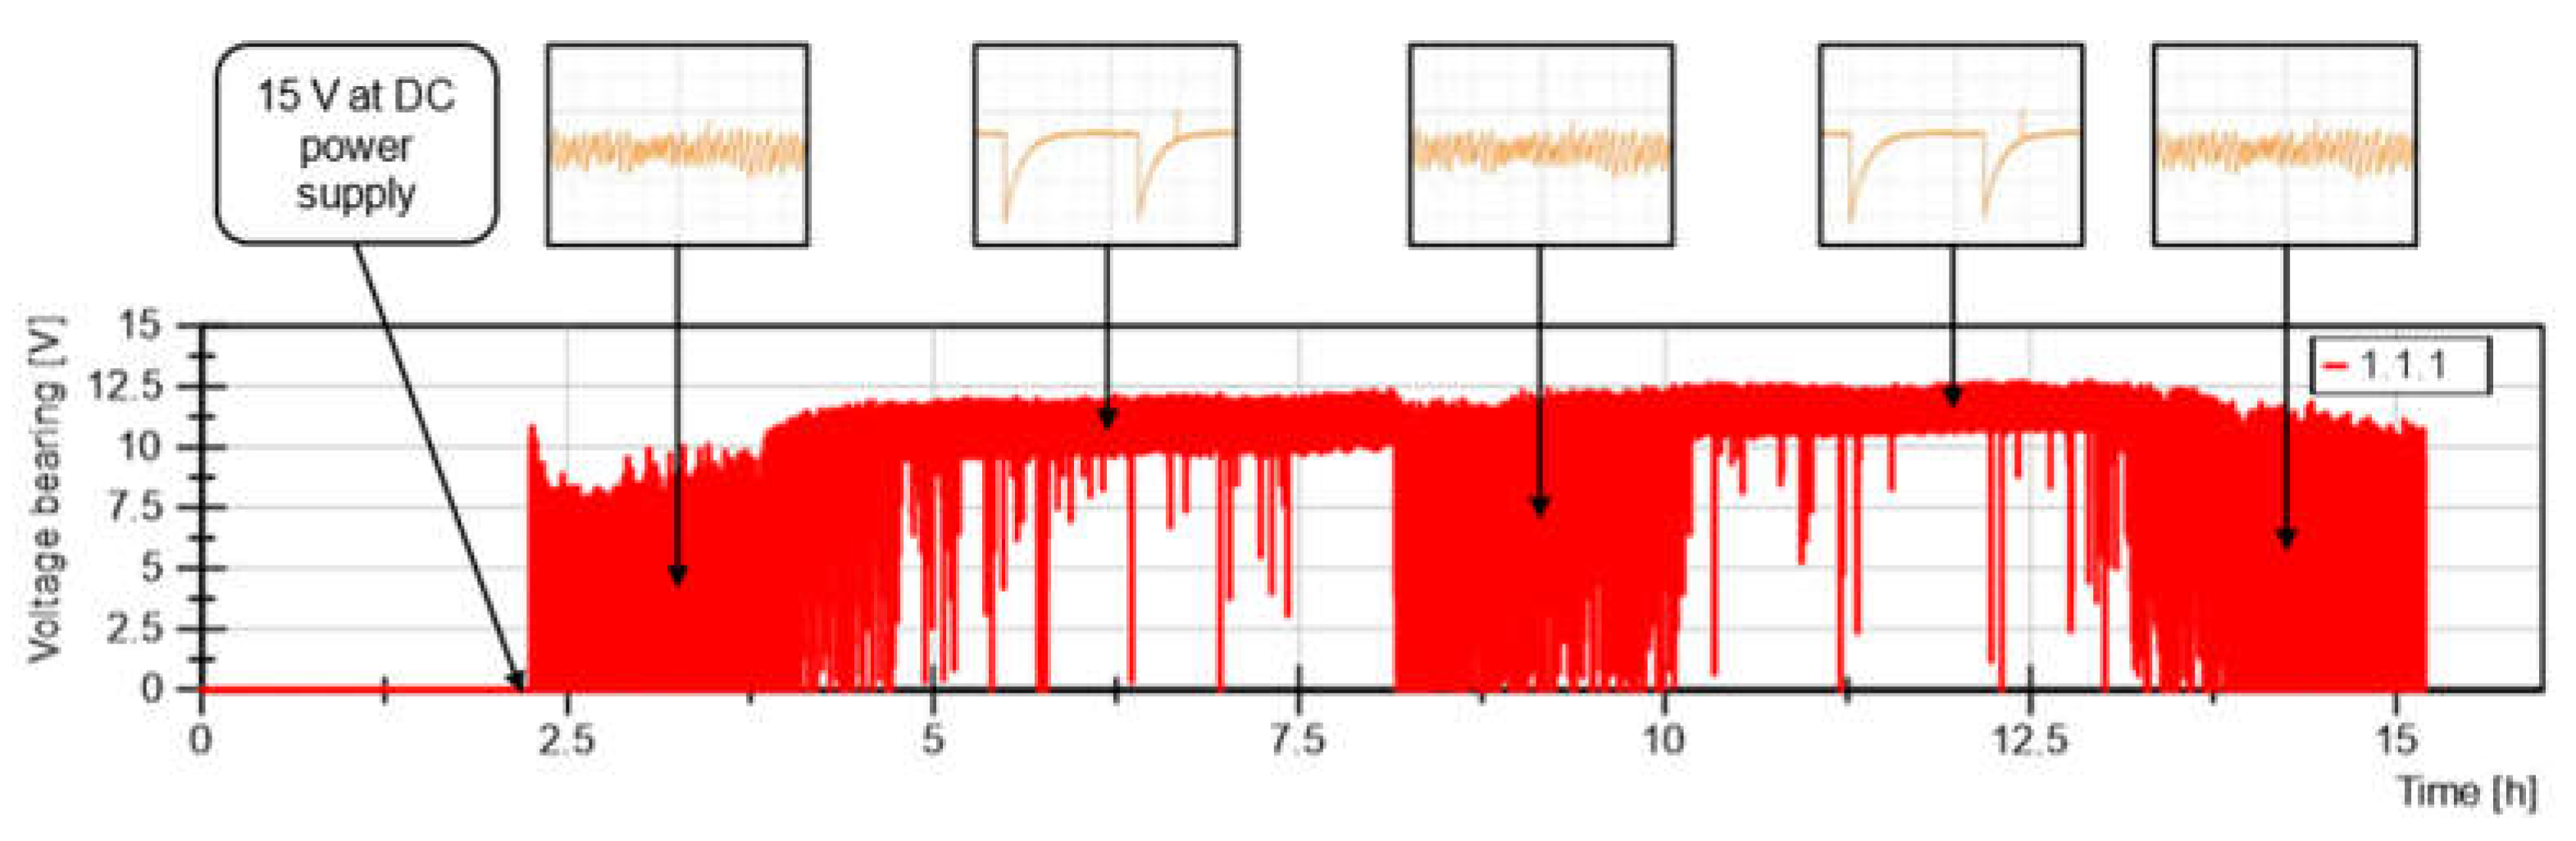
Figure 8.
Smoothening Procedure according to an Example of a Test Run.
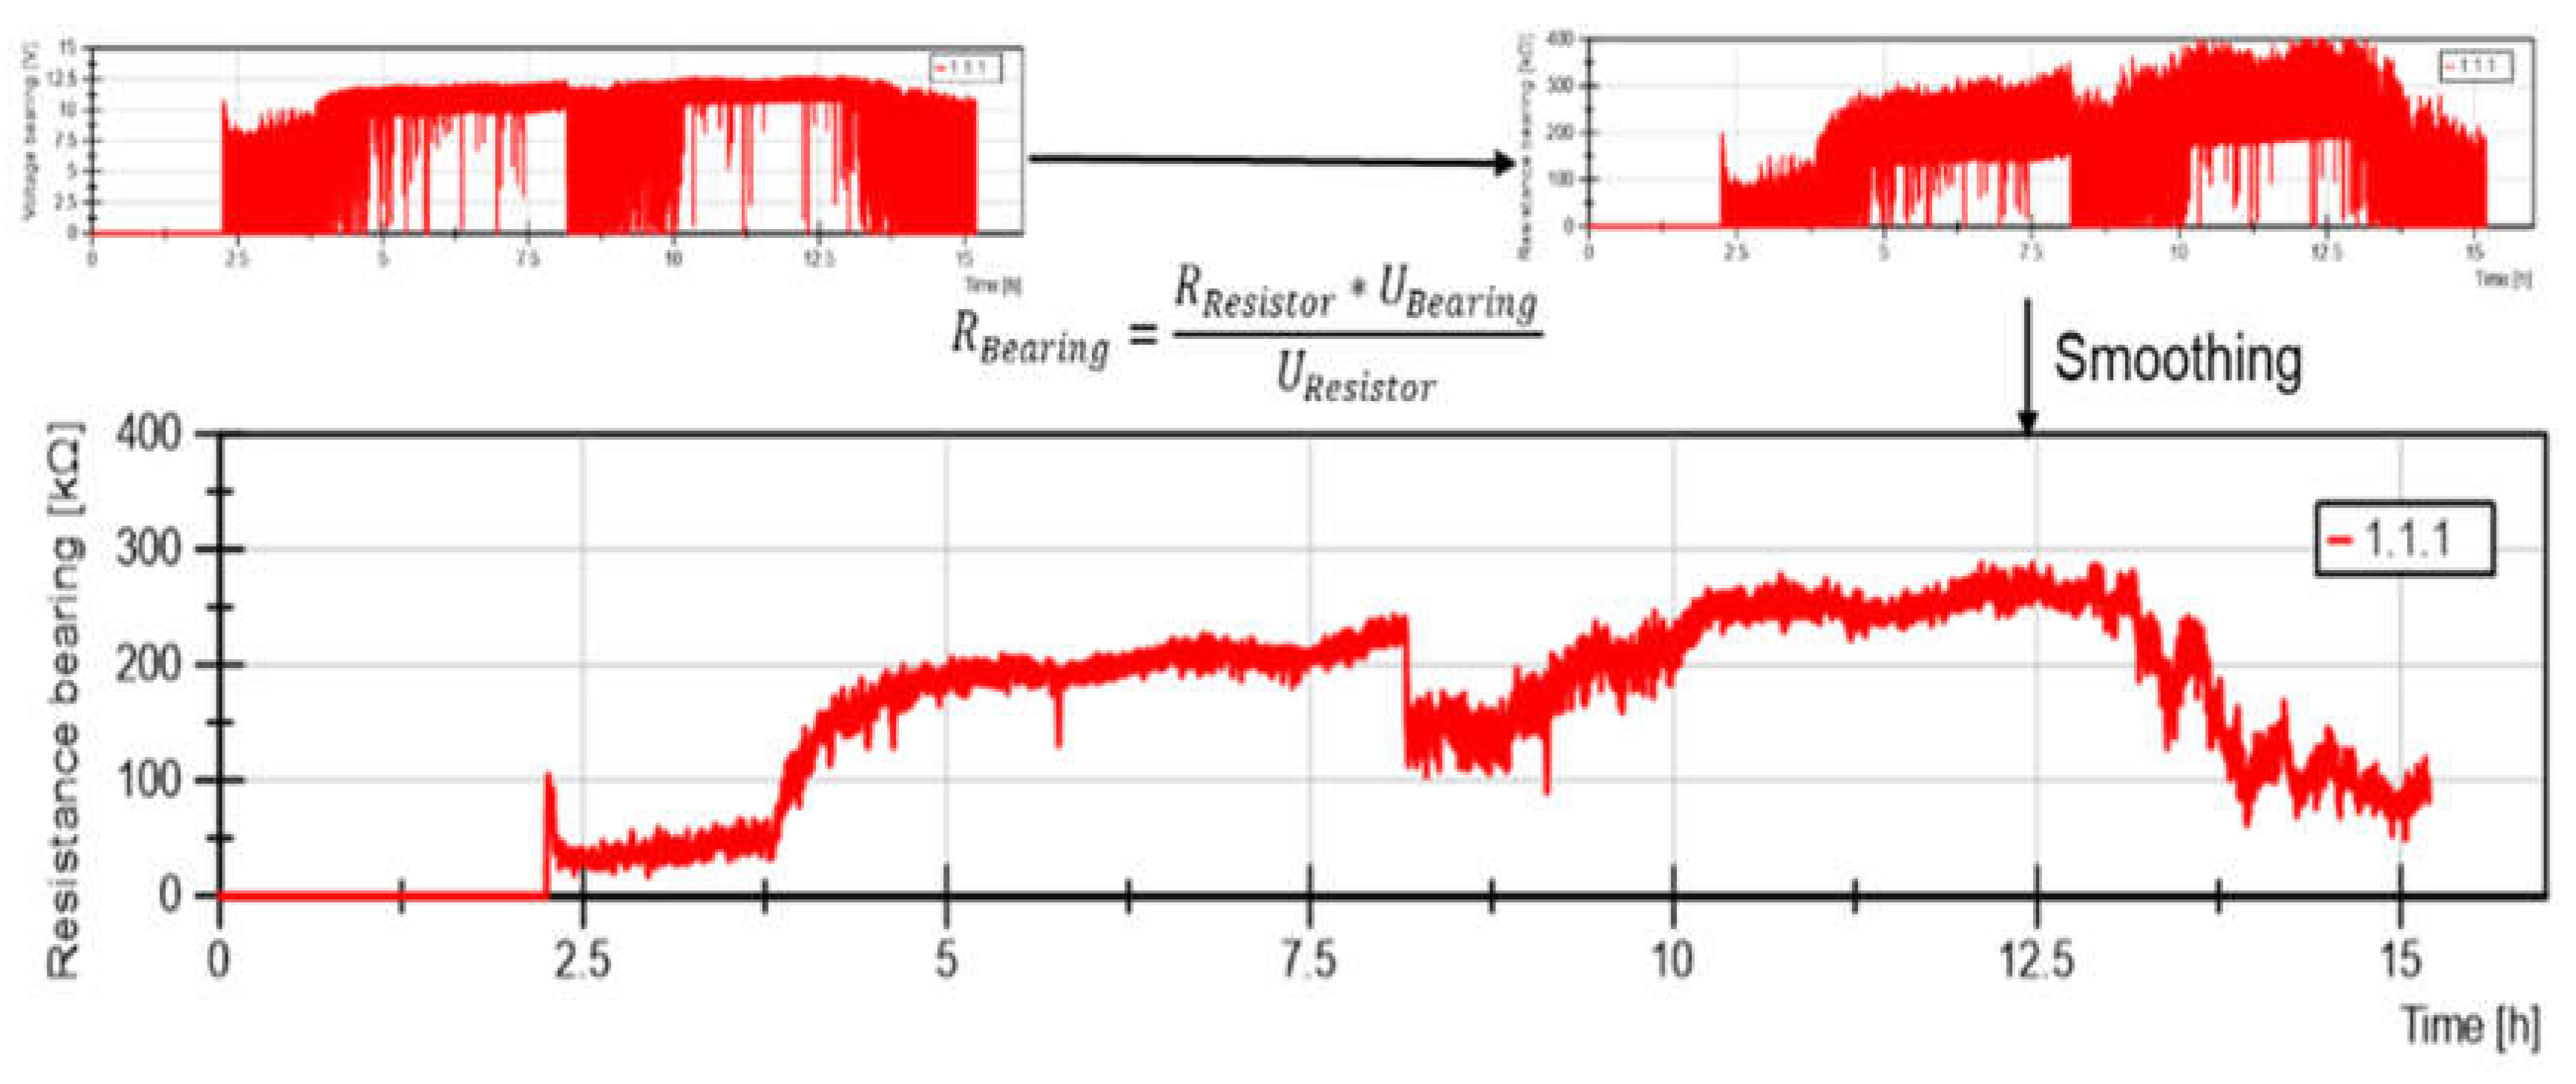
Figure 9.
Schematic Representation of disassembling the bearing.
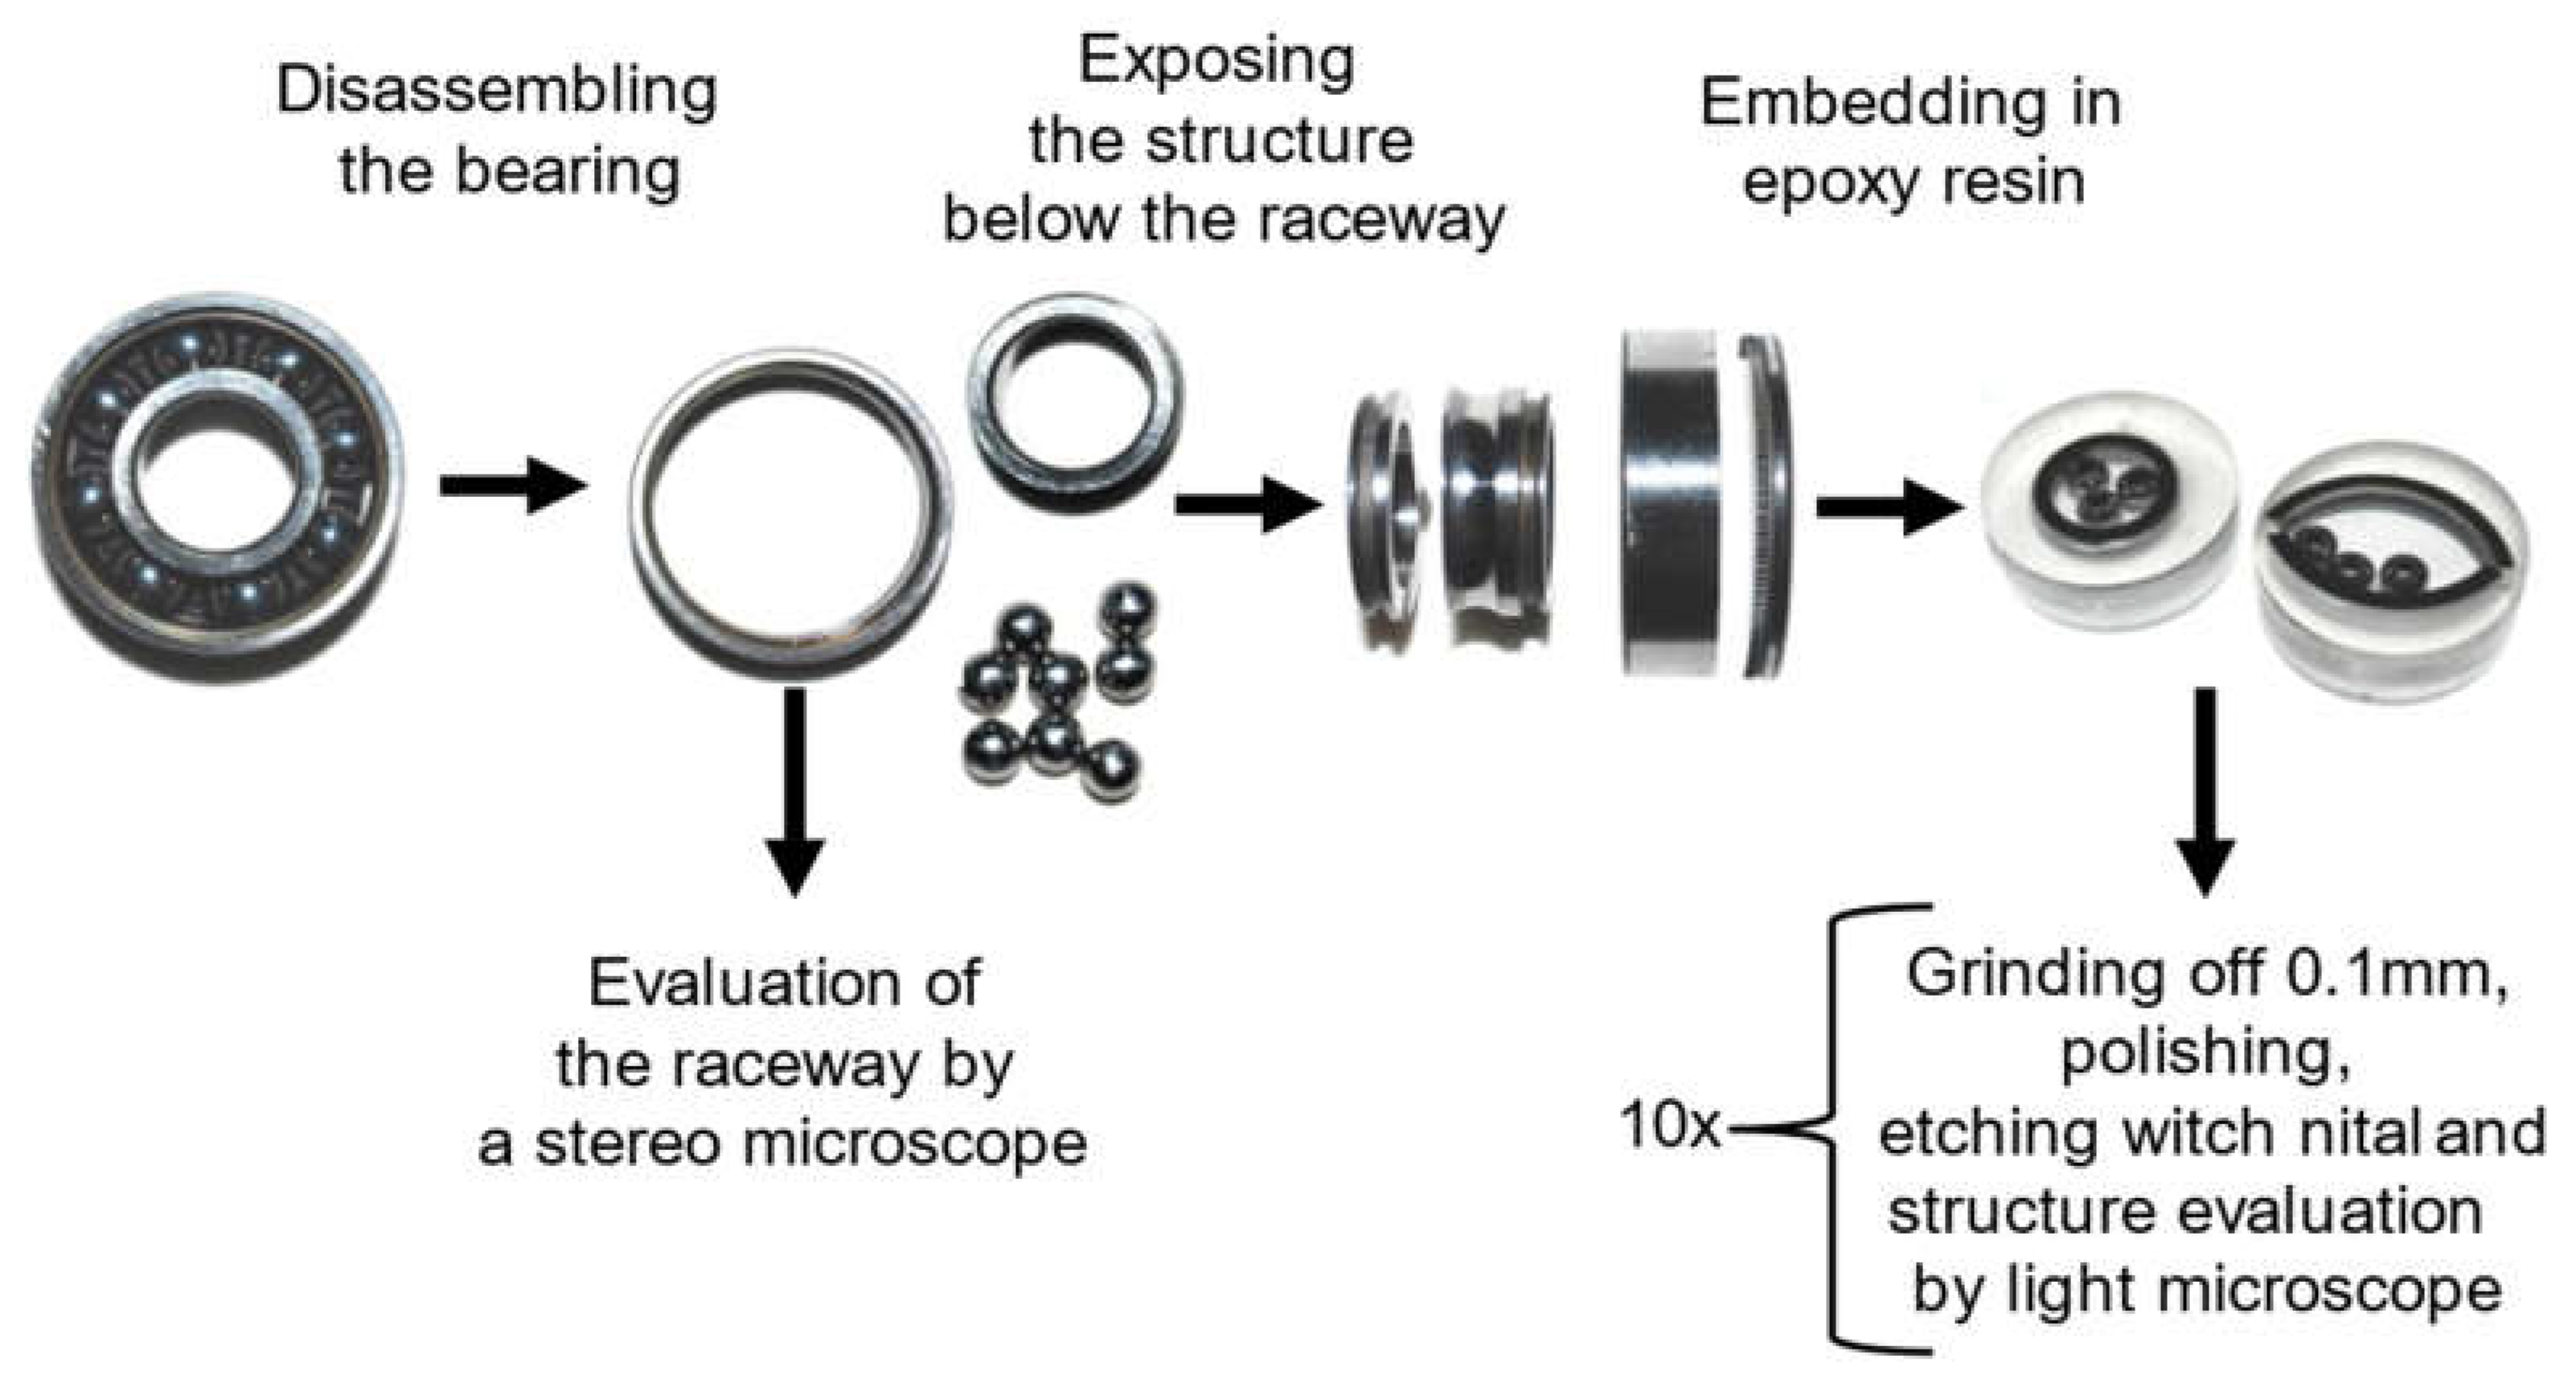
Figure 10.
New bearing raceway surface (left), after a test run without bearing failure (middle), after a bearing failure and spalling(right).
Figure 10.
New bearing raceway surface (left), after a test run without bearing failure (middle), after a bearing failure and spalling(right).
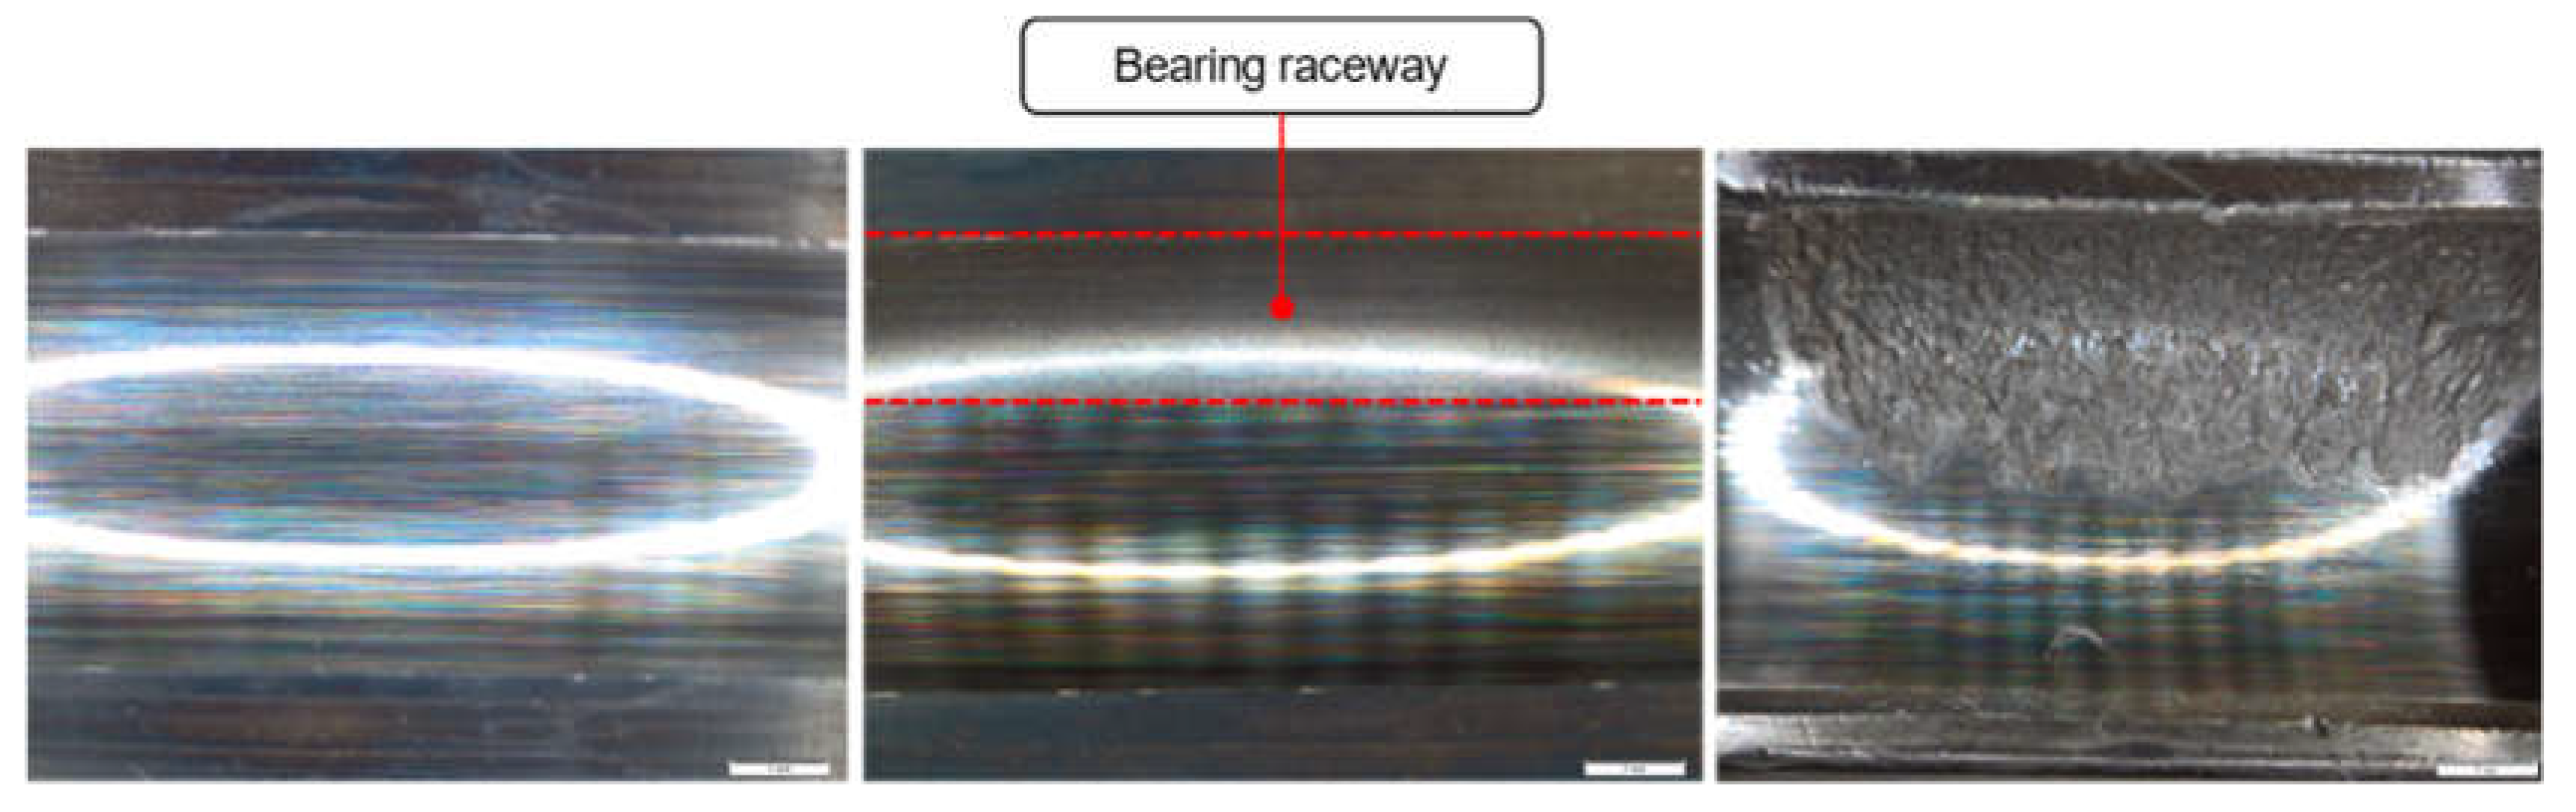
Figure 11.
Appearance of subsurface WEC features after etching with Nital.
Disclaimer/Publisher’s Note: The statements, opinions and data contained in all publications are solely those of the individual author(s) and contributor(s) and not of MDPI and/or the editor(s). MDPI and/or the editor(s) disclaim responsibility for any injury to people or property resulting from any ideas, methods, instructions or products referred to in the content. |
© 2024 by the authors. Licensee MDPI, Basel, Switzerland. This article is an open access article distributed under the terms and conditions of the Creative Commons Attribution (CC BY) license (http://creativecommons.org/licenses/by/4.0/).
Copyright: This open access article is published under a Creative Commons CC BY 4.0 license, which permit the free download, distribution, and reuse, provided that the author and preprint are cited in any reuse.


