
Submitted:
09 July 2024
Posted:
10 July 2024
You are already at the latest version
Abstract
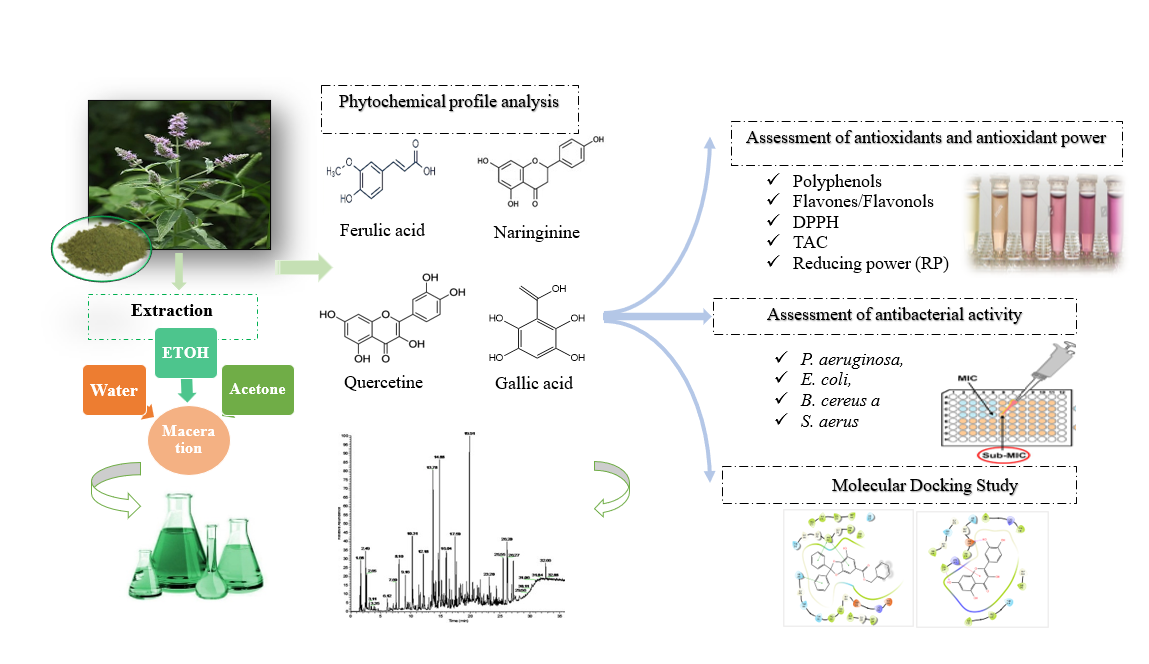
The main purpose of our research is the evaluation of the efficacity of solvent polarity on phenolic composition, as well as the antibacterial, and antioxidant activities of extract of Moroccan Mentha aquatica L., leaves. To attempt these objectives, the HPLC-DAD was used to identify the biomolecules. The total amount of phenolic and flavonoid content was determined using the Folin-Ciocalteu and aluminum trichloride processes as well as the DPPH, RP, and TAC tests were used to evaluate the antioxidant capabilities. In addition, by employing both in vitro and in silico analysis through the microdilution method, the minimum inhibitory concentration (MIC) and minimum bactericidal concentration (MBC) of the extracts were assessed against multidrug-resistant bacteria. Furthermore, the High-Performance Liquid Chromatography (HPLC) analysis indicated that all extracts of M. aquatica were abundant in noteworthy phytochemical compounds, especially gallic acid, vanillic acid, chlorobenzoic acid, quercetin, and kaempferol. Furthermore, the results indicated that the total phenolic content was higher in hydroethanolic extract (62.19 ± 1.19 mg GAE/g DW) in contrast to the acetonic and aqueous extracts (22.22 ± 0.64, and 22.44± 0.57 mg GAE/g DW) respectively. Similarly, the aqueous ethanol extract contained the greatest flavonoid concentration, with values of 29.15± 0.09 mg QE/g DW when compared with the other extracts. The seam extract poses excellent antioxidant power with an IC50 of 0.06 ± 0.00 mg/mL for the DPPH test, and lower RP with EC50 of 80± 0.00 µg/ml when compared with acetonic and aqueous extract (370± 0.00 and 460± 0.01 µg/mL) respectively. Moreover, the hydroethanolic extract has a high level of TAC 75.09± 2.00 mg EAA/g DW, followed by aqueous extract carrying a value of 28.53 ± 1.36 mg EAA/g DW. The antibacterial capacity is ranged between 0.78 ± 0.05 mg/mL and 12.60 ± 0.00 mg/L. The results of the in-silico study demonstrated that quercetin, vanillic acid, and naringenin components contribute to the antioxidant capability. While gallic acid, kaempferol, and quercetin components are attributed to the antibacterial capacity.
Keywords:
Mentha aquatica
; HPLC‐DAD analysis
; in‐silico approach
; solvent polarity
; antioxidant activity
; antibacterial activity
1. Introduction
Mentha is a distinguished genus of the Lamiaceae family. This genus comprised between 25 and 30 reported species of mint growing almost everywhere in the world [1]. It’s well recognized for its medicinal properties, owing to its widespread usage as an antimicrobial, biocide, anti-inflammatory, antiulcer, antiemetic, antidiabetic, antispasmodic, tonic, anti-allergic, and antihypertensive [2]. Likewise, the reported pharmacological and therapeutic benefits have been associated with distinct bioactive phytochemical components, including flavonoids, phenolic acid, carotenoids, tannins, fatty acids, saponins, terpenoids, and volatile compounds[3].
Mentha aquatica L., commonly known as water mint, is an annual herbaceous plant that is a member of the Lamiaceae family. It is distributed extensively across all continents (except in South America and Antarctica). In folk medicine traditions of several nations, is used to treat various diseases, such as respiratory problems cough, and ulcerative colitis [4]. It is taken as a tonic, used as a stimulant, digestive stomachic, carminative, relaxing, antispasmodic, sedative, and analgesic [5]. Solid research has proven some of M. aquatica's pharmacological characteristics, most notably insecticidal [6], antihemolytic [7], anti-inflammatory [3] antimicrobial [8], hepatoprotective [9], anticancer [10], gastroprotective effect [11], and antiemetic [5].
The extraction solvent is one of the key parameters influencing the effectiveness of extracting bioactive molecules from plant materials and their associated beneficial effects on health. Selecting the optimal solvent could maximize the rate of phytochemicals and antioxidants extracted [12]. For phytochemical extraction, acetone, water, ethanol, and a combination of these organic solvents with water are frequently utilized [13]. The solubility and bioactivities of chemical compounds are additionally suggested by the increasing solvent polarity from hexane to distilled water (hexane <chloroform<acetone < ethyl acetate < ethanol < distilled water).
Several prior reports have extracted bioactive chemicals from Mentha genus species using methanol, ethanol, chloroform, acetone, and water as the solvents[10,11]. To the best of our knowledge, no previous studies have been exploring how varying solvent polarities affect the bioactive properties and extraction efficiency of antioxidant compounds from the leaves of Moroccan M. aquatica. The present study attempts to explore the efficacity of solvent polarities (acetone, ethanol, and distilled water) on the extraction of bioactive molecules, antioxidant potential, and antibacterial activity of M. aquatica leaves, in order to determine which solvent is best for extracting more bioactive composites and distinguishing M. aquatica's antioxidant and antibacterial capability.
2. Results and Discussion
2.1. Preliminary Solvent Secerning
Selecting an appropriate solvent is the pivotal step in phytochemical research, especially when isolating phenolic compounds and other beneficial constituents from vegetables, fruits, and plants [15]. Overall, the efficiency of phenolic component extraction is affected by various factors, including time of extraction, solvent polarity, and temperature. The results of the preliminary screening solvent extracts for the extraction of total phenolic content and antioxidant ability are displayed in (Figure 1 A, and B), and demonstrated that all three solvents (hexane, chloroform, and ethyl acetate) exhibited little effect on antioxidant activity, reducing power, as well as total antioxidant capacity. The seam three solvent showed a lower level of flavonoids and phenolic amounts. Additionally, the amount of phenolic and flavonoid content ranged between 2.56 ± 0.43 to 62.198±1.65 mg GAE/g DW, and 1.57± 0.20 to 29.157± 0.07 mg QE/g DW respectively. It must be stated that the ETOH 70% extract boosted to extract a great level of TPC and TFC. The results of the preliminary testing indicate that the potent antioxidant power and the high phenolic and flavonoid concentrations of M. aquatica were considerably related to the solvent polarity which was confirmed by Tourabi et al [15]. Based on the preliminary screening results, we chose the stronger extracts (aqueous, acetonic, and ETOH 70%) to test for phenolic composition and antibacterial activity. The next part of this work will present and discuss the outcomes of this preliminary screening.
2.2. Solvent Polarity Effect on the Extraction Yield
The outcomes of the solvent extraction, including acetone, ETOH 70 %, and distilled water were displayed in (Figure 2) and indicated that ETOH 70% had the high extraction yield followed by aqueous extract with a rate of 12 %, however, the acetonic extract showed the lower amount of extraction yield with a value of 9%.
Research findings suggest a positive relationship between the polarity of solvents and their effectiveness in extracting compounds from plant materials [16]. In addition, the solvent's polarity significantly influences the amount of extract obtained it was found that the extract yield was higher in polar solvents (water and aqueous ethanol) than in nonpolar solvents (acetone).
2.3. HPLC–DAD expLoration of Individual Phenolic Composition
The findings of the High-performance Liquid Chromatography are displayed in Table 1 for the three solvent extracts (water, ETOH 70%, and acetone). In total, six compounds were discovered in our samples; four phenolic acids (gallic acid, vanillic acid, and chlorobenzoic acid) as well as three flavonoids (quercetin, naringenin, and kaempferol). The acetonic extract is characterized by a low amount of phenolic compounds. Regarding aqueous ethanol extract, four phenolic components; two flavonoids and two phenolic acids were detected. The great concentration is observed for chlorobenzoic acid at 5.61 mg/g DW, followed by naringenin at 2.45 mg/g DW, while kaempferol and gallic acid were detected in low concentrations (Figure 3b). Thus, the aqueous extract comprised four phenolic compounds, which include gallic acid at 1.10 mg/g DW, followed by vanillic acid at a concentration of 1.43 mg/g DW while the flavonoid compounds were also detected in low concentrations (Figure 3 a). The ethanol 70% enhances the extraction of phenolic and flavonoid components of M. aquatica. This could result from the synergistic effects of binary solvent extraction (ethanol/water) on the extraction of flavonoids and phenol components. Our findings support those of Teodor et al [17] and Park et al[3], who revealed that the most recognized components of M. aquatica are gallic, vanillic acid, kaempferol, naringenin, and quercetin, which are responsible for their biological properties.
Our data highlights that the different solvents can extract diverse chemicals from the same source material due to their particular chemical characteristics such as polarity, solubility, and affinity for specific components.
2.4. Total Phenolic and Flavonoid Content
Phenolic compounds are among the most widespread and frequent groups of plant metabolites including alkaloids, terpenoids, and phenolic compounds, of which (phenolic acids, coumarins, simple and condensed tannins, and flavonoids) are widely used for therapeutic and dietary applications [18]. In addition, the phenolic compound may exhibit biologically pertinent activities including, antioxidant, antimicrobial, anti-inflammatory anti-infectious, and antiproliferative activities [19]. The TPC and TFC of samples are displayed in (Figure 3 A, B). The aqueous ethanol extract had a high level of TPC with a rate of 62.19±1.19 mg GAE/g DW, while the aqueous and acetonic extracts come next with a value of 22.44 ± 0.57 and 22.22 ± 0.64 mg GAE/g DW respectively (Figure 4 A). Considering the outcome of this study, suggests that polar solvents maximize the extraction of phenolic compounds more than non-polar solvents. Our findings are higher than those signaled by Abbas and colleagues [20]. In contrast, Dorman et al found that the aqueous extract had a high level of phenolic content with a rate of 152.5 ± 0.00 mg GAE/g DW [21]. Other research reported by Hoai et al, found that the acetone 50% extract illustrates a high amount of TPC with a rate of 120.92 mg GAE/g DW [22].
Concerning total flavonoid rate, the outcome is presented in (Figure 4B) and indicates that the aqueous ethanol extract (ETOH 70%) extracts a maximum of flavonoid content with a rate of 29.15± 0.09 mg QE/g DW, while the aqueous and acetonic extracts respectively with a rate of (10.93± 0.62 and 10.17± 0.07 mg QE/g DW). These values were in arrangement with those discovered by Tourabi et al [15] and Abbas et al [20].
2.5. Antioxidant Activity
Three distinct techniques were used to assess the antioxidant effects, including the DPPH test, reducing power test, and total antioxidant capacity, and results are displayed in Figures 5A, B, and C. Our results showed significant variability between the different extracts, which the aqueous ethanol exhibited a potent antiradical activity and reducing power with the stronger IC50= 0.06±0.19 mg/mL for radical DPPH and the heigh EC50 = 0.08±0.01 mg/mL for RP test, followed by acetonic extract with IC50= 0.19 and EC50= 0.37 ±0.02 (Figure 5 A and B). Similarly, the aqueous ethanol extract showed a high total antioxidant capacity of 75.09 ± 2.00 mg AAE/g DW, following the aqueous extract with a rate of 28.53 ± 1.00 mg AAE/g DW, however, the acetonic extract exhibited a less total antioxidant capacity of 21.11± 0.13 mg AAE/g DW (Figure 5 C). This outcome is corroborated with those indicated by Conforti et al who reported that the hydroethanolic extract has a high IC50 value of the scavenging activity of 29 μg/mL [23], greater compared to the cited by Thi et al [24] which found that the ethanolic and aqueous extract exhibited the lower antioxidant ability with IC50 value of 306.97 ± 13.78 and 142.98 ± 19.93 μg/mL respectively. The obtained result in this work suggests that the high levels of total phenolic and flavonoid content are observed in the aqueous ethanol extract which strongly contributed to their potent antioxidant properties. The result of the ANOVA test indicates that a statistically significant difference (p < 0.05) was noted among the three extraction solvents for the M. aquatica leaf. Our results agree with those of other studies, which stated that the solvents with a superior polarity namely water, ethanol, methanol, and acetone are mostly used to maximize the extraction of antioxidant components [15,25]. Indeed, the variability in antioxidant potential is achieved by in vitro synergism between phytochemical components. Hajimehdithepoor and coworkers reported the synergetic antioxidant capability of the mixture of quercetin, gallic acid, caffeic acid, and the combination of quercetin, gallic acid, and rutin using FRAP assay [26]. Additionally, the tested extract showed powerful antioxidant capacity that may be associated with their antioxidant constituents notably phenolic acids, flavonoids, and terpenoids, especially any potential interactions among them
2.6. Assessment of the Antibacterial Capacity
The results presented in Table 2 highlight the potent antibacterial properties of the solvent extract derived from M. aquatica across a spectrum of bacterial strains including E. coli, P. aeruginosa, B. cereus, and S. aureus. Especially, the acetonic extract exhibited high inhibitory concentration against S. aureus with MIC= 0.78±0.05 mg/mL and MBC= 1.56±0.33 mg/mL and against B. cereus bacteria with MIC=1.56±0.11 mg/mL and MBC=0.78±0.25 mg/mL. Likewise, acetone extract also has great activity against E. coli with MIC=4.68±0.0 mg/mL. Furthermore, aqueous ethanol exhibits potent inhibitory activity against B. cereus with a MIC=1.78±0.55 mg/mL. It is important to note that the acetonic and ethanolic extracts had a more potent antibacterial efficiency stronger so as for fighting gram-positive bacteria than gram-negative ones. In the same context, Tourabi et al [15] stated that the acetonic extract of M. longifolia expressed the ultimate antibacterial activity, especially against S. aureus and B. cereus. Ferhat et al [27], examined the antibacterial capacity of chloroform and methanolic extract of M. aquatica aerial part against several multi-resistance bacteria, and The findings indicated that the methanolic extract exhibited a potent antibacterial ability with a MIC value of 128 ± 1.30 µg/mL.
The examined extracts except aqueous ethanol showed that the ratio of MBC to MIC (MBC/MIC) was less than 4, indicating an effective bactericidal effect on the strains of B. cereus and S. aureus. This proposal is based on the observation that compounds with an MBC/MIC ratio of 4 or less are likely to induce bactericidal action, while those with a ratio greater than 4 are more likely to exert bacteriostatic effect [28].
According to the results of our experimental work, Gram-positive bacteria responded to our extracts more readily than Gram-negative strains. The complex architecture of the double membrane found in gram-negative microbes which consists of a lipoprotein and a lipopolysaccharide membrane (LPS) that is a component of the bacterial cell envelope, may be the reason for their reduced sensitivity [29]. Furthermore, the powerful antibacterial capacity of M. aquatica leaf extracts is explained by their rich in natural bioactive molecules, namely phenolic acids such as gallic acid, vanillic acid, and chlorobenzoic acid, as well as flavonoids composites namely quercetin, naringenin, and kaempferol (Table 1). Indeed, prior research revealed higher antibacterial efficiency of gallic acid, vanillic acid, quercetin, kaempferol, and naringenin [30,31,32]. This activity corresponds to their capacity to penetrate the bacterial cytoplasm and transit through the bacterial wall of strains [33].
As previously mentioned, phenolic molecules have been successfully isolated from botanical matter using a range of solvent mixtures. The most frequently utilized solvents are methanol, ethanol, water, and acetone, as well as their aqueous combinations [34]. While acetone dissolves both hydrophilic and lipophilic components, it may be used to extract antimicrobial substances, and this is responsible for the considerable antibacterial influence shown in our experiment [35]. In the seam context, acetonic and aqueous ethanol extracts were the great extractor of molecules with a range spectrum of biological properties notably hydroxycinnamic acid components such as caffeic acid, sinapinic acid, ferulic acid, vanillic acid as well as hydroxybenzoic acids which include gallic acid and chlorobenzoic acid and flavonoids compounds [36]. These molecules have been confirmed to exhibit the strongest antibacterial ability against multiresistant bacteria via several mechanisms of action, notably focusing on bacterial compounds called metabolites walls of cells, membrane destabilization, lipid membranes, receptors in membranes, ion channels, enzyme inhibition, inhibition of ATP production and the development of biofilms. Some combinations of polyphenols and antibiotics have also been shown to have synergistic effects [33]. Campos et al demonstrated that gallic acid alters the hydrophilic nature of pathogens (how well they interact with the surface of both Gram-positive and Gram-negative bacteria), which may lead to an acidification of their cytoplasm through an increase in K+ release and the induction of protein denaturation. These effects can affect the flexibility of the cytoplasmic membrane, trigger the ejection of intracellular materials, and destruction of membrane cells [37]. According to other experiments, the flavonols kaempferol and quercetin have shown strong antibacterial activity against S. aureus, with reported minimum inhibitory concentrations that are as low as 7.8 µg/mL and 1.95 µg/mL, respectively [38,39]. Naringenin has displayed antibacterial efficacy against many strains of S. aureus with low levels of inhibition that vary from 256 to 512 µg/mL [40].
2.7. Molecular Docking Assessment
NADPH oxidase plays a pivotal role in producing reactive oxygen species (ROS), with its activity being tightly regulated within cells. Although ROS generated by NADPH oxidase is essential for pathogen defense and cellular signaling, an overproduction can result in oxidative stress, contributing to various diseases. Inhibiting NADPH oxidase represents a promising strategy for enhancing antioxidant activity and protecting against diseases related to oxidative stress. By reducing ROS production, enhancing cellular antioxidant defenses, and decreasing chronic inflammation, NADPH oxidase inhibitors may be crucial in maintaining cellular health and preventing disease progression.
In our in-silico study, quercetin, vanillic acid, and chlorobenzoic contained the most active compounds against NADPH oxidase with glide scores of acids -6.587, -6.120, and -6.084 Kcal/mol (Table 2).
In antibacterial activity, gallic acid, ferulic acid, and chlorobenzoic acid were the most active against beta-ketoacyl- [acyl carrier protein] synthase from E. coli with a glide score of -7.240, -6.558, and -6.496 Kcal/mol. Furthermore, chlorobenzoic acid, vanillic acid, and ferulic were almost active against staphylococcus aureus nucleoside diphosphate kinase with glide scores of -8.448, -8.010, and -7.933 kcal/mol (Table 2).
Around the NADPH oxidase active location, quercetin has created two hydrogen bonds with the residues VAL 214 and ASP 179 and a single Pi cation bond with residue LYS 213.
However, gallic acid established three Pi-Pi stacking bonds with residues PHE 392 and HIE 298 in the active site of beta-ketoacyl - [acyl carrier protein] synthase from Escherichia coli. During its interaction in the active site of Staphylococcus aureus nucleoside diphosphate kinase, chlorobenzoic acid developed a salt bridge with the MG 159 residue (Figure 6 and Figure 7).
3. Statistical analysis
3.1. Correlation Analysis
To determine any relationship between the many factors under study, a correlation test is considered to be an effective tool. In the current examination, we assessed the correlation between antioxidant content and antibacterial activities as well as the correlation between antioxidant properties and amount employing the mean antioxidant value of all solvent extracts tested. The findings of the correlation assay are displayed in Figure 8. There was a substantial positive correlation (r2=1 and r2=0.99) found between the levels of flavonoids, phenolics, and total antioxidant capacity (TAC). However, phenolic compounds flavonoids, and antioxidant capability as measured by DPPH, and RP assays were found to be strongly negatively correlated. Furthermore, there was little correlation found between the antibacterial efficiency of the M. aquatica extracts and the polyphenolic and flavonoid content. The obtained data were in line with those mentioned by several reports that indicate the potent correlation between antioxidant activity and phenolic compounds as well as antibacterial ability [15,41].
3.2. Polar Heatmap Analysis
Figure 9 shows the Polar Heatmap representation based on the data of the correlation test between individual components, antioxidant, and antibacterial activity. Lower amounts were shown in yellow color, while higher amounts were shown in black color. Regrouping various samples according to similarities is made harder by the polar heatmap analysis. It is noticed that the solvent extract has been separated into two groups. One was comprised of ETOH 70 % extract, and the second group was composed of aqueous and acetonic extracts. Our polar heatmap also indicated the correlation between individual phenolic components, total phenolic, flavonoid content, antioxidants, and antibacterial activities.
3.3. Principal Component Analysis (PCA)
The principal component analysis (PCA) was applied to analyzing the prior collected findings, and Figures 7 A and B show the main outcomes. Indeed, Figure 10 (A) displays the main component analysis including TPC, TFC contents, individual phenolic compounds, and antioxidant potency of the solvent extracts. The key finding was that PC1 and PC2 adequately represented all of the chosen variables, accounting for 100% of the variance. The PC1 versus PC2 score plot shows a statistically significant positive correlation between content on TPC, TFC, and TAC, as well as between kaempferol, naringenin, and chlorobenzoic acid. This suggests that the extracts with the greatest antioxidant capacity also contained the greatest amount of TPC, TFC, and specific phenolic components. It was discovered that these variables had a negative relationship with acetone and water and a positive correlation with the hydroethanolic extraction solvents. Furthermore, the total phenolic and flavonoid content is adversely correlated with the DPPH and RP tests.
The PCA for antibacterial individual phenolic compounds of the examined extracts is displayed in Figure 10 (B), where PC1 and PC2 account for 100% of the variance. The score plot of PC1 versus PC2 demonstrates a statistically significant positive correlation across E. coli, P. aeruginosa, B. cereus, naringenin, vanillic acid, and gallic acid proving that the extracts possessing the greatest level of phenolic composites also had the highest antibacterial capacity. These factors had a positive relationship with water and an adverse correlation with EtOH 70% and acetone extraction solvents.
4. Material and Methods
4.1. Botanical Material
The leaves of M. aquatica were collected at Merja Zerga (or Moulay Bousselham lagoon) in June 2021 and then prepared into herbarium samples. Professor Amina BARI, a botanist from Sidi Mohamed Ben Abdellah University's Department of Biology, confirmed the following determinations about these specimens. The voucher specimen, with code 002MAMZ2121, has been stored in the faculty herbarium.
4.2. Preparation of Extracts
The present investigation employed diverse solvents with varying polarity to generate the varied extracts, and the extraction procedure was executed in concordance with Tourabi et al.,[15]. In summary, 10 milliliters of each selected solvent (hexane chloroform, ethyl acetate, acetone, hydroethanolic 70% v/v, and distilled water) were combined with one gram of dried plant powder and afterward macerated during seven days with frequent stirring at the ambient temperature. After the extracts had been purified of impurities using a Whatman N°1 filter, they were concentrated at 40 °C in a rotating vacuum evaporator. Before being used, the final crude extracts were obtained and kept in a freezer at -20 °C.
4.3. Estimating the Yield of Extraction
The obtained filtrate was condensed employing a rotating evaporator under a vacuum (BUCHI Rotavapor R200) at 40 °C, to obtain crude extract. Additionally, each extract's yield was estimated, expressed as a percentage, and calculated using the following method.
Y extract %: extraction yield presented in percentage; Wext: Weight of dry extract; Wplant: Weight of dry plant.
4.4. Identification of Individual Phenolic Components using High-Performance Liquid Chromatography Coupled with a Diode Array Detector (HPLC-DAD)
Liquid chromatography was used to determine and characterize the solvent extract of M. aquatica leaf. A Thermo Scientific HPLC equipment and a MOS-1 HYPERSIL 250 4.6 mm SS Exsil ODS 5 m analytical column were deployed for assessment. In gradient mode, a division was completed by applying two solvents, A (water) and C (acetonitrile). The gradient of elution appeared like this: 80% A, 20% C for one minute, 60% A, 40% C for 2.5 minutes, and 80% A, 20% C for four minutes. A 5 μL volume of injection was employed, and a 1 mL/min flow rate was maintained. By comparing their retention durations and UV spectra against standard profiles, the polyphenolic components namely, ferulic acid, gallic acid, vanillic acid, kaempferol, quercetin, and naringenin were determined. [15].
4.5. Assessment of Total Phenolic Content
The total phenolic amount was determined in accordance with the Tourabi et al. protocol using the Folin Ciocalteu procedure [42]. Gallic acid, at concentrations ranging from 0.016 to 2 mg/mL, provided a point of reference to establish the standard curve (R2 = 0.996). The total phenolic content (TPC) results were then presented as milligrams of gallic acid equivalent per gram of dry plant weight (mg GAE/g DW).
4.6. Assessment of Total Flavonoid Content
The total amount of flavonoid (TFC) was determined by using the colorimetric technique outlined by Tourabi et al., [42]. The standard curve was obtained with quercetin (0.008–1.00 mg/mL; R2 = 0.994), and the TFC data were given in (mg QE/g DW).
4.7. In Vitro Antioxidant Capabilities
Three different prototypes were applied to determine the antioxidant capacity of the solvent extract of M. aquatica leaf: The total antioxidant capacity (TAC), the reducing power assay (RP), and the 2,2-Diphenyl-1-picrylhydrazyl radical (DPPH•) [1]. All test results were measured using a spectrophotometer made by PerkinElmer Lambda 40.
The inhibitory concentration (IC50) was determined by calculating the percentage of the inhibition curve using BHT as the positive control. The values of IC50 were expressed in mg/mL.
The following formula illustrates the calculation of DPPH radical activity in % of inhibition.
where PI: Percentage of inhibition; Acontrol: Absorbance of control; Asample: Absorbance of sample
PI (%) = [(Acontrol - Asample| A control) × 100]
Ascorbic acid provided the reference for the reducing power test. Using the absorbance graph (Y = ax + b; Y = 0.5), all results were shown as EC50 (Half maximum effective concentration). The values of EC50 were expressed in μg/mL.
Ascorbic acid is employed as a standard with an average concentration of 0.00048 to 1 mg/mL (R2 = 0.9991) for total antioxidant capability. The data are shown as (mg AAE/g DW).
4.8. Assessment of Antibacterial Capacity
4.8.1. Microbial Testing
The antibacterial capacity of selected solvent extracts was assessed using the microdilution technique. Staphylococcus aureus (29,213 (ATCC)), Escherichia coli (25,922), Bacillus cereus (6633), and Pseudomonas aeruginosa (27,853), were employed as a test multiresistant bacteria. Mueller-Hinton agar (MHB) was used for the sensitivity test and nutritional agar (NG) was used to sustain the chosen strains.
4.8.2. Determination of Minimal Inhibitory Concentration (MIC)
The microdilution approach was used to reveal the lowest inhibitory concentration of the selected solvent extracts of M. aquatica leaf (water, ethanol 70 %, and acetone) using microplates of 96 wells under sterile conditions [43]. Different extracts were diluted in dimethyl sulfoxide DMSO (2%), to identify the lowest concentration that inhibits. Fifty microliters of each solvent extract at various concentrations from the dilution series were combined with sterilized Mueller–Hinton bouillon and 50 μL of microbial inoculate with a final microbial concentration of 10^8 CFU/mL in microplate wells. Next, the microplates were incubated took place at 37°C for a whole night. To per well, 10 μL of resazurin (0.015%) had been added to reveal the bacterial growth. After two hours of incubation at ambient temperature, microbial growth was indicated by a color change in the microplates from purple to pink.
4.8.3. Assessment of the Lowest Bactericidal Concentration (MBC)
In order to calculate the minimum concentration of bactericide (MBC), transferring 3 μL of the contents from each well showed no visible growth onto MH agar plates, followed by an incubation period of 24 hours at 37°C [44].
4.9. Molecular Docking Study
The molecular docking investigation was done using the Maestro 11.5 tool from the Schrodinger suite. The current research aimed to explore the interaction mechanisms between Phenolic compound of the different solvent extracts of M. aquatica and the operating sites of target proteins, including NADPH oxidase, beta-ketoacyl-[acyl carrier protein] synthase from Escherichia coli, and nucleoside diphosphate kinase from Staphylococcus aureus. The goal was to examine the antioxidant capacity of the phenolic components of the different solvent extracts of M. aquatica as well as their antibacterial activities.
4.9.1. Protein Preparation
The structure of human NADPH oxidase (PDB ID: 2CDU) and the beta-ketoacyl-[acyl carrier protein] synthase from Escherichia coli (PDB ID: 1FJ4), and Staphylococcus aureus nucleoside diphosphate kinase (PDB ID: 3Q8U) were obtained from the RCSB database. Protein preparation was done using Maestro 11.5's Protein Preparation Wizard, comprising preprocessing, refining, and reduction steps. Hydrogen atoms were added, and hydroxyl groups, water molecules, and amino acids were reoriented to address structural flaws like overlapping or missing atoms. The proteins were then gently altered to increase their structures [1]
4.9.2. Ligand Preparation
The Ligprep wizard in Maestro 11.5 from the Schrödinger suite was used to generate ligands. This involves converting 2D structures to 3D, adding hydrogen atoms, resolving bond length and angle problems, and decreasing structures using the OPLS3 force field. Ionization states were adjusted, and chirality was retained throughout the process [45].
4.9.3. Receptor Grid Generation
Receptor grids were developed via Glide molecular docking, discovering active areas based on the coordinates of original ligands. Ligands were positioned within the protein's X-ray crystal structure to evaluate different interaction conformations. The technique also entails defining places, boundaries, rotatable groups, and excluded volumes [46].
4.9.4. Performing Molecular Docking
Docking was carried out in Standard Precision (SP) mode after preparing the ligands and proteins and constructing the grids. This model was chosen to evaluate the binding interactions between molecules. Binding energies were calculated in kcal/mol, along with internal energy, RMSD, desolvation energy, hydrogen bonding, lipophilic interactions, and π-π stacking interactions. This approach ensures rapid and accurate analysis of ligand-protein interactions, providing detailed insights into binding mechanisms [47].
4.10. Statistical Analysis
The various assays conducted in the examination were carried out three times independently, and the findings are presented as mean ± standard deviation. The program entitled GraphPad Prism 8 was used for the statistical analysis, which included a One-way ANOVA test. The principal component analysis (PCA), the correlation coefficient test, and the polar heatmap analysis were carried out by use of OriginPro 2024 software.
5. Conclusions
The present study highlighted the effect of solvent polarity efficacy on the phenolic profile, antioxidant, and antibacterial activity of M. aquatica leaf. The obtained data revealed that the leaf extract of M. aquatica comprised a high level of flavonoids and phenols composites. Additionally, the molecular characterization of different solvent polarity extracts showed that the distilled water and aqueous ethanol have a high concentration of phenolic composites. Thus, the greatest antioxidant activity was revealed by aqueous ethanol followed by acetonic extract, while the aqueous extract exhibited the lowest antioxidant ability. The acetonic extract showed great antibacterial potential, especially against Gram-positive bacteria followed by hydroethanolic extract. Overall, this report indicated that This kind of plant offers beneficial levels of bioactive molecules that can be employed in several sectors, including as a conservative agent in food manufacturing, and used in the pharmaceutical sector for the formulation of innovative antibacterial agents.
References
- Tourabi, M.; Nouioura, G.; Touijer, H.; Baghouz, A.; El Ghouizi, A.; Chebaibi, M.; Bakour, M.; Ousaaid, D.; Almaary, K.S.; Nafidi, H.-A.; et al. Antioxidant, Antimicrobial, and Insecticidal Properties of Chemically Characterized Essential Oils Extracted from Mentha longifolia: in Vitro and in Silico Analysis. Plants 2023, 12, 3783. [Google Scholar] [CrossRef] [PubMed]
- Shaikh, S. Prospective Role in Treatment of Major Illnesses And Potential Benefits As A Safe Insecticide And Natural Food Preservative of Mint (Mentha Spp.): A Review. Asian Journal of Biomedical and Pharmaceutical Sciences 2014, 4, 1–12. [Google Scholar] [CrossRef]
- Park, Y.; Baek, S.-A.; Choi, Y.; Kim, J.; Park, S. Metabolic Profiling of Nine Mentha Species and Prediction of Their Antioxidant Properties Using Chemometrics. Molecules 2019, 24, 258. [Google Scholar] [CrossRef] [PubMed]
- Esmaeili, A.; Rustaiyan, A.; Masoudi, S.; Nadji, K. Composition of the Essential Oils of Mentha aquatica L. and Nepeta Meyeri Benth. from Iran. Journal of Essential Oil Research 2006, 18, 263–265. [Google Scholar] [CrossRef]
- Gruenwald, J.; Brendler, T.; Jaenicke, C. PDR for Herbal Medicines (Physicians’ Desk Reference). Montvale, New Jersey: Medical Economics Company 2000.
- Singh, P.; Pandey, A.K. Prospective of Essential Oils of the Genus Mentha as Biopesticides: A Review. Front. Plant Sci. 2018, 9, 1295. [Google Scholar] [CrossRef] [PubMed]
- Ebrahimzadeh, M.; Nabavi, S.M.; Nabavi, S.F.; Eslami, B. Biological Activity of Mentha aquatica l. Pharmacologyonline 2010, 2, 611–619. [Google Scholar]
- Mkaddem, M.; Bouajila, J.; Ennajar, M.; Lebrihi, A.; Mathieu, F.; Romdhane, M. Chemical Composition and Antimicrobial and Antioxidant Activities of Mentha (longifolia L. and Viridis ) Essential Oils. Journal of Food Science 2009, 74, M358–M363. [Google Scholar] [CrossRef] [PubMed]
- Pereira, O.R.; Macias, R.I.R.; Domingues, M.R.M.; Marin, J.J.G.; Cardoso, S.M. Hepatoprotection of Mentha aquatica L., Lavandula dentata L. and Leonurus cardiaca L. Antioxidants 2019, 8, 267. [Google Scholar] [CrossRef] [PubMed]
- Sharma, V.; Hussain, S.; Gupta, M.; Saxena, A.K. In Vitro Anticancer Activity of Extracts of Mentha spp. against Human Cancer Cells.
- Gul, H.; Abbas, K.; Qadir, M.I. Gastro-Protective Effect of Ethanolic Extract of Mentha longifolia in Alcohol- and Aspirin-Induced Gastric Ulcer Models. Bangladesh J Pharmacol 2015, 10, 241–245. [Google Scholar] [CrossRef]
- Fatiha, B.; Khodir, M.; Farid, D.; Tiziri, R.; Karima, B.; Sonia, O.; Mohamed, C. Optimisation Of Solvent Extraction Of Antioxidants (Phenolic Compounds) From Algerian Mint (Mentha spicata L.).
- Iloki-Assanga, S.B.; Lewis-Luján, L.M.; Lara-Espinoza, C.L.; Gil-Salido, A.A.; Fernandez-Angulo, D.; Rubio-Pino, J.L.; Haines, D.D. Solvent Effects on Phytochemical Constituent Profiles and Antioxidant Activities, Using Four Different Extraction Formulations for Analysis of Bucida buceras L. and Phoradendron californicum. BMC Research Notes 2015, 8, 396. [Google Scholar] [CrossRef]
- Jurić, T.; Mićić, N.; Potkonjak, A.; Milanov, D.; Dodić, J.; Trivunović, Z.; Popović, B.M. The Evaluation of Phenolic Content, in Vitro Antioxidant and Antibacterial Activity of Mentha piperita Extracts Obtained by Natural Deep Eutectic Solvents. Food Chemistry 2021, 362, 130226. [Google Scholar] [CrossRef] [PubMed]
- Tourabi, M.; Metouekel, A.; Ghouizi, A.E.L.; Jeddi, M.; Nouioura, G.; Laaroussi, H.; Hosen, M.E.; Benbrahim, K.F.; Bourhia, M.; Salamatullah, A.M.; et al. Efficacy of Various Extracting Solvents on Phytochemical Composition, and Biological Properties of Mentha longifolia L. Leaf Extracts. Sci Rep 2023, 13, 18028. [Google Scholar] [CrossRef] [PubMed]
- Lapornik, B.; Prošek, M.; Golc Wondra, A. Comparison of Extracts Prepared from Plant By-Products Using Different Solvents and Extraction Time. Journal of Food Engineering 2005, 71, 214–222. [Google Scholar] [CrossRef]
- Teodor, E.D.; Gatea, F.; Camelia, A.; Radulescu, C.; Chira, A.; Radu, G. Polyphenols, Radical Scavenger Activity, Short-Chain Organic Acids and Heavy Metals of Several Plants Extracts from `Bucharest Delta`. Chemical Papers 2015, 69, 1582–1590. [Google Scholar] [CrossRef]
- Naczk, M.; Shahidi, F. Phenolics in Cereals, Fruits and Vegetables: Occurrence, Extraction and Analysis. Journal of Pharmaceutical and Biomedical Analysis 2006, 41, 1523–1542. [Google Scholar] [CrossRef] [PubMed]
- Masibo, M.; He, Q. Major Mango Polyphenols and Their Potential Significance to Human Health. Comprehensive Reviews in Food Science and Food Safety 2008, 7, 309–319. [Google Scholar] [CrossRef] [PubMed]
- Abbas, A.; Sultana, B.; Hussain, A.; Anwar, F.; Ahmad, N. Antioxidant Potential, Phenolics Content and Antimicrobial Attributes of Selected Medicinal Plants. Pak. J. Anal. Environ. Chem. 2021, 22, 307–319. [Google Scholar] [CrossRef]
- Dorman, H.J.D.; Koşar, M.; Kahlos, K.; Holm, Y.; Hiltunen, R. Antioxidant Properties and Composition of Aqueous Extracts from Mentha Species, Hybrids, Varieties, and Cultivars. J. Agric. Food Chem. 2003, 51, 4563–4569. [Google Scholar] [CrossRef]
- Hoai, L.V.N.; Quoc, L.P.T.; Hoang, H.T.; Raes, K.; Mai, D.S.; Thien, L.T. Extraction of Polyphenols from Mentha aquatica Linn. Var. Crispa. Agric. Conspec. Sci. 2023, 88, 37–42. [Google Scholar]
- Conforti, F.; Sosa, S.; Marrelli, M.; Menichini, F.; Statti, G.A.; Uzunov, D.; Tubaro, A.; Menichini, F.; Loggia, R.D. In Vivo Anti-Inflammatory and in Vitro Antioxidant Activities of Mediterranean Dietary Plants. Journal of Ethnopharmacology 2008, 116, 144–151. [Google Scholar] [CrossRef]
- Thi, N.Q.N.; Duc, L.T.; Minh, L.V.; Tien, L.X. Phytochemicals and Antioxidant Activity of Aqueous and Ethanolic Extracts of Mentha aquatica L. IOP Conf. Ser.: Mater. Sci. Eng. 2020, 991, 012027. [Google Scholar] [CrossRef]
- Alam, M.N.; Bristi, N.J.; Rafiquzzaman, M. Review on in Vivo and in Vitro Methods Evaluation of Antioxidant Activity. Saudi Pharmaceutical Journal 2013, 21, 143–152. [Google Scholar] [CrossRef] [PubMed]
- Hajimehdipoor, H.; Shahrestani, R.; Shekarchi, M. Investigating the Synergistic Antioxidant Effects of Some Flavonoid and Phenolic Compounds.
- Ferhat, M.; Erol, E.; Beladjila, K.A.; Çetintaş, Y.; Duru, M.E.; Öztürk, M.; Kabouche, A.; Kabouche, Z. Antioxidant, Anticholinesterase and Antibacterial Activities of Stachys Guyoniana and Mentha aquatica. Pharmaceutical Biology 2017, 55, 324–329. [Google Scholar] [CrossRef]
- Konaté, K.; Mavoungou, J.F.; Lepengué, A.N.; Aworet-Samseny, R.R.; Hilou, A.; Souza, A.; Dicko, M.H.; M’Batchi, B. Antibacterial Activity against β- Lactamase Producing Methicillin and Ampicillin-Resistants Staphylococcus aureus: Fractional Inhibitory Concentration Index (FICI) Determination. Ann Clin Microbiol Antimicrob 2012, 11, 18. [Google Scholar] [CrossRef]
- Janakat, S.; Al-Nabulsi, A.A.R.; Allehdan, S.; Olaimat, A.N.; Holley, R.A. Antimicrobial Activity of Amurca (Olive Oil Lees) Extract against Selected Foodborne Pathogens. Food Sci. Technol (Campinas) 2015, 35, 259–265. [Google Scholar] [CrossRef]
- Adamczak, A.; Ożarowski, M.; Karpiński, T.M. Antibacterial Activity of Some Flavonoids and Organic Acids Widely Distributed in Plants. Journal of Clinical Medicine 2020, 9, 109. [Google Scholar] [CrossRef] [PubMed]
- Tian, Q.; Wei, S.; Su, H.; Zheng, S.; Xu, S.; Liu, M.; Bo, R.; Li, J. Bactericidal Activity of Gallic Acid against Multi-Drug Resistance Escherichia coli. Microbial Pathogenesis 2022, 173, 105824. [Google Scholar] [CrossRef]
- Chatterjee, N.S.; Panda, S.K.; Navitha, M.; Asha, K. .. K.; Anandan, R.; Mathew, S. Vanillic Acid and Coumaric Acid Grafted Chitosan Derivatives: Improved Grafting Ratio and Potential Application in Functional Food. J Food Sci Technol 2015, 52, 7153–7162. [Google Scholar] [CrossRef]
- Álvarez-Martínez, F.J.; Barrajón-Catalán, E.; Encinar, J.A.; Rodríguez-Díaz, J.C.; Micol, V. Antimicrobial Capacity of Plant Polyphenols against Gram-Positive Bacteria: A Comprehensive Review. Current Medicinal Chemistry 2020, 27, 2576–2606. [Google Scholar] [CrossRef]
- Michiels, J.A.; Kevers, C.; Pincemail, J.; Defraigne, J.O.; Dommes, J. Extraction Conditions Can Greatly Influence Antioxidant Capacity Assays in Plant Food Matrices. Food Chemistry 2012, 130, 986–993. [Google Scholar] [CrossRef]
- Eloff, J.N. Which Extractant Should Be Used for the Screening and Isolation of Antimicrobial Components from Plants? Journal of Ethnopharmacology 1998, 60, 1–8. [Google Scholar] [CrossRef] [PubMed]
- Herrera-Rocha, K.M.; Rocha-Guzmán, N.E.; Gallegos-Infante, J.A.; González-Laredo, R.F.; Larrosa-Pérez, M.; Moreno-Jiménez, M.R. Phenolic Acids and Flavonoids in Acetonic Extract from Quince (Cydonia oblonga mill.): Nutraceuticals with Antioxidant and Anti-Inflammatory Potential. Molecules 2022, 27, 2462. [Google Scholar] [CrossRef] [PubMed]
- Campos, F.M.; Couto, J.A.; Figueiredo, A.R.; Tóth, I.V.; Rangel, A.O.S.S.; Hogg, T.A. Cell Membrane Damage Induced by Phenolic Acids on Wine Lactic Acid Bacteria. International Journal of Food Microbiology 2009, 135, 144–151. [Google Scholar] [CrossRef] [PubMed]
- Su, Y.; Ma, L.; Wen, Y.; Wang, H.; Zhang, S. Studies of the in Vitro Antibacterial Activities of Several Polyphenols against Clinical Isolates of Methicillin-Resistant Staphylococcus aureus. Molecules 2014, 19, 12630–12639. [Google Scholar] [CrossRef] [PubMed]
- Mokhtar, M.; Ginestra, G.; Youcefi, F.; Filocamo, A.; Bisignano, C.; Riazi, A. Antimicrobial Activity of Selected Polyphenols and Capsaicinoids Identified in Pepper (Capsicum annuum L.) and Their Possible Mode of Interaction. Curr Microbiol 2017, 74, 1253–1260. [Google Scholar] [CrossRef] [PubMed]
- Zhang, Y.; Wang, J.; Dong, J.; Wei, J.; Wang, Y.; Dai, X.; Wang, X.; Luo, M.; Tan, W.; Deng, X.; et al. Inhibition of α-Toxin Production by Subinhibitory Concentrations of Naringenin Controls Staphylococcus aureus Pneumonia. Fitoterapia 2013, 86, 92–99. [Google Scholar] [CrossRef] [PubMed]
- Matejczyk, M.; Świsłocka, R.; Golonko, A.; Lewandowski, W.; Hawrylik, E. Cytotoxic, Genotoxic and Antimicrobial Activity of Caffeic and Rosmarinic Acids and Their Lithium, Sodium and Potassium Salts as Potential Anticancer Compounds. Advances in Medical Sciences 2018, 63, 14–21. [Google Scholar] [CrossRef] [PubMed]
- Tourabi, M.; EL Ghouizi, A.; Nouioura, G.; Faiz, K.; Fatemi, H.EL.; Elyagoubi, K.; Lyoussi, B.; Derwich, E.H. Phenolic Profile, Acute and Subacute Toxicity of an Aqueous Extract from Moroccan Mentha longifolia L. Aerial Part in Swiss Albino Mice Model. Journal of Ethnopharmacology 2023, 117293. [Google Scholar] [CrossRef]
- Fadipe, V.; Mongalo, N.; Opoku, A. In Vitro Evaluation of the Comprehensive Antimicrobial and Antioxidant Properties of Curtisia dentata (Burm.f) C.A. Sm: Toxicological Effect on the Human Embryonic Kidney (HEK293) and Human Hepatocellular Carcinoma (HepG2) Cell Lines. EXCLI J 2015, 14, 971–983. [Google Scholar] [CrossRef]
- Bachiri, L.; Echchegadda, G.; Ibijbijen, J.; Nassiri, L. Etude Phytochimique Et Activité Antibactérienne De Deux Espèces De Lavande Autochtones Au Maroc : «Lavandula stoechas L. et Lavandula dentata L.». European Scientific Journal, ESJ 2016, 12, 313–313. [Google Scholar] [CrossRef]
- Abdali, Y.E.; Mahraz, A.M.; Beniaich, G.; Mssillou, I.; Chebaibi, M.; Jardan, Y.A.B.; Lahkimi, A.; Nafidi, H.-A.; Aboul-Soud, M.A.M.; Bourhia, M.; et al. Essential Oils of Origanum compactum Benth: Chemical Characterization, in Vitro, in Silico, Antioxidant, and Antibacterial Activities. Open Chemistry 2023, 21. [Google Scholar] [CrossRef]
- Ouahabi, S.; Loukili, E.H.; Daoudi, N.E.; Chebaibi, M.; Ramdani, M.; Rahhou, I.; Bnouham, M.; Fauconnier, M.-L.; Hammouti, B.; Rhazi, L.; et al. Study of the Phytochemical Composition, Antioxidant Properties, and In Vitro Anti-Diabetic Efficacy of Gracilaria bursa-pastoris Extracts. Marine Drugs 2023, 21, 372. [Google Scholar] [CrossRef] [PubMed]
- Amrati, F.E.-Z.; Elmadbouh, O.H.M.; Chebaibi, M.; Soufi, B.; Conte, R.; Slighoua, M.; Saleh, A.; Al Kamaly, O.; Drioiche, A.; Zair, T.; et al. Evaluation of the Toxicity of Caralluma europaea (C.E) Extracts and Their Effects on Apoptosis and Chemoresistance in Pancreatic Cancer Cells. Journal of Biomolecular Structure and Dynamics 2023, 41, 8517–8534. [Google Scholar] [CrossRef] [PubMed]
Figure 1.
(A): Total phenolic amount (TPC) and flavonoid content (TFC), total antioxidant capacity (TAC), (B): EC50 of Reducing power (RP), and IC50 of DPPH scavenging activity of different secerned solvents.
Figure 1.
(A): Total phenolic amount (TPC) and flavonoid content (TFC), total antioxidant capacity (TAC), (B): EC50 of Reducing power (RP), and IC50 of DPPH scavenging activity of different secerned solvents.
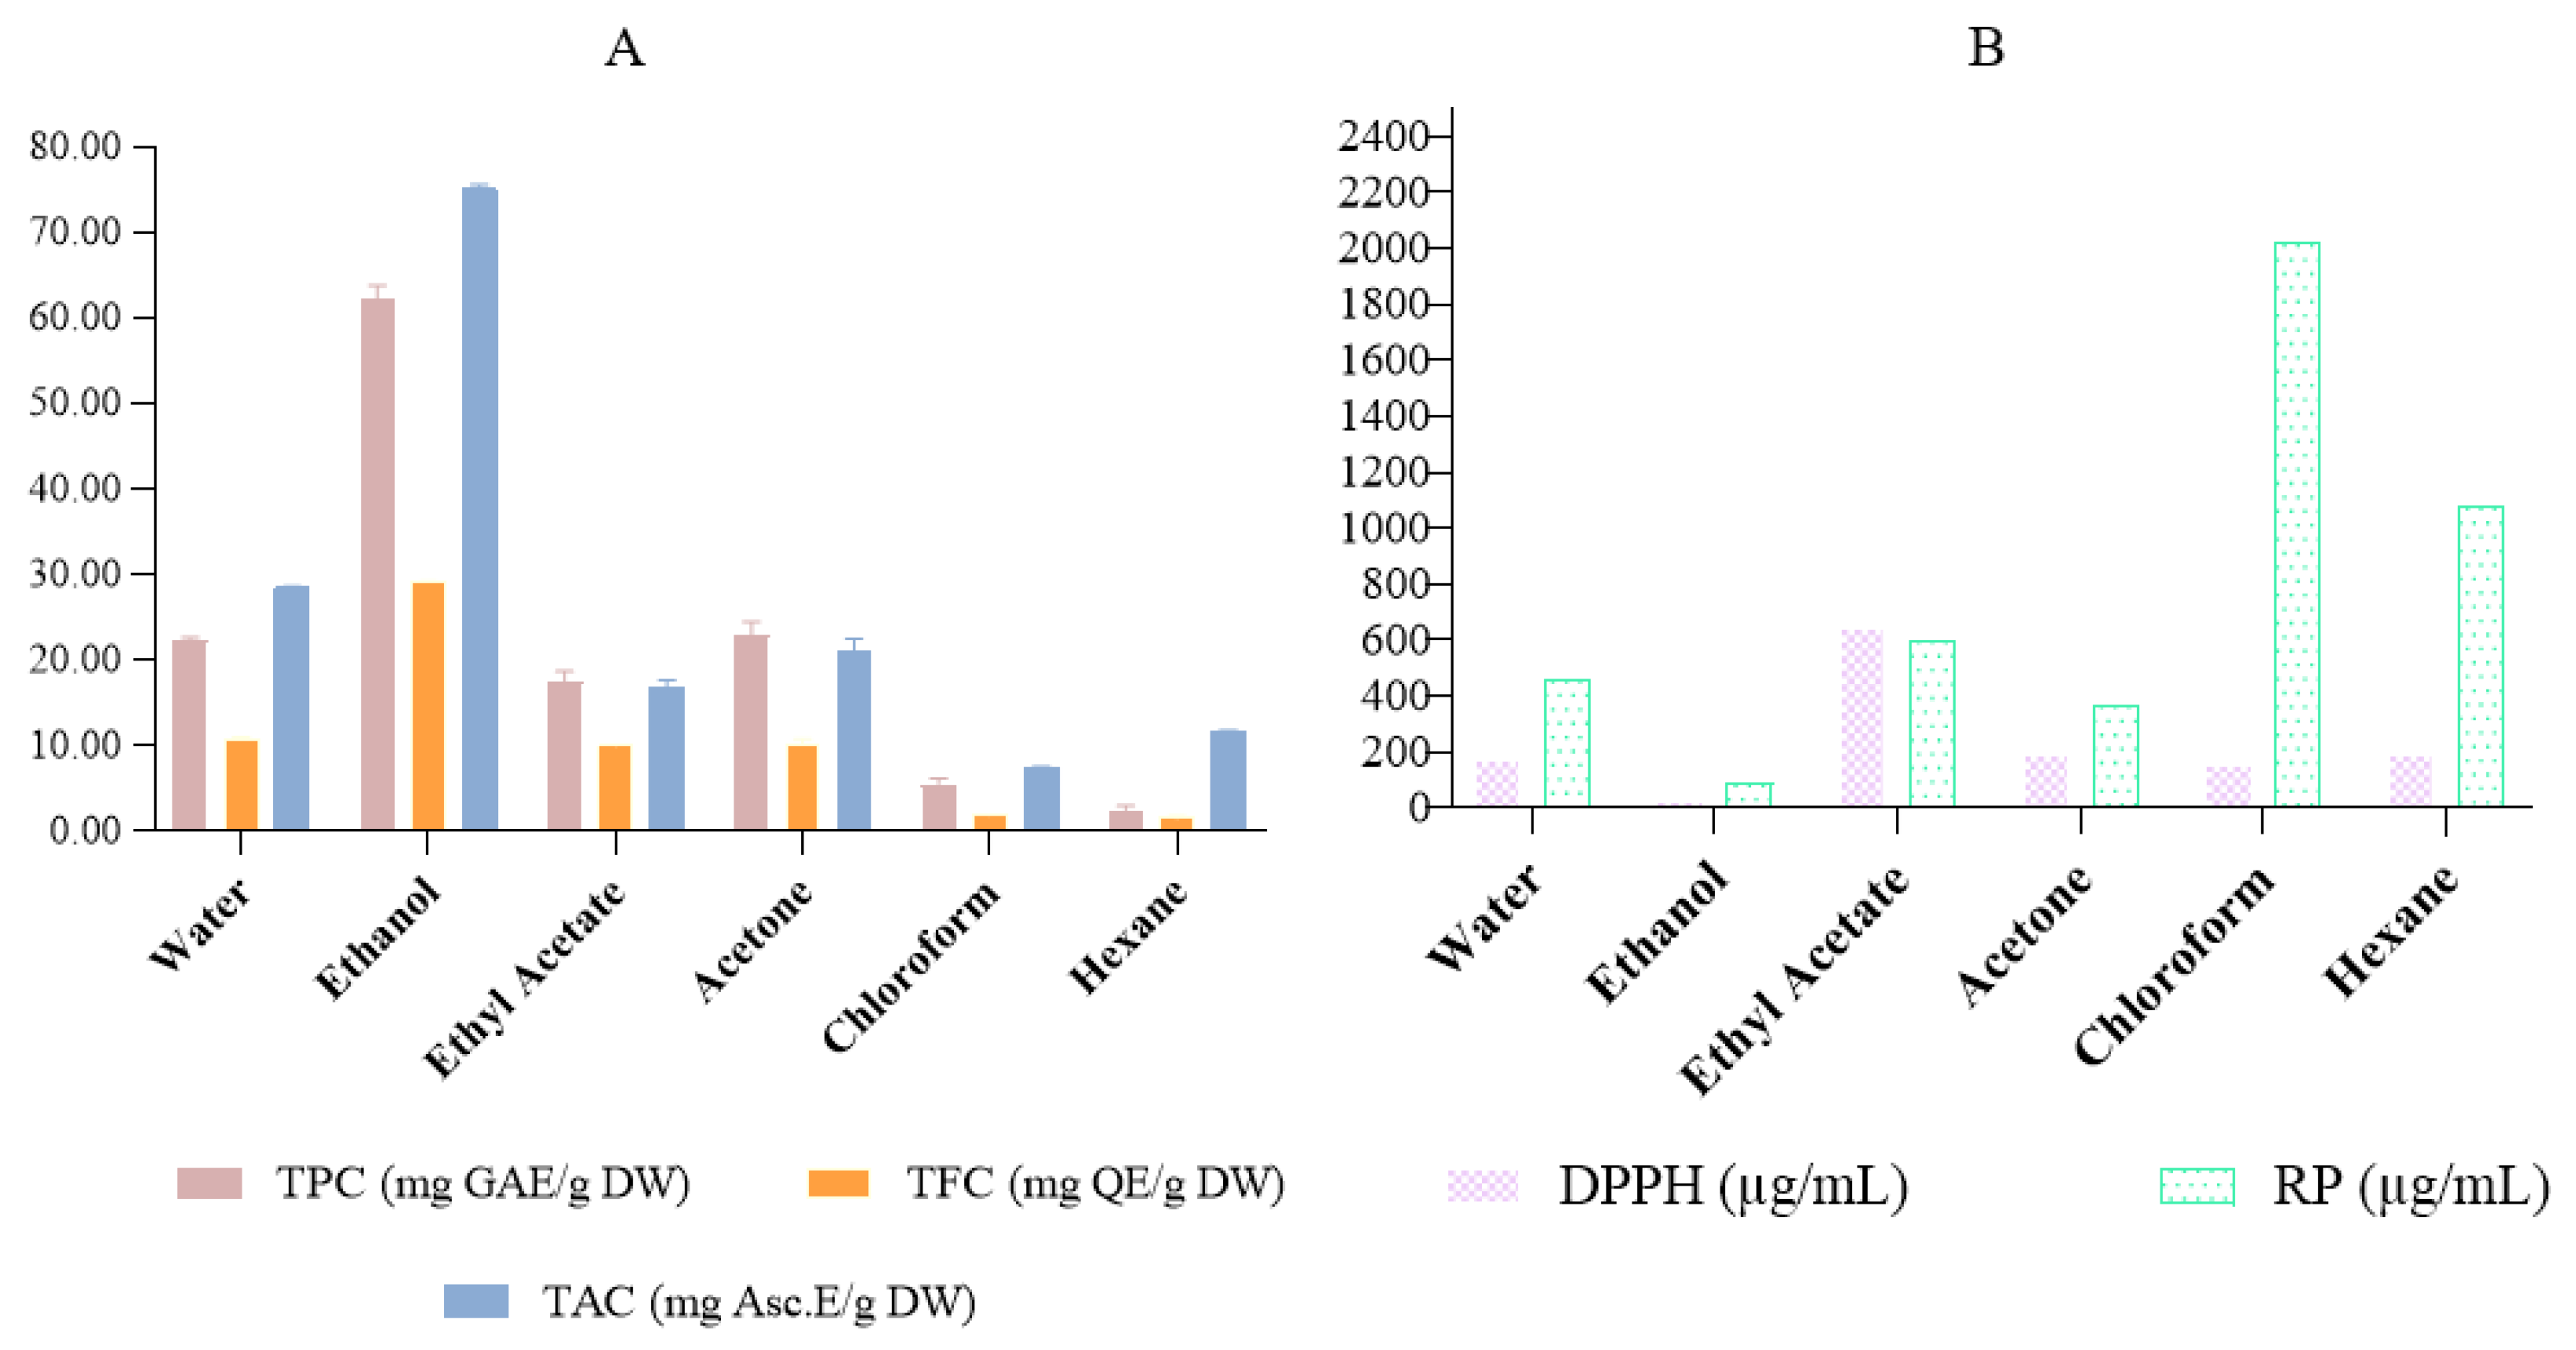
Figure 2.
Effect of solvent polarity on the extraction yield of studied solvent extracts of M. aquatica. Means values ± SD (n = 3).
Figure 2.
Effect of solvent polarity on the extraction yield of studied solvent extracts of M. aquatica. Means values ± SD (n = 3).
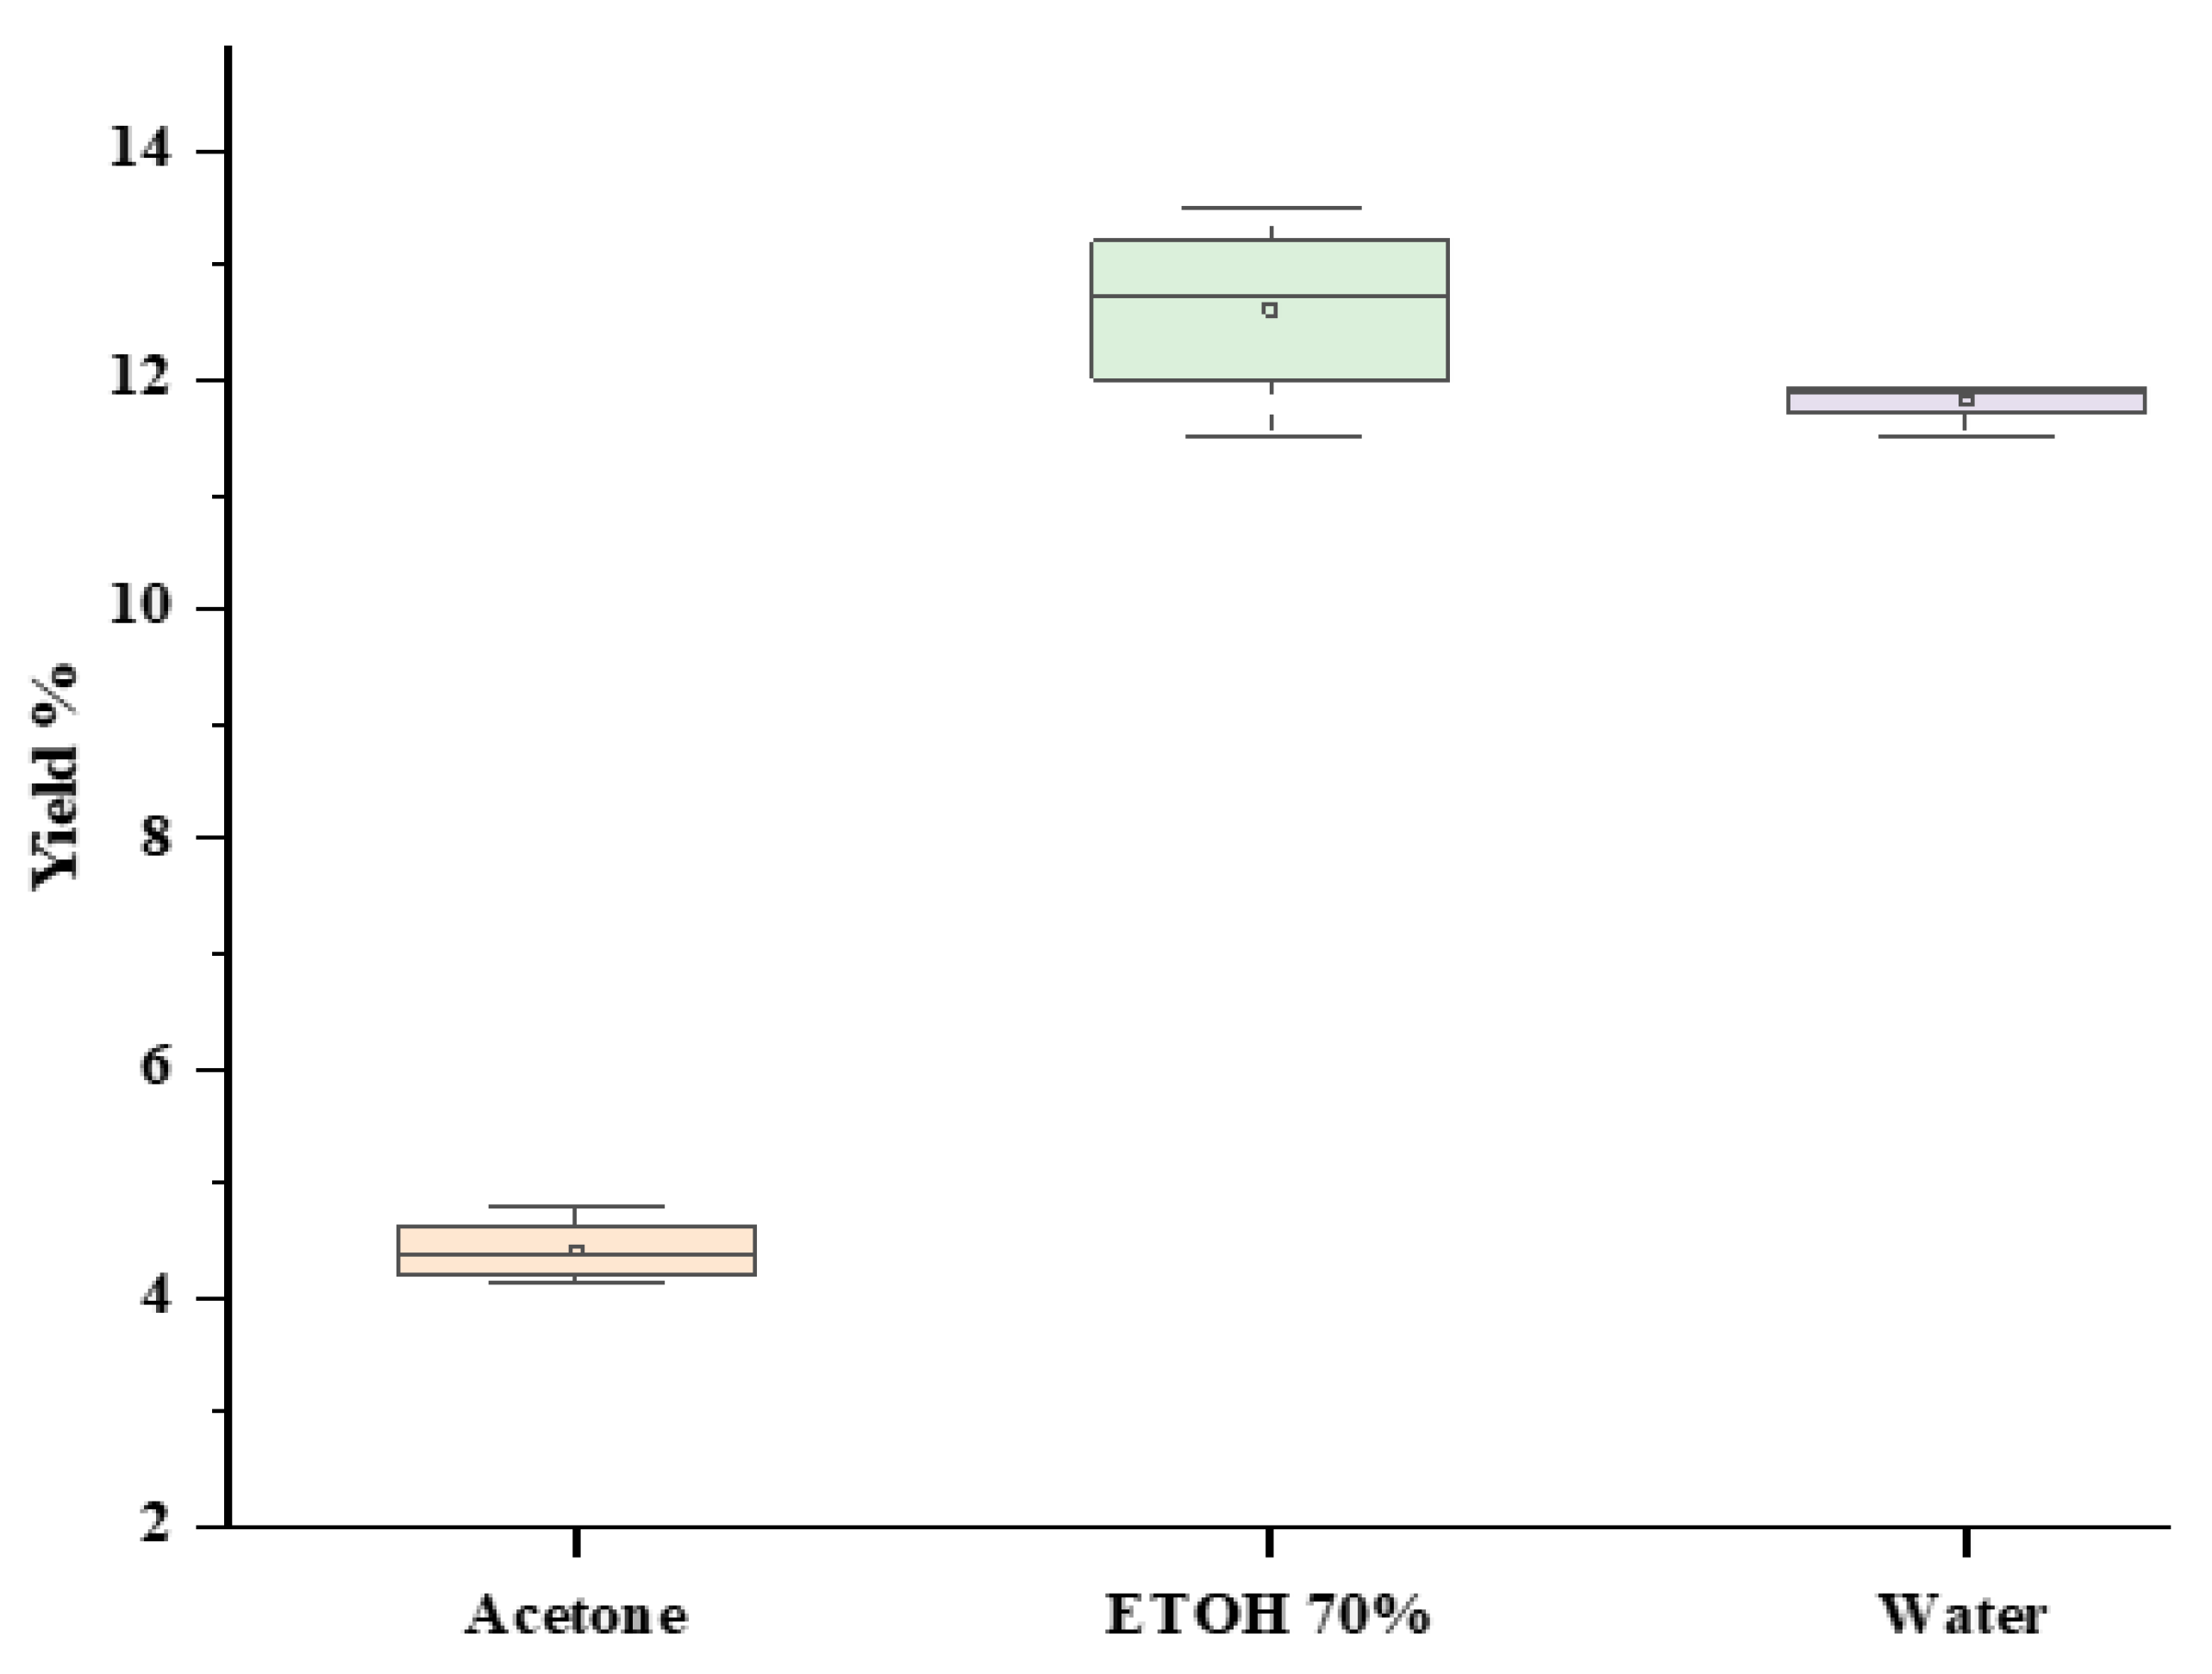
Figure 3.
Chromatograms of different solvent extracts of M. aquatica using HPLC-DA analysis. (a): aqueous extract; (b) ethanolic extract; (c) acetone extract.
Figure 3.
Chromatograms of different solvent extracts of M. aquatica using HPLC-DA analysis. (a): aqueous extract; (b) ethanolic extract; (c) acetone extract.
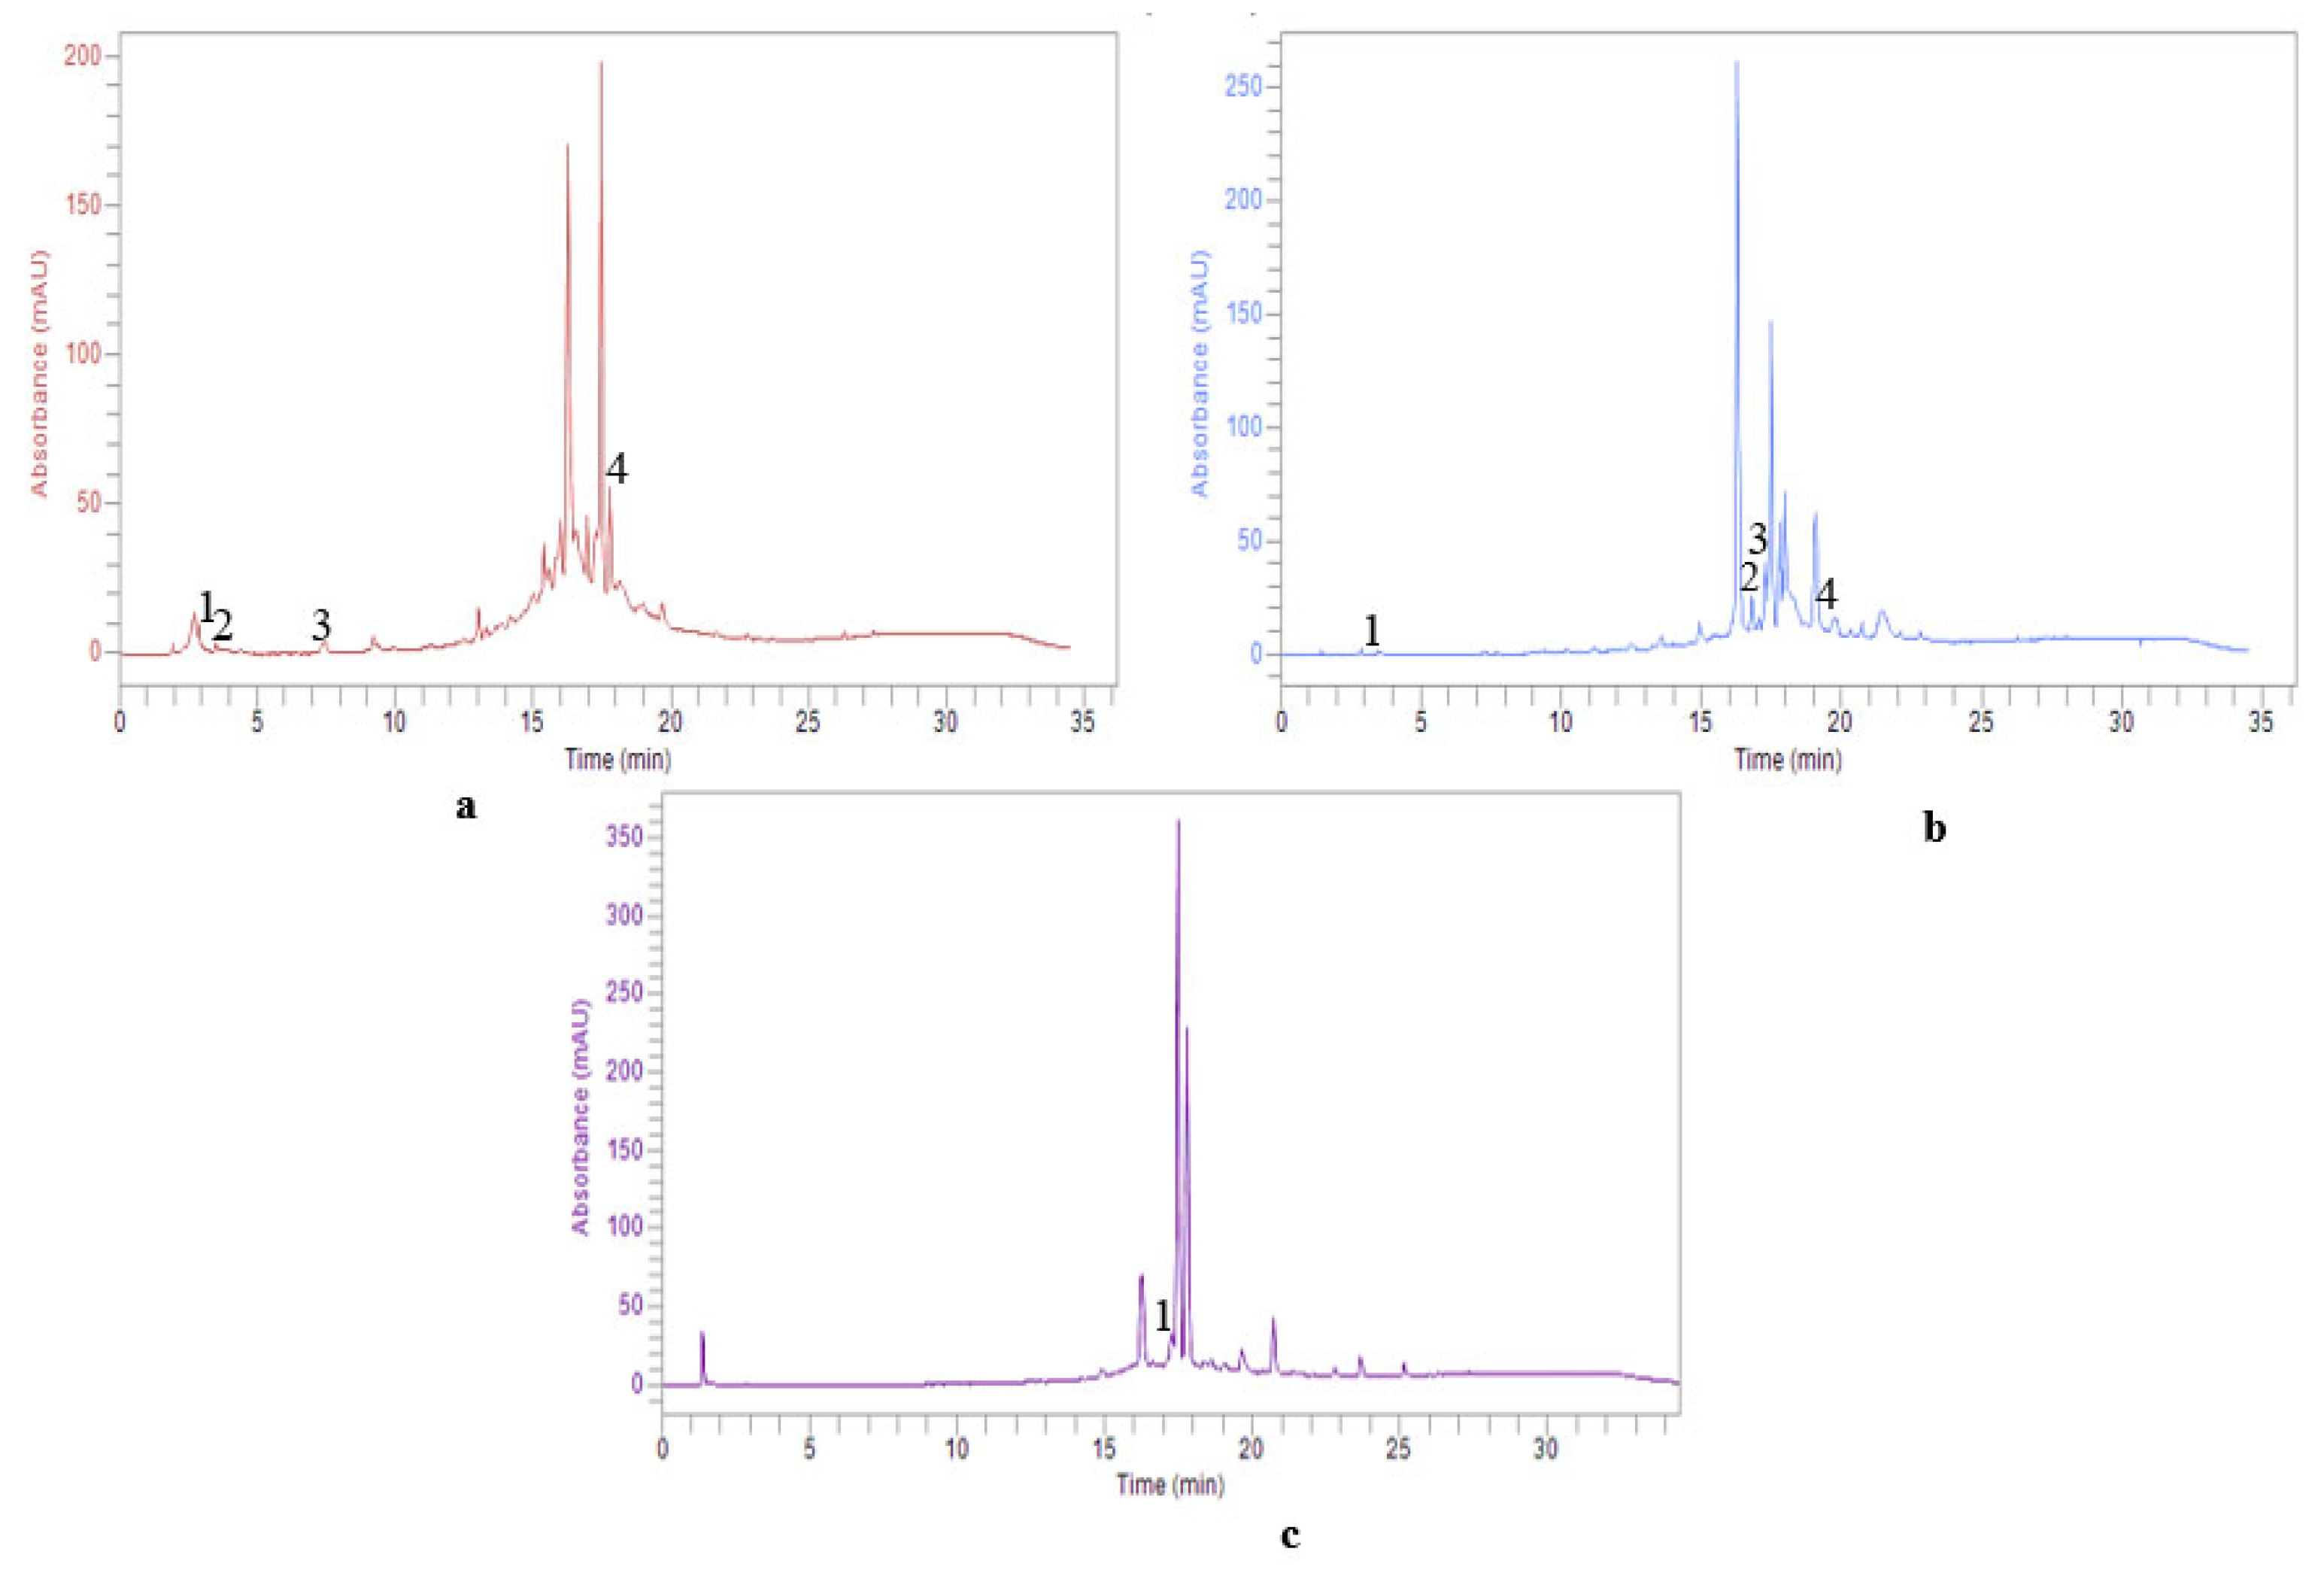
Figure 4.
Total phenolic amount (A), and Total flavonoid content of selected solvent extract of M. aquatica. There is no statistically significant difference between the same letter findings in the same test (p > 0.05). Means values ± SD (n = 3).
Figure 4.
Total phenolic amount (A), and Total flavonoid content of selected solvent extract of M. aquatica. There is no statistically significant difference between the same letter findings in the same test (p > 0.05). Means values ± SD (n = 3).
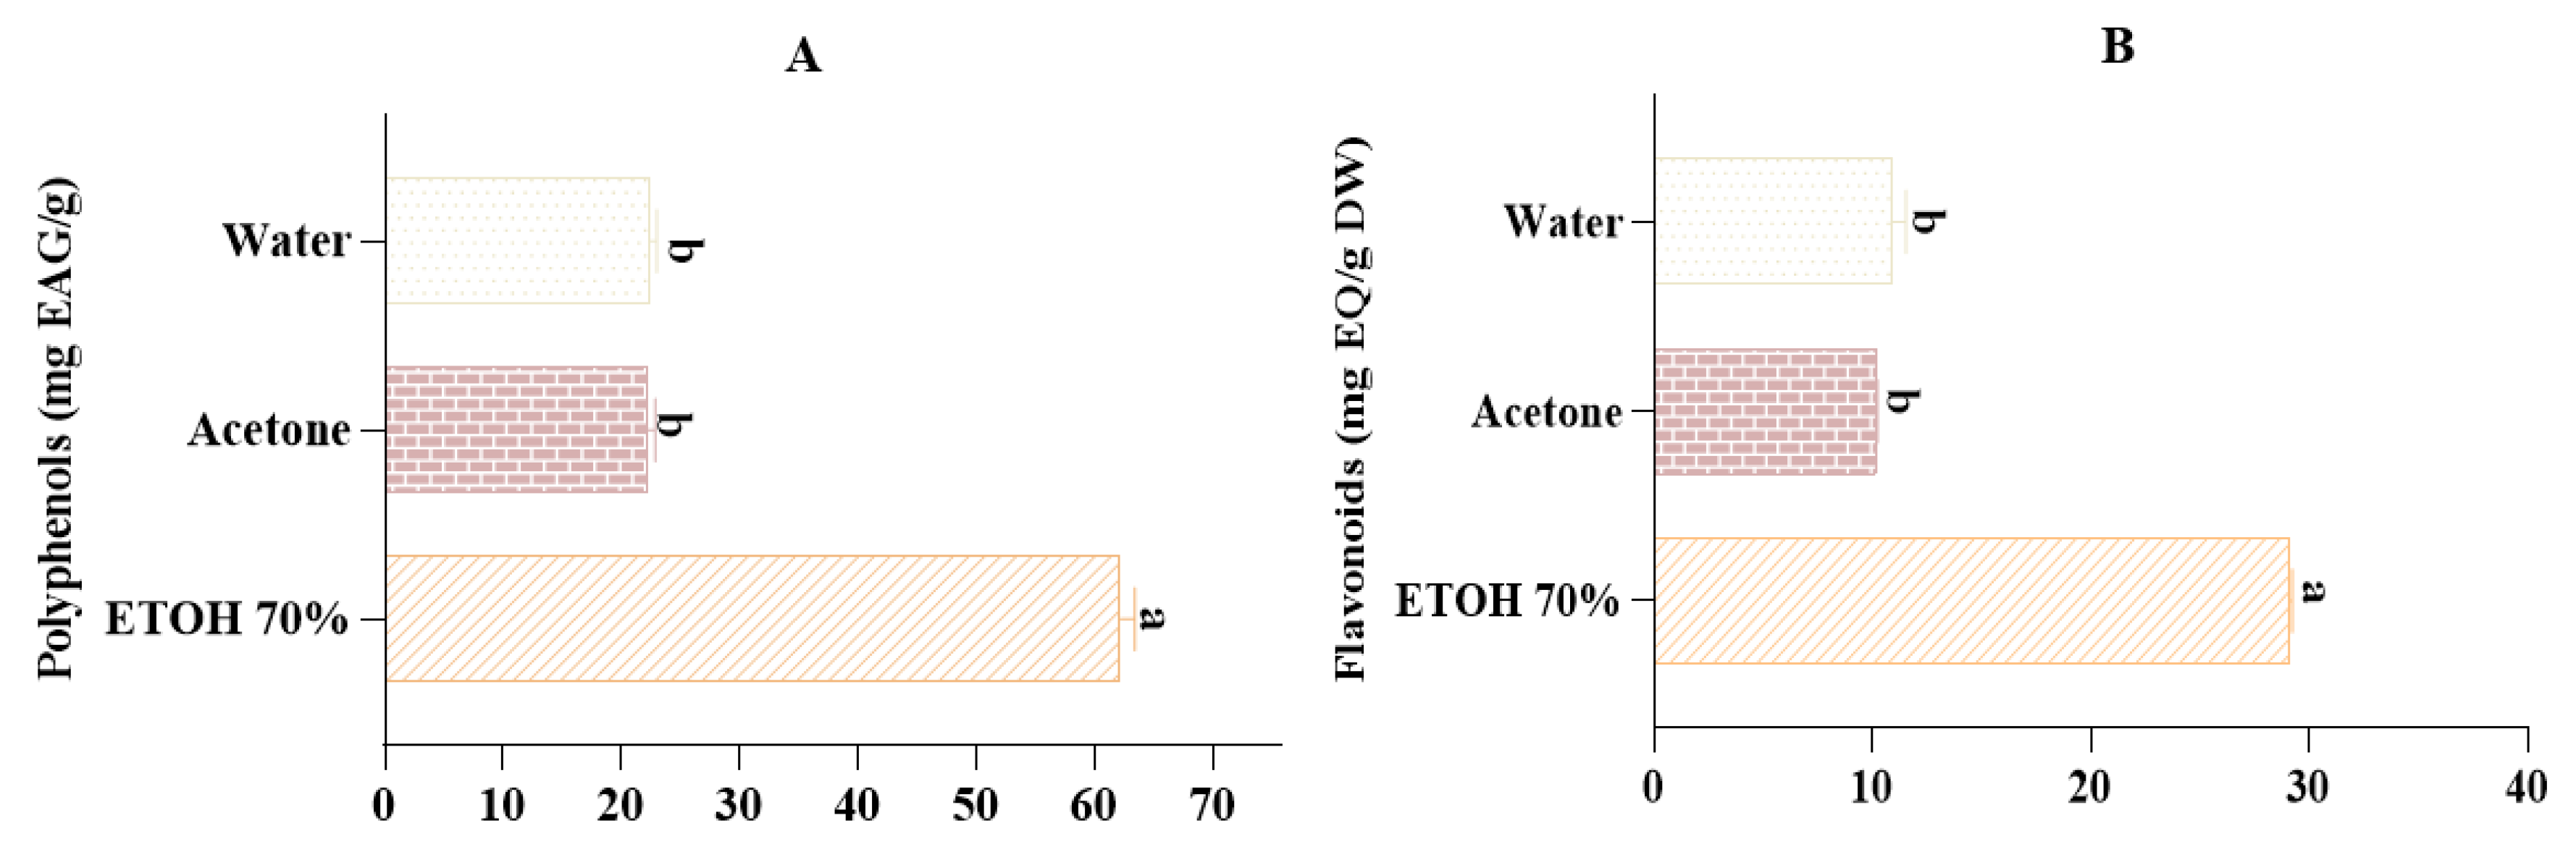
Figure 5.
Antioxidant activities of solvent extract of M. aquatica (A): IC50 of DPPH assay, (B): EC50 of reducing power, and (C): Total antioxidant capacity. There is no statistically significant difference between the same letter results in the same test (p>0.05). Means values ± SD (n = 3); BHT: Butylated hydroxytoluene; As.ac: Ascorbic acid.

Figure 6.
The two-dimensional representation of ligand interactions with the active site. (A) Interactions between quercetin and the NADPH oxidase active site (B): Gallic acid interacts with the active site of Escherichia coli beta-ketoacyl-[acyl carrier protein] synthase. Interactions between Staphylococcus aureus nucleoside diphosphate kinase and chlorobenzoic acid at the active site (C).
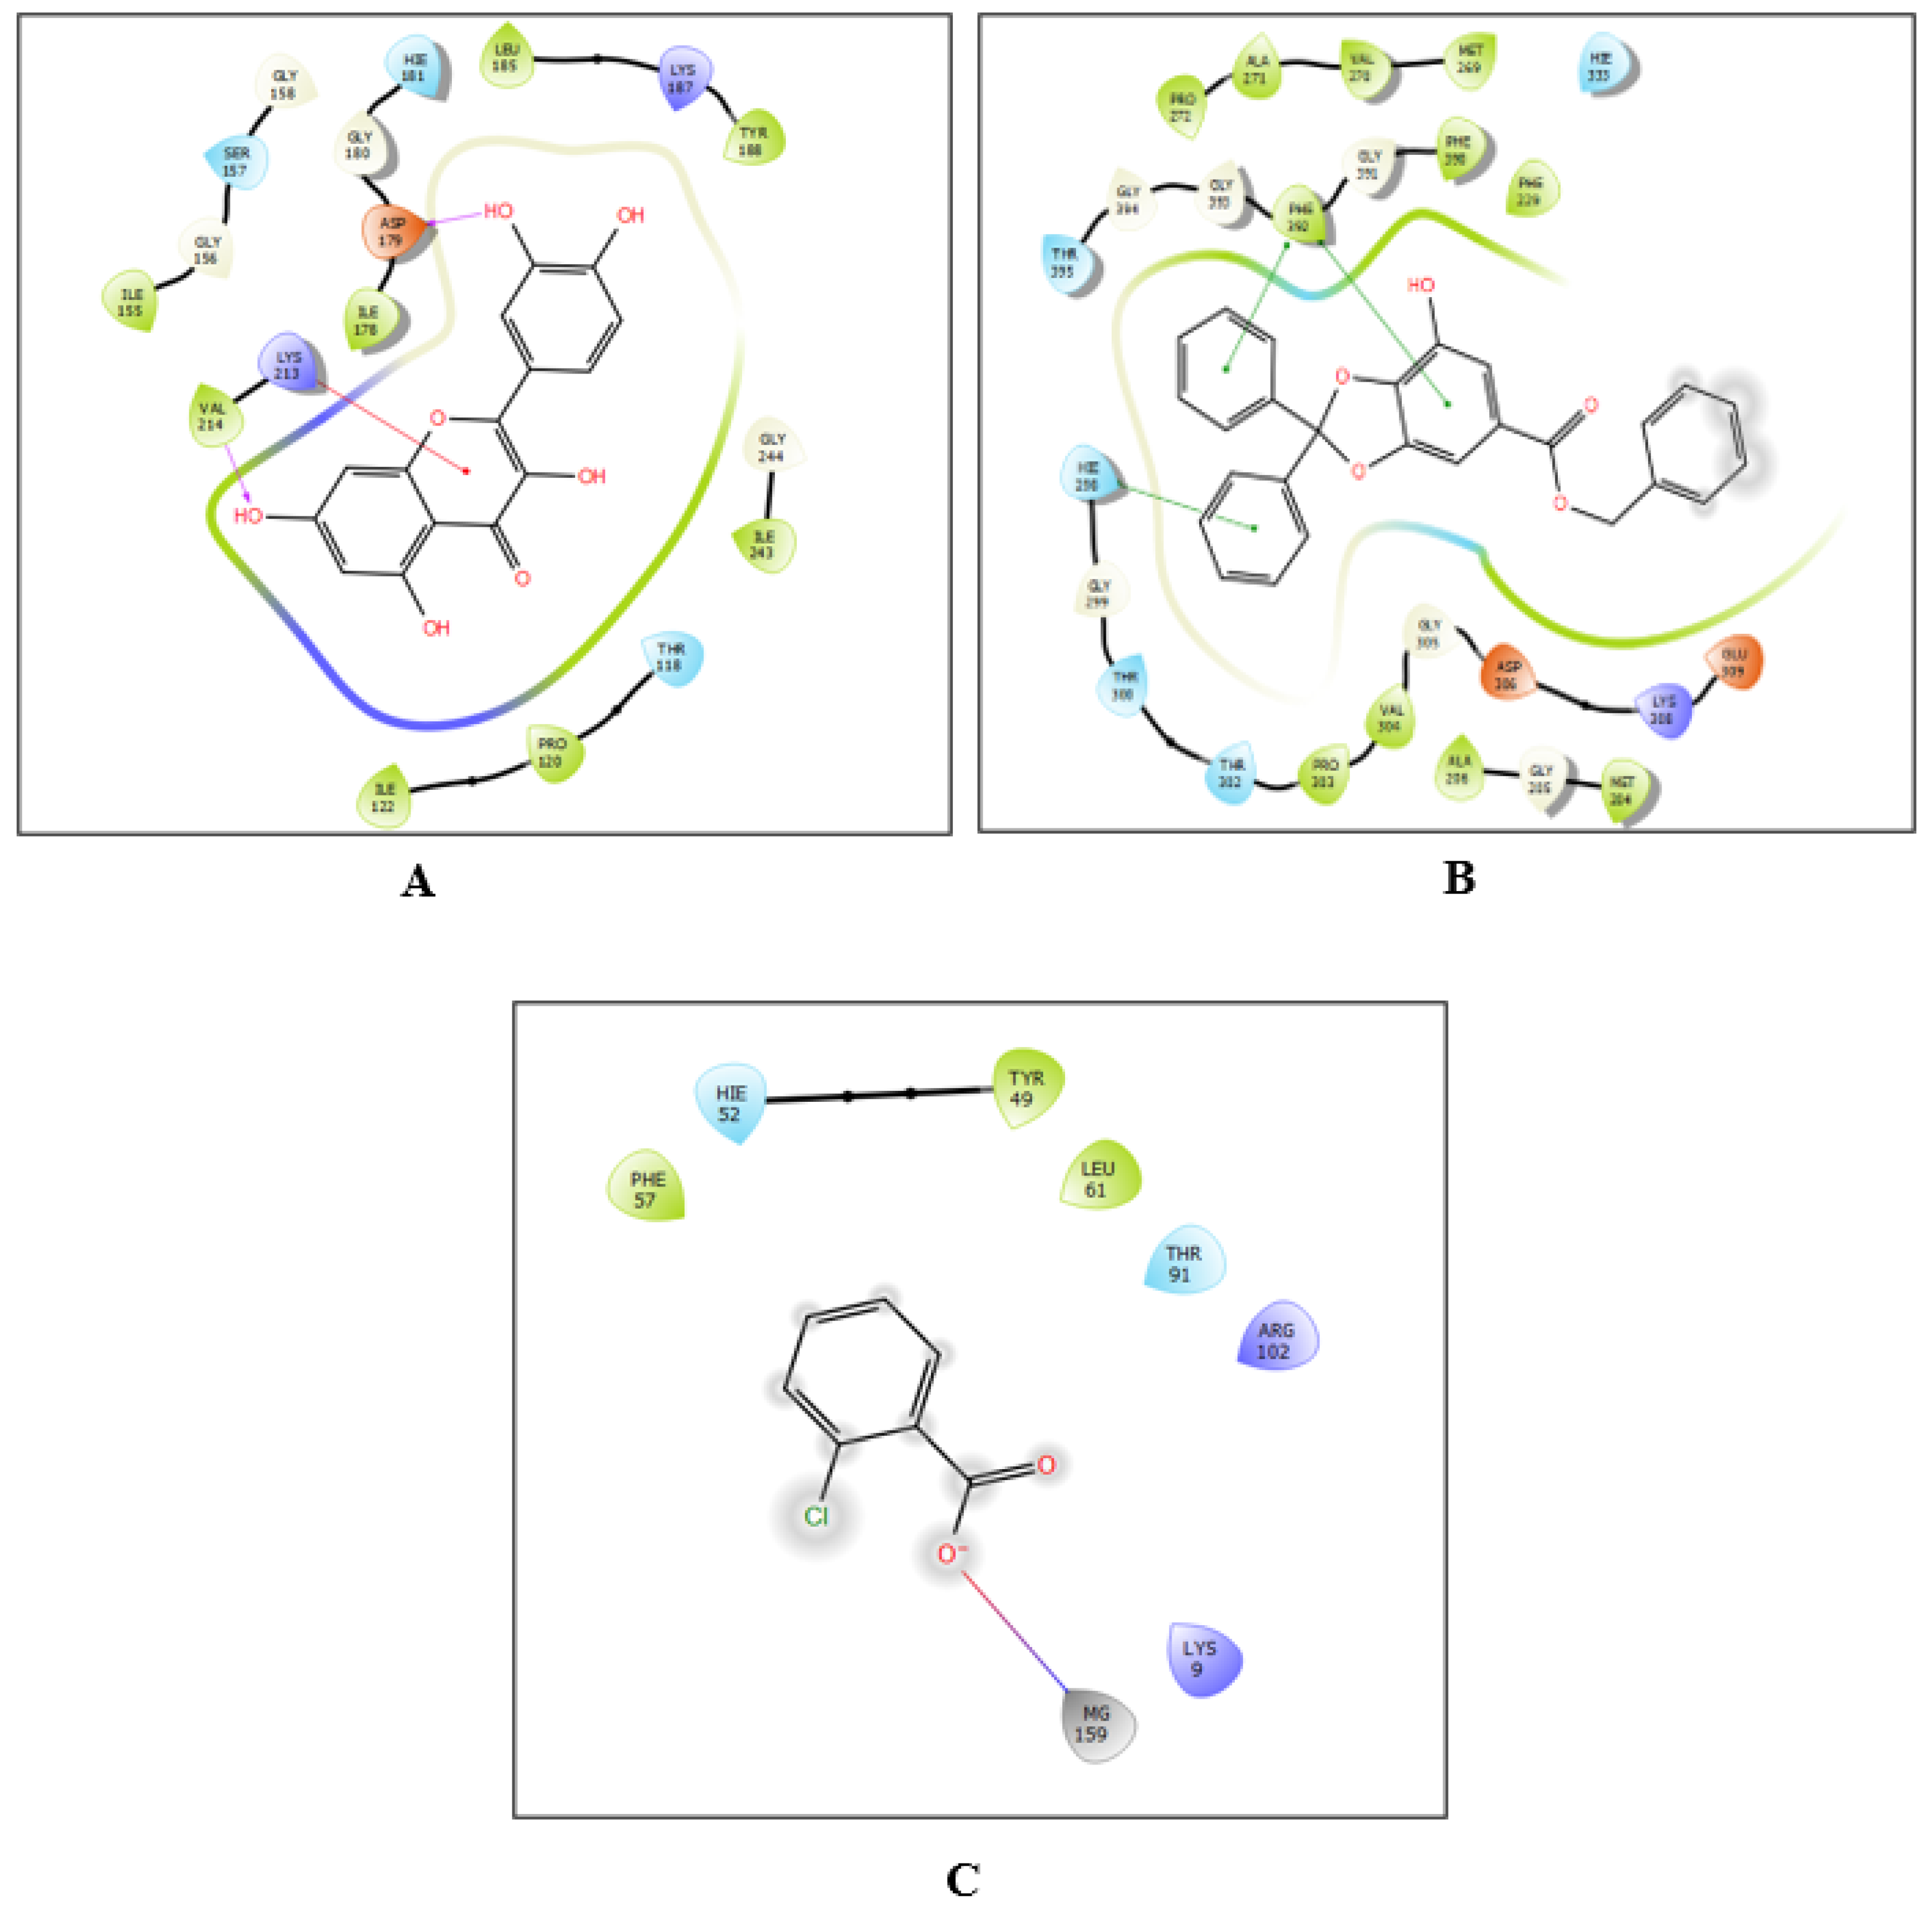
Figure 7.
The three-dimensional display of ligand interactions with the active site. (A): Interactions among quercetin and the NADPH oxidase active site, (B): Gallic acid interacts with the active site of Escherichia coli beta-ketoacyl-[acyl carrier protein] synthase. (C): The interactions between Staphylococcus aureus nucleoside diphosphate kinase and chlorobenzoic acid at the active site.
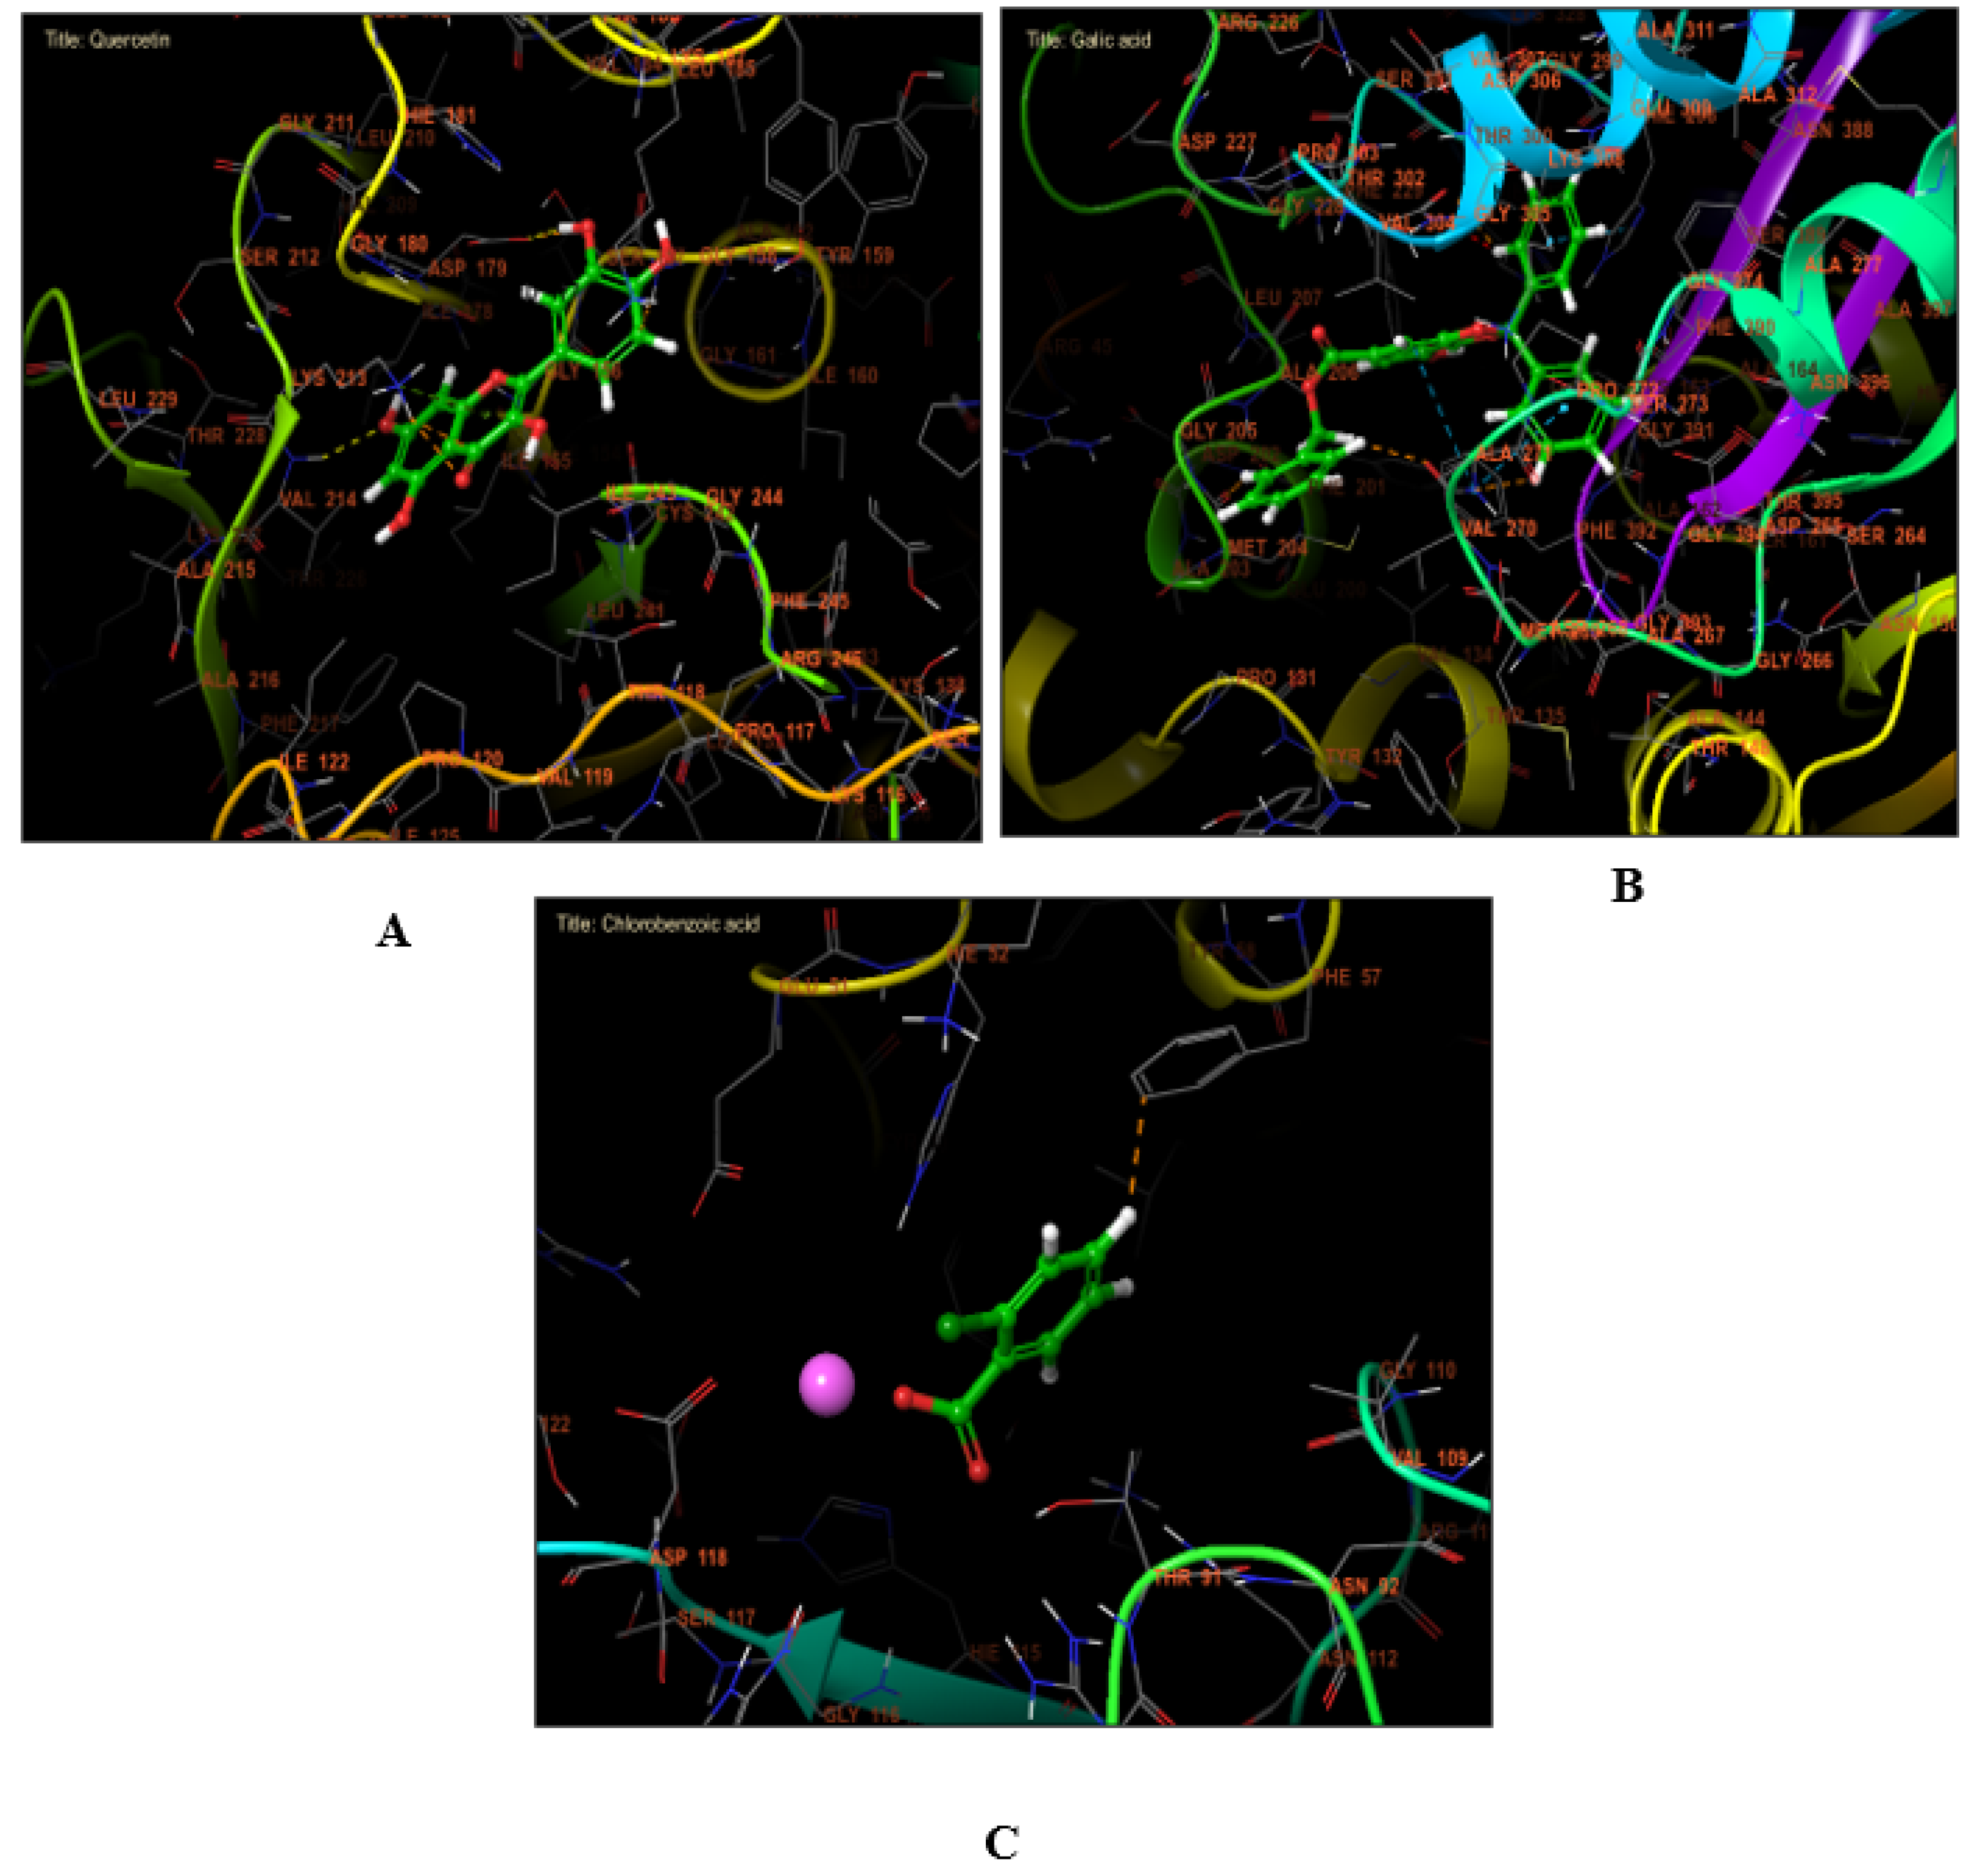
Figure 8.
Pearson correlation coefficients of antioxidant content (polyphenols, flavonoids), DPPH, RP, TAC, and antibacterial capacity of M. aquatica solvent extract. Pearson correlation values are illustrated by different squares.
Figure 8.
Pearson correlation coefficients of antioxidant content (polyphenols, flavonoids), DPPH, RP, TAC, and antibacterial capacity of M. aquatica solvent extract. Pearson correlation values are illustrated by different squares.
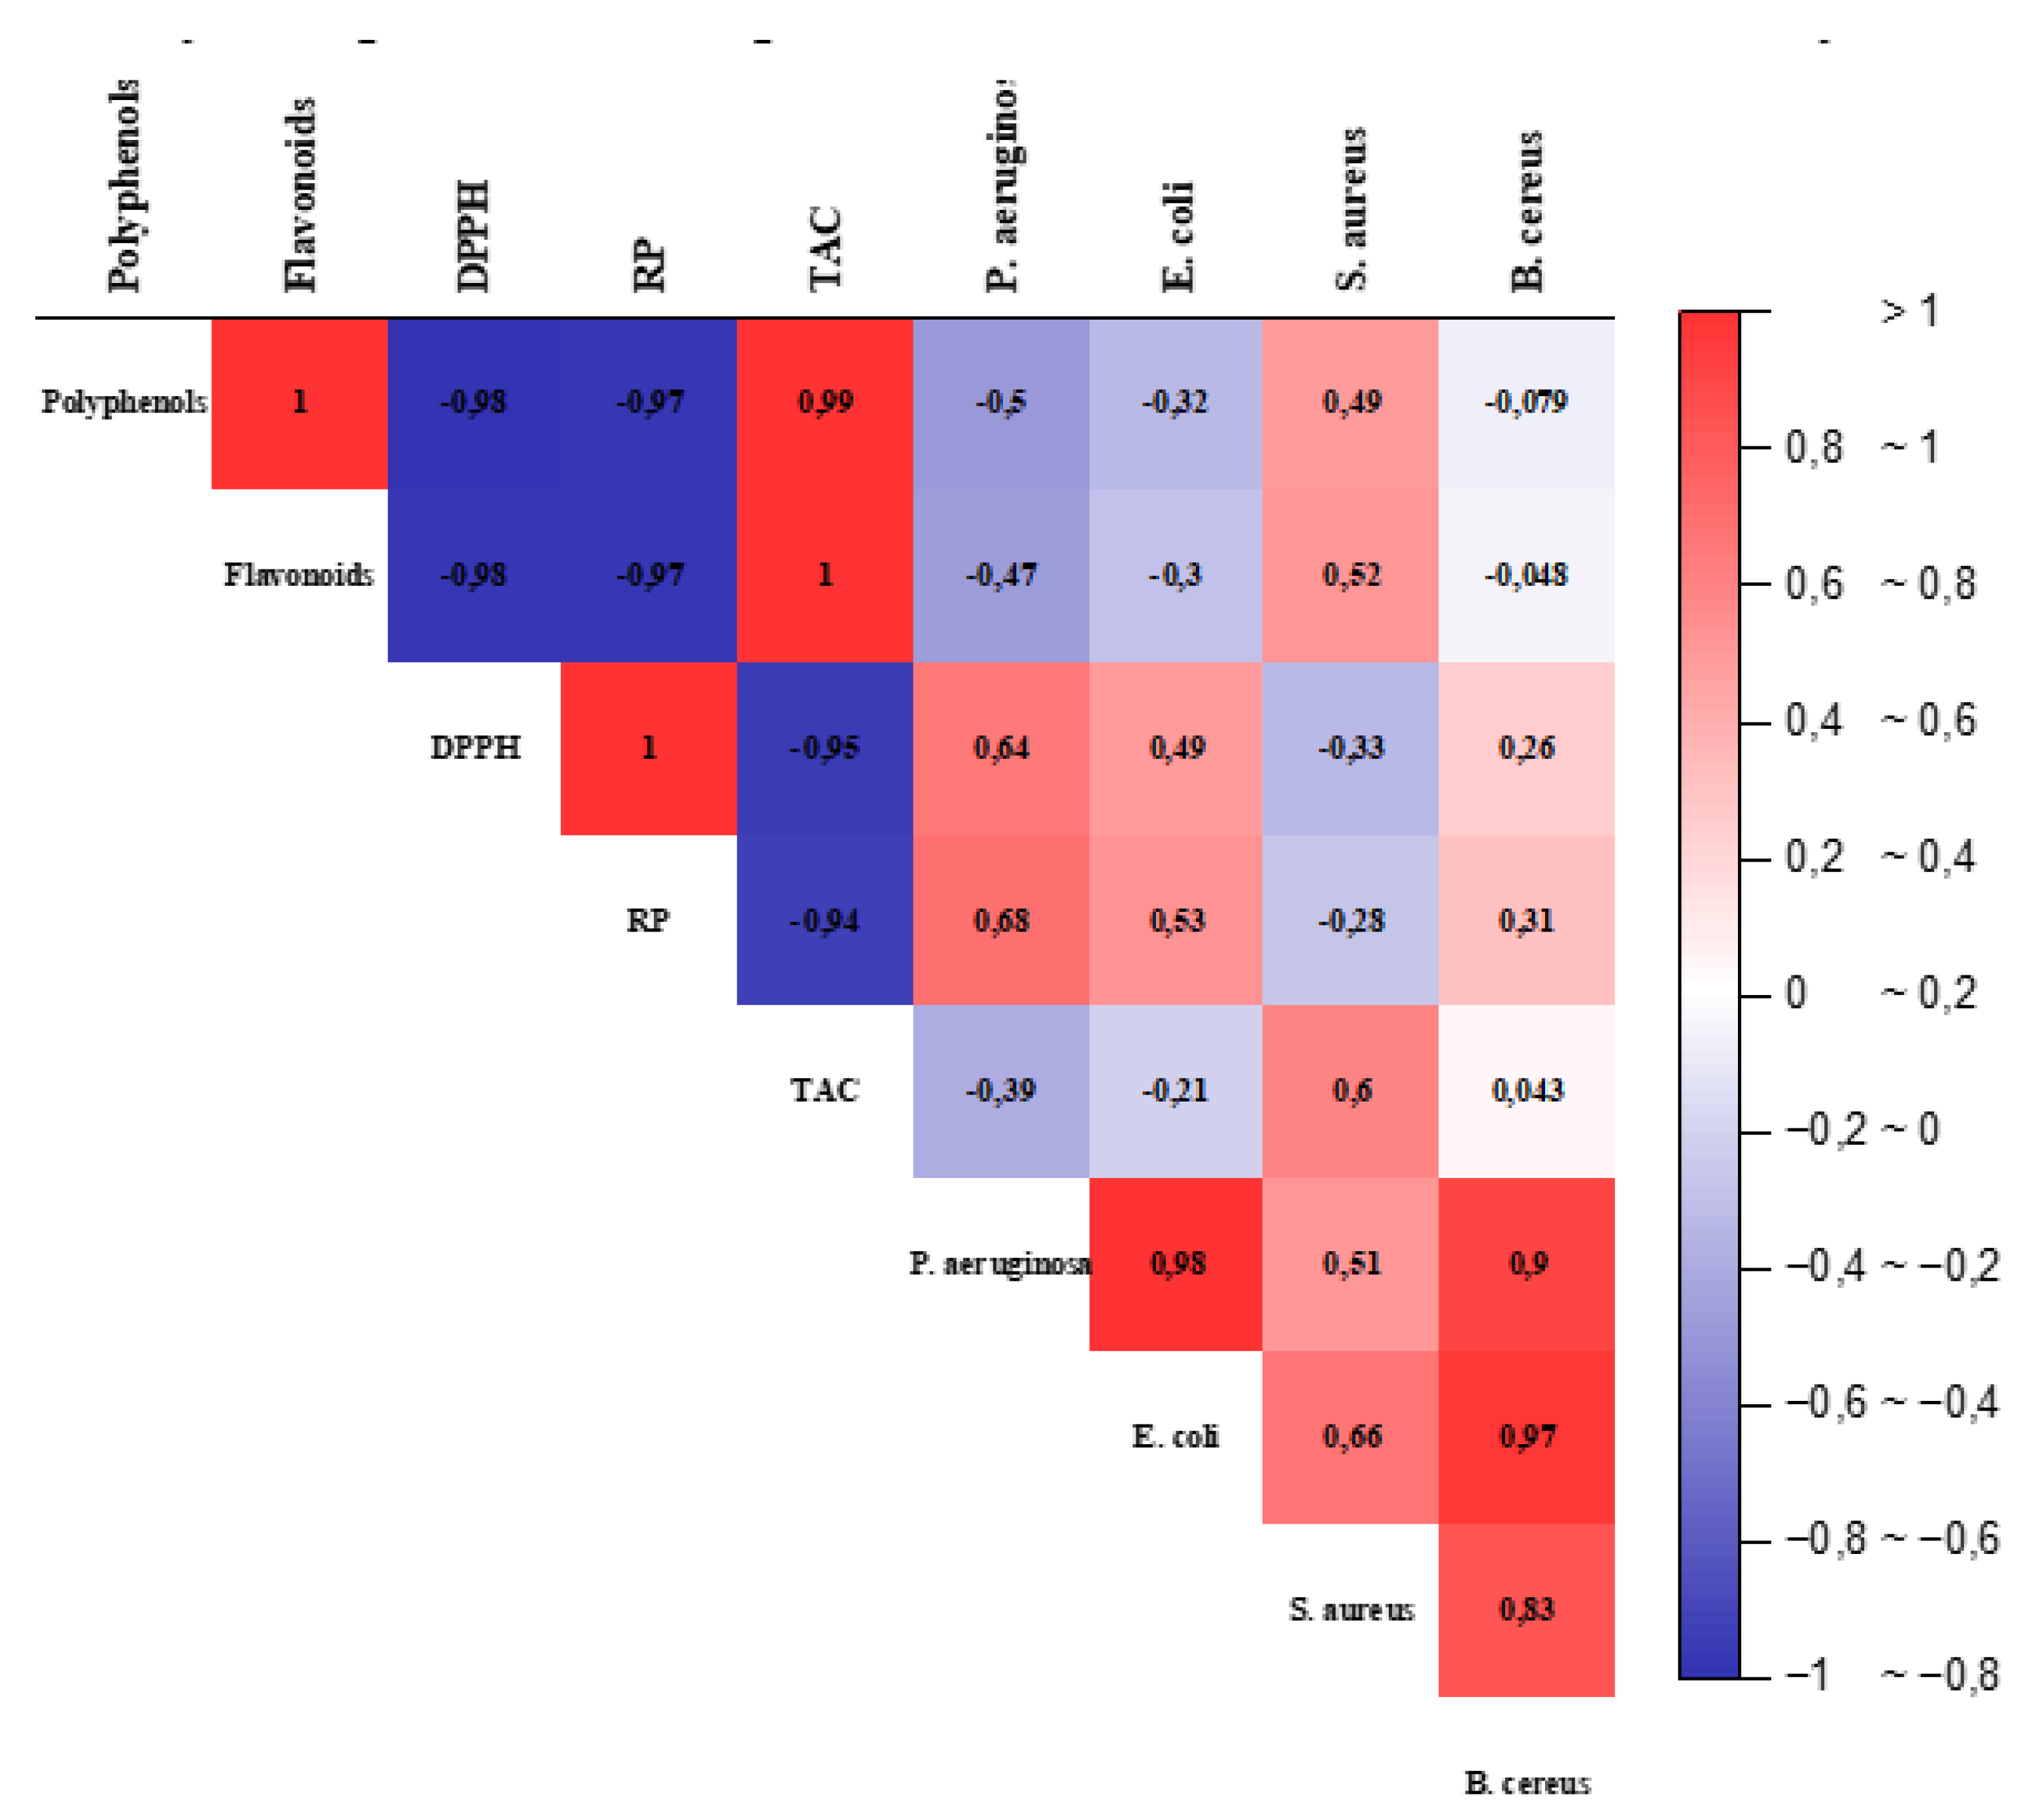
Figure 9.
Polar Heatmap with circular dendrogram representation of individual component, polyphenol, flavonoid, antioxidant, and antibacterial correlations of solvent extract.
Figure 9.
Polar Heatmap with circular dendrogram representation of individual component, polyphenol, flavonoid, antioxidant, and antibacterial correlations of solvent extract.
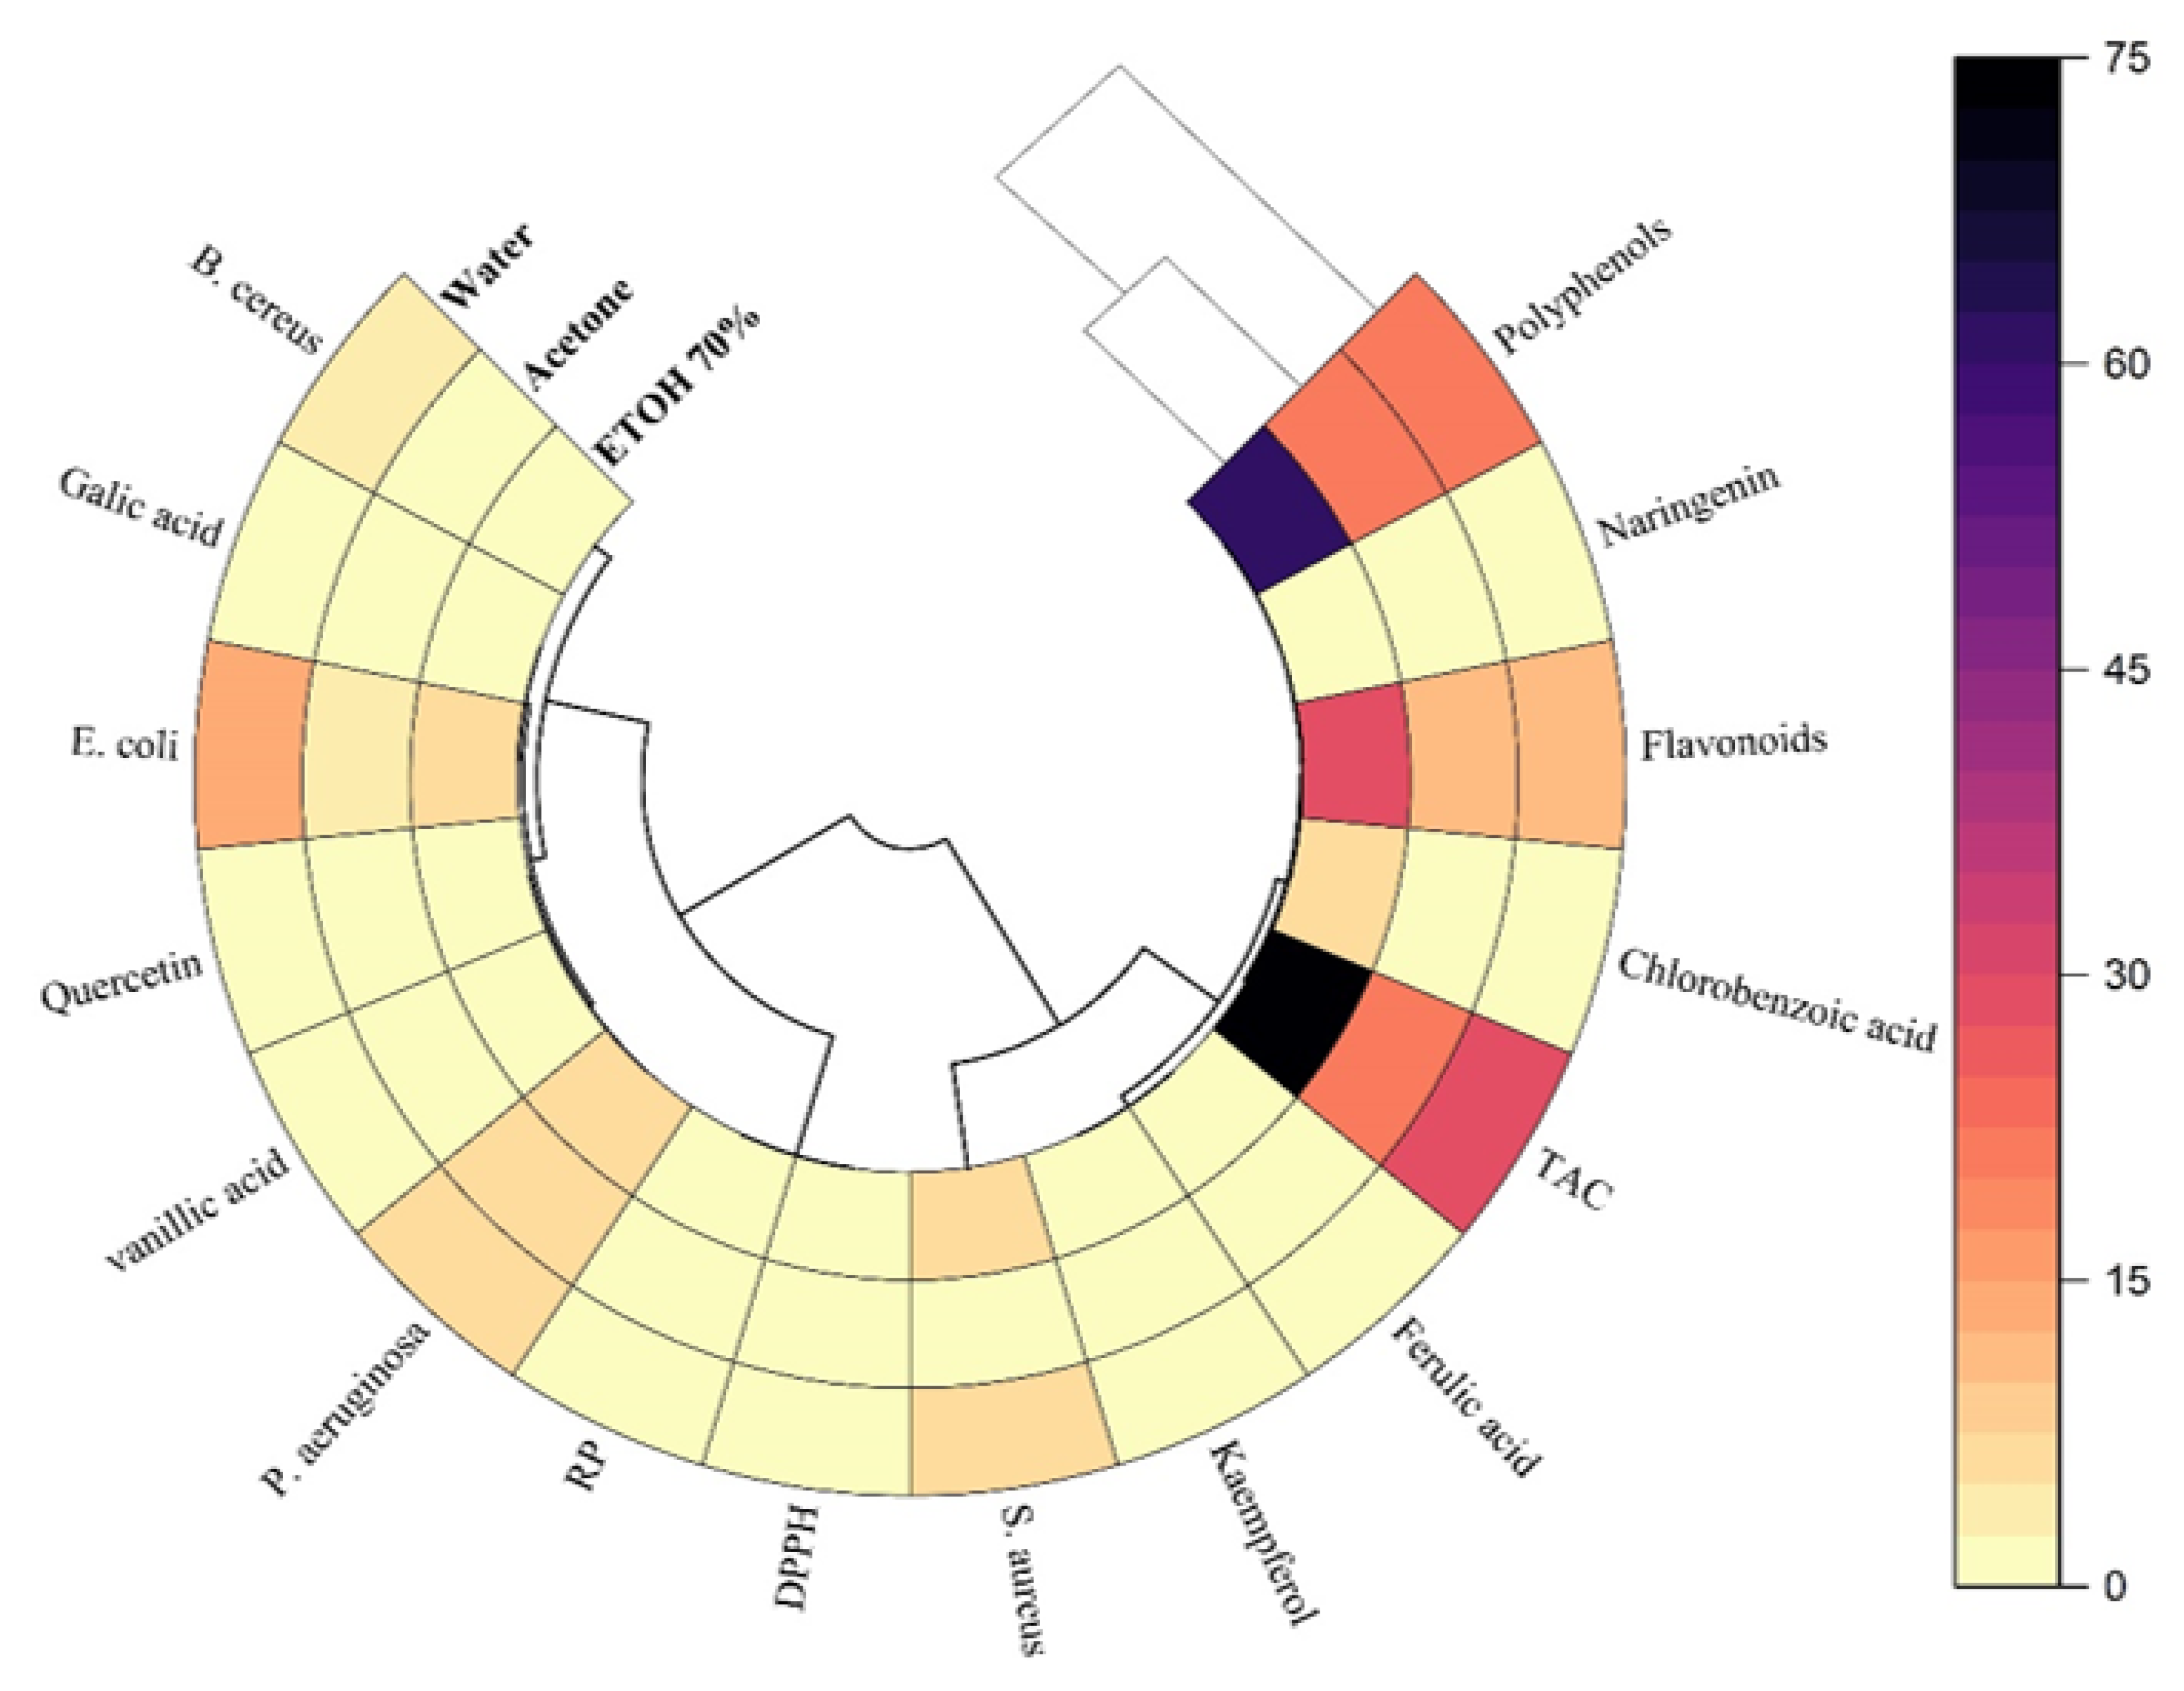
Figure 10.
Principal component analysis (PCA). (A) Charts showing the antioxidant properties and phenolic components in the solvent extracts under study. (B) Biplots for individual phenolic compounds, and the antibacterial capacity of examined solvent extracts. Na: naringenin, FA: Ferulic acid, Kamp: Kaempferol, GA: Gallic acid, VA: Vanillic acid, Cha: Chlorobenzoic acid and Quer: Quercetin.
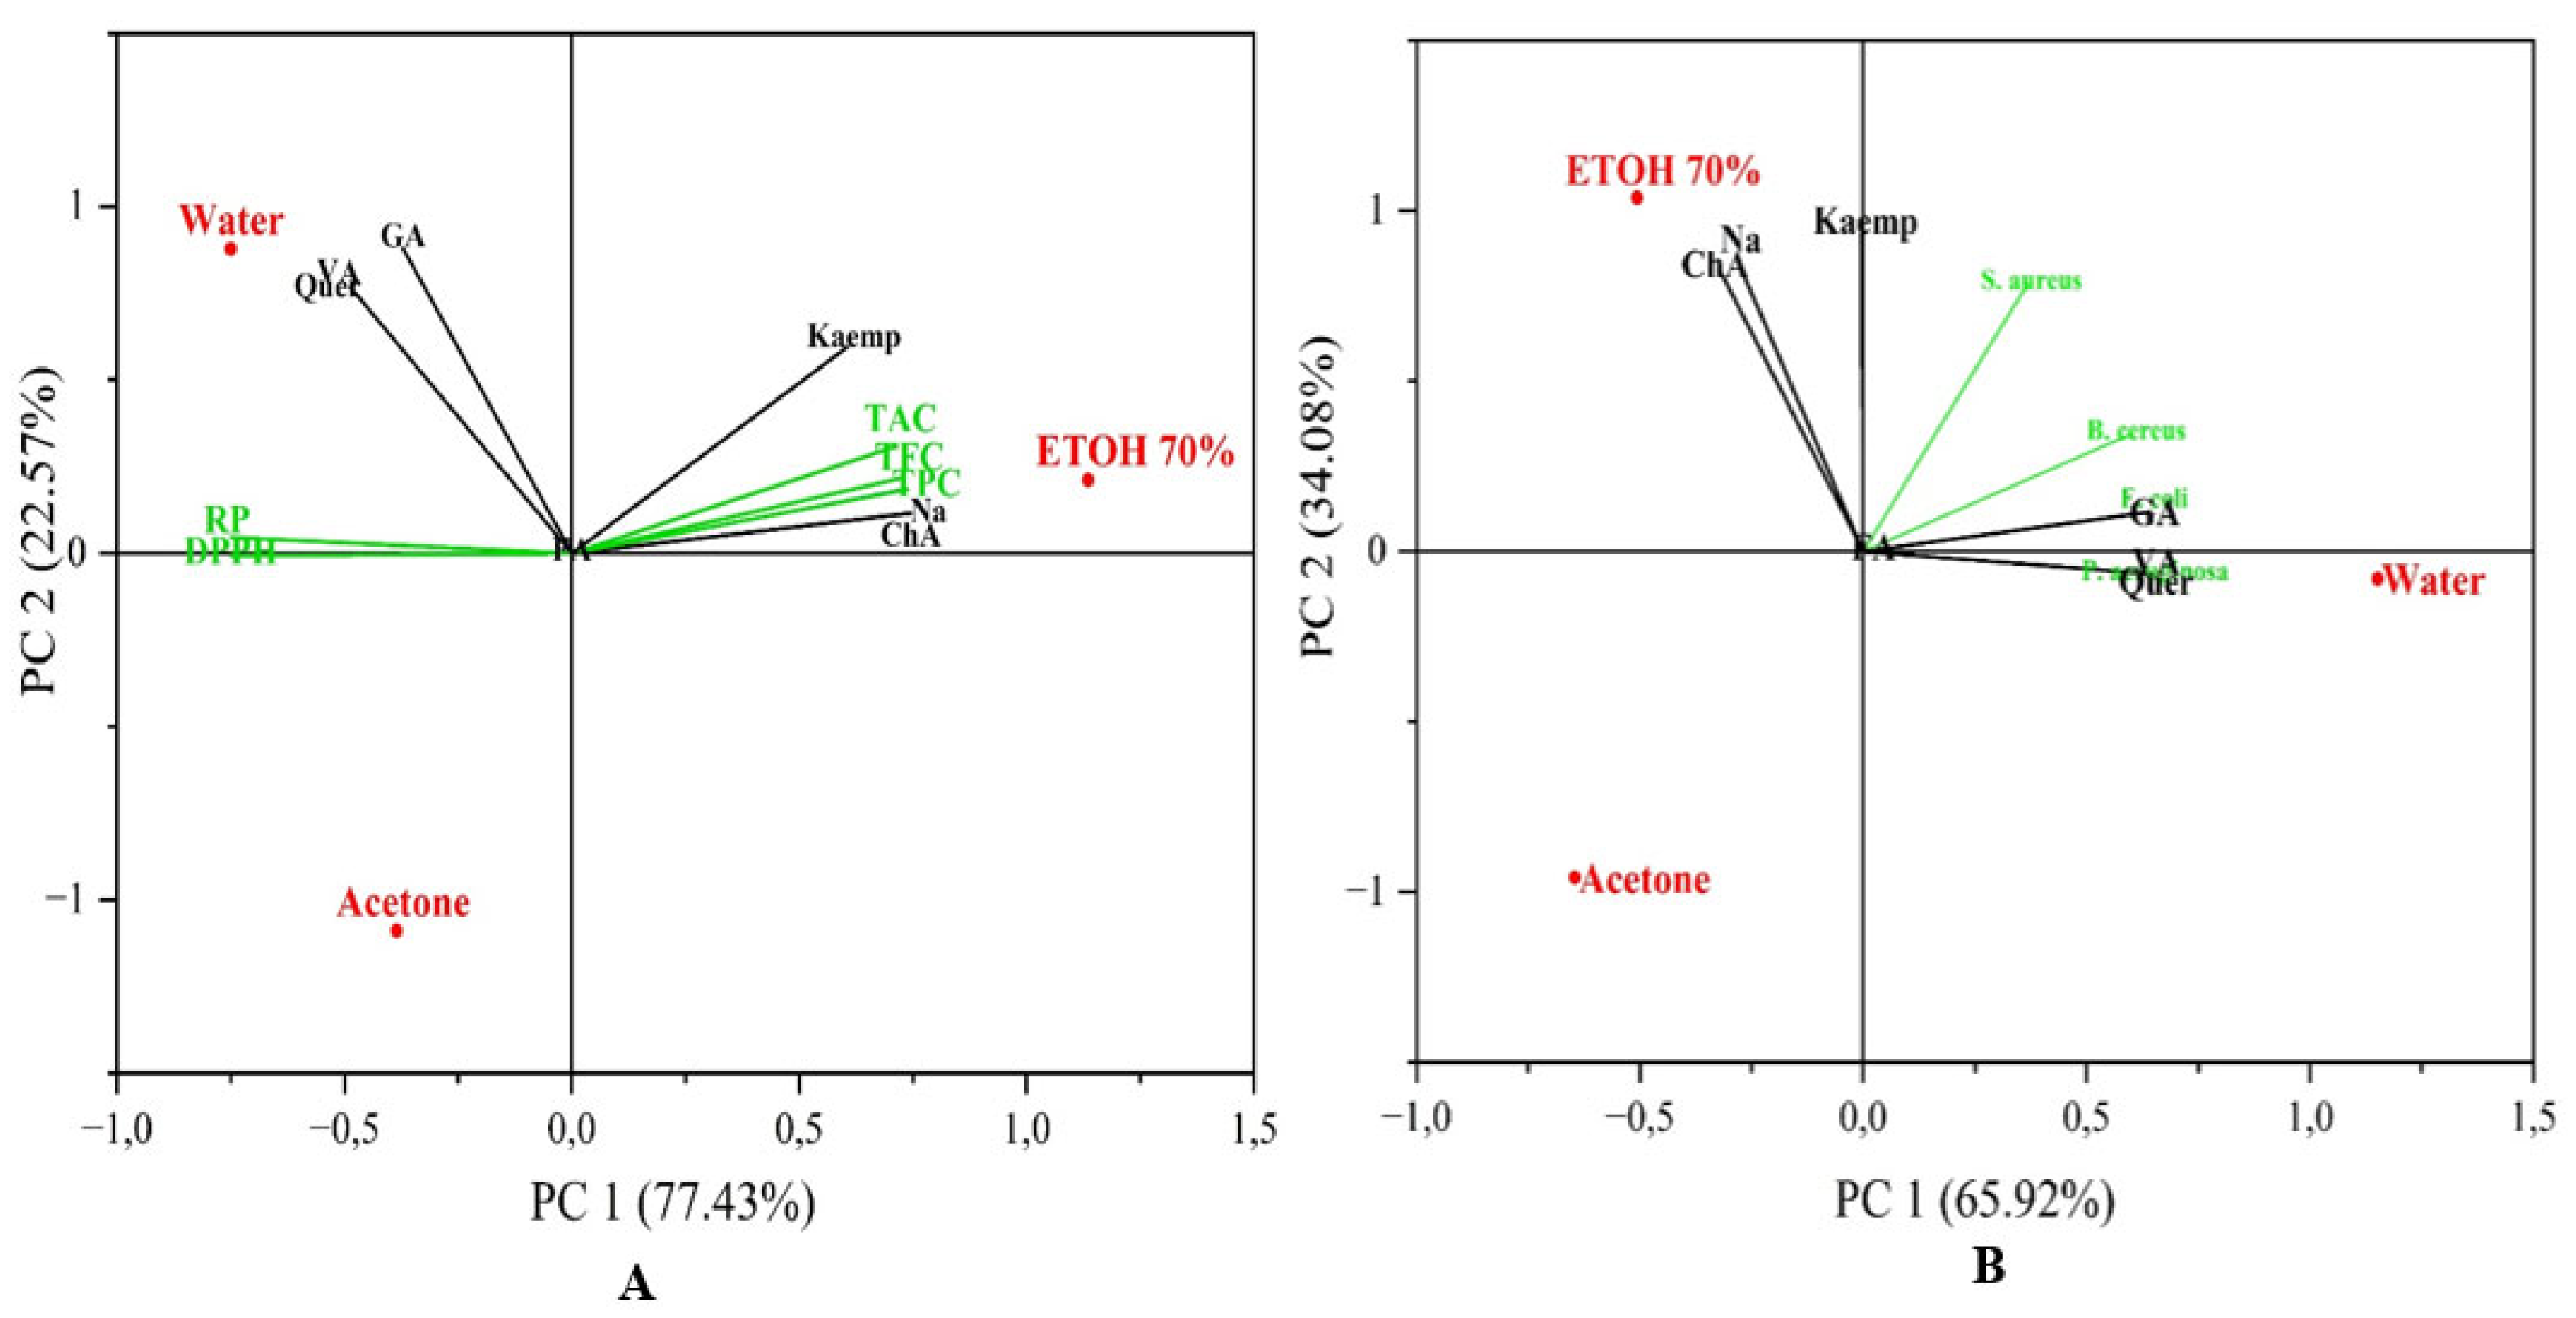

Table 1.
HPLC-DAD screening for individual phenolic molecules identified in the solvent extract of M. aquatica.
Table 1.
HPLC-DAD screening for individual phenolic molecules identified in the solvent extract of M. aquatica.
| Area % | ||||||
|---|---|---|---|---|---|---|
| Standards | MF | RT | Water | EtOH 70% | Acetone | |
| Gallic acid | C7H6O5 | 2.89 | 1.10 | 0.22 | nd | |
| Vanillic acid | C8H8O4 | 7.428 | 1.43 | nd | nd | |
| Ferulic acid | C10H10O4 | 12.236 | nd | nd | nd | |
| Chlorobenzoic acid | C7H5ClO2 | 16.799 | nd | 5.61 | 0.43 | |
| Quercetin | C15H10O7 | 3.307 | 0.39 | nd | nd | |
| Naringenin | C15H12O5 | 17.130 | nd | 2.45 | nd | |
| Kaempferol | C15H10O6 | 18.132 | 0.39 | 0.9 | nd | |
MF: molecular formula; RT: retention time (min); nd: non-detected.
Table 2.
Lowest inhibitory (MIC) and bactericidal concentrations (MBC) of various solvent extracts of different solvent extracts of M. aquatica (mg/mL).
Table 2.
Lowest inhibitory (MIC) and bactericidal concentrations (MBC) of various solvent extracts of different solvent extracts of M. aquatica (mg/mL).
| EtOH 70% | Acetone | Water | ||||||||||
|---|---|---|---|---|---|---|---|---|---|---|---|---|
| Bacterial strains | MIC | MBC | MBC/MIC | Effect | MIC | MBC | MBC/MIC | Effect | MIC | MBC | MBC/MIC | Effect |
| Gram-negative Bacteria | ||||||||||||
| P. aeruginosa | 6.25±0.00 | ND | - | - | 6.25±0.00 | ND | _ | _ | 6.37±0.16 | ND | _ | _ |
| E. coli | 6.25±0.07 | ND | - | - | 4.68±0.0 | ND | _ | _ | 12.60±0.00 | ND | _ | _ |
| Gram-positive Bacteria | ||||||||||||
| S. aureus | 6.18±0.08 | 50 ±2.03 | 8.08±0.43 | Bacteriostatic | 1.56±0.11 | 1.56±0.33 | 1 | Bactericidal | 6.25±0.10 | 6.25±1 | 1±0.0 | Bactericidal |
| B. cereus | 1.78±0.55 | 50 ±1.07 | 28.07 | Bacteriostatic | 0.78±0.05 | 0.78±0.25 | 1 | Bactericidal | 3.12±0.06 | 25±0.0 | 8.08 ±0.18 | Bacteriostatic |
ND: non-determined; MBC: Minimal bactericide concentration; MIC: Minimal inhibitory concentration.
Table 3.
Docking outcomes for multiple receptors ligands.
| Glide score (kcal/mol) | |||
|---|---|---|---|
| Antioxidant activity | Antibacterial activity | ||
| 2CDU | 1FJ4 | 3Q8U | |
| Chlorobenzoic acid | -6.084 | -6.496 | -8.448 |
| Ferulic acid | -5.401 | -6.558 | -7.933 |
| Gallic acid | -4.978 | -7.24 | -5.339 |
| Kaempferol | -5.543 | -5.959 | -8.984 |
| Naringenin | -6.181 | -6.336 | -8.209 |
| Quercetin | -6.587 | -5.929 | -8.991 |
| Vanillic acid | -6.12 | -6.217 | -8.01 |
Disclaimer/Publisher’s Note: The statements, opinions and data contained in all publications are solely those of the individual author(s) and contributor(s) and not of MDPI and/or the editor(s). MDPI and/or the editor(s) disclaim responsibility for any injury to people or property resulting from any ideas, methods, instructions or products referred to in the content. |
© 2024 by the authors. Licensee MDPI, Basel, Switzerland. This article is an open access article distributed under the terms and conditions of the Creative Commons Attribution (CC BY) license (http://creativecommons.org/licenses/by/4.0/).
Copyright: This open access article is published under a Creative Commons CC BY 4.0 license, which permit the free download, distribution, and reuse, provided that the author and preprint are cited in any reuse.


