Submitted:
08 July 2024
Posted:
10 July 2024
You are already at the latest version
Abstract
The mental health impact of the environmental crisis, particularly eco-anxiety, is a growing research topic whose measurement still lacks consensus. In this article, we use item response theory (IRT) to better un-derstand what existing questionnaires measure. To conduct this review, we used open-access data from the short French version of the Climate Change Anxiety Questionnaire (Mouguiama-Daouda et al. 2022, Heeren et al., 2023). Our results suggest that, of the different models tested, the unidimensional model seems to be the most appropriate for measuring eco-anxiety. The item difficulty parameter extracted from the IRT enabled us to discuss the level of severity of the items making up this tool. The Climate Change Anxiety Questionnaire is more appropriate for measuring severe to moderately severe eco-anxiety. Ave-nues for improving this questionnaire and the measurement of eco-anxiety in general are then discussed.
Keywords:
eco-anxiety
; item response theory
; continuum
; Climate Change Anxiety Scale
1. Introduction
The continuum hypothesis of eco-anxiety
For several years now, there has been growing interest in the impact of the ecological crisis on mental health. The term often used to describe this phenomenon is eco-anxiety. However, there is a heterogeneity in the way it is defined [1,2,3]. What is common, however, is the idea that eco-anxiety is a form of psychological distress of varying significance [3,4,5,6], ranging from severe distress to what might be described as worry or concern. Thus, eco-anxiety can be situated along a continuum ranging from mild forms of eco-anxiety to more severe forms generating emotional, cognitive, social, and/or functional difficulties [3,4,7,8]. Many authors seem to focus on the most severe forms of eco-anxiety, adopting a pathologizing approach to the concept [9] rather than adopting a continuous perspective that allows climate anxiety to be viewed as a continuum of reactions ranging from mild to severe reactions to the ecological crisis [2,10]. Indeed, even the mildest forms of climate anxiety can have motivational consequences, prompting people to adopt a more eco-responsible lifestyle [11].
Attempting to quantify eco-anxiety is relatively a new task [4,5]. Thus, not all measurement tools incorporate in their development the idea of a continuous conception of eco-anxiety. For example, Lutz et al [2] demonstrate that the Climate Change Anxiety Scale (CCAS, [4]), one of the most widely used tools in the world, only assesses severe manifestations of eco-anxiety, thus serving a clinical (even psychologizing) approach to identifying people in need of care.
Several authors have attempted to quantify this psychological discomfort linked to climate change and the environmental crisis in other ways, but no conceptualization takes into account the full spectrum of this discomfort. Beyond the clinical aspect assessed by the CCAS, the psychological reaction to the environmental crisis is assessed either as worry via the Climate Change Worry Scale [12] or as distress and impairment by the Climate Change Distress and Impairment Scale [13]. The Hogg Eco-Anxiety Scale (HEAS, [5]) claims to measure non-pathological eco-anxiety and represents an alternative to the CCAS. However, this questionnaire adapts items from the GAD-7, which is a questionnaire for measuring generalized anxiety disorder; a questionnaire considered by Jordan et al. [14] to be reserved for the diagnosis of severe anxiety. Thus, HEAS scores appear to be highly correlated with CCAS scores [15]. What’s more, both questionnaires have the same floor effect problem. For both the CCAS [4,16] and the HEAS [5,15], the means reported (with comparable standard deviations slightly below 1) are close to the lower limit of the Likert scale used, with the exception of the last factor of the HEAS. This makes these scales particularly poor at detecting mild forms of eco-anxiety.
Logic dictates that, through the distinction of two boundaries (weak and strong), intermediate stages of eco-anxiety should exist. The only attempt to combine the two "ends" of the concept in a single questionnaire is that of Àgoston et al. [17]. It gives rise to two factors representing the two extimities: habitual ecological worry and negative consequences of eco-anxiety. However, the factor analysis does not identify a factor representing an intermediate stage of eco-anxiety.
However, we think that it’s important to have a tool that covers the whole spectrum of anxiety caused by climate change, so as to be able to understand the reasons behind this variability between individuals, or even for the same individual, depending on the context and the time of measurement. Consequently, climate change anxiety scale that measures clinical eco-anxiety might not be a fitted tool to use amongst the general population.
This article is a first step in exploring this spectrum of eco-anxiety. Using statistical methods derived from item response theory (IRT) [18], we wish to examine the factor structure of the CCAS [4]. We assume that the choices made by the authors (factor analysis) make it difficult to express an approach in terms of a hierarchy of symptom severity. To examine such a hypothesis, we will adopt another statistical perspective (item response theory) offering a theorization of eco-anxiety as a continuum probably more in tune with the reality of the unease felt by people about the climate crisis, as it provides us with the possibility to describe the evolution of the phenomenon by conserving the scaling property of a questionnaire.
Item response theory
It is very conventional to consider the ordinal categorical modalities of a Likert scale as numerical and continuous, in order to be able to apply linear modeling (principal component analysis). This assumption of linearity can in the case of principal component analysis give rise to completely artifactual factors (for a detailed critique on principal component analysis see: [19,20]. In contrast to the frequently used linear model, Item Response Theory (IRT) takes into account the fact that response modalities are categorical and bounded. Categorial in a sense that the scale is discrete not continuous and bounded in a sense that it’s finite non infinite like the linear model suppose that the data is. What's more, unlike conventional testing methods, IRT distinguishes between an item's level of difficulty and its ability to discriminate between individuals. More precisely, IRT stipulates that the probability of an individual responding in an extreme manner to an item (the indicator) depends on his or her ability to endorse the phenomenon (latent trait) described by it. Thus, the IRT makes it possible to standardize on the same scale the level of difficulty of each item in terms of people's ability to endorse them, so that they can be compared. As a result, two people with a comparable score, according to the factorial analyses, may not be at the same level of endorsement of the phenomenon studied in relation to the level of difficulty of the items.
De Boeck [21] demonstrates, for example in relation to the use of psychological tests, that scores of a person's ability to endorse the latent trait produced by IRT models offer us the possibility of identifying a hierarchy of symptoms experienced by people. Factor analyses, on the other hand, are based on averages, which erase information on how participants responded to the items most diagnostic of the phenomenon, thus preventing us from identifying the most symptomatic participants.
In the specific case of eco-anxiety, for example, it is claimed that 8 out of 10 French people suffer from eco-anxiety [22]. IRT provides a solution to this examination by projecting individuals' latent trait scores onto the same graphical space as the difficulty level of the proposed items. This method thus provides a description of the phenomenon that is closer to reality (see [23]).
Furthermore, according to Clayton & Karazsia [4], there is no clear threshold for the transition from adaptive climate anxiety to maladaptive eco-anxiety. They argue that a person with an overall CCAS score above the median is one for whom climate change is having a significant impact on their mental health. Hogg et al. [5] challenge this proposal, since for them only people with extreme overall scores on the HEAS should be considered as suffering from severe eco-anxiety.
The aim of this article is to provide some keys to clarifying these fuzzy areas relating to the conceptualization and measurement of eco-anxiety through the use of IRT. Our approach will be limited to the particular casee of the CCAS, since we already have two data sets at our disposal: one from study 2 by Mouguiama-Daouda et al. [16], and one from the study by Heeren et al. [24]. The data relate to responses from a total of 1,778 participants. These two datasets were chosen because they are of comparable size (N=905 and N =873 respectively).
In its initial validation, the CCAS is a 22-item scale that describes 4 dimensions: cognitive and emotional difficulties, functional difficulties, experience (direct or indirect of climate change) and environmental commitment. Researchers refer to the first two as measuring eco-anxiety and the last two as control factors [4]. However, several studies have shown that removing the last two dimensions improves the psychometric quality of the scale (e.g. [16,25]). We therefore follow these recommendations and use only the first 13 items of the scale, which cover the dimensions of cognitive and emotional impairment, and functional impairment, which we will refer to as CCAS-13.
In their article validating the CCAS in French, Mouguiama-Daouda et al. [16] carried out only confirmatory factor analyses to test the one- or two-factor structure of the CCAS-13 and the 4-dimensional structure (22-item version). They retained the 2-factor structure of the 13-item version. We would like to confirm this structure of the CCAS-13 by checking whether there are other models that fit the data better. According to Immekus et al. [26], in addition to theoretical and empirical data, the choice of instrument model must be made following exclusion of the presence of other models that could lead to an alternative explanation of the factor structure. Cruz and High [27] explored a second-order model for the CCAS-13. They found that both CCAS-13 factors are summarized by an overall second-order factor, i.e. they measure the same construct. Thus, they recommend the use of a hierarchical structure (one global factor and two first-order factors). On the other hand, Larionow et al. [28] found that a 3-factor solution was better than the 2-factor solution in the Polish context, although they did not report the significance of this difference. They also observed that correlations between factors are relatively high, and recommend the use of global scale scores. Tam et al. [29] demonstrate in a sample of participants from three Asian countries and the USA that a single-factor model does not have a good fit, and argue that the alternative two-factor solution is probably better. Nevertheless, the inter-factor correlations for the latter solution remain very high (this is true for each of the four countries represented in this study) and suggest the existence of a hierarchical structure such as mentioned by Cruz and High [27] and Larionow et al. [28]. To summarize, a lot of models tested on the CCAS and CCAS-13 seem to be plausible but not consensual.
In this article, we continue to explore alternative models that may provide a more plausible explanation of the eco-anxiety continuum. Using the IRT method, we explore alternative models that may have a better fit to the data. First, we revisit the unidimensional model, the two-factor model and the 3-factor model to compare the fit indicators given by IRT with the results of previous research. To explain the strong correlations between the CCAS-13 dimensions found in the literature, we will also test the bifactor model [30]. According to Gibbons and Cai [31], the latter is more appropriate for "self-report measures of health status covering both physical and emotional difficulties" (p. 52). This model compiles a general factor of the phenomenon and the uncorrelated sub-domains that make it up. It is therefore more flexible than the hierarchical model in explaining correlated factor structures [32]. Indeed, the bifactor model allows us to decide on the relevance of subdomain scores by looking at the saturation force not absorbed by the general factor [33].
Figure 1 shows the different models tested in this article.
2. Materials and Methods
The short version of the CCAS (13 items) is evaluated in this article, hence the acronym CCAS-13. According to its developers, the CCAS-13 is made up of eight items measuring "cognitive and emotional impairment" and five items measuring "functional impairment". Responses are based on a 5-point Likert-type frequency scale ("never", "rarely", "sometimes", "often" and "always").
Data was retrieved from: https://osf.io/m3ygz/ for 905 respondents of Mouguiama-Daouda et al. [16] study 2. Data from 873 respondents in Heeren et al. [24] were retrieved from: https://osf.io/2r659/. The data are made available by the researchers under the "CC-By attribution 4.0 International" license.
Data analysis was performed with the MIRT package [34] on R software [35], version 4.3.0. The Graded Response Model (GRM) [36] was used. This model is suitable for the analysis of ordinal data, particularly Likert scales [37]. It is also more flexible than other IRT models in that it allows the discrimination parameter to be estimated for each item [38]. Statistical analyses of the data were carried out in two stages: 1) tests of goodness of fit of models 2) verification of the psychometric properties of the chosen model.
For the first stage, four models were tested: the unidimensional model, the multidimensional 2- and 3-factor model, and the bifactorial model. Model fit was tested using the limited information goodness-of-fit statistic M2 [39]. This test is more appropriate than the Pearson’s test statistic χ² especially in the context of IRT models [39]. The M2 test belongs to the limited information test category. These tests were designed to solve the problem faced by full information tests like the χ²: they depend on all the information in the contingency table, especially in models with many variables, where the probability of combining certain categories is becoming increasingly rare. Indeed, according to Steinberg & Thissen [40], for a number of categories greater than or equal to 5, the fit approximation becomes invalid for any model as soon as the number of items exceeds six, regardless of sample size. One of the major interests of IRT is to tackle the problem of probability sparsity by examining the sample in terms of how participants responded to difficult answers [41]. The idea behind limited-information tests is to reduce the dependence on probabilities for rare response combinations [42], which can improve the power of the tests and the accuracy of the model fit assessment. Probability boxes removed from the contingency table are, in fact, more likely to appear (see [43] for more on the difference between limited-information and full-information tests).
Apart from the M2 test, we also consulted the values of other important indicators. In particular, we followed the recommendations of Maydeu-Olivares and Joe [44] that an RMSEA (Root Mean Square Error of Approximation) of less than 0.089 and a SRMR (Standardized Root Mean Square Residual) of less than 0.05 are acceptable model fits for the IRT. We also took into account the Comparative Fit Index (CFI) and the Tucker Lewis Index (TLI). They range from 0 to 1, indicating that model fit is acceptable when their respective values are above .90, and that model fit is excellent when their respective values are above .95 [45,46]. We have also reported the values of the Akaike Information Criterion (AIC) [47]. This indicator, which incorporates complexity and level of fit into its equation, is useful when selecting the best model from among several plausible ones [48]. A low AIC value indicates a better model [49].
Once the most suitable model had been selected, the psychometric qualities of the chosen model were checked. For each item, we evaluated the parameters of discrimination (noted a) and difficulty (noted b1, b2, b3, b4 respectively relative to the 50% probability of choosing “rarely” over “never”, then “sometimes” over “rarely”, then “often” over “sometimes” and finally “always” over “often”). Based on the principle that, according to IRT, the latent trait is represented by a continuum going from a low level to a high level, the discrimination parameter (a) determines how well an item is able to discriminate individuals along the latent trait continuum [50]. According to Baker [51], item discrimination becomes acceptable when the a value is greater than or equal to 0.5. Difficulty parameters (b1...4) are based on thresholds at which an individual has a 50% probability or more of selecting any category of an item [52]. The b1...4 values are standardized on a scale ranging, in our case, from -6 to 6. This choice was made in order to be able to graphically represent the most difficult modalities of the scale with values (greater than 3). A b value close to -6 reflects ease of endorsement of the item category in question. Conversely, an item category with a b value close to 6 is difficult to endorse.
One of the advantages of IRT is the independence of the estimated item parameters from the sample, and therefore the relative consistency of estimates across samples. Thus, a well-fitted model will always return the same item parameter estimates, regardless of the sample [53]. As a result, the same analyses were carried out separately on the two datasets, with no major differences. Consequently, we will only present the results obtained on a single dataset from the work of Mouguiama-Daouda et al. [16] (N=905). The full analyses carried out on both datasets are presented in the Supplementary Materials.
3. Results
Model selection
A confirmatory analysis of the two-dimensional model leads us to observe the results as described in Table 1.
The results of the IRT-based dimensionality analysis are comparable to the results of the confirmatory factor analysis of study two by Mouguiama-Daouda et al. [16]. Moreover, the correlation between the two factors (cognitive and emotional impairment (CEI) and functional impairment (FI)) is even stronger at .83, compared with .66 in Mouguiama-Daouda et al. [16].
This result consolidates Cruz and High's [27] assertion that these two factors are not independent of each other; they could therefore be measuring one and the same construct: eco-anxiety. This leads us to question the relevance of this two-factor model, which could be modeled differently.
We therefore tested a three-factor model by carrying out an exploratory factor analysis, the results of which are presented in Table 1.
The M2 goodness-of-fit test of the 3-dimensional model is insignificant. We therefore retain the null hypothesis that this 3-factor model fits the data perfectly. The other indicators (RMSEA, SRMSR, etc.) confirm this finding. Moreover, this model is significantly better than the other two (Table 2).
In fact, the Cognitive and Emotional Difficulties (CEI) factor is divided into two, (potentially: physiological symptoms (SYM) and rumination (RUM)).
This 3-factor modelling (Table 3) is more faithful to the questionnaire construction process (the first 13 items) adopted by Clayton & Karazsia [4]. As a reminder, the first 4 items, which correspond here to the SYM factor, were constructed on the basis of reading the scientific literature, but also of people's experiences shared on blogs. The aim of these 4 items is to reflect "physical symptoms". The next 4 items belonging to the RUM dimension were indeed adapted from the rumination questionnaire by Treynor et al. [54]. As for the last 5 (from the CCAS-13 version), representing the functional impairment factor, they were adapted from the Weiss Functional Impairment Rating Scale [55]. This is in line with the 3-factor structure validated by Larionow et al. [28] in their Polish-language validation of the CCAS-13.
Despite its perfect fit to the data, this model nevertheless presents several questionable points. Beyond the correlations between factors, which remain relatively strong (Table 3: factors correlation), the variance explained by the 3-factor model with rotation (55.6%) is not much higher than the variance explained by the unidimensional model (46%). Without rotation, the first factor explains 41.4% of the variance (Table 4), while the second and third explain only 7.4% and 7.3% of the total variance respectively.
The bifactorial model, the last model we tested, is likely to provide more explanation of the strong correlations between the previously extracted factors. The results show that it fits the data significantly better than the unidimensional model, in contrast to what Cruz and High [27] found. However, it does not show a significant improvement over the 3-dimensional model (see Table 2).
We note, however, that the general factor absorbs all item saturation. The saturations of the scale's sub-domains are low, and even negative for some items. Furthermore, most of the explained variance of the two-factor model is attributed to the global factor (Table 5). This translates into an explained variance of the general factor of the bifactor model comparable to that of the unidimensional model (Table 6). We therefore confirm the recommendation put forward by Cruz and High [27], inviting researchers and practitioners to report mainly the global scores of the CCAS. In line with what these authors suggest, our analyses show that the CEI and FI factor scores are somewhat irrelevant. In conclusion, although there are models that fit the data as well or better than the unidimensional model, several other statistical parameters lead us to reject them and retain the unidimensional model as the most reliable model for measuring climate anxiety by the CCAS. All the more so as this choice seems more consistent with the idea of a continuum of eco-anxiety.
Psychometric properties of the CCAS-13 unidimensional model
Overall, all items have a satisfactory discrimination index (a) (Table 7). However, item 7 has an a-value of less than 1, which means that its wording needs to be readjusted or reformulated. Although acceptable, the discrimination value of this item is not as high as that of the other items, especially as item 7 has proved problematic in several other studies [16,27,28].
The IRT classifies the response modalities of each item on the same axis by calculating threshold values corresponding to a 50% probability of choosing a given modality (Table 6 and Figure 2). It also calculates a general difficulty value for each item (Figure 3).
The overall difficulty level of the items compared with participants' scores on the latent trait (Figure 3) shows that the CCAS-13 mainly provides information on high levels of eco-anxiety. In itself, the CCAS-13 serves the authors' objective [4] of identifying severe to clinical cases of climate change anxiety. As a result, the questionnaire provides little information on almost half the sample, who identify to little or none of the current CCAS-13 items. For these participants, the CCAS-13 points to an absence of symptoms as described by the items, but tells nothing about their mental state in relation to climate change.
4. Discussion
The present study explores alternative CCAS-13 factor structures that may better explain climate anxiety. We argued in favor of using the one-dimensional model rather than the 2- or 3-factors model of the CCAS-13. Our results are in line with what has been found in the literature about the goodness of fit of the unidimensional model [16,27]. Indeed, the 2- and 3-dimensional models present a problem of strong correlations between their dimensions. This means that the different factors measure almost the same thing. This misinterpretation might partly be due to the almost systematic choice of oblique rotations [56].
Although rotation simplifies model selection and interpretation, it can also be misleading [56]. Factors interpreted a posteriori are merely the result of the chosen rotation. This choice of rotation exacerbates what Van Schuur and Kiers [20] call the "extra factor" phenomenon in exploratory factor analyses. These authors describe how, for a potentially bipolar concept, factor analyses misinterpret the (potentially quadratic) relationship between the latent dimension and its indicators, transforming what should be a unidimensional bipolar phenomenon into a multidimensional one whose factors are more or less independent. furthermore, the discussion around the eco-anxiety continuum, and the distinction between practical eco-anxiety and paralyzing eco-anxiety, raised questions about the multi-factor modeling of this construct. A recurring feature of the CCAS-13 data modelling we carried out without axis rotation is that there is always a dominant factor that explains most of the variance on its own. The bifactor model, which we also tested and which proposes a solution to circumvent the use of rotations, confirms that a general climate anxiety factor is the most relevant in the case of CCAS-13.
We have also demonstrated the usefulness of the IRT method in providing new perspectives on the conceptualization of eco-anxiety. It consolidates the tool, but also opens up prospects for its improvement. Indeed, the results of the item response model show that the positions of the items in terms of difficulty are similar in the analysis of the different data sets, thus indicating a good consistency of the eco-anxiety construct as described by CCAS-13. Consequently, it would be more interesting to validate tools based on a hierarchy of symptom severity.
In this regard, we note that items from the two dimensions defined by Clayton & Karazsia [4] overlap on the eco-anxiety continuum. By interpreting the position of the items and analyzing their content in depth, we can begin to trace a continuum of the place eco-anxiety takes in a person's life. According to the results, it starts with: 1) having problems managing one's needs and interest in the sustainable; 2) questioning the way the environmental situation is handled cognitively and emotionally; 3) having social problems and a loss of meaning at work; and 4) falling into despair, accompanied by severe physical symptoms such as crying and nightmares.
However, one part of the continuum remains unexplored: that which concerns people with low scores. This limits the use of the CCAS among the general public, and raises questions about how this issue is represented.
Based on the floor effects observed on the distributions of the various items, states other than those described above are likely to be grouped in the non-anxious category. However, even if these people do not suffer from severe symptoms, they may nonetheless feel a certain amount of anxiety and stress relative to the perceived environmental crisis. In a recent qualitative study, Marczak et al. [11] show that people who are strongly affected by the ecological crisis may not present any of the symptoms described in the CCAS-13 [11]. If this questionnaire is to be adapted to a general population, we need to consider adjusting and supplementing it by including items that refer to less severe manifestations, and thus have a tool that could fit in with the idea of a continuum relating to eco-anxiety.
5. Conclusions
A number of researchers are now advocating this idea [2,7], which makes it possible to identify people who are worried, stressed or even anxious about climate change, even though they do not display any manifestations measured by the CCAS or HEAS. In the current state of literature, we have several tools that can be used to identify different levels of discomfort with climate change (i.e. Climate Change Worry Scale, Climate Change Distress Scale, HEAS). Combining these measurement instruments with the CCAS would support the idea suggested by Mathé et al. [15] of developing a unified measurement scale covering the entire eco-anxiety continuum. The availability of such a tool would make it possible not only to care for people suffering from eco-anxiety that they are unable to manage on their own, but also to offer others the opportunity to engage in action to enable them to manage the discomfort they feel on their own.
Limitations
This study is not without limitations. For starter, participants questioned in the samples are French-speaking Europeans. Thought, comparison is made with modeling conducted on an American population. In no way can we guarantee the absence of a cultural effect on modeling. Furthermore, the analysis package for bifactorial models is limited. As a result, certain tests could not be carried out. So, the evaluation of the bifactorial model should be carried out again when the appropriate tools are available, since according to Gibbons and Cai [31], the bifactorial model is more promising due to its greater accuracy, especially in the context of supposedly multidimensional data.
Perspectives
In order to validate a questionnaire that could be used with the entire population, we would have to resort to "computer adaptive testing" [57]. This method would require the development of a large panel of questions based on the CCAS-13 items, but also consider for what a more moderate level of eco-anxiety encompasses. In this way, we could better identify the threshold for distinguishing between the pathological and motivational dimensions of eco-anxiety relating to the ecological transition [11]. The use of other statistical methodologies, such as the Receiver Operating Characteristic (ROC) [58], could enable the definition of thresholds and optimally detect false positives.
Supplementary Materials
The following supporting information can be downloaded at: www.mdpi.com/xxx/s1
Author Contributions
Conceptualization, Hannachi. T. and Somat. A.; methodology, Hannachi. T.; software, Hannachi. T.; validation, Hannachi. T. and Yakimova. S.; formal analysis, Hannachi. T.; investigation, Hannachi. T.; data curation, Hannachi.T.; writing—original draft preparation, Hannachi. T.; writing—review and editing, Somat. A. and Yakimova. S.; supervision, Somat. A. All authors have read and agreed to the published version of the manuscript.
Funding
This study is à part of the first author’s Ph.D. project which is cofounded by the university of Rennes 2 and the region of Brittany.
Conflicts of Interest
The authors declare no conflicts of interest. The funders had no role in the design of the study; in the collection, analyses, or interpretation of data; in the writing of the manuscript; or in the decision to publish the results.
References
- Coffey, Y.; Bhullar, N.; Durkin, J.; Islam, M. S.; Usher, K. Understanding eco-anxiety: A systematic scoping review of current literature and identified knowledge gaps. The Journal of Climate Change and Health 2021, 3, 100047. [Google Scholar] [CrossRef]
- Lutz, P. K.; Passmore, H.; Howell, A. J.; Zelenski, J. M.; Yang, Y.; Richardson, M. The Continuum of Eco-Anxiety Responses: A preliminary investigation of its nomological network. Collabra 2023, 9 (1). [CrossRef]
- Pihkala, P. Anxiety and the Ecological Crisis: An analysis of Eco-Anxiety and Climate Anxiety. Sustainability 2020, 12(19), 7836. [Google Scholar] [CrossRef]
- Clayton, S.; Karazsia, B. T. Development and validation of a measure of climate change anxiety. Journal of Environmental Psychology 2020, 69, 101434. [Google Scholar] [CrossRef]
- Hogg, T. L.; Stanley, S. K.; O’Brien, L.; Wilson, M.; Watsford, C. The Hogg Eco-Anxiety Scale: Development and validation of a multidimensional scale. Global Environmental Change 2021, 71, 102391. [Google Scholar] [CrossRef]
- Verplanken, B.; Marks, E.; Dobromir, A. I. On the nature of eco-anxiety: How constructive or unconstructive is habitual worry about global warming? Journal of Environmental Psychology 2020, 72, Article 101528. [Google Scholar] [CrossRef]
- Passmore, H.; Lutz, P. K.; Howell, A. J. Eco-Anxiety: a CCAScade of fundamental existential anxieties. Journal of Constructivist Psychology 2022, 36(2), 138–153. [Google Scholar] [CrossRef]
- Soutar, C.; Wand, A. Understanding the spectrum of anxiety Responses to climate change: A Systematic Review of the Qualitative literature. International Journal of Environmental Research and Public Health 2022, 19(2), 990. [Google Scholar] [CrossRef] [PubMed]
- Kurth, C.; Pihkala, P. P. Eco-anxiety: What it is and why it matters. Frontiers in Psychology 2022, 13. [Google Scholar] [CrossRef] [PubMed]
- Léger-Goodes, T.; Malbœuf-Hurtubise, C.; Mastine, T.; Généreux, M.; Paradis, P.; Camden, C. Eco-anxiety in Children: A scoping review of the mental health impacts of the awareness of climate change. Frontiers in Psychology 2022, 13. [Google Scholar] [CrossRef] [PubMed]
- Marczak, M.; Winkowska, M.; Chaton-Østlie, K.; Morote Rios, R.; Klöckner, C. A. “When I say I’m depressed, it’s like anger.” An exploration of the emotional landscape of climate change concern in Norway and its psychological, social and political implications. Emotion, Space and Society 2023, 46. [CrossRef]
- Stewart, A. E. Psychometric Properties of the Climate Change Worry Scale. International Journal of Environmental Research and Public Health 2021, 18(2), 494. [Google Scholar] [CrossRef] [PubMed]
- Hepp, J.; Klein, S. A.; Horsten, L. K.; Urbild, J.; Lane, S. P. Introduction and behavioral validation of the climate change distress and impairment scale. Scientific Reports 2023, 13 (1). [CrossRef]
- Jordan, P.; Shedden-Mora, M. C.; Löwe, B. Psychometric analysis of the Generalized Anxiety Disorder scale (GAD-7) in primary care using modern item response theory. PLOS ONE 2017, 12(8), e0182162. [Google Scholar] [CrossRef] [PubMed]
- Mathé, M.; Grisetto, F.; Gauvrit, N.; Roger, C. Psychometric validation of the French version of the Hogg Eco-Anxiety Scale (HEAS-FR). Canadian Journal of Behavioural Science / Revue canadienne des sciences du comportement 2023. Advance online publication. [CrossRef]
- Mouguiama-Daouda, C.; Blanchard, M. A.; Coussement, C.; Heeren, A. On the measurement of climate change anxiety: French validation of the climate anxiety scale. Psychologica Belgica 2022, 62(1), 123. [Google Scholar] [CrossRef] [PubMed]
- Ágoston, C.; Urbán, R.; Nagy, B.; Csaba, B.; Kőváry, Z.; Kovács, K.; Varga, A.; Dúll, A.; Mónus, F.; Shaw, C. A.; Demetrovics, Z. The psychological consequences of the ecological crisis: Three new questionnaires to assess eco-anxiety, eco-guilt, and ecological grief. Climate Risk Management 2022, 37, 100441. [Google Scholar] [CrossRef]
- Van Der Linden, W. J. Handbook of Item Response Theory, Three Volume Set; Chapman and Hall/CRC eBooks, 2018. [CrossRef]
- Noel, Y.; Fevrier, F.; Deflandre, A. Two factors but one dimension: An alternative view at the structure of mood and emotion. PsychArchiv 2018. [CrossRef]
- Van Schuur, W. H.; Kiers, H. A. Why factor analysis often is the incorrect model for analyzing bipolar concepts, and what model to use instead. Applied Psychological Measurement 1994, 18(2), 97–110. [Google Scholar] [CrossRef]
- De Boeck, P. Psychological testing. In Handbook of Item Response Theory: Applications; Van Der Linden, W. J., Ed.; Chapman and Hall/CRC Press, 2018; Vol. 3, pp 313–328.
- Herbemont, A. Éco-anxiété : huit Français sur 10 se disent inquiets face au changement climatique. Franceinfo, 2023, 25 octobre. https://www.francetvinfo.fr/replay-radio/le-brief-politique/eco-anxiete-huit-francais-sur-10-se-disent-inquiets-face-au-changement-climatique_6114024.html.
- Embretson, S. E.; Reise, S. P. Item Response Theory for Psychologists; Lawrence Erlbaum Associates Publishers: Mahwah, NJ, 2000. [Google Scholar]
- Heeren, A.; Mouguiama-Daouda, C.; McNally, R. J. A network approach to climate change anxiety and its key related features. Journal of Anxiety Disorders 2023, 93, 102625. [Google Scholar] [CrossRef] [PubMed]
- Hogg, T. L.; Stanley, S. K.; O’Brien, L. Synthesising psychometric evidence for the Climate Anxiety Scale and Hogg Eco-Anxiety Scale. Journal of Environmental Psychology 2023, 88, 102003. [Google Scholar] [CrossRef]
- Immekus, J. C.; Snyder, K. E.; Ralston, P. A. Multidimensional Item Response Theory for Factor Structure Assessment in Educational Psychology Research. Frontiers in Education 2019, 4. [Google Scholar] [CrossRef]
- Cruz, S. M.; High, A. C. Psychometric properties of the climate change anxiety scale. Journal of Environmental Psychology 2022, 84, 101905. [Google Scholar] [CrossRef]
- Larionow, P.; Sołtys, A.; Fedyk, M. Methodological triangulation to measure climate change awareness and anxiety among students. International Journal of Environmental Research and Public Health 2023, 20(6), 4612. [Google Scholar] [CrossRef]
- Tam, K.-P.; Chan, H.-W.; Clayton, S. Climate change anxiety in China, India, Japan, and the United States. J. Environ. Psychol. 2023, 87, 1–14. [Google Scholar] [CrossRef]
- Gibbons, R. D.; Bock, R. D.; Hedeker, D.; Weiss, D.; Bhaumik, D. K.; Kupfer, D.; Frank, E.; Grochocinski, V.; Stover, A. Full-information item bi-factor analysis of graded response data. Appl. Psychol. Meas. 2007, 31, 4–19. [Google Scholar] [CrossRef]
- Gibbons, R. D.; Cai, L. Dimensionality analysis. In Handbook of Item Response Theory: Applications, 2nd ed.; Vander Linden, W. J., Ed.; Chapman and Hall/CRC Press: Boca Raton, FL, 2018; Vol. 3, pp. 47–65. [Google Scholar]
- Rijmen, F. Formal relations and an empirical comparison between the bi-factor, the testlet, and a second order multidimensional IRT model. J. Educ. Meas. 2010, 47, 361–372. [Google Scholar] [CrossRef]
- Reise, S. P. The rediscovery of bifactor measurement models. Multivar. Behav. Res. 2012, 47, 667–696. [Google Scholar] [CrossRef] [PubMed]
- Chalmers, R. P. mirt: A Multidimensional Item Response Theory Package for the R Environment. J. Stat. Softw. 2012, 48(6), 1–29. [Google Scholar] [CrossRef]
- R Core Team. R: A Language and Environment for Statistical Computing; R Foundation for Statistical Computing: Vienna, Austria, 2023; https://www.R-project.org/. [Google Scholar]
- Samejima, F. Estimation of Latent Ability Using a Response Pattern of Graded Scores. Psychometr. Monogr. Suppl. 1969, 34(4), 100. [Google Scholar] [CrossRef]
- Ayala, R. J. The Theory and Practice of Item Response Theory; Guilford Press: New York, NY, 2009. [Google Scholar]
- Baker, F. B.; Kim, S. H. Item Response Theory: Parameter Estimation Techniques; CRC Press: Boca Raton, FL, 2004. [Google Scholar]
- Cai, L.; Hansen, M. Limited-information goodness-of-fit testing of hierarchical item factor models. Br. J. Math. Stat. Psychol. 2012, 66(2), 245–276. [Google Scholar] [CrossRef] [PubMed]
- Steinberg, L.; Thissen, D. Uses of item response theory and the testlet concept in the measurement of psychopathology. Psychol. Methods 1996, 1(1), 81–97. [Google Scholar] [CrossRef]
- Reckase, M. D. Multidimensional Item Response Theory; Springer: New York, NY, 2009. [Google Scholar]
- Bartholomew, D. J.; Tzamourani, P. The goodness of fit of latent trait models in attitude measurement. Sociol. Methods Res. 1999, 27(4), 525–546. [Google Scholar] [CrossRef]
- Wirth, R.; Edwards, M. C. Item Factor Analysis: Current approaches and future directions. Psychol. Methods 2007, 12(1), 58–79. [Google Scholar] [CrossRef] [PubMed]
- Maydeu-Olivares, A.; Joe, H. Assessing approximate fit in categorical data analysis. Multivar. Behav. Res. 2014, 49(4), 305–328. [Google Scholar] [CrossRef] [PubMed]
- Bentler, P. M. Comparative fit indexes in structural models. Psychol. Bull. 1990, 107(2), 238–246. [Google Scholar] [CrossRef] [PubMed]
- Hu, L.-T.; Bentler, P. M. Cutoff criteria for fit indexes in covariance structure analysis: Conventional criteria versus new alternatives. Struct. Equ. Model. 1999, 6(1), 1–55. [Google Scholar] [CrossRef]
- Akaike, H. Factor analysis and AIC. Psychometrika 1987, 52(3), 317–332. [Google Scholar] [CrossRef]
- Bozdogan, H. Model selection and Akaike’s Information Criterion (AIC): The general theory and its analytical extensions. Psychometrika 1987, 52(3), 345–370. [Google Scholar] [CrossRef]
- Byrne, B. M. Structural Equation Modeling With AMOS: Basic Concepts, Applications, and Programming, 2nd ed.; Routledge: New York, NY, 2013. [Google Scholar]
- Embretson, S. E.; Reise, S. P. Item Response Theory, 2nd ed.; Psychology Press: New York, NY, 2013. [Google Scholar]
- Baker, F. B. The Basics of Item Response Theory, 2nd ed.; Eric Clearing House on Assessment and Evaluation: College Park, MD, 2001. [Google Scholar]
- Hambleton, R. K.; Swaminathan, H.; Rogers, H. J. Fundamentals of Item Response Theory; Sage Publications: Thousand Oaks, CA, 1991. [Google Scholar]
- Embretson, S. E.; Reise, S. P. Item Response Theory for Psychologists; Lawrence Erlbaum Associates Publishers: Mahwah, NJ, 2000. [Google Scholar]
- Treynor, W.; Gonzalez, R.; Nolen-Hoeksema, S. Rumination reconsidered: A psychometric analysis. Cognit. Ther. Res. 2003, 27(3), 247–259. [Google Scholar] [CrossRef]
- Weiss, M. D. Weiss functional impairment rating scale (WFIRS) self-report. University of British Columbia: Vancouver, Canada, 2000.
- Browne, M. W. An overview of analytic rotation in exploratory factor analysis. Multivar. Behav. Res. 2001, 36(1), 111–150. [Google Scholar] [CrossRef]
- Gibbons, R. D.; Weiss, D. J.; Kupfer, D. J.; Frank, E.; Fagiolini, A.; Grochocinski, V. J.; Bhaumik, D. K.; Stover, A.; Bock, R. D.; Immekus, J. C. Using computerized adaptive testing to reduce the burden of mental health assessment. Psychiatr. Serv. 2008, 59, 361–368. [Google Scholar] [CrossRef] [PubMed]
- Swets, J. A. Signal Detection Theory and ROC Analysis in Psychology and Diagnostics: Collected Papers; Lawrence Erlbaum Associates, Inc.: Mahwah, NJ, 1996. [Google Scholar]
Figure 1.
The four models tested in this study: (a) unidimensional model, (b) correlated 2 factor model (c) correlated 3 factor model (d) bifactor model
Figure 1.
The four models tested in this study: (a) unidimensional model, (b) correlated 2 factor model (c) correlated 3 factor model (d) bifactor model

Figure 2.
Projection of thresholds for the modalities of each item and participants' scores standardized on the same scale. Right panel represents participants' scores on the eco-anxiety dimension. Left panel represents thresholds for having a 50% chance of endorsing a particular modality with A = always, O = often, S= sometimes R = rarely.
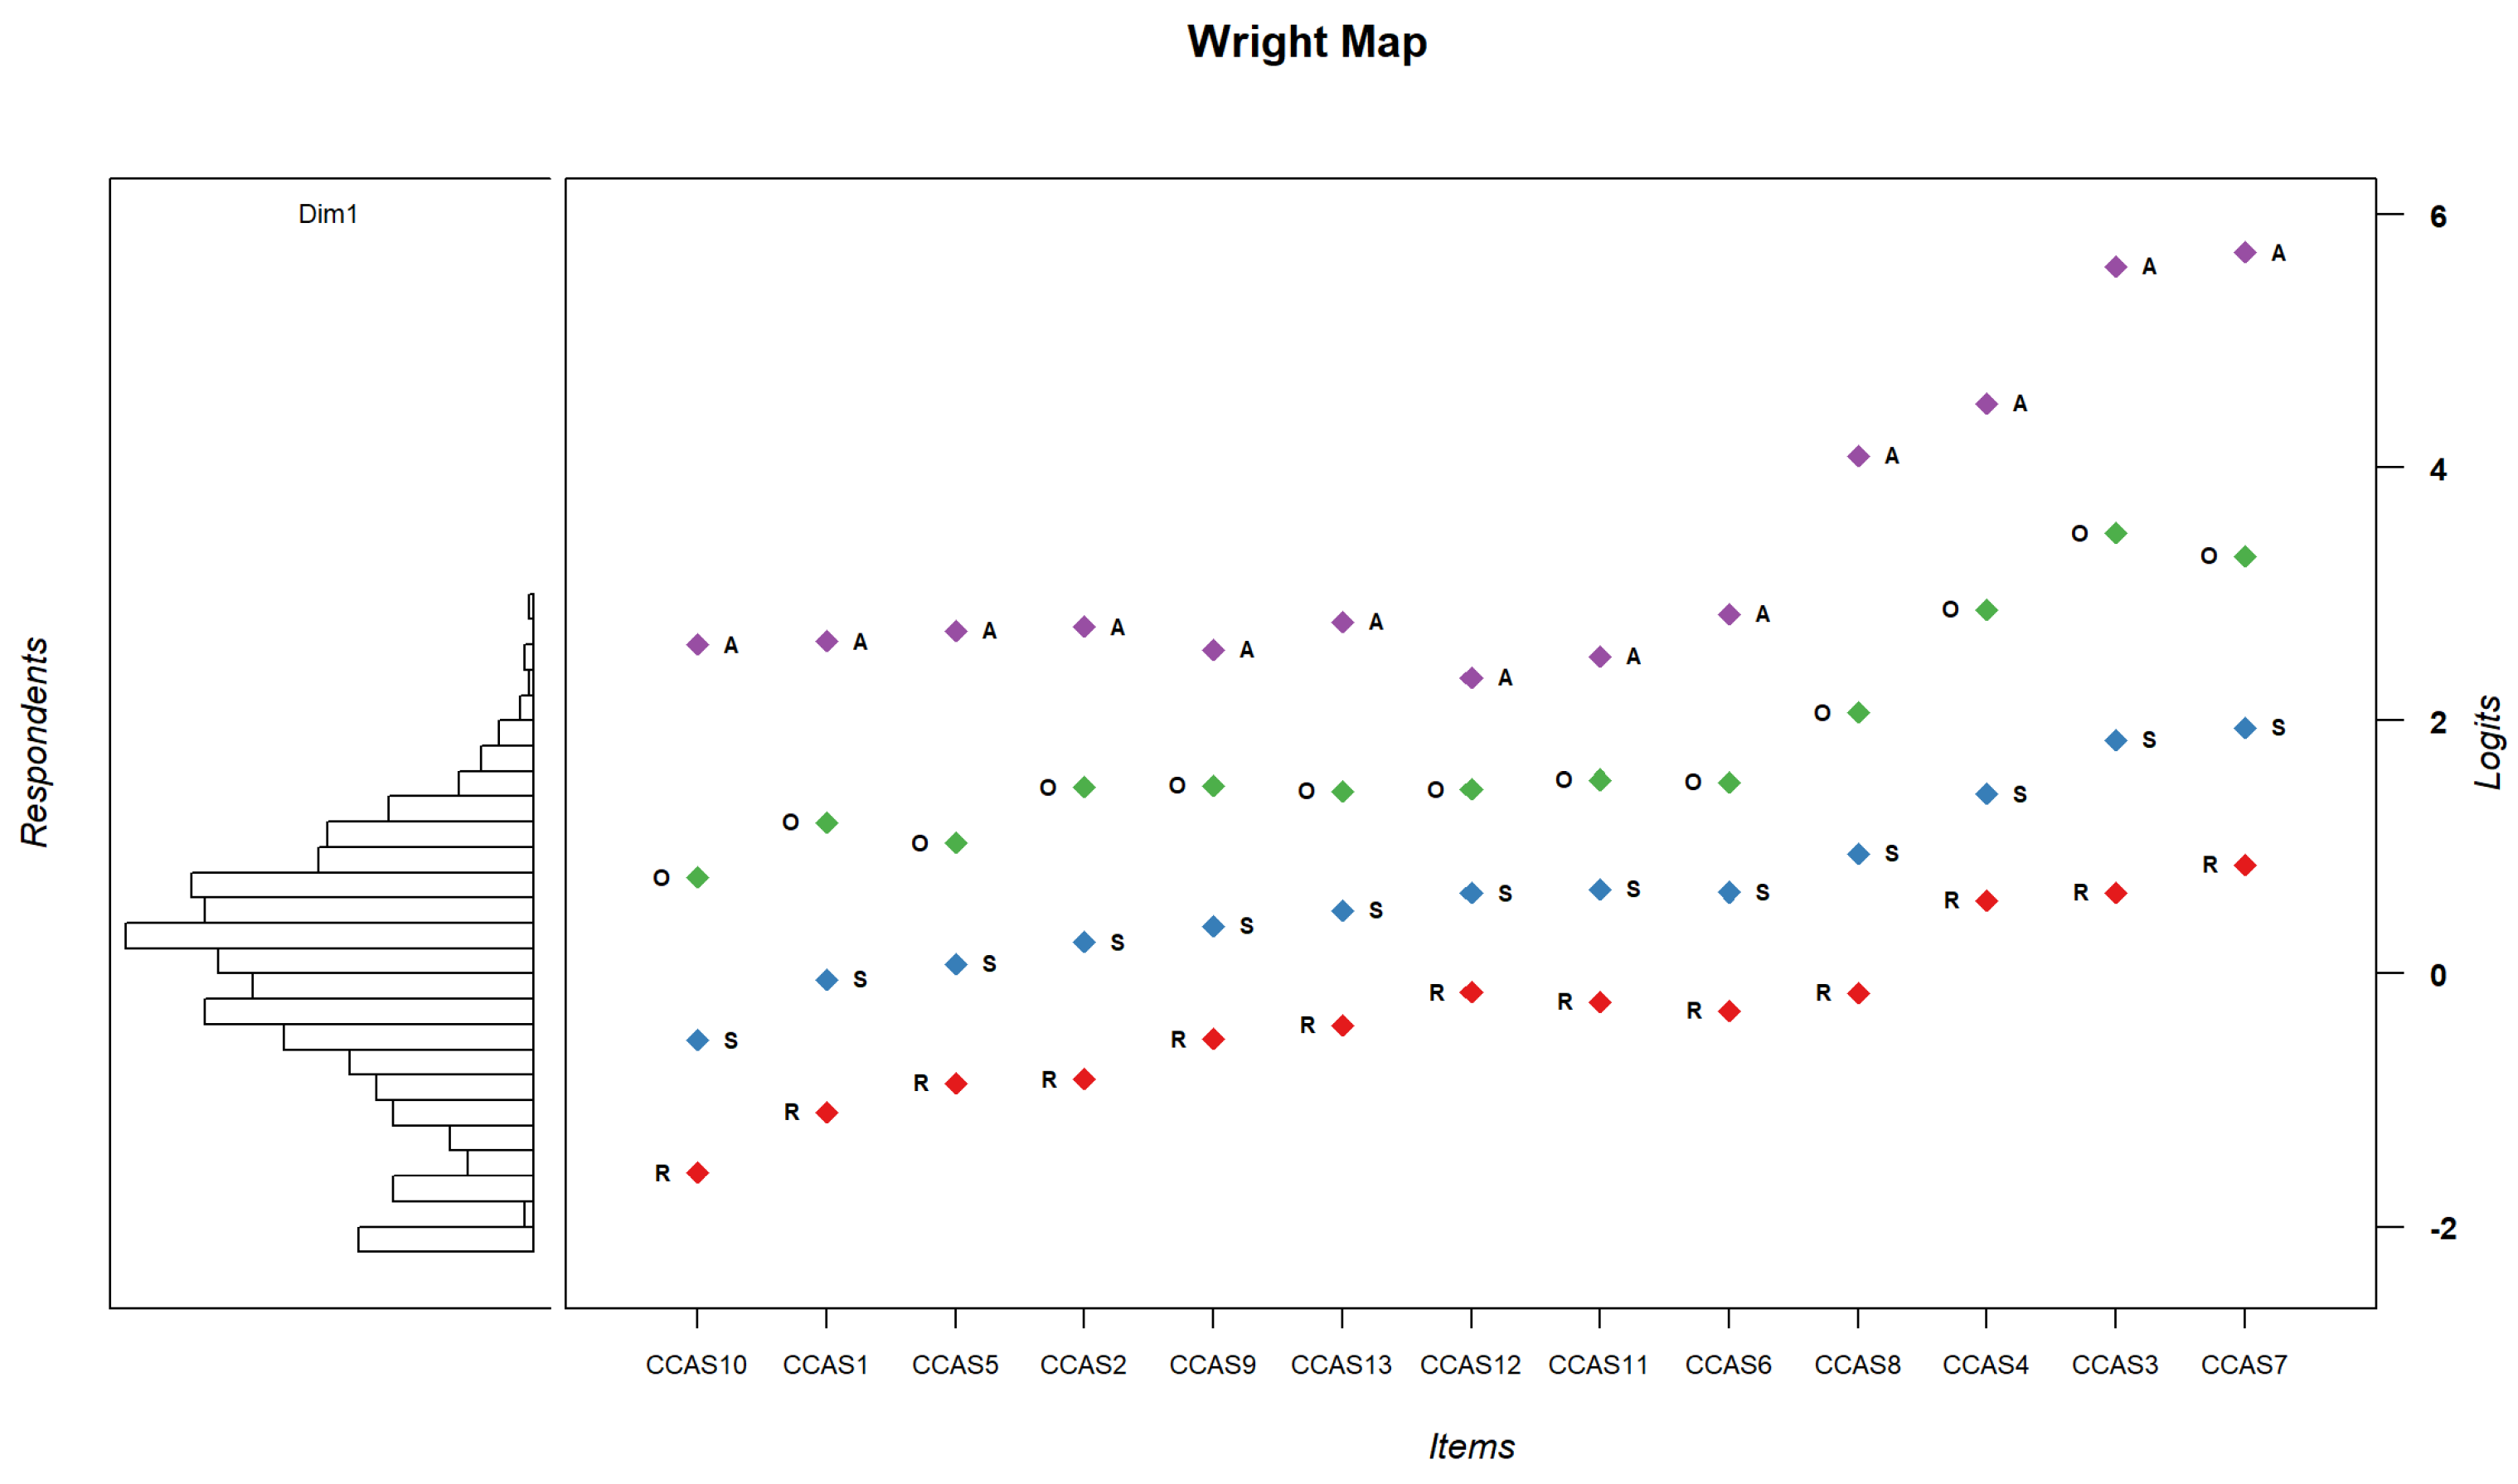
Figure 3.
Wright map: comparison between persons’ scores and general items difficulty. Right panel, items are sorted by their general level of difficulty. Left panel persons’ latent trait level of eco-anxiety.
Figure 3.
Wright map: comparison between persons’ scores and general items difficulty. Right panel, items are sorted by their general level of difficulty. Left panel persons’ latent trait level of eco-anxiety.
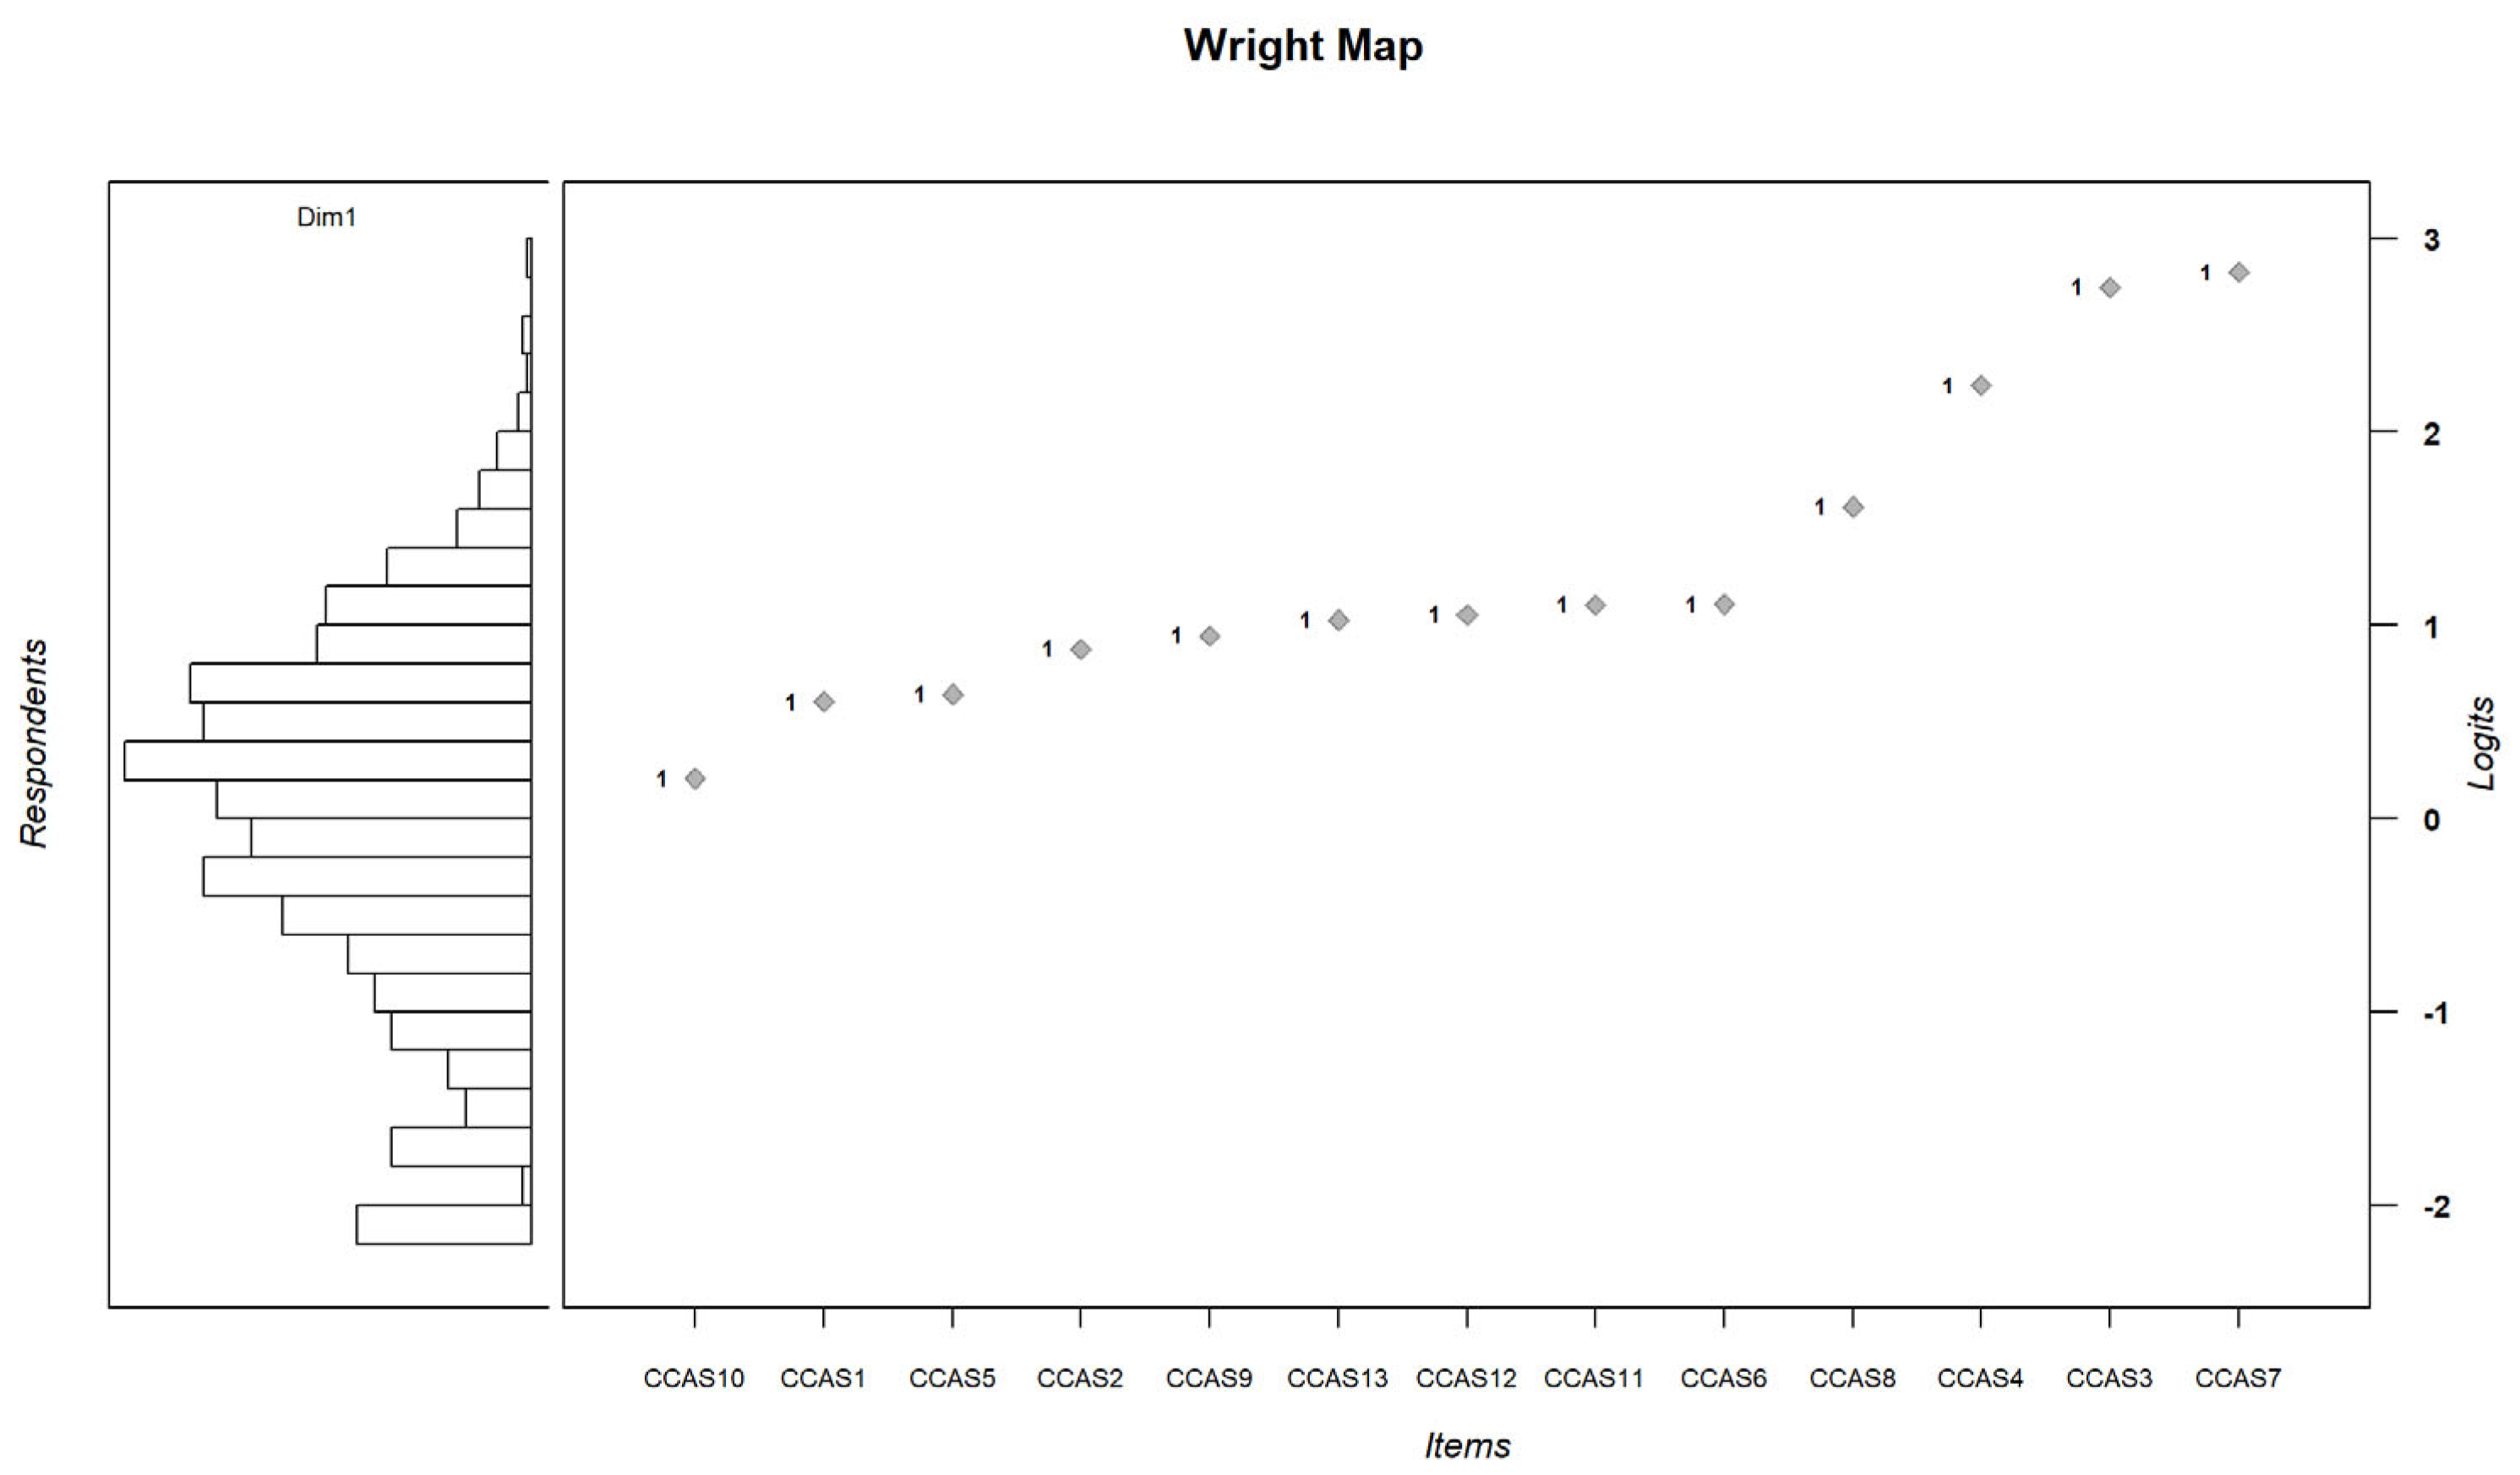

Table 1.
comparison of the fit of CCAS-13 models between the work of Mouguiama-Daouda et al. [16] and the present work.
Table 1.
comparison of the fit of CCAS-13 models between the work of Mouguiama-Daouda et al. [16] and the present work.
| Model fit tests performed by Mouguiama-Daouda et al. [16] | ||||||||
| Model | χ2 | df | p | RMSEA | SRMR | TLI | CFI | AIC |
| 1 factor | 542.26 | 65 | <.01 | .10 | .06 | .81 | .84 | 31355.91 |
| 2 factors | 390.48 | 64 | <.01 | .08 | .05 | .87 | .89 | 31170.33 |
| Model fit tests carried out in this work | ||||||||
| Model | M2 | df | p | RMSEA | SRMSR | TLI | CFI | AIC |
| 1 factor | 176.38 | 26 | <.001 | 0.08 | 0.074 | 0.91 | 0.94 | 27402.92 |
| 2 factors | 173.14 | 25 | <.001 | 0.08 | 0.07 | 0.90 | 0.94 | 27213.69 |
| 3 factors | 3.46 | 3 | 0.33 | 0.01 | 0.04 | 0.99 | 0.99 | 26974.11 |
| bifactor | 13.89 | 13 | 0.38 | 0.008 | 0.49 | 0.99 | 0.99 | 26959.97 |
Note. χ2: Pearson’s test statistic, M2: the limited information goodness-of-fit test statistic, df: degree of freedom, p: p value, RMSEA: Root Mean Square Error Approximation, SRMSR: Standardized Root Mean Squared Residual, TLI: Tucker-Lewis Index, CFI: Comparative Fit Index, AIC: Akaike Information Criterion.
Table 2.
Comparison between the 1 to 2 and 3 dimensional models and the two-factor model.
| Model | AIC | χ² | df | p |
|---|---|---|---|---|
| 1 factor | 27402.92 | |||
| 2 factors | 27213.69 | 191.234 | 1 | <.001 |
| 3 factors (Exploratory) | 26985.59 | 232.094 | 2 | <.001 |
| bifactor | 26959.97 | 5.857 | 10 | .82 |
Table 3.
3-factor model item saturation (with Oblimin rotation).
| FI | SYM | RUM | |
|---|---|---|---|
| CCAS1 | - | 0.58 | - |
| CCAS2 | - | 0.94 | - |
| CCAS3 | - | 0.69 | - |
| CCAS4 | - | 0.56 | - |
| CCAS5 | - | - | 0.65 |
| CCAS6 | - | - | 0.75 |
| CCAS7 | - | - | 0.43 |
| CCAS8 | - | - | 0.76 |
| CCAS9 | 0.80 | - | - |
| CCAS10 | 0.57 | - | - |
| CCAS11 | 0.86 | - | - |
| CCAS12 | 0.81 | - | - |
| CCAS13 | 0.61 | - | - |
| Factor correlations | |||
| FI | SYM | RUM | |
| FI | - | ||
| SYM | 0.650 | - | |
| RUM | 0.736 | 0.609 | - |
| Explained variance | |||
| FI | SYM | RUM | |
| Explained variance | 22.2% | 18.3% | 15.1% |
Table 4.
Comparison of factor loadings for the 3-dimensional model without rotation (right) and the unidimensional model (left).
Table 4.
Comparison of factor loadings for the 3-dimensional model without rotation (right) and the unidimensional model (left).
| F1 | |||
|---|---|---|---|
| CCAS1 | 0.73 | ||
| CCAS2 | 0.70 | ||
| CCAS3 | 0.58 | ||
| CCAS4 | 0.63 | ||
| CCAS5 | 0.64 | ||
| CCAS6 | 0.77 | ||
| CCAS7 | 0.45 | ||
| CCAS8 | 0.58 | ||
| CCAS9 | 0.79 | ||
| CCAS10 | 0.60 | ||
| CCAS11 | 0.81 | ||
| CCAS12 | 0.80 | ||
| CCAS13 | 0.65 | ||
| F1 | |||
| Explained variance | 46% | ||
| F1 | F2 | F3 | |
| CCAS1 | -0.66 | -0.39 | - |
| CCAS2 | -0.62 | -0.65 | - |
| CCAS3 | -0.49 | -0.47 | 0.22 |
| CCAS4 | -0.53 | -0.38 | 0.27 |
| CCAS5 | -0.55 | - | 0.45 |
| CCAS6 | -0.69 | - | 0.51 |
| CCAS7 | -0.39 | - | 0.27 |
| CCAS8 | -0.50 | - | 0.50 |
| CCAS9 | -0.82 | - | - |
| CCAS10 | -0.61 | - | - |
| CCAS11 | -0.85 | - | - |
| CCAS12 | -0.83 | - | - |
| CCAS13 | -0.64 | - | - |
| F1 | F2 | F3 | |
| Explained variance | 41.4% | 7.4% | 7.3% |
Table 5.
Comparison of saturations in the unidimensional model and the bifactor model.
| Unidimensional model | Bifactorial model | |||
|---|---|---|---|---|
| F | G | CEI | FI | |
| CCAS1 | 0.727 | 0.721 | 0.300 | - |
| CCAS2 | 0.700 | 0.735 | 0.539 | - |
| CCAS3 | 0.579 | 0.615 | 0.355 | - |
| CCAS4 | 0.631 | 0.661 | 0.250 | - |
| CCAS5 | 0.635 | 0.690 | -0.150 | - |
| CCAS6 | 0.766 | 0.836 | -0.215 | - |
| CCAS7 | 0.445 | 0.464 | -0.179 | - |
| CCAS8 | 0.581 | 0.650 | -0.254 | - |
| CCAS9 | 0.790 | 0.687 | - | 0.443 |
| CCAS10 | 0.597 | 0.525 | - | 0.315 |
| CCAS11 | 0.811 | 0.690 | - | 0.537 |
| CCAS12 | 0.803 | 0.691 | - | 0.502 |
| CCAS13 | 0.651 | 0.592 | - | 0.253 |
Table 6.
Comparison of variance explained between the unidimensional model and the bifactorial model.
Table 6.
Comparison of variance explained between the unidimensional model and the bifactorial model.
| Modèle unidimensionnel | Modèle bifactoriel | ||||
|---|---|---|---|---|---|
| F | G | CEI | FI | ||
| Explained variance | 46% | 44.2% | 5.7% | 6.9% | |
Table 7.
Discrimination and difficulty parameters for CCAS items N=905.
| a | b1 | b2 | b3 | b4 | |
|---|---|---|---|---|---|
| CCAS1 | 1,8 | -1,09 | -0,05 | 1,19 | 2,63 |
| CCAS2 | 1,67 | -0,84 | 0,25 | 1,47 | 2,74 |
| CCAS3 | 1,21 | 0,64 | 1,85 | 3,48 | 5,59 |
| CCAS4 | 1,38 | 0,58 | 1,42 | 2,88 | 4,51 |
| CCAS5 | 1,4 | -0,86 | 0,08 | 1,03 | 2,71 |
| CCAS6 | 2,03 | -0,29 | 0,64 | 1,51 | 2,84 |
| CCAS7 | 0,84 | 0,86 | 1,94 | 3,3 | 5,7 |
| CCAS8 | 1,22 | -0,15 | 0,95 | 2,06 | 4,09 |
| CCAS9 | 2,19 | -0,52 | 0,37 | 1,49 | 2,56 |
| CCAS10 | 1,27 | -1,57 | -0,53 | 0,76 | 2,6 |
| CCAS11 | 2,36 | -0,22 | 0,66 | 1,53 | 2,51 |
| CCAS12 | 2,3 | -0,15 | 0,63 | 1,45 | 2,34 |
| CCAS13 | 1,46 | -0,41 | 0,5 | 1,44 | 2,78 |
Disclaimer/Publisher’s Note: The statements, opinions and data contained in all publications are solely those of the individual author(s) and contributor(s) and not of MDPI and/or the editor(s). MDPI and/or the editor(s) disclaim responsibility for any injury to people or property resulting from any ideas, methods, instructions or products referred to in the content. |
© 2024 by the authors. Licensee MDPI, Basel, Switzerland. This article is an open access article distributed under the terms and conditions of the Creative Commons Attribution (CC BY) license (http://creativecommons.org/licenses/by/4.0/).
Copyright: This open access article is published under a Creative Commons CC BY 4.0 license, which permit the free download, distribution, and reuse, provided that the author and preprint are cited in any reuse.


