
Submitted:
12 June 2024
Posted:
10 July 2024
You are already at the latest version
Abstract
There are few results about the internal damping ratio of normal and high strength concretes. Hence, this paper presents the expansion of the investigation about internal damping ratio under undamaged and damaged conditions, for usual concretes (NSC) and high strength concretes (HSC). In this way, the study cover a strength range of 42 to 83 MPa. Cyclic load was employed by a servo-controlled hydraulic testing machine and for each cyclic step the dynamic elastic modulus (Ed) and internal damping ratio (ξ) were determinate by acoustic tests. Normal strength concretes (fc = 42MPa) presented undamaged internal damping ratio ξ = 0.5% and achieved the maximum value of ξ = 2.5 for a damage index equal to 0.8. High strength concretes mixtures (fc = 83MPa) presented an undamaged internal damping of ξ=0.29% and maximum internal damping equal to ξ=0.93% (under damage index of 0.32). Porosity and the transition zones were the responsible to the initial internal damping values and how the material behavior under each cyclic load. The progressive damage generates the increase of coulomb damping. There are few studies allowing the quantification and comprehension of internal damping ratio under damage cyclic loading and this approach will lead to improve the understanding of NSC and HSC under dynamical excitation subject to damage evolution, mainly in impact situations.
Keywords:
internal damping ratio
; acoustic tests
; usual concretes
; damage evolution
; high-strength concretes
1. Introduction
The internal damping ratio is a non-dimensional parameter that measures the material capacity to dissipate a vibration [1]. Bachmann et al. [2] report that is contained in the range of 0.1% to 1.0% for conventional concretes with low damage levels. Besides fundamental for describing the dynamics of structures by numerical models, the internal damping ratio also is an essential parameter used to describe the materials’ internal thermal shock [3,4] and its determination enables monitoring the degradation level of concrete structures [5].
The material’s internal damping ratio is composed by hysteretic, viscous, and Coulomb parcel [6,7]. Hysteretic internal damping is related to the sliding friction inside the microstructure [8], viscous damping is associated with the internal moisture into the cement matrix [8] and the Coulomb parcel is generated by internal friction between crack faces. The Coulomb damping is the most relevant mechanism that influences the concrete’s internal damping ratio [6,7,9,10].
Microstructural factors, like porosity, transition zone and previous micro-cracking are severely linked to internal damping ratio. A decrease of water-cement ratio, for example, generates an reduction of the porosity, the transition zone, and preexisting microcracking, improving the material’s integrity. When the material is more dense, the acoustic wave propagate more easily in the sample, and then, the internal damping ratio decreases[11,12,13,14]. On the other hand, when the material’s integrity is low, with a high level of cracks and porous, the material attenuate the acoustic signal [14]. This phenomenon occurs in different scales, for pastes, mortars, normal concretes [12,15,16] and UHPFRCs [14], affecting .
Under compressive strains, cracks already exist in the inter-facial transition zone (ITZ) and start to propagate from the aggregate-matrix interfaces, air voids, and pores. When the mechanical damage is induced in the samples, more attenuation occurs because due the arisen of discontinuities, which increases the material capacity of dissipating kinetic energy by friction between the crack faces that came up. Hence, the damping of the material can also be associated with the damage mechanisms occurring during severe loading and the pre-existing cracking [14].
Recent advances have be noted about the concretes internal damping ratio [17,18,19]. The effects of rubber powder on internal damping capacity of polypropylene fiber reinforced concrete (PFRC) were explored by Tian et al. [18]. The authors founded that the addition of rubber powder improves the damping capacity of PFRC. Tian et al. [17] also studied the incorporating damping aggregate (DA) in a new cement mortar, and observed that damping ratio of specimens containing 70% DA was approximately three times higher than that of the reference mortar, with a slight decrease in the mechanical properties. Li et al. [19] developed a freeze and flexural-loading coupling test to investigate the mechanical characteristics of concrete beams constituted by self-compacting concrete applied in filling layer (FLSCC). The authors shown that the flexural strength and the internal damping ratio of FLSCC decreases with increasing of cycle number, stress level and low temperatures.
Given this context, there are many studies of focused in special concretes [14,17,18,20]. Nevertheless, the damage index and internal damping ratio relation still are relatively unknown for conventional and high-strength concretes. Hence, this paper report the expansion of study of Gidrão et al. 2020 [14], and presents a investigation about internal damping ratio of usual concretes and high-strength concretes (i.e., a range of 42 MPa to 83 MPa), subject to cyclic mechanical loads. The obtained results can explain the behavior of internal damping ratio in function of mix parameters and damage evolution for each concrete class, and could be useful to input of damped dynamic models that considers the damage evolution.
2. Experimental Program
2.1. Materials and Mixtures
Table 1 presents the proportion (in weight) for the produced concrete mixtures. The relation of cement-aggregates was equal to 5 (mix proportions of 1 cement: 2 sand: 3 coarse aggregate). The water cement relation (w/c) was modified to 0.3 up to 0.7. Ten specimens were produced for each mixture concrete. Cement used was a Portland cement type III specified according to the classification of ASTM C150 [21], with 3.10 g/cm³ density. Sand used was graded as zone 1, with 0.60 mm maximum diameter and 1.74 fineness modulus [22] and 2,65 g/cm³ density. The coarse aggregate used was with maximum diameters equal to 9.5 mm and density equal to 2,75 g/cm³, all produced by diabasic rocks, classified as igneous. The grading curves of sand and coarse aggregate are shown to the Figure 1a,b, respectively. Superplasticizer employed in the mixture of w/c = 0.3 was Glenium 51, produced by BASF®.
The production of concrete samples consisted in (i) mix the cement and aggregates with no water addition, then (ii) water was added and the mixing procedure was performed until the material had shown a homogeneous appearance (iii) After hardening, the molds were removed and immediately stored in a moist chamber for curing until the age of testing. Five cylindrical samples of 200 mm x 100 mm were produced for each mix.
2.2. Cyclic Tests
Cyclic tests were conducted systematically until rupture in a servo-controlled hydraulic testing machine (Figure 2), at force ratio constant of 2.4 kN/s. Initially, the adopted criterion was performing the load until a per-established stress was achieved, generally as 50%, 60%, 70%, 80%, 90%, and 95% of . At end of each cycle, acoustic test was employed to determine the dynamic elastic modulus (), damage index () and the internal damping ratio. Figure 2 shows the setup used in cyclic tests. Figure 3 presents the characteristic force-displacement diagram for produced concretes.
2.3. Acoustic Tests
At the end of each cycle, acoustic tests (Figure 4) were accomplished to determine the damage indexes and internal damping ratio. The test procedure is established by ASTM C215-02 (2003) [23] and ASTM E1876-01 (2001) [24], which consists of using a hammer to impose a manual excitation of short duration on the samples. A uni-dimensional microphone captures the amplitude of the acoustic response in the time domain. After excitation, an onboard sound card of a regular notebook captured the acoustic signal at a 96 kHz acquisition rate. Next, this signal is processed by the software (SONELASTIC®). The software uses the 1024-point block firstly and multiply the signal by a flat-top window and then zero-padded for the obtaining of an 8192-point vector. Through a Fast Fourier Transform (FFT), the signal in the time domain can be transformed to the frequency domain. From this analysis, the natural frequency peaks are obtained. When the sample is excited by an eccentric impact, the characterization of frequency peaks and modes of vibration is similar to Figure 6. It is necessary to highlight that predictions of cylinders’ modes of vibration presented in Figure 4 were obtained from a numerical model using Abaqus® software. Such previous analysis enabled to accomplish the theoretical modal analysis and determine the natural frequencies and modes of vibration through eigenvalues analysis. More information could be found in Haach et al. [25]. According to ASTM C215-02 (2003) [23], for cylindrical concrete specimens, the dynamic elastic modulus () can be obtained by the first longitudinal mode (Equations (1) and (2)) and the first flexural mode (Equations (3) and (4)).
Where M is the mass of the sample (in kilograms), L and d are the length and diameter of the sample (in meters) respectively, is the frequency of the longitudinal vibration mode (Hz), is the frequency of flexural vibration mode (Hz), and T is a correction factor. The correction factor was derived by Pickett [26] and presented in Equation (5).
Where is the Poisson ratio, assumed as 0.20.
The damage index , is obtained with Equation (6):
Where is the dynamic elastic modulus at the i-th cycle, is the dynamic elastic modulus for the undamaged condition.
Besides, for each natural frequency peak, the software adjusts single curves that represent the evolution of the amplitude of each frequency recorded in the time-frequency matrix, and then, calculates the internal damping ratio through Equation (7) (see also Figure 7). The curve fitting is performed with the equation of Levemberg-Marquardt [27,28], a numerical method that selects a prioritized region by adjusting the amplitude function through experimental parameters. The internal damping ratio was obtained for flexural and longitudinal frequency peaks. For analysis performed in this paper, it was considered the longitudinal internal damping ratio, due the accuracy of this mode of vibration.
Where: and are consecutive amplitudes considered on the analysis, as shown in Figure 5; m is the number of peaks between amplitudes.
3. Results
Acoustic tests were performed in undamaged samples with the purpose of determine the influence of time maturity, water cement ratio and dynamic elastic modulus to internal damping ratio, in Section 3.1. After 28 days the internal damping ratio became stable, and then cyclic loading was performed to purpose a damage evolution, material degradation and observation of internal damping ratio, presented in Section 3.2.
3.1. Undamaged Samples
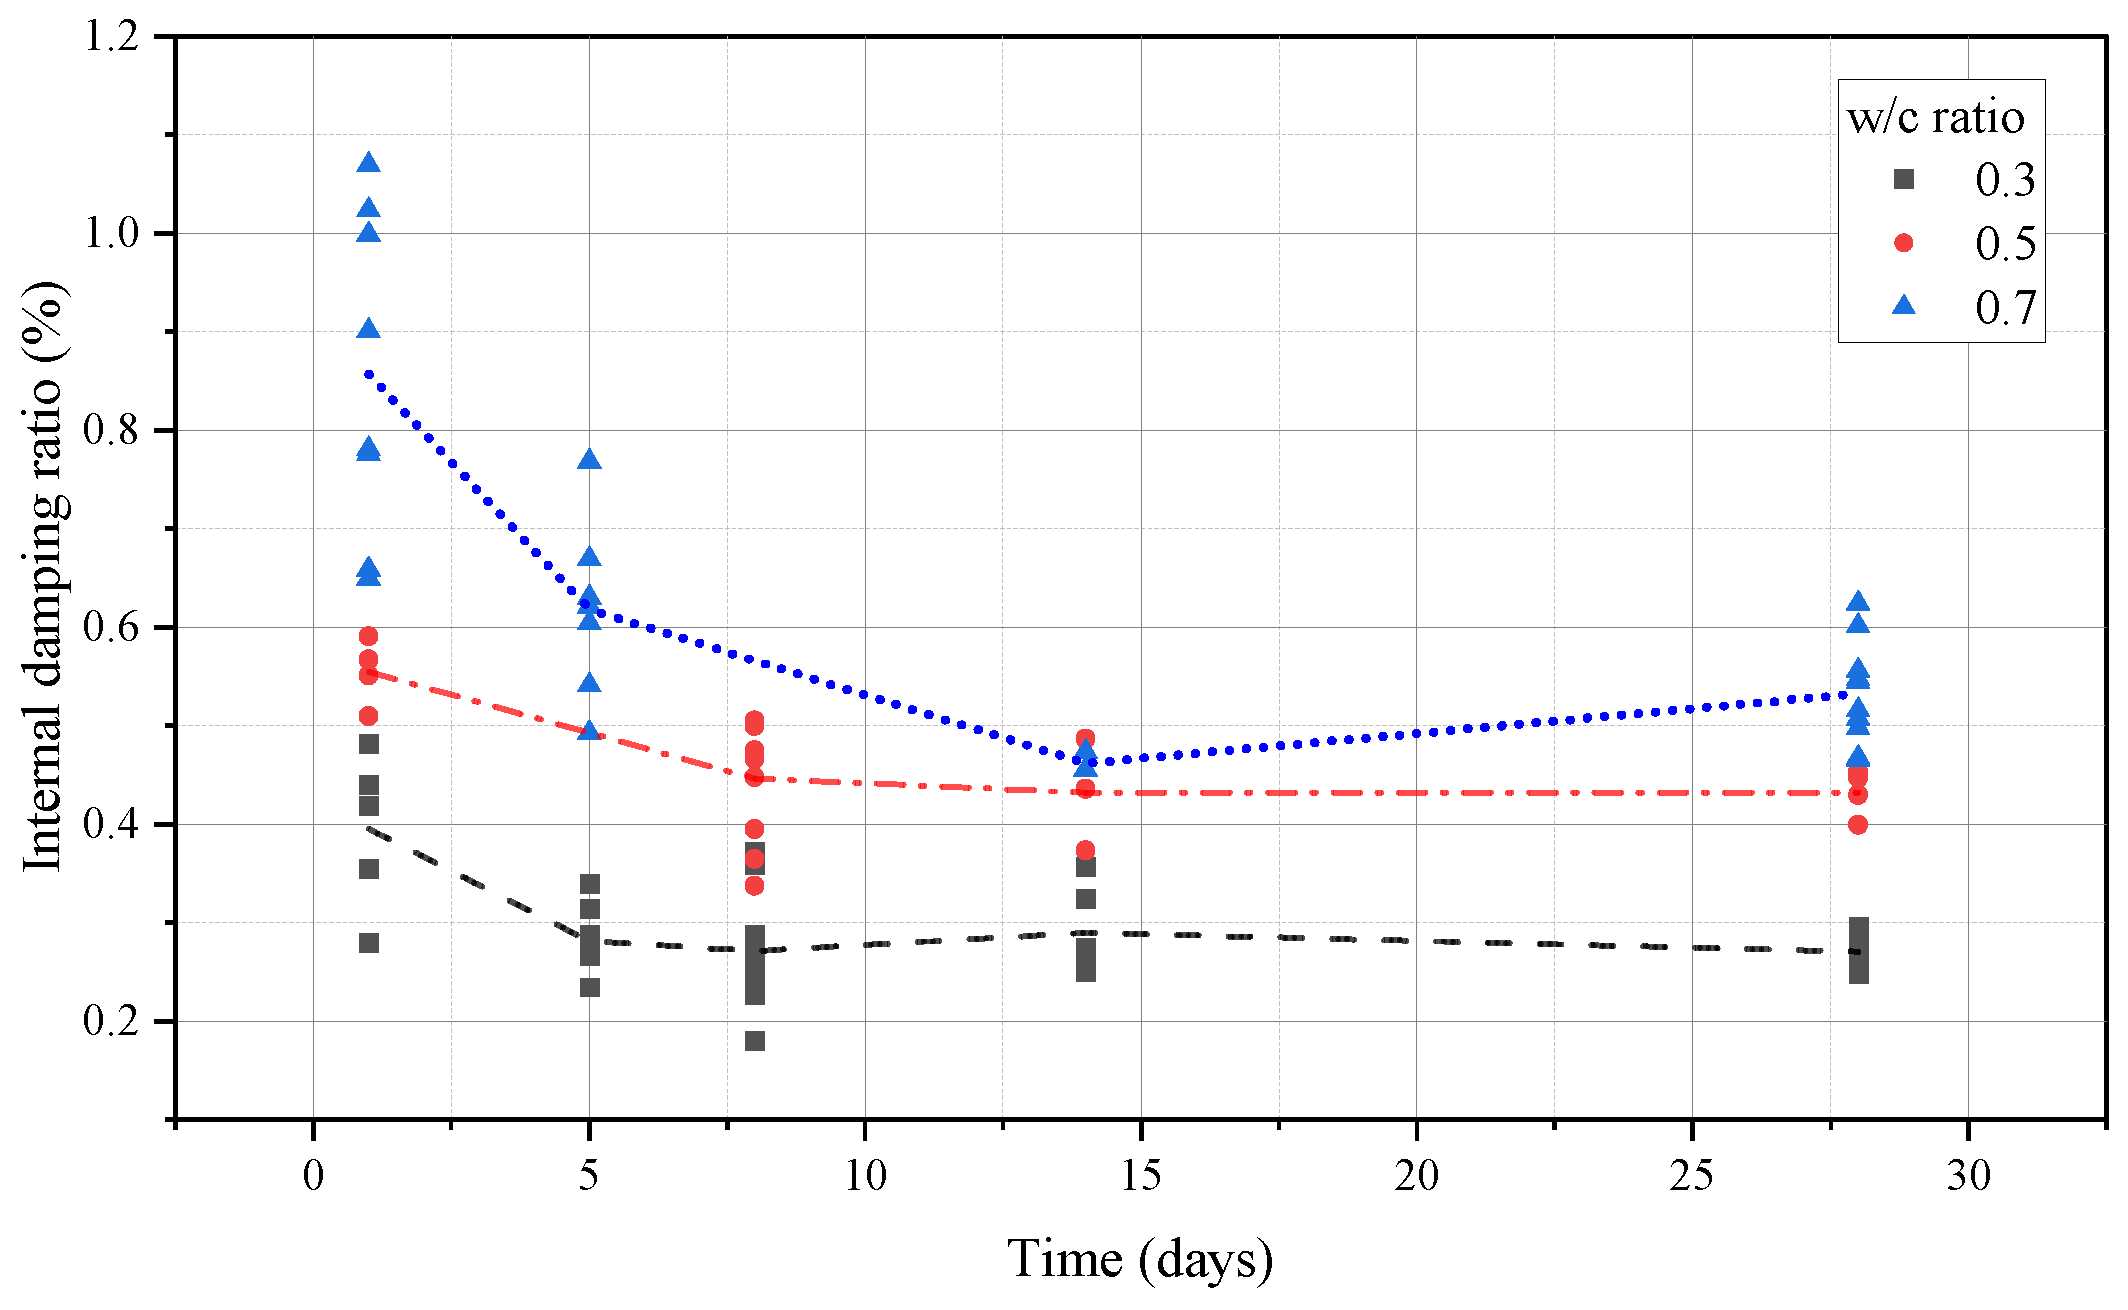
Figure 6, Figure 7 and Figure 8 show the behavior of the internal damping ratio and dynamic elastic modulus () in function of maturity, for concretes of w/c = 0.3, 0.5 and 0.7, respectively. Internal damping presents an decrease at first 5 days for w/c = 0.5 and 0.7, and next becomes stable, until 28 days. For samples with w/c = 0.7, the decrease of is observed until 15 days. These results are strongly linked to microstructure which develops at early ages. When the concrete is hardening, there are loss of water, chemical transformation of anhydrous cement to C-S-H and formation of transition zones. Water loss generates a decrease of internal damping ratio, due the viscous damping parcel. Besides, the increase of C-S-H concentration improves the density of microstructure, closes the poros and reducing the the material`s imperfection. The previous micro-cracks in transition zone also are responsible to Coulomb parcel of the damping, and its is linked with water-cement ratio and coarse aggregate size. Consequently, there are a diminishing of and increase of , according to observed in Figure 6, Figure 7 and Figure 8.The decrease of internal damping in time is more markedly in mixtures with w/c equal to 0.7, followed by w/c = 0.5 and w/c = 0.3. Hence, the water-cement ratio and porosity level influences this decrease, and could be observed in Figure 6, Figure 7 and Figure 8. The mixture with high level of porosity (i.e., w/c = 0.7) departs of high level of internal damping () and decreases until 15 days, due the high occurrence of porous, voids and previous micro cracks. Mixtures with minor occurrence of poros and micro-cracks (i.e., w/c = 0.3 and 0.7), the decrease of internal damping ratio is more quickly. Hence, the scale of porosity and transition zone influences severely material`s internal damping ratio, and this microstructure will be important to explain the behavior of material under mechanical cycles, presented in Section 3.2.
Figure 6.
Internal damping ratio and dynamic elastic modulus over time - w/c = 0.3
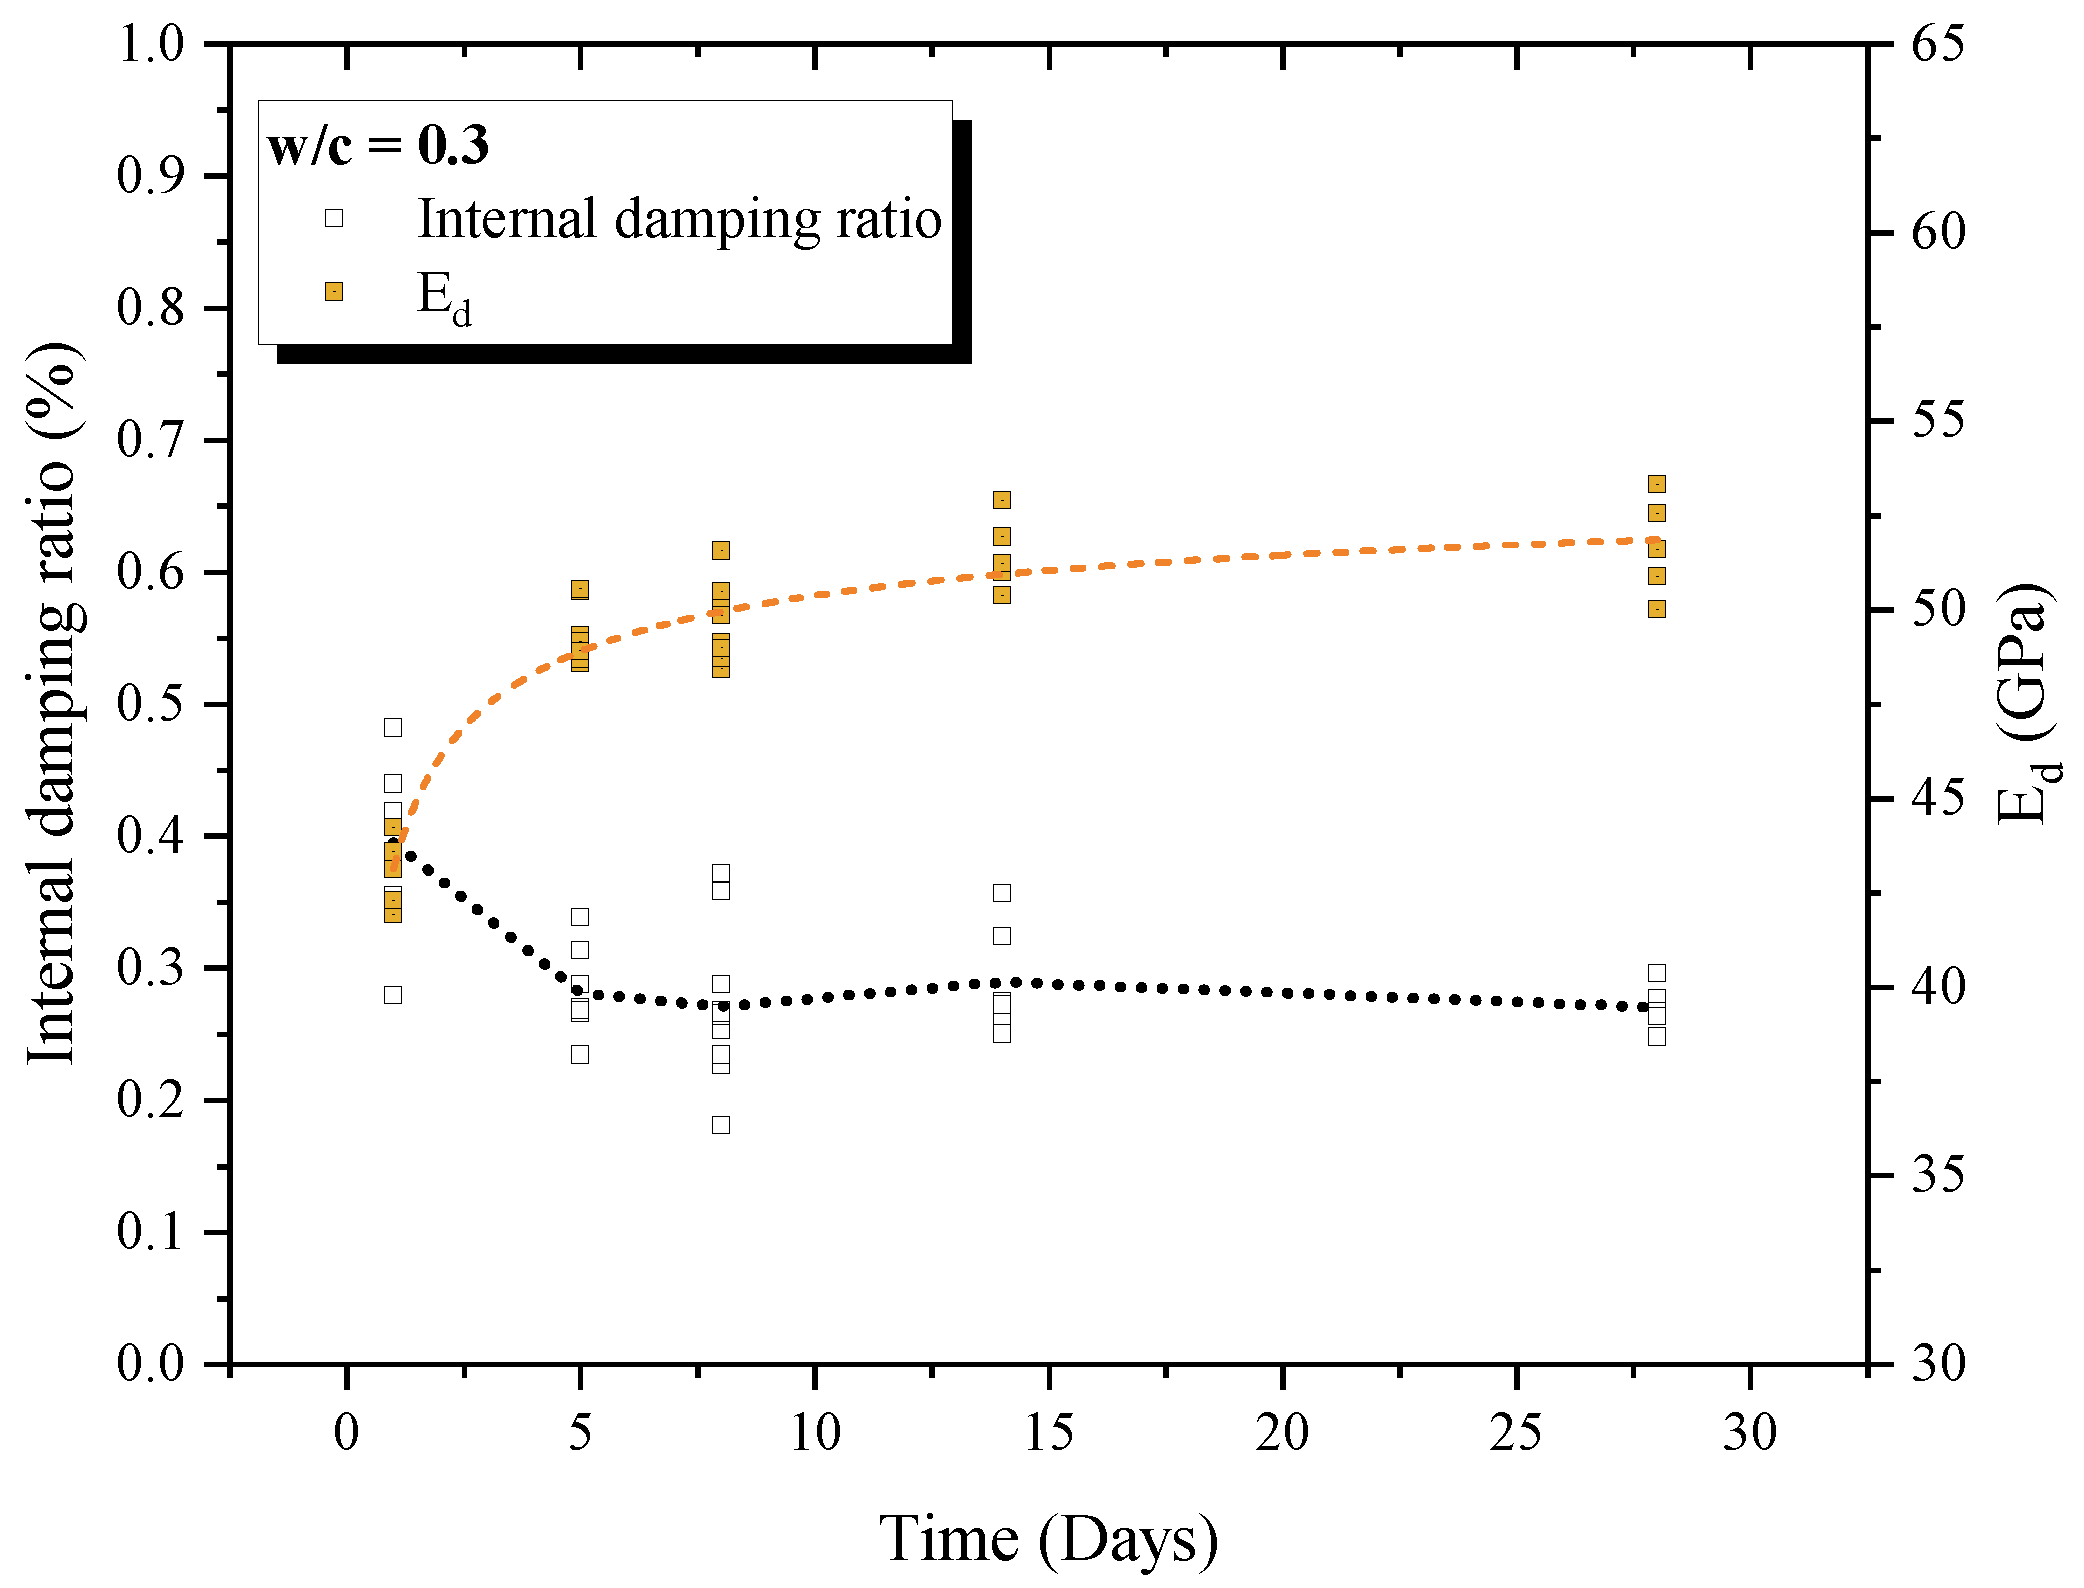
Figure 7.
Internal damping ratio and dynamic elastic modulus over time - w/c = 0.5
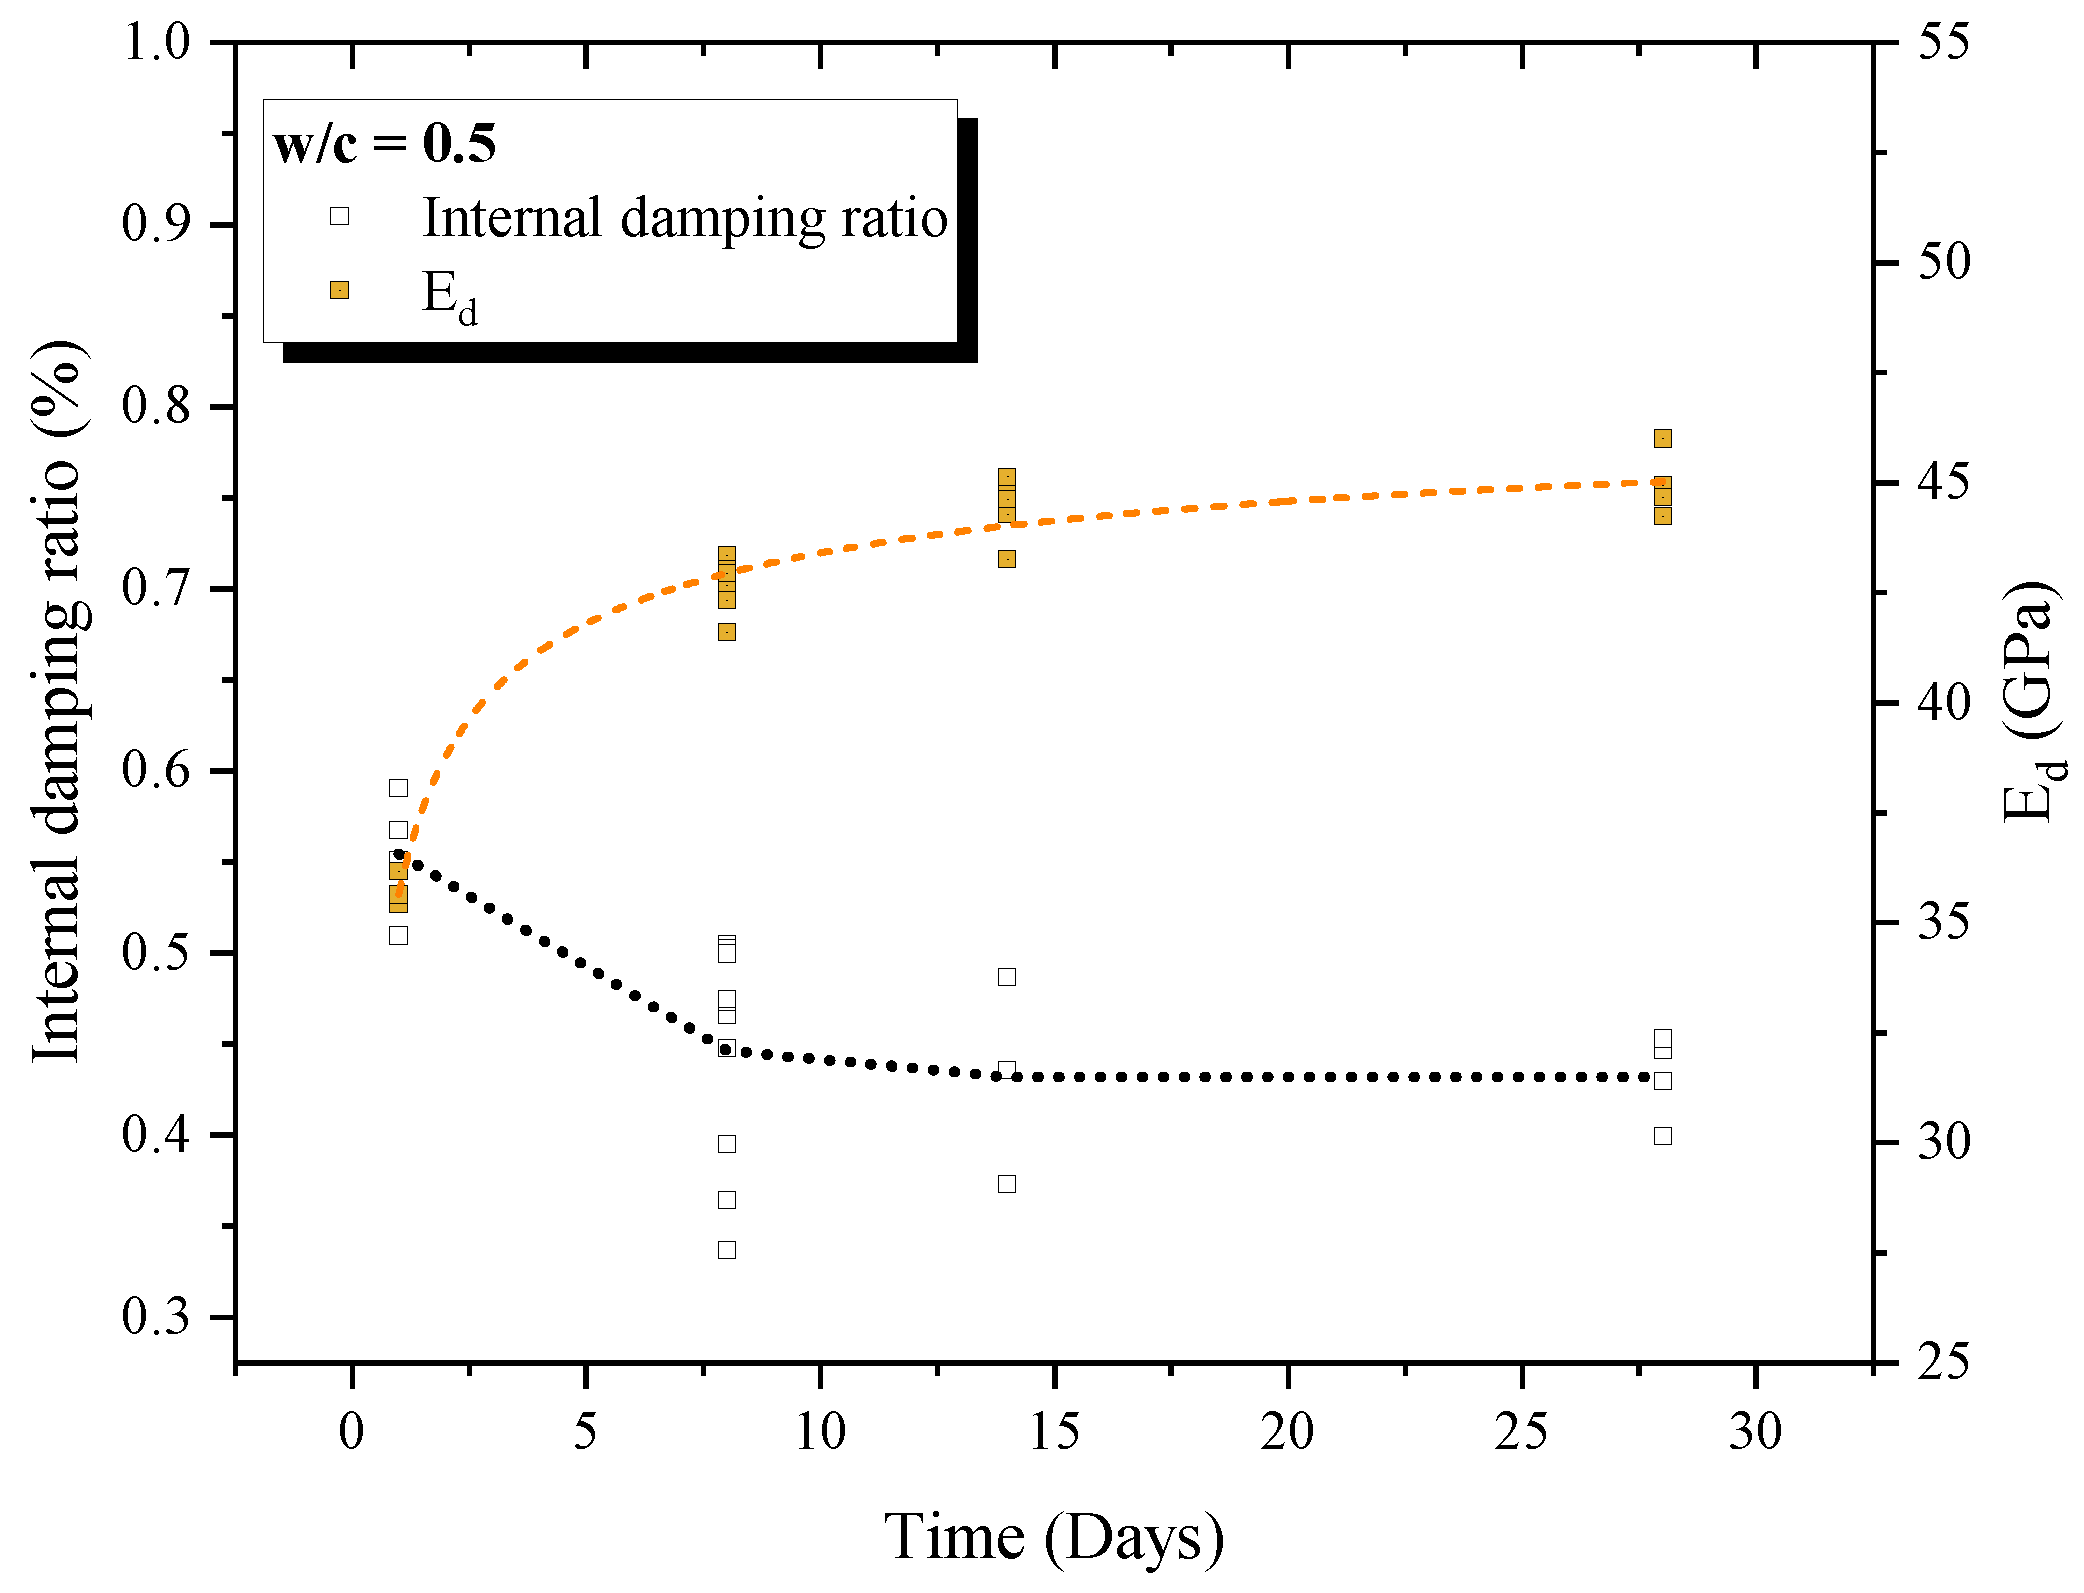
Figure 8.
Internal damping ratio and dynamic elastic modulus over time - w/c = 0.7
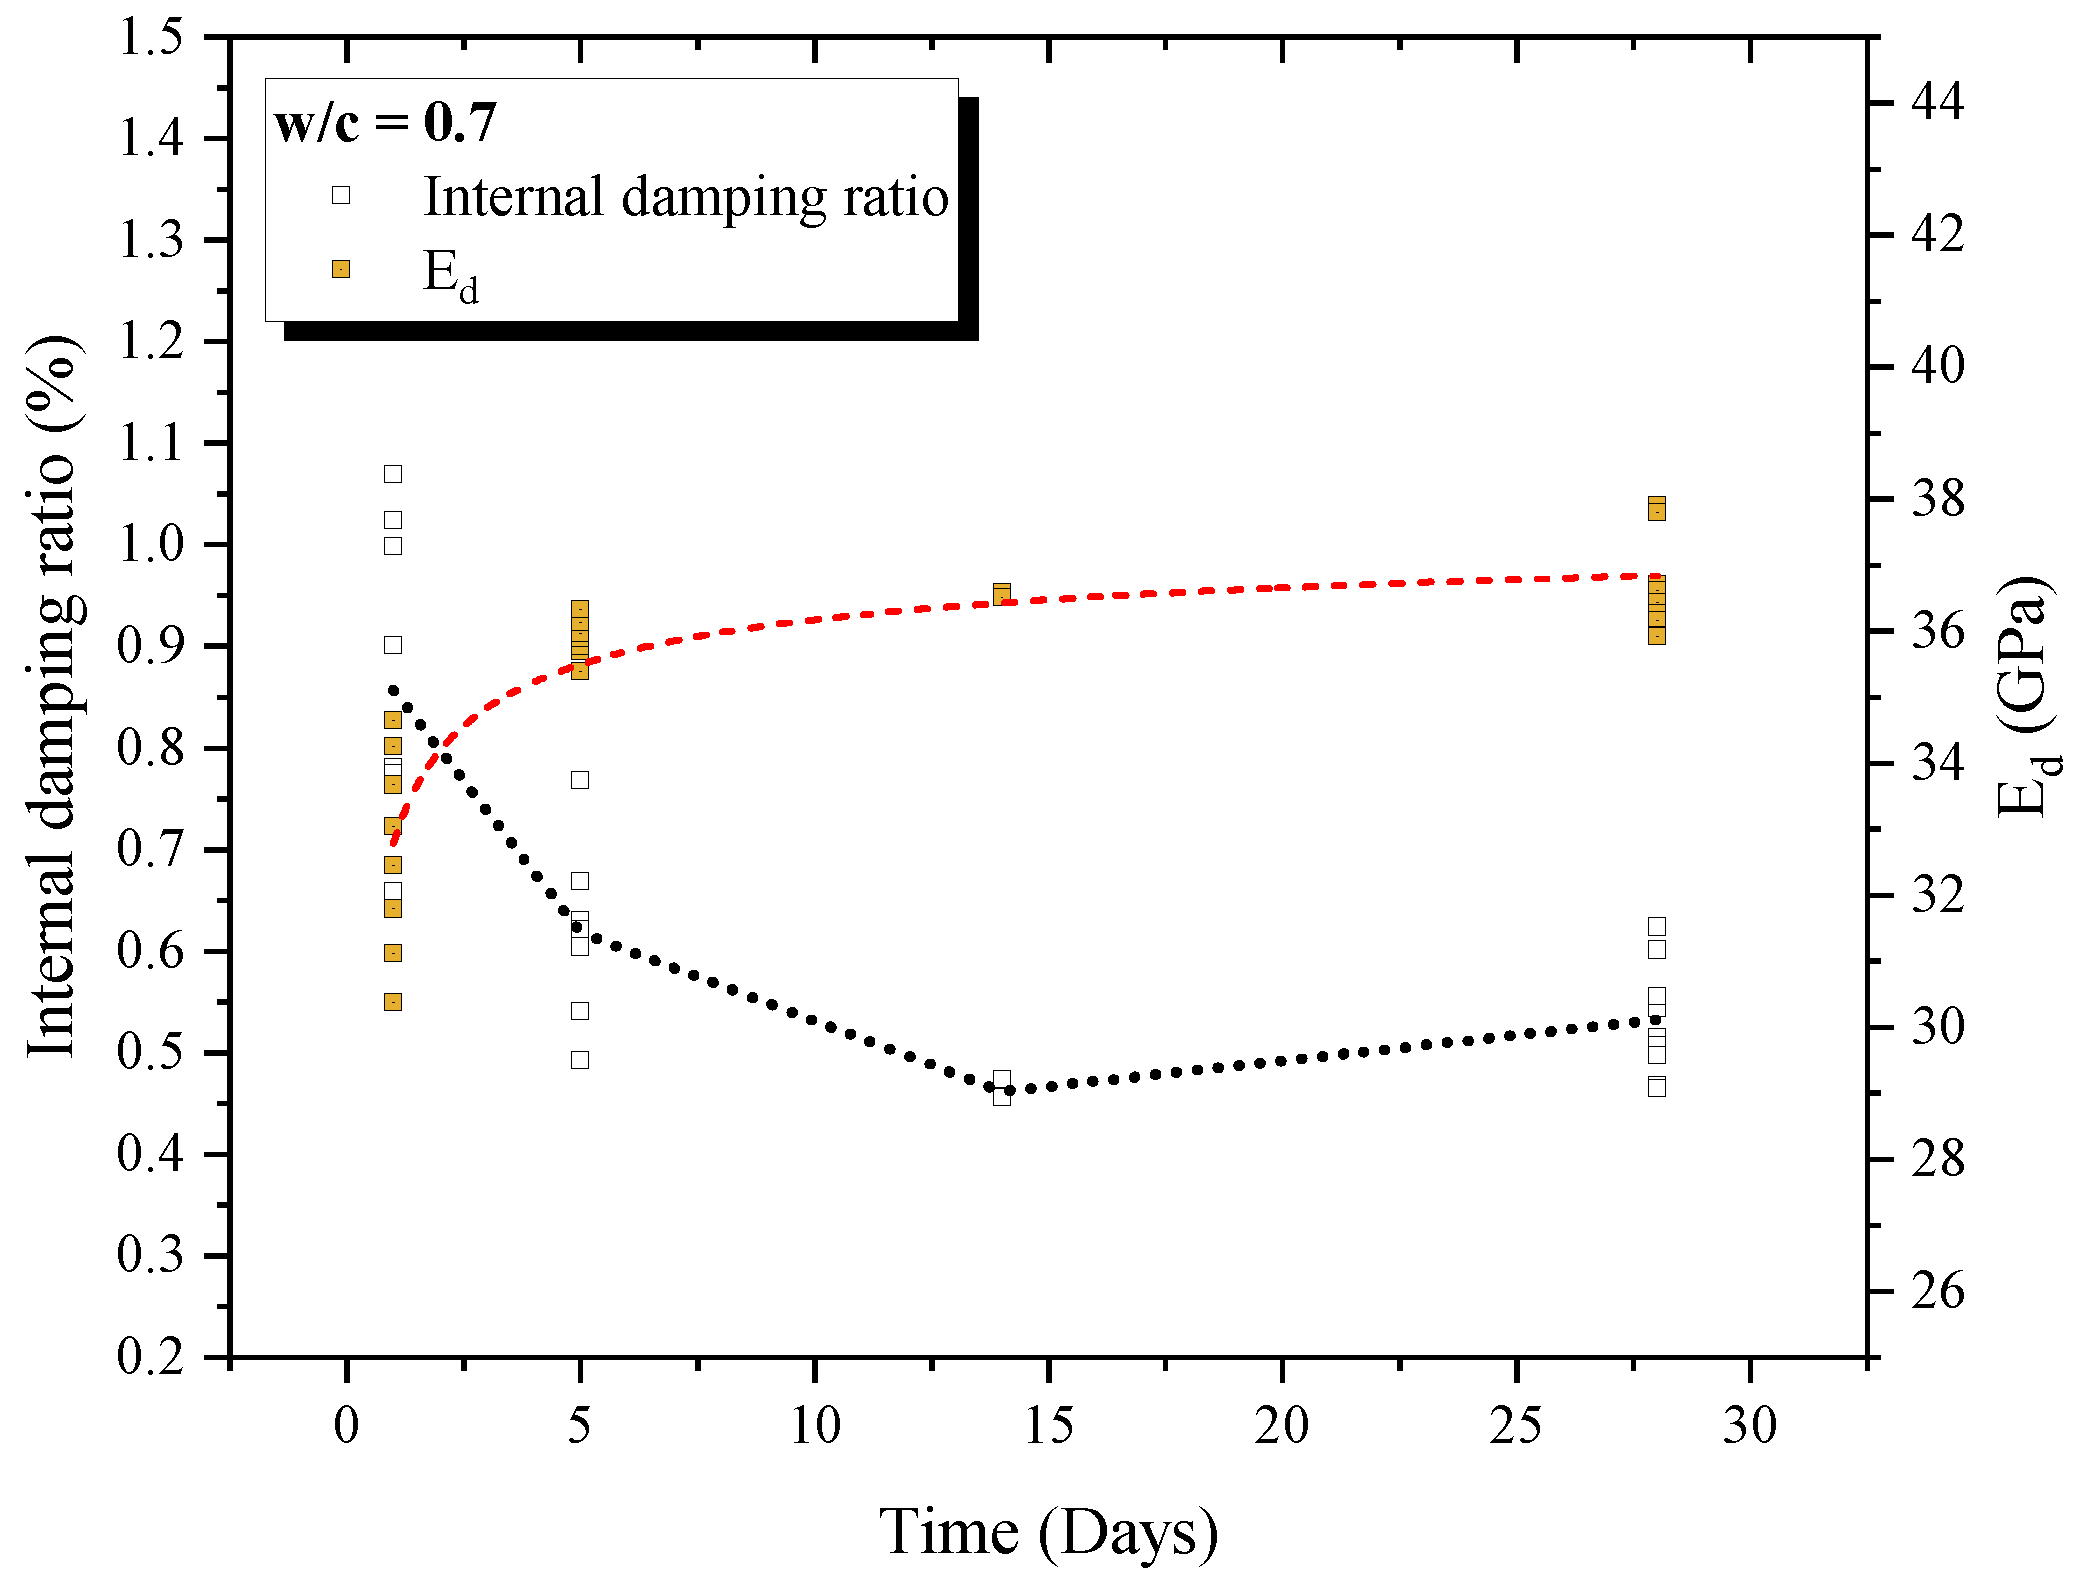
Figure 9.
Internal damping ratio over time with different w/c
An empirical relation of and could be presented according to Figure 10. The Equation (8) was used to calibrate experimental data, with , and , with 00. Despite of great variability, there is a clearly downward tendency between these parameters, confirming that internal damping ratio is correlated with the occurrence of microstructure imperfections, like voids, porous and transition zone, factors which influences negatively .
Figure 11 shows the comparison of the internal damping ratio between conventional concrete (NSC – 1:2:3:w/c = 0.5 and 0.7), high strength concrete (HSC - 1:2:3:w/c = 0.3) and Ultra-High-Performance Fiber-Reinforcement Concrete (UHPFRC, with w/c = 0.29) [14], for intact samples. It can be seen from Figure 11 that as far as w/c ratio increases, the material systematically an increase level of previous micro-cracks and ITZ, and then the dissipation of acoustic wave increases, deteriorating the signal and improving the internal damping ratio. Hence, UHPFRC presents the smallest internal damping ratio, due the dense microstructure, with low level of ITZ and micro cracks. Consequently, the small water film formed around the fine aggregates and fibers in UHPFRC results in stronger interfaces that typically constitute weak zones of the composites. On other hand, the dimension of coarse aggregates generates ITZ larger, and this phenomenon is amplified by increase of water-cement ratio, for NSC and HSC.
3.2. Damaged Samples
Figure 12a–c presents typical stress-strain relation for studied mixtures. Box plots reveal a maximum standard deviation of 5 MPa, for mixture with w/c = 0.3. The hysteretic behavior was observed during cyclic loading. The area inside the loading-unloading curves can be called hysteretic damping [1,14], and the increase in this area over the cycles represents the increase in energy dissipation and, consequently, in the internal damping of the material. There is a low hysteretic damping in w/c = 0.3 and high hysteretic damping in w/c = 0.5 and 0.7, due the voids, poros and ITZ of this mixtures. Figure 13 presents box plot which contain the peak stress data of produced concretes with w/c = 0.3 until 0.7.
Figure 14, Figure 15 and Figure 16 present the evolution of damage index () in function of non-dimensional stress, parameter obtained by relation of maximum stress at cycle ( and peak stress (). These data demonstrates a high level of fragility for mixtures with w/c = 0.3, and this is explained due the dense microstructure, with low porosity and imperfections, which induces a high energy rupture of the material. This phenomenon is also observed in linear stress-strain relation (Figure a), high values of dynamic elastic modulus (Figure 10) and low internal damping ratio of undamaged samples (Figure 9). Mixtures with w/c = 0.5 and 0.7 presents high level of damage at rupture, due minor fragility of this materials.
Figure 18 and Figure 19 presents the dependency of internal damping ratio and damage evolution. The progressive damage generates an increase of cracks occurrence, what allows an increase of Coulomb damping component and the additional dissipation of vibration energy, increasing the internal damping ratio. The phenomenon of increase of Coulomb damping in function of damage index is similar to three mixtures, but the scale which happen is different: Figure 17 demonstrates that concrete mixtures with w/c = 0.7 presents increase in internal damping of (undamaged sample) to (damage equal to 0.8); Figure 18 and Figure 19 present the evolution of in relation of damage index, for concretes with w/c = 0.5 and 0.3. There are an internal damping ratio increase of to , for concretes with w/c = 0.5. For mixtures with w/c = 0.3, internal damping ratio develop of to . Hence, the intact internal damping ratio reflects how the parameter develop under cyclic loads.
Figure 20 presents the ratio of internal damping measured in cracked and uncracked samples (i.e., ), in function of damage index. The scale of keep very similar for all mixtures until 0.20 damage index, and this region consists in the pre-peak branch. When the cracking process become unstable, the evolution of internal damping ratio is more quickly to w/c = 0.3, following by w/c = 0.5 and w/c = 0.7, due the difference of fragility of these mixtures.
As discussed, the damage index and the internal damping ratio are correlated. Therefore, the damping of the material can also be associated with the damage mechanisms occurring during severe loading and the pre-existing cracking. Under compressive strains at the beginning of the pre-peak branch, cracks already exist in the interfacial transition zone (ITZ) and start to propagate from the aggregate-matrix interfaces, air voids, and pores. Coarse aggregates in NSC and higher water/binder ratio promotes a high porosity in the interface between matrix and aggregate. In these regions, the cracks have micro-scale typically. Then, the difference in the scale of the damage mechanisms also reflects the difference observed in the internal damping ratio between NSC and HSC. Then, for further increase in load, the matrix starts to dilate, and, when it reaches the peak, localization occurs with the appearance of macro-cracks. As observed by the acoustic test, the internal damping of with the mechanical degradation of the specimens. More attenuation occurs because the arisen of further discontinuities with damage increases the material capacity of dissipating kinetic energy by friction between the crack faces that came up. Under compression, high tensile stresses occur above and below the voids, therefore favoring the formation of splitting crack.
4. Conclusions
This paper addressed the investigation of internal damping ratio of samples’ concrete under damage evolution. Acoustic test was employed to investigate the degradation of dynamic elastic modulus and the influence of this degradation to internal damping ratio. Obtained results could be employed in impact numerical dynamic models that consider the damage evolution. The following findings could be highlighted:
- Internal damping ratio was correlated with parameters as w/c ratio, maturity and dynamic elastic modulus. The pore closure over maturity decrease the viscous internal damping. Furthermore, C-S-H hydration reactions improves the material density and decreases the internal dissipation, decreasing the acoustic wave dissipation.
- An investigation of how the damage influences the damping ratio was accomplished. Our results appointed that a growth of damage generates a increase of Coulomb damping parcel, and its is accompanied of internal damping ratio improvement. It was determine the scale of this phenomenon, regarding mixtures of NSC and HSC.
- Microstructural conditions, like initial porosity, early micro-cracks and transition zone showed influential to response of damage and internal damping ratio evolution, once samples with higher water cement ratios showed more susceptible to increase of damage accompanied by high values of internal damping ratio and dissipation of acoustic wave.
- Internal damping ratio is a parameter sensitive to Microstructural modifications and its very linked to damage progression.
- There are few studies allowing the quantification and comprehension of internal damping ratio under damage cyclic loading and this approach will lead to improve the understanding of concrete under dynamical excitation, mainly impact situations.
References
- Paultre, P. Dynamics of Structures; ISTE ltd/Wiley: London, 2011. [Google Scholar]
- Bachmann, H.; Ammann, W.J.; Eisenmann, J.; Floegl, I.; Hirsch, G.H.; Klein, G.K.; Lande, G.J.; Mahrenholtz, O.; Natke, H.G.; Nussbaumer, H.; et al. Vibration Problems in Structures - Practical Guidelines 1995.
- Boccaccini, D.N.; Romagnoli, M.; Kamseu, E.; Veronesi, P.; Leonelli, C.; Pellacani, G.C. Determination of thermal shock resistance in refractory materials by ultrasonic pulse velocity measurement. Journal of the European Ceramic Society 2007, 27, 1859–1863. [Google Scholar] [CrossRef]
- Pereira, A.H.; Fortes, G.M.; Schickle, B.; Tonnesen, T.; Musolino, B.; Maciel, C.D.; Rodrigues, J.A. Correlation between changes in mechanical strength and damping of a high alumina refractory castable progressively damaged by thermal shock. Ceramica 2010, 56, 311–314. [Google Scholar] [CrossRef]
- Curadelli, R.O.; Riera, J.D.; Ambrosini, D.; Amani, M.G. Damage detection by means of structural damping identification. Engineering Structures 2008, 30, 3497–3504. [Google Scholar] [CrossRef]
- Angela Salzmann. DAMPING CHARACTERISTICS OF REINFORCED AND PRESTRESSED NORMAL- AND HIGH-STRENGTH CONCRETE BEAMS. Doctor of philosophy, GRIFFITH UNIVERSITY - GOLD COAST CAMPUS, 2002.
- Angela Salzmann, S. Fragomeni, Y.C.L. The Damping Analysis of Experimental Concrete Beams under Free-Vibration. Advances in Structural Engineering 2003, 6, 53–64. [Google Scholar] [CrossRef]
- Jordan, R.W. The effect of stress, frequency, curing, mix and age upon the damping of concrete. Magazine of Concrete Research 1980, 32, 195–205. [Google Scholar] [CrossRef]
- Gheorghiu, C.; Rhazi, J.E.; Labossiere, P. Impact resonance method for fatigue damage detection in reinforced concrete beams with carbon fibre reinforced polymer. Canadian Journal of Civil Engineering 2005, 32, 1093–1102. [Google Scholar] [CrossRef]
- Ndambi, J.M.; Vantomme, J.; Harri, K. Damage assessment in reinforced concrete beams using eigenfrequencies and mode shape derivatives. Engineering Structures 2002, 24, 501–515. [Google Scholar] [CrossRef]
- Bawa, N.; Graft-Johnson, J. Effect of Mix Proportion , Water-Cement Ratio , Age and Curing Conditions on the Dynamic Modulus of Elasticity of Concrete. Build. Sci. 1969, 3, 171–177. [Google Scholar]
- Swamy, R. Damping Mechanisms in Cementitious Systems. In Proceedings of the Proceedings of a Conference on Dynamic waves in civil engineering, Swansea, 1970; pp. 521–542. [Google Scholar]
- Eiras. ; Popovics.; Borrachero.; Monzó.; Payá. The effects of moisture and micro-strucutral modification in drying mortars on vibration-based NDT methods. Construction and Building Materials 2015, 94, 565–571. [Google Scholar] [CrossRef]
- Gidrão, G.d.M.S.; Krahl, P.A.; Carrazedo, R. Internal damping ratio of Ultra-High-Performance Fiber-Reinforcement Concrete (UHPFRC) considering the effect of fiber content and damage evolution. Journal of Materials in Civil Engineering 2020. [Google Scholar] [CrossRef]
- Swamy, N.; Rigby, G. Dynamic properties of hardened paste , mortar and concrete. Matériaux et constructions, 1971; pp. 13–40. [Google Scholar]
- Swamy, R.N. DYNAMIC POISSON’S RATIO OF PORTLAND CEMENT PASTE, MORTAR AND CONCRETE. Cement and Concrete Research, 1971; Vol.I, pp. 559–583. [Google Scholar]
- Tian, Y.; Lu, D.; Zhou, J.; Yang, Y.; Wang, Z. Damping Property of Cement Mortar Incorporating Damping Aggregate Yaogang. materials, 2020; pp. 1–13. [Google Scholar]
- Tian, Y.; Yan, X.; Zhang, M.; Yang, T.; Zhang, J.; Wang, Z. Effect of the characteristics of lightweight aggregates presaturated polymer emulsion on the mechanical and damping properties of concrete. Construction and Building Materials 2020, 253, 119154. [Google Scholar] [CrossRef]
- Li, N.; Long, G.; Fu, Q.; Wang, X.; Ma, K.; Xie, Y. Effects of freeze and cyclic flexural load on mechanical evolution of filling layer self-compacting concrete. Construction and Building Materials 2019, 200, 198–208. [Google Scholar] [CrossRef]
- Tian, Y.; Shi, S.; Jia, K.; Hu, S. Mechanical and dynamic properties of high strength concrete modified with lightweight aggregates presaturated polymer emulsion. Construction and Building Materials 2015, 93, 1151–1156. [Google Scholar] [CrossRef]
- ASTM International. ASTM C150-04: Standard Specification for Portland Cement. American Society for Testing and Materials. 2011, 04, 1–7. [Google Scholar] [CrossRef]
- ABNT, A.B.d.N.T. ABNT NBR 7211 - Agregados para concreto - Especificação. 2009.
- ASTM C215-02, A.S.f.T.M. Standard Test Method for Fundamental Transverse, Longitudinal, and Torsional Resonant Frequencies of Concrete Specimens. 2003, pp. 1–7.
- ASTM E1876-01, A.S.f.T.M. Standard Test Method for Dynamic Young ’ s Modulus, Shear Modulus, and Poisson ’ s Ratio by Impulse Excitation of Vibration, 2001.
- Haach, V.G.; Carrazedo, R.; Oliveira, L.M.; Corrêa, M.R. Application of acoustic tests to mechanical characterization of masonry mortars. NDT & E International 2013, 59, 18–24. [Google Scholar] [CrossRef]
- Pickett, G. Equations for Computing Elastic Constants from Flexural and Torsional Resonant Frequencies of Vibration of Prisms and Cylinders. Proceedings of the American Society for Testing Materials 1945, 45, 846–866. [Google Scholar]
- Pereira, A.H.A.; Otani, L.B.; De Anchieta Rodrigues, J.; Traon, N.; Tonnesen, T.; Telle, R. The influence of nonlinear elasticity on the accuracy of thermal shock damage evaluation by the impulse excitation technique. InterCeram: International Ceramic Review, 2011; pp. 98–102. [Google Scholar]
- Pereira. ; Musolino.; Maciel.; Rodrigues. Algorithm to determine the damping of ceramic materials by the impulse excitation technique ceramic materials by the impulse excitation technique. Ceramica 2012, 58. [Google Scholar]
Figure 1.
Material characteristics.
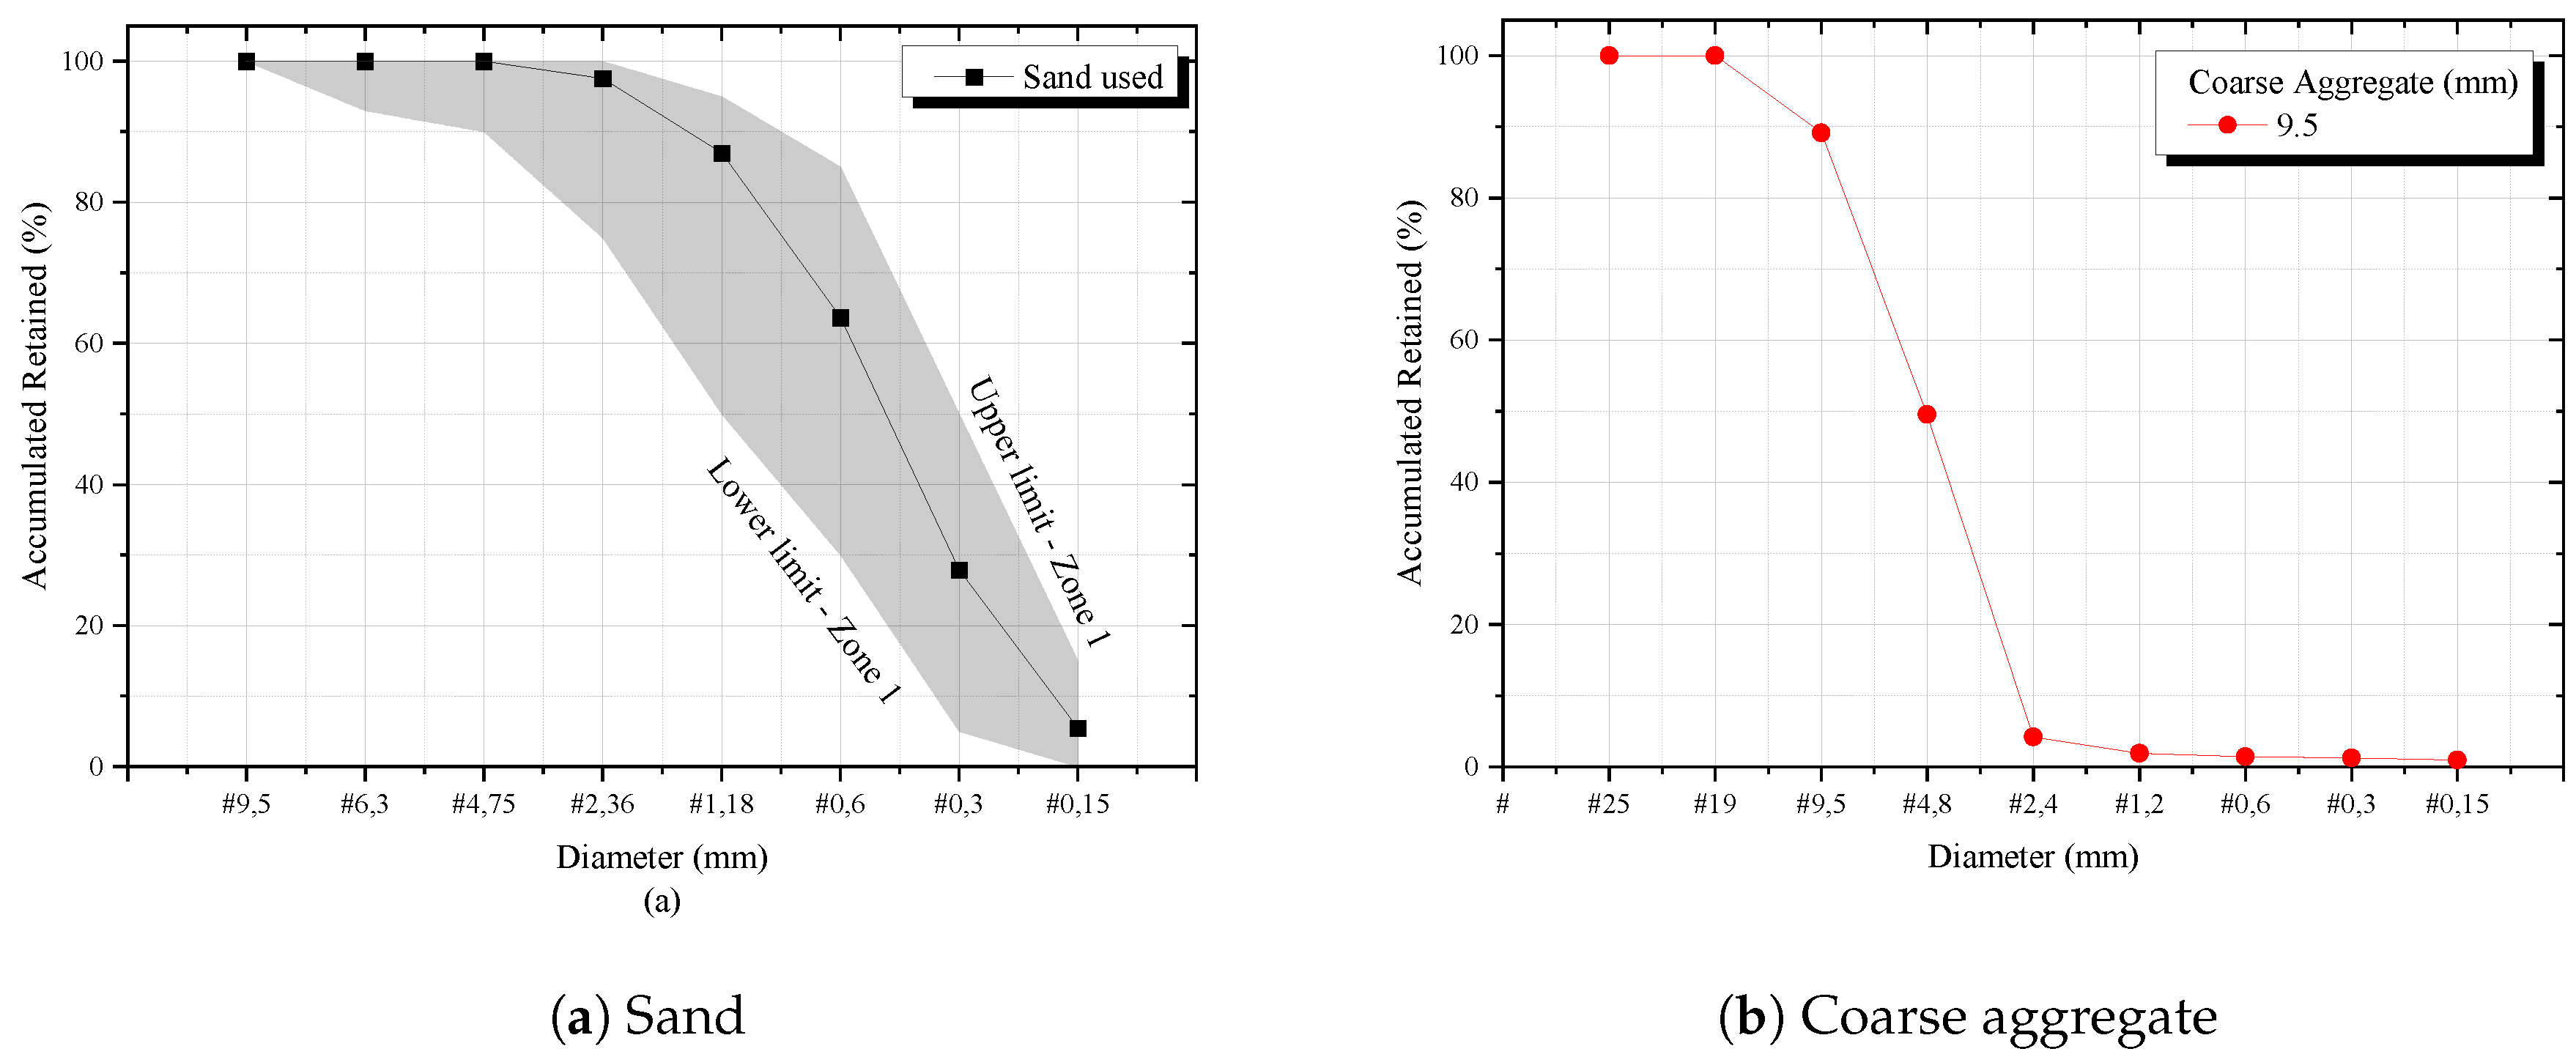
Figure 2.
Cyclic test setup
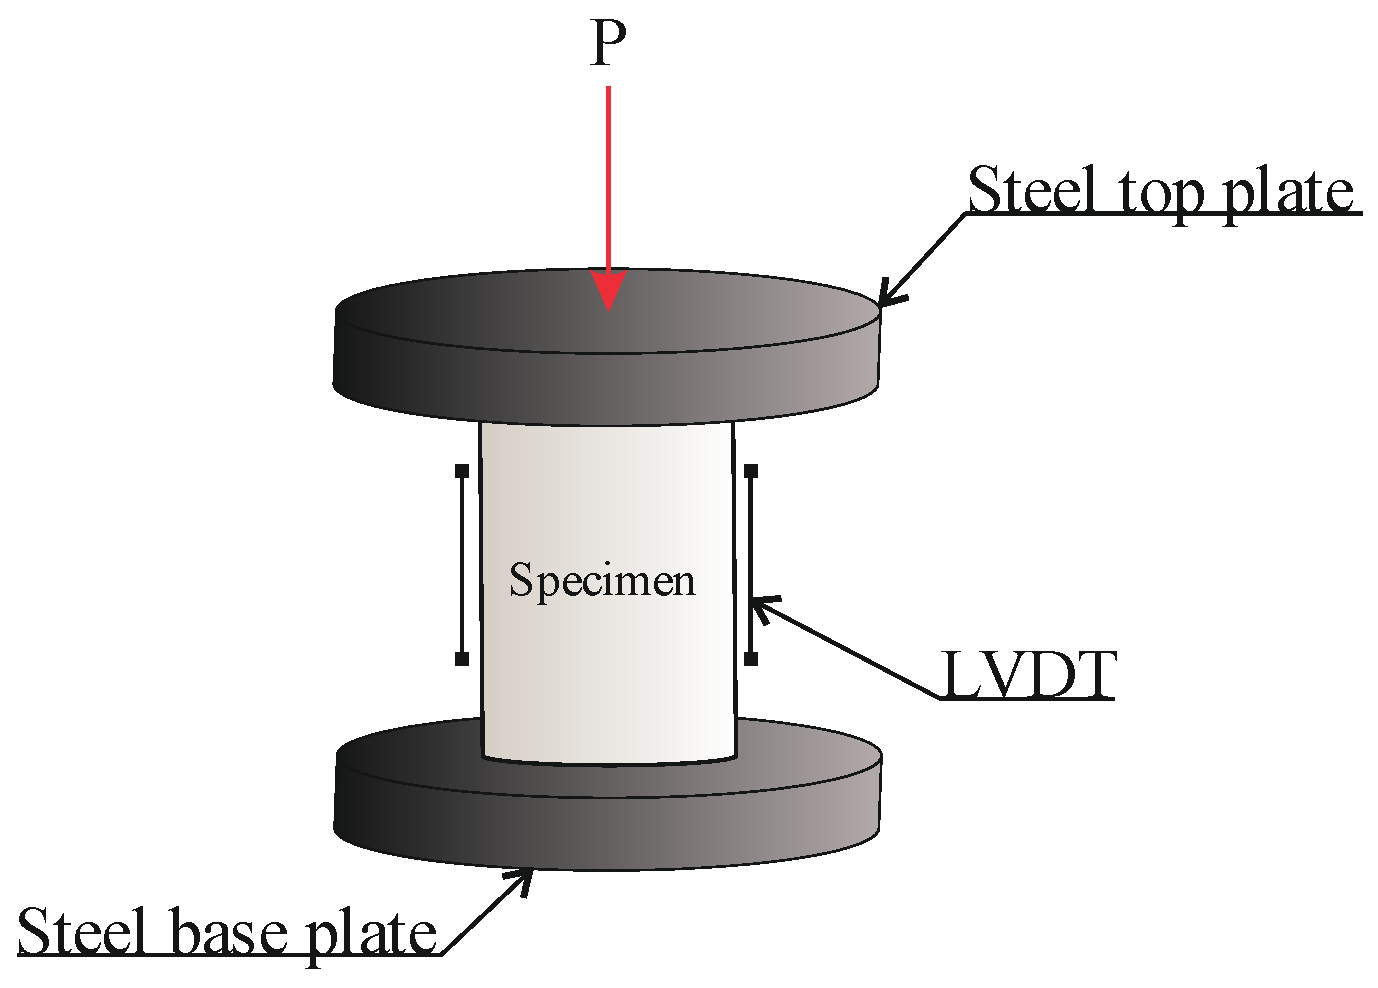
Figure 3.
Characteristic force-displacement diagram
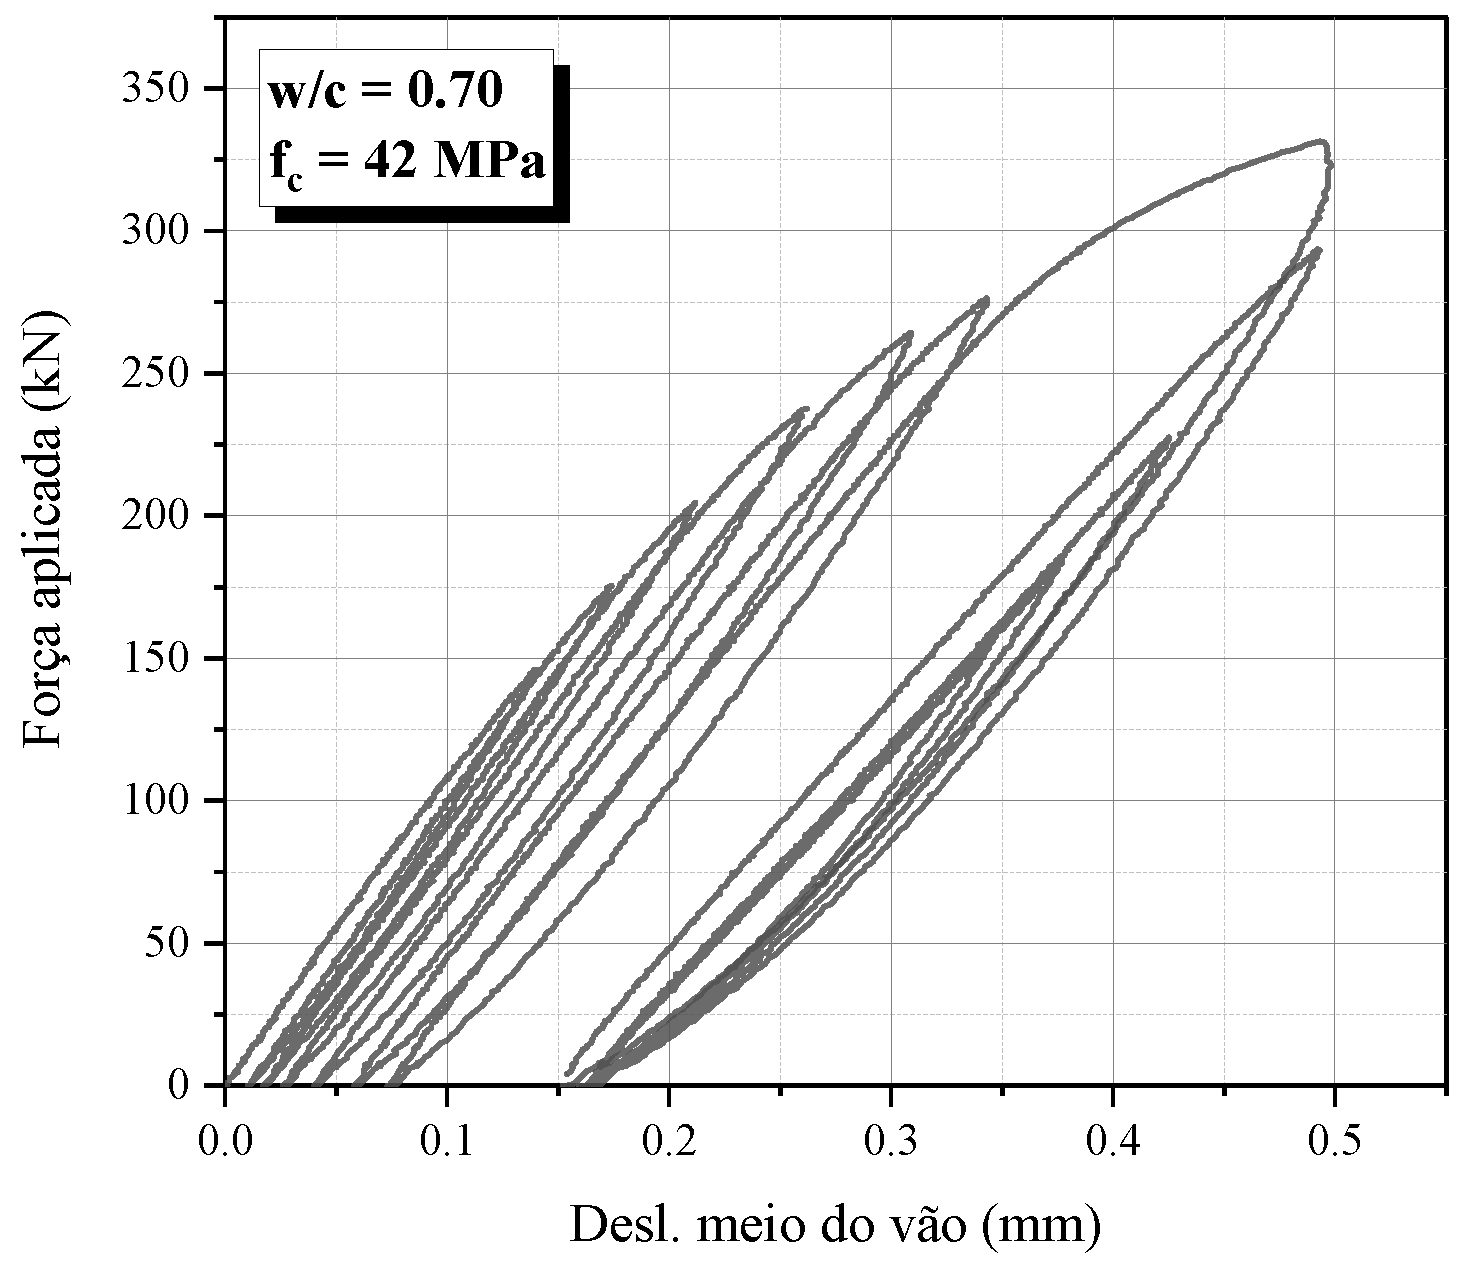
Figure 4.
Acoustic Test
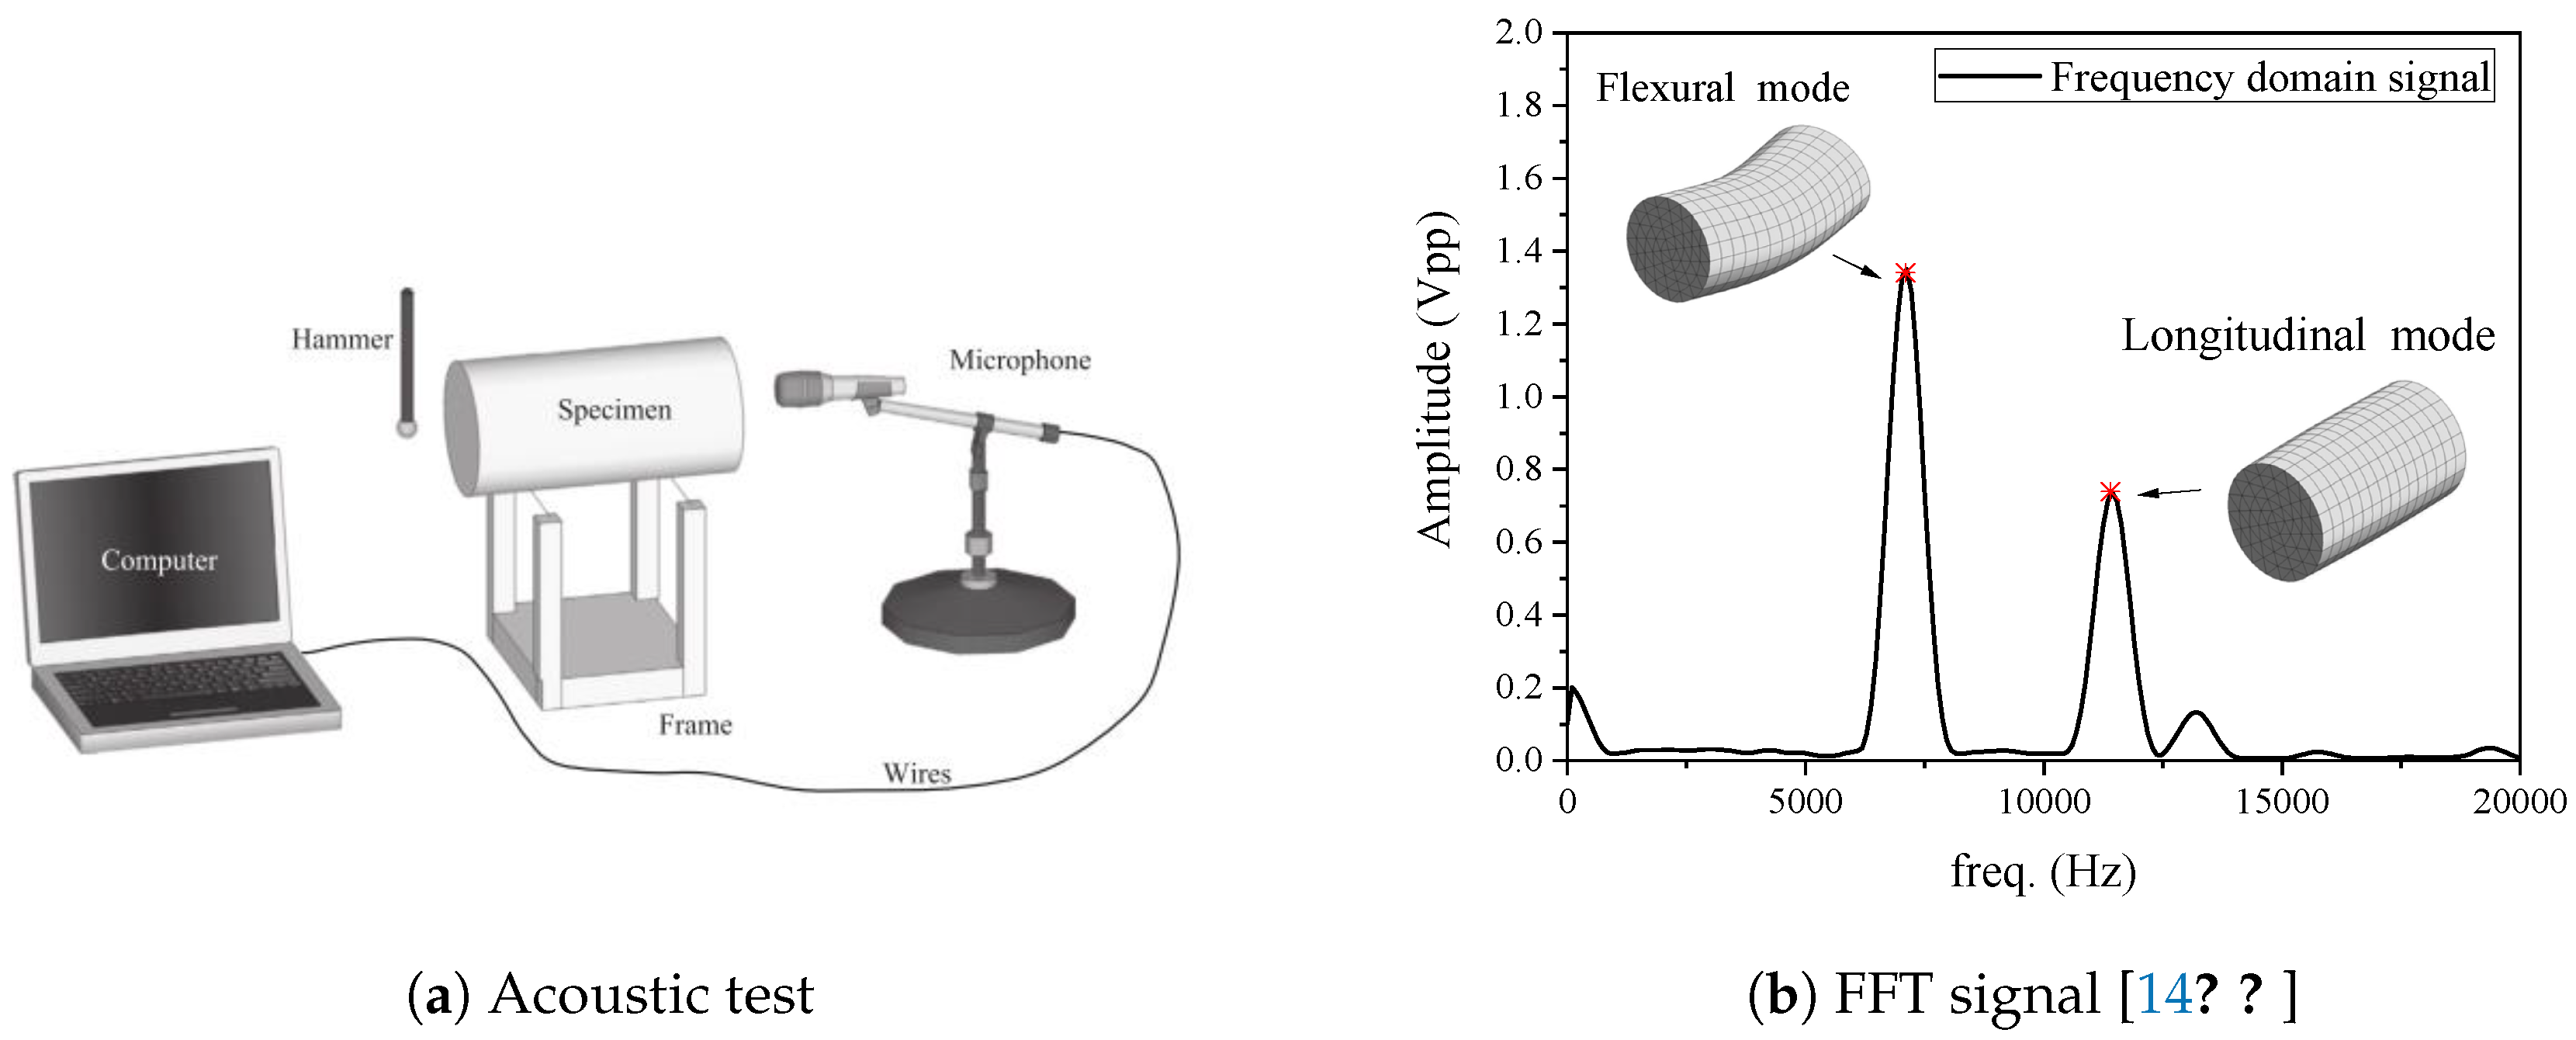
Figure 5.
Damping determination
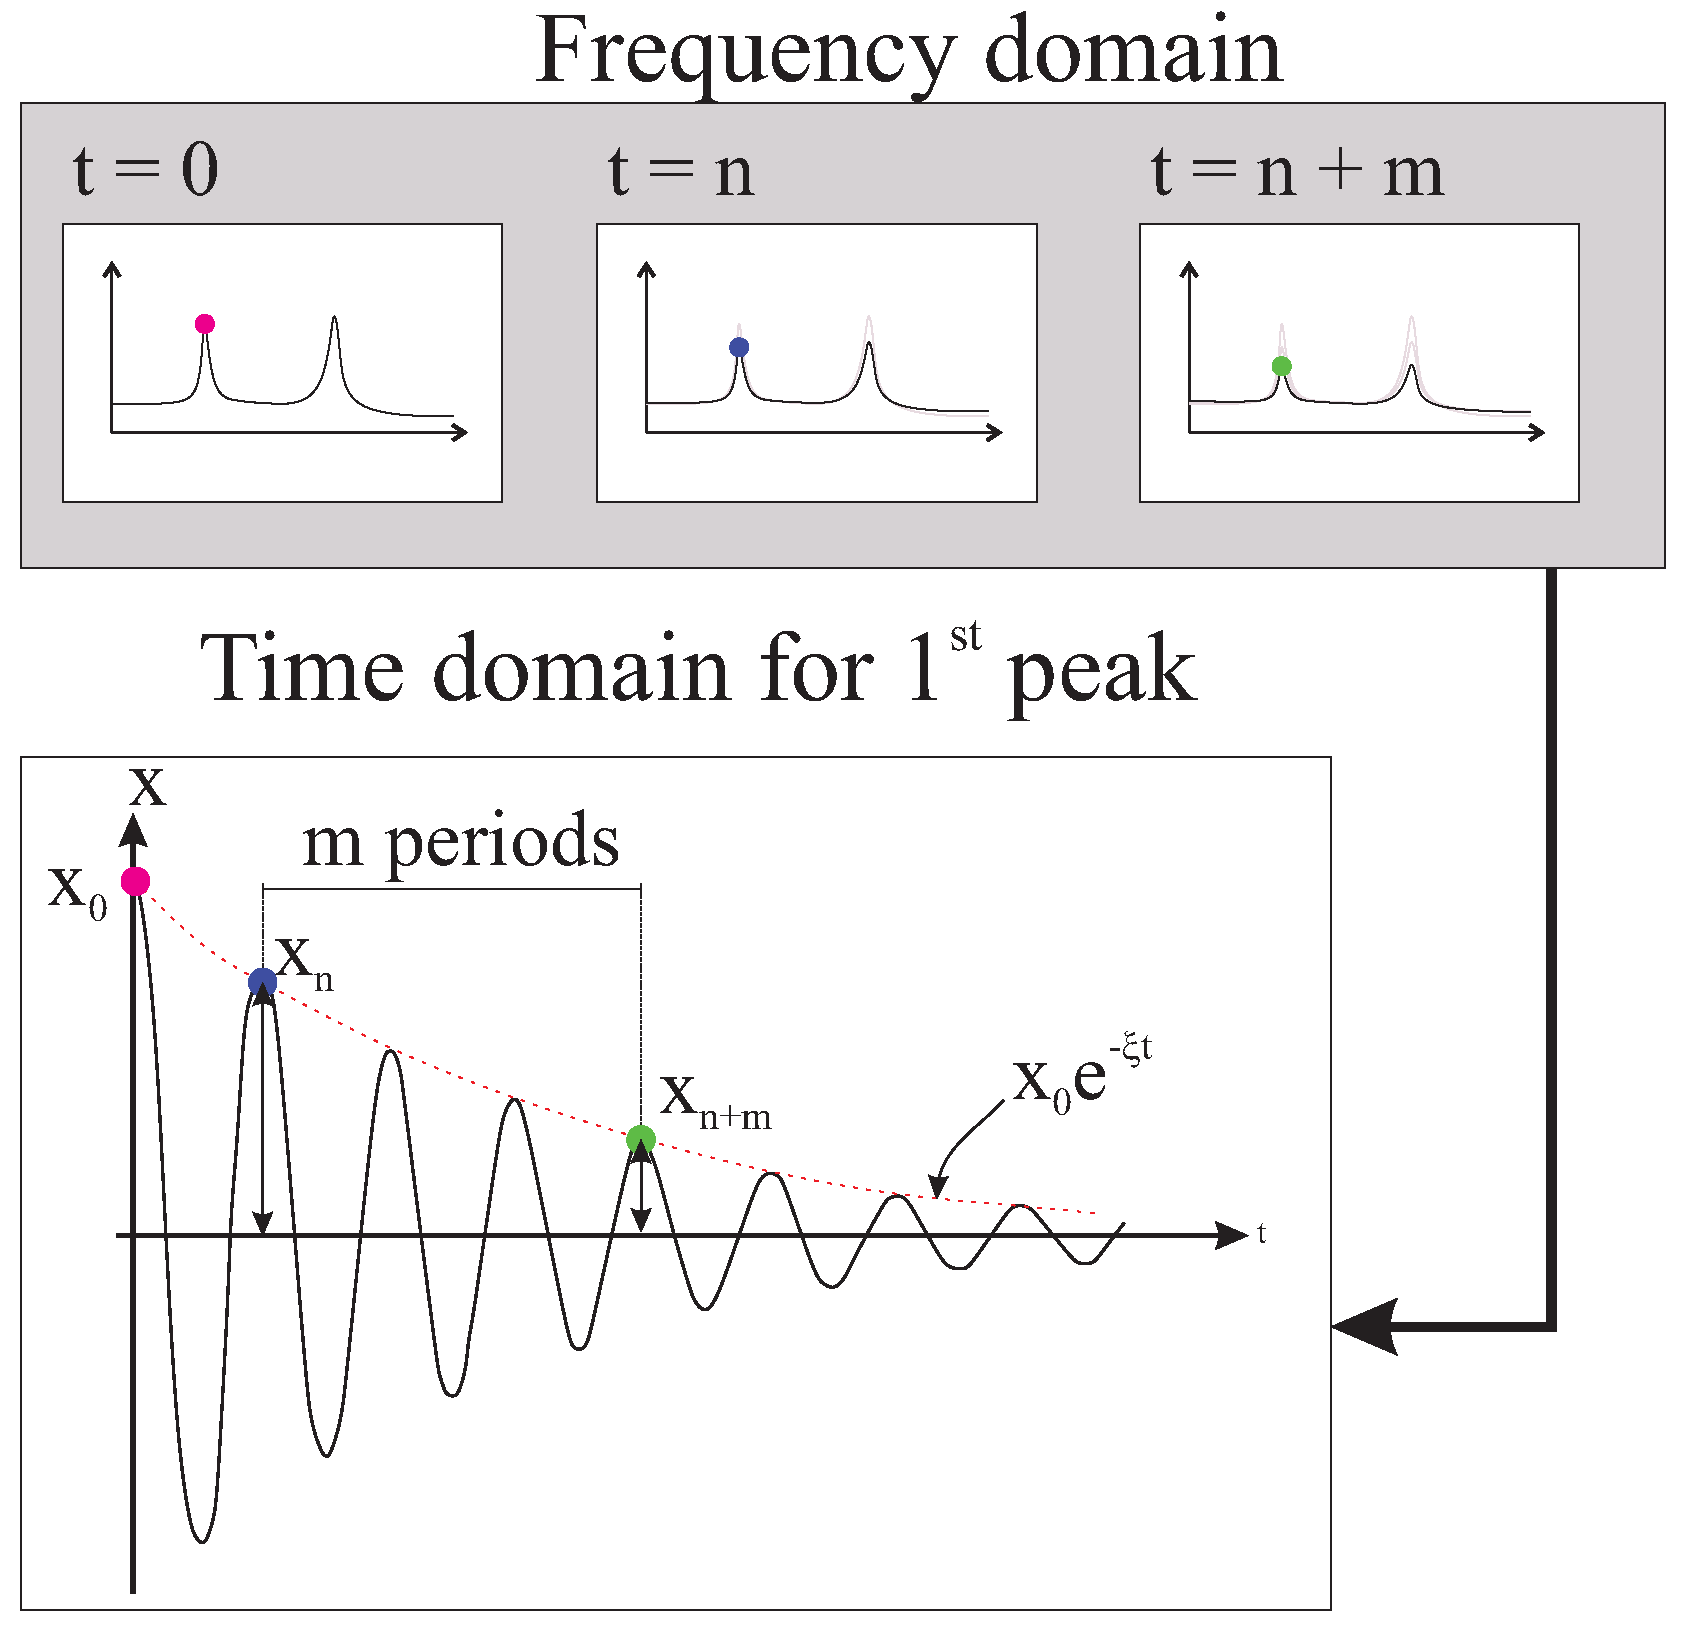
Figure 10.
Internal damping ratio and
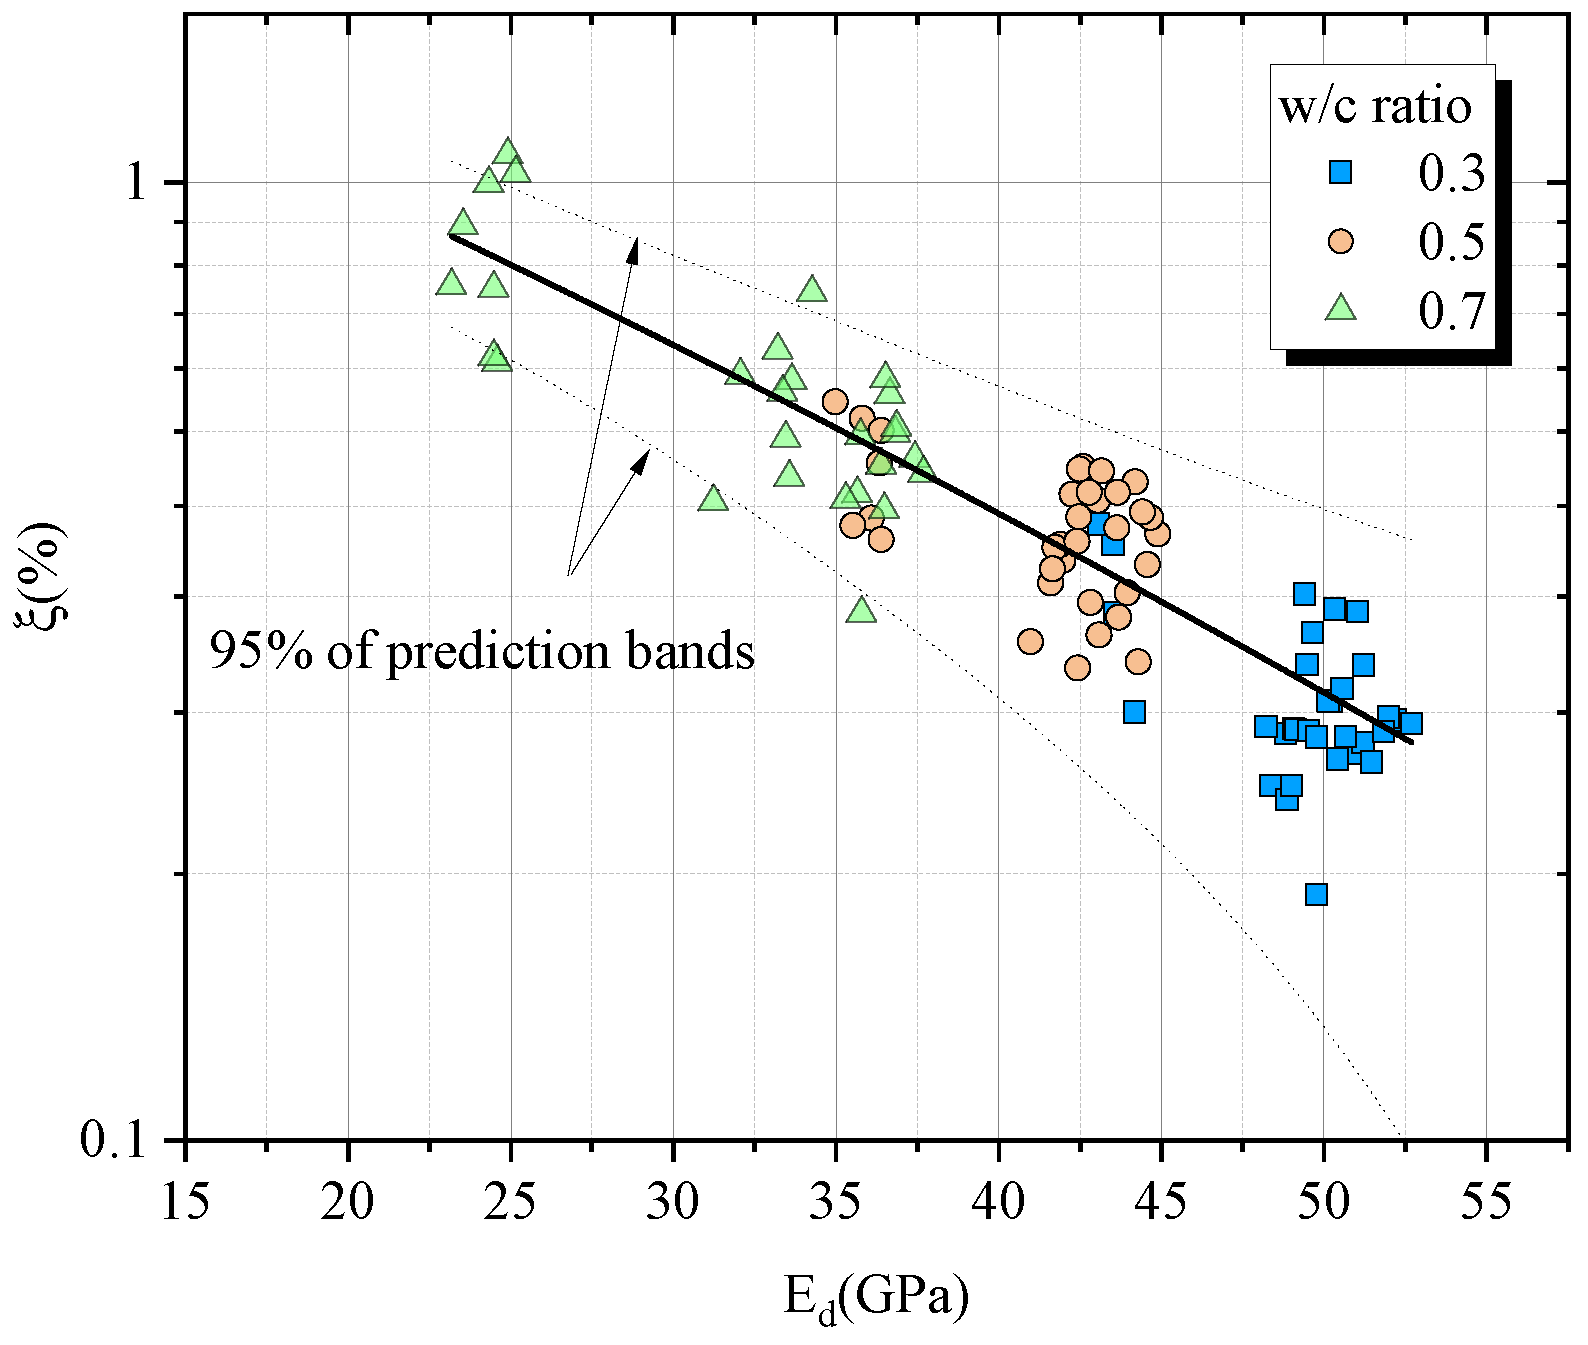
Figure 11.
Comparison of mixtures
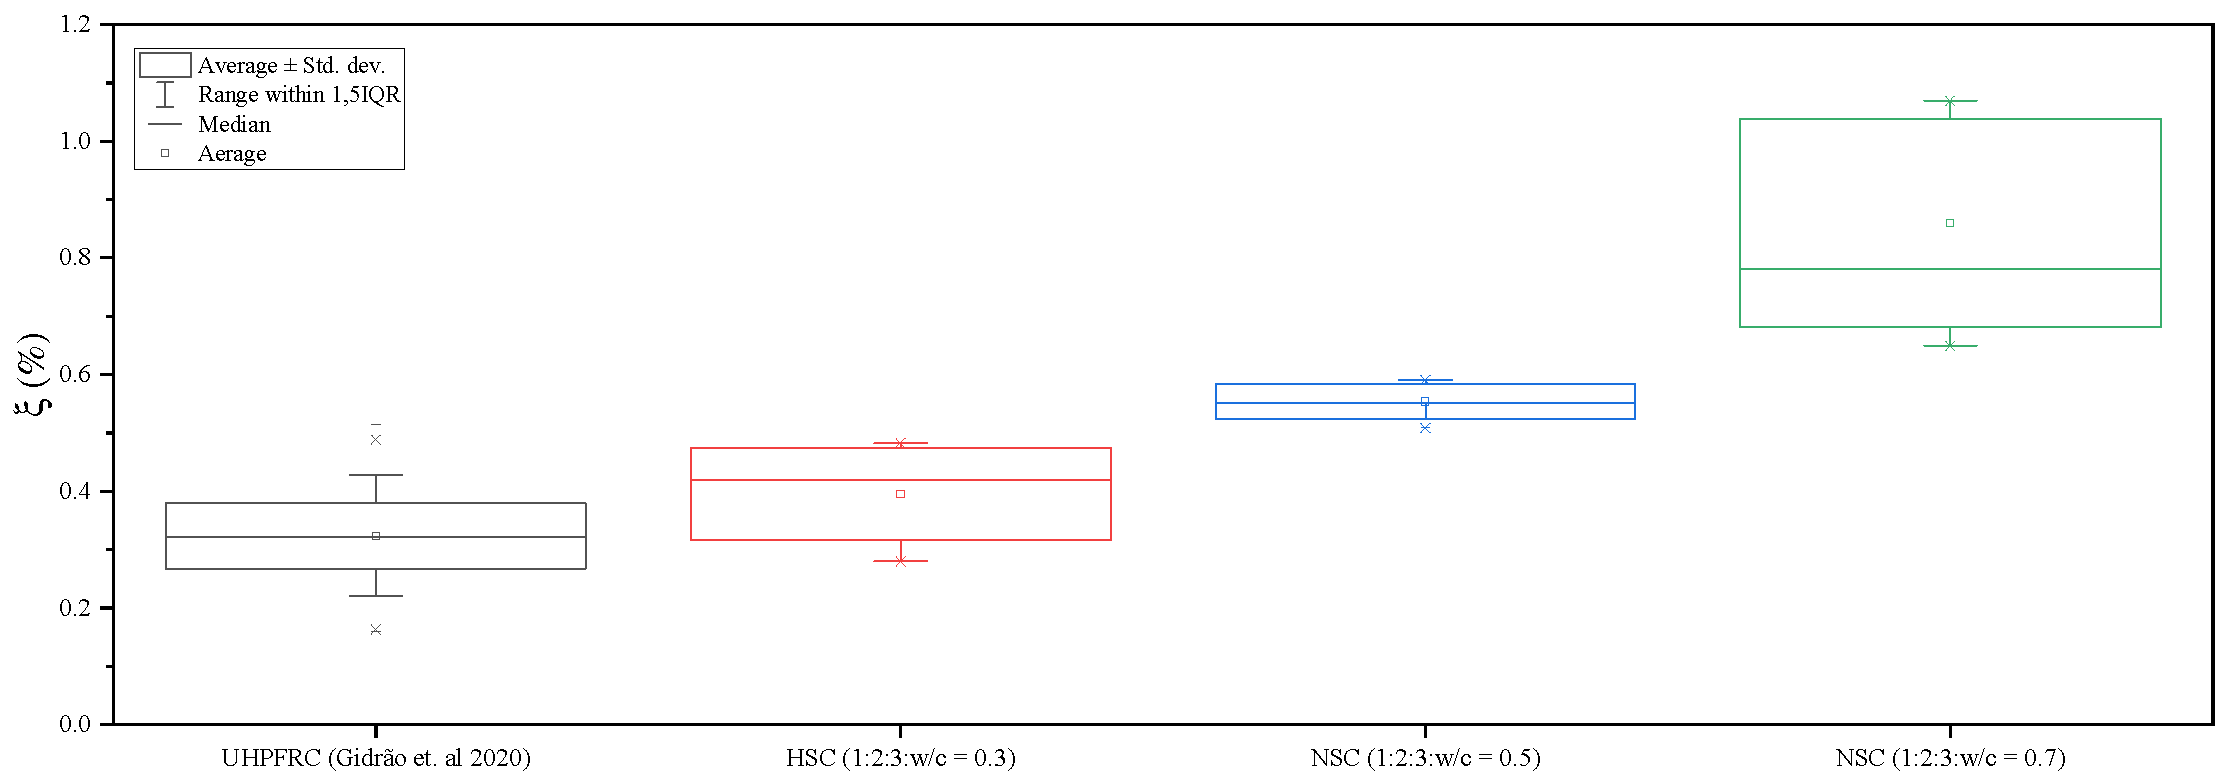
Figure 12.
Typical stress-strain diagram

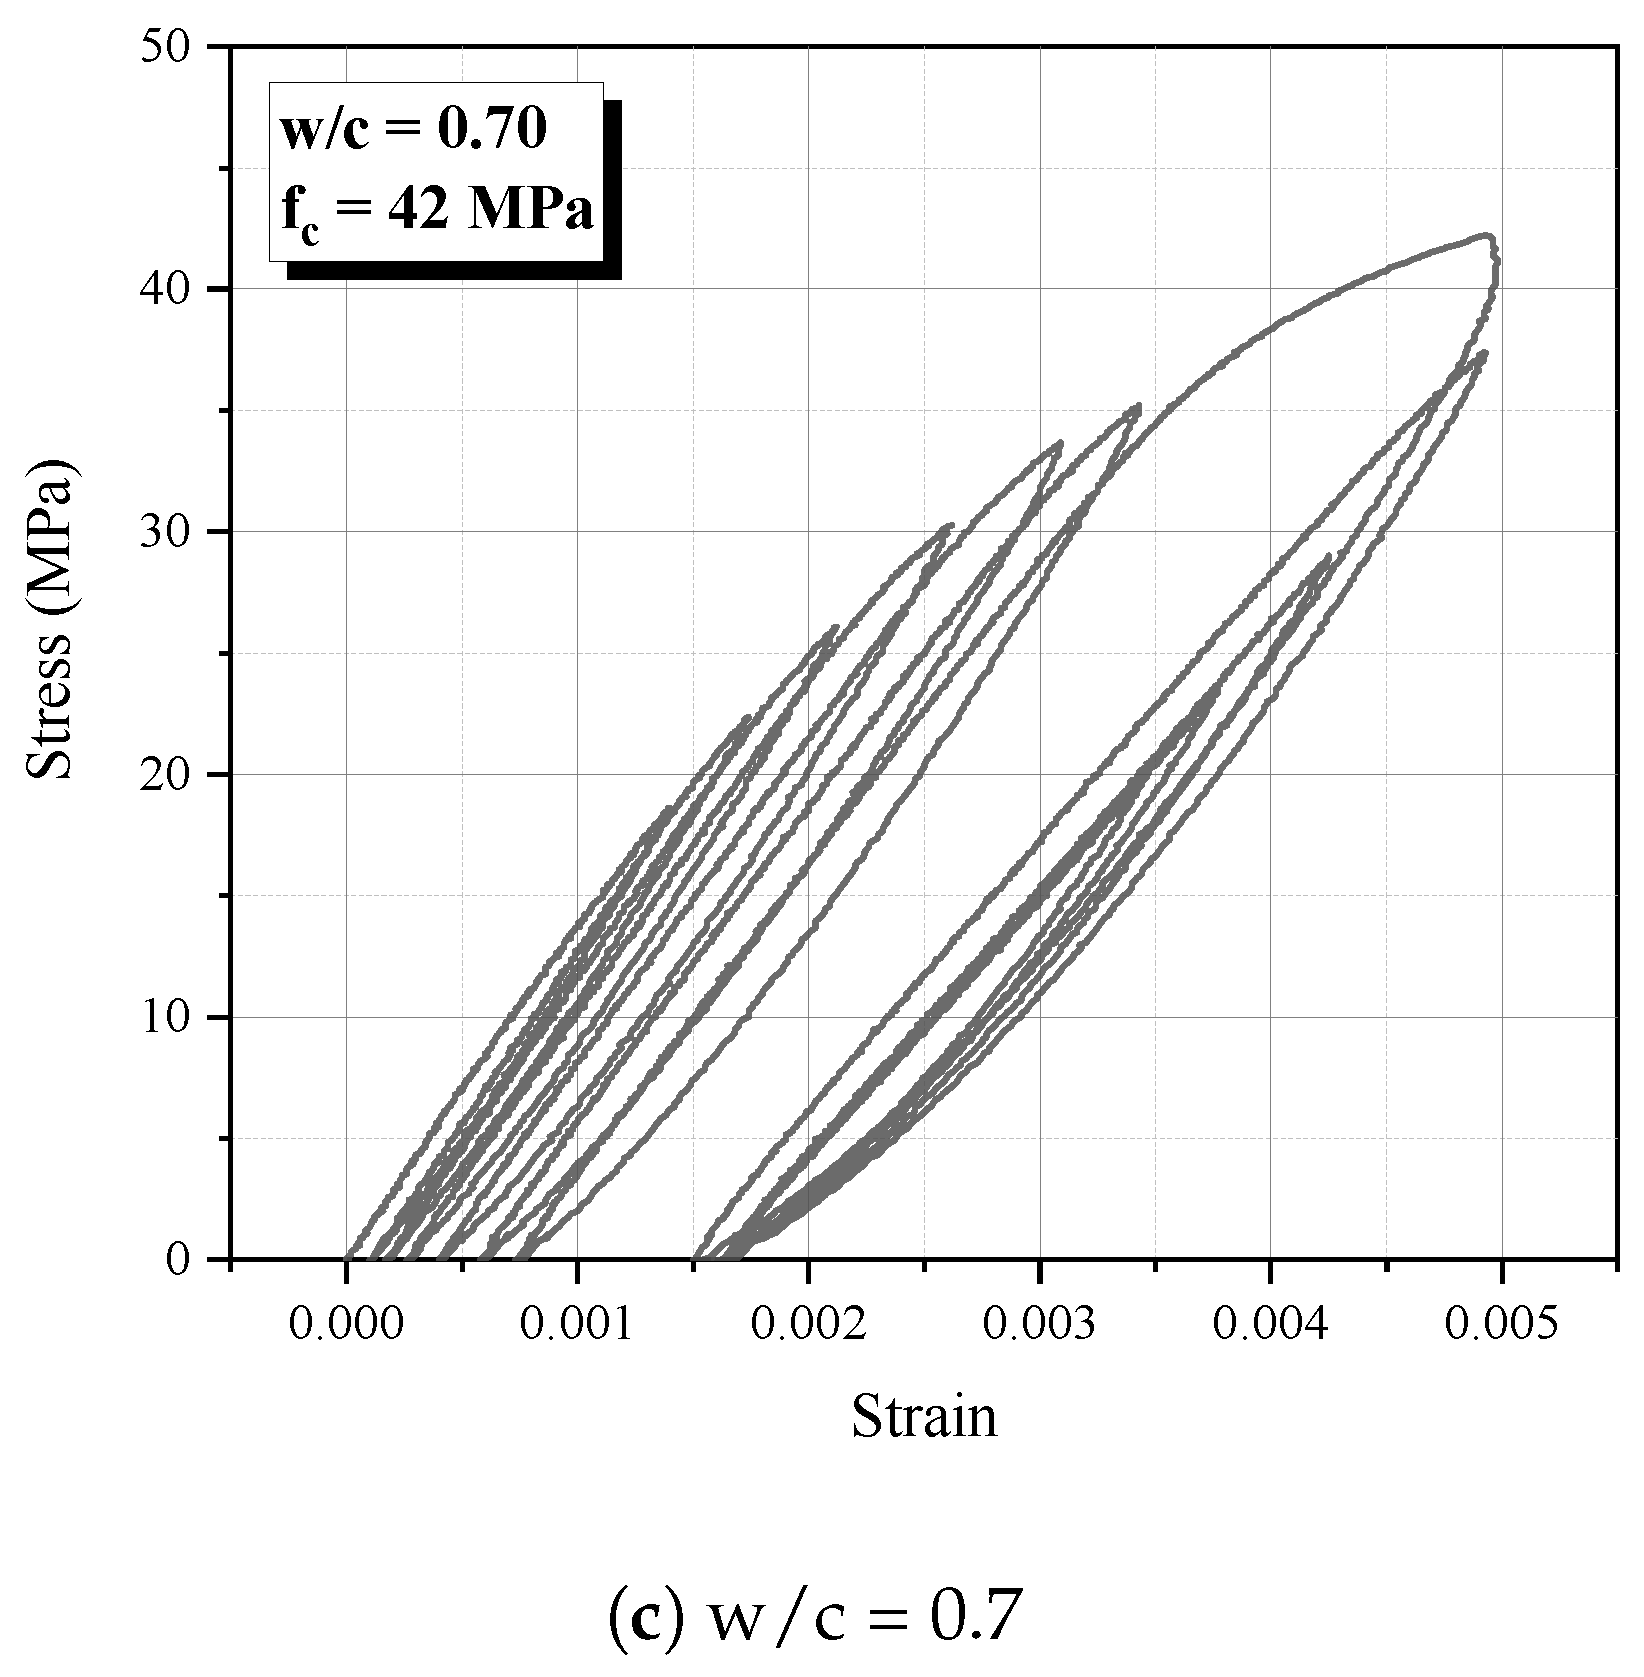
Figure 13.
Mixtures strength
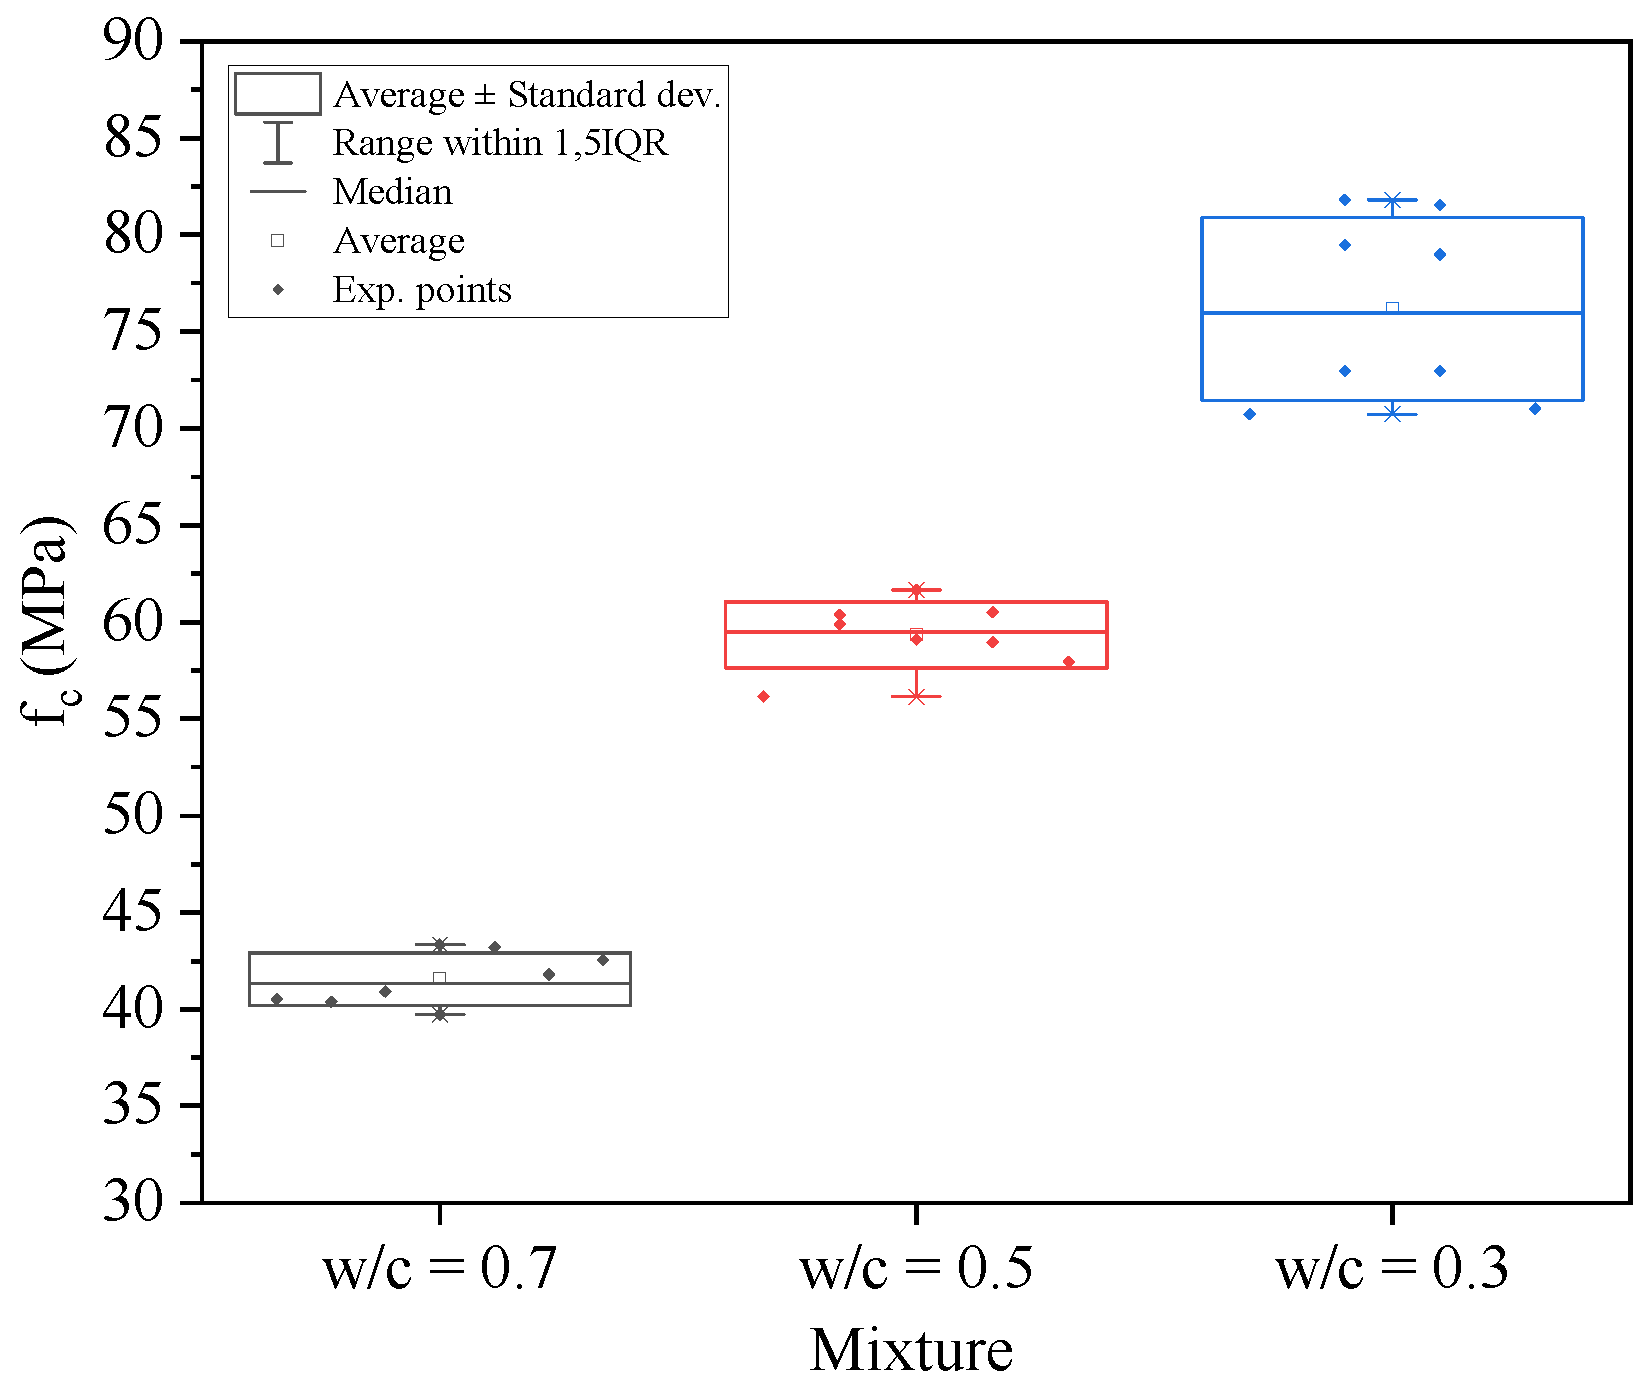
Figure 14.
Damage evolution - w/c = 0.5
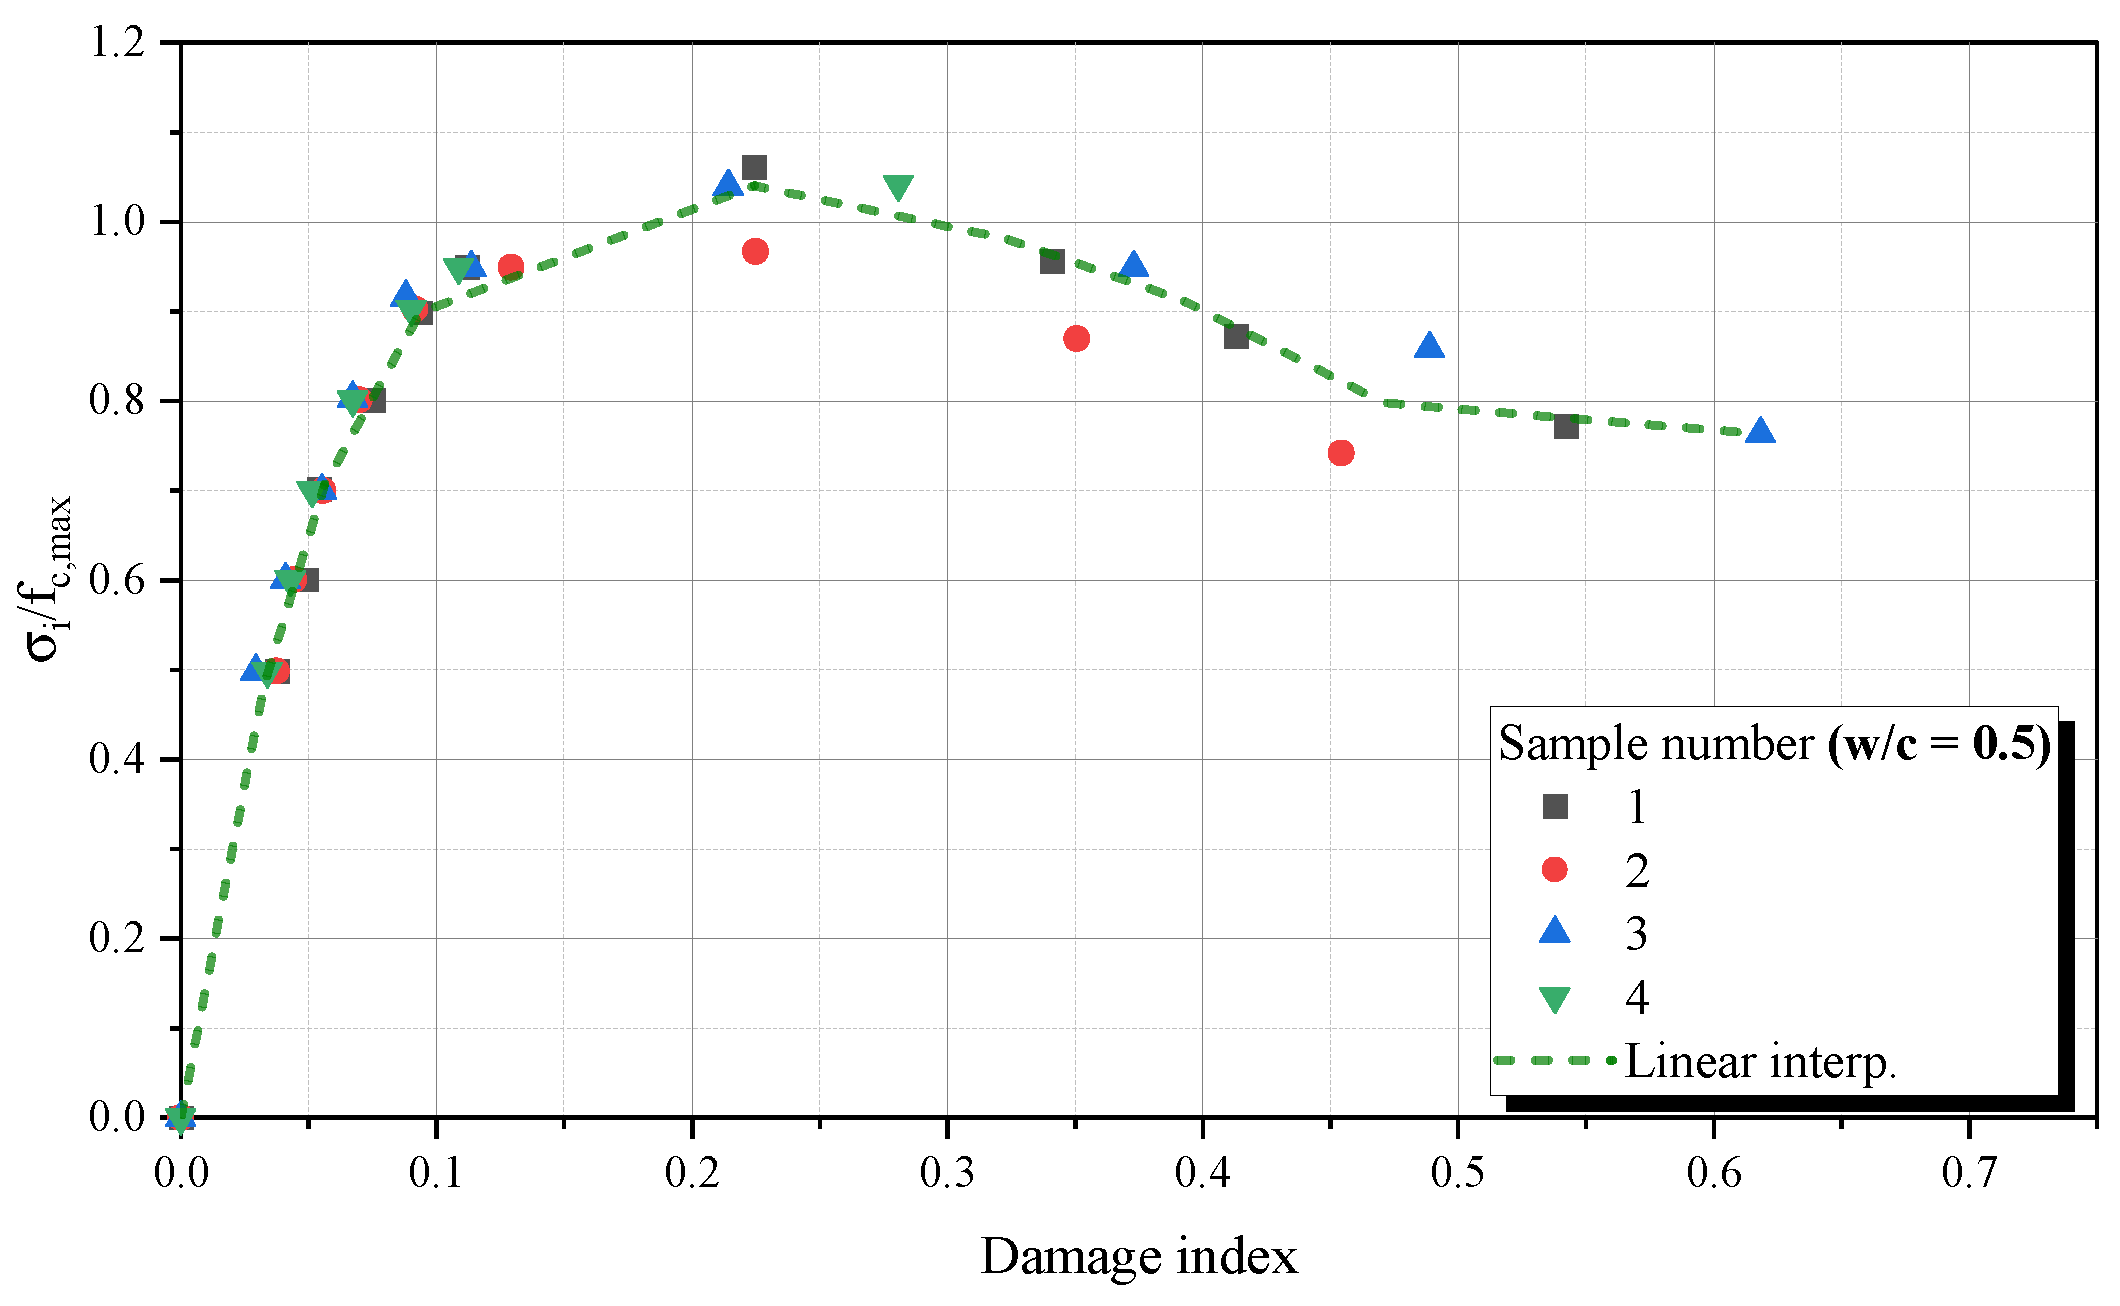
Figure 15.
Damage evolution - w/c = 0.3
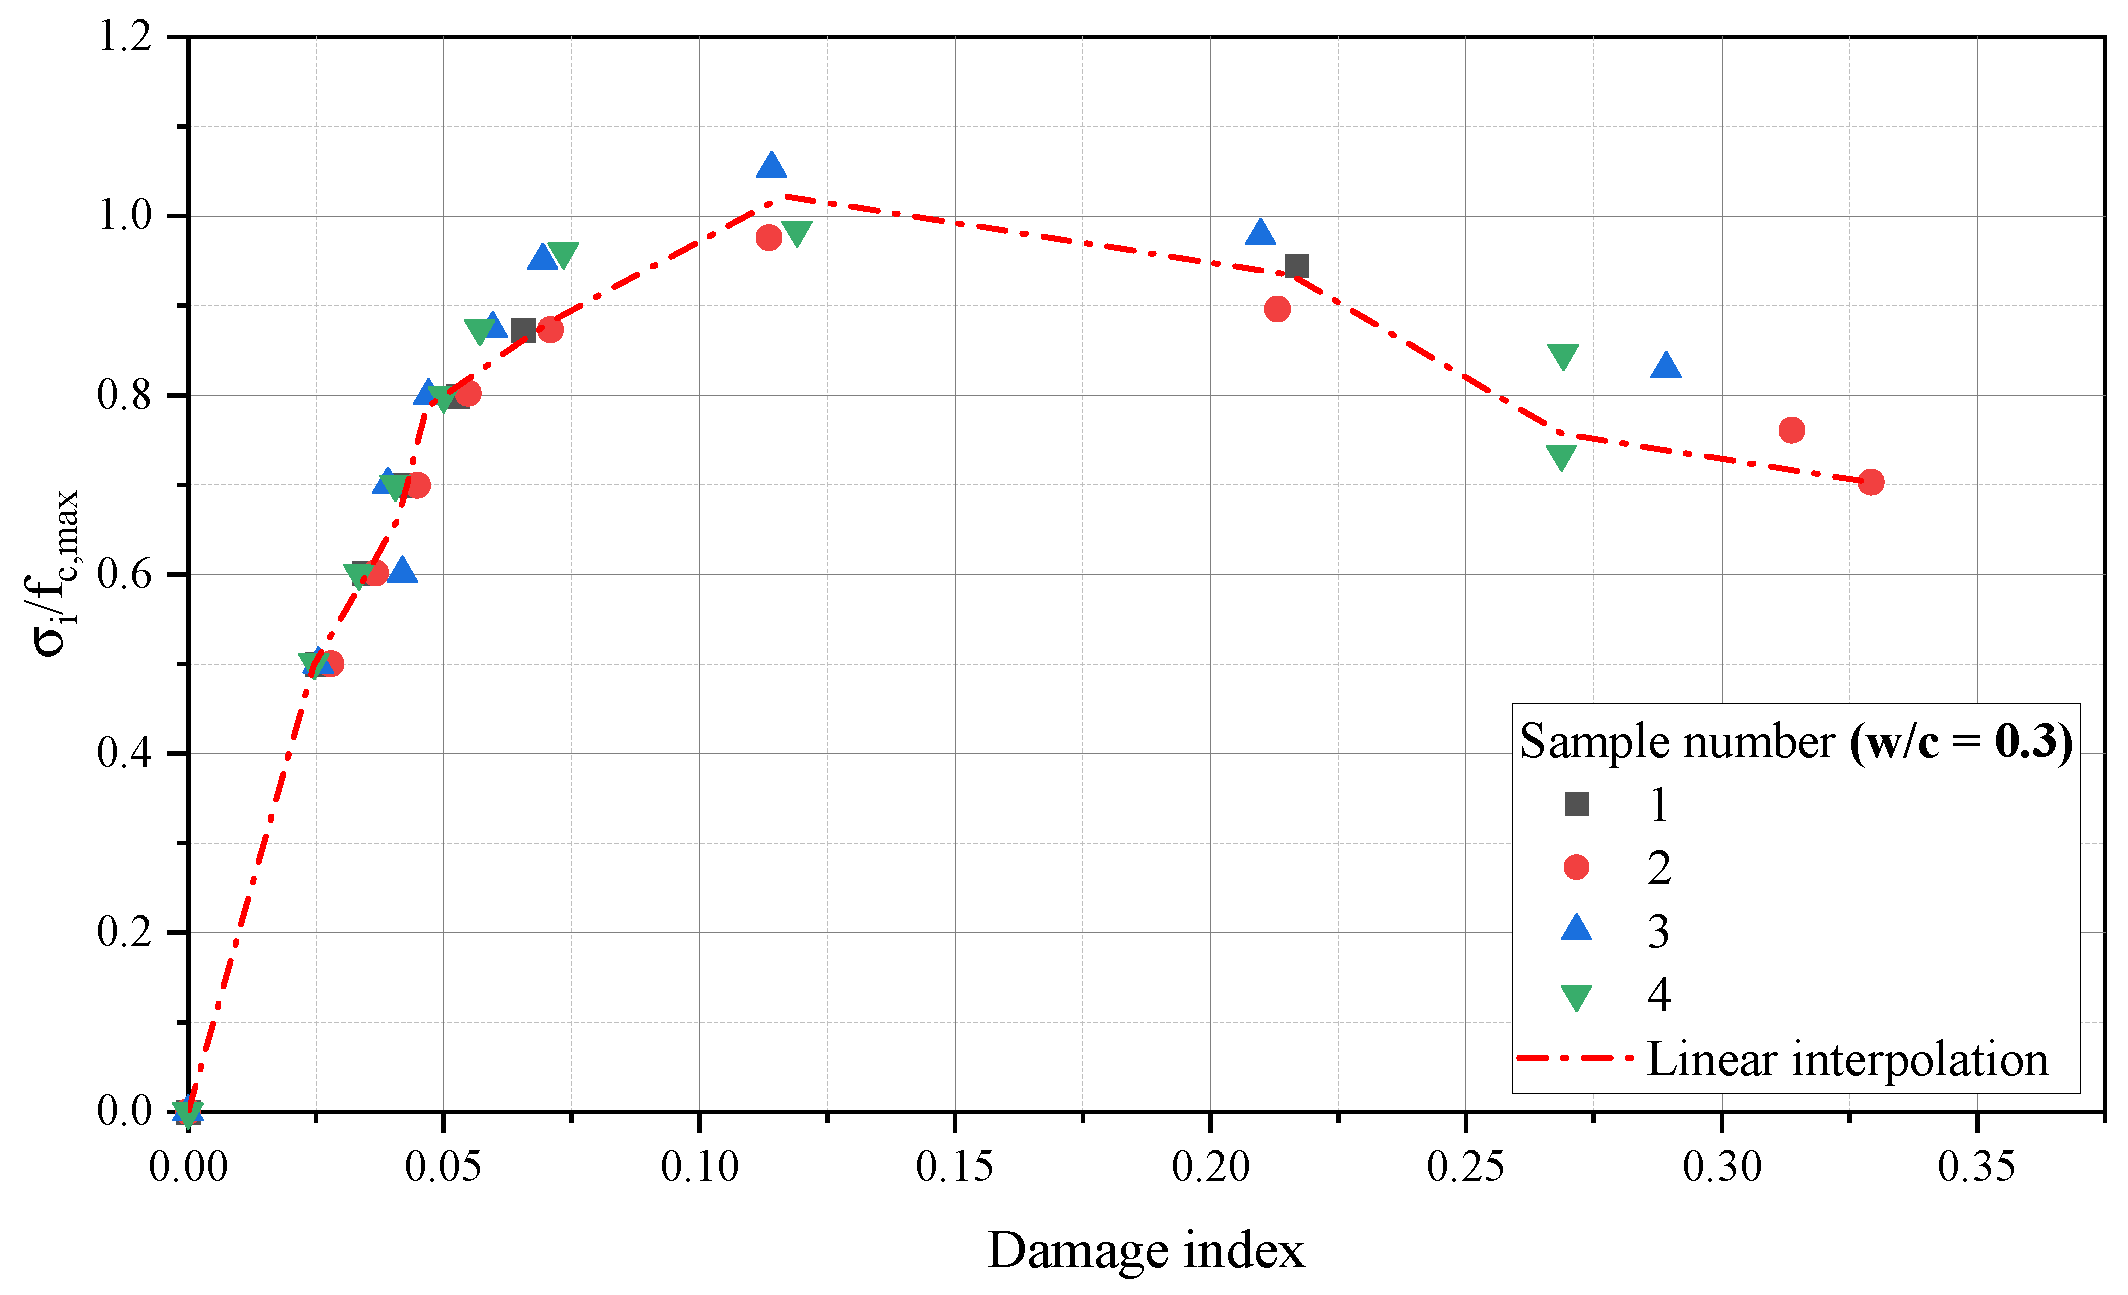
Figure 16.
Damage evolution - w/c = 0.7
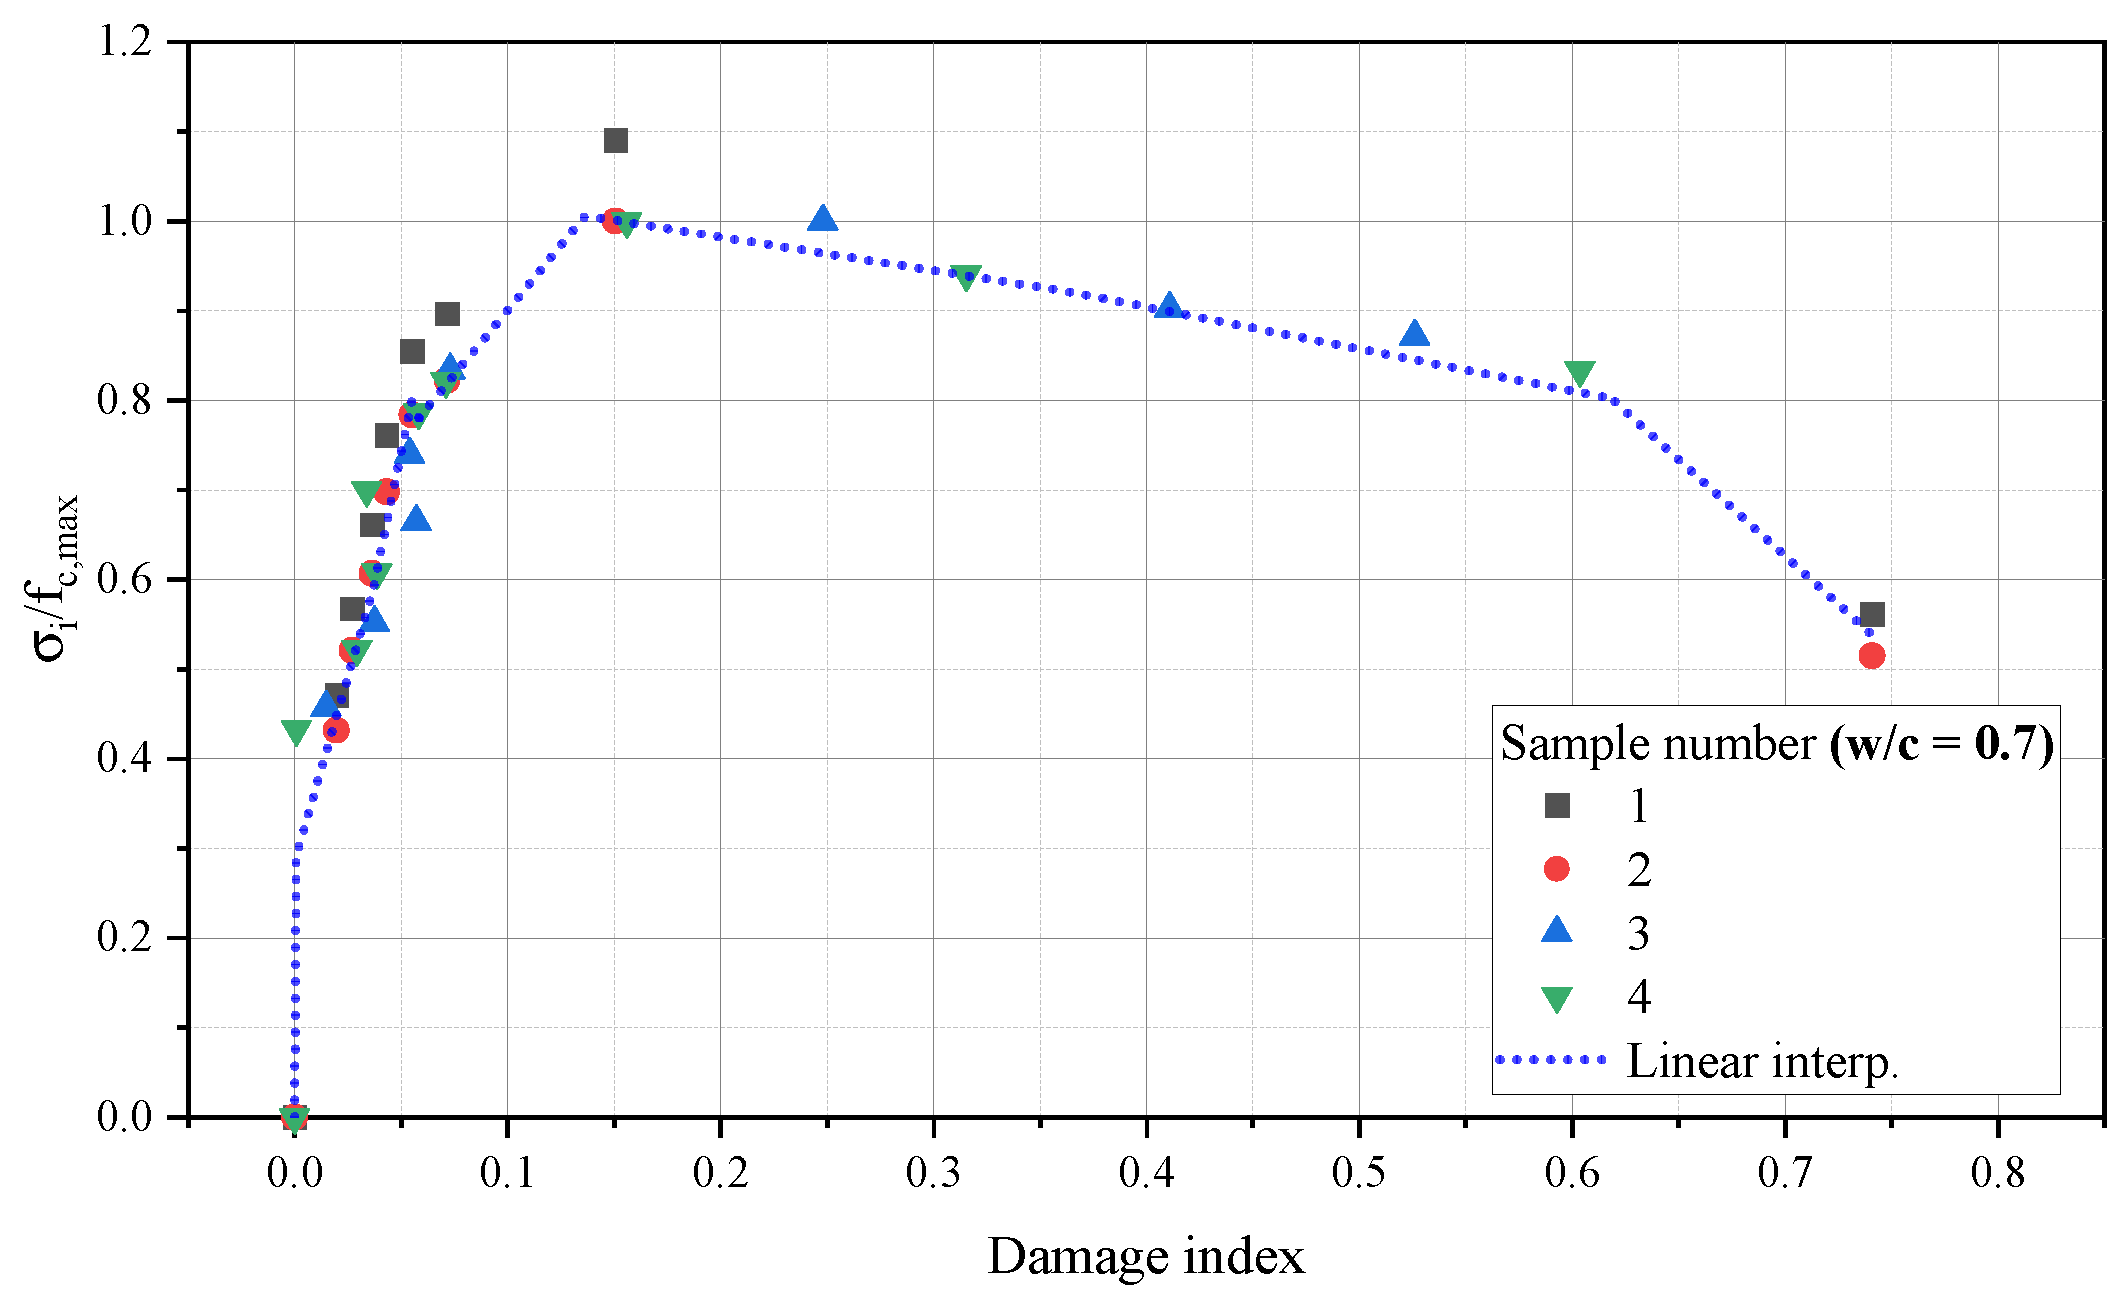
Figure 17.
Influence of Damage to internal damping ratio (w/c = 0.7)
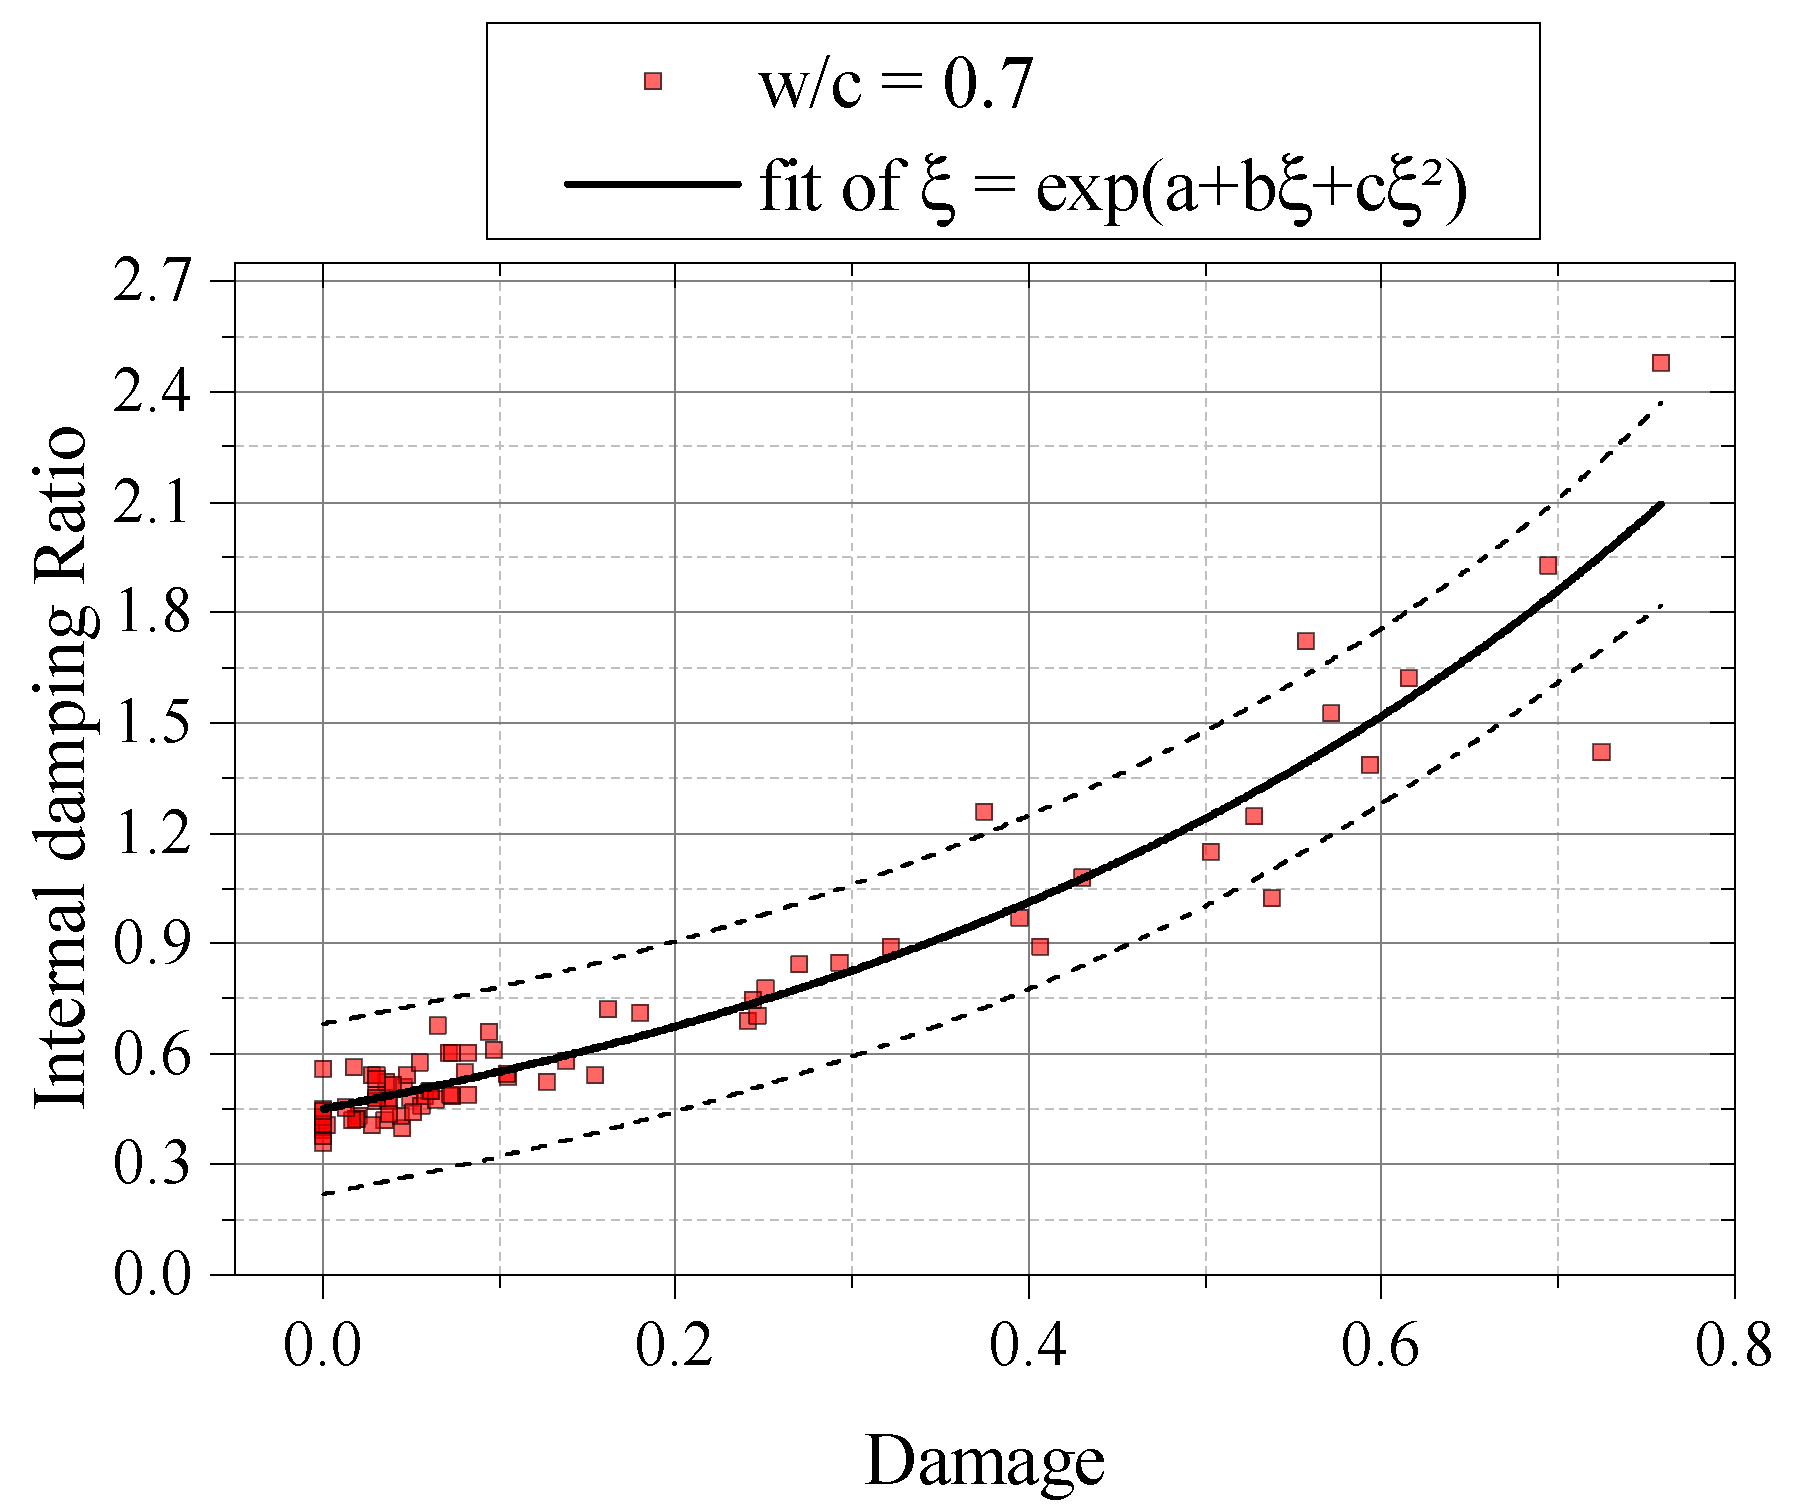
Figure 18.
Influence of Damage to internal damping ratio (w/c = 0.5)
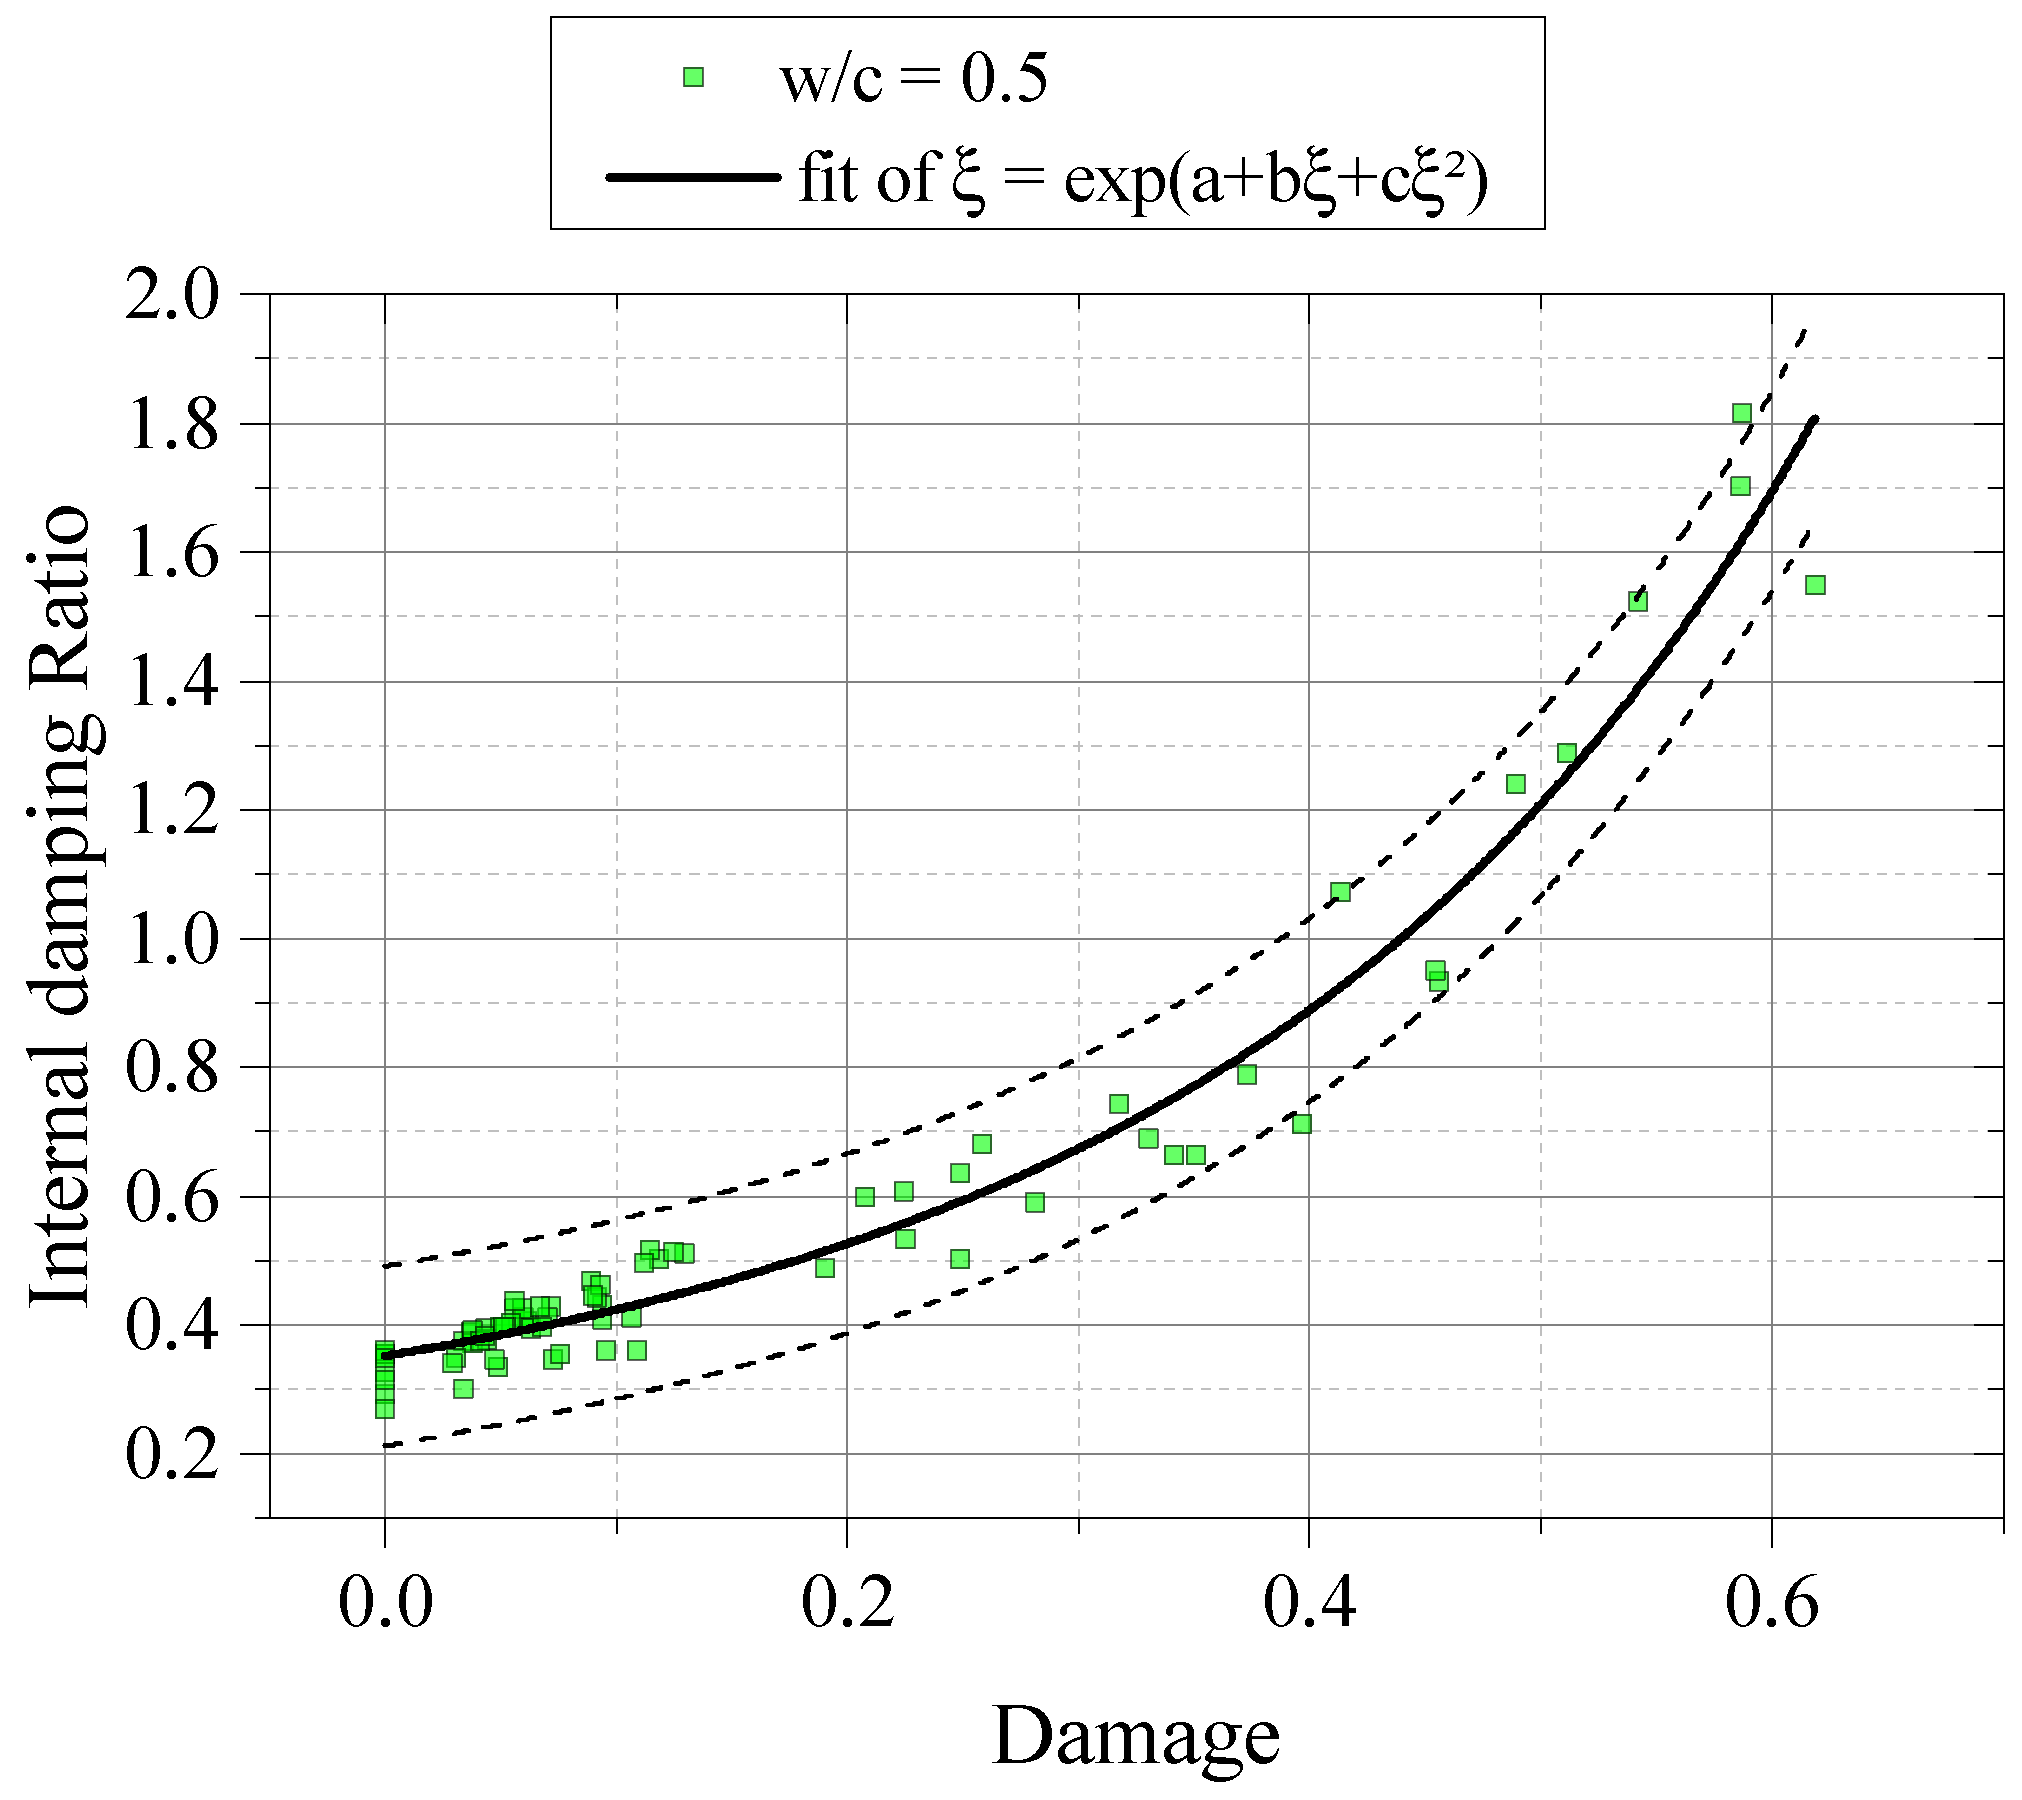
Figure 19.
Influence of Damage to internal damping ratio (w/c = 0.3)
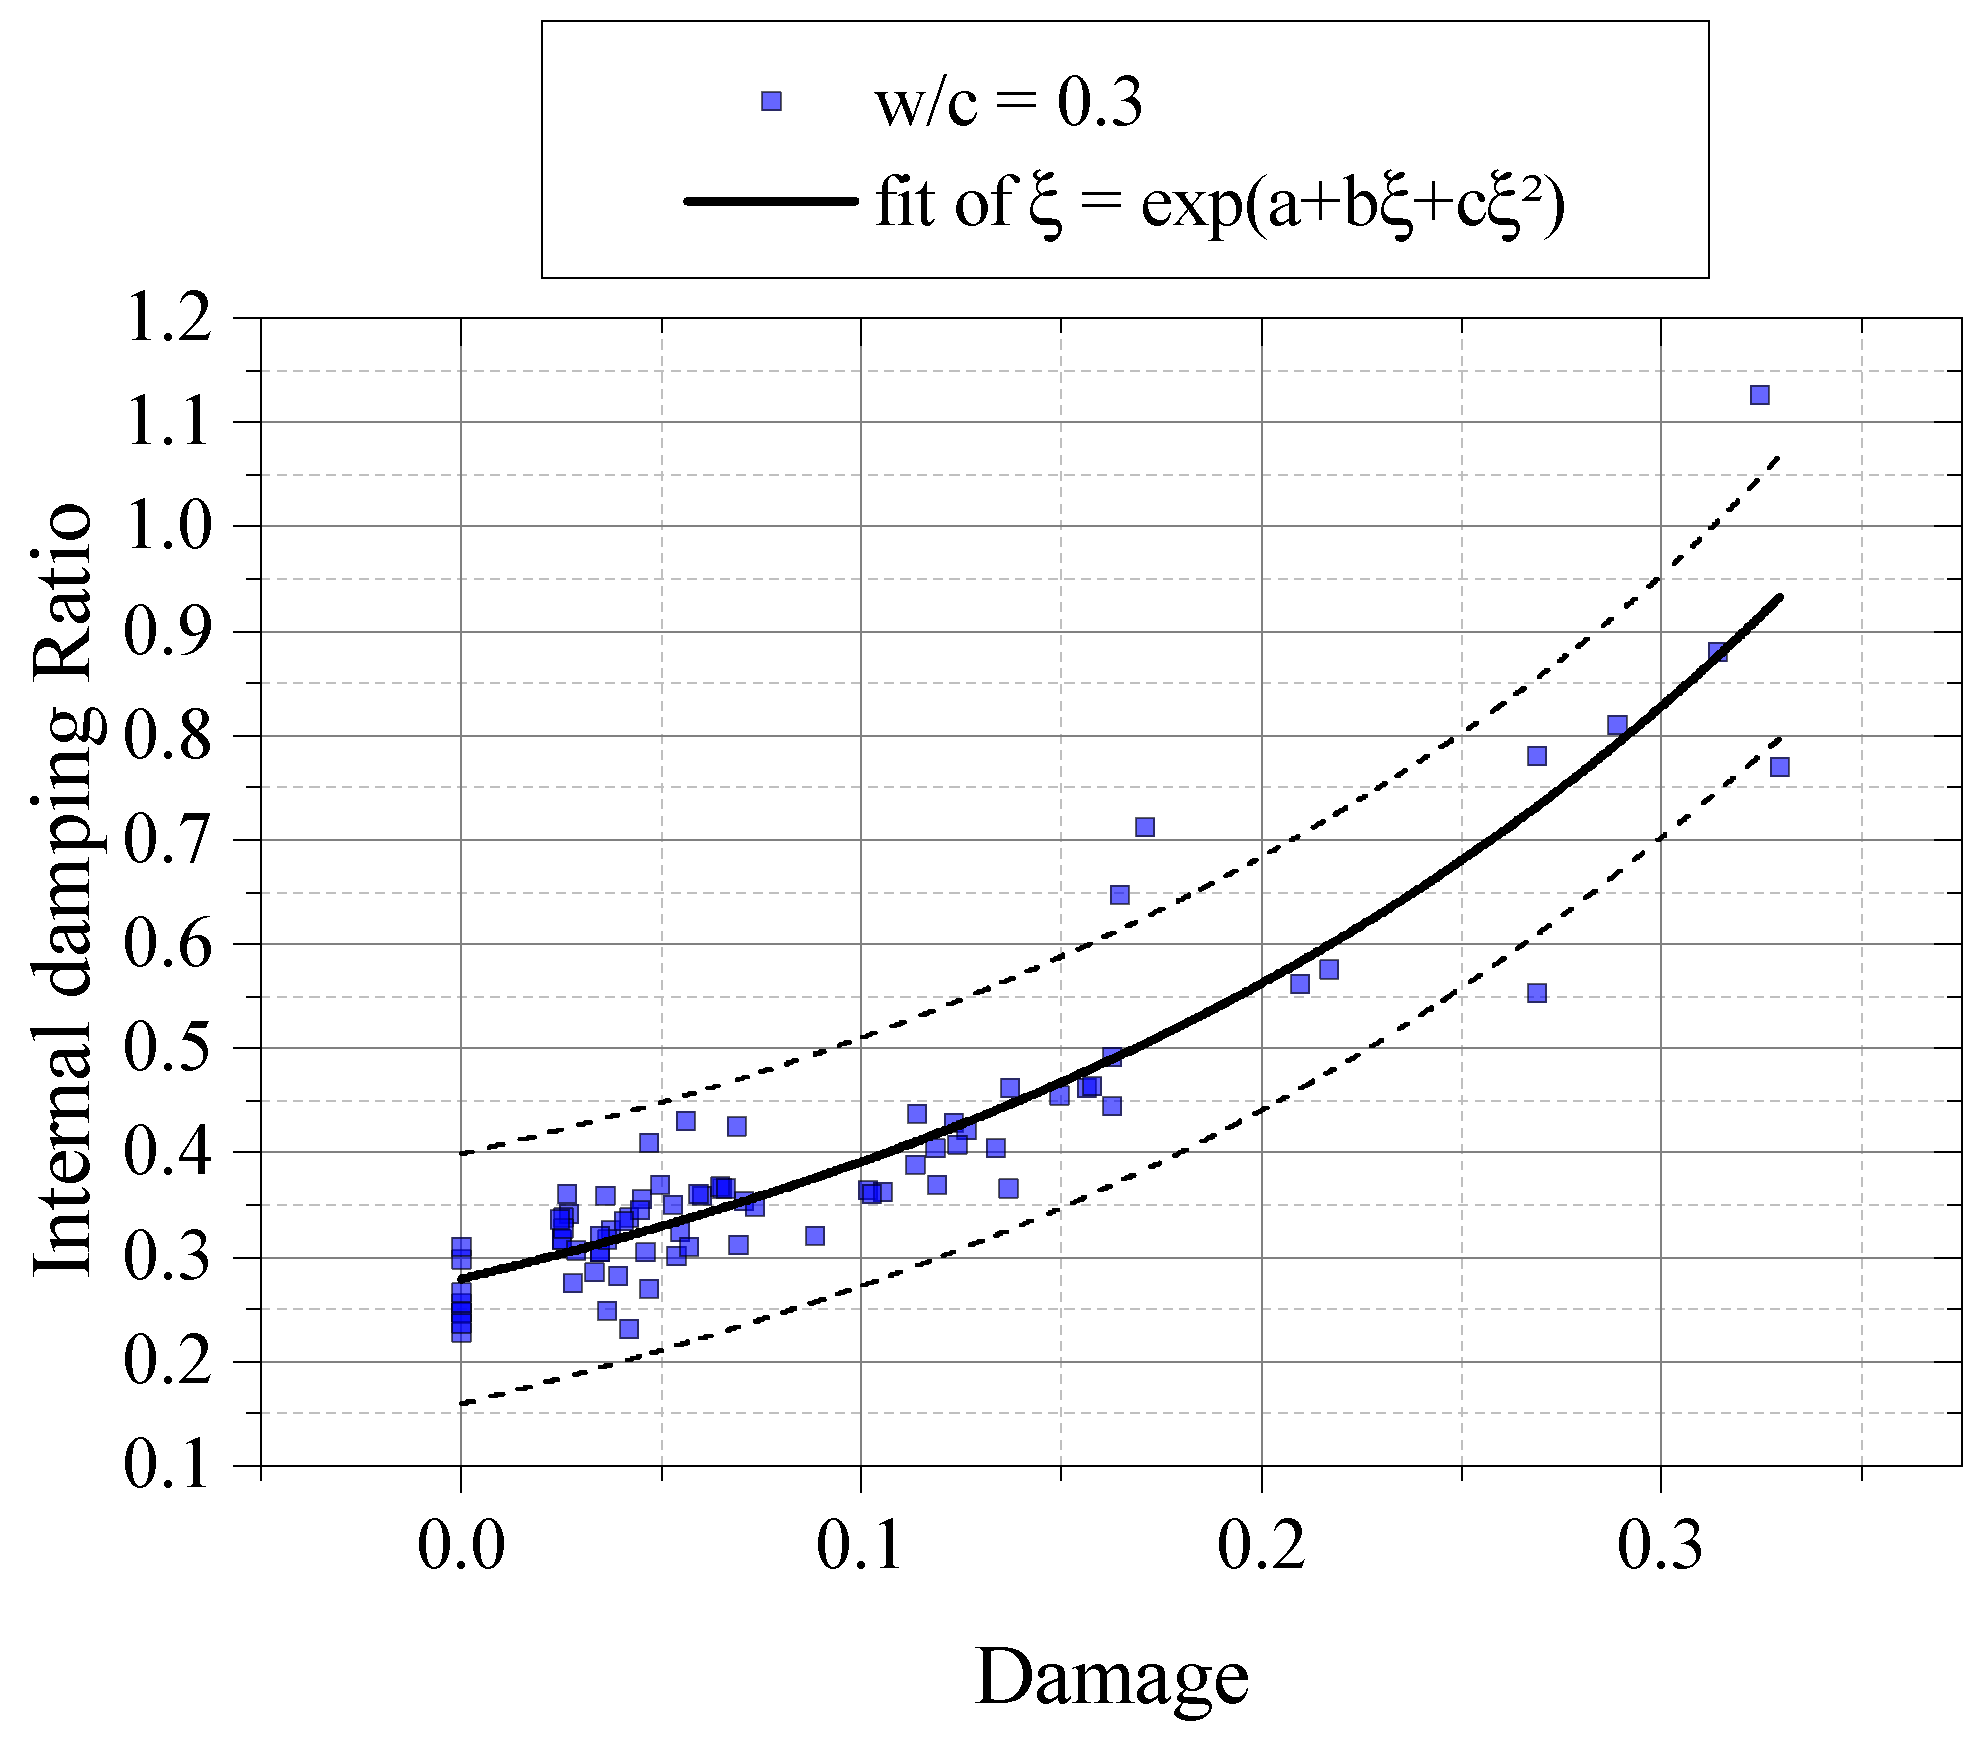
Figure 20.
Damage index vs
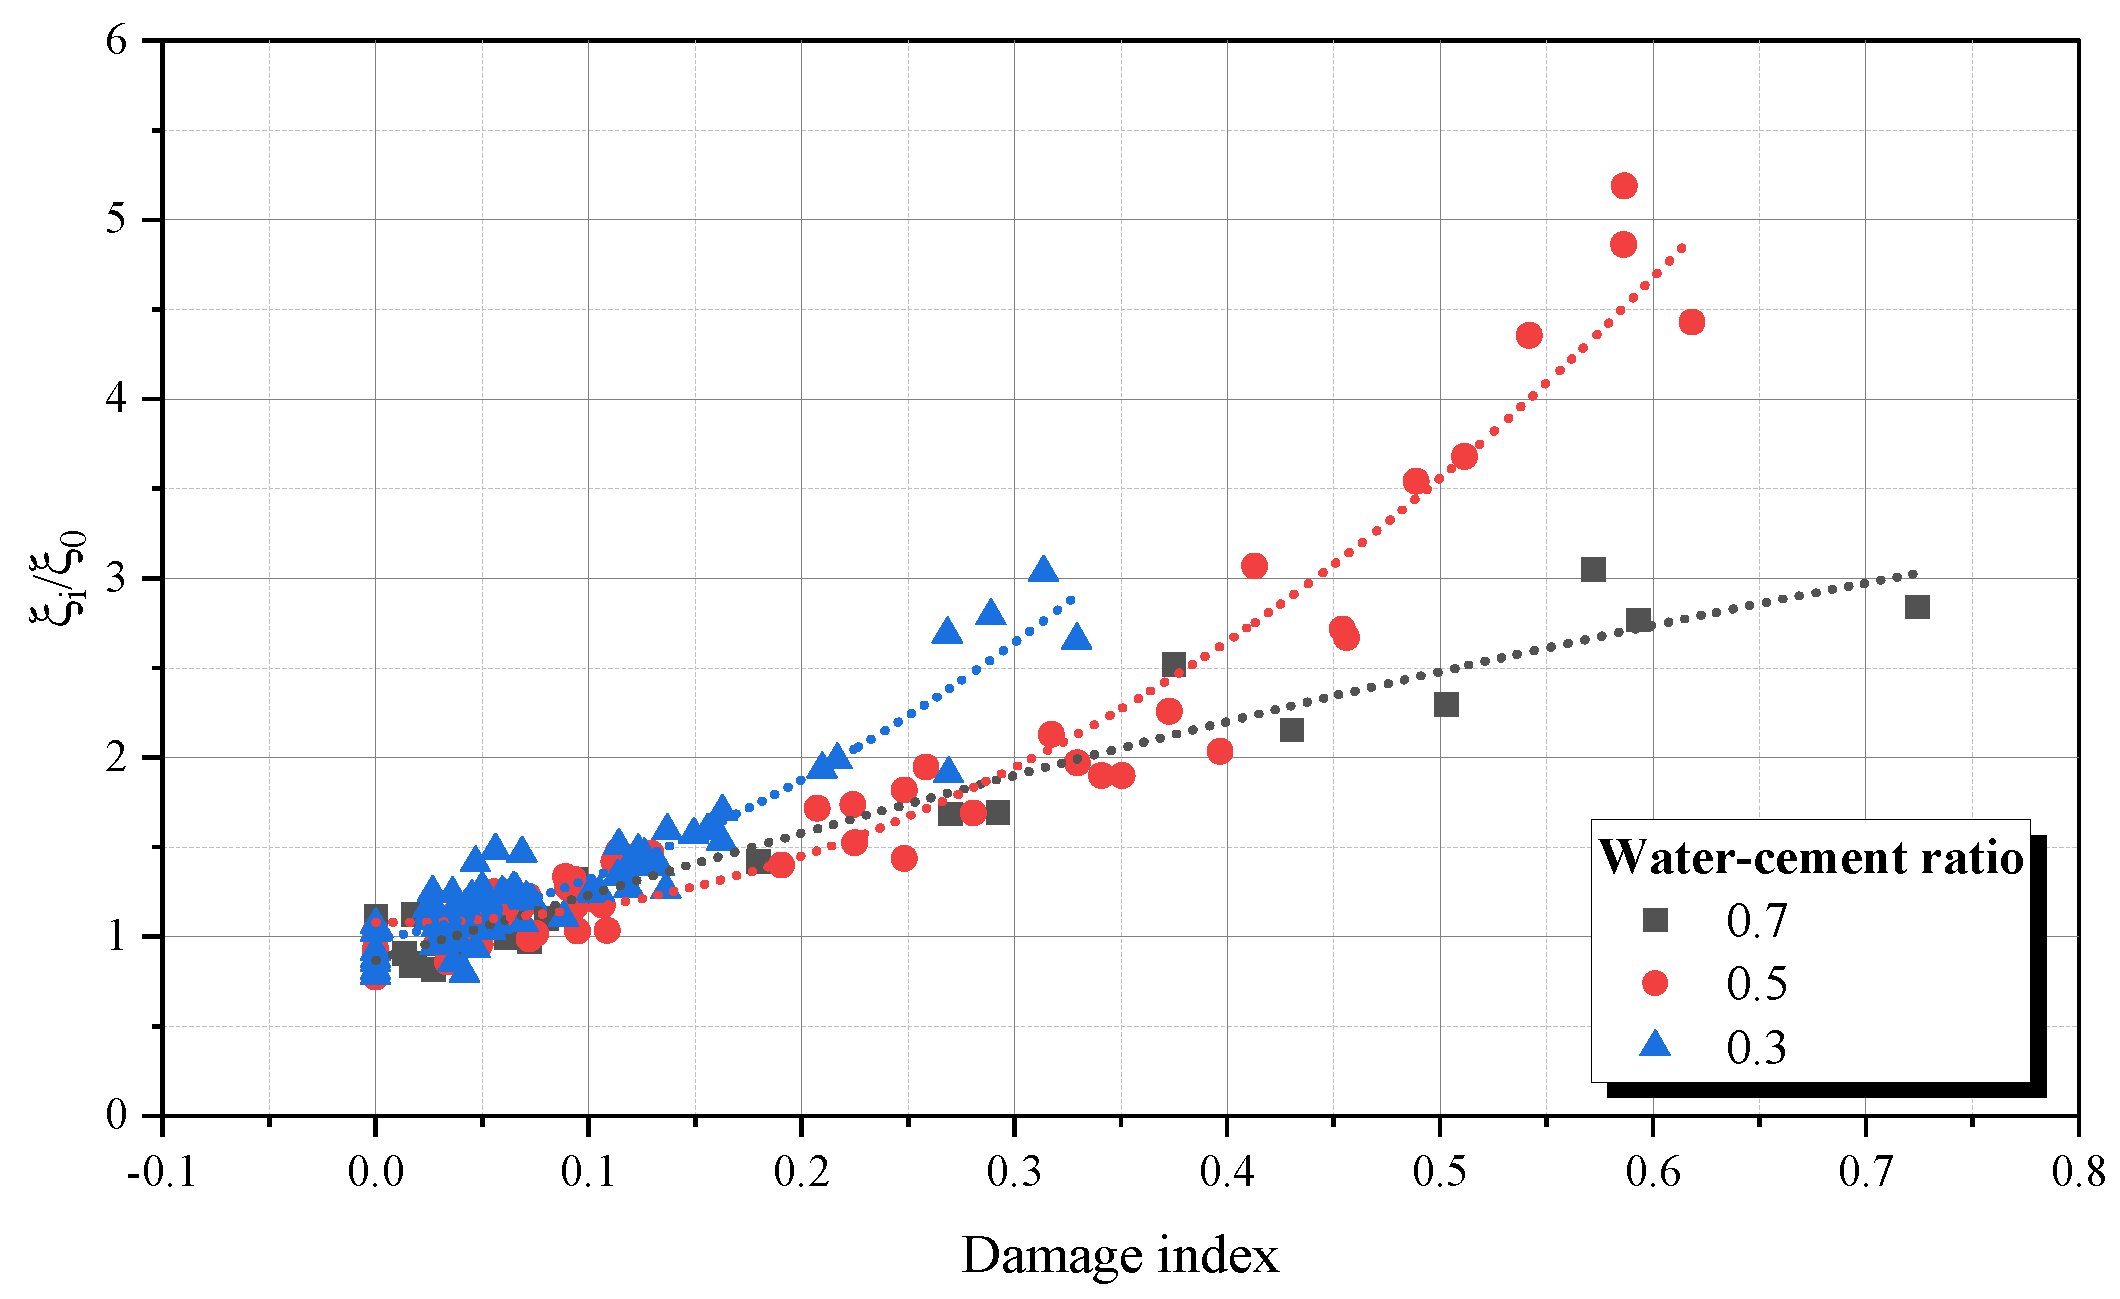

Table 1.
Concrete mixtures.
| ID | w/c | Cement | Sand | Aggregate | (mm) | SP. |
| 1 | 0.7 | 1 | 2 | 3 | 9.5 | 0 |
| 2 | 0.5 | 1 | 2 | 3 | 9.5 | 0 |
| 3 | 0.3 | 1 | 2 | 3 | 9.5 | 2 |
14.1cm 1 kg/kg of cocrete mixture 2 kg/kg of cocrete mixture 3 kg/kg of cocrete mixture 4 maximum diameter of coarse aggregate 5 Superplasticizer, in relation of cement weigth.
Disclaimer/Publisher’s Note: The statements, opinions and data contained in all publications are solely those of the individual author(s) and contributor(s) and not of MDPI and/or the editor(s). MDPI and/or the editor(s) disclaim responsibility for any injury to people or property resulting from any ideas, methods, instructions or products referred to in the content. |
© 2024 by the authors. Licensee MDPI, Basel, Switzerland. This article is an open access article distributed under the terms and conditions of the Creative Commons Attribution (CC BY) license (http://creativecommons.org/licenses/by/4.0/).
Copyright: This open access article is published under a Creative Commons CC BY 4.0 license, which permit the free download, distribution, and reuse, provided that the author and preprint are cited in any reuse.


