Submitted:
05 July 2024
Posted:
08 July 2024
You are already at the latest version
Abstract
This research is concentrated on the physical technique of carbon activation from carbon-based material such as bamboo. In addition, we impregnated the activated carbon by use of experimental methods. In the first case, the results from various parameters on the carbon activation process, such as kiln rotation speed, steaming time, calcination temperature and heating rate at the different levels has been investigated on iodine number of activated carbon. Using the Taguchi method and ANOVA analysis, the optimal test results were obtained which are as follows: steaming time and calcination temperature were the most influential factors and heating rate and kiln rotation speed were the less influential factors in the process. In the second case, palladium-impregnated activated carbon (Pa/AC) was prepared at different conditions of the experiment and effects of optimum ratios on the responses have been studied.
Keywords:
Activated carbon
; Design of experiment
; DOE
; Taguchi
; Iodine number
; ANOVA
; Palladium Impregnation.
1. Introduction
Due to the growth of the population and naturally the development of industry and the significant increase in environmental pollution and also production of domestic and industrial pollutants and effluents, the use of activated carbon for cleaning and filtration because of its reasonable and cost-effective prices has drawn global attention [1].
This activated matters which sometimes called black carbon or charcoal, is a unique adsorbent prized for its extremely porous structure that causes to have a very high surface area which can be capable of capturing and holding materials [2]. Another unique features of these purifiers is that they perform filtration without having any chemical reaction with its target host [3].
These carbonaceous source materials can widely use for an unending number of applications that require the removal of contaminants from air and water purification to soil and even gold recovery [4]. They have an impressive pore structure that causes to have a very high surface area which can be capable of capturing and holding materials and can be produced from a number of carbon-rich organic materials called biomass including: coconut, hazelnut, pistachio shells, wood, coal, peat, etc. [5]. The most commonly used as an emergency overdose or anti-poison treatment. Depending on the source material and the processing methods (physical and chemical), activation processes can differ significantly [6]. This creates a matrix of possibilities for variation in commercially produced carbons with hundreds of varieties available. Because of this, commercially produced activated carbons are highly specialized to achieve the best results for a given application. The most popular techniques used for the production of AC are chemical and physical activation. The properties of the ACs mainly affected by the activation method. Physical activation includes pyrolysis of the raw material in an inert medium and sequential activation in the presence of steam, CO2 or oxygen [7,8]. In chemical activation method that is not our goal in this research, activating agents such as potassium carbonate, sodium hydroxide, potassium hydroxide, zinc chloride and phosphoric acid are mixed with raw material which leads to the formation of porous structure [9]. Also, active carbon impregnation methods especially with metals and their oxides in carbonaceous materials modify the gasification characteristics and alter the porous structure of the final carbon product [10]. This issue caused a lot of noises in the last two decades. These techniques are relatively new methods compared to the carbon activation processes [11]. Activated carbon impregnation is one of the most common techniques for selective separation and removal of materials especially in industrial uses [12] for removing harmful and toxic gases in the environment and in a closed atmosphere and limited areas which can be useful in waste cleaning from factories, reactors and petrochemical uses (as catalyst), mask making industries etc. [13,15].
2. Result
2.1. Activation Process Supplements
In this paper, bamboo from the Northern part of Iran (Guilan province, city of Rudsar) was used. Before usage, the samples were stored in sealed plastic containers at room temperature. The bamboo was previously sieved to a uniform size and shape and was dried overnight at 180°C in a mechanical convection furnace. For moisture percentage of raw bamboo, this value was calculated around 50% of the total mass. The carbonization and activation of samples were performed in a rotating kiln furnace. According to the design of experiment (DOE), during the carbonization step, the kiln temperature was increased from room temperature to distinct levels of temperature and different ramping times. When the desired temperature was occurred, the inert atmosphere was changed into an activating atmosphere by injecting steam. Following the activation step, the samples were cooled to room temperature in a nitrogen atmosphere overnight and were then recovered. A scheme of the one-step activation process is presented in Figure 1. A mass flow regulator mounted on the input of the reactor tube controlled the flow of the protective gas. The steam was transferred to the reactor through a heated transfer-line using nitrogen gas as a carrier. The process parameters selected as factors were calcination temperature, heating rate, steaming time and kiln rotation speed.
The impregnation process involves the adsorption of palladium solution onto the surface of the activated carbon through various methods, such as wetness impregnation or deposition-precipitation. The resulting impregnated palladium activated carbon has a higher surface area and pore volume compared to traditional activated carbon which provide a greater number of active sites for catalytic reactions.
Activated carbon from impregnated palladium is commonly used in the filtration of contaminated water and air, as well as in industrial processes [16]. Impregnated palladium/AC is an effective and efficient material for catalytic for a wide range of applications and it is considered as clean and accessible resources. Also, use of these cost-effective materials leads to an improvement in efficiency and consequently increases the environmental sustainability [17].
2.2. Palladium Impregnation Process
After making the active carbon samples, it is time for impregnation. For this purpose, the prepared palladium ingots were divided into very small pieces. An aqua regia solution (mixture of three volumes of hydrochloric acid and one volume of nitric acid) were used to dissolve palladium pieces. It is very important to pay attention to the fact that the solution is highly toxic and corrosive and it is recommended to use an industrial hood for its use [18].
About 250 ml of freshly prepared aqua-regia solution from 65% sulfuric acid and 37% hydrochloric acid was poured into a 1-liter volumetric flask containing 20 grams of palladium pieces and placed on an electric heater. The temperature was kept in the range of 40-50 °C. In order to speed up the reaction and desolation of more palladium in the acid solution, a solution of dissolved oxygen was needed. For this purpose, about 50 ml of 37% hydrogen peroxide repeatedly as drop by drop was added to the flask. It will take about 2 hours for the palladium to completely dissolve. The involved reactions in this process are as follow:
- (1)
- Pd + HNO3 + 3HCl → PdCl2 + NOCl + 2H2O
- (2)
- PdCl2 + CO + H2O → Pd + CO2 + 2HCl
In the next step, the freshly prepared dissolved palladium in aqua-regia solution was added to the activated carbon) which was previously washed by water in order to remove impurities and waste materials (samples and mixed well. The solution is then allowed to stand for about two hours to be stabilized.
After that, the first stage of impregnation i.e., impregnation with ammonia solution begins [19]. Because of that, 100 ml of 25% ammonia solution was prepared with distilled water at different ratios. This ratio is one of the most important factors involved in impregnation by ammonia solution [20,21]. The different values of these ratios are listed in Table 6.
In this section, temperature increased to the range of 65-80°C. It should be noted that pH adjustment is one of the key factors in the palladium impregnation process, therefore, according to the laboratory results, the pH range was kept constant at 7-8. In the following, the bamboo activated carbon was directly poured into the tub containing the ammonia solution and it was well mixed. It was allowed to stand for about 2 hours to be completely cooled and stabilized.
- (3)
- PdCl2 + NH3 → (Pd(NH3)4)Cl
The next step is the second step of impregnation i.e., 55% hydrazine addition [22].
- (4)
- (Pd(NH3)4)Cl2 + 2N2H4 → Pd + 4NH4Cl + N2
In the following of the previous stage, different ratios of hydrazine to water was used which is shown in Table 1.
Also, this ratio is also one of the most influential factors in palladium impregnation process [23,24]. Along with the ratio, pH and temperature range like the previous section are the most important influencing parameters. In this part, as in the previous part, setting the temperature and pH of the environment is vital. Therefore, according to our laboratory findings, the temperature range was kept around 60-80 °C and pH range was kept constant at about 7-8. In this step, like the previous section, addition of hydrazine solution was gradually increased, then the mixture was stirred for 30 minutes using a magnetic stirrer. Finally, total ash content and concentration of Pd-impregnated on the activated carbon samples was determined as shown in Table 2.
2.3. Total Ash Content of Activated Carbon
An accurately weighed sample of dried impregnated activated carbon was placed in a muffle furnace as controlled-temperature for a period of several hours. After reaching the constant weight, the crucible was cooled to ambient temperature in a desiccator and reweighed (the weight of the ashed carbon is expressed as a weight percentage of the original carbon sample)
Total ash, % 5 = [(X – A) / (Y – A)] × 100
where:
A = weight of crucible, g,
X = weight of crucible plus ashed sample, g, and
Y = weight of crucible plus original sample, g.
The values obtained from the amount of total carbon are given in Table 2.
After removing the palladium impregnation of activated carbon crucible from the muffle furnace, they were placed in a desiccator to cool. Then, the samples were transferred to the industrial hood and in order to destroying the carbon content some formic acid was added. It should be noted that formic acid should not be used in large amounts and only to the extent that it overlaps with the ash content. Then the sample was transferred to the oven in the temperature range of 100-125 °C. After cooling the sample, 1:1 amounts of aqua-regia and distilled water were added to the mixture and it was placed on an electric heater equipped with temperature control and the temperature was kept constant in the range of 45-50 °C and covered with a watch glass. It is very important to note that the solution should not boil. After the volume of the solution on the heater reaches a third of its initial volume, the samples from the heater was removed and it was allowed to cool. In the next step, about 20 ml of hot hydrochloric acid solution (1:1 dilution (in conjunction with 80ml of HCl (1:1 dilution (was added and then diluted to the mark with distilled water. Then the solution was transferred to 250ml volumetric flasks. Finally, with aid of an inductively coupled plasma (ICP/OES 700 series) device, the amounts of palladium concentrations present in the samples were read out. The values of final calculated results of the apparatus are shown in Table 2.
C = (Cppm × V × D × CF) / m
Where:
Cppm = concentration of palladium read out by the device, ppm
V = volume of palladium solution, ml
D = dilution factor
CF = correction factor
m = weight of ashed sample, g
2.4. The Relationship between the Responses
In this investigation, the results of the total ash content and palladium concentration were studied through the interpretation of the data using the scatterplot curve, and as expected, a delicate relationship was found, which indicates that the lower the amount of ash from the carbonaceous material from bamboo, the higher the palladium concentration read by the ICP/OES device will be. This is clearly evident in the three-dimensional curves of the scatterplot in Figure 2 and Figure 3. These figures demonstrate the exact relationship of the ratios and the responses results in the process separately.
3. Discussion
The activated carbons were characterized by several parameters to investigate the IN of bamboo samples. Different main parameters were selected among some less-influential factors involved in the process and studied for the carbon activation processes which including calcination temperature, steaming time, heating rate and kiln rotation speed.
3.1. Importance of Variables Involved in the Process
In this section, the importance of each parameter in the process has been examined separately, and the results of the analysis are given in Table 4.
3.1.1. Effect of Steaming Time
The effect of steaming time on the carbon activation process was studied. This factor causes the creation of microscopic pores and porosity in the carbon sample, which naturally increases the surface area of carbon, porosity and ultimately increases the IN. Because the more porosity is applied under the desired temperature, it creates more microscopic holes and allows more iodine molecules to absorb into the biomass. This result demonstrates that physical activation with steaming is a widening process in which micropores are generated in the first phase, and mesopores in the second phase are formed. The obtained results are listed in Table 3.
3.1.2. Effect of Calcination Temperature
As the steaming time, calcination temperature also plays a significant role in activation process. This factor had a highly significant effect on the yield and the total carbon and oxygen contents. In this research, the calcination temperature range between 300 and 1200 °C was investigated and studied. The observations imply that the best results of IN are in the temperature range between 600-800 °C. In the temperature between < 600 °C and 800-1200 °C, the lowest IN responses were observed.
3.1.3. Effect of Kiln Rotation Speed
The rotation speed results of the study on iodine number (IN) was considered and it was found that it causes the decreases at high rotation speeds of furnace and in turn this is interesting but like the previous two factors did not have such a significant impact on the content of the IN of activated carbon.
3.1.4. Effect of Heating Rate
The heating rate influence on activated carbon properties was not as relevant when we compared with steaming time and calcination temperature because it had a very small positive influence on the porosity and eventually the IN of production.
After finishing the production of activated carbon, an approximate analysis relative to the bamboo on AC yield was carried out. It was observed that the AC yield from activation temperature at 700 °C was the highest (82.5 % in average) whereas the AC yield from 300-600 and 900-1200 °C was the lowest (43.3% in average). Higher activation temperature reduced the AC yield. A detailed interpretation about the temperature of 900 °C was obtained regarding the temperature relationship of active carbon with IN and it was concluded that the higher activation temperatures helped eliminating volatile matter from the structure of the bamboo samples. For the samples with lower temperature such as 300 °C, activation temperature did not apparently affect the yield of AC as it was around 43.3% in average.
This research has presented a direct transfer of the parameters to an industrial scale production.
ACs from bamboo samples were produced and the effect of parameters including heating rate, kiln rotation speed, calcination temperature and steaming time on IN was investigated.
The first part of the results includes the evaluation of the main factors of the overall activation process. The response values summarize the overall contribution of each variable to the Taguchi design. With 95% confidence level for the results it was understood that among the factors influencing the activation process, only two out of four factors had the greatest impact on improving the carbon activation process. On the other hand, heating rate and kiln rotation speed in the range considered for this experiment were the least influential factors involved in the process. In addition, results from the contribution percentage of mentioned factors were also obtained which proves this subject. The second part of the experiment is dedicated to the obtained results from total ash content (%) and concentrations of palladium (ppm) at the different levels of experiment. From these results, it was concluded that when the third level of ammonia and hydrazine ratios was applied we observe much better results in the concentration of palladium and the total ash content than the first level and the second level to some extent.
4. Materials and Methods
4.1. Iodine Number
The iodine number (IN) is a relative indicator of porosity in an activated carbon [25]. It does not necessarily provide a measure of the carbon’s ability to absorb other species. IN may be used as an approximation of surface area for some types of activated carbons. This test method covers the determination of the relative activation level of unused or reactivated carbons by adsorption of iodine from aqueous solution. The amount of iodine absorbed (in milligrams) by 1 g of carbon using test conditions listed are listed in the Table 2.
4.2. Software
Minitab 17 Statistical Software can visualize, analyze and harness the power of your data to solve your toughest challenges from anywhere [26]. With the power of statistics, industry-leading data analytics, and dynamic visualizations on your side, the possibilities are endless.
For the design of the experiment, software Minitab 17 was used. In the first step, a factor list of four process parameters was selected. Minitab Statistical Software gives you the tools you need to analyze your data and make decisions about how to improve your process. Its power and ease of use make it the leading software used for quality improvement and statistics education worldwide.
4.3. ICP/OES 700 Series
Inductively coupled plasma atomic emission spectroscopy (ICP-AES), also referred to as inductively coupled plasma optical emission spectroscopy (ICP-OES), is an analytical technique used for the detection of chemical elements [27].
ICP OES takes on this role, superseding other methods of elemental analysis. Short analysis times, low sample preparation effort, multi-element detection and exceptional device sensitivity are hallmarks of this method. The latest generation of ICP OES devices makes elemental analysis even more user-friendly, economical, and flexible.
4.4. Taguchi Experimental Design
Taguchi’s quality control method is an engineering approach that emphasizes the role of research, design and product development in reducing the incidence of defects in manufactured goods [28]. Invented by Japanese engineer Genichi Taguchi, this method considers design more important than the production process in quality control and aims to eliminate variances in production before they occur [29]. Taguchi’s quality control method measures quality as a calculation of the loss to society associated with a product. Specifically, loss in a product is defined by changes and deviations in its performance as well as harmful side effects caused by the product. The loss caused by the change in performance and comparing the difference of each product unit is the basis of the performance of this method. The greater the variance, the greater the loss of performance and quality. This method can show as a monetary figure how the use of defects has affected the product. In this research, separate effect of each parameter on IN of AC was studied and using Taguchi experimental design method, designing a matrix and determining the number of trials, the results were analyzed and the importance of each one was separately evaluated.
4.4.1. Generation of the Matrix of Experiments
The first part of the research involved designing and individuating the parameters necessary for the experiment [30]. The values of the process parameters were specified in a range with a minimum and a maximum value as reported in Table 3. These values represent the parameters according to which the study was carried out and for which all the analyses achieved statistical validity. The experiments were performed following a random sequence to maintain stochastic independence between each experiment.
The orthogonal array configuration was chosen as a setup for the matrix generation. From a factor list of seven process parameters, a matrix of the experiment was generated which is designed in Table 4. The number of experiments resulting from the Orthogonal array was OA9 (33) with intermediate values.
It should be noted that HR, ST, CT and KRS are abbreviation for Heating Rate, Steaming Time, Calcination Temperature and Kiln Rotation Speed, respectively.
4.4.2. Main Effect Calculations
4.4.2.1. The Philosophy of Main Effects Plot
The main effects plot’s basic purpose is to compare the average changes of the data for the most influential factor that affects the response. Following that agenda, you can expect it to display the means for each group within a categorical variable. When the line is horizontal (parallel to the x-axis), it means that there is no main effect on the characteristic of the product. Each level of the factor affects the response in the same way and the response mean is the same across all factor levels. When the line is not horizontal, then there is a main effect. Also different levels of the factor being studied will differently affect the response. It means that the greater the slope of the graph line, the greater its magnitude. The main effect plot and data mean of the responses are shown in Figure 4 and Table 5, respectively.

Table 5.
Mean responses for iodine number of activated carbon at the different levels.
| Variables | Level 1 | Level 2 | Level 3 |
| Calcination Temperature (°C) | 420 | 785 | 555 |
| Kiln Rotation Speed (rpm) | 350.900 | 456.980 | 350.090 |
| Heating Rate (°C/min) | 320.667 | 380.000 | 290.900 |
| Steaming Time (min) | 575 | 780.333 | 555.667 |
The existence of ash in activated carbon process would result in blocking some pores, and the removal of ash can form some new pores, especially micropores. When water vapor is injected and used as an activator, if the ash content of raw material is high, the activated carbon will have larger pores, more medium and large pores, and consequently lower specific surface area. In other word, the lower the amount of ash remaining in the crucible, the better efficiency we will have in the process of activation and impregnation. This is a general principle that should be paid special attention to it. The presence of a lot of ash, especially in palladium solubilization causes errors, because the greater the amount of ash, it will finally appear in the mathematical formula for reading out by the ICP/OES device, because the weight of the ash causes the percentage of calculation error and will give a false result. Therefore, it is better to perform activation in such a way that the amount of carbon ash is as low as possible. The mean values of impregnation data are presented in Table 6.
Table 6.
Mean responses for total ash content from impregnated activated carbon.
| Variables | Level 1 | Level 2 | Level 3 |
| Ratio of NH3/H20 | 0.703667 | 0.338667 | 0.282667 |
| Ratio of Hydrazine/H2O | 0.594667 | 0.433000 | 0.297000 |
On the basis of main effects plot and using the “smaller the better” mode we found that third level out of three levels of the process is an optimum level as it is obvious from the data of Figure 5. These digits are extracted from the below formula:
η = –10 log 10 (∑ y2 /n)
where:
η: is the obtained mean data
n: is the number of data
y: obtained data from the parameters
4.4.3. Signal to Noise Ratio Calculations
The philosophy of signal to noise ratio usage is to perform calculations to check the sensitivity of influencing factors in a process that is supposed to be carried out in a controlled manner. In Taguchi method, the term ‘signal’ denotes to the desirable effect (mean) for the output characteristic and the term ‘noise’ represents the undesirable effect (signal disturbance, S. D) for the output responses which affects the data outcome due to external factors namely noise factors [31]. The S/N ratio can be defined as η = –10 log (MSD), where MSD is mean-square deviation for the output responses.
Figure 3 and Figure 4 demonstrate the S/N ratio data for the parameters available in the activation process and total ash content, respectively. It is worth to say that the results are according the ʺlarger is betterʺ and ʺsmaller is betterʺ modes which is obvious in Figure 6 and Figure 7, respectively.
Table 7.
Signal to noise ratio for IN at the different levels.
| Variables | Level 1 | Level 2 | Level 3 |
| Calcination Temperature (°C) | 52.2657 | 56.9861 | 54.5297 |
| Kiln Rotation Speed (rpm) | 54.7503 | 22.24 | 15.54 |
| Heating Rate (°C/min) | 54.3684 | 54.7058 | 54.3254 |
| Steaming Time (min) | 53.2785 | 57.2757 | 53.2274 |
Table 8.
Signal to noise (S/N) responses for total ash content of impregnated activated carbon.
| Variables | Level 1 | Level 2 | Level 3 |
| Ratio of NH3/H20 | 3.29402 | 9.54958 | 12.5140 |
| Ratio of Hydrazine/H2O | 5.15087 | 8.35993 | 11.8468 |
4.5. Analysis of Variance (ANOVA)
The relative effect of the different parameters of the activation process on the iodine number was obtained by decomposition of variance which is called analysis of variance or ANOVA [32]. The relative importance of the factors with respect to the responses was investigated to determine more accurately the optimum combinations of the activation parameters using ANOVA. The results of ANOVA are presented in a table that displays for each factor as follow:
DOF: degree of freedom which is the number of levels for each factor minus 1.
SS: sum of squared deviations from the mean. For n values of Yi and the mean value Ybar
MS: mean of squares.
MS = SS/DOF
F: F is the ratio between the mean of squares effect and the mean of squares error.
F= MSeffect /MSerror
Statistically, F-test provides a decision at some confidence level whether these estimates are significantly different or not. Larger F-value implies that the variation of the process parameter is significant.
P: P is the probability value which gives the degree of confidence (DOC) at which the parameter is significant. If the P-value be smaller than 0.05, it means that the effect of the parameter on response is significant [23]. The results of ANOVA for the activation data are presented in Table 4. According to ANOVA, the factors which affected the process were such as steaming time and calcination temperature. Percent contribution helped us to understand the relative contribution of each factor on the response. For our carbon activation process, the factors with a high percent contribution (i.e., 50.23% and 39.35%) for steaming time and calcination temperature, respectively had a small variation which consequently resulted in a great influence on the performance. According to this table, the mentioned factors were the main factors which affecting the response whereas heating rate and kiln rotation speed understood to be the second ranking factor which have less influences on the responses.
According to Table 4, the F values of the parameters is greater than tabulated F value for α (risk) = 0.05 (F = 3.29). This implies that the variance of steaming time and calcination temperature is significant compared with the variance of error and then have an outstanding effect on the response. In addition, P-values data extracted are smaller than 0.05 which implies they are the most influential factors to create an optimal condition.
Table 9.
Statistical calculations from ANOVA for the characteristics of the responses.
| Variables | DOF | SS | MS | P | F | Contribution % |
| Calcination Temperature (°C) | 2 | 122.80 | 13.20 | 0.043 | 22.56 | 39.35 |
| Kiln Rotation Speed (rpm) | 2 | 9.56 | 1.65 | 0.714 | 1.76 | 2.82 |
| Heating Rate (°C/min) | 2 | 14.22 | 4.45 | 0.630 | 6.66 | 7.60 |
| Steaming Time (min) | 2 | 158.30 | 19.65 | 0.011 | 37.90 | 50.23 |
| Error | 2 | 0.8845 | 0.3156 | |||
| 10 | 304.88 | 38.95 |
5. Conclusion
This research has presented a direct transfer of the parameters to an industrial scale production.
ACs from bamboo samples were produced and the effect of parameters including heating rate, kiln rotation speed, calcination temperature and steaming time on IN was investigated.
The first part of the results includes the evaluation of the main factors of the overall activation process. The response values summarize the overall contribution of each variable to the Taguchi design. With 95% confidence level for the results it was understood that among the factors influencing the activation process, only two out of four factors had the greatest impact on improving the carbon activation process. On the other hand, heating rate and kiln rotation speed in the range considered for this experiment were the least influential factors involved in the process. In addition, results from the contribution percentage of mentioned factors were also obtained which proves this subject. The second part of the experiment is dedicated to the obtained results from total ash content (%) and concentrations of palladium (ppm) at the different levels of experiment. From these results, it was concluded that when the third level of ammonia and hydrazine ratios is applied we observe much better results in the concentration of palladium and the total ash content than the first level and to some extent the second level.
Table 10.
Lists of used abbreviations in the carbon activation process.
| AC | Activated Carbon | ANOVA | Analysis of Variance |
| IN | Iodine Number | N | Number of Experiments |
| DOF | Degrees of Freedom | DOE | Design of Experiment |
| HR | Heating Rate | KRS | Kiln Rotation Speed |
| CT | Calcination Time | ST | Steaming Time |
References
- Adinata, D. : Daud, W.; Aroua, MK. Preparation and characterization of activated carbon from palm shell by chemical activation with K2CO3. Bioresour Technol 2007, 98, 145–149. [Google Scholar] [CrossRef] [PubMed]
- Ahmed, MJ.; Theydan, SK. Physical and chemical characteristics of activated carbon prepared by pyrolysis of chemically treated date stones and its ability to adsorb organics. Powder Technol 2012, 229, 237–245. [Google Scholar] [CrossRef]
- Altenor S and Carene, B. Adsorption studies of methylene blue and phenol onto vitier roots activated carbon prepared by chemical activation. J Hazard Mater 2009, 165, 1029–1039. [Google Scholar] [CrossRef]
- Angin, D. Production and characterization of activated carbon from sour cherry stones by zinc chloride. Fuel 2014, 115, 804–811. [Google Scholar] [CrossRef]
- Angın, D.; Altintig, E. Influence of process parameters on the surface and chemical properties of activated carbon obtained from biochar by chemical activation. Bioresour Technol 2014, 148, 542–549. [Google Scholar] [CrossRef] [PubMed]
- Al Bahri, M.; Calvo, L.; Gilarranz, MA.; Rodríguez, JJ. Activated carbon from grape seeds upon chemical activation with phosphoric acid. Chem Eng J 2013, 203, 348–356. [Google Scholar] [CrossRef]
- Tseng, RL. , Tseng, S., Wu, FC.; Hu, CC.; Wang, CC. Effects of micropore development on the physicochemical properties of KOH-activated carbons. J Chin Inst Chem Eng 2018, 39, 37–47. [Google Scholar] [CrossRef]
- Gao Y, Yue Q and Gao B, Comparisons of porous, surface chemistry and adsorption properties of carbon derived from Enteromorpha prolifera activated by H4P2O7 and KOH. Chem Eng J 2013, 232, 582–590. [CrossRef]
- Wu, FC.; Tseng, RL.; Hu, CC. Comparisons of pore properties and adsorption performance of KOH-activated and steam-activated carbons. Colloids Surf B 2018, 80, 95–106. [Google Scholar] [CrossRef]
- Tseng, RL.; Tseng, SK. Pore structure and adsorption performance of the KOH-activated carbons prepared from corncob. J Colloid Interface Sci 2005, 2, 428–437. [Google Scholar] [CrossRef]
- Muniandy, L.; Adam, F.; Mohamed, AR. The synthesis and characterization of high purity mixed microporous/mesoporous activated carbon from rice husk using chemical activation with NaOH and KOH. J Colloid Interface Sci 2014, 197, 316–323. [Google Scholar] [CrossRef]
- Ji, Y.; Li, T.; Zhu, L.; Wang, X. ; Lin, Q, Preparation of activated carbons by microwave heating KOH activation. Appl Surf Sci 2007, 2, 506–512. [Google Scholar] [CrossRef]
- Ceyhan, A.; Şahin, O.; Baytar, O.; Saka, C. Surface and porous characterization of activated carbon prepared from pyrolysis of biomass by two-stage procedure at low activation temperature and it’s the adsorption of iodine. J Anal Appl Pyrolysis 2013, 104, 378–383. [Google Scholar] [CrossRef]
- Gao, Y.; Yue, Q.; Gao, B. Comparisons of porous, surface chemistry and adsorption properties of carbon derived from Enteromorpha prolifera activated by H4P2O7 and KOH. Chem Eng J 2013, 232, 582–590. [Google Scholar] [CrossRef]
- Liu, J.; Choe, J.; Sasnow, Z.; Werth Strathmann, T. Application of a Re–Pd bimetallic catalyst for treatment of perchlorate in waste ion-exchange regenerant brine. Water Res.
- Perez, AM.; Soares, L.; Rodriguez, JJ.; Gilarranz, MA.; Pereira, MFR. Catalytic reduction of bromate over catalysts based on Pd nanoparticles synthesized via water-in-oil microemulsion. Appl Catal B Environ 2018, 237, 206–213. [Google Scholar] [CrossRef]
- Sangeetha, S.; Ranjithkumar, V.; Rajendran, S. ; Synthesis, structure and thermal behavior of hydrazine-coordinated copper pyromellitate polymeric complex and dihydrazinium pyromellitate. J. Therm. Anal. Calorim 2016, 124, 1601–1608. [Google Scholar] [CrossRef]
- E. H.P. Bai, S. Vairam, Spectral and thermal studies of transition metal complexes of Acetamido Benzoic Acids with hydrazine. Asian J. Chem. 2013, 25, 209–217. [Google Scholar] [CrossRef]
- Johnson, AL.; Hollingsworth, A.; Kingsley, A. New organocadmium hydrazine adducts and hydrazide complexes. Eur. J. Inorg. Chem 2012, 12, 246–250. [Google Scholar] [CrossRef]
- B, Raju. ; Sivasankar, BN. Spectral, thermal and X-ray studies on some new Bis-hydrazine lanthanide(III) glyoxylates. J. Therm. Anal. Calorim 2008, 94, 289–296. [Google Scholar] [CrossRef]
- Ereeman, E. , Sieminiewska, T., Marsh, H.; Rand, B. Carbon 1970, 8, 7–17. [Google Scholar]
- Kaneko, K.; Nakahigashi, Y.; Nagata, K. Carbon 1988, 26, 327–332. 26.
- Kaneko K and Kakei K, J Colloid Int Sci 1989, 129, 583–587. 129.
- Nelson, W. ; Iodine number analysis and preparation of activated carbon from acorn shell by chemical activation with ZnCl2. J Anal Appl Pyrolysis 2012, 95, 21–24. [Google Scholar]
- Suresh, V. Predictive Analysis in Six Sigma Using Statistical Software Minitab. J Emerg Comput Sci 2020, 7, 676–771. [Google Scholar]
- Hieftje, G. Effect of the plasma operating frequency on the figures of merit of an inductively coupled plasma time-of-flight mass spectrometer. J Anal At Spectrom 2016, 21, 160–167. [Google Scholar]
- Singh, B.; Kumar, P. Optimizing cutting force for turned parts by Taguchi’s parameter design approach. Indian J Eng Mater 2005, 12, 97–103. [Google Scholar]
- Liao, HC.; Chen, Y K. ; Optimizing multi-response problem in the Taguchi method by DEA based ranking method. J Qual Reli Manage 2002, 2002 19, 825–837. [Google Scholar] [CrossRef]
- Erzurumlu, T.; Ozcelik, B. Minimization of warpage and sink index in injection-molded thermoplastic parts using Taguchi optimization method. Mater Des 2007, 27, 853–861. [Google Scholar] [CrossRef]
- García-Reyes, RB.; Garcia-Leon, AM.; Garza-González, MT. Determining optimal conditions to produce activated carbon from barley husks using single or dual optimization. J Environ Manage 2013, 125, 117–125. [Google Scholar]
- Altan, M. Reducing shrinkage in injection moldings via the Taguchi, ANOVA and neural network methods. Mater Des 2010, 31, 599–604. [Google Scholar] [CrossRef]
Figure 1.
Experimental set up of physical activation process.
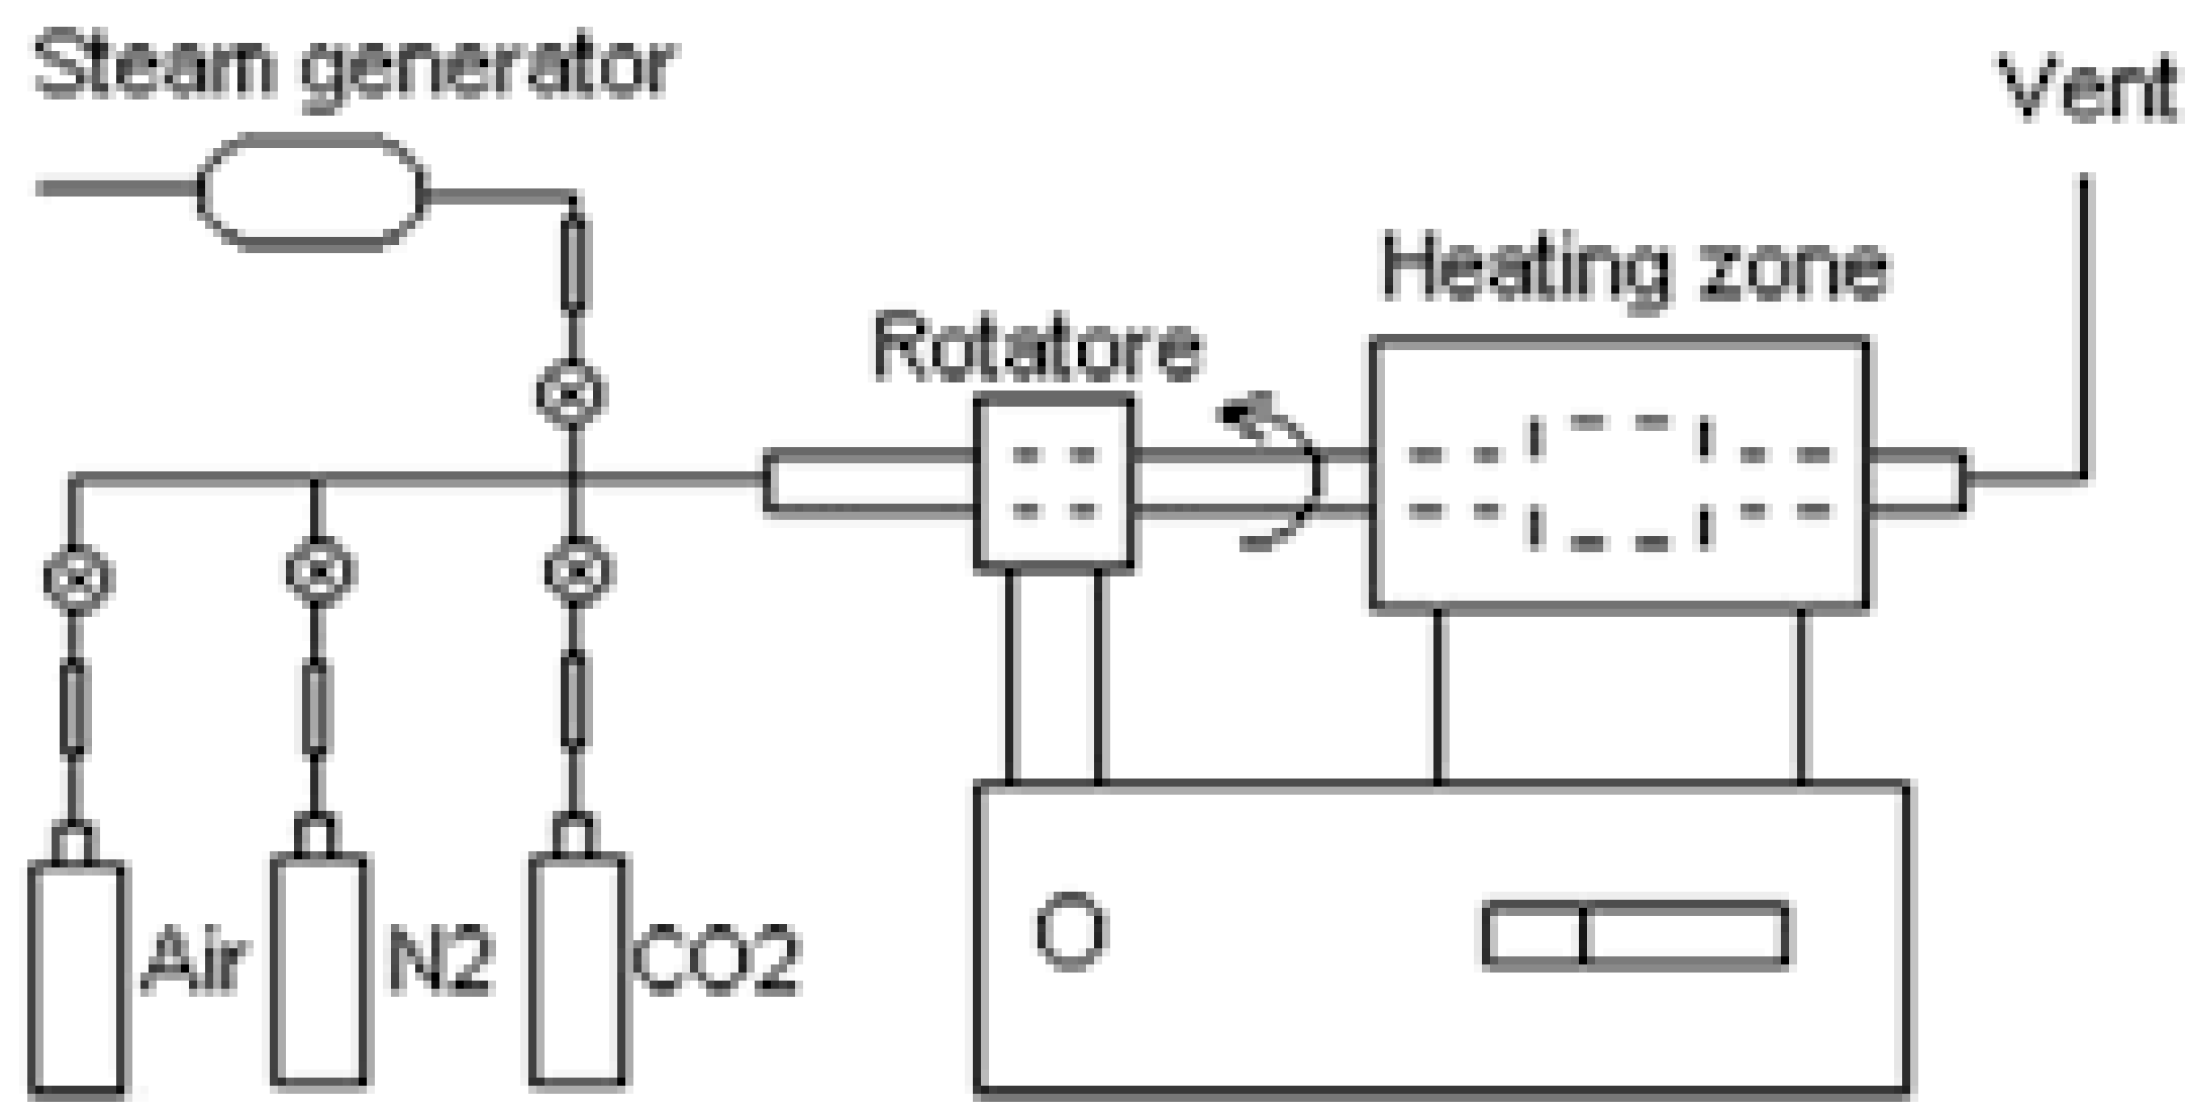
Figure 2.
A comparison between two ratios in three levels vs. the responses which is listed as: (a) illustration of hydrazine/H2O ratio vs. total ash content; (b) another illustration of NH3/H2O ratio vs. concentration of Pd in the solution.
Figure 2.
A comparison between two ratios in three levels vs. the responses which is listed as: (a) illustration of hydrazine/H2O ratio vs. total ash content; (b) another illustration of NH3/H2O ratio vs. concentration of Pd in the solution.
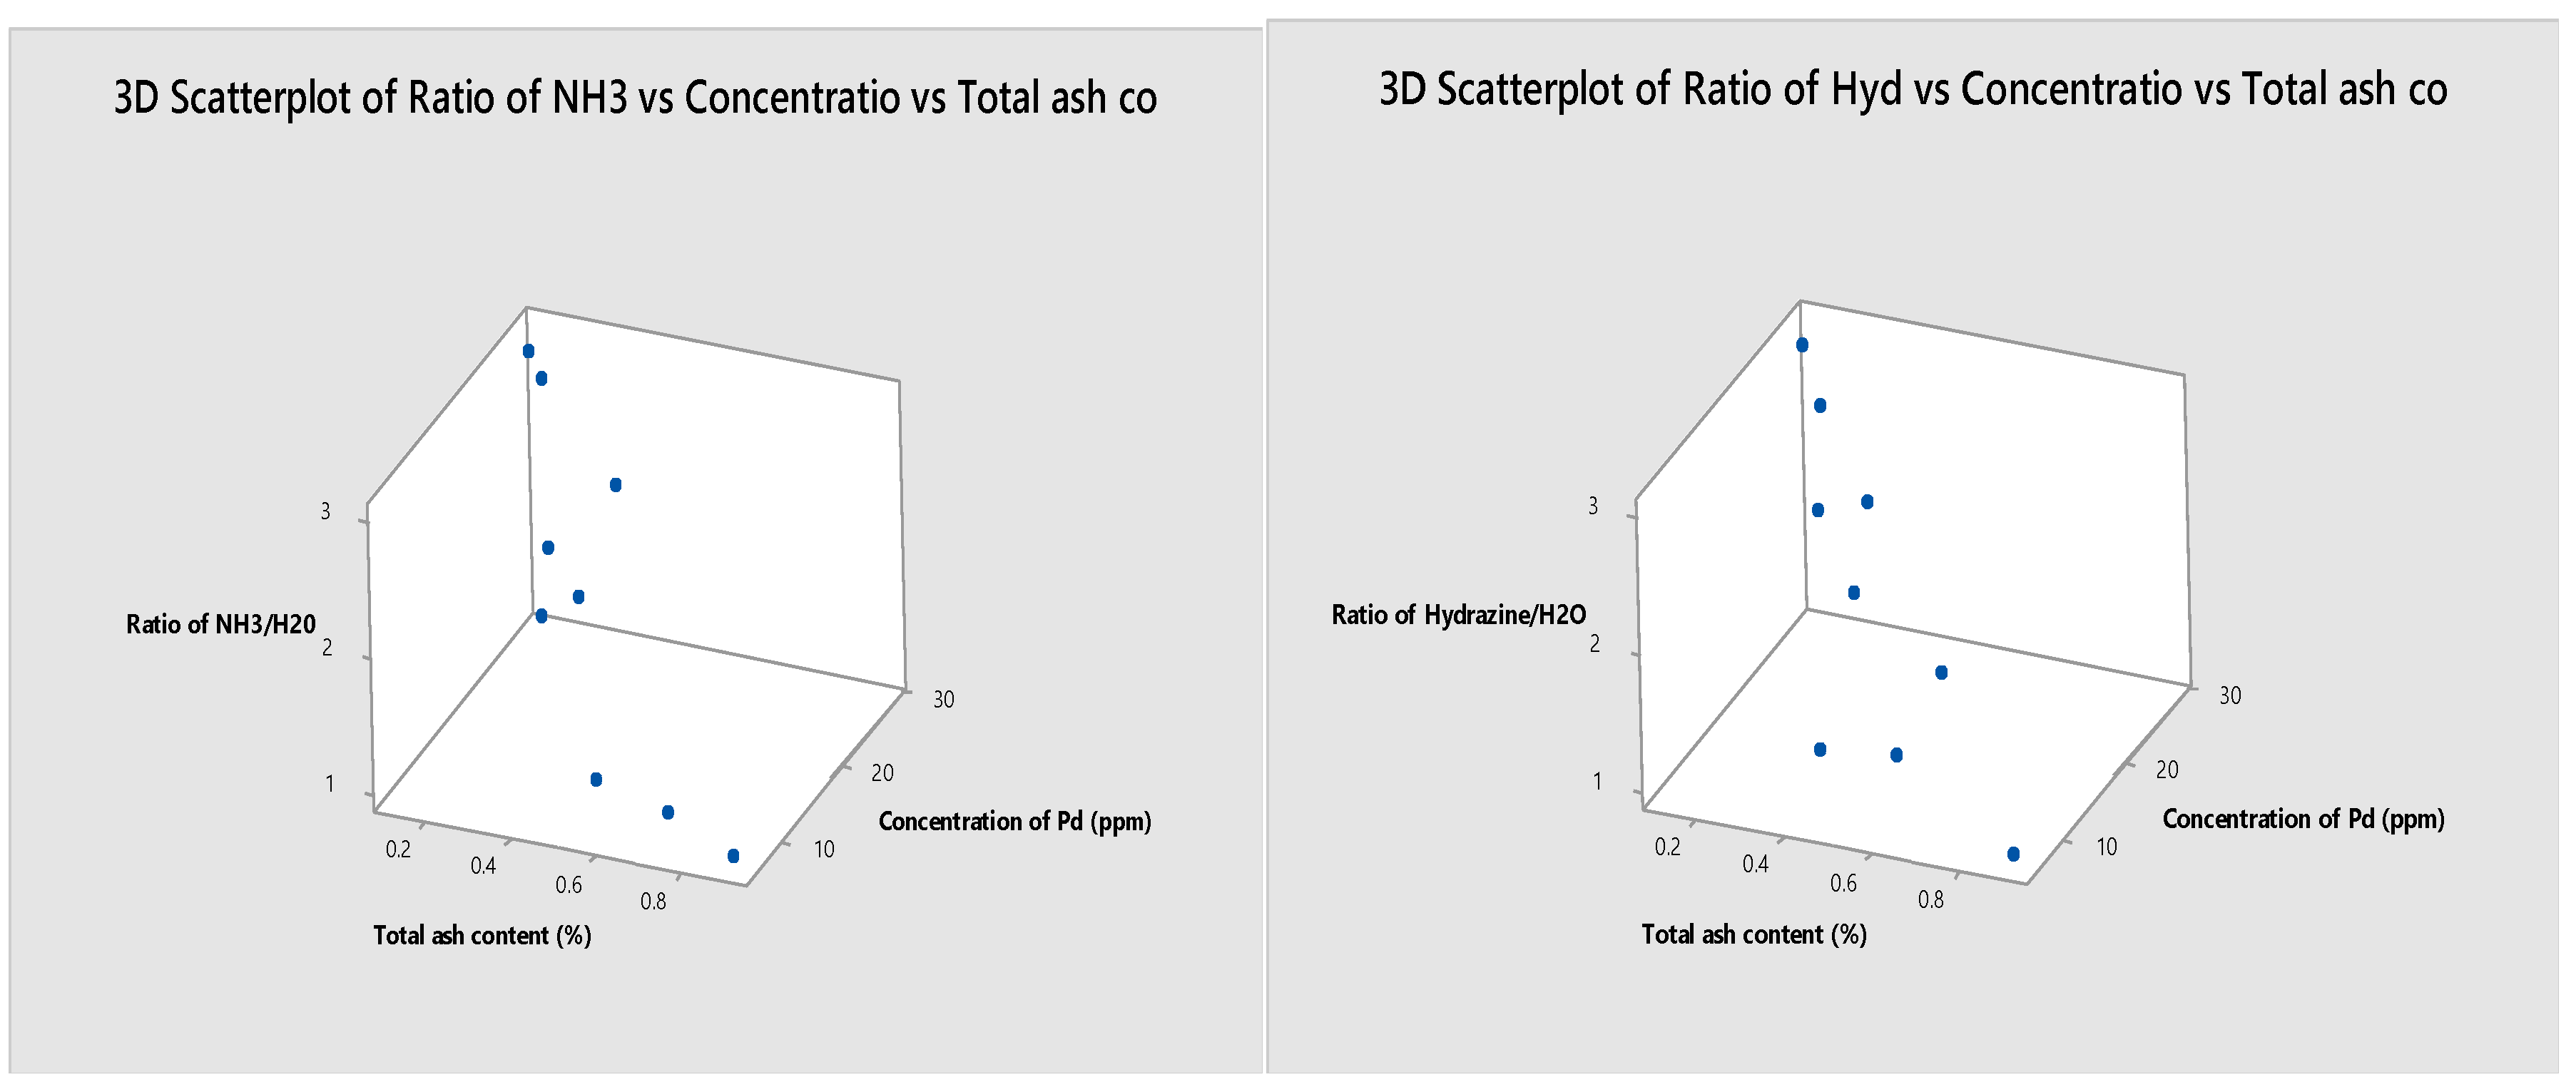
Figure 4.
Main effect plot for mean data of iodine number.
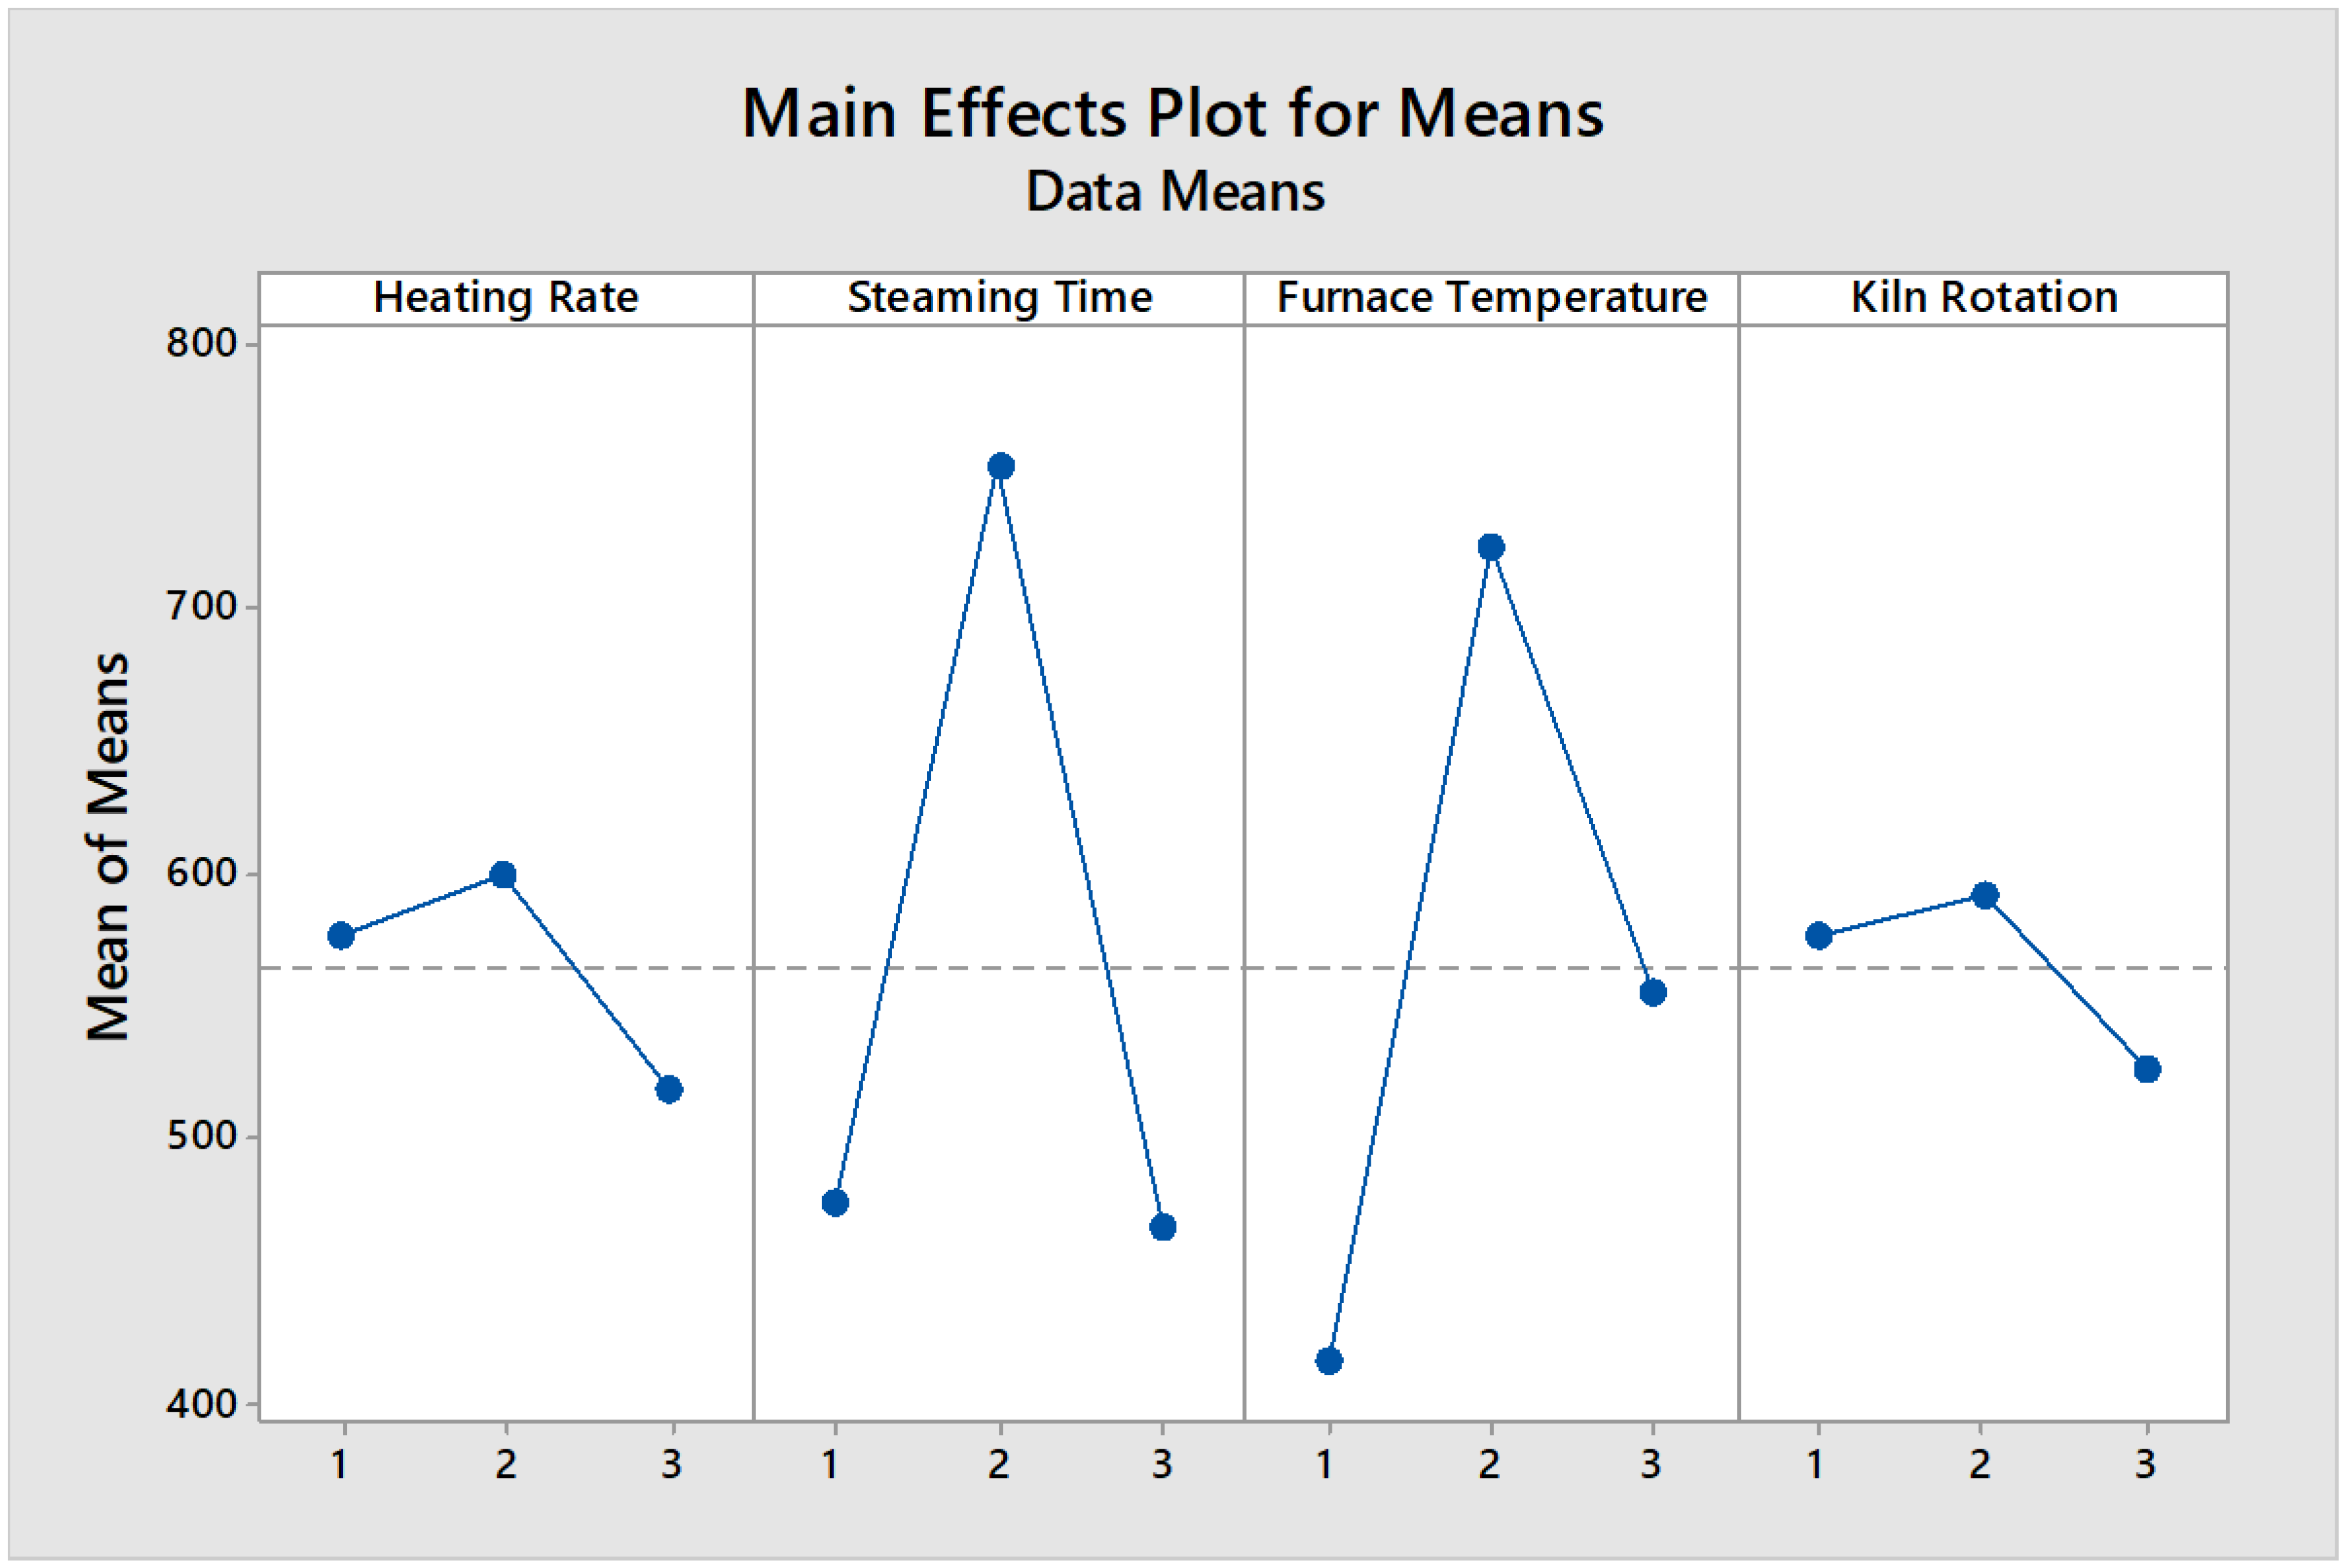
Figure 5.
Main effect plot for mean data from total ash content.
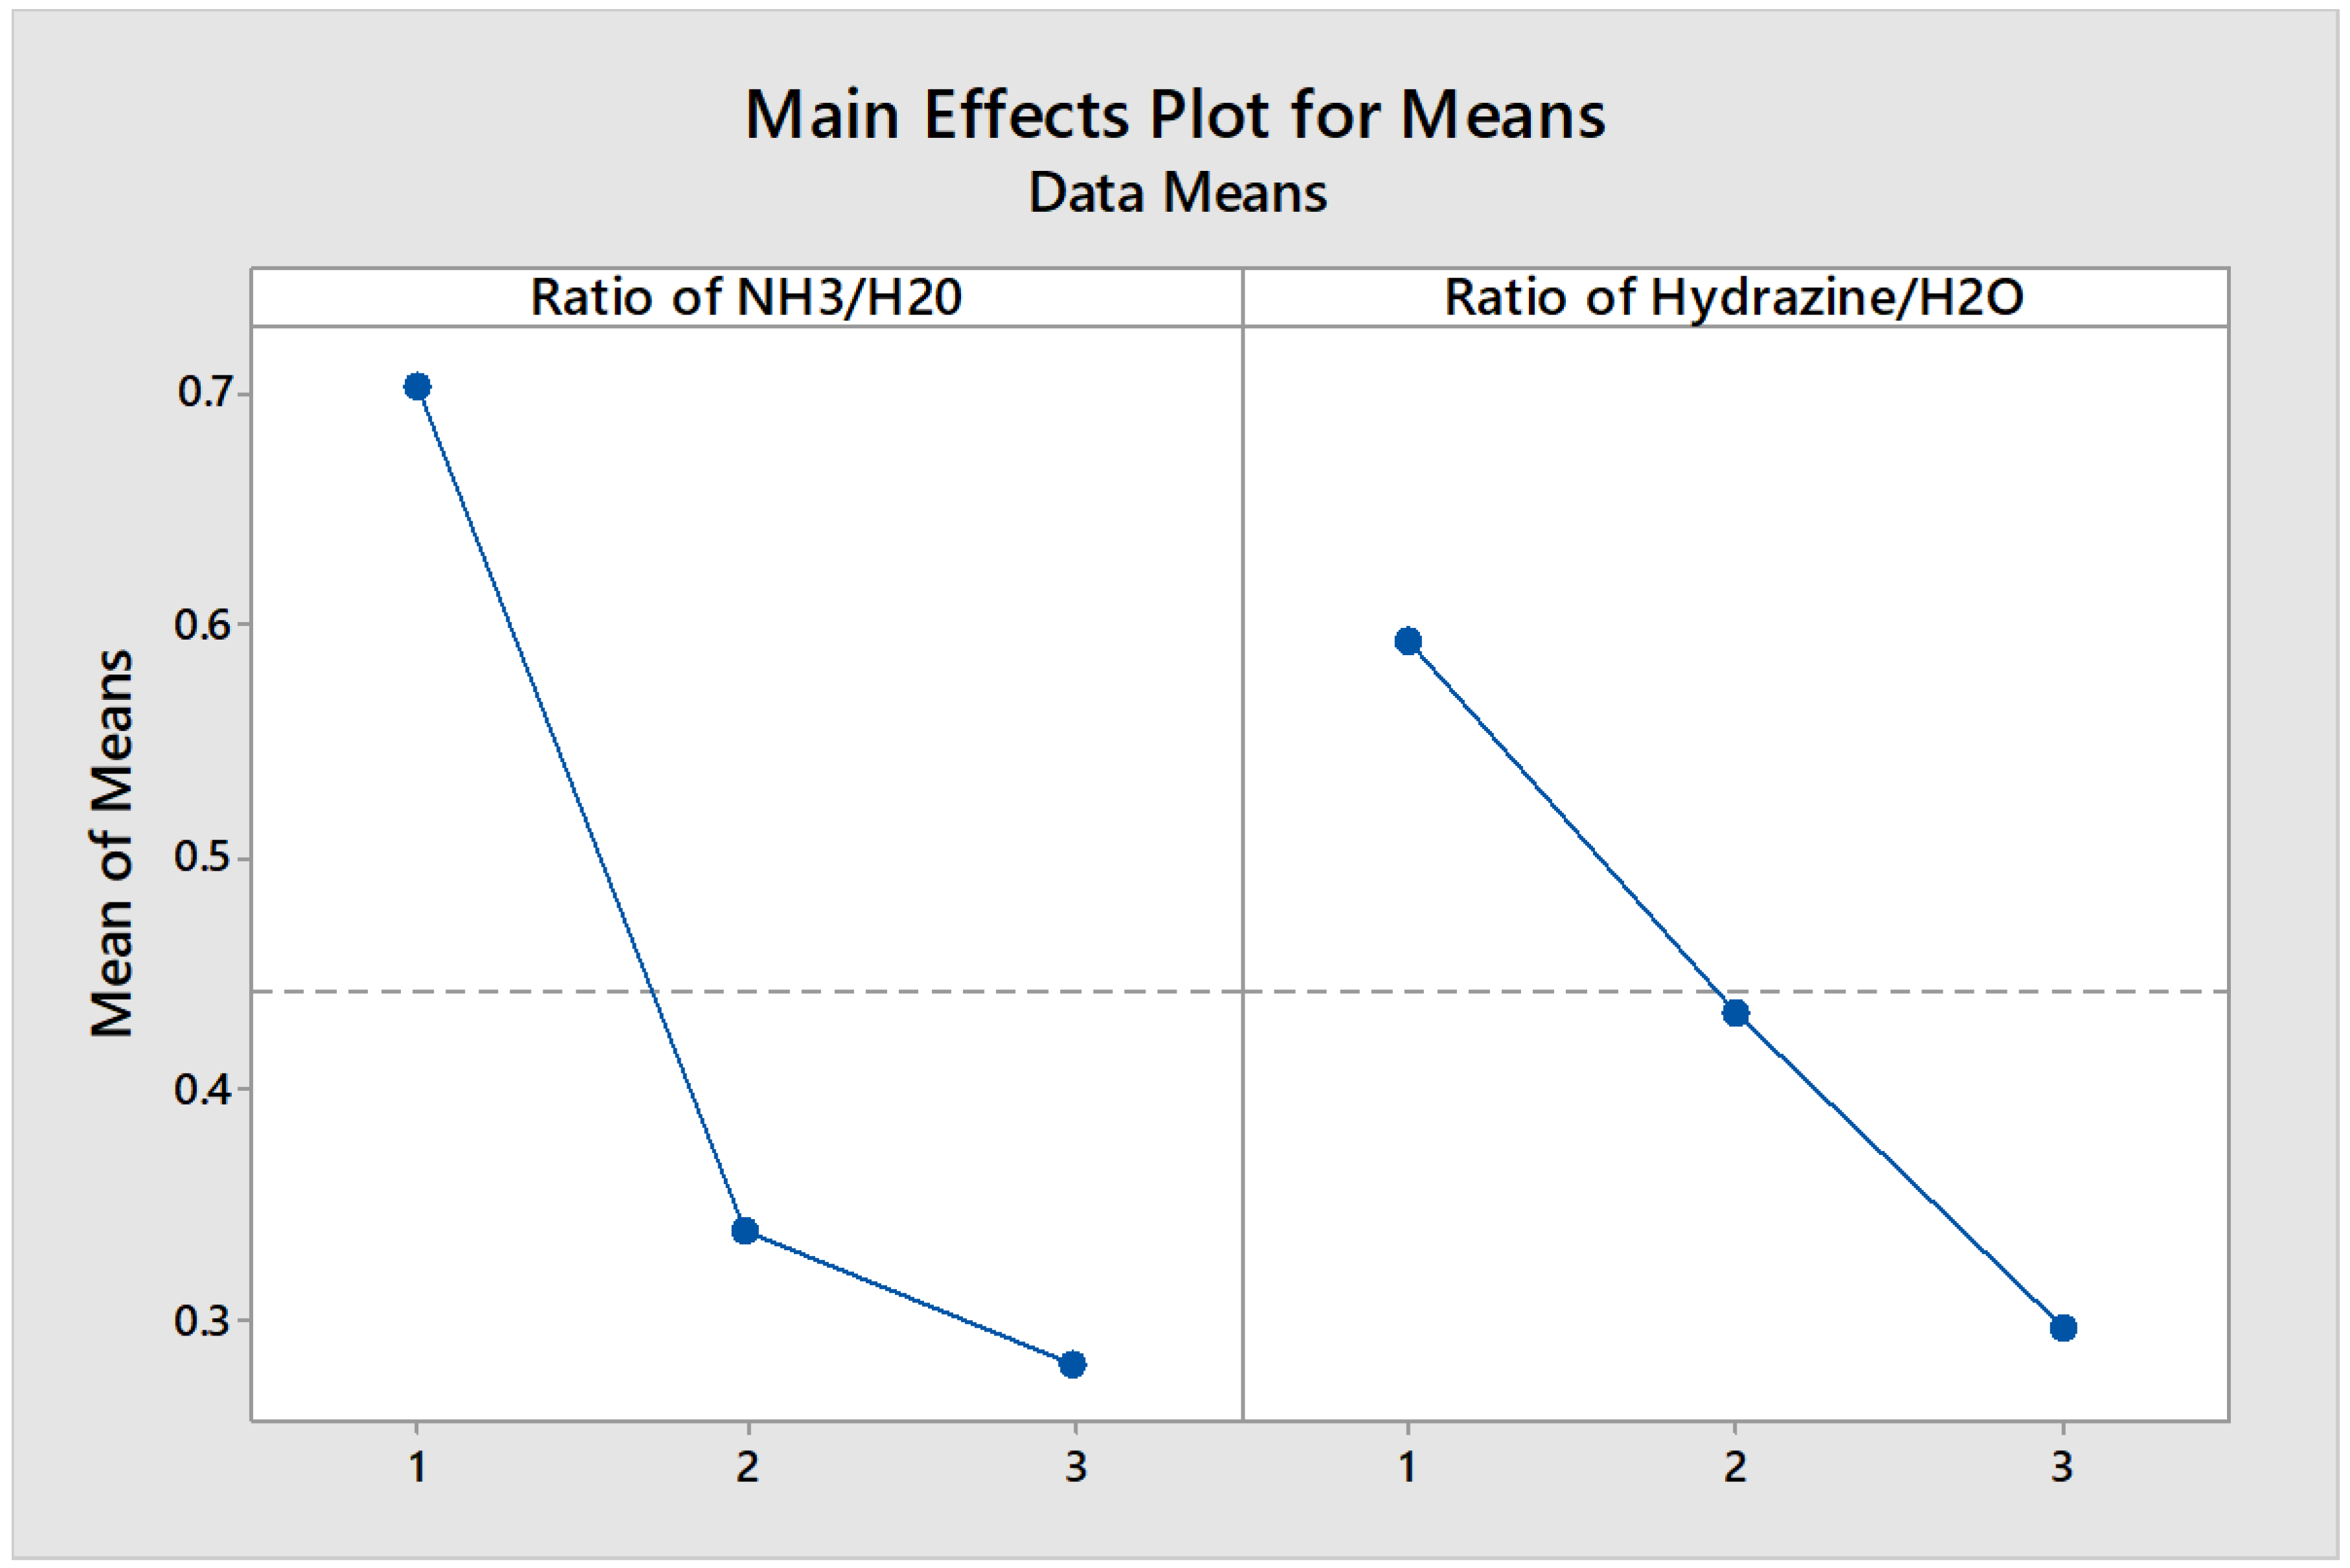
Figure 6.
Main effect plot for signal to noise ratio responses.
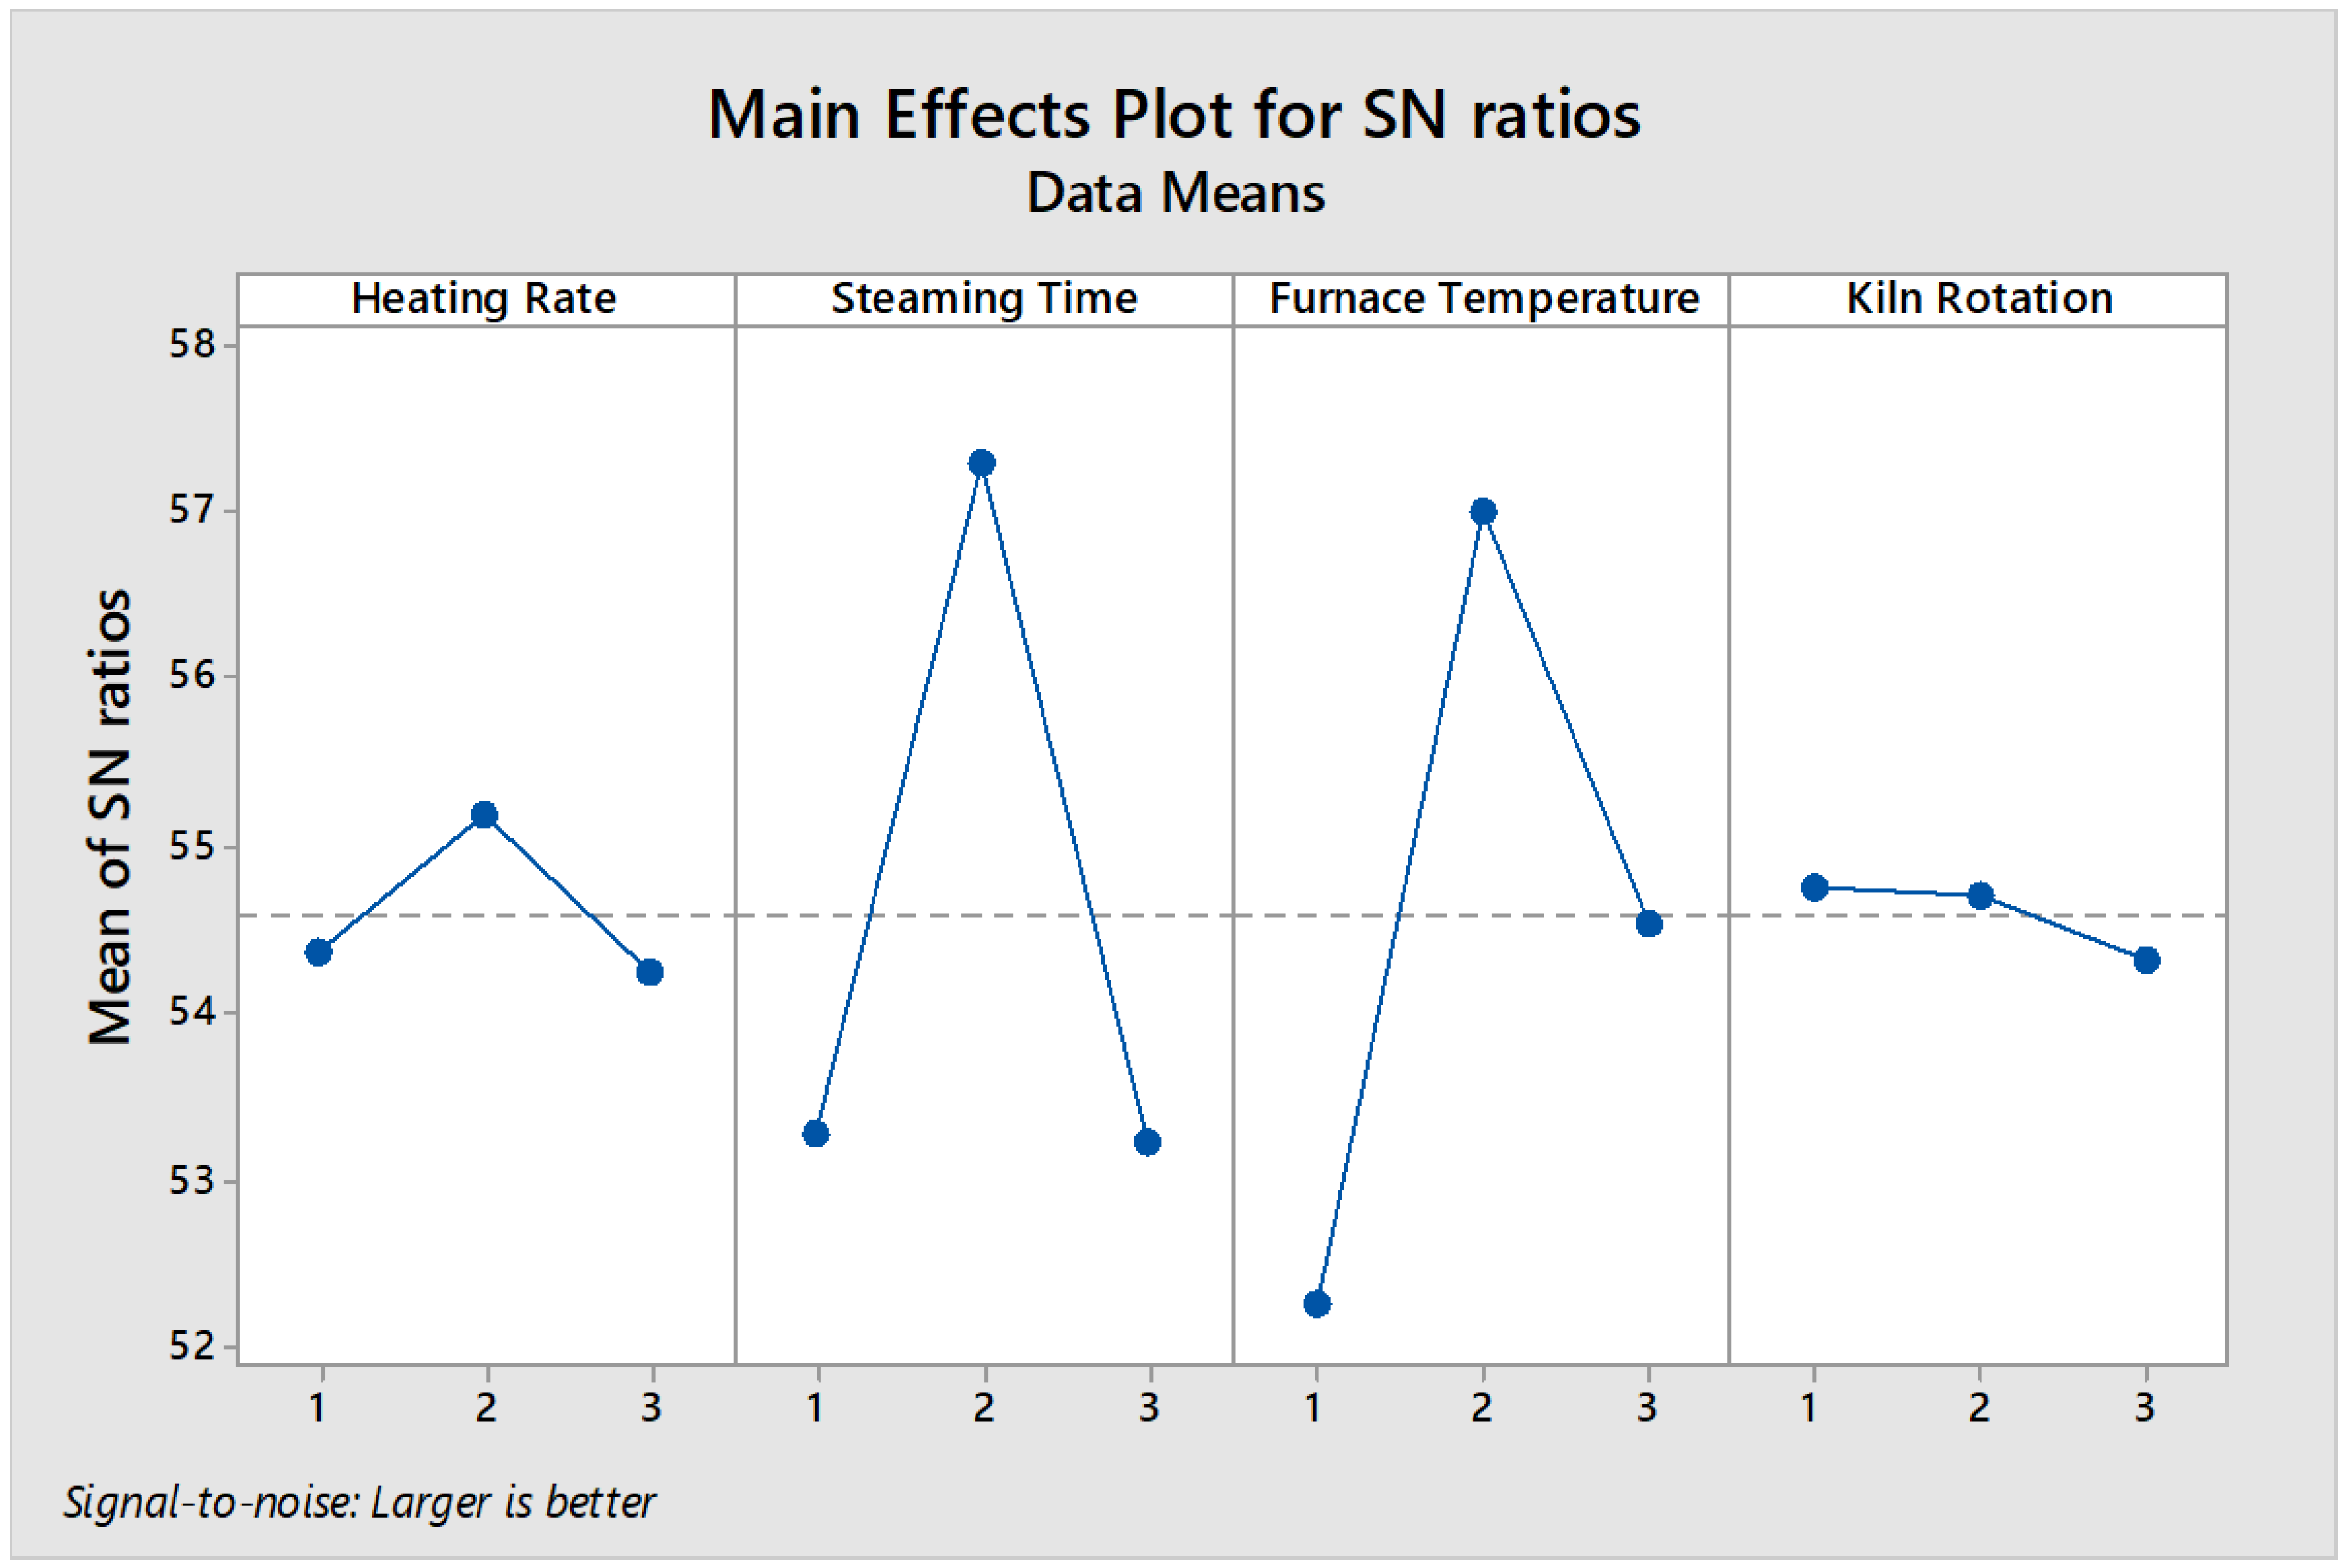
Figure 7.
Main effect plot for signal to noise ratio (S/N) for total ash content.
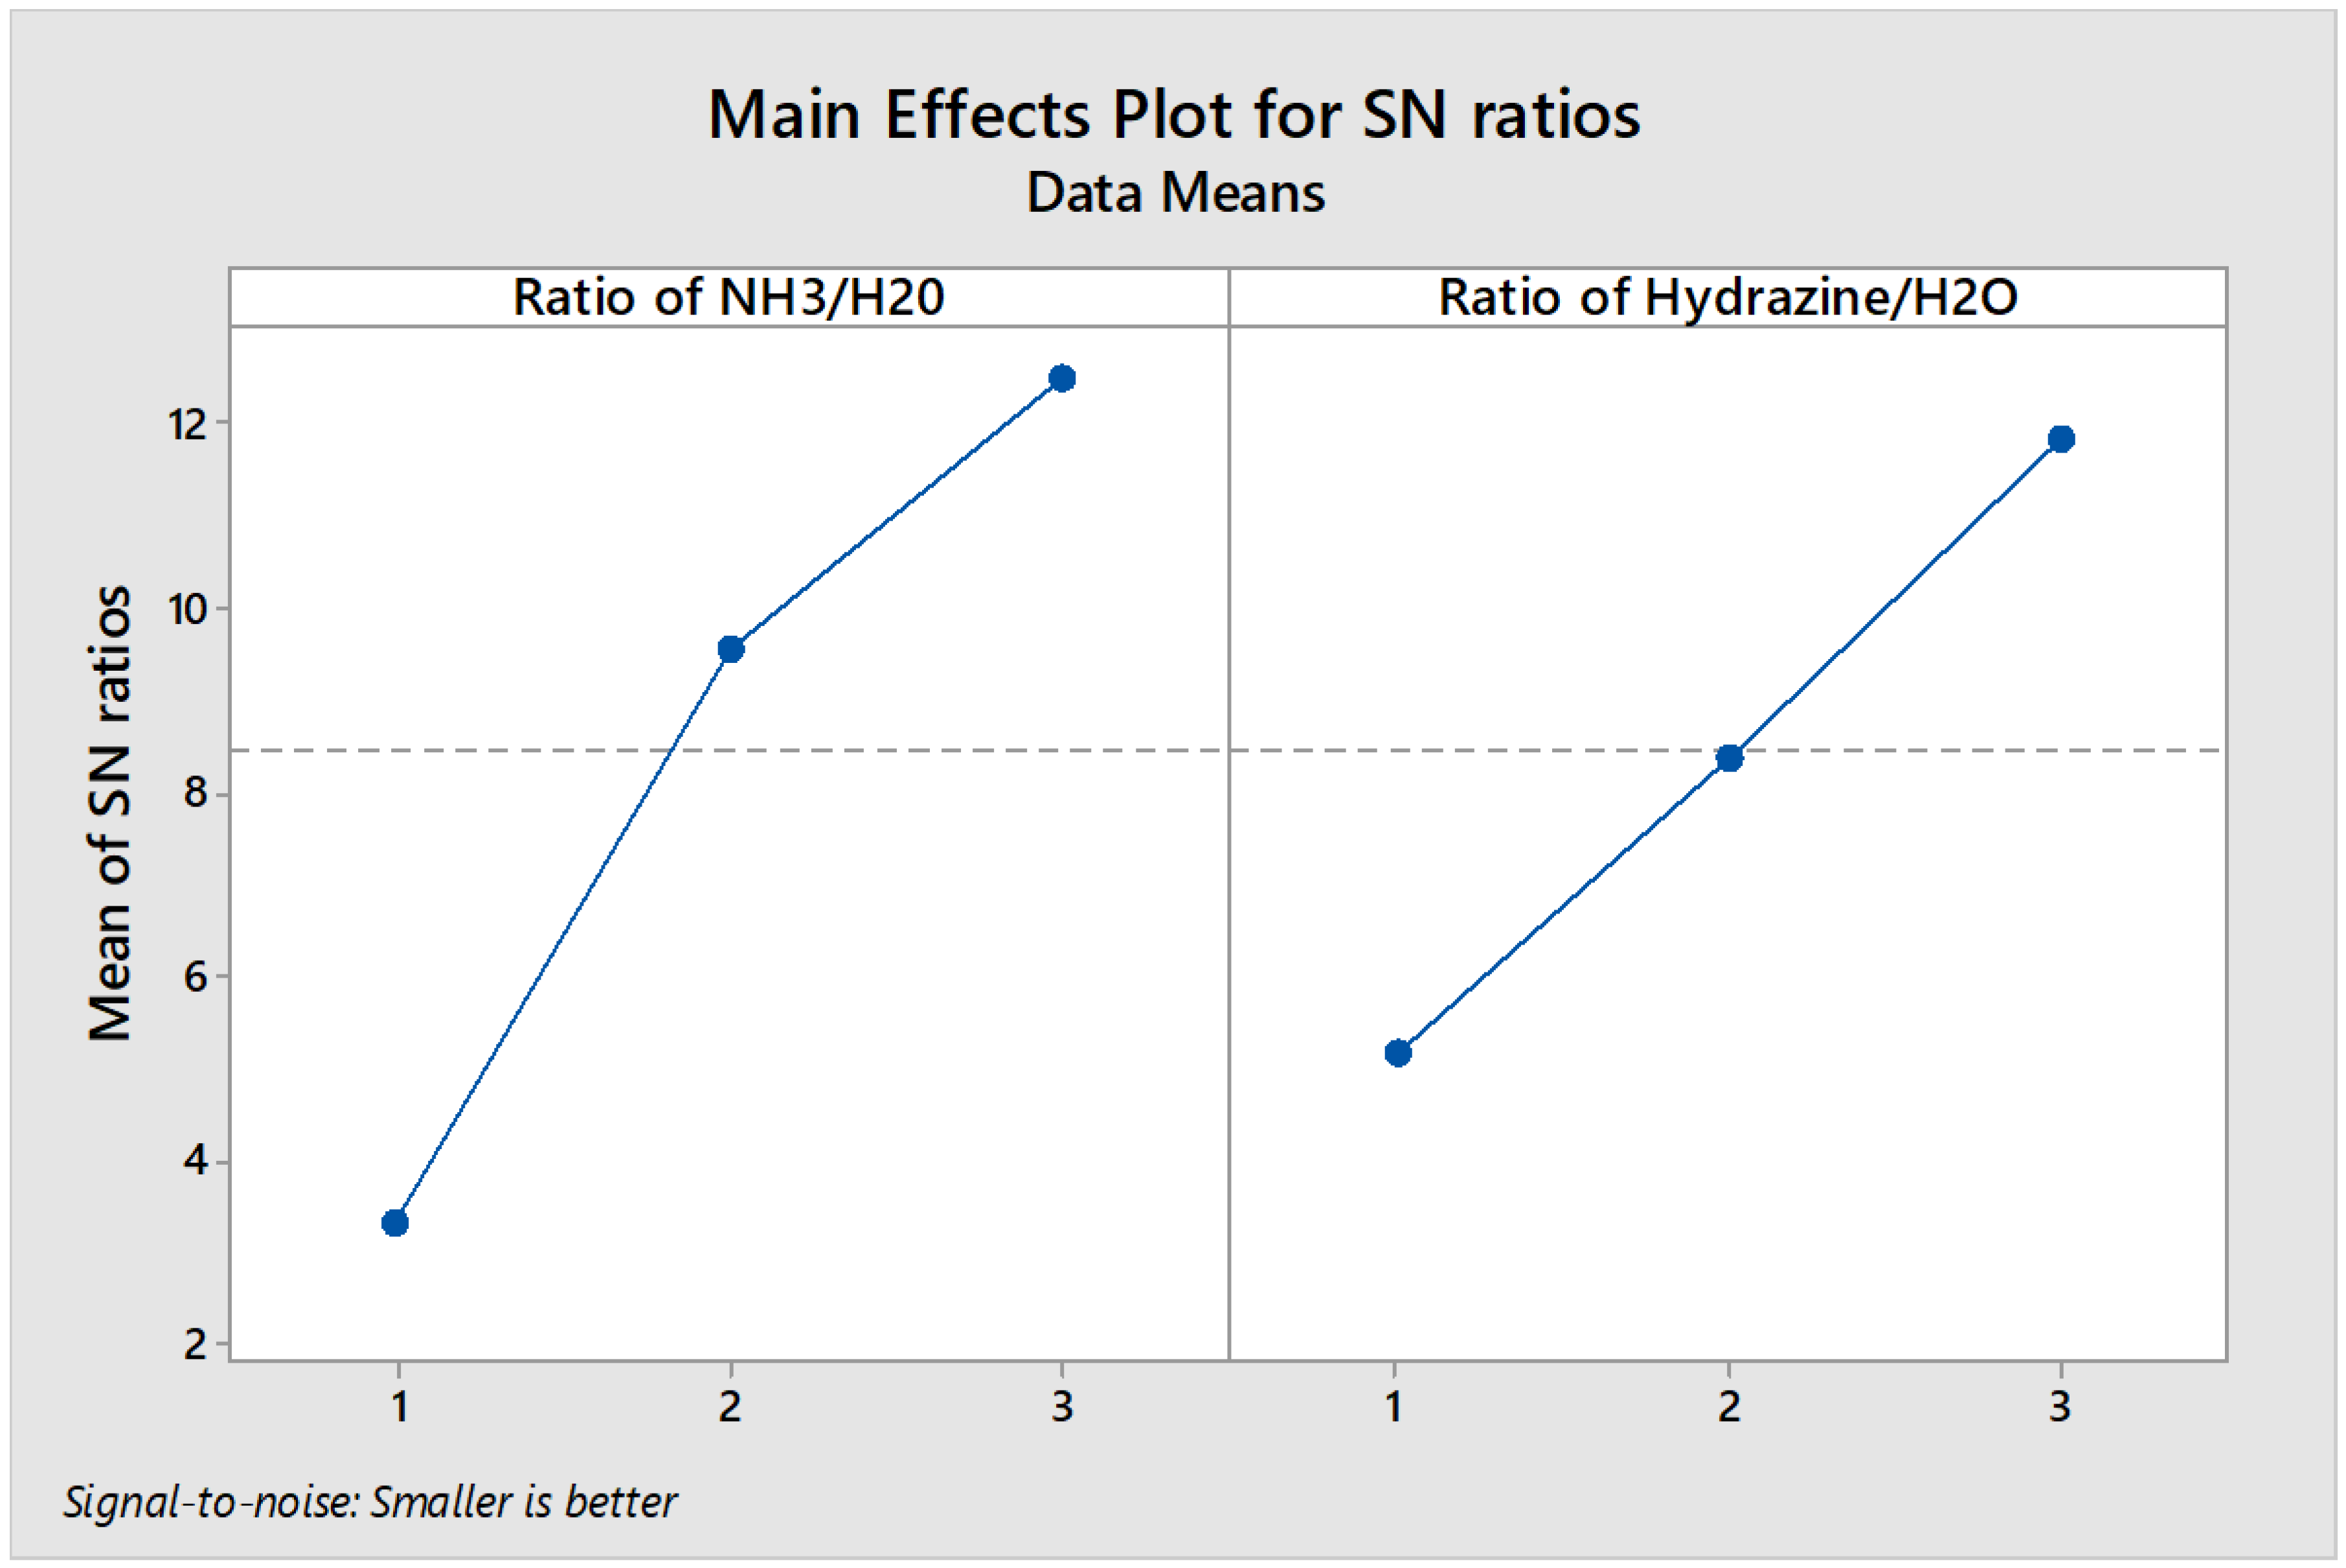
Table 1.
Coding of factors and levels of test method.
| Variables | Level 1 | Level 2 | Level 3 |
| Ratio of NH3/H20 | 1:1 | 1:5 | 1:10 |
| Ratio of Hydrazine/H2O | 1:5 | 1:10 | 1:20 |
Table 2.
The results from the various ratios on the responses.
| Run | NH3/H20 | Hydrazine/H2O | Total ash Content | Concentration of Pd (ppm) |
| 1 | 1 | 1 | 0.905 | 5.5258 |
| 2 | 1 | 2 | 0.700 | 9.0579 |
| 3 | 1 | 3 | 0.506 | 11.0698 |
| 4 | 2 | 1 | 0.358 | 13.0241 |
| 5 | 2 | 2 | 0.400 | 16.0258 |
| 6 | 2 | 3 | 0.258 | 21.0125 |
| 7 | 3 | 1 | 0.521 | 14.0589 |
| 8 | 3 | 2 | 0.199 | 24.4580 |
| 9 | 3 | 3 | 0.128 | 27.4450 |
Table 3.
Coding of factors and levels of orthogonal test.
| Variables | Level 1 | Level 2 | Level 3 |
| Calcination Temperature (°C) | 300 | 700 | 950 |
| Kiln Rotation Speed (rpm) | 3 | 8 | 12 |
| Heating Rate (°C/min) | 5 | 10 | 18 |
| Steaming Time (min) | 30 | 55 | 90 |
Table 4.
Matrix array for variables involved in the activation process.
| Run | HR (°C/min) | ST (min) | CT (°C) | KRS (rpm) | IN(mg/g) |
| 1 | 1 | 1 | 1 | 350 | 350 |
| 2 | 2 | 2 | 2 | 950 | 950 |
| 3 | 3 | 3 | 3 | 430 | 430 |
| 4 | 1 | 2 | 3 | 630 | 630 |
| 5 | 2 | 3 | 1 | 790 | 790 |
| 6 | 3 | 1 | 2 | 380 | 380 |
| 7 | 1 | 3 | 2 | 445 | 445 |
| 8 | 2 | 1 | 3 | 520 | 520 |
| 9 | 3 | 2 | 1 | 590 | 590 |
Disclaimer/Publisher’s Note: The statements, opinions and data contained in all publications are solely those of the individual author(s) and contributor(s) and not of MDPI and/or the editor(s). MDPI and/or the editor(s) disclaim responsibility for any injury to people or property resulting from any ideas, methods, instructions or products referred to in the content. |
© 2024 by the authors. Licensee MDPI, Basel, Switzerland. This article is an open access article distributed under the terms and conditions of the Creative Commons Attribution (CC BY) license (https://creativecommons.org/licenses/by/4.0/).
Copyright: This open access article is published under a Creative Commons CC BY 4.0 license, which permit the free download, distribution, and reuse, provided that the author and preprint are cited in any reuse.


