Submitted:
05 July 2024
Posted:
08 July 2024
You are already at the latest version
Abstract
We estimate general public’s willingness to pay (WTP) for agricultural soil quality protection and improvement in Spain (n=1000) and the UK (n=984) using data from a cross-sectional survey via Qualtrics panels in March-April 2021. We use a double bound dichotomous choice contingent valuation approach to elicit the individuals’ WTP. We investigate the effect of uncertainty on the success of policies aiming at achieving soil protection. In addition, to understand the heterogeneity in individuals’ WTP for agricultural soil quality protection and improvement we model individuals’ WTP through individual’s awareness and attitudes toward agricultural soil quality protection and the environment, trust in institutions; risk and time preferences; pro-social behavior and socio-demographics in Spain and the UK. We found that there is significant public support for agricultural soil quality protection and improvement in Spain and the UK. We also found that the support does not vary significantly under uncertainty of success of policies aiming at achieving soil protection. However the individual’s reasons for supporting agricultural soil quality protection and improvement are found to depend on the level of uncertainty and country. Hence, promoting public support for soil protection needs to be tailored according to the level of general public’s perceived uncertainty and geographic location.
Keywords:
soil quality
; willingness to pay
; contingent valuation
; sustainable land management
; uncertainty
; risk preferences
; time preferences
1. Introduction
The soil system provides different types of ecosystem services such as provisioning ecosystem services (e.g. a medium to provide food, natural water reservoir to provide clean water, habitat provision); regulating ecosystem services offering resilience to climate change and extreme weather events, droughts and floods (e.g. climate regulation through carbon storage, nutrient cycling); and cultural services (e.g. supporting culture, traditions and practices linked to agriculture and landscapes) [1]. Consequently, soil management is key to build up resilience to ensure sustainable agricultural systems and the environment through soil quality protection and improvement [2].
Currently about 60 to 70% of soils in the EU are in an unhealthy state [3]. The costs of soil degradation in the EU has been estimated that may exceed EUR 50 billion annually [3] based on a previous estimate of EUR 38 billion annually for 25 EU countries that did not include costs from biodiversity decline, sealing or compaction [4]. For the UK soil degradation has been estimated to cost £1.2 billion annually [5]. The past European Union’s (EU) Common Agricultural Policy (CAP) based on price support in combination with technological change led to agriculture intensification, specialization and concentration of production with subsequent environmental impacts including habitat loss and decline in wildlife and biodiversity [6,7,8,9] and possibly detrimental soil quality and yields (e.g. shorter rotations, traffic-induced soil compaction [10,11,12]) .
The EU CAP has reacted to these environmental impacts and the constraints to agricultural support set up in the 1994 WTO’s Uruguay Round Agreement in agriculture [13]. Thus, in 1998, voluntary set-aside was introduced to reduce crop overproduction and deliver environmental benefits, following the 1992 MacSharry reform made set-aside compulsory and the CAP’s Agenda 2000, which allowed Member States (MS) to apply cross-compliance. Under Regulation (EEC) 2078/92 MS were allowed to provide support to farmers for making environmental improvements to their land by changing farming practices [14]. The Fisher reform in 2003 meant that agricultural policies moved from price support to area based payments and payments for the supply of environmental goods (e.g. agri-environmental schemes).
More specifically on soil, the EU has developed an EU soil strategy which has medium and long-term objectives by 2030 and 2050, respectively. The EU soil strategy’s medium term objectives include: a) combat desertification, restore degraded land and soil, including land affected by desertification, drought and floods, and strive to achieve a land degradation-neutral world (Sustainable Development Goal 15.3); b) restore significant areas of degraded and carbon-rich ecosystems, including soils c) achieve an EU net greenhouse gas removal of 310 million tones CO2 equivalent per year for the land use, land use change and forestry (LULUCF) sector; d) reach good ecological and chemical status in surface waters and good chemical and quantitative status in groundwater by 2027; e) reduce nutrient losses by at least 50%, the overall use and risk of chemical pesticides by 50% and the use of more hazardous pesticides by 50% by 2030; f) significant progress has been made in the remediation of contaminated sites. As for the long term objectives these are: a) reach no net land take; b) soil pollution should be reduced to levels no longer considered harmful to human health and natural ecosystems and respect the boundaries our planet can cope with, thus creating a toxic-free environment; c) achieve a climate-neutral Europe and, as the first step, aim to achieve land-based climate neutrality in the EU by 2035; d) achieve for EU a climate-resilient society, fully adapted to the unavoidable impacts of climate change by 2050. Also, aiming that by 2030, at least 75% of soils in each EU Member State are healthy, or show a significant improvement towards meeting accepted thresholds of indicators, to support ecosystem services [3]. Consequently, the EU has been incorporating specific policy measures to target agricultural soils at regional and national levels [15]. The CAP has set out soil protection policies via its soil thematic strategy, which includes a proposal for a Directive on soil monitoring and resilience (soil monitoring law)[16].
Regarding the UK, the 2016 Brexit vote and UK decision to leave the EU meant that the UK could decide on a new agricultural policy, which is currently under development with farm support in the UK changing. The Agriculture Act 2020 provided a framework for the UK government to create its own agricultural policy. However, agriculture is a devolved policy area, which means that each administration (England, Scotland, Wales and Northern Ireland) can shape their own agricultural policies. This offers opportunities to develop policies closer to stakeholders that consider particular environmental, socio-demographic and geographical characteristics. It also faces challenges such as effective coordination whenever needed. To ensure an effective coordination the UK government and the devolved administrations agreed to establish the UK agricultural support framework to learn from each other and coordinate policies when needed. Soil management and improved soil quality can be targeted through the Environmental Land Management Scheme (ELMS) and its sustainable farming incentive [17].
These policies in the EU and the UK require investment in soil quality protection and improvement. The funding allocated to the CAP for the 2021-2027 period is EUR 387 billion, which is split into the European agriculture guarantee fund (EAGF), EUR 291.1 billion, and the European agricultural fund for rural development (EAFRD), EUR 95.5 billion. The CAP strategic plans devote EUR 98 billion (EUR 14 billion per year) to deliver specific environmental benefits for climate, water, soil, air, biodiversity and animal welfare and to encourage practices that go beyond the conditionality [18]. However, there is no estimate of CAP spending on soil quality protection and improvement apart from an estimate CAP financing for sustainable soils and manure management to be approximately EUR85 billion over 2014-2020 (EUR 12 billion per year) [19], which seems an overestimate considering the CAP strategic plans figure.
Regarding the UK budget, the agriculture transition plan 2021-2024 states the spending plans across environmental and animal welfare outcomes, improving farm prosperity and direct payments, which amounts to an average of £2.4 billion a year [17]. However, there are uncertainties on the effectiveness of policy measures and agricultural practices to be applied to protect and improve soil quality (e.g. uncertainties around the effectiveness of measures to improve soil carbon sequestration [20]). These uncertainties may play a role in public’s support for public policies that support soil quality.
This study contributes to the scarce literature on general public’ valuation of agricultural soil quality protection and improvement by a) evaluating the public support for agriculture soil quality protection and improvement policies, b) gaining understanding on what motivates general public’s support for agricultural soil protection and improvement. In addition, it contributes to the literature that incorporates uncertainty into the economic valuation of agricultural policies by providing monetary valuation of policies under relatively less and more certain scenarios. To the best of our knowledge this is the first paper to provide an economic valuation of agricultural soil quality protection and improvement in the UK and Spain and one of the scarce papers estimating the soil’s economic value and how general population values soil functions and their support for public policy action [21,22,23,24]. Previous literature on willingness to pay (WTP) for soil security has provided WTP estimates for Italian and Australian citizens indicating there is public support for these. The average public’s WTP for soil security in the Veneto region in Italy and New South Wales in Australia were estimated to be $244 and $567, respectively by using a choice experiment approach [21]. Other stated preference valuation studies of soils [20,25,26,27,28] provide useful information for setting specific agri-environmental schemes contributing to manage soil in a sustainable way. However, as pointed out by Bartowski et al. [29] they are narrow in terms of the soil-based ecosystem services covered (soil erosion, carbon sequestration).
2. Materials and Methods
2.1. Data Collection: Survey
A cross-sectional survey instrument was designed and administered to a panel using Qualtrics. Qualtrics distributed the survey to a panel collecting a total of 882 and 910 valid responses from UK and Spain, respectively in March-April 2021. Quota restrictions were imposed on age and gender. We divided survey participants into two groups per country: Group 1 UK (n=449); Group 2 UK (n=433); Group 1 Spain (n=462); Group 2 Spain (n=448).
Both groups in each country were presented with the same background information except that those in group 2 in each country had an extra text on their background information, which introduced uncertainty and ambiguity on the environmental scheme presented to improve soil quality. This was based on the fact that it is difficult to see what farmers would decide to do (e.g. number and type of soil management practices that will be conducted at each farm; the number, distribution and location of farms which would join the environmental land management scheme to implement these soil improving measures) [2].
2.2. Data Collection: Questionnaire
The survey questionnaire comprised a total of 10 sections including background information, WTP questions, protest views, soil quality attitudes, trust, risk attitudes, time preference, uncertainty, pro-social behavior, and socio-demographics. In addition the questionnaire included attention check questions to ensure respondents were focusing on the questions asked.
2.2.1. Background Information
We presented all participants with information about soil quality and its decline in many parts of the world: “Soil quality is in decline in many parts of the world. Agricultural practices and agriculture intensification (e.g. increase in the use of fertilizers per ha) are two of the main drivers of soil quality decline. However, the use of sustainable soil management practices by farmers can help improving soil fertility and soil structure, which can reduce the risk of flooding and erosion. Hence, farmers' uptake of sustainable soil management practices is seen as key to improve soil quality and the associated environmental benefits.” We also explain to UK and Spanish respondents relevant EU and UK policies. For the UK respondents we stated that: “Under the Agriculture Act 2020 the UK government establishes that it may give financial assistance for environmental protection or improvement. This means that the government may pay farmers in order to achieve these purposes. These payments may be part of the new Environmental Land Management scheme, the cornerstone of the governments' new agricultural policy. Farmers may be paid for delivering the following public goods: clean air; clean and plentiful water; thriving plants and wildlife; protection from environmental hazards; beauty, heritage and engagement with the environment; reduction of and adaptation to climate change”. To Spanish respondents we stated that “The soil protection policy of the European Union (EU) is shaped through the EU Soil Thematic Strategy. This soil policy is provided using various instruments such as the common agricultural policy (CAP). The EU can give financial support to farmers for environmental protection or improvement. These payments would be based on farmers achieving environmental benefits: clean and plentiful water; thriving plants and wildlife; protection from environmental hazards; beauty, heritage and engagement with the environment; reduction of and adaptation to climate change”. Then we asked all respondents to focus specifically on one of the ways in which farmers may contribute to protect and improve the environment: Protecting or improving quality of soil and stated that “Soil is an essential ecosystem that delivers valuable services such as the provision of food, energy and raw materials, carbon sequestration, water purification, nutrient regulation, pest control, and support for biodiversity and recreation.”
Then we provided all respondents with a table (Table 1) with information on the ways in which agricultural soil improvement can be achieved by farmers and the related benefits to soil quality and the environment.
Participants in Group 2 were given the following extra information: “However, there is uncertainty on the overall impact/success of the Environmental Land Management scheme (for UK respondents)/EU Soil Thematic Strategy (for Spanish respondents) (i.e. level of provision of public goods) since this depends on: 1) the number, distribution and location of farms which would join the environmental land management scheme to implement these soil improving measures, 2) the number and type of soil management practices that will be conducted in each farm.”. This information introduces a lack of certainty about the scheme success/outcome to respondents as well as lack of clarity on how the environmental land management scheme will be implemented (i.e. ambiguity).
2.2.2. Willingness to Pay (WTP) Questions
After the background information was presented we moved to the WTP questions providing the following explanation to respondents: “Next you will be asked about your willingness to pay for a policy that aims at improving the soil quality. Under this policy, the government may grant financial assistance to farmers for the protection or improvement of the environment. Payments would be given to farmers who carry out agricultural practices indicated in Table 1. This information you provide may be useful for government to establish the agri-environmental payments farmers receive in the future associated with soil quality protection and improvement”. We use a double bounded dichotomous choice contingent valuation approach. Respondents were ask to answer “yes” or “no” to the following question “Would you be willing to pay an additional £X in your taxes each month for the next 10 years to protect and improve agricultural soil quality?” which was followed up by another question which depended on the answer given to the first question (e.g. “You said you would not be willing to pay £5. Would you be willing to pay £1 each month for the next 10 years?”; You said you would be willing to pay £15. Would you be willing to pay £20 each month for the next 10 years?” (See section 2.4 for more detail).
2.2.3. Protest Answers
When respondents answered twice “no” to the WTP question they were asked about the reasons for their answer. Table 2 shows a list of possible reasons for respondents answering twice “no” to the WTP question. Respondents were asked to select as many statements as applied as follows: “You answered that you are not prepared to pay for the proposed policy. Could you state the reason for your answer? Click as many as they apply”. Responses driven by the respondent’s economic constraints or failures to derive utility from protecting and improving soil quality are considered as “true zeros” (i.e. statements 1,3,7,8 are considered “true zeros”). Regarding the “other, please state” option there were a variety of reasons including “true” and “non-true” zeros. For instance, most respondents expressed dissatisfaction with the scenario presented (e.g. “They all seem to be things the farmers are already doing or should be doing and I fail to see why they need paying to look after the farm properly - also what is it that they feel needs cash another”; “I have never known a poor farmer. Sell one of the Range Rovers and use that money”; ”Farmers and government are well funded already. They don’t need more taxes from already taxed people I think”). These were not considered to be a true zero since the participant, whereas some respondents expressed economic constraints (e.g. “I am retired and I do not have any spare income”), which were considered to be “true-zeros”. For the UK survey we removed a total of 87 protest responses out of 882 (9.9%) whereas from the Spanish survey we removed a total of 88 protest responses out of 910 (9.7%), leaving a sample size for the UK n=882 and a sample size n=910 for Spain.
2.2.4. Views on Sustainable Agricultural Practices Benefits
We collected respondents views on how important the benefits related to the implementation of sustainable practices are for them. A set of 10 benefits were stated (Table 3). To reduce data complexity we applied a Principal Component Analysis (PCA) to the 10 statements. The PCA produced a single component, named “SAP benefits”, (with strong internal consistency - alpha ranging between 0.90 and 0.93; Keiser-Meyer-Olkin (KMO) ranging between 0.92 and 0.94 -), which was used as explanatory variable of the individual’s WTP for agricultural soil quality protection and improvement.
2.2.5. Views on How Concerned Participants are About Soil Quality Decline
We asked participants a question with four possible answers on how serious the issue of declining soil quality was for them. We asked “How serious is the issue of declining soil quality to you?” and the possible answers were “not at all serious”, “not very serious”, “fairly serious” and “extremely serious”. This allowed us to classify participants into relatively concerned about soil quality decline (those who answered “fairly serious” or “extremely serious”) and relatively unconcerned about soil quality decline (those who answered “not at all serious” or “not very serious”). The variable “Soil quality concern” takes a value of 1 if they are relatively concerned, and 0 otherwise, given the responses given to the question above.
2.2.6. Trust
Regarding trust, UK and Spanish participants were asked to evaluate how much trust they put on the UK/Spanish parliament, UK/Spanish government, UK/Spanish political parties, UK/Spanish politicians, Defra- Department for environment and rural affairs (for UK respondents only), the Spanish Ministry for Agriculture, Fisheries and Food (for Spanish respondents only), the government to monitor farmers’ agricultural practices, farmers to carry out sustainable agricultural practices, agri-environmental schemes to be successful in improving soil quality. Respondents evaluated their level of trust on these using a 5 point Likert scale (none at all, a little, a moderate amount, a lot, a great deal). We conducted a PCA to identify trust dimensions and how these may affect public’s WTP. Two components were obtained, “Trust in governance” and “Trust in agriculture stewardship“, which showed strong internal consistency (alpha ranging between 0.87 and 0.92; KMO ranging between 0.87 and 0.91) which were used as explanatory variables in the WTP model. We expect that the more trust respondents have on these the more likely they are to be willing to pay for the soil quality improvement scheme.
2.2.7. Risk Attitudes
We used an experimental approach to measure risk-taking behavior following Holt and Laury’s ten paired lottery choice decisions [30] (Table 4). Each of the lotteries was presented individually to respondents and consecutively (from the top lottery to the bottom lottery shown in Table 4). Respondents should cross over to option B when the probability of the payoff outcome increases enough as they “move down the table”[30]. The switching point is used as an estimate for the relative risk aversion (i.e. we use a 10 point risk aversion scale based on the switching point from option A to option B) [30]. The expected payoff (these were not provided to respondents) indicates that a risk neutral individual would switch from option A to option B at the fifth question; an extreme risk averse would switch at the tenth question and an extreme risk lover would switch at the first question.
The variable “Risk averse” takes the values at which the respondent has switched. If the respondent switches to B and comes back to A in the next question the first switch is not considered a definite switch.
2.2.8. Time Preferences
To capture individual’s time preferences or patience we use an approach previously used in the literature [31,32] where survey participants are given two choices from which they are asked to select one of them: either £/€3,400 this month or £/€3,800 next month. Respondents were divided into relatively patient and relatively impatient according to the choice they made. The variable “Time Preference” takes a value of 1 if the respondent is patient and 0 if is impatient. The relationship between time preference and willingness to pay has been previously analyzed using experiments [33]. Findings indicated consumer’s WTP for fuel economy improvements to be higher if payments for improvements are made more disperse through time [33]. The association between risk and time preferences and farmers’ preferences for agroforestry attributes has also been investigated and it has been recommended to be included when studying adoption of agricultural innovations [34]. We incorporate individual’s time preferences to investigate its direct association with individual’s willingness to pay.
2.2.9. Ambiguity Tolerance
As defined by McLain ambiguity aversion theory states that decision makers prefer a known risk to an ambiguous risk [35]. In our study there is no certainty about the level of success of the policy (i.e. granting farmers financial assistance to carry out agricultural practices in Table 1) in achieving its objective. To measure individuals’ ambiguity tolerance we used a 13-item measure of ambiguity tolerance (MSTAT-II) proposed by McLain using a 5 point Likert scale (1=strongly disagree; 5= strongly agree) [36]. Table 5 shows the 13-item used. We do not have any strong prior expectation on the relationship between ambiguity tolerance and individuals’ WTP for granting farmers financial assistance to carry out agricultural practices. Individuals who have a relatively high tolerance to ambiguity are more comfortable with uncertainty and more likely to be willing to pay for soil quality protection and improvement than those with relatively low tolerance to ambiguity. On the other hand, individuals with high ambiguity tolerance may be less willing to pay for soil quality protection and improvement than those with relatively low tolerance to ambiguity since the latter would like to reduce the ambiguity/uncertainty. To reduce data complexity and classify participants by their relatively ambiguity tolerance level we applied cluster analysis. Two clusters are obtained. The variable “Ambiguity Tolerant” takes a value of 1 if the respondent is ambiguity tolerant and 0 otherwise. We expect that ambiguity tolerant respondents to be willing to pay more than ambiguity intolerant respondents in general, but more in particular under an ambiguous situation such as the one presented to respondents in group 2. Ambiguity tolerance has been found to play a role in explaining organic wine purchase behaviors [37]
2.2.10. Pro-Social Behavior
We measure pro-social individual behavior by using a set of 27 statements (Table 6) on social responsibility, empathy, moral reasoning, and self-report altruism (past helpfulness and interpersonal generosity) that participants evaluate using a 7-point Likert scale, following Rapert et al. (2021) [38]. A cluster analysis is conducted resulting in 3 groups of respondents. A variable “pro-social behavior” takes value 1 for those with relative high pro-social behavior; 2 for those with medium pro-social behavior and 3 for those with relatively low pro-social behavior.
2.3. Conceptualisation of the Analysis
Figure 1 illustrates the model variables and how the process followed to obtain them. We use a set of constructs including views on the benefits associated with sustainable agricultural practices; views on soil quality decline; individuals’ ambiguity tolerance, prosocial behavior, time and risk preferences and their trust in governance and agriculture stewardship to investigate the heterogeneity in the WTP for soil quality protection and improvement through payments to farmers to carry out sustainable agricultural practices. Figure 1 also shows how the constructs have been derived or what information contain (e.g. socio-demographics). This is applied to both groups of UK and Spanish respondents (those to whom extra background information was provided on uncertainty and ambiguity on the environmental scheme presented to improve soil quality and those to whom this information was not presented).
2.4. Data Analysis: Double Bounded Dichotomous Choice Contingent Valuation
We use a double bounded dichotomous choice contingent valuation approach to elicit general public’s WTP for soil quality improvement through the implementation of policies aiming at farmers to uptake sustainable agricultural practices. The payment vehicle is a monthly tax to be paid in the next 10 years. All participants were first asked whether they would be “willing to pay and additional £/€X in their taxes each month for the next 10 years to protect and improve agricultural soil quality. The initial bids were £/€5, £/€15, £/€25, £/€35, £/€45. These were randomly distributed so each respondent had the same probability to be shown any of these bids. If the respondent answered “yes” (“no”) to the initial question, then the respondent was asked whether would be willing to pay a higher (lower) amount. The corresponding higher (and lower) amounts were +£/€5 (-£/€5) with respect to the original bid. This is £/€10, £/€20, £/€30, £/€40, £/€50 for the “yeses” and £/€1, £/€10, £/€20, £/€30, £/€40 for the “noes”.
2.5. Data analysis: Model Estimation
Random Utility Theory (RUM) provides the theoretical basis for the double bound contingent valuation method used. Under RUM individuals choose alternatives that maximize their utility. We use an interval regression to estimate the WTP model. Our model specification is:
where ; is the WTP (latent variable) of respondent for a policy program to protect and improve agricultural soil quality; is a vector of explanatory variables including respondents’ views on the benefits of sustainable agricultural practices (SAP_benefits), soil quality decline views (Soil quality concern), respondent’s ambiguity tolerance (Ambiguity tolerance), pro-social behavior (Pro-social behavior), time-preference, risk preference, trust in governance, trust in agriculture stewardship, age, gender and education level and income; is a vector of coefficients associated with the explanatory variables to be estimated and is the normally distributed error term. The probability of the respondent’s WTP for a policy program to protect and improve agricultural soil quality is ) where and are the respondent’s WTP lower and upper bounds; is the standard normal random variable, represents the standard normal cumulative distribution function (cdf) with and .
We estimate 4 models: 1) UK respondents – no uncertain and ambiguous background information presented; 2) UK respondents – uncertain and ambiguous background information presented; 3) Spanish respondents – no uncertain and ambiguous background information presented; 4) Spanish respondents – uncertain and ambiguous background information presented.
3. Results
This section is structured as follows: Section 3.1 reports the descriptive statistics Section 3.2 reports the results obtained from the interval regression estimation of the WTP models for UK and Spain (control and treatment).
3.1. Descriptive Statistics
The sample descriptive statistics of the variables used in the statistical models is presented in Table 6. No major differences exist between control and treatment groups for the UK and Spanish respondents. Regarding differences between countries Spanish respondents are on average relatively more concern about soil quality, less risk aversed, and more impatient and have less trust in governance but more trust in stewardship than UK respondents.
3.2. Willingness to Pay: Control And Treatment Models
3.2.1. UK—Willingness to Pay for Agricultural Soil Quality Improvement
Table 7 presents the results of the WTP models for the UK control and treatment models. Results for the control group show that individuals who appreciate the benefits of sustainable agricultural practices (SAP) are willing to pay more for soil quality protection and improvement than those who do not appreciate the benefits of SAP. Likewise, those respondents who are concerned about soil quality are more willing to pay for soil quality protection and improvement than those who are relatively less concerned. We found that the more tolerant to ambiguity the individual is the less is willing to pay for soil quality protection and improvement. Also, prosocial behavior was not found to be associated with WTP for soil quality improvement. Risk and time preferences were not found to be associated with the WTP for soil quality protection and improvement for the control group. Age was found to be associated with individual’s WTP for soil quality protection and improvement. Thus, relatively older respondents were willing to pay less than younger respondents. Likewise, women were found to be willing to pay less than male respondents. Education was also found to be associated with individual’s WTP with individuals having a post-graduate degree be willing to pay more than individuals with primary/secondary education for soil quality protection and improvement.
The results for the treatment group (i.e. these respondents were shown information that introduced uncertainty and ambiguity on the environmental scheme presented to improve soil quality) are similar to the control group for SAP benefits, soil quality concern, pro-social behavior, trust in governance and stewardship, age and income. However, the results from the treatment group also present some key differences with respect to the results obtained from the control sample. Although the coefficient associated with soil quality concern is statistically significant (p-value <0.10), as it is for the control group, the relationship between this and the individual’s WTP is weaker. The association between ambiguity tolerance and WTP association is less evident in the treatment group than in the control group (p-value = 0.019 in the control group; p-value = 0.102 in the treatment group). Individual’s risk aversion and time preference were found to be associated with the WTP. Thus, individuals who are relatively more risk averse in the treatment group are willing to pay less than individuals who are relatively less risk averse (p-value < 0.10). Also, relatively more patient individuals are less willing to pay for soil quality protection and improvement than relatively less patient individuals (p-value < 0.05). The gender difference in WTP is not present in the treatment group.
It is worth notint that although the estimated coefficients for the control and treatment prosocial behaviour are not statistically significant (p-value>0.10), there is a signficant difference between them suggesting that introducing uncertainty and ambiguity in the message may have influenced individual’s tendency to support the policy programme.
3.2.1. Spain—Willingness to Pay for Agricultural Soil Quality Improvement
Table 8 shows the results of the WTP models for the Spain control and treatment models. Results for the control group show that, similarly to UK control model, individuals who appreciate the benefits of sustainable agricultural practices (SAP) and are concerned about soil quality are willing to pay more for soil quality protection and improvement than those who do not appreciate the benefits of SAP or are not concerned about soil quality. Unlike for the UK case, we found that for the Spain case the tolerant ambiguity is not associated with individual’s WTP for soil quality protection and improvement, but individuals who have a relatively high pro-social behavior are willing to pay more than individuals with a relatively low pro-social behavior. Spanish respondents who have trust in governance are willing to pay higher amounts than those who place no trust in governance, something that was not found in the UK case. Risk and time preferences were not found to be associated with the WTP for soil quality protection and improvement for the control group, as in the UK case. Age was found to be associated with individual’s WTP for soil quality protection and improvement whereas gender was not found to be associated with WTP more or less for quality improvement. No differences in WTP were found across education and income levels.
For Spanish respondents who were shown information that introduced uncertainty and ambiguity on the environmental scheme presented to improve soil quality e treatment group the model shows similar results to the control group regarding SAP benefits, ambiguity tolerance, risk aversion, time preference, and trust in governance and stewardship. However, as in the UK case the results from the treatment group also present some key differences with respect to the results obtained from the control sample. For this groups of respondents who were presented with a relatively more uncertainty and ambiguous message about the impact/success of the schemes aiming to protect and improve soil quality the only factors associated with their WTP were their appreciation for the benefits associated with sustainable agricultural practices, their level of trust in governance and their level of income.
The estimated sample average and median WTP for UK and Spanish respondents in control and treatment groups is shown in Table 9.
As pointed out we found significant heterogeneity in individual’s WTP for soil quality protection and improvement. Table 10 and Table 11 show the average WTP for control and treatment groups and the difference between them under 18 different combination levels for SAP benefits, soil quality concern, pro-social behavior, and trust in governance.
4. Discussion
We have found that there is significant public support for governments to provide financial assistance to farmers to improve soil quality through the use of sustainable agricultural practices. Our individual’s average and median WTP estimates are in line with recent research on the WTP estimates for soil security in Italy ($244) and Australia ($567) [21]. These estimates were obtained using an annual tax to be paid in the next 5 years as vehicle payment. Our vehicle payment was a monthly tax for the next 10 years. We estimated that the median annual WTP for agricultural soil quality protection and improvement is £223 and €293 (£248 at £1=£0.85 28/06/2024 exchange rate) for the UK and Spain, respectively. The estimates obtained once introduction of uncertainty and ambiguity are £237 and €287 (£243 at £1=£0.85 28/06/2024 exchange rate) for the UK and Spain, respectively. These estimates allow us to provide an estimate of the capital value of programs supporting farmers financially to conduct sustainable agricultural practices to aim for agricultural soil quality improvement. For the UK the annual capital value estimate is £15.1-£16.0 billion, whereas the annual capital value of the program for Spain is €13.9-14.2 billion (using median WTP estimates with and without uncertainty and ambiguity and UK population data [39] [40]). These are significantly higher than the annual £2.4 billion and €14 billion the UK and EU annual budgets allocated to the UK agriculture transition plan 2021-2024 and the EU budget to deliver specific environmental benefits for climate, water, soil, air, biodiversity and animal welfare and to encourage practices that go beyond the conditionality.
We found that introducing information to respondents on the level of uncertainty of the program does not have a significant impact on their average WTP. Although there are not significant differences between the average respondents’ mean and median WTP per group and country there are significant heterogeneity in their WTP for soil quality protection and improvement. We found that providing information about the uncertainty on the overall impact/success of the ELMS scheme/ EU Soil Thematic Strategy (i.e. level of provision of public goods) alters the reasons that individuals have for being (or not ) willing to pay for soil quality protection and improvement. For UK respondents what explains individual’s WTP moves away from aspects associated with individual’s level of concern for soil quality, their level of ambiguity tolerance and socio-demographics towards individual’s risk aversion levels and their time preferences. For Spanish respondents what explains individual’s WTP moves away from aspects associated with individual’s level of concern for soil quality, their level of pro-social behavior and age towards individual’s appreciation of SAP benefits and their level of income.
We found that the more tolerant to ambiguity the less individuals are willing to pay for soil quality protection and improvement. This may indicate that the less ambiguity tolerant an individual is the more the individual is keen to remove such ambiguity and therefore would be willing to pay for it.
Under uncertainty relatively more risk averse individuals in the UK are less willing to pay than less risk averse individuals (i.e. relatively more risk averse individuals value less a program aiming at protecting and improving soil quality when they are informed about the uncertainty of the success of the policy). This effect was not found for Spanish respondents. Results indicating a negative relationship between risk aversion and willingness to pay have been reported in different studies (e.g. for improved agricultural technologies [41]; energy efficient insulation and ventilation systems in rental apartments [42]; insurance contracts [43]; and functional food [44]).
Regarding potential limitations of this study it is worth mentioning that, although widely used, there have been contentious discussions regarding the multiple discrete choice (DCm) approach reliability (McFadden (1994)); its internal consistency (Bateman et al. (2001)); hypothetical bias (List and Gallet, 2001; Murphy and Stevens, 2004; Murphy et al, 2005). The DCm approach may suffer from hypothetical bias, i.e. a deviation from real market evidence, if the study was conducted in hypothetical situations with no consumption consequences for the participants (Ding et al., 2005). However, on the other hand, Hanemann et al. (1991) suggested double dichotomous choice as an efficient approach to obtaining contingent valuation estimates. Carson et al. (2003) indicated that a careful contingent valuation survey design and development could reduce the concern of biased estimates of DCm, especially when a large-scale survey was employed rather than a small size experiment. The above literature highlights the still inconclusive justification of using DCm for measuring WTP, and motivates the present study.
This study has developed a conceptual framework that can be altered to answer other type of questions to the ones presented here. We recommend that future valuation research incorporate elements of uncertainty and ambiguity into the analysis.
5. Conclusions
There is significant public support for agricultural soil quality protection and improvement in both Spain and the UK. The individuals’ reasons for supporting and being willing to pay change under increase uncertainty and ambiguity about the impact and results of a soil protection program and these may vary across countries, which is in line with previous findings in the literature significant spatial variation in response to policy and biodiversity impact [7].
Results suggest that as general public being supportive of public policies become more aware of the level of uncertainty around the success of achieving policy objectives they can remain supportive of those public policies but their reasons for supporting them may change. Hence, under an increased public awareness on the level of uncertainty about a policy/program outcomes, actions to try to gain/keep public support should differ from actions taken to gain/keep support where public awareness on the level of uncertainty is low. It is also important to acknowledge that since the individual’s reasons to support a public policy may change once individual’s become more aware of the uncertainty around achieving the policy objectives and that these may vary across geographical locations any action to gain/keep public support needs to be tailored to the relevant geographical area (e.g. country, region). For instance, for the case of promoting public support for soil protection, illustrating the benefits of SAP is important to gain/keep support in both countries studied, regardless of the level of policy outcome uncertainty. However, using other approaches such as promoting public support for soil protection through messages focusing on soil quality concerns may be less effective, when public is aware of the uncertainty around the success of soil protection objectives, especially in Spain. Similarly, messages promoting pro-social behavior to gain/keep policy support for agricultural soil quality protection and improvement are less likely to be effective when public is aware of the uncertainty of the success of these policies.
Funding
This research received funding from the European Union’s Horizon 2020 research and innovation program under grant agreement No 677407 (SoilCare project).
Data Availability Statement
Data will be made available before publication (Zenodo).
Conflicts of Interest
“The authors declare no conflicts of interest.”
References
- Directorate General for Health and Food Safety, E.C., COMMUNICATION FROM THE COMMISSION TO THE EUROPEAN PARLIAMENT, THE COUNCIL, THE EUROPEAN ECONOMIC AND SOCIAL COMMITTEE AND THE COMMITTEE OF THE REGIONS A Farm to Fork Strategy for a fair, healthy and environmentally-friendly food system, in COM(2020)381 final, E. Commission, Editor. 2020, European Commission: Brussels.
- Hessel, R., et al., Soil-Improving Cropping Systems for Sustainable and Profitable Farming in Europe. Land, 2022. 11(6): p. 780. [CrossRef]
- Veerman, C., et al., Caring for soil is caring for life – Ensure 75% of soils are healthy by 2030 for food,.
- people, nature and climate. 2020, European Commission: https://op.europa.eu/en/publication-detail/-/publication/4ebd2586-fc85-11ea-b44f-01aa75ed71a1/.
- Agarwal, S.K. and A.K. Srivastava, On probability limits in snowball sampling. Biometrical Journal, 1980. 22(1): p. 87-88. [CrossRef]
- Environment Agency, The state of the evironmnet: soil. 2019, Environment Agency.
- Potter, C. and P. Goodwin, Agricultural liberalization in the European union: an analysis of the implications for nature conservation. Journal of Rural Studies, 1998. 14(3): p. 287-298. [CrossRef]
- Mattison, E.H.A. and K. Norris, Bridging the gaps between agricultural policy, land-use and biodiversity. Trends in Ecology & Evolution, 2005. 20(11): p. 610-616. [CrossRef]
- Donald, P.F., R. Green, and M. Heath, Agricultural intensification and the collapse of Europe's farmland bird populations. Proceedings of the Royal Society of London. Series B: Biological Sciences, 2001. 268(1462): p. 25-29. [CrossRef]
- Wilson, J.D., et al., A review of the abundance and diversity of invertebrate and plant foods of granivorous birds in northern Europe in relation to agricultural change. Agriculture, Ecosystems & Environment, 1999. 75(1): p. 13-30. [CrossRef]
- Gasso, V., et al., Controlled traffic farming: A review of the environmental impacts. European Journal of Agronomy, 2013. 48: p. 66-73. [CrossRef]
- Batey, T., Soil compaction and soil management – a review. Soil Use and Management, 2009. 25(4): p. 335-345. [CrossRef]
- Hamza, M.A. and W.K. Anderson, Soil compaction in cropping systems: A review of the nature, causes and possible solutions. Soil and Tillage Research, 2005. 82(2): p. 121-145. [CrossRef]
- Swinbank, A., Capping the CAP? Implementation of the Uruguay round agreement by the European union. Food Policy, 1996. 21(4): p. 393-407. [CrossRef]
- Hynes, S., et al., Modelling habitat conservation and participation in agri-environmental schemes: A spatial microsimulation approach. Ecological economics, 2008. 66(2-3): p. 258-269. [CrossRef]
- Kutter, T., et al., Policy measures for agricultural soil conservation in the European Union and its member states: Policy review and classification. Land Degradation & Development, 2011. 22(1): p. 18-31. [CrossRef]
- Commission, E., Proposal for a DIRECTIVE OF THE EUROPEAN PARLIAMENT AND OF THE COUNCIL on Soil Monitoring and Resilience (Soil Monitoring Law) in COM(2023) 416 final.
- 2023/0232 (COD) 2023, European Commission.
- DEFRA, The Path to Sustainable Farming: An Agricultural Transition Plan 2021 to 2024 2020, DEFRA.
- Commission, E., Common agricultural policy for 2023-2027: 28 CAP strategic plans at a glance. 2022, European Commission.
- European Court of Auditors, EU efforts for sustainable soil management: Unambitious standards and limited targeting. 2023, European Court of Auditors.
- Glenk, K. and S. Colombo, Designing policies to mitigate the agricultural contribution to climate change: an assessment of soil based carbon sequestration and its ancillary effects. Climatic Change, 2011. 105(1): p. 43-66. [CrossRef]
- Franceschinis, C., et al., Society's willingness to pay its way to soil security. Soil Security, 2023. 13: p. 100122. [CrossRef]
- Wang, H.H., J. Yang, and N. Hao, Consumers’ Willingness to Pay for Rice from Remediated Soil: Potential from the Public in Sustainable Soil Pollution Treatment. International Journal of Environmental Research and Public Health, 2022. 19(15): p. 8946. [CrossRef]
- Dimal, M.O.R. and V. Jetten, Analyzing preference heterogeneity for soil amenity improvements using discrete choice experiment. Environment, Development and Sustainability, 2020. 22(2): p. 1323-1351. [CrossRef]
- Eusse-Villa, L.F., et al., Attitudes and Preferences towards Soil-Based Ecosystem Services: How Do They Vary across Space? Sustainability, 2021. 13(16): p. 8722. [CrossRef]
- Rodríguez-Entrena, M., et al., Evaluating the demand for carbon sequestration in olive grove soils as a strategy toward mitigating climate change. Journal of Environmental Management, 2012. 112: p. 368-376. [CrossRef]
- Colombo, S., N. Hanley, and J. Calatrava-Requena, Designing Policy for Reducing the Off-farm Effects of Soil Erosion Using Choice Experiments. Journal of Agricultural Economics, 2005. 56(1): p. 81-95. [CrossRef]
- Colombo, S., J. Calatrava-Requena, and N. Hanley, Analysing the social benefits of soil conservation measures using stated preference methods. Ecological Economics, 2006. 58(4): p. 850-861. [CrossRef]
- Almansa, C., J. Calatrava, and J.M. Martínez-Paz, Extending the framework of the economic evaluation of erosion control actions in Mediterranean basins. Land Use Policy, 2012. 29(2): p. 294-308. [CrossRef]
- Bartkowski, B., J.R. Massenberg, and N. Lienhoop, Investigating preferences for soil-based ecosystem services. Q Open, 2022. 2(2). [CrossRef]
- Holt, C.A. and S.K. Laury, Risk Aversion and Incentive Effects. The American Economic Review, 2002. 92(5): p. 1644-1655. [CrossRef]
- Rieger, M.O. and Y. He-Ulbricht, German and Chinese dataset on attitudes regarding COVID-19 policies, perception of the crisis, and belief in conspiracy theories. Data in Brief, 2020. 33: p. 106384. [CrossRef]
- Wang, M., M.O. Rieger, and T. Hens, How time preferences differ: Evidence from 53 countries. Journal of Economic Psychology, 2016. 52: p. 115-135. [CrossRef]
- McGowan, F.P., E. Denny, and P.D. Lunn, Looking beyond time preference: Testing potential causes of low willingness to pay for fuel economy improvements. Resource and Energy Economics, 2023. 75: p. 101404. [CrossRef]
- Julia Ihli, H., et al., Risk and time preferences for participating in forest landscape restoration: The case of coffee farmers in Uganda. World Development, 2022. 150: p. 105713. [CrossRef]
- Ellsberg, D., Risk, Ambiguity, and the Savage Axioms*. The Quarterly Journal of Economics, 1961. 75(4): p. 643-669. [CrossRef]
- McLain, D.L., Evidence of the Properties of an Ambiguity Tolerance Measure: The Multiple Stimulus Types Ambiguity Tolerance Scale–II (MSTAT–II). Psychological Reports, 2009. 105(3): p. 975-988. [CrossRef]
- Jorge, E., E. Lopez-Valeiras, and M.B. Gonzalez-Sanchez, The role of attitudes and tolerance of ambiguity in explaining consumers’ willingness to pay for organic wine. Journal of Cleaner Production, 2020. 257: p. 120601. [CrossRef]
- Rapert, M.I., A. Thyroff, and S.C. Grace, The generous consumer: Interpersonal generosity and pro-social dispositions as antecedents to cause-related purchase intentions. Journal of Business Research, 2021. 132: p. 838-847. [CrossRef]
- ONS, Population estimates for the UK, England, Wales, Scotland, and Northern Ireland: mid2022. 2024, Office for National Statistics.
- INE. Estadística continua de Población (ECP). 2024 28/06/2024].
- Shee, A., C. Azzarri, and B. Haile Farmers’ Willingness to Pay for Improved Agricultural Technologies: Evidence from a Field Experiment in Tanzania. Sustainability, 2020. 12. [CrossRef]
- Farsi, M., Risk aversion and willingness to pay for energy efficient systems in rental apartments. Energy Policy, 2010. 38(6): p. 3078-3088. [CrossRef]
- Elabed, G. and M.R. Carter, Compound-risk aversion, ambiguity and the willingness to pay for microinsurance. Journal of Economic Behavior & Organization, 2015. 118: p. 150-166. [CrossRef]
- Zhen, S., et al., Does risk preference matter to consumers’ willingness to pay for functional food: Evidence from lab experiments using the eye-tracking technology. Food Quality and Preference, 2024. 119: p. 105197. [CrossRef]
Figure 1.
Conceptual framework
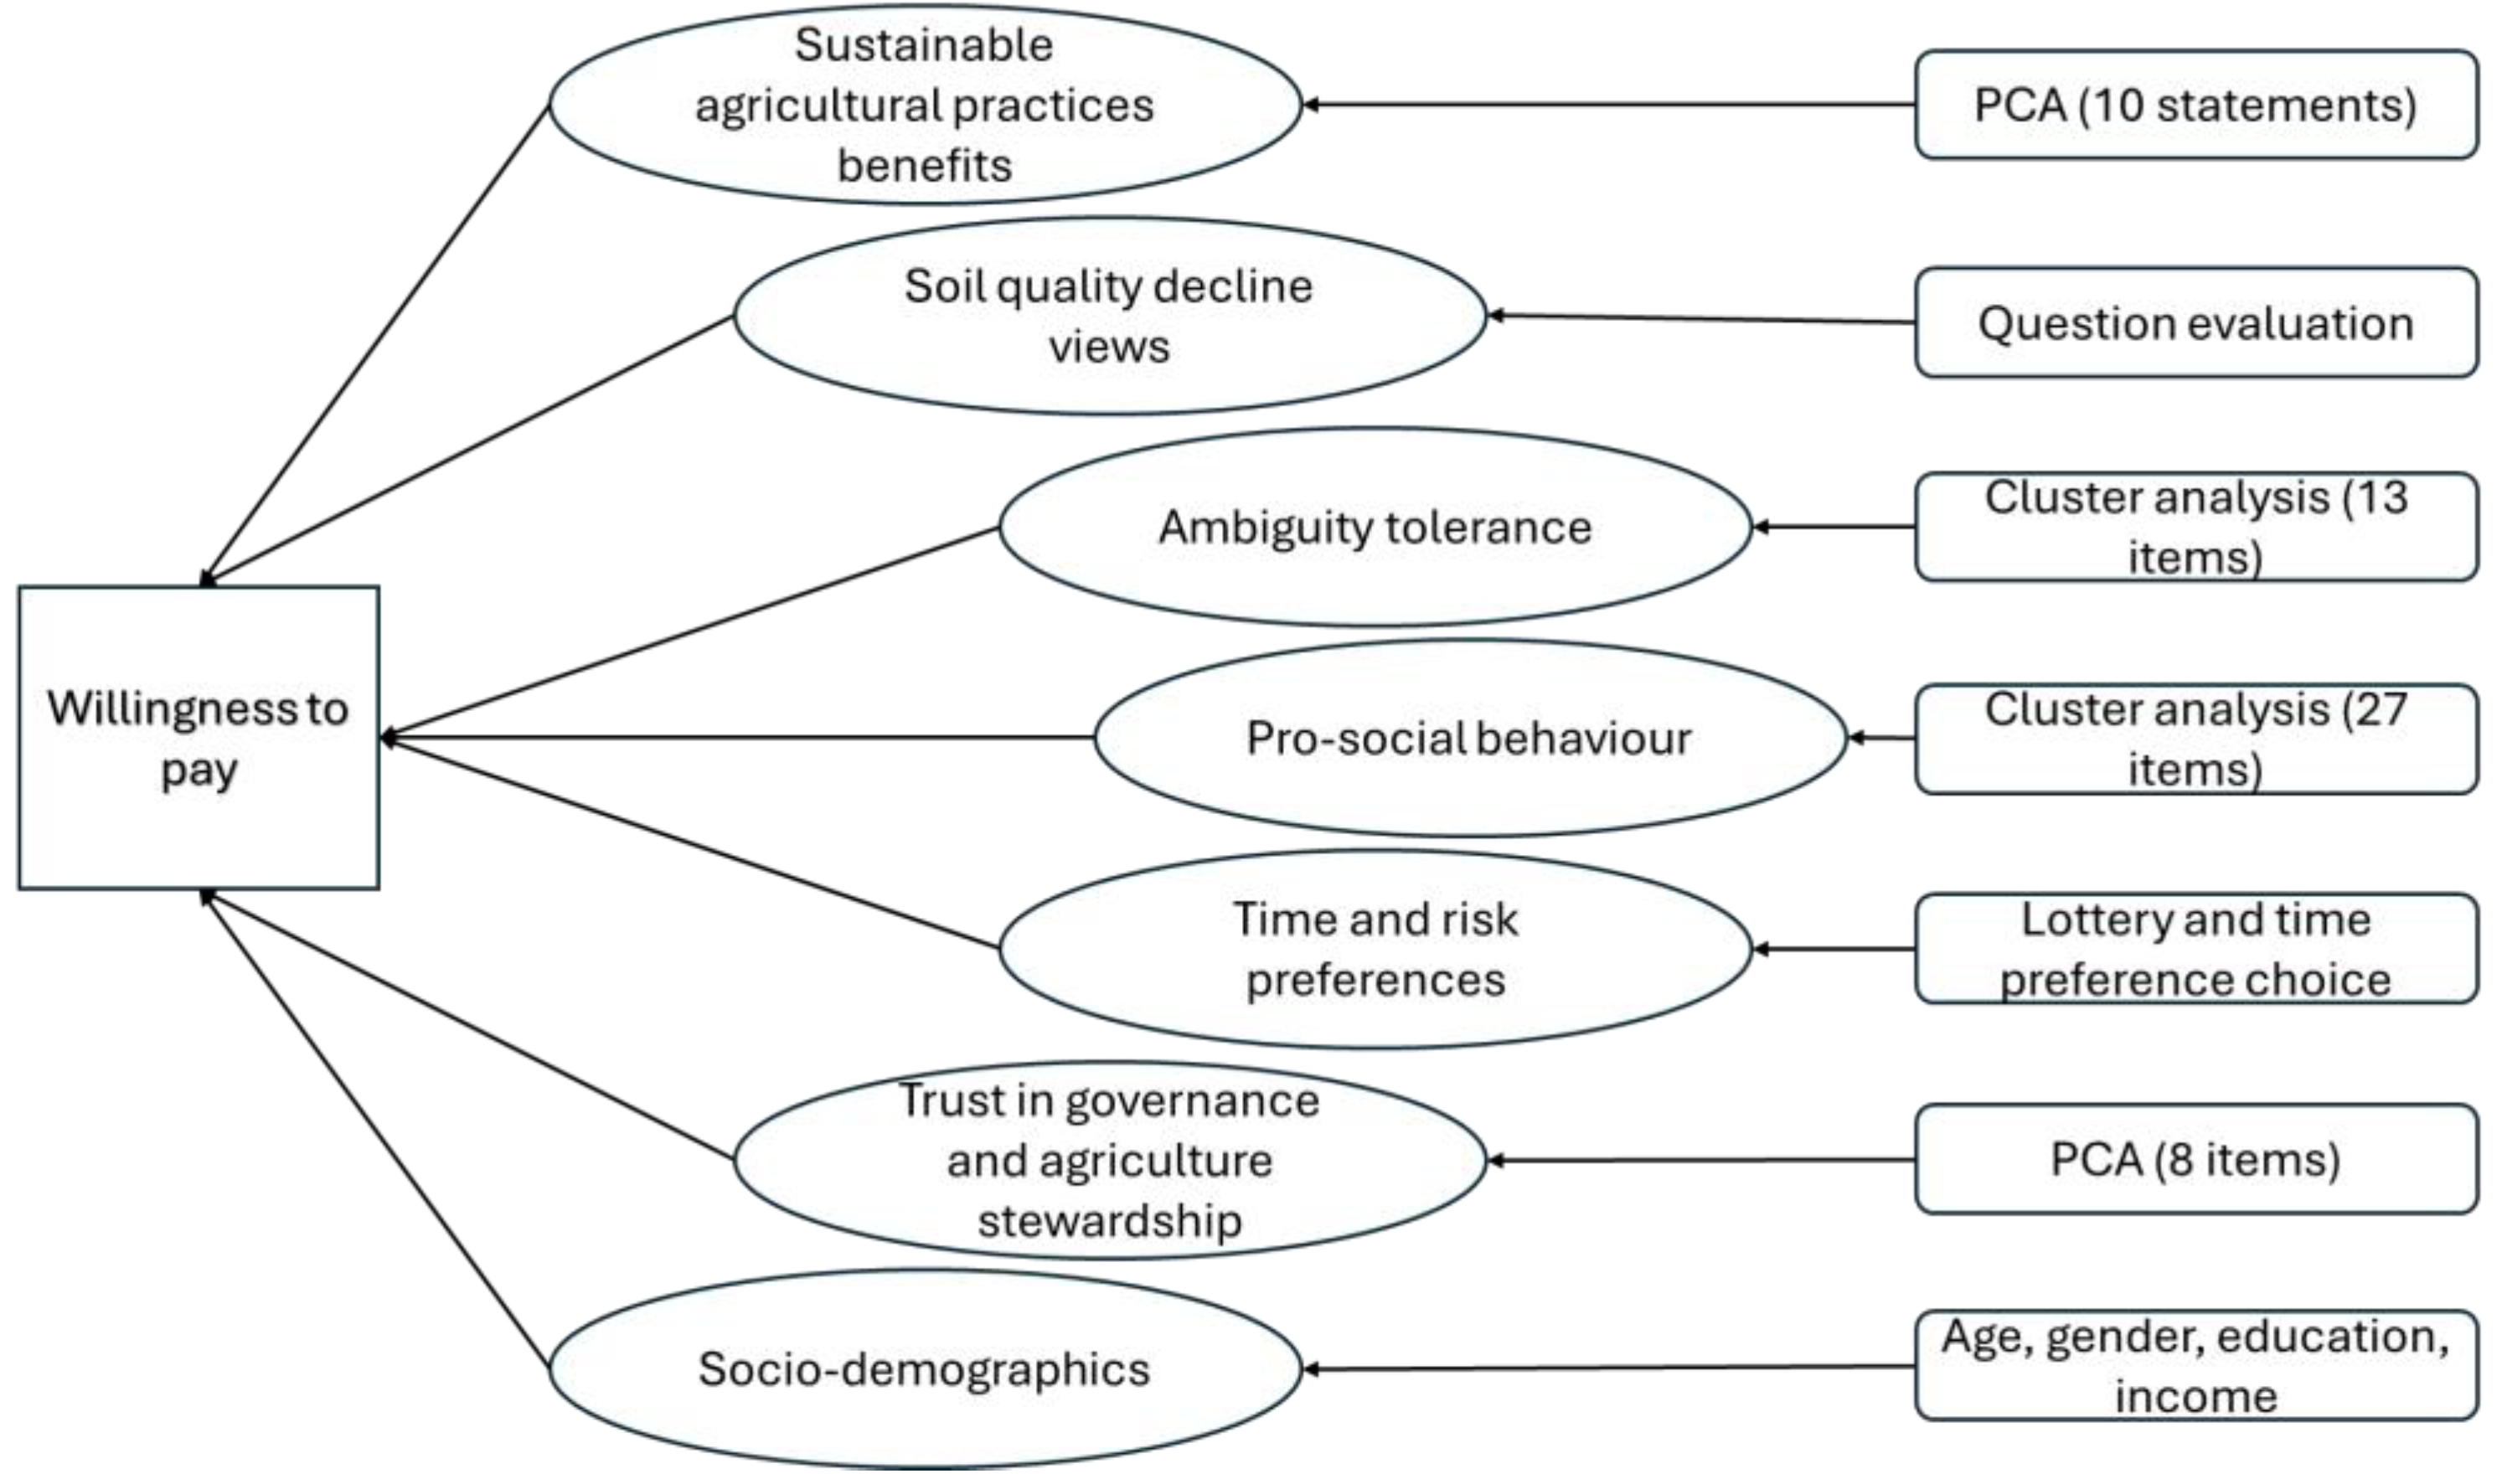

Table 1.
Soil improving cropping system components and their environmental benefits.
| Soil improving cropping system component | Description |
|---|---|
| Cover crops, green manures & intercropping | Help keep ground covered over winter when rain and winds can cause erosion; can reduce need for fertilizer and supply organic N if leguminous; create habitat for insects and therefore food for birds. |
| Crop rotation | Rotating crops with a diverse mix of crops as well as livestock, can increase soil health infiltration through different root lengths by adding a range of nutrients therefore reducing the need for chemical inputs, improving soil structure and reducing the need for chemical pest and weed control. |
| Fertilization / soil amendments | Adding compost, mulch, woodchip (fresh or composted) and animal manure reduce the need for chemical fertilizers |
| Soil cultivation | Reducing or eliminating the amount of ploughing or tillage of the soil can improve soil health by reducing organic matter decline, keeping soil microbiology intact and reduce compaction through less machine passes across fields as well as reducing fuel use and related emissions. |
| Compact alleviation | Sub-soiling can be used to alleviate compaction (increasing infiltration and soil health), as well as using diverse cover crops, (the roots of which can help aerate soil and improve structure), and reducing machinery passes across fields e.g. reducing tillage. |
| Controlled drainage | Re-use of water on farm; ditches etc to allow run-off; afforestation to reduce waterlogging. Improves crop productivity and resource use efficiency; minimizes the risk of waterlogging. |
| Integrated landscape management | Mixed farming and rotations across farms; hedgerows and corridors for wildlife and beneficial predators; water harvesting e.g. through dams, reservoirs. Improves biodiversity, pest management and cropping systems sustainability on a landscape-scale. |
Table 2.
Protest views statements
| Statement | |
|---|---|
| 1 | I cannot pay. I do not have enough income |
| 2 | I will need to have more information about this policy |
| 3 | I am skeptical the money will go to farmers |
| 4 | I am already paying tax and I think the government has to use that money to support farmers |
| 5 | It is unfair for me to pay |
| 6 | I object to the way the question is asked |
| 7 | The money collected will not make a difference |
| 8 | My employment is temporary, uncertain; therefore my commitment cannot be long term |
| 9 | Other, please state |
Table 3.
Benefits associated with the implementation of sustainable agricultural practices.
| Statement | |
|---|---|
| 1 | Creating habitat for insects and therefore food for birds |
| 2 | Improving soil health and structure |
| 3 | Reducing the need for chemical pest and weed control |
| 4 | Reducing fuel use and related emissions |
| 5 | Improving water use efficiency |
| 6 | Minimizing risks of salinization and desertification |
| 7 | Improving crop productivity |
| 8 | Minimizing the risk of waterlogging |
| 9 | Improving biodiversity |
| 10 | Improving cropping system sustainability |
Table 4.
Benefits associated with the implementation of sustainable agricultural practices.
| Option A | Option B | Expected payoff difference |
|---|---|---|
| 10% chance wining £2.00 and 90% wining £1.60 | 10% chance wining £3.85 and 90% wining £0.10 | £/€1.17 |
| 20% chance wining £2.00 and 80% wining £1.60 | 20% chance wining £3.85 and 80% wining £0.10 | £/€0.83 |
| 30% chance wining £2.00 and 70% wining £1.60 | 30% chance wining £3.85 and 70% wining £0.10 | £/€0.50 |
| 40% chance wining £2.00 and 60% wining £1.60 | 40% chance wining £3.85 and 60% wining £0.10 | £/€0.16 |
| 50% chance wining £2.00 and 50% wining £1.60 | 50% chance wining £3.85 and 50% wining £0.10 | -£/€0.18 |
| 60% chance wining £2.00 and 40% wining £1.60 | 60% chance wining £3.85 and 40% wining £0.10 | -£/€0.51 |
| 70% chance wining £2.00 and 30% wining £1.60 | 70% chance wining £3.85 and 30% wining £0.10 | -£/€0.85 |
| 80% chance wining £2.00 and 20% wining £1.60 | 80% chance wining £3.85 and 20% wining £0.10 | -£/€1.18 |
| 90% chance wining £2.00 and 10% wining £1.60 | 90% chance wining £3.85 and 10% wining £0.10 | -£/€1.52 |
| 100% chance wining £2.00 and 0% wining £1.60 | 100% chance wining £3.85 and 0% wining £0.10 | -£/€1.85 |
Table 5.
MSTAT-II 13-item to measure ambiguity tolerance.
| Statement | |
|---|---|
| 1 | I don't tolerate ambiguous situations well |
| 2 | I would rather avoid solving a problem that must be viewed from several different perspectives |
| 3 | I try to avoid situations that are ambiguous |
| 4 | I prefer familiar situations to new ones |
| 5 | Problems that cannot be considered from just one point of view are a little threatening |
| 6 | I avoid situations that are too complicated for me to easily understand |
| 7 | I am tolerant of ambiguous situations |
| 8 | I enjoy tackling problems that are complex enough to be ambiguous |
| 9 | I try to avoid problems that don’t seem to have only one “best” solution |
| 10 | I generally prefer novelty over familiarity |
| 11 | I dislike ambiguous situations |
| 12 | I find it hard to make a choice when the outcome is uncertain |
| 13 | I prefer a situation in which there is some ambiguity |
Table 5.
Pro-social behavior statements.
| Statement | |
|---|---|
| 1 | I would feel less bothered about leaving litter in a dirty park than in a clean one |
| 2 | Depending on what a person has done, there may be an excuse for taking advantage of them |
| 3 | With the pressure of grades and the widespread cheating in school nowadays, the individual who cheats occasionally is not really as much at fault |
| 4 | It doesn’t make much sense to be very concerned about how we act when we are sick and feeling miserable |
| 5 | If I broke a machine through mishandling, I would feel less guilty if it was already damaged before I used it |
| 6 | When you have a job to do, it is impossible to look out for everyone’s best interest |
| 7 | When I see someone being taken advantage of, I feel kind of protective towards them |
| 8 | Other people’s misfortunes usually disturb me a great deal |
| 9 | When I see someone being treated unfairly, I usually feel pity for them |
| 10 | I am often quite touched by things that I see happen |
| 11 | I often have tender, concerned feelings for people less fortunate than me |
| 12 | I often feel very sorry for other people when they are having problems |
| 13 | I would describe myself as a pretty soft-hearted person |
| 14 | My decisions are usually based on my concern for other people |
| 15 | I choose a course of action that maximizes the help other people receive |
| 16 | My decisions are usually based on concern for the welfare of others |
| 17 | I choose alternatives that minimize the negative consequences to other people |
| 18 | I have helped carry a stranger’s belongings (e.g., books, packages, groceries, etc.) |
| 19 | I have let a neighbor whom I didn’t know too well borrow an item of some value (e.g., tools, a dish, etc.) |
| 20 | I have, before being asked, voluntarily looked after a neighbour’s pet or children without being paid for it |
| 21 | I have offered to help a handicapped or elderly stranger (e.g., to cross a street, to lift something, etc.) |
| 22 | When one of my loved ones needs my attention, I really try to slow down and give them the time and help they need |
| 23 | I am known by family and friends as someone who makes time to pay attention to other’s problems |
| 24 | I'm the kind of person who is willing to go the “extra mile” to help take care of my friends, relatives, and acquaintances |
| 25 | When friends or family members experience something upsetting or discouraging, I make a special point of being kind to them |
| 26 | It makes me very happy to give to other people in ways that meet their needs |
| 27 | I make it a point to let my friends and family know how much I love and appreciate them |
Table 6.
Sample descriptive statistics.
| UK – control (n=449) | UK – treatment (n=433) |
ESP – control (n=462) | ESP – treatment (n=448) |
|
|---|---|---|---|---|
| Variable | Mean (std dev) | Mean (std dev) | Mean (std dev) | Mean (std dev) |
| SAP benefits | 7.993 (1.530) | 8.031 (1.654) | 8.404 (1.381) | 8.375 (1.375) |
| Soil quality concern | 0.744 (0.437) | 0.736 (0.442) | 0.907 (0.291) | 0.920 (0.272) |
| Ambiguity tolerance | 0.492 (0.500) | 0.416 (0.493) | 0.444 (0.497) | 0.426 (0.495) |
| Pro-social behavior - high | 0.565 (0.497) | 0.515 (0.500) | 0.584 (0.493) | 0.581 (0.494) |
| Pro-social behavior - low | 0.437 (0.497) | 0.485 (0.500) | 0.419 (0.493) | 0.420 (0.494) |
| Risk aversion | 6.933 (2.305) | 6.952 (2.370) | 6.394 (2.487) | 6.469 (2.383) |
| Time preference | 0.759 (0.428) | 0.733 (0.443) | 0.571 (0.495) | 0.583 (0.494) |
| Trust in governance | 2.874 (2.030) | 3.145 (2.313) | 2.524 (2.010) | 2.641 (2.199) |
| Trust in stewardship | 4.606 (1.830) | 4.962 (1.873) | 5.124 (1.859) | 5.452 (2.030) |
| Age | 46.909 (15.816) | 45.951 (15.642) | 42.982 (13.619) | 42.728 (13.317) |
| Gender | 0.508 (0.500) | 0.494 (0.501) | 0.487 (0.500) | 0.520 (0.500) |
| Education level – Primary/Secondary | 0.256 (0.437) | 0.296 (0.457) | 0.297 (0.457) | 0.261 (0.440) |
| Education level – University/Professional | 0.254 (0.436) | 0.233 (0.423) | 0.271 (0.445) | 0.277 (0.448) |
| Education level – Post-graduate degree | 0.490 (0.500) | 0.471 (0.500) | 0.433 (0.496) | 0.462 (0.499) |
| Income | 37,895 (23,262) | 40,471 (26,185) | 29,437 (20,535) | 29,218 (20,482) |
Table 7.
WTP interval regressions (UK).
| UK – control | UK – treatment | |||
|---|---|---|---|---|
| Variable | Coeff. (std dev) | p-value | Coeff. (std dev) | p-value |
| Constant | 12.686 (6.006) | 0.035 | 6.836 (6.735) | 0.310 |
| SAP benefits | 1.485 (0.545) | 0.006 | 1.570 (0.577) | 0.007 |
| Soil quality concern | 6.698 (1.778) | 0.000 | 3.524 (2.089) | 0.092 |
| Ambiguity tolerance | -3.331 (1.415) | 0.019 | -2.631 (1.609) | 0.102 |
| Pro-social behavior - high | 2.436 (1.565) | 0.120 | 0.067 (1.725) | 0.699 |
| Risk aversion | -0.284 (0.316) | 0.320 | -0.660 (0.348) | 0.058 |
| Time preference | -2.021 (1.566) | 0.197 | -4.615 (1.850) | 0.013 |
| Trust in governance | 0.397 (0.399) | 0.320 | 0.462 (0.466) | 0.322 |
| Trust in stewardship | 0.147 (0.472) | 0.755 | 0.794 (0.588) | 0.177 |
| Age | -0.149 (0.046) | 0.001 | -0.102 (0.055) | 0.064 |
| Gender | -2.076 (1.489) | 0.046 | -0.641 (1.651) | 0.698 |
| Education level – University/Professional | 0.691 (1.943) | 0.722 | 1.834 (2.194) | 0.403 |
| Education level – Post-graduate degree | 1.718 (1.759) | 0.329 | 2.557 (1.938) | 0.187 |
| Income | 9.3E-5 (3.2E-5) | 0.004 | 7.3E-5 (3.4E-5) | 0.030 |
| n | 449 | 433 | ||
| Log-likelihood | -631.628 | -682.096 | ||
| LR chi2 | 85.85 | 68.72 | ||
Table 8.
WTP interval regressions (Spain).
| Spain – control | Spain – treatment | |||
|---|---|---|---|---|
| Variable | Coeff. (std dev) | p-value | Coeff. (std dev) | p-value |
| Constant | 9.887 (6.429) | 0.124 | -2.034 (6.899) | 0.768 |
| SAP benefits | 1.483 (0.695) | 0.033 | 1.898 (0.714) | 0.008 |
| Soil quality concern | 5.432 (3.054) | 0.075 | 3.571 (3.180) | 0.261 |
| Ambiguity tolerance | 0.340 (1.657) | 0.837 | 2.096 (1.639) | 0.201 |
| Pro-social behavior - high | 4.287 (1.779) | 0.016 | 1.732 (1.815) | 0.340 |
| Risk aversion | 0.185 (0.327) | 0.572 | -0.023 (0.346) | 0.947 |
| Time preference | -0.376 (1.637) | 0.818 | -0.661 (1.654) | 0.689 |
| Trust in governance | 1.075 (0.446) | 0.016 | 0.958 (0.414) | 0.021 |
| Trust in stewardship | 0.569 (0.485) | 0.209 | 0.617 (0.451) | 0.182 |
| Age | -0.235 (0.063) | 0.000 | -0.084 (0.063) | 0.182 |
| Gender | -2.124 (1.691) | 0.217 | -0.617 (1.708) | 0.720 |
| Education level – University/Professional | -0.628 (2.151) | 0.770 | -0.474 (2.218) | 0.831 |
| Education level – Post-graduate degree | -0.080 (2.019) | 0.968 | 2.083 (2.004) | 0.299 |
| Income | 5.5E-5 (4.4E-5) | 0.182 | 10E-5 (4.3E-5) | 0.013 |
| n | 462 | 433 | ||
| Log-likelihood | -619.963 | -586.911 | ||
| LR chi2 | 50.47 | 46.97 | ||
Table 9.
Average and median monthly and annual WTP by country and respondents’ group
| Country and group | Monthly Average WTP | Monthly Median WTP | Annual Average WTP | Annual Median WTP |
|---|---|---|---|---|
| UK – control (£) | 18.33 | 18.59 | 220 | 223 |
| UK- treatment (£) | 20.26 | 19.72 | 243 | 237 |
| Spain – control (€) | 24.37 | 24.40 | 292 | 293 |
| Spain – treatment (€) | 23.82 | 23.89 | 286 | 287 |
Table 10.
UK average WTP for control and treatment groups under 18 combination levels
| SAP benefits | Soil quality concern | Pro-social behavior | Trust in governance | Average WTP control |
Average WTP treatment |
Diff. (%) |
|---|---|---|---|---|---|---|
| 5 | 5 | Low | 5 | 41.84 | 31.45 | -10.39 (-24.83) |
| 5 | 5 | High | 5 | 44.27 | 31.38 | -12.88 (-29.10) |
| 1 | 1 | Low | 1 | 7.52 | 9.38 | 1.86 (24.73) |
| 1 | 1 | Low | 10 | 11.09 | 13.70 | 2.61 (23.53) |
| 1 | 1 | High | 1 | 9.96 | 9.44 | -0.52 (-5.22) |
| 1 | 1 | High | 10 | 13.53 | 13.77 | 0.24 (1.77) |
| 1 | 10 | Low | 1 | 67.80 | 40.82 | -26.98 (-39.79) |
| 1 | 10 | Low | 10 | 71.37 | 45.15 | -26.22 (-36.74) |
| 1 | 10 | High | 1 | 70.24 | 40.89 | -29.35 (-41.79) |
| 1 | 10 | High | 10 | 73.81 | 45.22 | -28.59 (-38.73) |
| 10 | 1 | Low | 1 | 20.88 | 23.12 | 2.24 (10.73) |
| 10 | 1 | Low | 10 | 24.45 | 27.45 | 3.00 (12.27) |
| 10 | 1 | High | 1 | 23.32 | 23.19 | -0.13 (-0.56) |
| 10 | 1 | High | 10 | 26.89 | 27.51 | 0.62 (2.31) |
| 10 | 10 | Low | 1 | 81.16 | 54.57 | -26.59 (-32.76) |
| 10 | 10 | Low | 10 | 84.73 | 58.90 | -25.83 (-30.49) |
| 10 | 10 | High | 1 | 83.60 | 54.64 | -28.96 (-34.64) |
| 10 | 10 | High | 10 | 87.17 | 58.96 | -28.21 (-32.36) |
Table 11.
Spain average WTP for control and treatment groups under 18 combination levels
| SAP benefits | Soil quality concern | Pro-social behavior | Trust in governance | Average WTP control |
Average WTP treatment |
Diff. (%) |
|---|---|---|---|---|---|---|
| 5 | 5 | Low | 5 | 41.93 | 33.22 | -6.98 (-20.77) |
| 5 | 5 | High | 5 | 45.57 | 34.95 | -12.35 (-23.30) |
| 1 | 1 | Low | 1 | 9.60 | 7.51 | -2.09 (21.77) |
| 1 | 1 | Low | 10 | 19.50 | 16.13 | -3.37 (-17.28) |
| 1 | 1 | High | 1 | 13.23 | 9.25 | -3.98 (-30.08) |
| 1 | 1 | High | 10 | 23.15 | 17.86 | -5.29 (-22.85) |
| 1 | 10 | Low | 1 | 58.59 | 39.65 | -18.94 (-32.33) |
| 1 | 10 | Low | 10 | 68.50 | 48.27 | -20.23 (-29.53) |
| 1 | 10 | High | 1 | 62.23 | 41.39 | -20.84 (-33.49) |
| 1 | 10 | High | 10 | 72.14 | 50.01 | -22.13 (-30.68) |
| 10 | 1 | Low | 1 | 23.45 | 24.60 | 1.15 (4.90) |
| 10 | 1 | Low | 10 | 33.36 | 33.22 | -0.14 (-0.42) |
| 10 | 1 | High | 1 | 27.09 | 26.33 | -0.76 (-2.81) |
| 10 | 1 | High | 10 | 37.00 | 34.95 | -2.05 (-5.54) |
| 10 | 10 | Low | 1 | 72.44 | 56.74 | -15.70 (-21.67) |
| 10 | 10 | Low | 10 | 82.35 | 65.36 | -16.99 (-20.63) |
| 10 | 10 | High | 1 | 76.08 | 58.47 | -17.61 (-23.15) |
| 10 | 10 | High | 10 | 85.99 | 67.09 | -18.90 (-21.98) |
Disclaimer/Publisher’s Note: The statements, opinions and data contained in all publications are solely those of the individual author(s) and contributor(s) and not of MDPI and/or the editor(s). MDPI and/or the editor(s) disclaim responsibility for any injury to people or property resulting from any ideas, methods, instructions or products referred to in the content. |
© 2024 by the authors. Licensee MDPI, Basel, Switzerland. This article is an open access article distributed under the terms and conditions of the Creative Commons Attribution (CC BY) license (http://creativecommons.org/licenses/by/4.0/).
Copyright: This open access article is published under a Creative Commons CC BY 4.0 license, which permit the free download, distribution, and reuse, provided that the author and preprint are cited in any reuse.


