Submitted:
05 July 2024
Posted:
09 July 2024
You are already at the latest version
Abstract
For quantitative determination of honokiol (HNK) and metformin hydrochloride (M-HCl) by HPLC from formulations and from dissolution studies, a QbD approach using three factors - three levels design was implemented to optimize the chromatographic conditions. To study the impact of each variable on the peak area of both compounds and retention time of last compound eluted, the 3D response surface plots were developed. HNK and M-HCl were separated on a Thermoscientific ODS Hypersyl TM (250 x 4.6 mm, 5 μm) column mantained at 30 C, using 0.02 M acetate buffer (pH = 3) / methanol (15 / 85, v / v) as mobile phase with a flow rate of 1 mL/min. The injected volume was 20 L, and the detection wavelengths were 256 nm for HNK and 236 nm for M-HCl. The validation of proposed method showed a linearity range of 4 – 1200 μg/mL for M-HCl (r2 = 0.9992) and 1 – 300 μg/mL for HNK (r2 = 0.9998), good precision (RSD < 2% for both HNK and M-HCl, in intra- and inter-day studies) and accuracy (mean recovery = 100.09% in the range 99.80 – 100.43% for M-HCl and mean recovery = 100.12% in the range 99.70 – 100.38% for HNK). The environmentally friendly nature of the method was confirmed by the evaluation of the method’s greenness. The proposed method was applied for the determination of HNK and M-HCl from oral dosage forms and in dissolution studies.
Keywords:
QbD optimization
; HPLC
; validation
; greenness
; assay
; dissolution test
; metformin hydrochloride
; honokiol
; oral dosage forms
; diabetes mellitus.
1. Introduction
Diabetes mellitus is a chronic metabolic syndrome, characterized by high blood glucose levels with metabolic imbalance. Diabetes is one of the fastest growing medical conditions and is the health emergency of the 21st century [1]. According to data published by the United States (US) Centers for Disease Control and Prevention (CDC), the incidence of diabetes in 2021 was 11.6% of the total US population. What is more worrying is the high prevalence of prediabetes, so that 38% (97.8 million) of the US population aged 18 years and older have prediabetes, and in the elderly (over 65 years), 1 in 2 people are affected (48.8%) [2]. Worldwide, in 2021, there will be 537 million people (aged 20 to 79) with diabetes. The International Diabetes Federation predicts that in 2030 there will be 642.7 million diabetics, rising to 783.2 million in 2045. The prevalence of diabetes worldwide in 2021 was 10.5%, increasing by about 2% for the 2045 estimate (12.2%) [1]. In light of these data in pharmaceutical research, increasing the therapeutic efficacy of antidiabetic drugs is a priority. This objective can be achieved either by synthesizing innovative molecules (such as, ertugliflozin, remogliflozin, empagliflozin, canagliflozin omarigliptin, vildagliptin) [3] or by incorporating known antidiabetic substances into new formulations with superior bioavailability compared to conventional formulations.
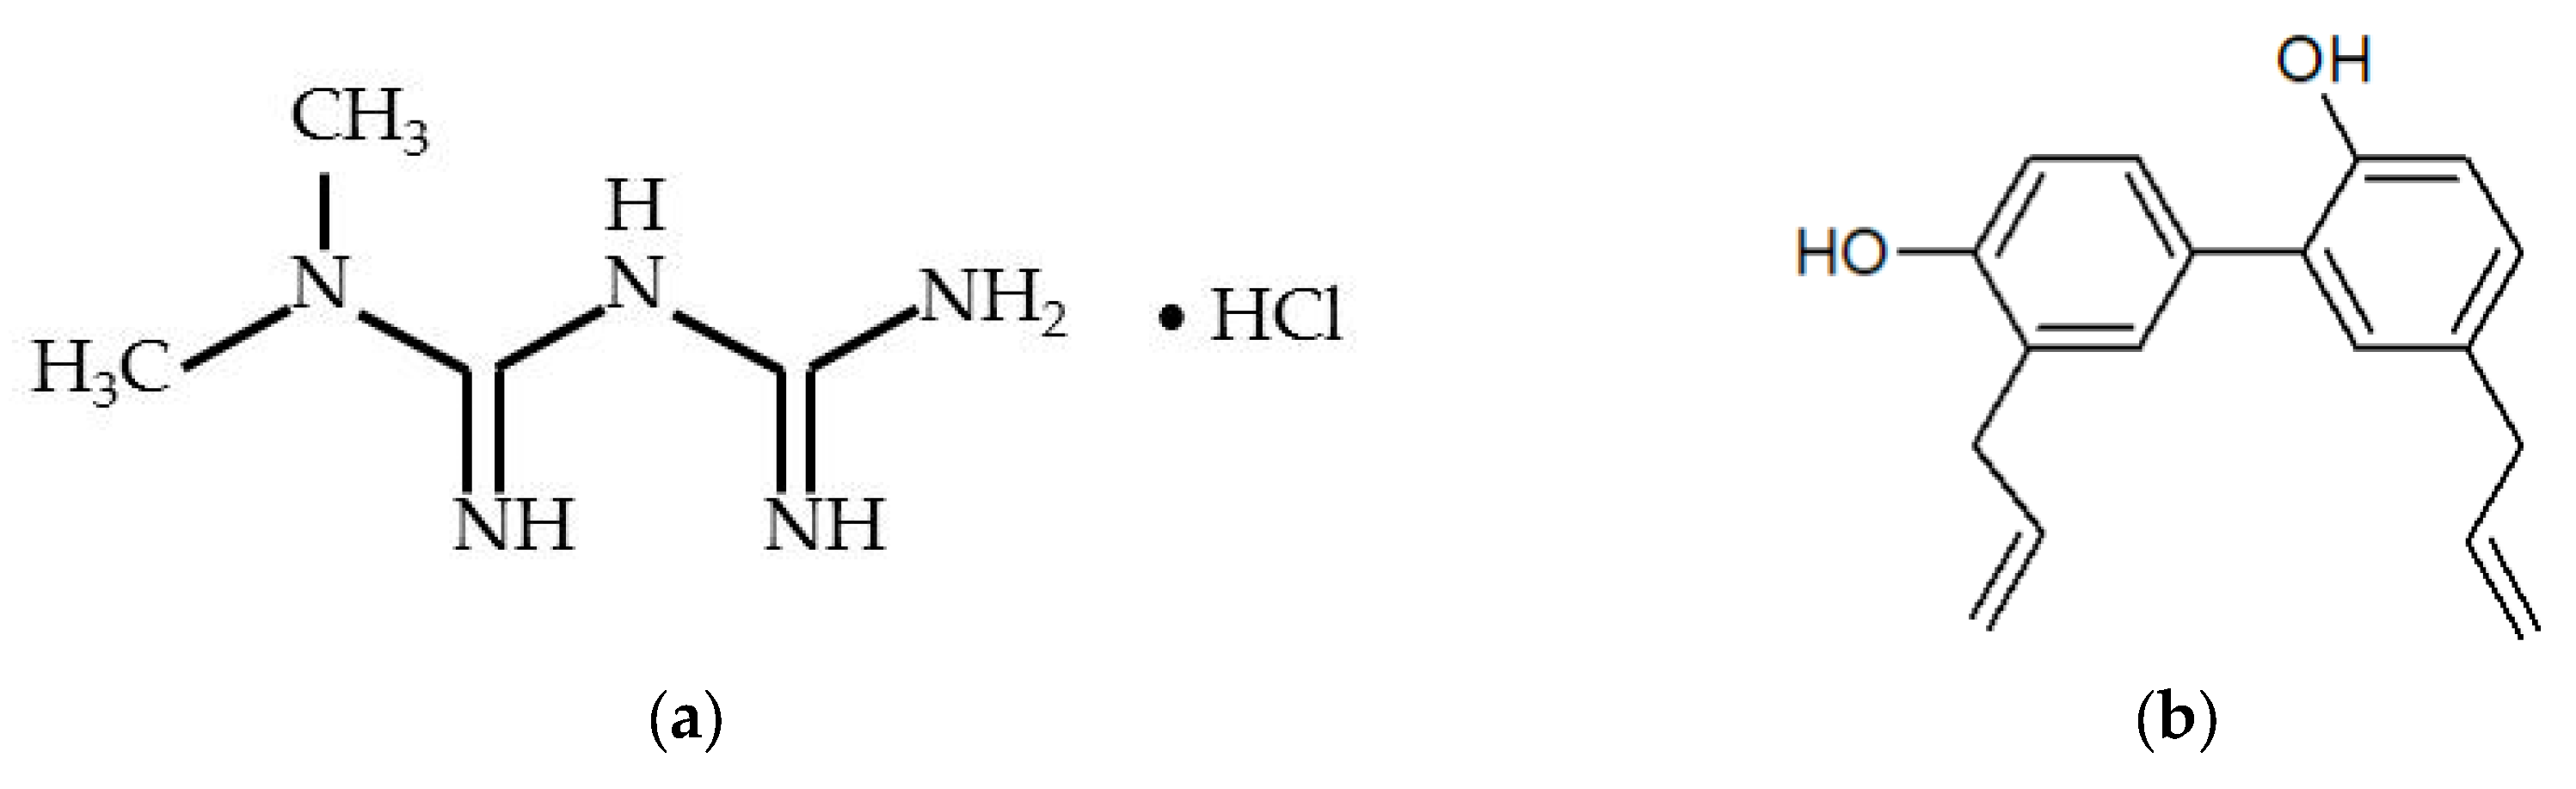
Metformin hydrochloride (M-HCl, Figure 1) or 1,1-dimethylbiguanide or N,N-dimethylimidodicarbonimidic diamide (C4H12ClN5, Mr = 165.62 g/mol) is a small molecule used as first-line therapy in the treatment of type 2 diabetes mellitus [4,5,6]. Growing data from preclinical models and human subjects indicates that there may be advantages in lowering the risk of aging-related illnesses including neurodegeneration. M-HCl is the standard molecule of the biguanide class, being involved in improving insulin sensitivity, reducing glycemic levels and inhibit gluconeogenesis in the liver [3]. Due to these qualities, metformin (as a senotherapeutic agent) has generated great interest from the scientific community and pharmaceutical company to create human anti-aging treatment indications [7,8].
In the literature, we have identified various analytical methods for quantification of M-HCl by UV-Vis spectrophotometry, capillary electrophoresis, potentiometry, gas chromatography, but most are HPLC with various specific working conditions. HPLC methods developed in the last 5 years for the qualitative identification and quantitative determination of M-HCl alone or in combination with other antidiabetic molecules (gliclazide, glimepiride, pioglitazone, dapagliflozin, empagliflozin, sitagliptin, saxagliptin, linagliptin, vildagliptin, teneligliptin, voglibose and repaglinide) have been performed on industrial pharmaceuticals, but also on biological samples (human plasma) [4,9,10,11,12,13,14,15,16].
Honokiol (HNK, Figure 1) or 5,3′-diallyl-2,4′-dihydroxybiphenyl (C18H18O2, Mr = 266.3 g/mol), is obtained from Magnolia officinalis bark (dried bark from the stem and branch, minimum 2% content for the sum of honokiol and magnolol) and Magnolia officinalis flower (steamed and dried, unopened flower, minimum 0.2% content for the sum of honokiol and magnolol) of Magnolia officinalis Rehder et E.H. Wilson [17,18]. As a health perspective, HNK is a promising therapeutic agent in various diseases such as diabetes mellitus / diabetic peripheral neuropathy [19,20,21,22], cancer [23,24,25,26], neurodegenerative diseases, nonalcoholic fatty liver disease, reproductive diseases and arthritis [27,28]. It has antioxidant, antimicrobial, anti-inflammatory and cardioprotective properties [28,29,30]. The antidiabetic action of HNK is achieved by: activates insulin signalling pathways, reducing inflammation and oxidative stress, but also targets Nrf2/ARE (nuclear erythroid 2-related factor 2/antioxidant response element) and PPARG (Peroxisome proliferator-activated receptor gamma) pathways [29]. HNK is a pharmacologic inducer of sirtuin-3 that attenuates oxidant-induced alveolar epithelial cell damage to mitochondrial DNA, so that protection is achieved in a sirtuin-3-dependent manner [31]. HNK also shows beneficial biological effects in metabolic diseases such as type 2 diabetes mellitus, by regulating insulin signaling, as sirtuin-3 activation by HNK leads to improves insulin resistance. Sirtuin-3 activator - HNK is responsible for inducing adipogenesis, increasing the amount of free fatty acid, but also glucose uptake and utilization [20]. HNK also shows biological effects in local cutaneous treatment, having antidermatophytic effects, being a potent antifungal agent [18,32]. HNK shows a low solubility in water at room temperature (50.6 ± 1.2 µg/mL), but pH and temperature increase to 37 °C leads to an increase in solubility to about 75 µg/mL [33].
In Asian countries such as China and Japan, HNK has been quite widely used in gastrointestinal ailments, in reducing anxiety and to treat thrombotic stroke, these being some of the indications in traditional medicine [34,35]. Findings from a Chinese research group demonstrated that a high dose of HNK could considerably lessen the impact of diabetes on Bcrp (breast cancer resistance protein) mRNA expression in the kidney [36]. Acute ischemia-reperfusion injury [37], toxic renal injury [38,39], and chronic tubulointerstitial fibrosis [40] are among the renal disorders against which HKL is protective [41].
HNK with anti-inflammatory, antioxidant and antithrombotic effects was one of the dietary and protective factors for halting or attenuating the progression of autoimmunity and COVID-19 characterized by hypercoagulability and cytokine storm [19].
It has been observed that HNK exhibits anti-tumor activities and suppresses liver fibrosis. HNK offers therapeutic potential for clinical applications for the treatment of hepatic fibrosis as well as for the prevention of liver cirrhosis and liver cancer because it is frequently utilized as a component of herbal medications in clinical practice [42].
Despite the fact that HNK is a tiny molecule with multiple functions, its limited solubility in water frequently reduces its bioavailability. Recent studies suggested that nanotechnology might be a viable tactic to improve phytochemical solubility and stability and extend the in vivo half-life of lipophilic compounds by preventing high levels of degradation during administration in order to get past this natural chemical solubility barrier of HNK [39,40].
After the 2000s in the literature we find analytical methods implemented for the determination of honokiol alone as well as in combination with magnolol or other active molecules in plant products, dried extracts, biological samples, but also modern pharmaceutical formulations that aimed to increase solubility, bioavailability, and the realization of extended-release (XR) pharmaceutical forms. For analytical methods in the literature we have identified high-performance thin-layer chromatography - effect-directed analysis (HPTLC-EDA), a method used for the separation of the neolignans honokiol and magnolol from dietary supplements containing Magnolia extract. According to literature data, HNK can be quantitatively determined by HPLC methods, under easily obtainable working conditions in terms of specific parameters such as stationary phase, mobile phase, detection and flow rate. Most of the methods identified are for HPLC, the majority of the research reported the use of a stationary phase, reversed C18 column (e.g. Agilent, Cosmosil, Eclipse, Waters, Sunfire, Poroshell) in different chromatographic columns, with length between 50 - 250 mm, inner diameter 2.1 - 4.6 mm, and particle size 1.7 and 5 micrometers. Regarding the mobile phase, it is in different compositions and ratios, so that we find 2 or more solvents (such as water, acetonitrile, ethanol, methanol, dichloromethane). The most complex mobile phase consists of a mixture of 4 solvents: methanol/dichloromethane/water/phosphoric acid (81/3/16/0.12, v/v/v/v/v) or a method in which the mobile phase consisted of acetonitrile/methanol/water (20/55/25, v/v/v/v); and the organic modifier ratio of the mobile phase varies between 20% (methanol) and 100% (ethanol) for 6 minutes for a gradient method used for the quantification of honokiol and magnolol in various cosmetic products (baby lotion, vaginal gels, shampoos, lipophilic anti-aging cream, antioxidant ampoule and detox mask). In general, the column was thermostated by varying this parameter between 25 °C and 40 °C, the flow rate of the mobile phase being generally 1 mL/min, with extreme variations between 0.4 and 1.5 mL/min. Detection of honokiol was accomplished by UV spectrophotometry in particular or mass spectrometry, most literature investigations specified UV detection at wavelengths between 225 and 295 nm [33,43,44,45,46,47,48,49,50,51,52,53].
In order to harmonize regulatory decisions to the greatest extent possible across the two regions, the United States Food and Drug Administration (FDA) and the European Medicines Agency (EMA) launched in March 2011 a joint pilot program for the parallel assessment of applications containing Quality by Design, QbD, elements (introduced through the International Council for Harmonisation, ICH, Q8, Q9 and Q10 documents), this being a systematic approach used to ensure the quality of products and processes in pharmaceutical development [54]. The QbD concept implies that the design and development of a product as well as its manufacturing processes are carried out after a thorough understanding of the factors that affect the quality of that product, as well as the implementation of controls that ensure the product's consistent quality throughout its life cycle [55].
Thus, the robustness and reliability of the method can be significantly increased by applying QbD even during the development and optimization of the analytical method, which is known as Analytical Quality by Design (AQbD), in which an extremely important role is played by the Analytical Target Profile (ATP) which is similar with Quality Target Product Profile (QTPP), which provides a broad description of the quality and performance characteristic of the analytical method, such as specificity, sensitivity, precision or accuracy. In this sense, it is important to define the purpose of the proposed analytical method as well as the acceptable range of the Critical Quality Attributes (CQA), in this case the Critical Method Attributes (CMA) i.e. the parameters (such as retention time, peak area, peak height, symmetry factor, tailing factor, the resolution between adjacent peaks, plate count, etc.) that have a significant impact on the quality of this method. In order to understand the factors that influence the performance of the method and for its better improvement, a Method Operable Design Region (MODR) is required in the analytical method development phase [4,55,56].
First, high-risk variables that have an impact on the performance of the analysis method must be identified, that is, those CMPs that refer to the instrument, its operating parameters, the parameters of the meter, the attributes of the materials used, etc. For this, a risk assessment and factor screening studies are performed, then the parameters are to be optimized to increase the performance of the method. By identifying the potential risks that may arise (and their severity), a prioritization of controls can be carried out as well as the mitigation of these risks [4,57,58,59,60,61,62].
In the process of developing the HPLC method through the QbD approach and the preliminary study of risk assessment experiments, the choice of CMPs presents an important aspect. Also, the Ishikawa (fish bone) diagram is used to evaluate the CMPs that present a potential risk on the performance of the method.
In the case of HPLC analysis methods, CMPs that present a high potential risk are those that refer to (i) material (purity, grade, solubility, storage, sampling, etc.), (ii) instrumental parameters (injection volume, flow rate , oven temperature, detection parameters, instrument precision, run time), (iii) column characteristics and preparation (type, length, diameter, particle size, conditioning time etc.), (iv) mobile phase (degassing, filtration, ratio of solvents , organic modifier, buffer type, concentration and pH, etc.) and (v) analyst (weighing, sonication, etc.), as seen in Figure 2 [4,62] .
In the present work, the steps taken for the development and practical application of an HPLC method for the simultaneous determination of HNK and M-HCl are: (i) project initiation, literature search and initial risk assessment, (ii) identification of ATP, CMAs, risk assessment, (iii) method optimization and method development with Design of Experiments (DOE) and MODR (iv) control strategy and risk assessment, (v) method validation and (vi) continuous method monitoring.
The Sustainable Development Goals (SDGs), which the United Nations is implementing from 2015 to 2030, are in line with the global demand that everyone live in peace and prosperity and that the planet be protected. It is helpful to keep in mind that Sustainable Development necessitates the equilibrium of its three pillars, social, economic, and environmental. The 17 established SDGs are interrelated, therefore it is important to remember that achieving one will have an impact on other areas. The application of chemistry for pollution avoidance through appropriate product and process designs, minimizing and ideally completely eliminating the usage and production of hazardous compounds, is known as "Green Chemistry" (GC), it consists of a protocol of 12 principles: 1 – prevention; 2 – atom economy; 3 – less hazardous chemical synthesis; 4 – designing safer chemicals; 5 – safer solvents and auxiliaries; 6 – design for energy efficiency; 7 – use of renewable feedstocks; 8 – reduce derivatives; 9 – catalysis; 10 – design for degradation; 11 – real-time analysis for pollution prevention; and 12 – inherently safer chemistry for accident prevention [63].
The aim of the study is to develop and validate a method for the simultaneous determination by HPLC of the two active substances M-HCl and HNK, formulated in oral solid dosage forms. No analytical method for the determination of the two active substances (M-HCl and HNK) has been identified in the literature. The proposed method is a simple, rapid, economical and environmentally friendly one. The HPLC analytical method can also be used for the individual determination of M-HCl and HNK content, but the initial purpose was for the M-HCl / HNK mixture.
2. Results and Discussion
2.1. Method Development and Optimization Using QbD Approach
After identifying the independent CMPs and their effect on the dependent variables, their optimization in terms of the CMAs was carried out through various preliminary experiments by trial and error.
Initially a mobile phase formed by water/methanol was tried in various reports and it was observed that the symmetry of the peaks is not very good (the peak corresponding to M-HCl has the tailing shape). Another mobile phase used consist from a mixture of acetate buffer / methanol in various reports. At the same pH or the same flow and at the increase of the percentage of methanol in the mobile phase, (i) the retention time (Rt) of HNK decreases between and that of M-HCl increases (Rt has values between 2.178 – 3.889 min for HNK and 3.423 - 7.664 min for M-HCl), (ii) the peak area for both HNK and M-HCl decreases, (iii) in only one case (85% methanol, pH = 3 and flow rate 1.5 mL/min) the resolution is lower than 1.33. For the same percentage of methanol in the composition of the mobile phase and at an increase in the flow rate (i) as expected, the retention times decrease, (ii) the peak areas decrease for both compounds.
Another factor studied was the nature of the organic modifier in the composition of the mobile phase, using acetonitrile instead of methanol. In this case, no significant changes were observed in terms of retention times, but only a weak hypochromic effect that results in a decrease in the areas of the obtained peaks, i.e. a decrease in detection sensitivity. This aspect, as well as the higher cost price and toxicity, led us to keep methanol in the mobile phase composition.
- Method Optimization
For the evaluation of the experimental results and selection of final method conditions, the influence of the ratio between the organic solvent and buffer solution in the composition of the mobile phase, the pH value of the buffer solution and of the flow, we chose a three factors – three levels model. By this approach the method conditions were assessed. As responses we choose the peak area of HNK and M-HCl (to obtain a detection sensitivity as high as possible) and the retention time for M-HCl. Although the resolution between the two chromatographic peaks is usually chosen as the response (to highlight the fact that there are no overlaps between the two compounds), we took into account the fact that in the 26 from 27 of the tests carried out the resolution is greater than 1.5, we chose as response the retention time of the second eluted compound (M-HCl) because a shorter retention time means a shorter time for the analysis. The selection of the CMPs actually affecting the method performance was optimized using a three factors at three levels, i.e., low (−1), intermediate (0), and high (+1) levels, on the basis of the factor screening studies. The same standard concentration was used for all experimental runs, which were analyzed for method CMAs. The experimental values and the design matrix are presented in Table 1.
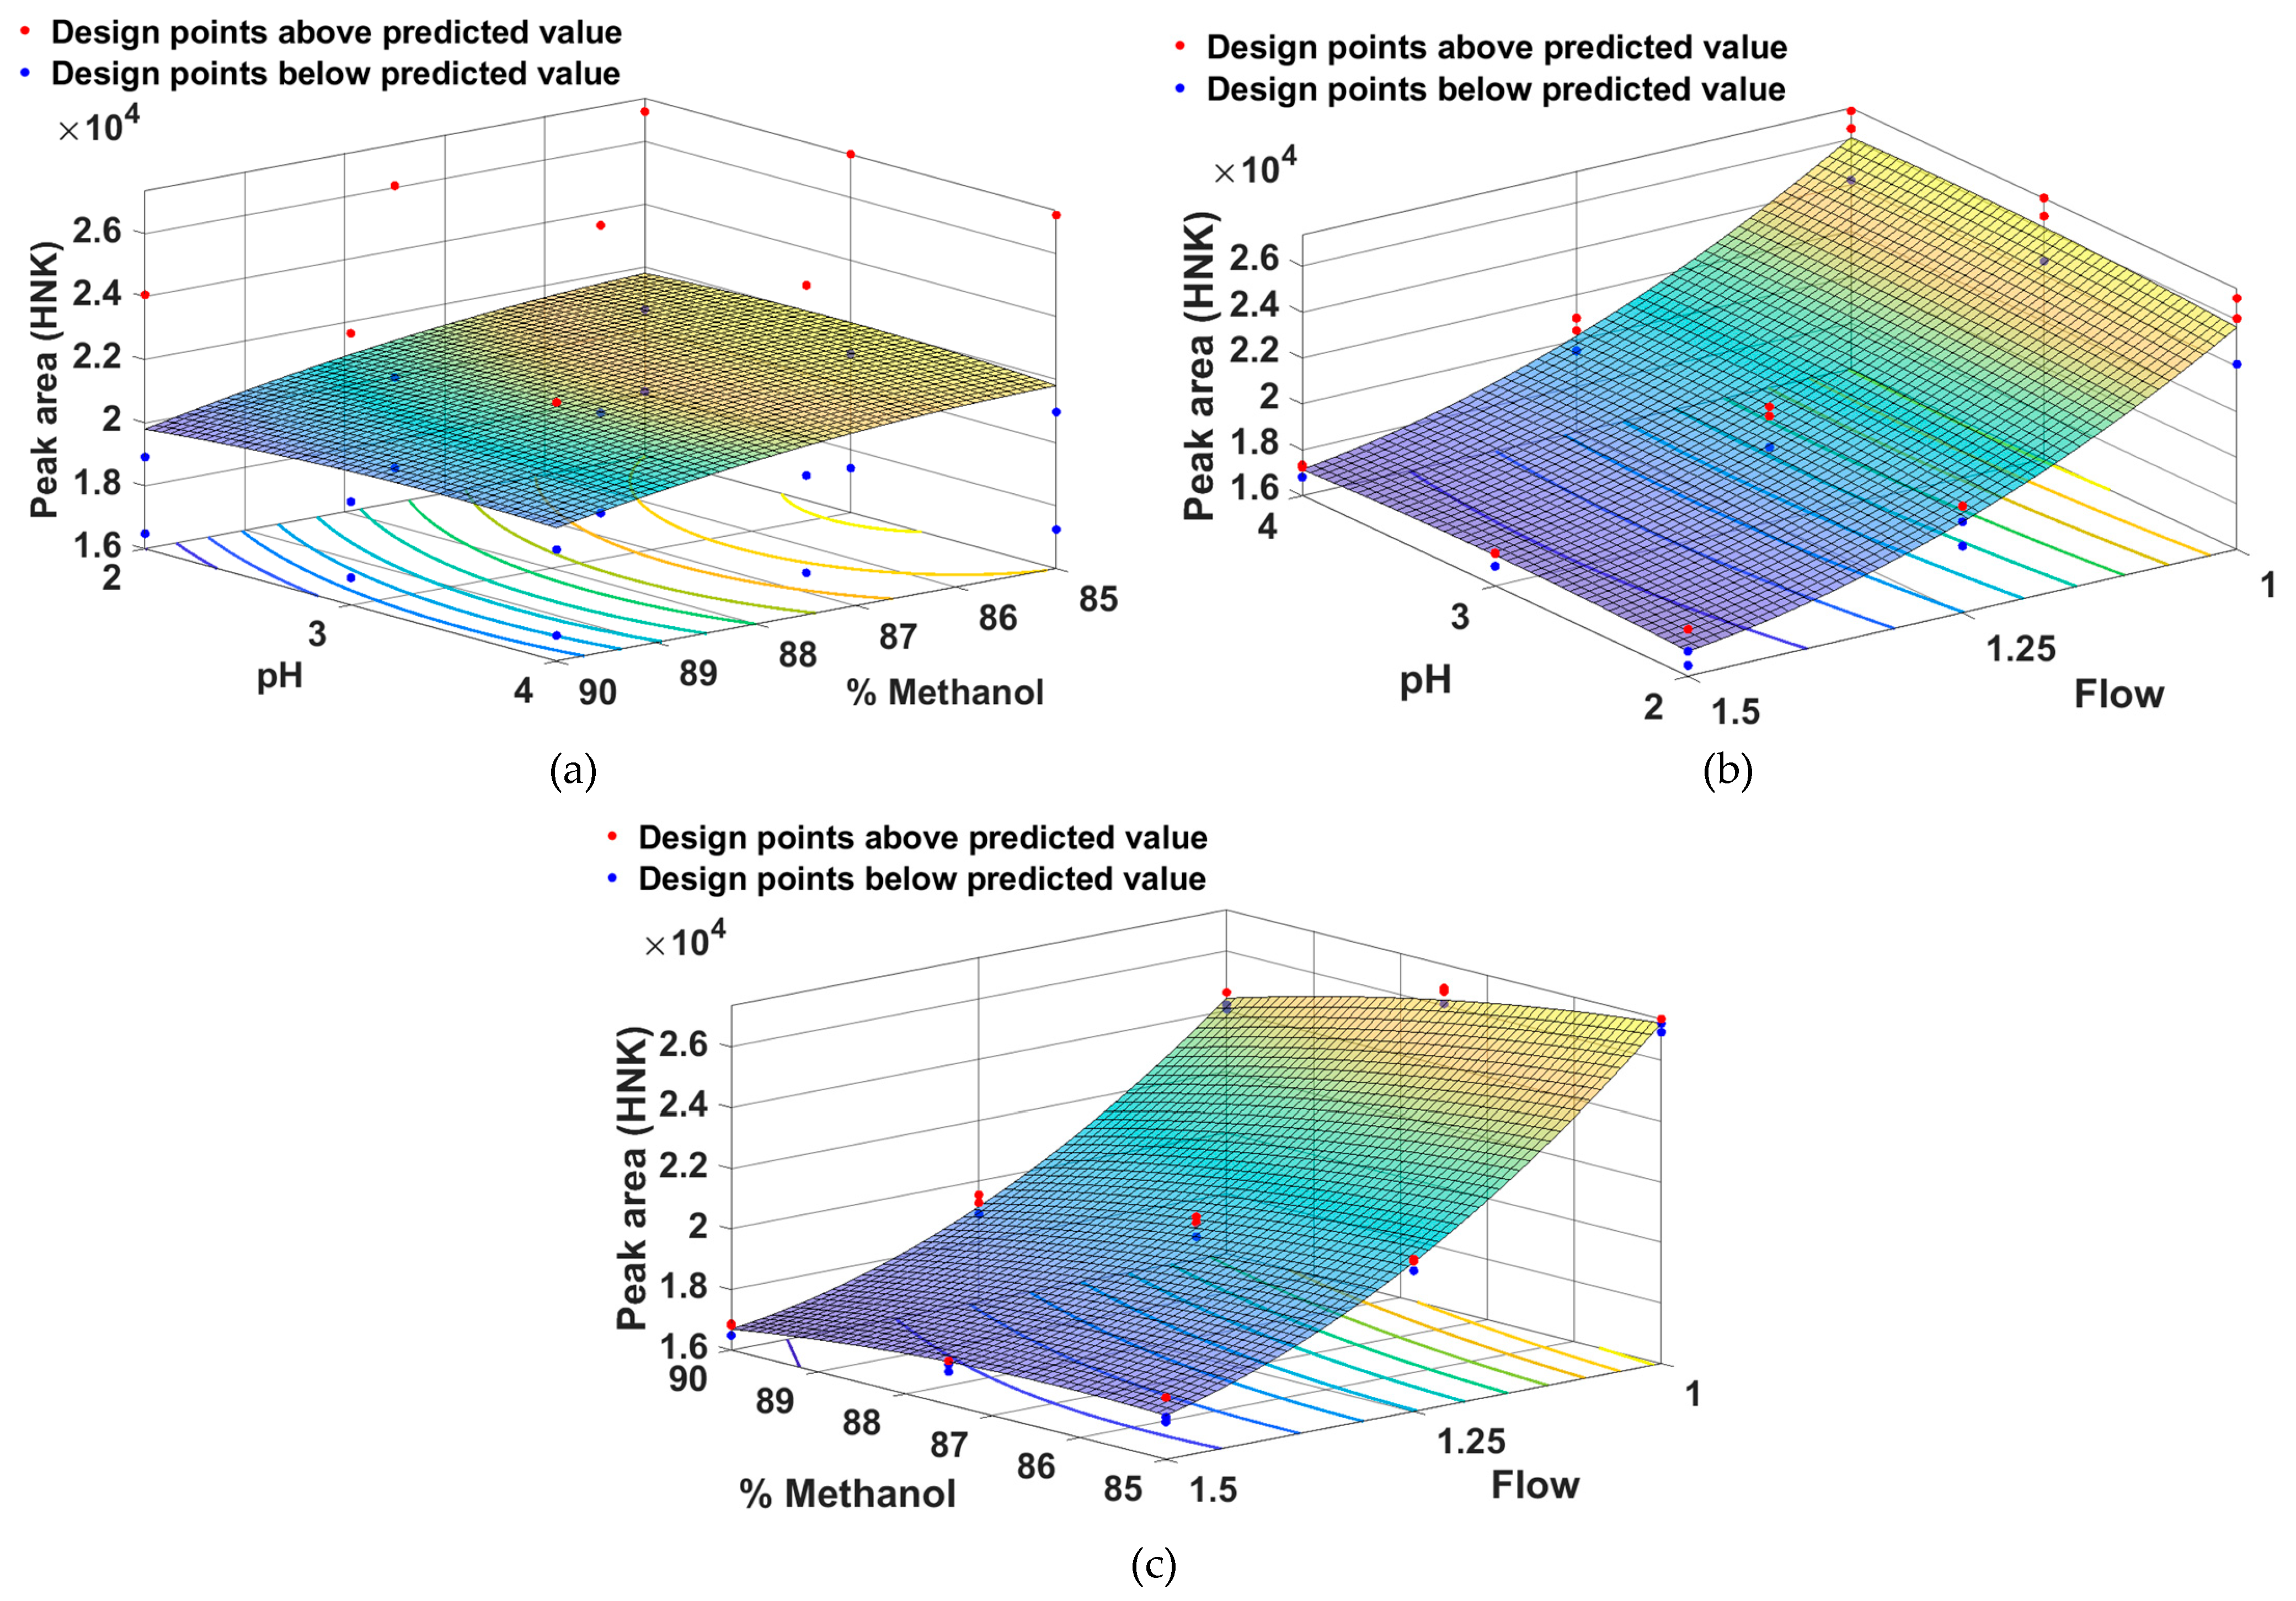
The response surface study type, a three factors – three levels with 27 runs, was used. The proposed experimental design was applied and the evaluation of mobile phase composition, pH of buffer and flow were performed against the three responses, peak area of HNK and M-HCl, and retention time of M-HCl; the results are summarized in Table 2 and Figure 3, respectively. The results of the calculation of the second-order polynomial exploring quadratic response surfaces are presented in Table 2 and Table 3, equations (1), (2), (3) and Figure 3, Figure 4, Figure 5 and Figure 6.
| Peak area (HNK) | Peak area (M-HCl) | Rt (M-HCl) | |||||||
|---|---|---|---|---|---|---|---|---|---|
| Coefficient | t-Stat | P-value | Coefficient | t-Stat | P-value | Coefficient | t-Stat | P-value | |
| β0 | –222525.41 | –1.849 | 0.082 | –1904154* | –3.0572 | 0.007 | 214.03 | 2.0114 | 0.060 |
| β1 | 8281.01* | 3.025 | 0.007 | 46999* | 3.3178 | 0.004 | –4.9477 | –2.0444 | 0.056 |
| β2 | –1946.43 | –0.776 | 0.449 | 4826.5 | 0.37163 | 0.715 | –2.6944 | –1.2144 | 0.241 |
| β3 | –143856.08* | –13.76 | 1.207×10⁻¹⁰ | –112896.35* | –2.0866 | 0.049 | 2.9691 | 0.32122 | 0.752 |
| β4 | 44.07 | 1.597 | 0.129 | –54.803 | –0.38366 | 0.706 | 0.0336 | 1.3768 | 0.186 |
| β5 | 810.72* | 7.343 | 1.149×10⁻⁶ | 1814.5* | 3.1756 | 0.005 | –0.1829 | –1.874 | 0.078 |
| β6 | –359.50 | –1.303 | 0.210 | 1346.6 | 0.94272 | 0.359 | –1.6527* | –6.7722 | 0.000 |
| β7 | –55.91* | –3.581 | 0.002 | –286.18* | –3.5417 | 0.002 | 0.0305* | 2.2092 | 0.041 |
| β8 | –55.91* | –2.302 | 0.034 | –304.32 | –0.60258 | 0.555 | 0.3233* | 3.7469 | 0.001 |
| β9 | 22597.51* | 14.47 | 5.456×10⁻¹¹ | –29485* | –3.649 | 0.001 | 5.5324* | 4.0076 | 0.001 |
| Run | Run order | Factor 1 | Factor 2 | Factor 3 | Response 1 | Response 2 | Response 3 |
|---|---|---|---|---|---|---|---|
| Methanol (%) |
pH | Flow (mL/min) |
Peak area (HNK) |
Peak area (M-HCl) |
Rt M-HCl (min) |
||
| 1 | 1 | 85 | 2 | 1 | 26934.4 | 36288.5 | 5.170 |
| 2 | 13 | 87.5 | 2 | 1 | 26051.8 | 35084.3 | 5.651 |
| 3 | 3 | 90 | 2 | 1 | 24065.6 | 29777.44 | 6.537 |
| 4 | 5 | 85 | 2 | 1.25 | 20652.0 | 32147.4 | 4.125 |
| 5 | 17 | 87.5 | 2 | 1.25 | 19963.5 | 30535.5 | 4.555 |
| 6 | 7 | 90 | 2 | 1.25 | 18914.8 | 25817.9 | 5.212 |
| 7 | 9 | 85 | 2 | 1.5 | 18052.4 | 22994.3 | 3.896 |
| 8 | 15 | 87.5 | 2 | 1.5 | 17096.1 | 20943.2 | 4.381 |
| 9 | 11 | 90 | 2 | 1.5 | 16482.0 | 20862.1 | 5.132 |
| 10 | 21 | 85 | 3 | 1 | 27366.9 | 37076.2 | 5.167 |
| 11 | 25 | 87.5 | 3 | 1 | 26577.8 | 36215.17 | 5.702 |
| 12 | 23 | 90 | 3 | 1 | 24623.7 | 30006.2 | 6.535 |
| 13 | 20 | 85 | 3 | 1.25 | 21042.0 | 30104.6 | 4.119 |
| 14 | 27 | 87.5 | 3 | 1.25 | 20627.6 | 31948.4 | 4.553 |
| 15 | 18 | 90 | 3 | 1.25 | 19280.3 | 25998 | 5.228 |
| 16 | 22 | 85 | 3 | 1.5 | 17406.8 | 22245.6 | 3.423 |
| 17 | 26 | 87.5 | 3 | 1.5 | 17451.7 | 21623.1 | 3.770 |
| 18 | 24 | 90 | 3 | 1.5 | 16868.4 | 20969.6 | 4.327 |
| 19 | 2 | 85 | 4 | 1 | 27219.6 | 35458.15 | 6.020 |
| 20 | 14 | 87.5 | 4 | 1 | 26458.6 | 34020.9 | 6.725 |
| 21 | 4 | 90 | 4 | 1 | 24217.1 | 28466 | 7.664 |
| 22 | 6 | 85 | 4 | 1.25 | 20970.1 | 31024.5 | 4.105 |
| 23 | 19 | 87.5 | 4 | 1.25 | 20429.2 | 32885.2 | 4.500 |
| 24 | 8 | 90 | 4 | 1.25 | 19543.6 | 24956.4 | 6.292 |
| 25 | 10 | 85 | 4 | 1.5 | 17241.7 | 23676.9 | 3.426 |
| 26 | 16 | 87.5 | 4 | 1.5 | 17337.4 | 21837 | 3.783 |
| 27 | 12 | 90 | 4 | 1.5 | 16816.4 | 20120.31 | 4.293 |
Next, to predict the cumulative influence of the independent factors, the values obtained for the HNK peak area, respectively M-HCl and the retention time of M-HCl from the quadratic polynomial equations were used. The equations for the response surfaces are:
Peak area (HNK) = –222525.41 + 8281.01⋅A – 1946.43⋅B – 143856.08⋅C + 44.07⋅A⋅B + 810.72⋅A⋅C – 359.50⋅B⋅C – 55.91⋅A2 – 55.91⋅B2 + 22597.51⋅C2
Peak area (M-HCl) = –1904154 + 46999⋅A + 4826.5⋅B – 112896.35⋅C – 54.803⋅A⋅B + 1814.5⋅A⋅C + 1346.6⋅B⋅C – 286.18⋅A2 – 304.32⋅B2 – 29485⋅C2
Rt (M-HCl) = 214.03 – 4.9477⋅A – 2.6944⋅B + 2.9691⋅C + 0.0336⋅A⋅B – 0.1829⋅A⋅C – 1.6527⋅B⋅C + 0.305⋅A2 + 0.3233⋅B2 + 5.5324⋅C2
In these equations A is the percentage of methanol, B is the pH of the buffer from the mobile phase and C is the flow (mL/min) of the mobile phase.
In the case of the peak area for HNK given by the Equation (1): (i) if the pH (B) and flow rate (C) are kept constant, with an increase in the percentage of methanol the value (+8281.01⋅A – 55.91⋅A2) decreases, (ii) if the percentage of methanol (A) and the pH (B) are kept constant, when the flow rate increases the value (–143856.08⋅C + 143856.08⋅C2) decreases, (iii) ) if it is maintained constant the percentage of methanol (A) and the flow rate (C), with an increase in pH the value (– 1946.43⋅B– 5 5.91⋅B2) decreases. All this indicates a decrease in the peak area for HNK. Regarding the combined effect of the variables, the cumulative influence of the methanol percentage and the pH (A⋅B) respectively of the methanol percentage and the flow rate (A⋅C) lead to an increase in the area of the HNK peak and in the case of the pH and the flow rate (B⋅C) will reduce the area of the HNK peak.
In the case of the peak area for M-HCl given by the Equation (2): (i) if the pH (B) and flow rate (C) are kept constant, with an increase in the percentage of methanol the value (+46999⋅A – 286.18⋅A2) decreases and the area of the peak will decrease, (ii) if the percentage of methanol (A) and the pH (B) are kept constant, when the flow rate increases the value (–112896.35⋅C – 29485⋅C2) increase and the area of the peak will increase, (iii) ) if it is maintained constant the percentage of methanol (A) and the flow rate (C), with an increase in pH the value (+4826.5⋅B – 304.32⋅B2) increase and the area of the peak will increase. Regarding the combined effect of the variables, the cumulative influence of the methanol percentage and the pH (A⋅B) leads to a decrease in the peak area, in the case of the methanol percentage and the flow rate (A⋅C) respectively in the case of the pH and the flow rate (B⋅C), an increase in the area of the M-HCl peak is obtained.
In the case of the retention time for M-HCl given by the Equation (3): (i) if the pH (B) and flow rate (C) are kept constant, with an increase in the percentage of methanol the value (–4.9477⋅A + 0.305⋅A2) increase and the retention time will increase, (ii) if the percentage of methanol (A) and the pH (B) are kept constant, when the flow rate increases the value (+2.9691⋅C + 5.5324⋅C2) increase and the retention time will increase, (iii) ) if it is maintained constant the percentage of methanol (A) and the flow rate (C), with an increase in pH the value (–2.6944⋅B + 0.3233⋅B2) decrease and the retention time will decrease. Regarding the combined effect of the variables, the cumulative influence of the methanol percentage and the pH (A⋅B) leads to a increase in the retention time, in the case of the methanol percentage and the flow rate (A⋅C) respectively in the case of the pH and the flow rate (B⋅C), an decrease in the retention time of the M-HCl is obtained.
Using an ANOVA statistical study the proposed quadratic model was validated. The predicted R2 value is given in Table 3, the values obtained for all three factors (Peak Area for HNK, Peak area for M-HCl and Retention time for M-HCl) are very close to the value of adjusted R2 valves; the difference between R2 and adjusted R2 was less than 0.02.
To observe the combined influence of the independent factors (methanol percentage, pH and flow) on the responses (HNK peak area, M-HCl peak area and M-HCl retention time) the response surface diagrams were constructed (Figure 3, Figure 4 and Figure 5).
In the response surface diagrams, the X and Y axes indicate the independent variables (methanol percentage, pH and flow rate), the vertical axis indicates the response obtained for the dependent variable (HNK peak area, M-HCl peak area and respectively M-HCl retention time) and the contour lines show how the combined impact of the two variables changes on the response. The fact that these contour lines show the curvilinear relationship between the independent variables can be explained by the fact that these variables have a non-linear effect on the response, as can be seen from Equations (1), (2) and (3).
From Figure 3 it can be seen that the peak area for HNK is greater for a low percentage of methanol combined with a medium pH (a), a low flow rate combined with a medium pH (b) and a low percentage of methanol combined with a low flow rate.
From Figure 4 it can be seen that the peak area for M-HCl is greater for a low percentage of methanol combined with a medium pH (a), a low flow rate combined with a medium pH (b) and a low percentage of methanol combined with a low flow rate.
From Figure 5 it can be seen that the retention time of M-HCl is smaler for a low percentage of methanol combined with a medium pH (a), a high flow rate combined with a medium pH (b) and a low percentage of methanol combined with a high flow rate.
In order to find the optimal chromatographic conditions, a numerical optimization was carried out along with the graphic one, the objective of which was to reduce the retention time of M-HCl (and thus the duration of the analysis) as much as possible and to increase the areas of the peaks corresponding to HNK as much as possible and M-HCl (to obtain a detection sensitivity as high as possible), and the desirability should be as high as possible. The results obtained are represented in Table 4 and Figure 6.
Analyzing the data presented in Table 4 and Figure 6, it is observed that, following the optimization of this method, the ideal chromatographic conditions are 85% methanol in the composition of the mobile phase, the acetate buffer system with pH = 3 and a flow rate of mobile phase of 1 mL/min.
The final chromatographic conditions for HNK and M-HCl determination by are shown in Table 5.
Figure 7 shows the chromatograms obtained under the optimized conditions of the method, at the wavelengths corresponding to the absorption maxima of the two compounds (236 nm for M-HCl and 256 nm for HNK).
2.2. Method Validation
2.2.1. Linearity
Linearity of the proposed method was evaluated according to the ICH guidelines Q2 (R1) and Q2 (R2) [57,58]. A number of three sets of working solutions were prepared for the study of linearity over the concentration range 4 – 1200 μg/mL for M-HCl and 1 – 300 μg/mL for HNK. Each of these samples were analyzed under the mentioned conditions and, from the chromatograms obtained, the area of the peaks corresponding to M-HCl and HNK were determined. M-HCl showed linearity in the concentration range of 4 – 1200 μg/mL, (r2 = 0.9992), and HNK showed linearity in the concentration range of 1 – 300 μg/mL, (r2 = 0.9998). The regression equations obtained were PA = 90.3852 × C + 901.5302 and PA = 51.1980 × C + 67.5673, where PA is peak area and C is concentration in μg/mL for M-HCl and HNK respectively (Figure 8). These equations were used to determine the amount of M-HCl and HNK present in the samples.
2.2.2. Limits of Detection (LOD) and Limits of Quantification (LOQ)
For M-HCl, the detection and quantification limits were calculated using the standard deviation of the response (σ = 90.3852) and the slope of the calibration curve (S = 941.1741):
LOD = (3.3 × 941.1741) / 90.3852 = 34.36 μg/mL
LOQ = (10 × 941.1741) / 90.3852 = 104.13 μg/mL
For HNK, the detection and quantification limits were calculated using the standard deviation of the response (σ = 90.3852) and the slope of the calibration curve (S = 941.1741)
LOD = (3.3 × 74.4541) / 51.1980 = 4.80 μg/mL
LOQ = (10 × 74.4541) / 51.1980 = 14.54 μg/mL
2.2.3. Precision and Accuracy
To examine the system precision, the same solution containing M-HCl (400 μg/mL) and HNK (100 μg/mL), at the concentrations of interest, was injected 6 times to obtain as many chromatograms. From the obtained chromatograms, the peak areas were measured, and the mean value, the standard deviation (SD) and the relative standard deviation (RSD%) were calculated. The obtained RSD% value is less than 2% (Table 6).
The repeatability and the intermediate precision were evaluated by injecting three different concentrations (320, 400 and 480 μg/mL) for M-HCl and (80, 100 and 120 μg/mL) for HNK. For repeatability (intra-day) determination, sets of three replicates of the three concentrations were analyzed on the same day. For intermediate precision (inter-day), three replicates were analyzed on three different days. In both cases, the relative standard deviation (RSD%) is less than 2%, indicating that the method was precise (Table 7).
In order to estimate the accuracy, this was determined by performing the recovery experiments for three different solutions at three concentration levels (320, 400 and 480 μg/mL) for M-HCl, and (80, 100 and 120 μg/mL) for HNK respectively, and the final recovery was calculated. The mean recoveries are 100.09% on the range 99.8 - 100.43% for M-HCl and 100.12% on the range 99.70 – 100.38% for HNK respectively (Table 8).
Because in addition to the quantitative determination of M-HCl and HNK from tablets, the application of the method to dissolution studies is also considered, the accuracy was also studied at lower concentrations, being calculated in terms of percent relative error (RE%) using Equation (11). Keeping in account the fact that the calculated value for LOQ is 104.13 μg/mL (M-HCl) and 14.54 μg/mL (HNK), the accuracy was thus calculated for the range 108 - 1200 μg/mL (M-HCl) and 27 – 300 μg/mL (HNK), with the mean values of three replicates (Table 9 and Table 10). Since the mean recovery is 100.96% (M-HCl) and 100.26% (HNK) in the range 97.14 – 103.34% (M-HCl) and 97.78 – 101.90% (HNK) results that the method is accurate over the entire measured range. Analyzing the data presented in Table 9; Table 10 it is observed that the mean percent error (%RE) calculated with equation (11) is 1.71% for M-HCl and 0.83% for HNK and recovery values of less than 98% for M-HCl are obtained at low concentrations 108 µg/mL, which is 27% of the concentration of interest (400 µg/mL) and at high concentrations 1080 µg/mL and 1140 µg/mL, which are 270% and 285% of the concentration of interest (400 µg/mL), respectively, as a result, they show an acceptable variation in dissolution studies. At high concentrations of M-HCl (1080 µg/mL and 1140 µg/mL), the dilution factor comes into play and thus eliminates a small recovery for a high concentration. In the case of HNK recoveries below 98% are found only at low concentrations, at 27 µg/mL and 36 µg/mL, which represent 27% and 36% respectively of the concentration of interest (100 µg/mL).
2.3. Stability Studies for HNK and for M-HCl / HNK Solutions
Solutions of HNK with concentration of 90 and 300 μg/mL, M-HCl / HNK with concentration of 360 / 90 μg/mL and 1200 / 300 μg/mL were analyzed under the method conditions at intervals of: 0, 24 and 48 hours after preparation, the solutions being stored in the refrigerator (2 – 8 °C), at room temperature (20 – 25 °C) and in a water bath at 37 °C. For photostability we used the M-HCL / HNK mixture only at room temperature (20 – 25 °C) and on water bath at 37 °C. By integrating the obtained chromatograms, the area of the peaks (Table 11, Table 12 and Table 13) corresponding to M-HCl (236 nm) and HNK (256 nm) were determined, then, using the equation of the regression line, the concentration in M-HCl and HNK were calculated.
From the stability studies it is found that:
- for HNK the recovery decreases after 24 hours with 0.46%, 0.72% and 0.93% and after 48 hours with 0.82%, 1.12% and 1.61% (for a concentration of 90 μg/mL), with 1.1%, 1.49% and 1.58% and after 48 hours with 1.37%, 1.66% and 2.16% (for a concentration of 300 μg/mL), in refrigerator, at room temperature and on the water bath respectively;
- for M-HCL / HNK mixture, the recovery of HNK are not changed with more than 1% after 24 hours or 48 hours for any studied concentration (90 or 300 μg/mL), in refrigerator, at room temperature and on the water bath respectively and the recovery of M-HCl are changed with more than 1% after 48 hours only for a concentration of 1200 μg/mL) on the water bath;
- for M-HCL / HNK mixture, in the case of photostability, the recovery are changed with more than 1% after 48 hours for 1200 / 300 µg/mL M-HCl / HNK (unprotected for light) and 1200 M-HCl (protected for light).
Keeping into account these aspects and the fact that the maximum time of HPLC analysis from forms or from dissolution time is not great than 24 hours, a simple conclusion can be achieved: the solutions containing M-HCl and HNK can be used without any problem for quantitative analysis of M-HCl and HNK alone or in mixture from different pharmaceutical forms or in dissolution studies. If the samples will be analyzed in a few hours, it is acceptable to work at room temperature. If the samples will be analyzed after 6 hours we recommend to keep the samples in refrigerator after these are obtained until the HPLC analysis.
2.4. Determination of HNK and M-HCl Content from Oral Dosage Forms
These two studied compounds were quantified as follows: M-HCl alone from industrial tablets with conventional and modified releases, HNK alone from industrial capsules and both M-HCl and HNK from prolonged-release tablets formulated in our laboratory. In all cases, the identification of HNK and M-HCl was carried out by comparing the retention times of the peaks obtained in the chromatogram of the sample with those obtained during the validation of the method for standard solutions 3.935 ± 0.197 min (HNK), 5.722 ± 0.286 min (M-HCl) and by comparing the absorption spectra of the peaks in the chromatogram of the sample with the standard spectra of the two compounds obtained under the same analysis conditions. For the quantitative determination, the area of the peaks corresponding to HNK and M-HCl was used to calculate the content of HNK and M-HCl respectively in the studied pharmaceutical forms with the help of the calculation equations mentioned for each type of product.
The experimental results obtained by this method of recovery M-HCl from different types of tablets are presented in Table 14. From Table 14 it can be seen that 5 formulations of industrial tablets with different releases have been studied by determining the percent content - C (%). In a previous study on an HPLC method developed and validated exclusively for M-HCl, the percent content - C1 (%) ranged from 97.78% to 99.20% [4]. It is found that between the both HPLC methods, the percentage content found differs by less than 1%, so that for CP - 1 we have the smallest difference (0.03%) and for CP - 2 it is the maximum (0.71%). The percent content in tablets is calculated using equation (12).
The experimental results obtained by this method of recovery HNK from different capsules are presented in Table 15. The percent content in capsules is calculated using equation (13).
The experimental results obtained by this method of recovery M-HCl and HNK from prolonged-release tablets are presented in Table 16. The percent content in tablets is calculated using equations (14 and 15).
Analyzing the data in Table 14, Table 15 and Table 16 it is found that all the pharmaceutical products analyzed have a percentage content of M-HCl in the range 98.28 – 99.91% (Table 14); for HNK in the range 97.70 - 100.14% (Table 15), and for the last table of M-HCl / HNK prolonged release tablet (Table 16) have a percentage content of M-HCl in the range 99.62 – 100.99 and for HNK (100.26 – 100.63), for a percentage deviation of ± 5% [64].
2.5. Dissolution Studies
Prolonged-release tablets (400 mg M-HCl / 100 mg HNK tablets) were used in the dissolution test for tablets.
In the case of prolonged-release tablets with 400 mg M-HCl and 100 mg HNK, it is observed that at the first sampling in simulated gastric fluid with pH = 1.2 has a release of M-HCl from the P-1 sample of 28.42% (M-HCl), 0.32% (HNK), and in the case of the P-2 sample of 19.33% (M-HCl), 0.13% (HNK), which corresponds to the acceptance criteria of the European Pharmacopoeia, 11th edition [17], by preventing the occurrence of „dose dumping”. After 2 hours, in the simulated gastric fluid with pH = 1.2, formulation P-1 has a maximum release of 59.50% (M-HCl), 1.86% (HNK), respectively 52.62% (M-HCl) and 2.01% (HNK) in P-2 (Figure 9).
The 2nd specification point of the dissolution test will be defined by the release of approximately 50% of M-HCl from prolonged-release tablets, the second point is achieved after 2 hours in simulated gastric fluid with pH=1.2. In the case of HNK, the second point is achieved after 7 hours in simulated intestinal fluid, pH = 6.8 for both formulation (P-1 – 67.17% and P-2 – 56.28%). The final specification point stipulated in the conditions of European Pharmacopoeia, 11th edition it is the assurance of complete release, which is understood to be at least 80% achieved in a simulated intestinal fluid pH = 6.8. For the P-1 test, this point is reached after 4 hours for M-HCl (83.25%) and 9 hours for HNK (93.26%), with a maximum release of 99.27% (M-HCl), 98.66% (HNK) at the end of the test, and for the P-2 we have released 83.04% (M-HCl) after 7 hours, 90.76% (HNK) after 9 hours with a maximum 98.20% (M-HCl), 98.83% (HNK) after 12 hours (Figure 9). The two samples analyzed are compliant and fall into the release profile for prolonged-release dosage forms, according to „2.9.3. Dissolution test for solid dosage forms” and „5.17. Recommendations on methods for dosage forms testing – 5.17.1 Recommendations on dissolution testing” from European Pharmacopoeia, 11th edition [17].
2.6. Greenness of the Method
2.6.1. Evaluation of the Greenness of the Proposed Method (Analytical Eco-Scale, AES)
The Analytical Eco-Scale is the score obtained by subtracting the total penalty points from the maximum of 100 points (ideal score). The score obtained from the analytical method can be higher than 75, which represents excellent green analysis, higher than 50, but up to 75 represents acceptable green analysis and a final score lower than 50 represents inadequate green analysis [63,65]. In the case of the developed and validated analytical method it was proposed to evaluate the green characteristics. The score obtained was 77 points out of a maximum total of 100 points, with 23 penalty points due to the use of the solvents methanol and glacial acetic acid for the pH = 3 buffer system required for the mobile phase (10 penalty points), the need to use ethanol for sampling dilution step (6 penalty points) and the waste obtained (6 penalty points) and one point for the instrument part. Replacing the polar organic solvent, i.e. mobile phase methanol with acetonitrile, would have resulted in the same penalty score, with an analytical eco-scale score of 77 points for the developed method, which means an excellent green method (Table 17).
2.6.2. Analytical GREEnness Metric (AGREE)
Based on the twelve principles, AGREE is a metric method for evaluating how green analytical procedures are, is a comprehensive, flexible, easy to interpret, and easy to perform (Figure 10 and Table 18).
From the information presented above, it can be seen that for principle 10, which concerns the use of sustainable reagents, we have a score of 0 (red colour), because the methanol used in the analysis is not from organic sources, but the score can be improved by using methanol from renewable sources, so the score value becomes 0.5 for this principle. A lower score was also obtained for principle 11 (intense orange), by using methanol as solvent of the mobile phase, being toxic, but also in the amount of 8.5 mL per analysis. In general, the use of solvents methanol, ethanol, water, and acids such as acetic acid in analytical chemistry classifies them as greenness [67]. Regarding principles 3 and 5, it can be seen that automation of the process leads to the development of a greener method, and for principle 9, the energy consumption for HPLC is ≤ 1.5 kWh per sample. The method developed and validated for M-HCl and HNK, with a total score of 0.62 (maximum 1) falls under the green method.
3. Materials and Methods
3.1. Chemicals and Reagents
Honokiol (98% purity) from plant (C18H18O2; Mr = 266.3) was purchased from New Natural Biotechnology (Shanghai, China); metformin hydrochloride or 1,1-Dimethylbiguanide hydrochloride (97% purity, C4H11N5·HCl; Mr = 165.6) was purchased from Sigma Aldrich Chemie Gmbh (Steinheim, Germany), sodium acetate (CH3COONa, ≥ 99.0%) was obtained from Silal Trading SRL (Bucharest, Romania), potassium dihydrogen phosphate (KH2PO4, ≥ 99,5%) was obtained from Utchim SRL (Râmnicu Vâlcea, Romania), potassium chloride (KCl, ≥ 99.0%) was obtained from Chemical Company S.A. (Iasi, Romania), glacial acetic acid (CH3COOH, 99.9%) was obtained from Chimreactiv SRL (Bucharest, Romania), acetic acid ≥ 99.8% - ACS reagent obtained from Honeywell Fluka (Seelze, Germany), hydrochloric acid (HCl, ≥ 37,0%) was obtained from Chemical Company S.A. (Iasi, Romania), sodium hydroxide (NaOH, 98,5%) was purchased from Chemical Company S.A. (Iasi, Romania), gradient grade acetonitrile (CH3CN, Mr = 41.05) (Hipersolv Chromanorm) was obtained from VWR International S.A.S. (Fontenay-sous-Bois, France), methanol (CH3OH, Mr = 32.04) for HPLC, ≥ 99.9% (Chromasolv™) was purchased from Honeywell Riedel-de Haën (Seelze, Germany). Ultrapure water (resistivity 18.2 MΩ·cm) was obtained from a local pharmaceutical company. The distilled water was obtained in the private laboratories with a GFL typ 2004, no. 11918315J distiller (Germany). All reagents were used without further purification. Carbopol 71 – G NF and Noveon AA – 1 were obtained from Noveon (Clevaland - Ohio, SUA), MicroceLac® 100 (co-processed lactose-cellulose – compound for direct compression) was obtained from Meggle Group (Wasserburg, Germany). For the comparative analysis of the data we have taken 2 industrial formulations with M-HCl with modified release and 3 industrial formulations with M-HCl with conventional release. The industrial products with HNK are capsules with conventional release. The multicomponent matrix tablets (M-HCl / HNK) are based on extended-release polymers, using the granular Carbopol 71G and Noveon AA. In case of the first formulation, P - 1 we have Carbopol 71G / Noveon AA in the proportion of 15% / 3%, and for P - 2 we have 25% / 7% of the tablets mass. The concentrations and other characteristics of these formulations are shown in Table 9, Table 10 and Table 11. The industrial products were purchased from the local market (communitary pharmacy).
3.2. Equipment
Agilent Technologies 1200 (USA) liquid chromatograph equipped with quaternary pump (type G1311A), multidiode detector (DAD type G1315B), degasser (type G1322A), thermostatted column compartment (type G1316A) and Agilent ChemStation 32 software (Rev. B.03.02.). The used chromatographic colum was a Thermoscientific ODS Hypersyl TM (250 x 4.6 mm, 5 μm), Lithuania. Other instruments used were: pH-metter inoLAB pH 7110 (Xylem Analytics Germany GmbH), PH CHECK G 5040-0302 (article 6311940, Dostmann electronic GmbH, Germany), water bath Biobase (model SY-1L4H, Biobase Biodustry, Shandong, Co. Ltd, China), ultrasonic bath Biobase (model UC-40A, Biobase Biodustry, Shandong, Co. Ltd, China), analytical balance PIONEER® Analytical OHAUS PX124M (Ohaus Corporation, Parsippany, USA), dissolution apparatus SR 8 Plus Dissolution Test Station (model 73-100-104, Hanson Research, Chatsworth, USA), microliter™ Syringes, 20 μL Hamilton Bonaduz AG (CH-7402 Bonaduz / Switzerland), Pipet4u® Pro 20 – 200 μL (article OK99957, AHN® Biotechnologie GmbH, Germany), Transferpette® Dig. 100 – 1000 μL (article 704180, Brand GMBH + CO KG, Germany), Rotilabo® - Mikroliterpipette 0,5 – 5,0 mL (article TA 26.1, Carl Roth GmbH, Germany), Korsch EK0 tablet press (12 mm flat punches, 5 kN tabletting pressure).
3.3. Preparation of Standard Solutions (M-HCl Aqueous Solution, HNK Alcoholic Solution and M-HCl / HNK Final Hydroalcoholic Solution)
Standard solutions are obtained by dissolving 185.6 mg of M-HCl (reference substance, 97 %) in 25 mL of ultrapure water (rezistivity 18,2 MΩ·cm) on the ultrasonic bath and diluting with ultrapure water after complete dissolution to 50 mL to give a solution with a concentration of 3.6 mg/mL (3600 μg/mL). We prepared HNK standard solution of concentration 0.45 mg/mL (450 ug/mL) by dissolving 22.5 mg of the substance in 25 mL ethanol, ultrasonication in the bath for 3 min, then dilution with ethanol to 50 mL volumetric flask. The final standard solution was obtained by adding 1/3 parts of M-HCl standard aqueous solution of concentration 3.6 mg/mL over 2/3 parts of HNK alcoholic solution of concentration 0.45 mg/mL, obtaining a final concentration of 0.3 mg/mL (300 μg/mL) for HNK and 1.2 mg/mL (1200 μg/mL) for M-HCl. Any dilutions that occurs during the preparation of standard solutions were performed with solvent: one third (1/3) ultrapure water and two thirds (2/3) ethanol.
3.4. Selection and Preparation of Mobile Phase
Mobile phases containing methanol, acetonitrile, water, and buffer were tried in different proportions. Satisfactory peaks were obtained at a flow rate of 1 mL/min with a mobile phase made up of 15 parts 0.02 M acetate buffer (pH = 3) and 85 parts methanol. A volume of 1 L 0.02 M acetate buffer is obtained by dissolving an amount of 1.64 g of sodium acetate in a volume of 1 L with water, then adjusting to pH = 3 with glacial acetic acid with the help of pH meter. To prepare a volume of 1 liter of mobile phase, a volume of 850 mL methanol is mixed with 150 mL 0.02M acetate buffer (pH = 3). After the mixture has reached room temperature, the mobile phase were filtered through 0.45 μm membrane filters by application of vacuum and sonicated for 20 min before introducing into the system.
3.5. Method Development and Optimization Using QbD Approach
3.5.1. Method Development
Following the consultation of the specialized literature regarding the determination of HNK and M-HCl by HPLC, as well as some preliminary tests, for the development of the proposed method, determinations were carried out in several chromatographic conditions, using as the mobile phase mixtures in different proportions of methanol or acetonitrile / water or buffer (at different pH) and at different flow rates, following that the final analysis conditions will be established by optimization using the QbD approach, considering as independent factors studied the percentage of organic solvent and the pH of the buffer system from the composition of the mobile phase as well as its flow rate and as dependent variables the area of the peaks corresponding to HNK and M-HCl and the retention time of M-HC.
3.5.2. The Model and Treatment Runs for a 3 Factors – 3 Levels Design
The experimental design (a three factor, mobile phase composition, pH of buffer solution and flow at three different levels), the desirability function, and data analysis calculations were performed by using MATLAB and Statistics Toolbox Release 2020a (The MathWorks, Inc., Natick, MA, USA) software.
The model for a three factors each at three levels can be expressed as a 3 x 3 x 3 = 33 design. The model for such an experiment is given by Equation (8):
or
Yijk = μ +Ai + Bj + A⋅Bij + Ck + A⋅Cik + B⋅Cjk + ABCijk + εijk
Response = β0 +β1⋅A + β2⋅B + β3⋅C + β4⋅A⋅B + β5⋅A⋅C + β6⋅B⋅C + β7⋅A2 + β8⋅B2 + β9⋅C2
In Equation (8) each factor (A, B and C) is included as a nominal factor rather than as a continuous variable. So, In such cases, the main effects have 2 degrees of freedom, the two-factor interactions have 22 = 4 degrees of freedom and the k-factor interactions have 2k degrees of freedom. This model contains 2 + 2 + 2 + 4 + 4 + 4 + 8 = 26 degrees of freedom. In the case in which there is no replication, the fit is exact and there is no error term (the ε term) in the equation of the model. In this model, the values for i are 1, 2 and 3 and similarly for j and k, thus obtaining a total of 27 treatments [68].
From the obtained data, various ANOVA parameters were calculated. To examine the impact of each variable on the various responses and to determine the probable interaction between the parameters, and in order to obtain a 3D response surface contour the response surface methodology was applied. As responses we choose the peak area of HNK and M-HCl and the retention time for M-HCl.
3.6. Method Validation
The HPLC method for M-HCl was validated in terms of linearity, limit of detection (LOD), limit of quantification (LOQ), precision and accuracy according to ICH Q2 (R1) and ICH Q2 (R2) Guidelines [57,58].
The linearity was determined by preparing a calibration curve for 40 standard solutions with concentrations ranging from 4 to 1200 μg/mL for M-HCl and 1 to 300 μg/mL for HNK. Each solution was analyzed in triplicate, and from the obtained chromatograms the peaks area were determined by integration and used to generate the calibration curve using the corresponding concentration of M-HCl, respectively for HNK. The equation of regression line was determined using the least squares method and mathematical estimates of the degree of linearity (correlation coefficient – r, coefficient of determination – r2, the slope and the intercept with ordinate of the regression line), using regression function in Excel.
The detection limit (LOD) and quantification limit (LOQ) were calculated based on the standard deviation of a linear response and a slope, where σ = the standard deviation of the respondse and S = the slope of the calibration curve. These limits are calculated using the equation of the regresion curve obtained in linearity study:
The precision of the developed HPLC method was evaluated in terms of repeatability (intra-day precision) and intermediate precision (inter-day precision). For determination of repeatability, were evaluated in triplicate on the same day three solutions of M-HCl at three concentrations: 320, 400 and 480 μg/mL for M-HCl, and 80, 100 and 120 μg/mL for HNK. Similarly, for the determination of intermediate precision the above-prepared solutions were analyzed on three consecutive days. The repeatability and intermediate precision of the method were presented as relative standard deviation (RSD%).
The accuracy of the method has been determined by application of the analytical procedure to recovery studies using the standard addition method. In this, formerly evaluated sample solutions consisting of a known amount of M-HCl were spiked with three different concentration levels. Briefly, to 0.25 mL of 800 / 200 μg/mL M-HCl / HNK solution, 0.15, 0.25 and 0.35 mL of 800 / 200 μg/mL M-HCl / HNK solution and 0.6 mL, 0.5 mL and 0.4 mL of solvent (alcohol/water, 2:1) were added to obtain a final volume of 1 mL. In this way, solutions with concentrations of 320 / 80; 400 / 100 and 480 / 120 μg/mL M-HCl / HNK were obtained. The accuracy was expressed in terms of percent recovery for final concentrations. The accuracy of the method was also studied at lower concentrations, in this case being calculated in terms of percent relative error (RE %) using the Equation:
where CM and CR are the measured and real concentration respectively
3.7. Stability Studies for HNK Alcoholic Solution and M-HCl / HNK Hydroalcoholic Solutions
For the stability study over time of HNK alcoholic solutions, were prepared solutions at concentrations of 90 and 300 µg/mL, M-HCl / HNK (360 / 90 μg/mL) and M-HCl / HNK (1200 / 300 μg/mL). These solutions were analyzed initially and then after 24 and 48 hours, the solutions being stored in the refrigerator, at room temperature and on a water bath at 37 °C. In the case of the mixture M-HCL / HNK, the photostability was studied, only at room temperature and on water bath at 37 °C, considering that the sample kept in refrigerator is protected by light. The protection against the light was done using an alimentary aluminium sheet. In all cases, recoveries of HNK, respectively M-HCl / HNK were calculated.
3.8. Determination of HNK and M-HCl Content from Oral Dosage Forms
Initially, the average weight of one tablet (Mm) is determined according to the provisions of the European Pharmacopoeia, 11th edition [17] for a number of 20 tablets, after that, the 20 tablets are crushed into powder form. Samples of formulated M-HCl (tablets) were prepared by dissolving a quantity of the powdered tablets equivalent to 200 mg of M-HCl in 500 mL ultrapure water to get a concentration of M-HCl of 400 µg/mL. The obtained solution was filtered through 13 mm polytetrafluoroethylene (PTFE) filters, 0.45 µm, analyzed in the method conditions, and the percent content (C%) of M-HCl was calculated using the equation:
where Mm is average weight of a tablet calculated for 20 tablets (in g), A is the declared content (in mg), a is the quantity of tablet powder (in g), PA is the peak area, Int and S are the intercept and the slope of the regression line respectively.
For the quantitative determination of HNK in capped capsules, 20 capsules were used and mass uniformity was determined to determine the average mass of the content. The contents of the 20 capsules were homogenized in a grinder, after which the samples were processed by dissolving powder equivalent to 100 mg HNK in 1000 mL alcohol to obtain a HNK concentration of 100 µg/mL. The obtained solution was filtered through 13 mm polytetrafluoroethylene (PTFE) filters, 0.45 µm, analyzed in the method conditions, and the percent content (C%) of M-HCl was calculated using the equation:
where Mm is average weight of a tablet calculated for 20 tablets (in g), A is the declared content (in mg), a is the quantity of tablet powder (in g), PA is the peak area, Int and S are the intercept and the slope of the regression line respectively.
In the case of M-HCl / HNK tablets we used the same working protocol, with the except that the powder from tablets corresponding to 400 mg M-HCl and 100 mg HNK was dissolved in alcohol at 1000 mL, ultrasonic bath for 5 minutes, to get a concentration of M-HCl of 400 µg/mL and HNK 100 µg/mL. The obtained solution was filtered through 13 mm polytetrafluoroethylene (PTFE) filters, 0.45 µm, analyzed in the method conditions, and the percent content (C%) of M-HCl was calculated using the Equation (14) for M-HCl and Equation (15) for HNK:
where Mm is average weight of a tablet calculated for 20 tablets (in g), A is the declared content (in mg), a is the quantity of tablet powder (in g), PA is the peak area, R1 = 100.09% is mean recovery accuracy for M-HCl, R2 = 100.12% is mean recovery accuracy for HNK, Int and S are the intercept and the slope of the regression line respectively.
3.9. Dissolution Studies
In vitro dissolution tests were performed according to the specifications of the "2.9.3. Dissolution Test for Solid Pharmaceutical Forms" and "5.17. Recommendations on methods for dosage forms testing" of the European Pharmacopoeia, 11th edition [17].
The dissolution tests were performed at 37 ± 0.5 °C, using apparatus 2 (paddle apparatus). Two dissolution media were prepared for dissolution studies: for simulated gastric fluid with pH = 1.2 (3.7 g KCl, 7.5 mL concentrated HCl and distilled water up to 1000 g) and simulated intestinal fluid pH = 6.8 (6.8 g KH2PO4, 22.4 mL 1M NaOH solution and distilled water up to 1000 g). The pH value of the dissolution media was checked with a pH-metter and, if necessary, the solution is adjusted with concentrated HCl or 1M NaOH solution, as appropriate. The test sample (tablet) is placed on the bottom of the cylindrical vessel, after which the air bubbles are removed from the surface of the test sample; the apparatus is started and the rotational speed is adjusted. The dissolution test for prolonged-release tablets, named P-1 and P-2 was performed for a period of 12 hours, using specific working conditions, as follows: first 2 hours, simulated gastric fluid pH = 1.2; temperature 37 ± 0.5 °C; 60 rpm. The dissolution medium was replaced with simulated intestinal fluid pH = 6.8; temperature 37 ± 0.5 °C; 60 rpm. 2 mL of medium was collected, after each sampling, volume was kept constant into the cylindrical vessel by replacing with the same volume of fresh dissolution medium at 37 °C. We took samples at the following intervals: 0.5, 1, 2, 3, 4, 5, 6, 7, 8, 9, 10, 11 and 12 hours for prolonged-release tablets. Samples were collected at the declared time from the distance between the surface of the dissolution medium and the paddle, but also at least 10 mm from the wall of the vessel, then filtered using nylon filters (0.45 μm; diameter 25 mm). The samples were analyzed by the described method. If the area of the peak corresponding to M-HCl and HNK is greater than that obtained for standard M-HCl (800 μg/mL) and standard HNK (200 μg/mL), the solution was diluted twice and reanalyzed, from where a dilution factor (DF) appear in the equation used for calculations. The dissolution test was performed on six samples (tablets).
The following Equations (16, 17 and 18) were used to determine the amount of M-HCl and HNKreleased:
where:
- C% = percentage release in the dissolution medium;
- CI% = percentage concentration calculated for the first sampling;
- CII% = percentage concentration calculated in the 2 mL taken previously;
- DF = dilution factor (1 or 2);
- PA = peak area (mAU·min);
- Int and S = intercept and slope of the regression line respectively;
- A = declared content (mg);
- tx = current sampling time;
- tx-1 = previous sampling time.
At simulated gastric fluid with pH = 1.2 Equation (16) was used for the first sample taken, at the time of 0.5 hour (prolonged-release tablets), and for the following samples the Equation (17) was used. The dissolution medium was replaced with simulated intestinal fluid pH = 6.8, so that Equation (16) was used for the three hour sample, then Equation (17) for subsequent sampling. The values obtained were added with the final concentration obtained at medium pH = 1.2 (simulated gastric fluid).
3.10. Greenness of the Method
3.10.1. Evaluation of the Greenness of the Proposed Method (Analytical Eco-Scale, AES)
As a complete new technique for assessing the environmental friendliness of analytical methodology, there is the Analytical Eco-Scale. This is based on applying penalty points to analytical process parameters that deviate from the ideal ecological analysis.
3.10.2. Analytical GREEnness Metric (AGREE)
Over the last 15 years, methods have been developed to assess the environmental friendliness of analytical methods. Previously we presented the AES method which is based on the calculation of penalty points (PP).
For the HPLC method developed and validated for M-HCl and HNK we also used another method, more recently developed (June 2020) by researchers at the University of Vigo (Spain) and Gdańsk University of Technology (GUT, Poland), which is the Analytical Greenness Calculator, a freely available website application (https://mostwiedzy.pl/wojciech-wojnowski,174235-1/AGREE; agree-index.anvil.app), which is based on 12 principles of Green Analytical Chemistry (GAC) [69,70]. The scale of values for each of the 12 principles is from 0 to 1, where 0 is the highest value for a non-green method, corresponding to the colour red, and 1 is the highest value for the greenest method, corresponding to the colour dark green [63,69]. In the Analytical Greenness Calculator you can set a higher weighting (maximum value 4) for one or more of the 12 principles analysed, so that the final method score will vary according to the values. In the Analytical Greenness Calculator it is possible to set a higher weight (maximum value 4) for one or more of the 12 principles analysed, so that the final score of the method will vary according to the particularities of the method.
4. Conclusions
Chromatographic conditions for the simultaneous HPLC determination of HNK and M-HCl were established by optimization through the QbD approach using a three-factor, three-response model. The obtained 3D response surfaces demonstrate the fact that in the case of this method there is an impact of each variable studied (the percentage of methanol and the pH of the buffer in the composition of the mobile phase and its flow rate). Also, some interactions are observed between the variables studied in terms of the answers obtained. Numerical and graphic optimization was also performed to determine the design space where desirability is maximum. The chromatographic separation in the mentioned conditions takes less than 10 minutes. The evaluation of greenness of the proposed HPLC method was carried out through the Analytical Eco-Scale study obtaining a score of 77 points, which means an excellent green method and through the AGREE method obtaining a total score of 0.62 (maximum 1) which falls within the scope of a green methods, which confirms that the proposed method has an ecofriendly nature. The obtained validation parameters show that the method is linear (in the range 4 – 1200 μg/mL for M-HCl and 1 – 300 μg/mL for HNK), with detection limits of 4.80 μg/mL (HNK) and 34.36 μg/mL (M-HCl) and quantification limits of 104.13 (HNK) and 14.54 (M -HCl), the method is precise (RSD < 2% for both HNK and M-HCl, in intra- and inter-day studies), and accurate (mean recovery = 100.09% in the range 99.80 – 100.43% for M-HCl and mean recovery = 100.12% in the range 99.70 – 100.38% for HNK). The stability studies carried out show that the solutions containing HNK and M-HC are stable (both in time and as a result of being kept in light conditions) and thus it is demonstrated that the method can also be applied in the case of stability studies in which the solutions are maintained for more than 24 hours until HPLC analysis. The proposed method was applied with good results to the determination of HNK from capsules and M-HCl from tablets (obtained commercially) and to the simultaneous determination of HNK and M-HCl from prolonged-release tablets prepared by the authors, as well as in dissolution studies of the latter. From what the authors know, after consulting the specialized literature, this is the first HPLC method by which the simultaneous determination of HNK and M-HCl is carried out.
Author Contributions
Conceptualization, L.O., A.F.S. and M.S.; methodology, A.F.S., L.O. and M.S.; software, I.S. and M.S.; validation, M.S., A.F.S.; formal analysis, M.S., A.F.S., and I.S.; investigation, M.S., M.H., A.B., M.S.C.; resources, M.S., L.O. and A.F.S; data curation, M.S. and A.F.S.; writing—original draft preparation, M.S.; writing—review and editing, A.F.S., L.O. and M.S.; visualization, M.S. and A.F.S.; supervision, L.O. and A.F.S.; project administration, L.O. and M.S.; funding acquisition, L.O., A.F.S., M.S., A.B., M.H. and M.S.C. All authors have read and agreed to the published version of the manuscript.
Funding
Doctoral Scholarship No. 1756/30.10.2018 (Sha’at Mousa) from the “Grigore T. Popa” University of Medicine and Pharmacy of Iași, Romania.
Institutional Review Board Statement
Not applicable.
Informed Consent Statement
Not applicable.
Data Availability Statement
Not applicable.
Acknowledgments
Thanks to the “Grigore T. Popa” University of Medicine and Pharmacy, 700454 Iaşi, Romania, for using the facilities.
Conflicts of Interest
The authors declare no conflict of interest.
Abbreviations: AES
Analytical Eco-Scale; AGREE: Analytical GREEnness Metric; AQbD: Analytical Quality by Design; ARE: antioxidant response element; ATP: Analytical Target Profile; Bcrp: Breast Cancer Resistance Protein; CAA: Critical Analytical Attribute; CCD: Central Composite Design; CDC: Centers for Disease Control and Prevention; CMA: Critical Method Attribute; CMP: Critical Method Parameter; COVID-19: Coronavirus disease; CQA: Critical Quality Attribute; DAD: Diode Array Detector; DNA: Deoxyribonucleic Acid; DOE: Design of Experiments; EMA: European Medicines Agency; FDA: Food and Drug Administration; GC: Green Chemistry; GHS: Globally Harmonized System; HNK: Honokiol; HPLC: High Performance Liquid Chromatography; HPTLC-EDA: High-Performance Thin-Layer Chromatography - Effect-Directed Analysis; ICH: International Conference on Harmonisation; IR: immediate release; LOD: Limit of Detection; LOQ: Limit of Quantification; M-HCl: Metformin Hydrochloride; MODR: Method Operable Design Region; mRNA: Messenger Ribonucleic Acid; Nrf2: nuclear erythroid 2-related factor 2; PP: Penalty Points; PPARG: Peroxisome proliferator-activated receptor gamma; PTFE: polytetrafluoroethylene; QbD: Quality by Design; QTPP: Quality Target Product Profile; RE %: Percent Relative Error; RMSE: Root Mean Square Error; RSD%: Relative Standard Deviation; SD: Standard Deviation; SDG: Sustainable Development Goals; US: United States; UV: Ultraviolet; UV-VIS: Ultraviolet – Visible; XR: extended-release.
References
- International Diabetes Federation (IDF). IDF Diabetes Atlas 10th edition, 2021 https://diabetesatlas.org/idfawp/resource-files/2021/07/IDF_Atlas_10th_Edition_2021.pdf (accessed on 28 May 2024).
- U.S. Centers for Disease Control And Prevention (CDC). National Diabetes Statistics Report. https://www.cdc.gov/diabetes/php/data-research/index.html (accessed on 28 May 2024).
- Chatzianagnostou, K.; Gaggini, M.; Suman Florentin, A.; Simonini, L.; Vassalle, C. New Molecules in Type 2 Diabetes: Advancements, Challenges and Future Directions. Int. J. Mol. Sci. 2024, 25, 6218. [Google Scholar] [CrossRef] [PubMed]
- Sha’at, M.; Spac, A.F.; Stoleriu, I.; Bujor, A.; Cretan, M.S.; Hartan, M.; Ochiuz, L. Implementation of QbD Approach to the Analytical Method Development and Validation for the Estimation of Metformin Hydrochloride in Tablet Dosage Forms by HPLC. Pharmaceutics 2022, 14, 1187. [Google Scholar] [CrossRef]
- Sha’at, M.; Ghiciuc, C.M.; Bujor, A.; Timofte, D.V.; Ștefanache, A.; Ochiuz, L. Literature review of oral treatment of type 2 diabetes mellitus. Med. Surg. J. 2020, 124, 482–495. Available online: https://revmedchir.ro/index.php/revmedchir/article/view/2225.
- Petrescu, D.C.; Vicovan, A.G.; Constantinescu, D.; Iftimi, E.; Sha’at, M.; Solcan, C.; Ochiuz, L.; Ghiciuc, C.M.; Ungureanu, L.B. Metformin’s impact on serum imunoglobulins and bronchoalveolar lavage cells in mice with complicated severe asthma. Med. Surg. J. 2024, 128, 316–323. Available online: https://www.revmedchir.ro/index.php/revmedchir/article/view/2961.
- Soukas, A.A.; Hao, H.; Wu, L. Metformin as Anti-Aging Therapy: Is It for Everyone? Trends Endocrinol. Metab. 2019, 30, 745–755. [Google Scholar] [CrossRef] [PubMed]
- Pavaloiu, R.-D.; Sha’at, F.; Bubueanu, C.; Petrescu, M.; Sevcenco, C. Assessment of Pullulan, a Microbial Polysaccharide, as a Matrix for Senotherapeutics Delivery. Chem. Proc. 2023, 13, 23. [Google Scholar] [CrossRef]
- Gedawy, A.; Al-Salami, H.; Dass, C.R. Development and validation of a new analytical HPLC method for simultaneous determination of the antidiabetic drugs, metformin and gliclazide. J. Food Drug. Anal. 2019, 27, 315–322. [Google Scholar] [CrossRef] [PubMed]
- Kant, R.; Bodla, R.B.; Kapoor, G.; Bhutani, R. Optimization of a single HPLC-PDA method for quantifying metformin, gliclazide, pioglitazone, dapagliflozin, empagliflozin, saxagliptin, linagliptin and teneligliptin using central composite design. Bioorg. Chem. 2019, 91, 103111. [Google Scholar] [CrossRef]
- Sebaiy, M.M.; El-Adl, S.M.; Baraka, M.M.; Hassan, A.A. Rapid RP-HPLC method for simultaneous estimation of metformin, pioglitazone, and glimepiride in human plasma. Acta Chromatogr. 2020, 32, 16–21. [Google Scholar] [CrossRef]
- Shende, M.A.; Budde, B.R. Novel RP-HPLC method development and validation for simultaneous estimation of metformin, voglibose and pioglitazone in bulk and triple fixed drug combinations pharmaceutical dosage form. J. Drug Deliv. Ther. 2019, 9, 30–37. [Google Scholar] [CrossRef]
- Mahrouse, M.A.; Lamie, N.T. Experimental design methodology for optimization and robustness determination in ion pair RP-HPLC method development: Application for the simultaneous determination of metformin hydrochloride, alogliptin benzoate and repaglinide in tablets. Microchem. J. 2019, 147, 691–706. [Google Scholar] [CrossRef]
- Raza, A.; Murtaza, S.H.; Hanif, S.; Iqbal, J.; Ali, I.; Aftab, T.; Shakir, R.; Bedar, R.; Ali Syed, M. Validation of a rapid and economical RP-HPLC method for simultaneous determination of metformin hydrochloride and sitagliptin phosphate monohydrate: Greenness evaluation using AGREE score. Pak. J. Pharm. Sci. 2022, 35, 15–21. [Google Scholar] [PubMed]
- Balamurugan, K.; Kirtimaya, M. Quality by design based development and validation of RP-HPLC method for simultaneous estimation of sitagliptin and metformin in bulk and pharmaceutical dosage forms. Int. J. Pharm. Investig. 2020, 10, 512–518. [Google Scholar]
- Shakoor, A.; Ahmed, M.; Ikram, R.; Hussain, S.; Tahir, A.; Jan, B.M.; Adnan, A. Stability-indicating RP-HPLC method for simultaneous determination of metformin hydrochloride and vildagliptin in tablet and biological samples. Acta Chromtogr. 2020, 32, 39–43. [Google Scholar] [CrossRef]
- European Directorate for the Quality of Medicines and HealthCare. European Pharmacopoeia, 11th ed.; Council of Europe: Strasbourg, France, 2023. [Google Scholar]
- Trifan, A.; Bostănaru, A.-C.; Luca, S.V.; Temml, V.; Akram, M.; Herdlinger, S.; Kulinowski, Ł.; Skalicka-Woźniak, K.; Granica, S.; Czerwińska, M.E.; et al. Honokiol and Magnolol: Insights into Their Antidermatophytic Effects. Plants 2021, 10, 2522. [Google Scholar] [CrossRef] [PubMed]
- Ricordi, C.; Pacifici, F.; Lanzoni, G.; Palamara, A.T.; Garaci, E.; Della-Morte, D. Dietary and Protective Factors to Halt or Mitigate Progression of Autoimmunity, COVID-19 and Its Associated Metabolic Diseases. Int. J. Mol. Sci. 2021, 22, 3134. [Google Scholar] [CrossRef]
- Lee, A.Y.; Christensen, S.M.; Duong, N.; Tran, Q.-A.; Xiong, H.M.; Huang, J.; James, S.; Vallabh, D.; Talbott, G.; Rose, M.; et al. Sirt3 Pharmacologically Promotes Insulin Sensitivity through PI3/AKT/mTOR and Their Downstream Pathway in Adipocytes. Int. J. Mol. Sci. 2022, 23, 3740. [Google Scholar] [CrossRef] [PubMed]
- Bibi, T.; Bano, S.; ud Din, F.; Ali, H.; Khan, S. Preparation, characterization, and pharmacological application of oral honokiol-loaded solid lipid nanoparticles for diabetic neuropathy. Int. J. Pharm. 2023, 645, 123399. [Google Scholar] [CrossRef] [PubMed]
- Hu, M.; Jiang, W.; Ye, C.; Hu, T.; Yu, Q.; Meng, M.; Sun, L.; Liang, J.; Chen, Y. Honokiol Attenuates High Glucose-Induced Peripheral Neuropathy via Inhibiting Ferroptosis and Activating AMPK/SIRT1/PGC-1α Pathway in Schwann Cells. Phytother. Res. 2023, 37, 5787–5802. [Google Scholar] [CrossRef]
- Islam, M.R.; Islam, F.; Nafady, M.H.; Akter, M.; Mitra, S.; Das, R.; Urmee, H.; Shohag, S.; Akter, A.; Chidambaram, K.; et al. Natural Small Molecules in Breast Cancer Treatment: Understandings from a Therapeutic Viewpoint. Molecules 2022, 27, 2165. [Google Scholar] [CrossRef]
- Mottaghi, S.; Abbaszadeh, H. Natural Lignans Honokiol and Magnolol as Potential Anticarcinogenic and Anticancer Agents. A Comprehensive Mechanistic Review. Nutr. Cancer 2022, 74, 761–778. [Google Scholar] [CrossRef]
- Fried, L.E.; Arbiser, J.L. Honokiol, a multifunctional antiangiogenic and antitumor agent. Antioxid. Redox Signal. 2009, 11, 1139–1148. [Google Scholar] [CrossRef]
- Ong, C.P.; Lee, W.L.; Tang, Y.Q.; Yap, W.H. Honokiol: A Review of Its Anticancer Potential and Mechanisms. Cancers 2020, 12, 48. [Google Scholar] [CrossRef] [PubMed]
- Rauf, A.; Khan, S.A.; Olatunde, A.; Imran, M.; Alhumaydhi, F.A.; Aljohani, A.S.M.; Uddin, M.S.; Mitra, S.; Emran, T.B.; Khayrullin, M.; et al. Honokiol: A review of its pharmacological potential and therapeutic insights. Phytomedicine 2021, 90, 153647. [Google Scholar] [CrossRef] [PubMed]
- Li, X.; Yuan, Z.; Wang, Y.; Wang, W.; Shi, J. Recent advances of honokiol: pharmacological activities, manmade derivatives and structure-activity relationship. Eur. J. Med. Chem. 2024, 272, 116471. [Google Scholar] [CrossRef]
- Khatoon, F.; Ali, S.; Kumar, V.; Elasbali, A.M.; Alhassan, H.H.; Alharethi, S.H.; Islam, A.; Hassan, M.I. Pharmacological Features, Health Benefits and Clinical Implications of Honokiol. J. Biomol. Struct. Dyn. 2022, 1–23. [Google Scholar] [CrossRef] [PubMed]
- Pan, C.; Li, Q.; Xiong, S.; Yang, Y.; Yang, Y.; Huang, C. Delivery strategies, structural modification, and pharmacological mechanisms of honokiol: a comprehensive review. Chem. Biodivers. 2024, 21, e202302032. [Google Scholar] [CrossRef] [PubMed]
- Cheresh, P.; Kim, S.-J.; Jablonski, R.; Watanabe, S.; Lu, Z.; Chi, M.; Helmin, K.A.; Gius, D.; Budinger, G.R.S.; Kamp, D.W. SIRT3 Overexpression Ameliorates Asbestos-Induced Pulmonary Fibrosis, mt-DNA Damage, and Lung Fibrogenic Monocyte Recruitment. Int. J. Mol. Sci. 2021, 22, 6856. [Google Scholar] [CrossRef]
- Zhang, W.; Li, B.; Lv, Y.; Wei, S.; Zhang, S.; Hu, Y. Transcriptomic analysis shows the antifungal mechanism of honokiol against Aspergillus flavus. Int. J. Food Microbiol. 2022, 384, 109972. [Google Scholar] [CrossRef]
- Usach, I.; Alaimo, A.; Fernández, J.; Ambrosini, A.; Mocini, S.; Ochiuz, L.; Peris, J.-E. Magnolol and Honokiol: Two Natural Compounds with Similar Chemical Structure but Different Physicochemical and Stability Properties. Pharmaceutics 2021, 13, 224. [Google Scholar] [CrossRef]
- Kim, Y.-J.; Jung, U.J. Honokiol Improves Insulin Resistance, Hepatic Steatosis, and Inflammation in Type 2 Diabetic db/db Mice. Int. J. Mol. Sci. 2019, 20, 2303. [Google Scholar] [CrossRef]
- Sarrica, A.; Kirika, N.; Romeo, M.; Salmona, M.; Diomede, L. Safety and toxicology of magnolol and honokiol. Planta Med. 2018, 84, 1151–1164. [Google Scholar] [CrossRef] [PubMed]
- Wang, J.; Zhai, T.; Chen, Y. Effects of Honokiol on CYP450 Activity and Transporter mRNA Expression in Type 2 Diabetic Rats. Int. J. Mol. Sci. 2018, 19, 815. [Google Scholar] [CrossRef]
- Yu, Y.; Li, M.; Su, N.; Zhang, Z.; Zhao, H.; Yu, H.; Xu, Y. Honokiol protects against renal ischemia/reperfusion injury via the suppression of oxidative stress, iNOS, inflammation and STAT3 in rats. Mol. Med. Rep. 2016, 13, 1353–1360. [Google Scholar] [CrossRef]
- Bunel, V.; Antoine, M.-H.; Stévigny, C.; Nortier, J.; Duez, P. New in vitro insights on a cell death pathway induced by magnolol and honokiol in aristolochic acid tubulotoxicity. Food Chem. Toxicol. 2016, 87, 77–87. [Google Scholar] [CrossRef]
- Liu, H.-T.; Wang, T.-E.; Hsu, Y.-T.; Chou, C.-C.; Huang, K.-H.; Hsu, C.-C.; Liang, H.-J.; Chang, H.-W.; Lee, T.-H.; Tsai, P.-S. Nanoparticulated Honokiol Mitigates Cisplatin-Induced Chronic Kidney Injury by Maintaining Mitochondria Antioxidant Capacity and Reducing Caspase 3-Associated Cellular Apoptosis. Antioxidants 2019, 8, 466. [Google Scholar] [CrossRef]
- Khushnud, T.; Mousa, S.A. Potential role of naturally derived polyphenols and their nanotechnology delivery in cancer. Mol. Biotechnol. 2013, 55, 78–86. [Google Scholar] [CrossRef] [PubMed]
- Quan, Y.; Park, W.; Jin, J.; Kim, W.; Park, S.K.; Kang, K.P. Sirtuin 3 Activation by Honokiol Decreases Unilateral Ureteral Obstruction-Induced Renal Inflammation and Fibrosis via Regulation of Mitochondrial Dynamics and the Renal NF-κB-TGF-β1/Smad Signaling Pathway. Int. J. Mol. Sci. 2020, 21, 402. [Google Scholar] [CrossRef] [PubMed]
- Kataoka, S.; Umemura, A.; Okuda, K.; Taketani, H.; Seko, Y.; Nishikawa, T.; Yamaguchi, K.; Moriguchi, M.; Kanbara, Y.; Arbiser, J.L.; et al. Honokiol Acts as a Potent Anti-Fibrotic Agent in the Liver through Inhibition of TGF-β1/SMAD Signaling and Autophagy in Hepatic Stellate Cells. Int. J. Mol. Sci. 2021, 22, 13354. [Google Scholar] [CrossRef]
- Benedé, J.L.; Rodriguez, E.; Chisvert, A.; Salvador, A. Rapid and Simple Determination of Honokiol and Magnolol in Cosmetic Products by Liquid Chromatography with Ultraviolet Detection. Anal. Lett. 2021, 54, 1510–1521. [Google Scholar] [CrossRef]
- Zhuang, Q.; Pan, R.; Liu, X.; Xu, W.; Wang, H.; Zhang, X.; Lai, X.; Wang, H.; Zhang, L.; Jiang, J. A Validated Ultra-HPLC–MS/MS Method for Determination of Honokiol in Human Plasma and its Application to a Clinical Pharmacokinetic Study. Bioanalysis 2019, 11, 1085–1098. [Google Scholar] [CrossRef] [PubMed]
- Dong, H.D.; Liu, X.L. HPLC analysis of magnolol and honokiol in Magnoliae Cortex after solvent sublation. Acta Chromatogr. 2008, 20, 147–156. [Google Scholar] [CrossRef]
- Wu, X.; Chen, X.; Hu, Z. High-performance liquid chromatographic method for simultaneous determination of honokiol and magnolol in rat plasma. Talanta 2003, 59, 115–121. [Google Scholar] [CrossRef] [PubMed]
- Ww, A.; Wei, X.J.C.; Biointerfaces, S.B. Evaluation of anticancer activity of honokiol by complexation with hydroxypropyl-β-cyclodextrin. Colloids Surf. B Biointerf. 2020, 196, 111298. [Google Scholar] [CrossRef]
- Zheng, X.; Kan, B.; Gou, M.; Fu, S.; Zhang, J.; Men, K.; Chen, L.; Luo, F.; Zhao, Y.; Zhao, X.; et al. Preparation of mpeg-pla nanoparticle for honokiol delivery in vitro. Int. J. Pharm. 2010, 386, 262–267. [Google Scholar] [CrossRef] [PubMed]
- Godugu, C.; Doddapaneni, R.; Singh, M. Honokiol nanomicellar formulation produced increased oral bioavailability and anticancer effects in triple negative breast cancer (TNBC). Colloids Surf. B 2017, 153, 208–219. [Google Scholar] [CrossRef] [PubMed]
- Wei, X.W.; Gong, C.Y.; Shi, S.; Fu, S.Z.; Men, K.; Zeng, S. Self-assembled honokiol-loaded micelles based on poly(caprolactone)-poly(ethylene glycol)-poly(caprolactone) copolymer. Int. J. Pharm. 2009, 369, 170–175. [Google Scholar] [CrossRef] [PubMed]
- Qian, Z.; Chen, J.; Lei, Q.; Tan, G.; Zou, Y.; Peng, G.; Xie, J.; Li, W. Rapid determination of multiple components in herbal medicine using a single reference compound by high-performance liquid chromatography at equal absorption wavelength: case study of Magnoliae officinalis cortex. Sep. Sci. Plus 2024, 7, 2300071. [Google Scholar] [CrossRef]
- Lata, E.; Fulczyk, A.; Ott, P.G.; Kowalska, T.; Sajewicz, M.; Moricz, A.M. Thin-Layer Chromatographic Quantification of Magnolol and Honokiol in Dietary Supplements and Selected Biological Properties of These Preparations. J. Chromatogr. A 2020, 1625, 461230. [Google Scholar] [CrossRef]
- Chu, C.; Li, J.; Wang, S.; Weng, L.; Jiang, L.; Zhang, H.; Liu, C.; Yan, J. A simple and sensitive dispersive micro-solid-phase extraction coupled with high-performance liquid chromatography for quantification of honokiol and magnolol in complex matrices. J. AOAC Int. 2020, 103, 1406–1411. [Google Scholar] [CrossRef]
- Report from the EMA-FDA QbD pilot program, EMA/213746/2017, European Medicines Agency, US Food & Drug Administration, 2017, https://www.fda.gov/media/104371/download (accessed on 22 April 2024).
- Kumar. M.; Pant, A.; Chopra, S.; Bhatia A. AQbD enabled method development and quantification of asiaticoside in foam-based formulations. Accredit. Qual. Assur 2024, 2024, 1-16. [CrossRef]
- Attimarad, M.; Alali, M.J.; Alali, H.A.; Alabdulmuhsin, D.H.; Alnajdi, A.K.; Venugopala, K.N.; Nair, A.B. Design of Experimental Approach for Development of Rapid High Performance Liquid Chromatographic Process for Simultaneous Estimation of Metoprolol, Telmisartan, and Amlodipine from Formulation: Greenness and Whiteness Evaluation. Molecules 2024, 29, 1087. [Google Scholar] [CrossRef] [PubMed]
- International Conference on Harmonisation of Technical Requirements for Registration of Pharmaceuticals for Human Use. ICH Topic Q2 (R1). Validation of Analytical Procedures: Text and Methodology. Step 5. Available online: https://www.ema.europa.eu/en/documents/scientific-guideline/ich-q-2-r1-validation-analytical-procedures-text-methodology-step-5_en.pdf (accessed on 15 March 2024).
- International Conference on Harmonisation of Technical Requirements for Registration of Pharmaceuticals for Human Use. ICH Topic Q2 (R2). Validation of Analytical Procedures: Text and Methodology, European Medicines Agency. Step 5, Committee for Medicinal Products for Human Use, EMA/CHMP/ICH/82072/2006, December 2023. Available online: https://www.ema.europa.eu/en/documents/scientific-guideline/ich-q2r2-guideline-validation-analytical-procedures-step-5-revision-1_en.pdf (accessed on 15 March 2024).
- Kumar, N.; Sangeetha, D. Analytical method development by using QbD—An emerging approach for robust analytical method development. J. Pharm. Sci. Res. 2020, 12, 1298–1305. Available online: https://www.jpsr.pharmainfo.in/Documents/Volumes/vol12issue10/jpsr12102009.pdf.
- Sandhu, P.S.; Beg, S.; Katare, O.P.; Singh, B. QbD-Driven Development and Validation of a HPLC Method for Estimation of Tamoxifen Citrate with Improved Performance. J. Chromatogr. Sci. 2016, 54, 1373–1384. [Google Scholar] [CrossRef] [PubMed]
- Palakurthi, A.K.; Dongala, T.; Katakam, L.N.R. QbD based development of HPLC method for simultaneous quantification of Telmisartan and Hydrochlorothiazide impurities in tablets dosage form. Pract. Lab. Med. 2020, 21, e00169. [Google Scholar] [CrossRef]
- Jadhav, M.L.; Tambe, S.R. Implementation of QbD Approach to the Analytical Method Development and Validation for the Estimation of Propafenone Hydrochloride in Tablet Dosage Form. Chromatogr. Res. Int. 2013, 2013, 676501. [Google Scholar] [CrossRef]
- Martínez, J.; Cortés, J.F.; Miranda, R. Green Chemistry Metrics, A Review. Processes 2022, 10, 1274. [Google Scholar] [CrossRef]
- Romanian Pharmacopoeia Commission National Medicines Agency. Romanian Pharmacopoeia, 10th ed.; Medical Publishing House: Bucharest, Romania, 1993. https://scholar.google.com/scholar_lookup?title=Romanian+Pharmacopoeia&author=Romanian+Pharmacopoeia+Commission+National+Medicines+Agency&publication_year=1993.
- Gałuszka, A.; Migaszewski, Z.M.; Konieczka, P.; Namieśnik, J. Analytical Eco-Scale for assessing the greenness of analytical procedures. TrAC Trends Anal. Chem. 2012, 37, 61–72. [Google Scholar] [CrossRef]
- Mlinarić, Z.; Turković, L.; Begović, I.; Nigović, B.; Sertić, M. Rapid Capillary Electrophoresis Method for Simultaneous Determination of Abemaciclib, Ribociclib, and Palbociclib in Pharmaceutical Dosage Forms: A Green Approach. Molecules 2022, 27, 7603. [Google Scholar] [CrossRef]
- Tobiszewski, M. Metrics for green analytical chemistry. Anal. Methods 2016, 8, 2993–2999. [Google Scholar] [CrossRef]
- Three-level full factorial designs, In: NIST/SEMATECH e-Handbook of Statistical Methods; https://www.itl.nist.gov/div898/handbook/pri/section3/pri339.htm (accessed on 6 March 2024).
- Pena-Pereira, F.; Wojnowski, W.; Tobiszewski, M. AGREE—Analytical GREEnness metric approach and software. Anal. Chem. 2020, 92, 10076–10082. [Google Scholar] [CrossRef]
- Chandrasekaram, K.; Alias, Y.; Mohamad, S. Dispersive Membrane Microextraction of Substituted Phenols from Honey Samples and a Brief Outlook on Its Sustainability Using Analytical Eco-Scale and Analytical GREEnness Metric Approach. Membranes 2022, 12, 649. [Google Scholar] [CrossRef] [PubMed]
Figure 2.
The Ishikawa (fishbone) diagram used to identify high-risk variables in the development of the HPLC method.
Figure 2.
The Ishikawa (fishbone) diagram used to identify high-risk variables in the development of the HPLC method.
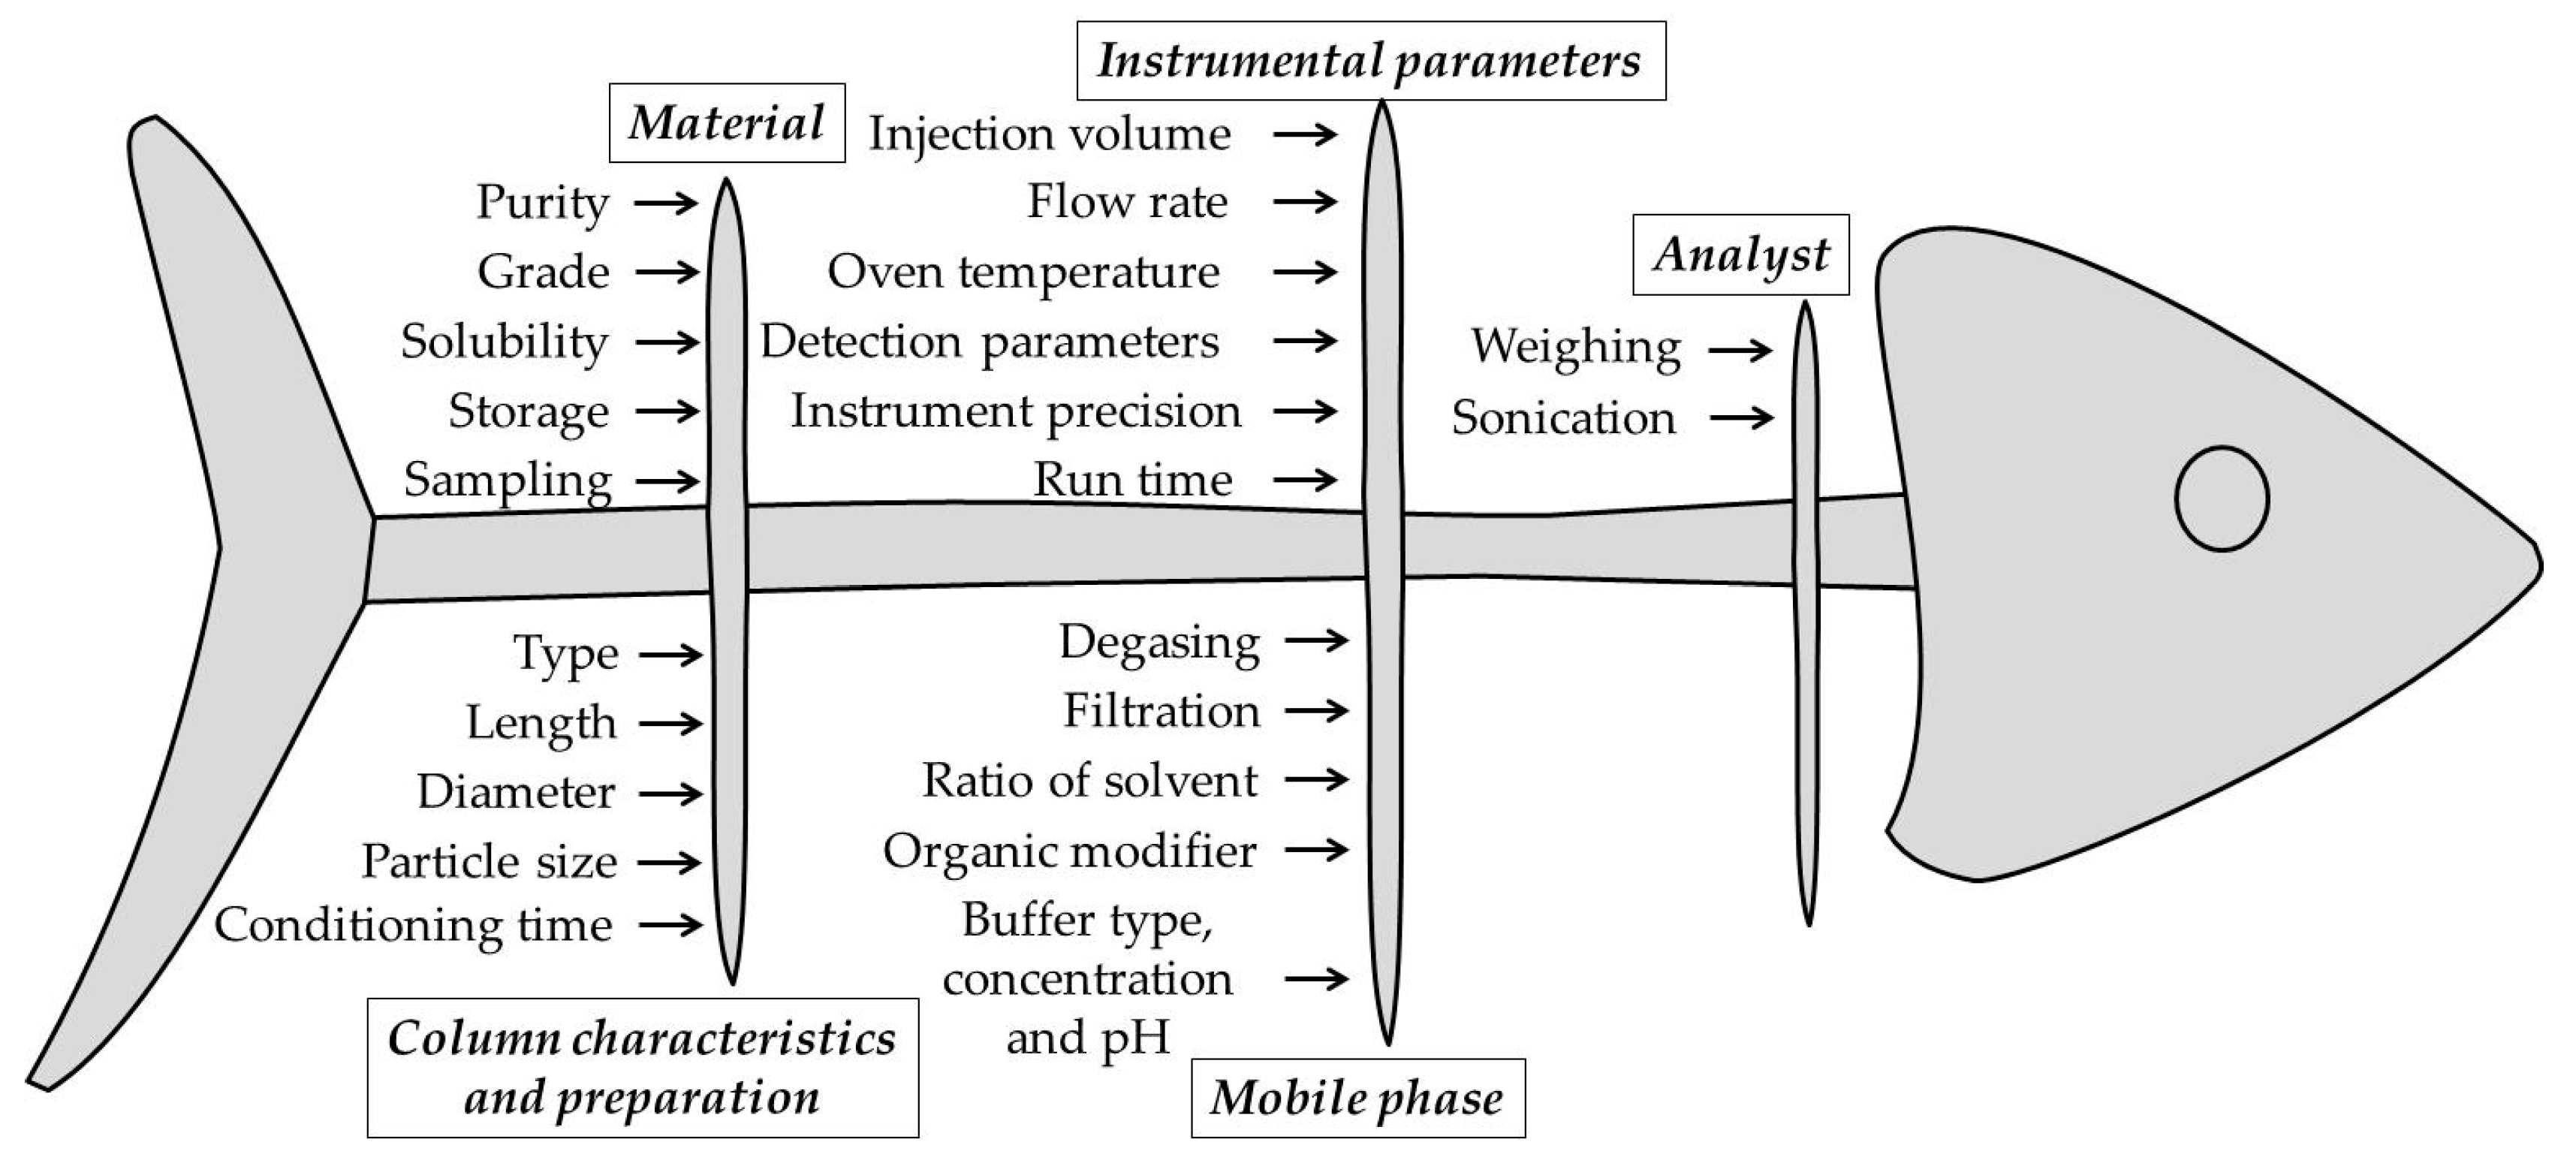
Figure 3.
Surface response models showing the effect of (a) pH and methanol percentage, (b) pH and flow, (c) methanol percentage and flow on peak area of HNK.
Figure 3.
Surface response models showing the effect of (a) pH and methanol percentage, (b) pH and flow, (c) methanol percentage and flow on peak area of HNK.
Figure 4.
Surface response models showing the effect of (a) pH and methanol percentage, (b) pH and flow, (c) methanol percentage and flow on peak area of M-HCl.
Figure 4.
Surface response models showing the effect of (a) pH and methanol percentage, (b) pH and flow, (c) methanol percentage and flow on peak area of M-HCl.
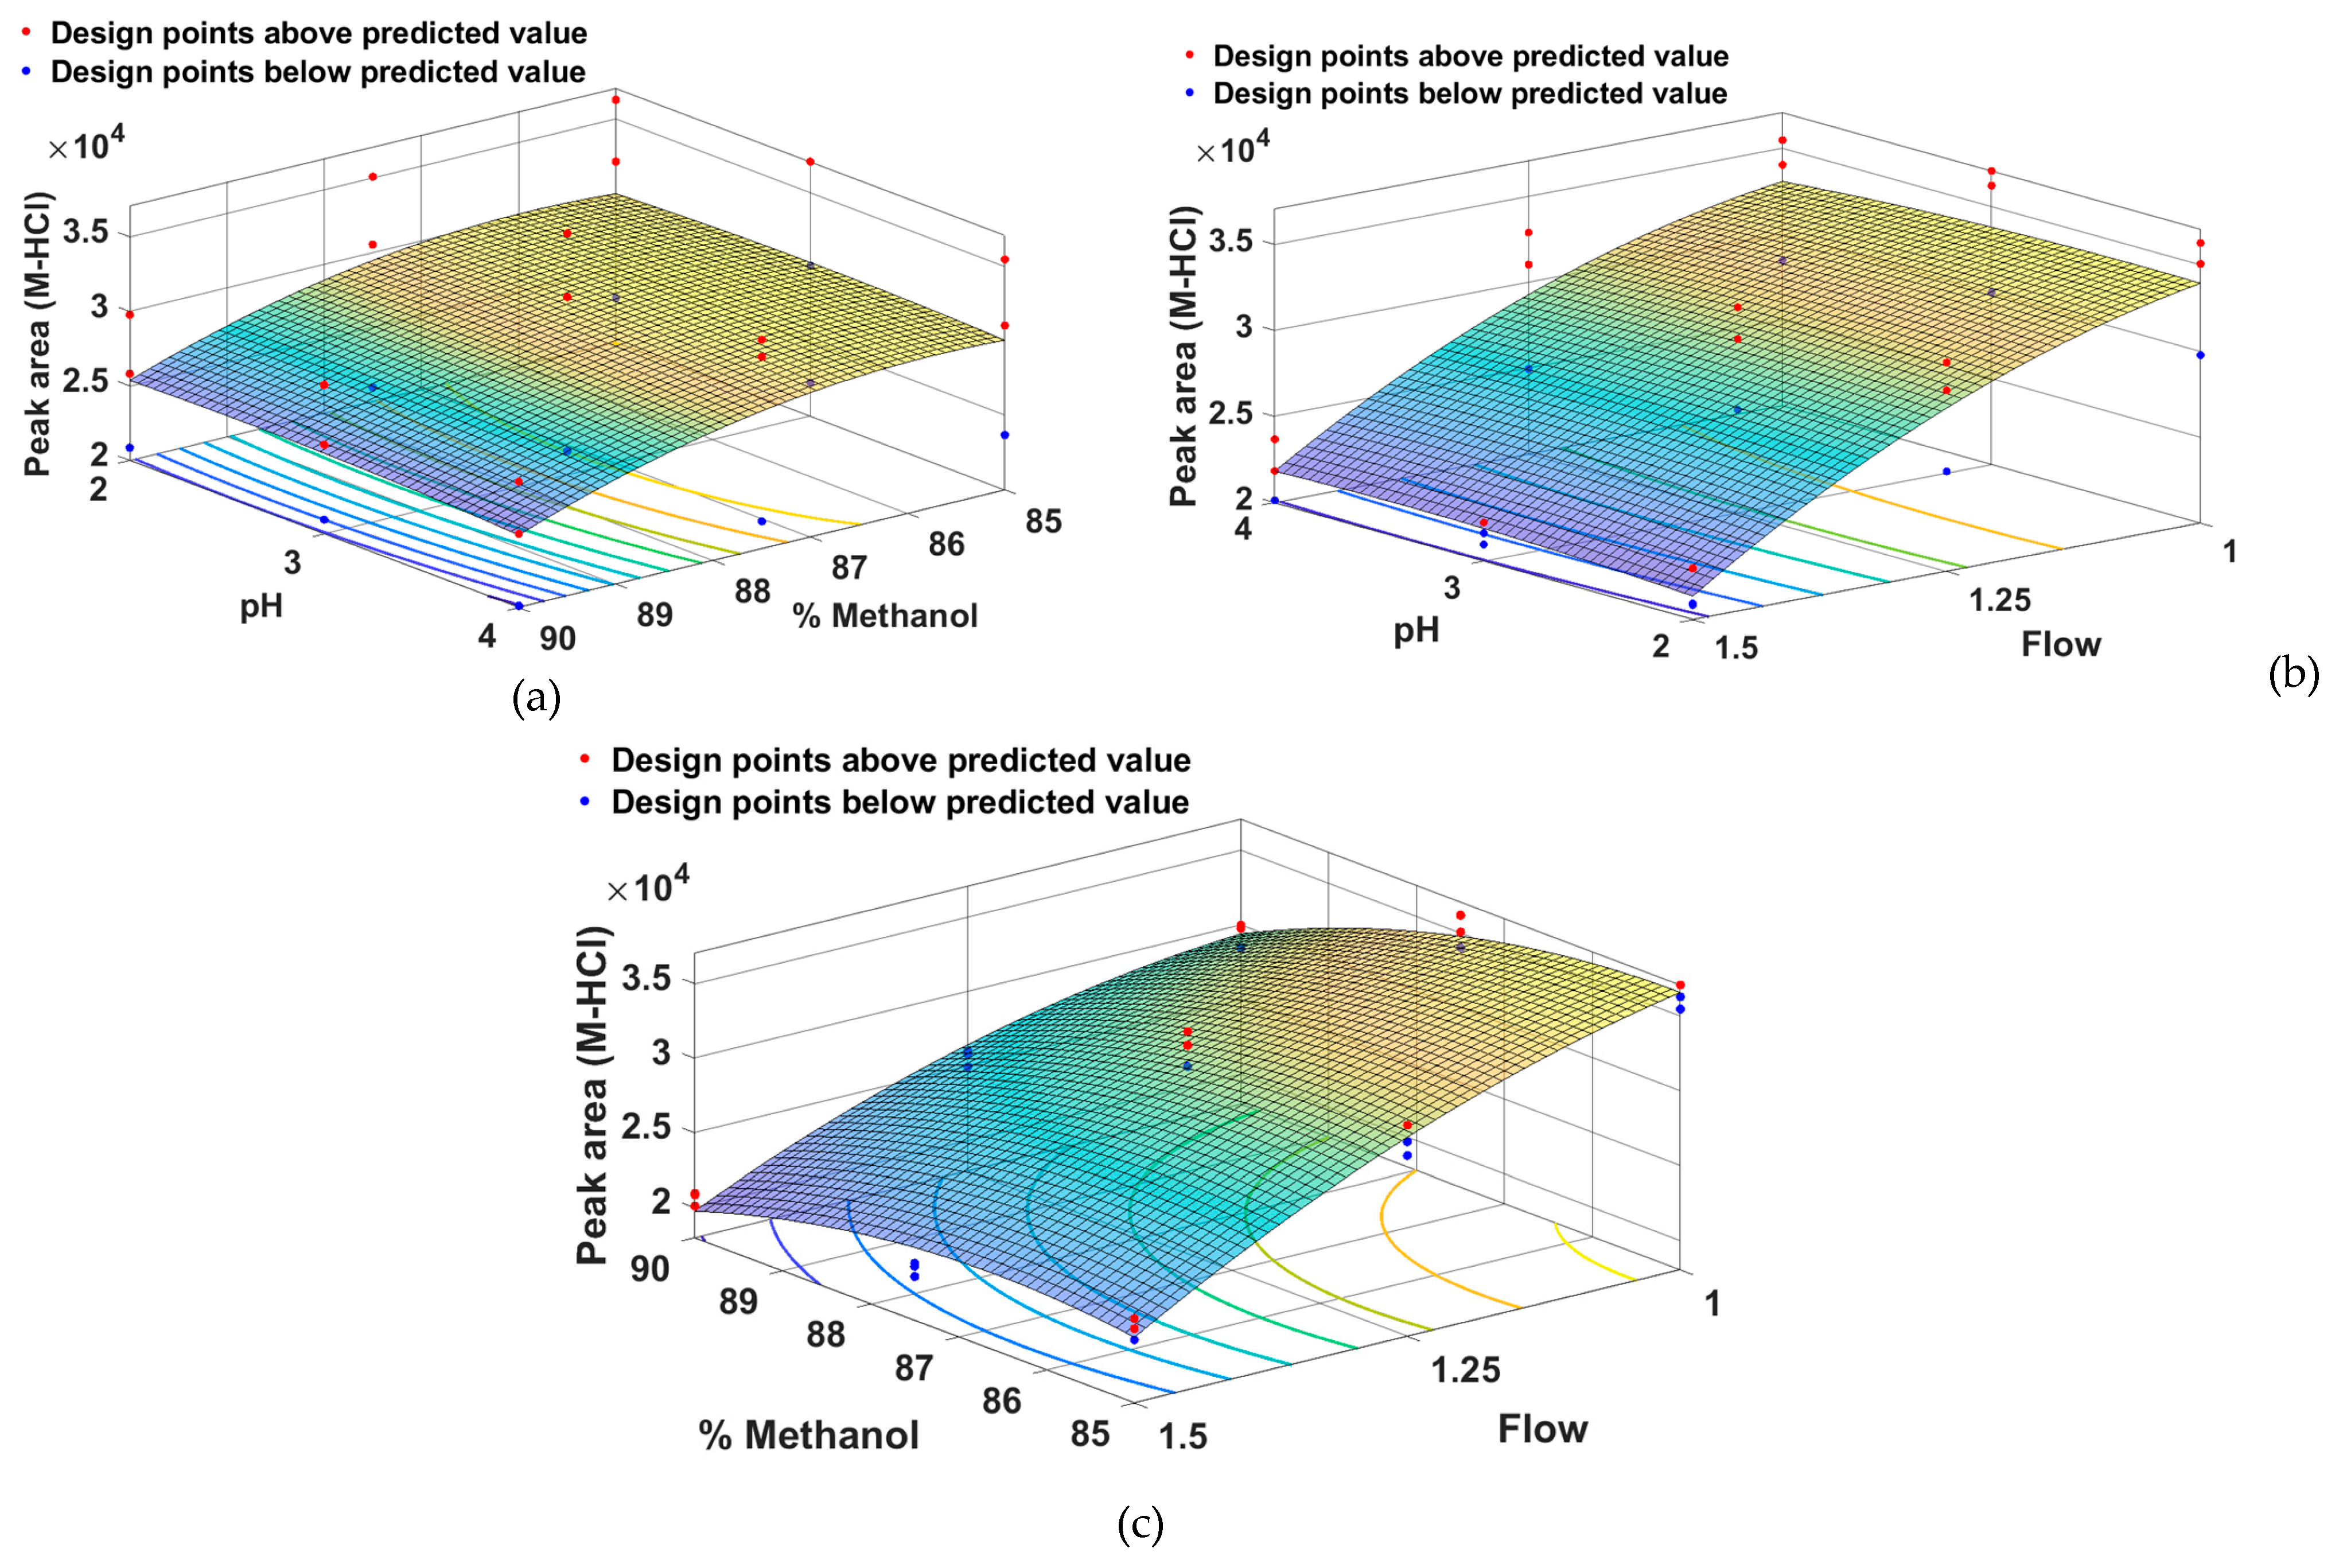
Figure 5.
Surface response models showing the effect of (a) pH and methanol percentage, (b) pH and flow, (c) methanol percentage and flow on retention time of M-HCl.
Figure 5.
Surface response models showing the effect of (a) pH and methanol percentage, (b) pH and flow, (c) methanol percentage and flow on retention time of M-HCl.
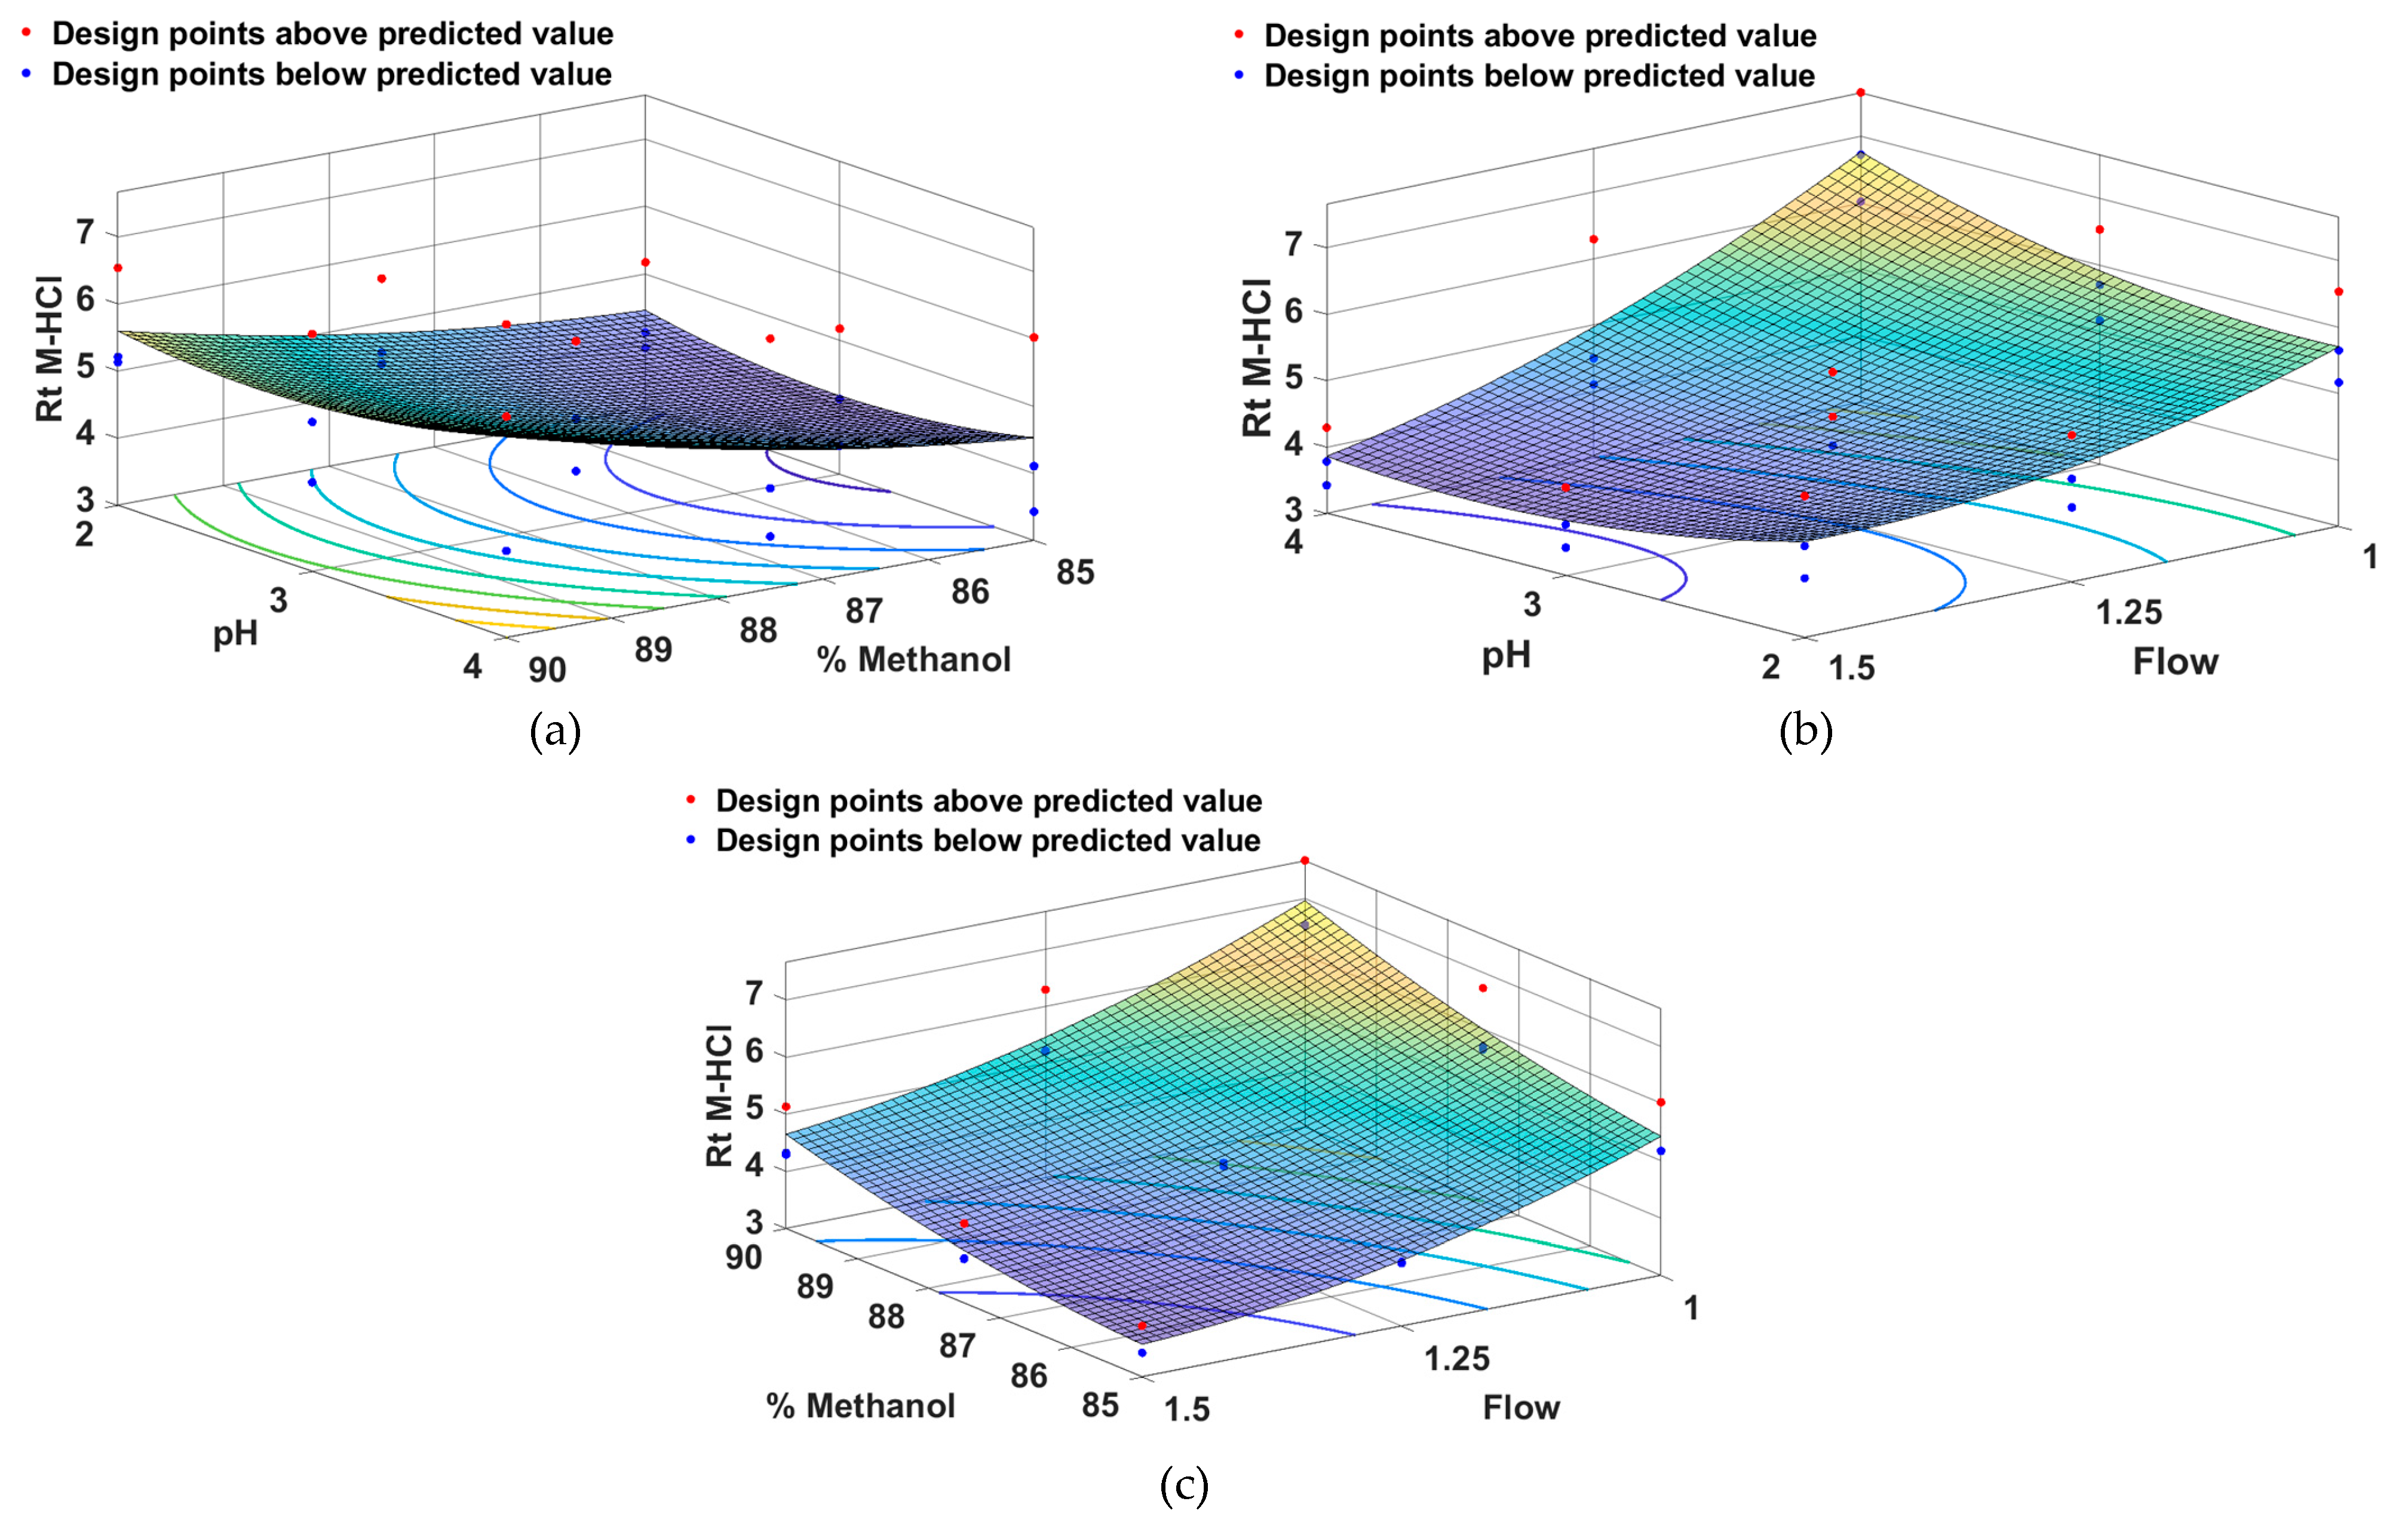
Figure 6.
3D Surface plot in case of (a) pH – percent of methanol, (b) pH – flow, (c) percent of methanol – flow and (d) 4D Surface plot for desirability.
Figure 6.
3D Surface plot in case of (a) pH – percent of methanol, (b) pH – flow, (c) percent of methanol – flow and (d) 4D Surface plot for desirability.
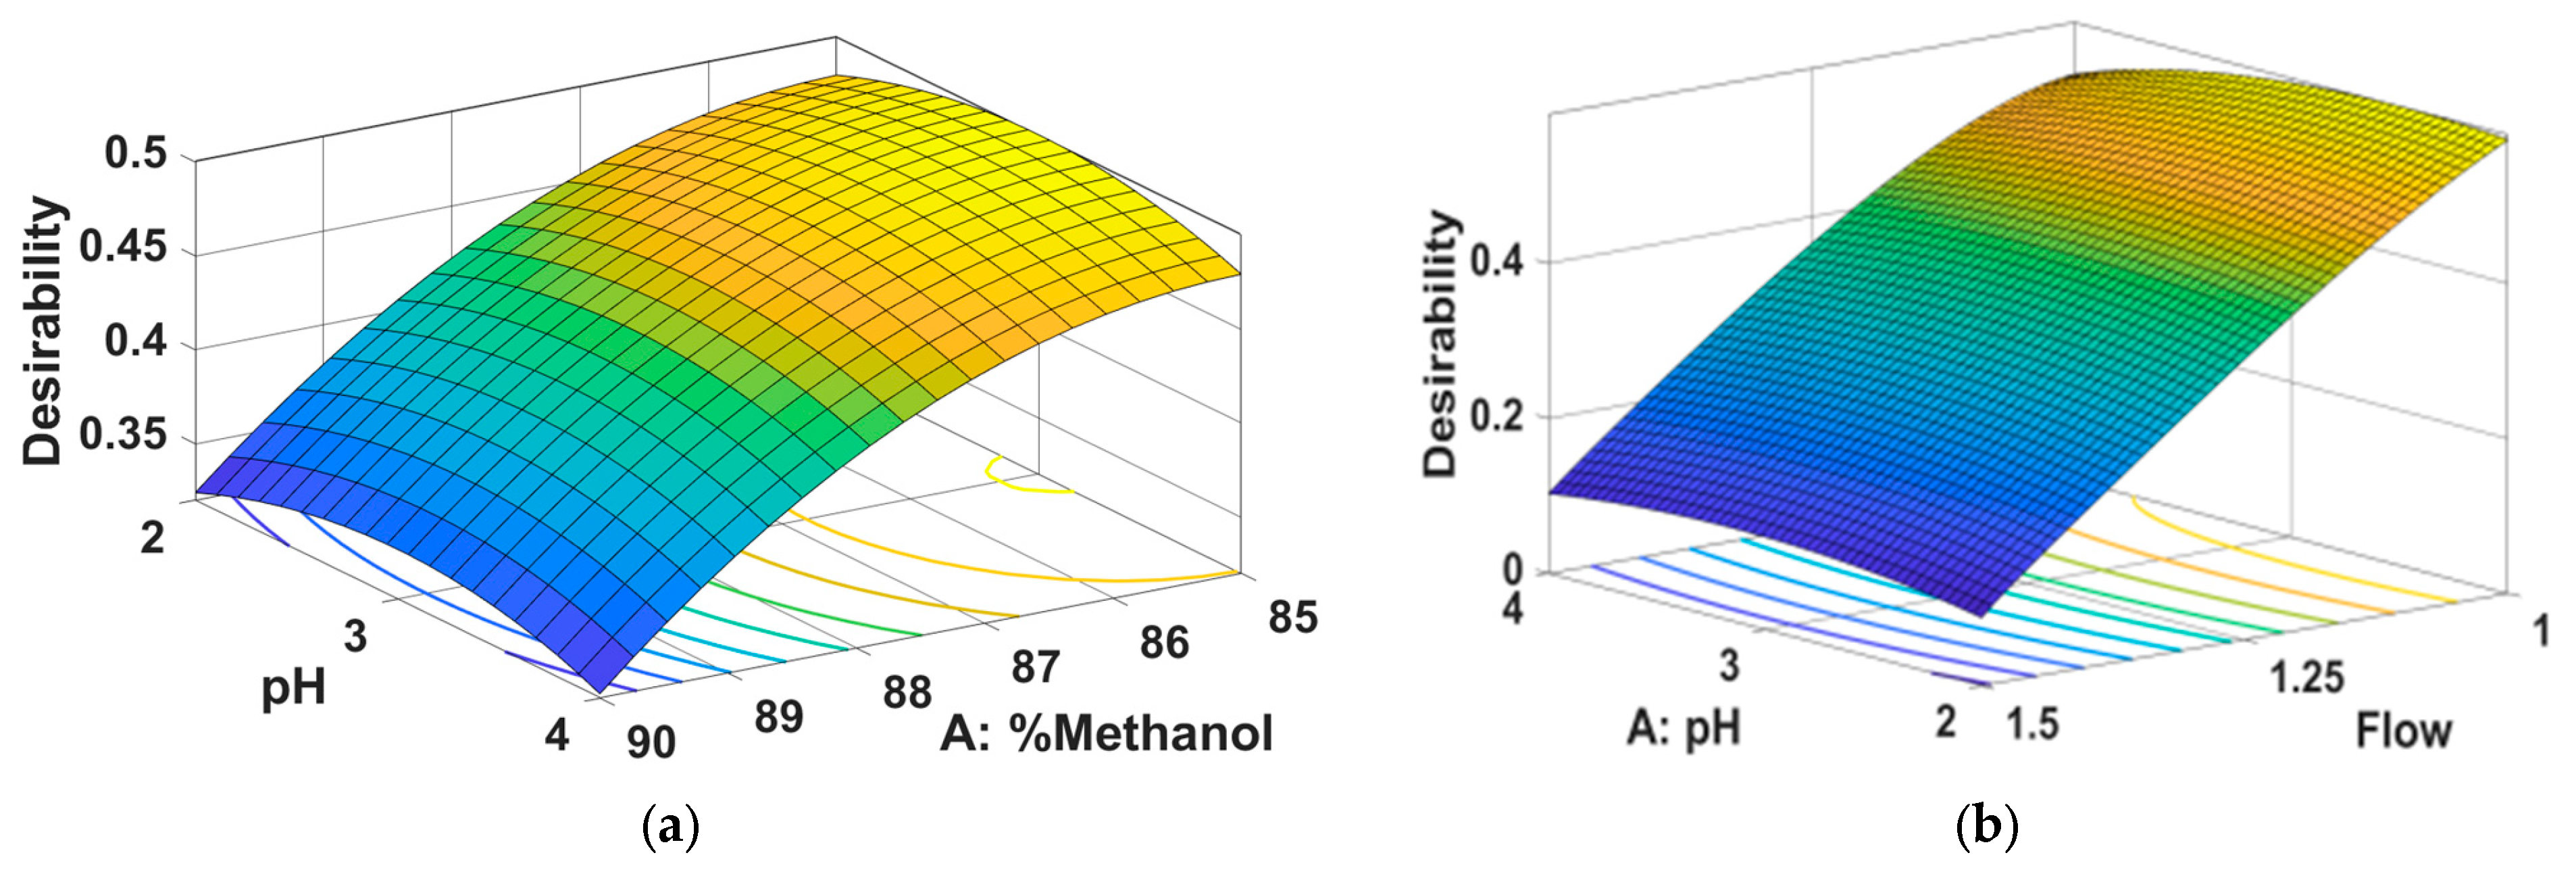
Figure 7.
The chromatograms obtained under the optimized conditions of the method, Rt = 3.935 min (HNK) and Rt = 5.722 min (M-HCl).
Figure 7.
The chromatograms obtained under the optimized conditions of the method, Rt = 3.935 min (HNK) and Rt = 5.722 min (M-HCl).
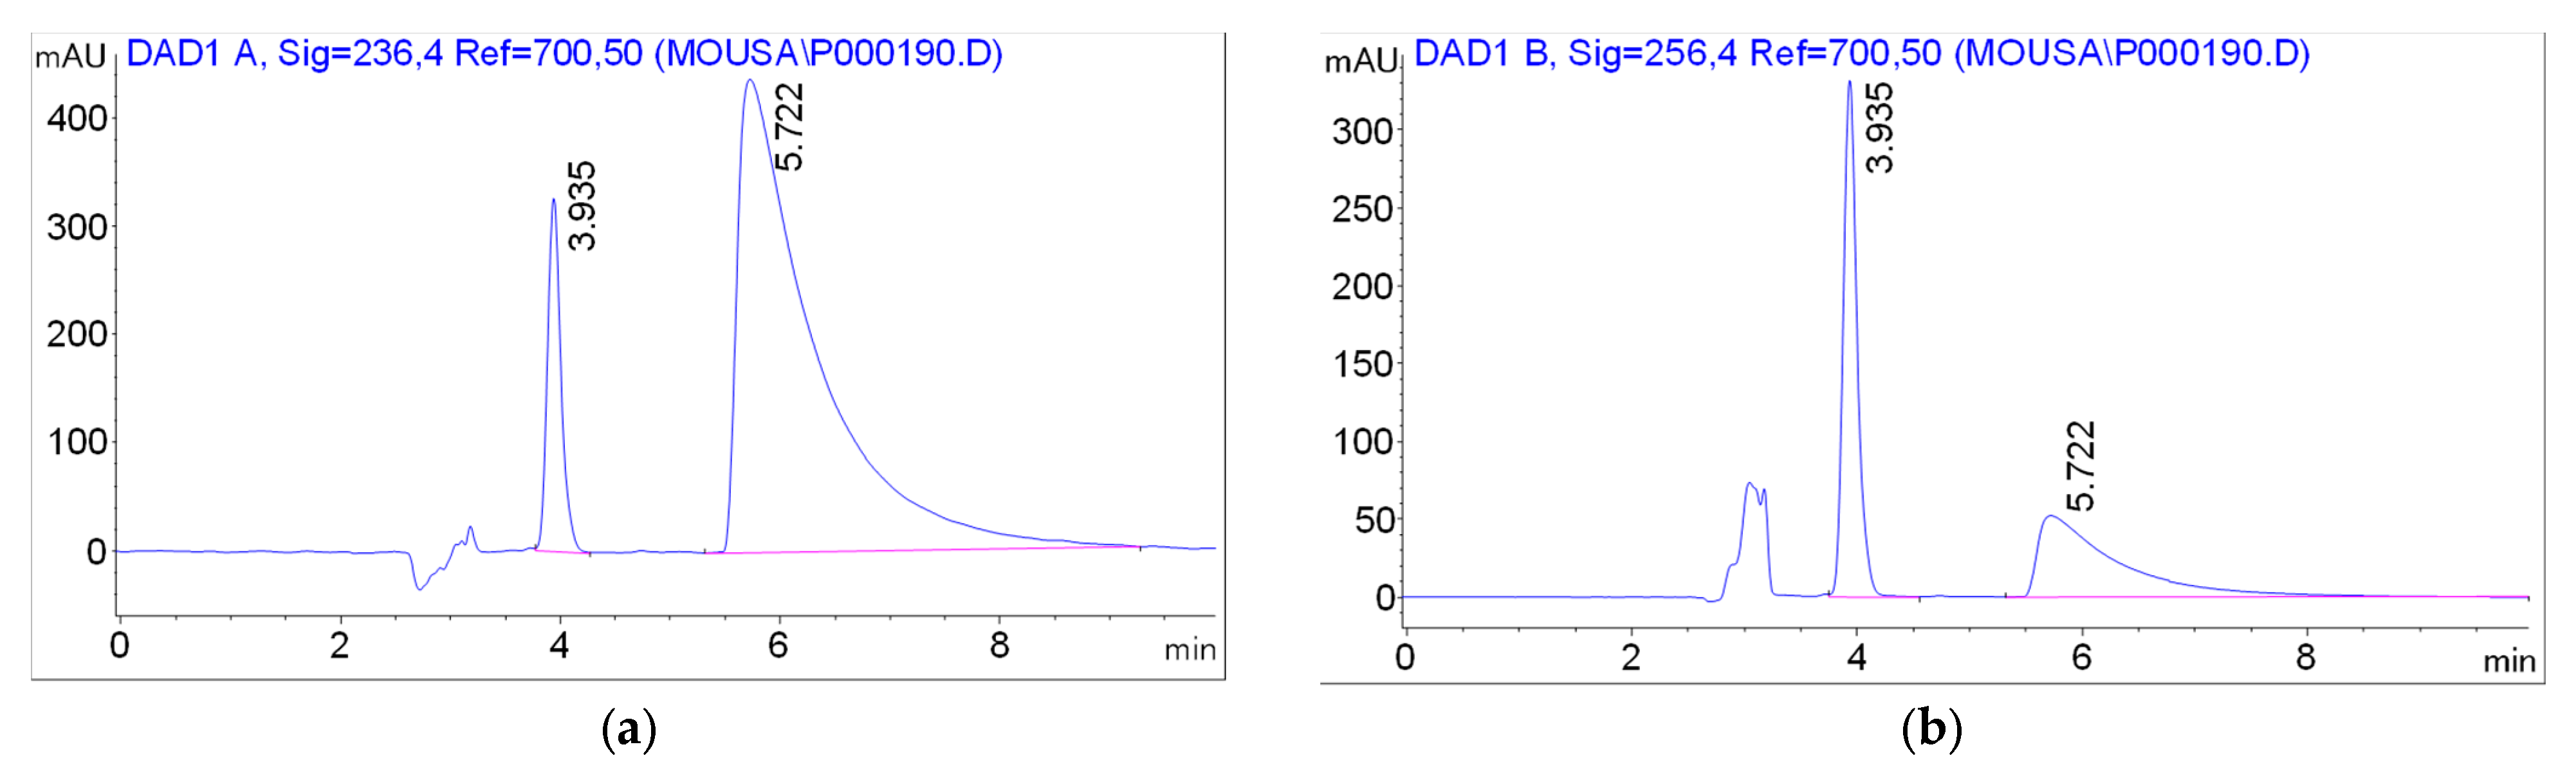
Figure 8.
Calibration curves for determination of M-HCl and HNK by HPLC.
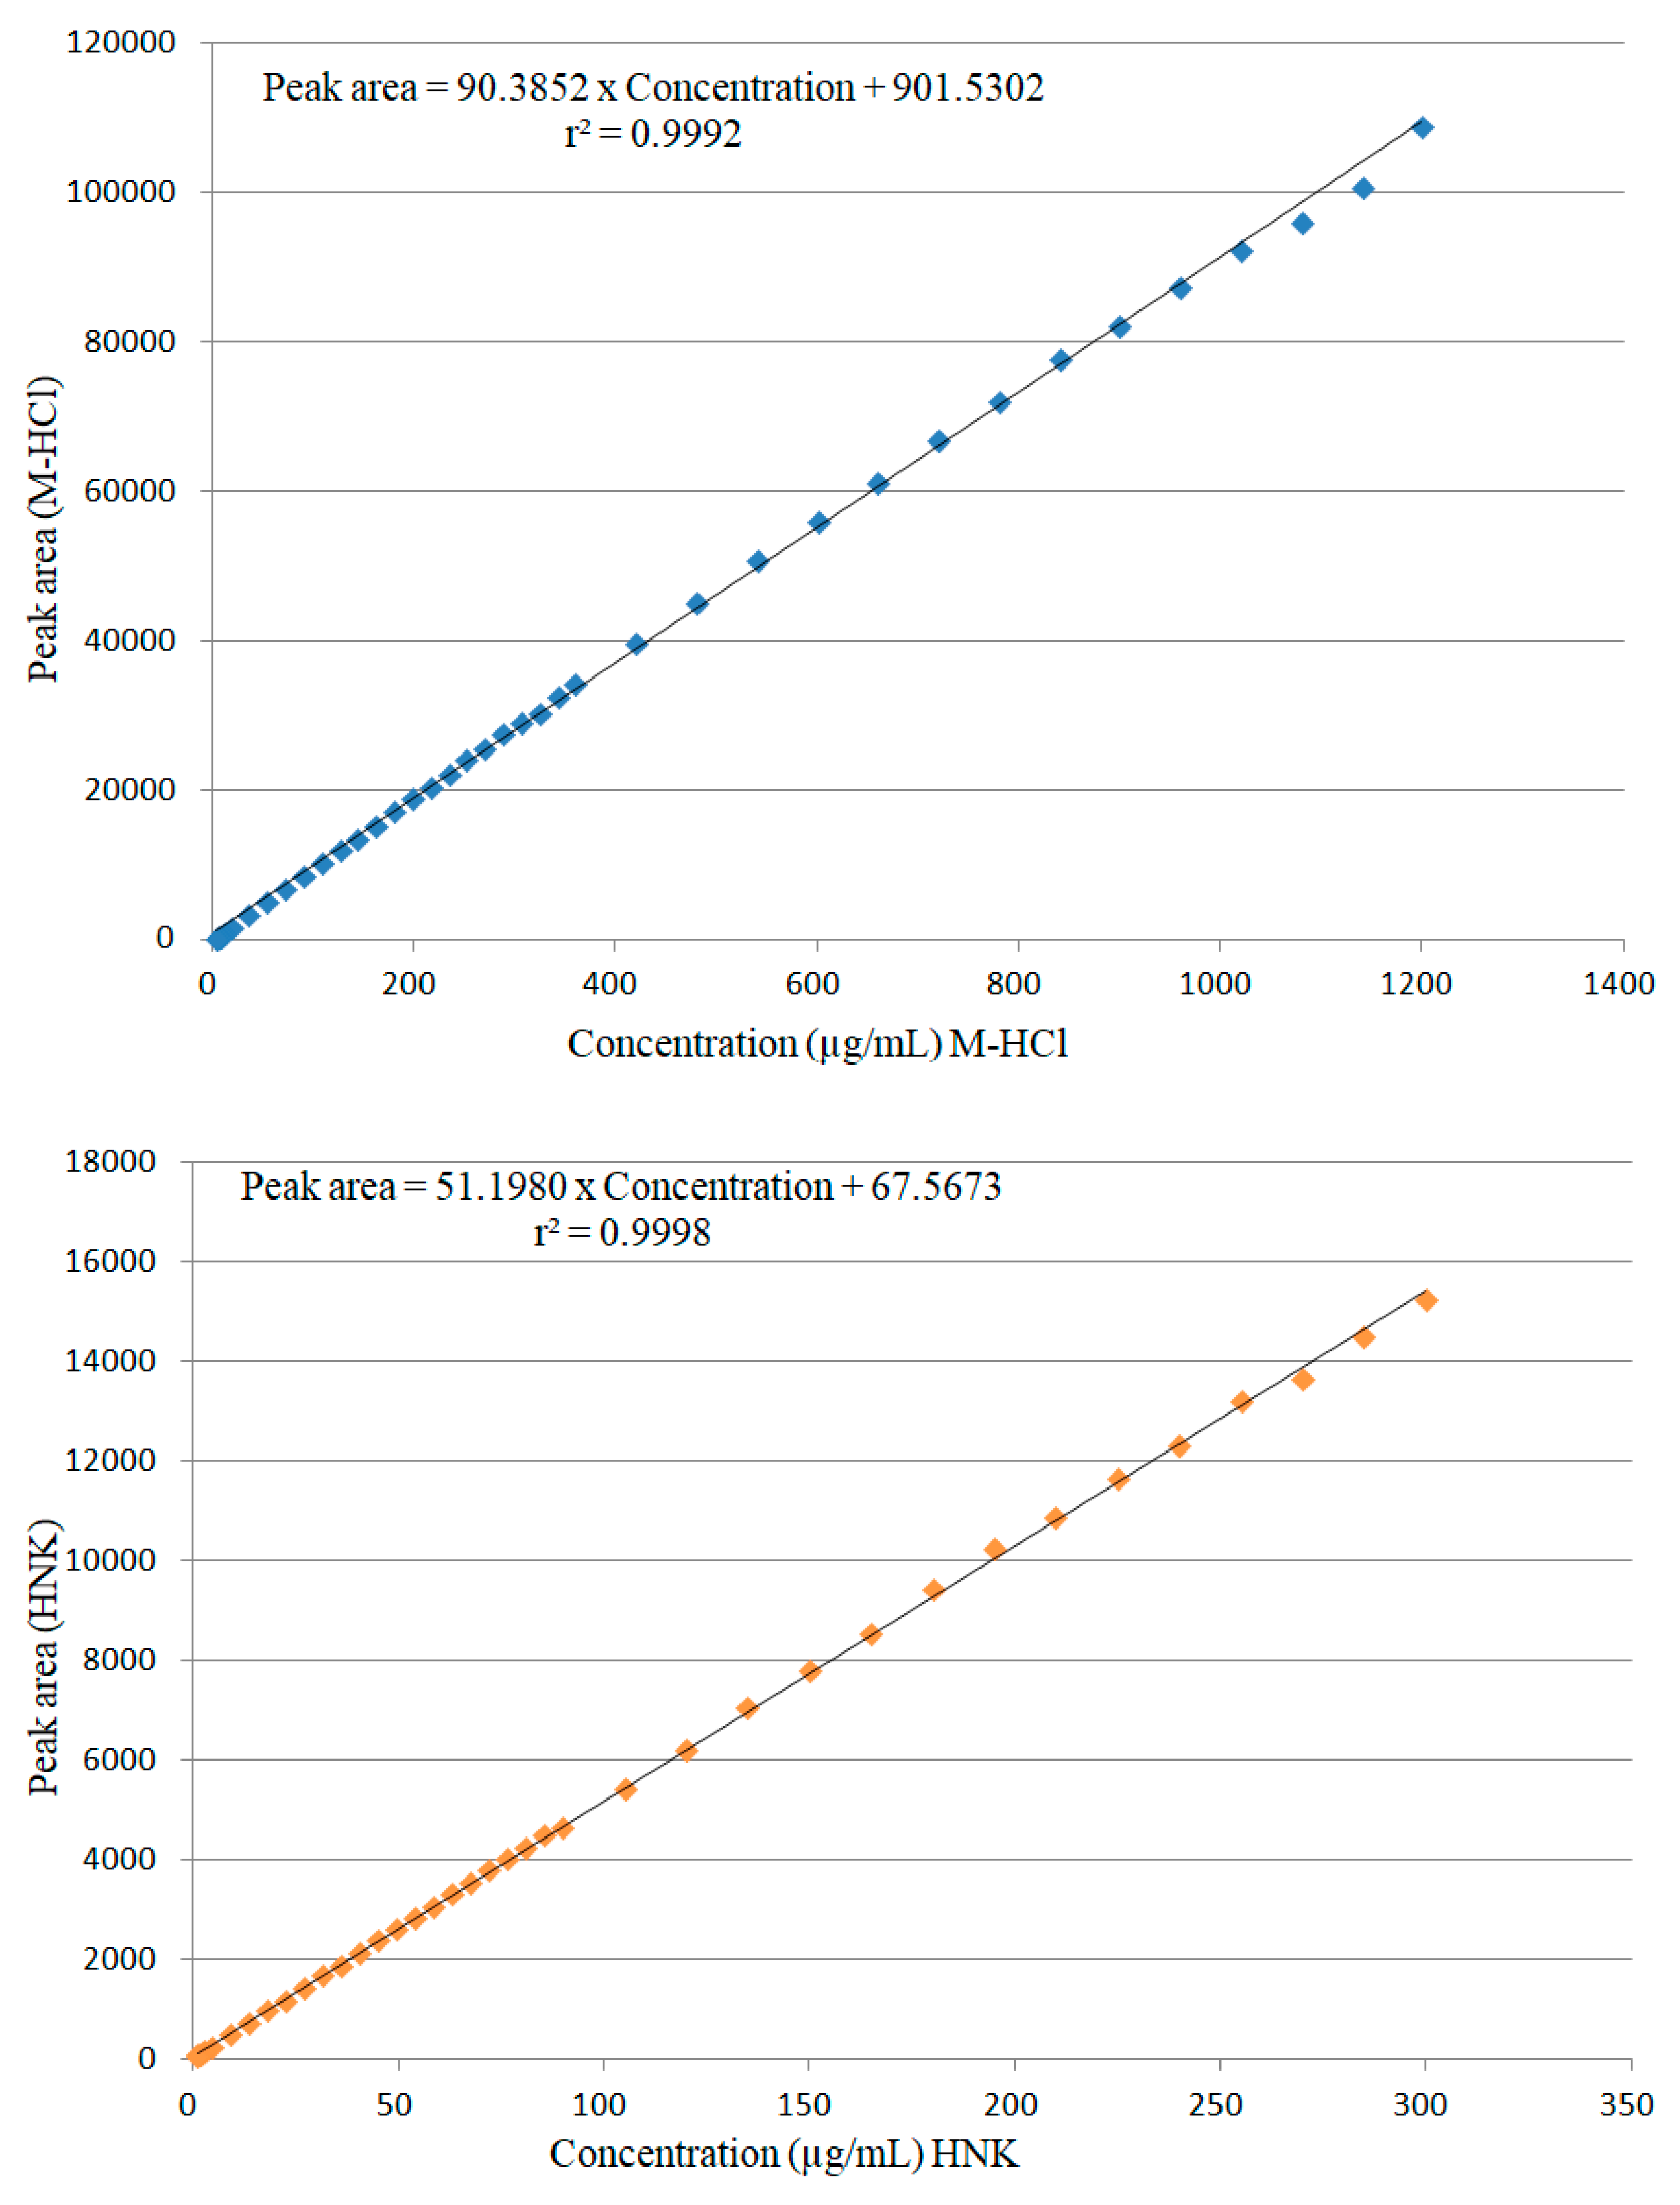
Figure 9.
Release profile of (a) M-HCl and (b) HNK from tested prolonged-release tablets.
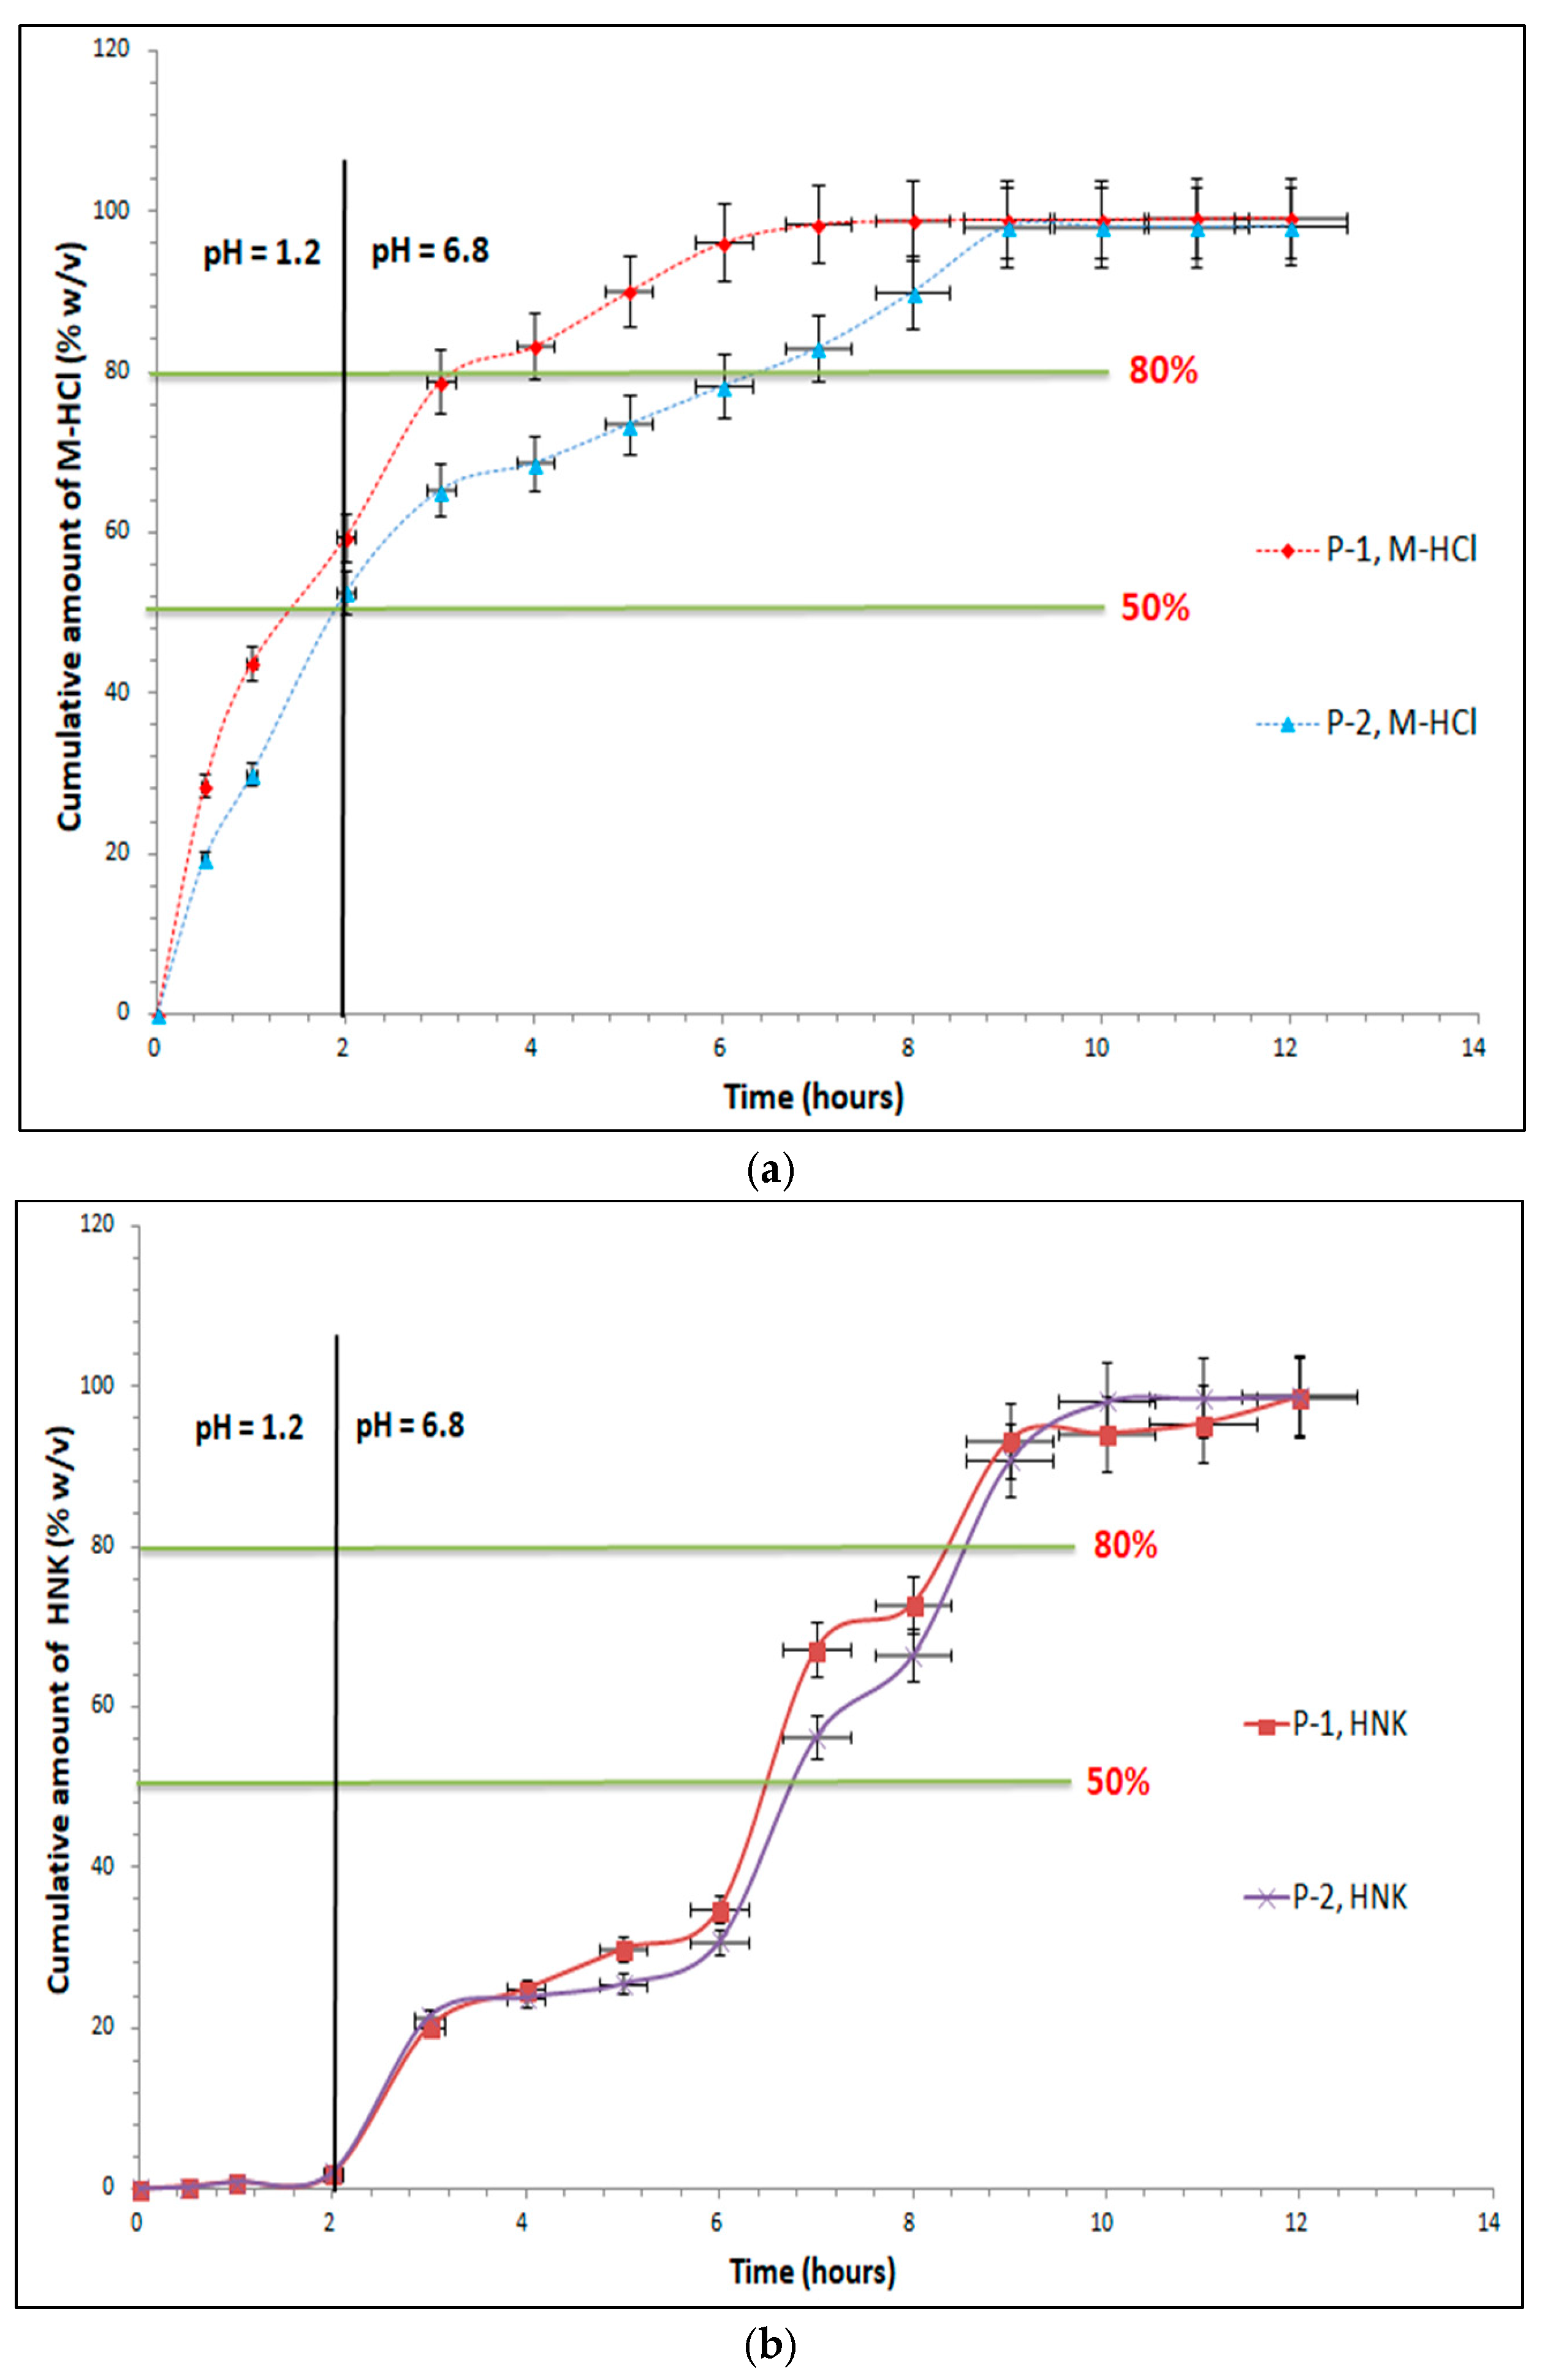
Figure 10.
Analytical GREEnness Metric (AGREE) for HPLC method (M-HCl / HNK).
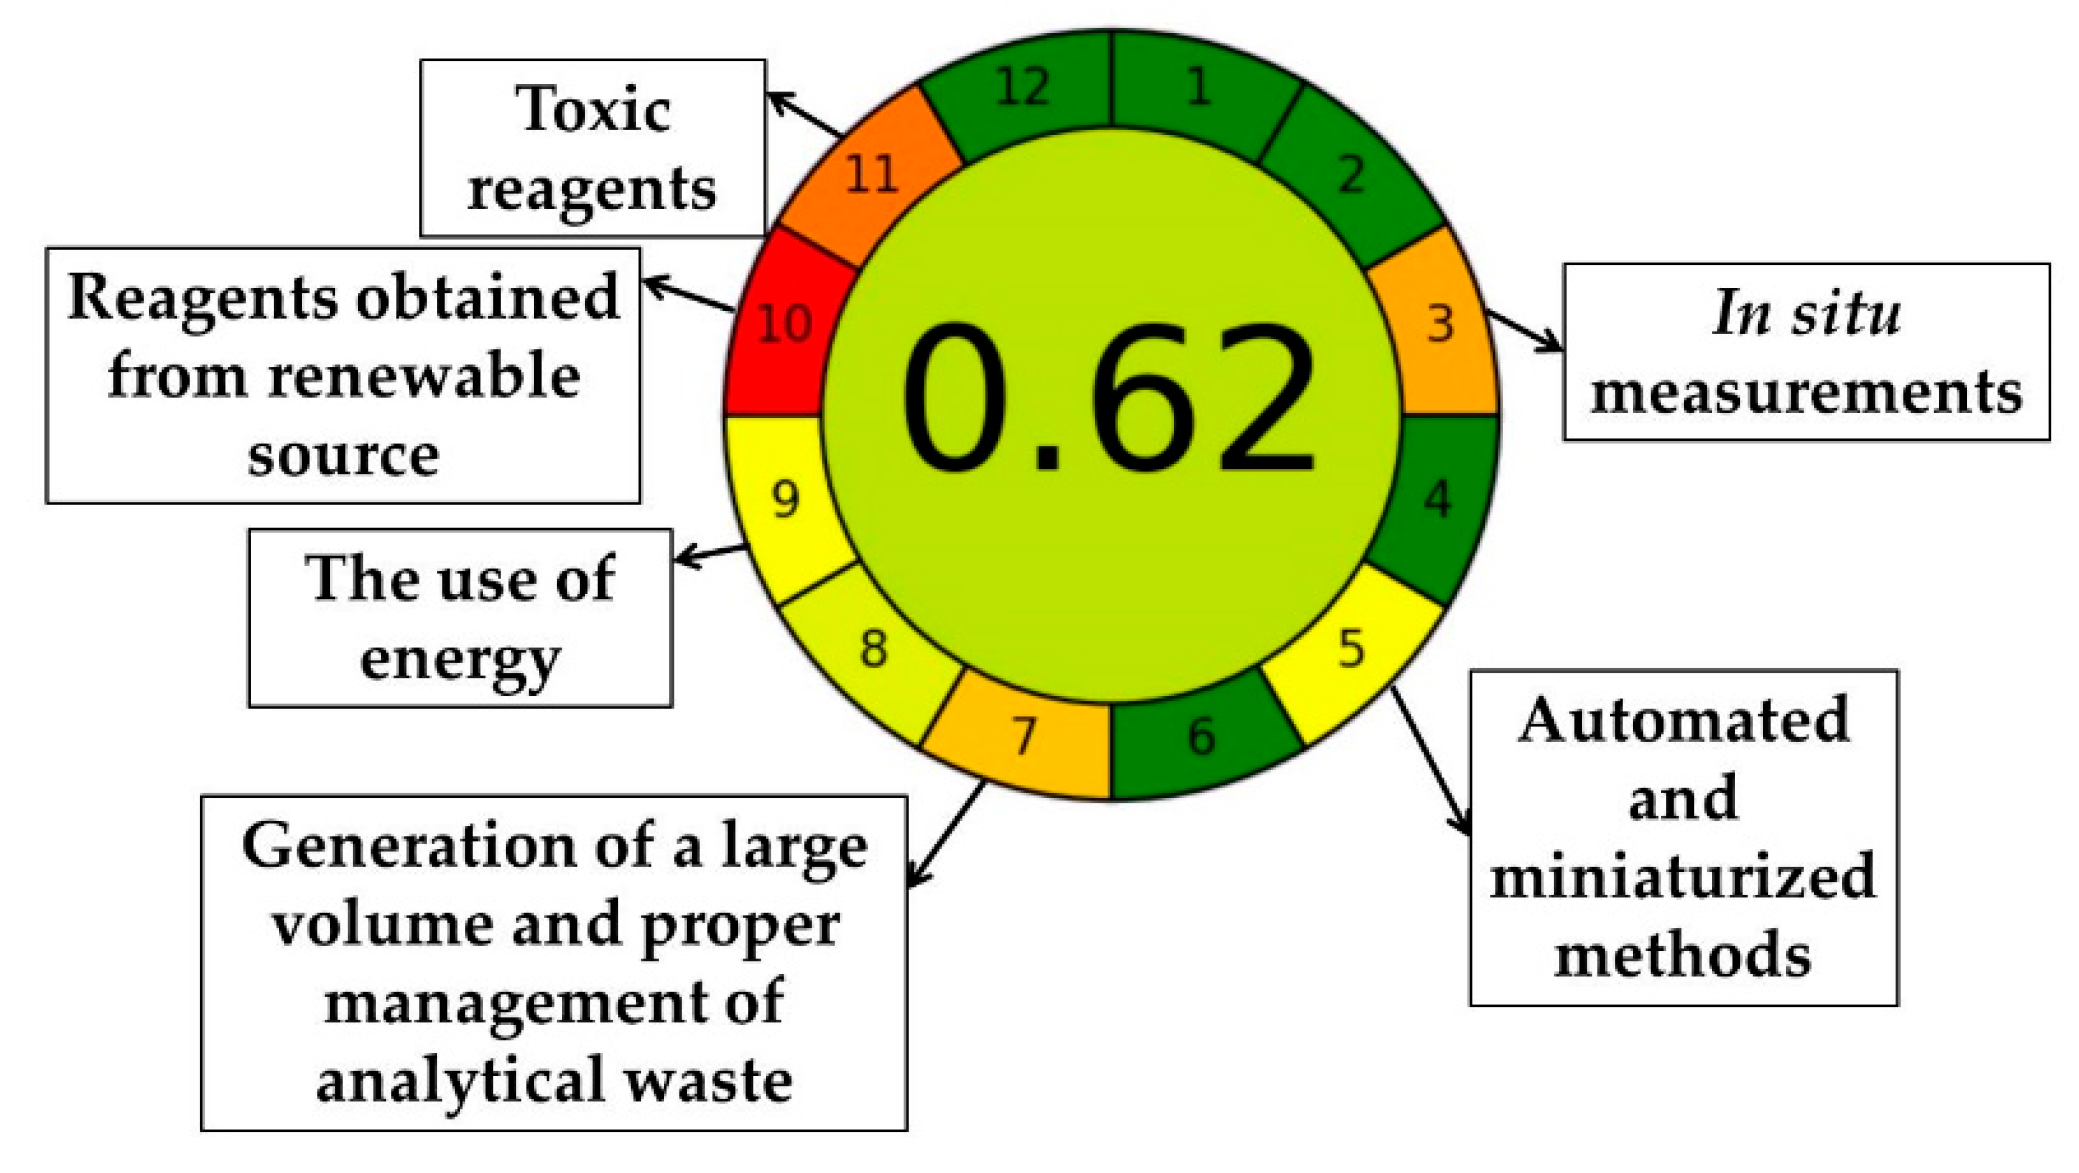
Figure 11.
The schematic of three factors, three level (33) design.
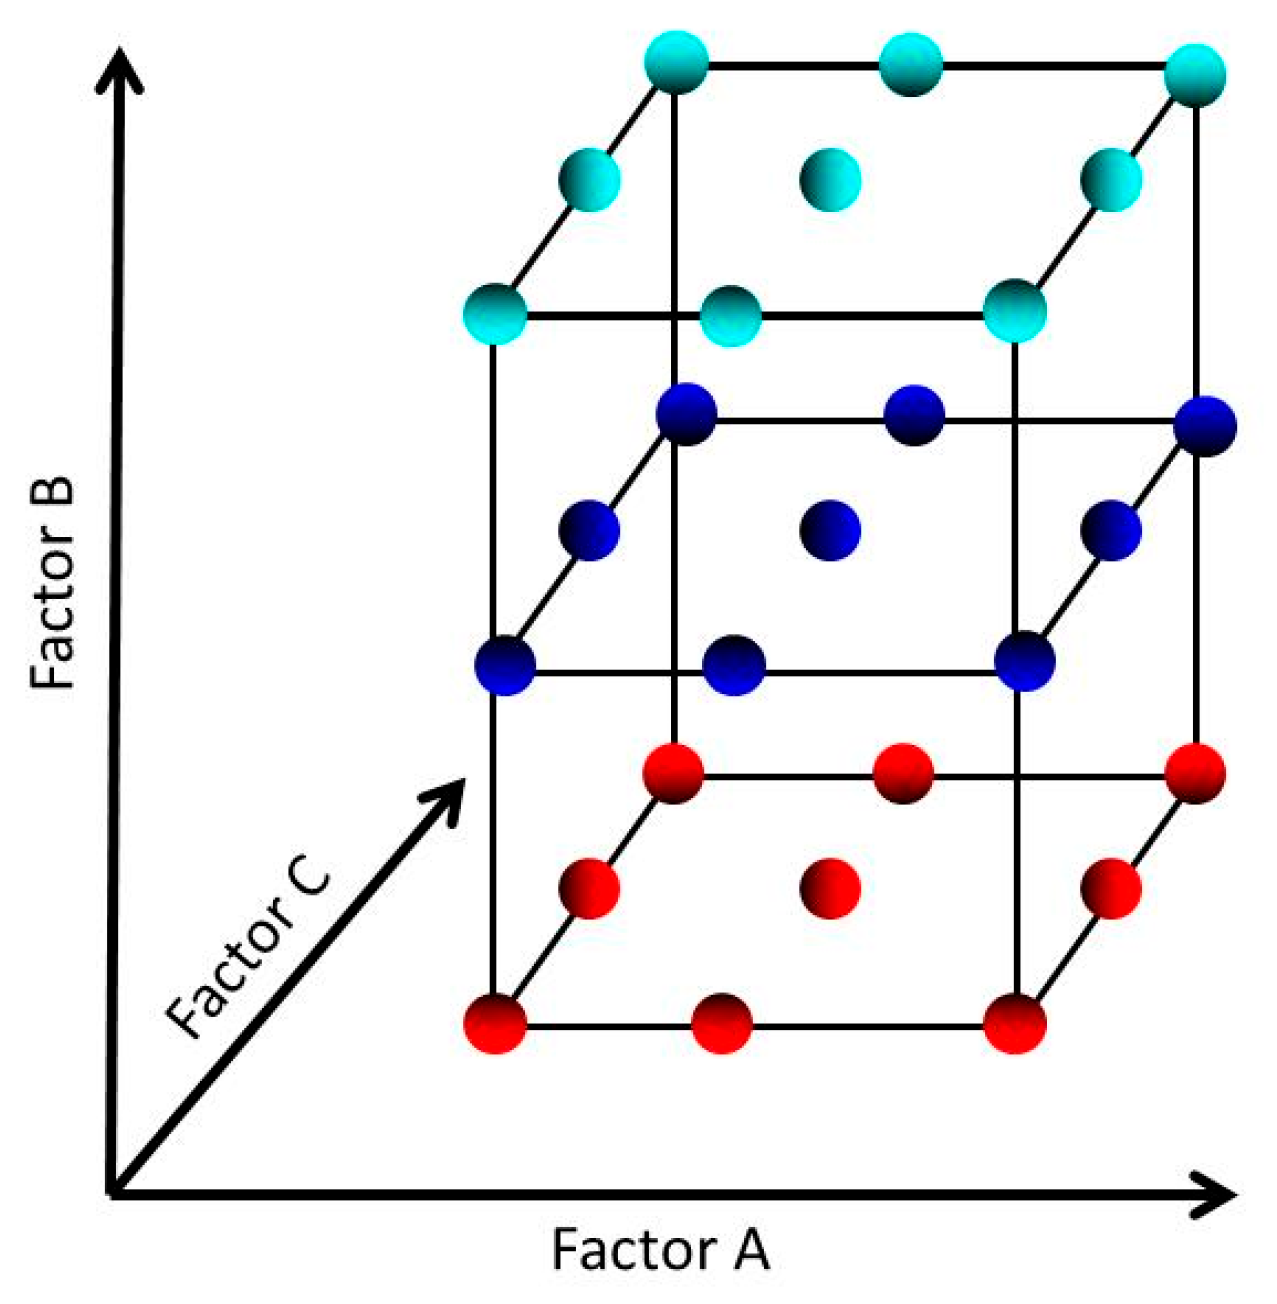

Table 1.
Design matrix for optimization of parameters for HPLC analysis of HNK and M-HCl.
| Run | Run order | Factor 1 | Factor 2 | Factor 3 | Response 1 | Response 2 | Response 3 |
|---|---|---|---|---|---|---|---|
| Methanol (%) |
pH | Flow (mL/min) |
Peak area (HNK) |
Peak area (M-HCl) |
Rt M-HCl (min) |
||
| 1 | 1 | 85 | 2 | 1 | 26934.4 | 36288.5 | 5.170 |
| 2 | 13 | 87.5 | 2 | 1 | 26051.8 | 35084.3 | 5.651 |
| 3 | 3 | 90 | 2 | 1 | 24065.6 | 29777.44 | 6.537 |
| 4 | 5 | 85 | 2 | 1.25 | 20652.0 | 32147.4 | 4.125 |
| 5 | 17 | 87.5 | 2 | 1.25 | 19963.5 | 30535.5 | 4.555 |
| 6 | 7 | 90 | 2 | 1.25 | 18914.8 | 25817.9 | 5.212 |
| 7 | 9 | 85 | 2 | 1.5 | 18052.4 | 22994.3 | 3.896 |
| 8 | 15 | 87.5 | 2 | 1.5 | 17096.1 | 20943.2 | 4.381 |
| 9 | 11 | 90 | 2 | 1.5 | 16482.0 | 20862.1 | 5.132 |
| 10 | 21 | 85 | 3 | 1 | 27366.9 | 37076.2 | 5.167 |
| 11 | 25 | 87.5 | 3 | 1 | 26577.8 | 36215.17 | 5.702 |
| 12 | 23 | 90 | 3 | 1 | 24623.7 | 30006.2 | 6.535 |
| 13 | 20 | 85 | 3 | 1.25 | 21042.0 | 30104.6 | 4.119 |
| 14 | 27 | 87.5 | 3 | 1.25 | 20627.6 | 31948.4 | 4.553 |
| 15 | 18 | 90 | 3 | 1.25 | 19280.3 | 25998 | 5.228 |
| 16 | 22 | 85 | 3 | 1.5 | 17406.8 | 22245.6 | 3.423 |
| 17 | 26 | 87.5 | 3 | 1.5 | 17451.7 | 21623.1 | 3.770 |
| 18 | 24 | 90 | 3 | 1.5 | 16868.4 | 20969.6 | 4.327 |
| 19 | 2 | 85 | 4 | 1 | 27219.6 | 35458.15 | 6.020 |
| 20 | 14 | 87.5 | 4 | 1 | 26458.6 | 34020.9 | 6.725 |
| 21 | 4 | 90 | 4 | 1 | 24217.1 | 28466 | 7.664 |
| 22 | 6 | 85 | 4 | 1.25 | 20970.1 | 31024.5 | 4.105 |
| 23 | 19 | 87.5 | 4 | 1.25 | 20429.2 | 32885.2 | 4.500 |
| 24 | 8 | 90 | 4 | 1.25 | 19543.6 | 24956.4 | 6.292 |
| 25 | 10 | 85 | 4 | 1.5 | 17241.7 | 23676.9 | 3.426 |
| 26 | 16 | 87.5 | 4 | 1.5 | 17337.4 | 21837 | 3.783 |
| 27 | 12 | 90 | 4 | 1.5 | 16816.4 | 20120.31 | 4.293 |
Table 2.
Statistical calculation of a second-order polynomial exploring quadratic response surfaces with equation Response = β0 +β1⋅A + β2⋅B + β3⋅C + β4⋅A⋅B + β5⋅A⋅C + β6⋅B⋅C + β7⋅A2 + β8⋅B2 + β9⋅C2.
Table 2.
Statistical calculation of a second-order polynomial exploring quadratic response surfaces with equation Response = β0 +β1⋅A + β2⋅B + β3⋅C + β4⋅A⋅B + β5⋅A⋅C + β6⋅B⋅C + β7⋅A2 + β8⋅B2 + β9⋅C2.
| Peak area (HNK) | Peak area (M-HCl) | Rt (M-HCl) | |||||||
|---|---|---|---|---|---|---|---|---|---|
| Coefficient | t-Stat | P-value | Coefficient | t-Stat | P-value | Coefficient | t-Stat | P-value | |
| β0 | –222525.41 | –1.849 | 0.082 | –1904154* | –3.0572 | 0.007 | 214.03 | 2.0114 | 0.060 |
| β1 | 8281.01* | 3.025 | 0.007 | 46999* | 3.3178 | 0.004 | –4.9477 | –2.0444 | 0.056 |
| β2 | –1946.43 | –0.776 | 0.449 | 4826.5 | 0.37163 | 0.715 | –2.6944 | –1.2144 | 0.241 |
| β3 | –143856.08* | –13.76 | 1.207×10⁻¹⁰ | –112896.35* | –2.0866 | 0.049 | 2.9691 | 0.32122 | 0.752 |
| β4 | 44.07 | 1.597 | 0.129 | –54.803 | –0.38366 | 0.706 | 0.0336 | 1.3768 | 0.186 |
| β5 | 810.72* | 7.343 | 1.149×10⁻⁶ | 1814.5* | 3.1756 | 0.005 | –0.1829 | –1.874 | 0.078 |
| β6 | –359.50 | –1.303 | 0.210 | 1346.6 | 0.94272 | 0.359 | –1.6527* | –6.7722 | 0.000 |
| β7 | –55.91* | –3.581 | 0.002 | –286.18* | –3.5417 | 0.002 | 0.0305* | 2.2092 | 0.041 |
| β8 | –55.91* | –2.302 | 0.034 | –304.32 | –0.60258 | 0.555 | 0.3233* | 3.7469 | 0.001 |
| β9 | 22597.51* | 14.47 | 5.456×10⁻¹¹ | –29485* | –3.649 | 0.001 | 5.5324* | 4.0076 | 0.001 |
* coefficients that are statistically significant at 95% confidence level.
Table 3.
Other relevant statistics.
| Peak area HNK | Peak area M-HCl | Retention time M-HCl | |
|---|---|---|---|
| 0.9974 | 0.9686 | 0.9763 | |
| 0.9961 | 0.9520 | 0.9637 | |
| 239 | 1237.1 | 0.211 |
RMSE - root mean square error.
Table 4.
The optimal formulation.
| %Methanol | pH | Flow | Peak area HNK | Peak area M-HCl | Retention time M-HCl | Desirability |
|---|---|---|---|---|---|---|
| 85 | 3 | 1 | 27379.17 | 36786.70 | 5.21 | 0.82 |
| Optimization | maximize | maximize | minimize | |||
| Priority | 3 | 2 | 1 | |||
Table 5.
Final chromatographic conditions.
| Parameters | Values |
|---|---|
| Stationary phase (column) | Thermoscientific ODS Hypersyl TM (250 x 4.6 mm, 5 μm) |
| Mobile phase | 0.02 M acetate buffer (pH = 3) / methanol (15/85, v/v) |
| Flow rate | 1 mL/min |
| Column temperature | 35 °C |
| Injection volume | 20 μL |
| Detection wavelength | 256 nm (HNK), 236 nm (M-HCl) |
| Retention time | 3.935 ± 0.197 min (HNK), 5.722 ± 0.286 min (M-HCl) |
Table 6.
System precision.
| No. | Peak area (M-HCl) | Statistics | Peak area (HNK) | Statistics |
|---|---|---|---|---|
| 1 | 37175.5 | Mean = 37119.97 SD = 125.0813 RSD = 0.3370% |
5190.1 | Mean = 5193.02 SD = 20.6052 RSD = 0.3968% |
| 2 | 37104.6 | 5184.2 | ||
| 3 | 37341.9 | 5230.4 | ||
| 4 | 37009.9 | 5177.7 | ||
| 5 | 37030.6 | 5201.1 | ||
| 6 | 37045.3 | 5174.6 |
Table 7.
Precision of the assay method of M-HCl and HNK by HPLC.
| Concentration (µg/mL) |
Method precision | Intermediate precision | ||
|---|---|---|---|---|
| Peak area | Statistics | Peak area | Statistics | |
| M-HCl | ||||
| 320 | 29784.7 | Mean = 29804.13 | 29784.6 | Mean = 29826.10 |
| 29834.6 | SD = 26.7171 | 30014.3 | SD = 171.2635 | |
| 29793.1 | RSD = 0.0896% | 29679.4 | RSD = 0.5742% | |
| 400 | 37009.9 | Mean = 37028.60 | 36820.3 | Mean = 37080.00 |
| 37030.6 | SD = 17.7845 | 37145.6 | SD = 233.9041 | |
| 37045.3 | RSD = 0.0480% | 37274.1 | RSD = 0.6308% | |
| 480 | 44285.4 | Mean = 44393.60 | 44217.5 | Mean = 44319.43 |
| 44453.2 | SD = 98.8652 | 44246.6 | SD = 152.0501 | |
| 44442.2 | RSD = 0.2114% | 44494.2 | RSD = 0.3431% | |
| HNK | ||||
| 80 | 4140.8 | Mean = 4160.87 | 4204.2 | Mean = 4175.57 |
| 4168.1 | SD = 17.6024 | 4155.9 | SD = 25.3678 | |
| 4173.7 | RSD = 0.4230% | 4166.6 | RSD = 0.6075% | |
| 100 | 5177.7 | Mean = 5184.47 | 5222.9 | Mean = 5235.40 |
| 5201.1 | SD = 14.4880 | 5224.1 | SD = 20.6201 | |
| 5174.6 | RSD = 0.2795% | 5259.2 | RSD = 0.3939% | |
| 120 | 6218.7 | Mean = 6235.57 | 6356.2 | Mean = 6352.67 |
| 6245.7 | SD = 14.7056 | 6365.1 | SD = 14.5260 | |
| 6242.3 | RSD = 0.2358% | 6336.7 | RSD = 0.2287% | |
SD – standard deviation; RSD – relative standard deviation.
Table 8.
Accuracy of the assay method of M-HCl and HNK by HPLC.
| Method accuracy | |||||
|---|---|---|---|---|---|
| M-HCl | HNK | ||||
| Concentration (µg/mL) |
Peak area | Recovery (%) | Concentration (µg/mL) |
Peak area | Recovery (%) |
| 320 | 29818.6 | 99.98 | 80 | 4176.3 | 100.31 |
| 29820.9 | 99.99 | 4171.2 | 100.19 | ||
| 29876.7 | 100.18 | 4150.9 | 99.70 | ||
| 400 | 37212.2 | 100.43 | 100 | 5206.8 | 100.38 |
| 36989.2 | 99.82 | 5188.8 | 100.03 | ||
| 37184.9 | 100.36 | 5202.9 | 100.30 | ||
| 480 | 44374.6 | 100.20 | 120 | 6210.5 | 99.98 |
| 44199.5 | 99.80 | 6209.9 | 99.98 | ||
| 44300.2 | 100.03 | 6225.4 | 100.23 | ||
| Mean recovery (%) = 100.09 Minimum (%) = 99.80 Maximum (%) = 100.43 |
Mean recovery (%) = 100.12 Minimum (%) = 99.70 Maximum (%) = 100.38 |
||||
SD – standard deviation; RSD – relative standard deviation.
Table 9.
Accuracy of the method in the range 108 – 1200 μg/mL for M-HCl.
| No. | CR (μg/mL) |
Mean peak area (n = 3) |
CM (μg/mL) |
Recovery (%) |
RE (%) |
|---|---|---|---|---|---|
| 1 | 108 | 10394.13 | 105.02 | 97.24 | 2.76 |
| 2 | 126 | 12188.93 | 124.88 | 99.11 | 0.89 |
| 3 | 144 | 13793.67 | 142.64 | 99.06 | 0.94 |
| 4 | 162 | 15542.87 | 161.99 | 99.99 | 0.01 |
| 5 | 180 | 17427.33 | 182.84 | 101.58 | 1.58 |
| 6 | 198 | 19208.90 | 202.55 | 102.30 | 2.30 |
| 7 | 216 | 20630.83 | 218.28 | 101.06 | 1.06 |
| 8 | 234 | 22268.60 | 236.40 | 101.03 | 1.03 |
| 9 | 252 | 24214.30 | 257.93 | 102.35 | 2.35 |
| 10 | 270 | 25772.73 | 275.17 | 101.91 | 1.91 |
| 11 | 288 | 27801.57 | 297.62 | 103.34 | 3.34 |
| 12 | 306 | 29199.47 | 313.08 | 102.31 | 2.31 |
| 13 | 324 | 30397.33 | 326.33 | 100.72 | 0.72 |
| 14 | 342 | 32738.03 | 352.23 | 102.99 | 2.99 |
| 15 | 360 | 34506.30 | 371.80 | 103.28 | 3.28 |
| 16 | 420 | 39979.80 | 432.35 | 102.94 | 2.94 |
| 17 | 480 | 45267.90 | 490.86 | 102.26 | 2.26 |
| 18 | 540 | 50976.57 | 554.02 | 102.60 | 2.60 |
| 19 | 600 | 56196.80 | 611.77 | 101.96 | 1.96 |
| 20 | 660 | 61372.30 | 669.03 | 101.37 | 1.37 |
| 21 | 720 | 67165.27 | 733.13 | 101.82 | 1.82 |
| 22 | 780 | 72354.53 | 790.54 | 101.35 | 1.35 |
| 23 | 840 | 78040.73 | 853.45 | 101.60 | 1.60 |
| 24 | 900 | 82284.63 | 900.40 | 100.04 | 0.04 |
| 25 | 960 | 87452.63 | 956.58 | 99.75 | 0.25 |
| 26 | 1020 | 92566.40 | 1014.16 | 99.43 | 0.57 |
| 27 | 1080 | 96253.60 | 1054.95 | 97.68 | 2.32 |
| 28 | 1140 | 100993.77 | 1107.40 | 97.14 | 2.86 |
| 29 | 1200 | 109041.37 | 1196.43 | 99.70 | 0.30 |
| Recovery (Minimum = 97.14%, Mean = 100.96%, Maximum = 103.34%), Mean percent error = 1.71% | |||||
CR – Real concentration of M-HCl; CM - Measured concentration of M-HCl.
Table 10.
Accuracy of the method in the range 27 – 300 μg/mL for HNK.
| No. | CR (μg/mL) |
Mean peak area (n = 3) |
CM (μg/mL) |
Recovery (%) |
RE (%) |
|---|---|---|---|---|---|
| 1 | 27 | 1419.27 | 26.40 | 97.78 | 2.22 |
| 2 | 31.5 | 1680.17 | 31.50 | 99.99 | 0.01 |
| 3 | 36 | 1872.47 | 35.25 | 97.93 | 2.07 |
| 4 | 40.5 | 2153.70 | 40.75 | 100.61 | 0.61 |
| 5 | 45 | 2404.13 | 45.64 | 101.42 | 1.42 |
| 6 | 49.5 | 2626.03 | 49.97 | 100.95 | 0.95 |
| 7 | 54 | 2842.05 | 54.19 | 100.35 | 0.35 |
| 8 | 58.5 | 3063.24 | 58.51 | 100.02 | 0.02 |
| 9 | 63 | 3307.77 | 63.29 | 100.46 | 0.46 |
| 10 | 67.5 | 3530.37 | 67.64 | 100.20 | 0.20 |
| 11 | 72 | 3788.09 | 72.67 | 100.93 | 0.93 |
| 12 | 76.5 | 4010.05 | 77.00 | 100.66 | 0.66 |
| 13 | 81 | 4260.62 | 81.90 | 101.11 | 1.11 |
| 14 | 85.5 | 4493.72 | 86.45 | 101.11 | 1.11 |
| 15 | 90 | 4674.54 | 89.98 | 99.98 | 0.02 |
| 16 | 105 | 5430.71 | 104.75 | 99.76 | 0.24 |
| 17 | 120 | 6221.86 | 120.21 | 100.17 | 0.17 |
| 18 | 135 | 7065.04 | 136.67 | 101.24 | 1.24 |
| 19 | 150 | 7810.87 | 151.24 | 100.83 | 0.83 |
| 20 | 165 | 8554.37 | 165.76 | 100.46 | 0.46 |
| 21 | 180 | 9418.55 | 182.64 | 101.47 | 1.47 |
| 22 | 195 | 10240.67 | 198.70 | 101.90 | 1.90 |
| 23 | 210 | 10880.40 | 211.20 | 100.57 | 0.57 |
| 24 | 225 | 11661.63 | 226.46 | 100.65 | 0.65 |
| 25 | 240 | 12343.23 | 239.77 | 99.90 | 0.10 |
| 26 | 255 | 13216.40 | 256.82 | 100.71 | 0.71 |
| 27 | 270 | 13671.23 | 265.71 | 98.41 | 1.59 |
| 28 | 285 | 14516.93 | 282.23 | 99.03 | 0.97 |
| 29 | 300 | 15251.47 | 296.57 | 98.86 | 1.14 |
| Recovery (Minimum = 97.78%, Mean = 100.26%, Maximum = 101.90%), Mean percent error = 0.83% | |||||
CR – Real concentration of M-HCl; CM - Measured concentration of M-HCl.
Table 11.
Experimental results obtained in the study of the stability over time of HNK solutions with concentrations of 90 and 300 µg/mL.
Table 11.
Experimental results obtained in the study of the stability over time of HNK solutions with concentrations of 90 and 300 µg/mL.
| Time (hours) |
Refrigerator (2 – 8°C) | Room temperature (20 – 25 °C) | 37 °C | ||||||
|---|---|---|---|---|---|---|---|---|---|
| Peak area | CC (µg/mL) |
R (%) | Peak area | CC (µg/mL) |
R (%) | Peak area | CC (µg/mL) |
R (%) | |
| 90 µg/mL | |||||||||
| 0 | 4663.1 | 89.76 | 99.73 | 4663.1 | 89.76 | 99.73 | 4663.1 | 89.76 | 99.73 |
| 24 | 4654.2 | 89.59 | 99.54 | 4642.4 | 89.36 | 99.28 | 4632.7 | 89.17 | 99.07 |
| 48 | 4637.8 | 89.27 | 99.18 | 4623.6 | 88.99 | 98.88 | 4601.1 | 88.55 | 98.39 |
| 300 µg/mL | |||||||||
| 0 | 15314.6 | 297.81 | 99.27 | 15314.6 | 297.81 | 99.27 | 15314.6 | 297.81 | 99.27 |
| 24 | 15257.8 | 296.70 | 98.90 | 15198.8 | 295.54 | 98.51 | 15184.2 | 295.26 | 98.42 |
| 48 | 15215.9 | 295.88 | 98.63 | 15172.1 | 295.02 | 98.34 | 15095.4 | 293.52 | 97.84 |
CC – calculated concentration, R(%) – recovery in percent.
Table 12.
Experimental results obtained in the study of the stability over time of M-HCl / HNK solutions with concentrations of 360 / 90 µg/mL and for 1200 / 300 µg/mL.
Table 12.
Experimental results obtained in the study of the stability over time of M-HCl / HNK solutions with concentrations of 360 / 90 µg/mL and for 1200 / 300 µg/mL.
| Time (hours) |
M-HCl / HNK |
Refrigerator (2 – 8°C) | Room temperature (20 – 25 °C) | 37 °C | ||||||
|---|---|---|---|---|---|---|---|---|---|---|
| Peak area | CC (µg/mL) |
R (%) | Peak area | CC (µg/mL) |
R (%) | Peak area | CC (µg/mL) |
R (%) | ||
| 360 / 90 µg/mL (M-HCl / HNK) | ||||||||||
| 0 | M-HCl | 33527.3 | 360.96 | 100.27 | 33527.3 | 360.96 | 100.27 | 33527.3 | 360.96 | 100.27 |
| HNK | 4712.4 | 90.72 | 100.80 | 4712.4 | 90.72 | 100.80 | 4712.4 | 90.72 | 100.80 | |
| 24 | M-HCl | 33492.6 | 360.58 | 100.16 | 33399.6 | 359.55 | 99.88 | 33362.4 | 359.14 | 99.76 |
| HNK | 4704.8 | 90.57 | 100.64 | 4694.1 | 90.37 | 100.41 | 4687.6 | 90.24 | 100.27 | |
| 48 | M-HCl | 33396.1 | 359.51 | 99.86 | 33287.5 | 358.31 | 99.53 | 33215.8 | 357.52 | 99.31 |
| HNK | 4698.5 | 90.45 | 100.50 | 4674.6 | 89.98 | 99.98 | 4664.2 | 89.78 | 99.76 | |
| 1200 / 300 µg/mL (M-HCl / HNK) | ||||||||||
| 0 | M-HCl | 55005.7 | 1197.19 | 99.77 | 55005.7 | 1197.19 | 99.77 | 55005.7 | 1197.19 | 99.77 |
| HNK | 7772.2 | 300.97 | 100.32 | 7772.2 | 300.97 | 100.32 | 7772.2 | 300.97 | 100.32 | |
| 24 | M-HCl | 54941.9 | 1195.78 | 99.65 | 54860.8 | 1193.98 | 99.50 | 54782.5 | 1192.25 | 99.35 |
| HNK | 7766.1 | 300.74 | 100.25 | 7742.7 | 299.82 | 99.94 | 7717.8 | 298.85 | 99.62 | |
| 48 | M-HCl | 54812.3 | 1192.91 | 99.41 | 54603.4 | 1188.29 | 99.02 | 54386.2 | 1183.48 | 98.62 |
| HNK | 7748.6 | 300.05 | 100.02 | 7717.9 | 298.85 | 99.62 | 7691.4 | 297.82 | 99.27 | |
CC – calculated concentration, R(%) – recovery in percent.
Table 13.
Experimental results obtained in the study of the photostability over time of M-HCl / HNK solution with concentrations of 1200 / 300 µg/mL.
Table 13.
Experimental results obtained in the study of the photostability over time of M-HCl / HNK solution with concentrations of 1200 / 300 µg/mL.
| Time (hours) |
M-HCl / HNK |
Room temperature (20 – 25 °C) | 37 °C | ||||
|---|---|---|---|---|---|---|---|
| Peak area | CC (µg/mL) |
R (%) | Peak area | CC (µg/mL) |
R (%) | ||
| 1200 / 300 µg/mL (M-HCl / HNK), unprotected for light | |||||||
| 0 | M-HCl | 55098.6 | 1199.25 | 99.94 | 55098.6 | 1199.25 | 99.94 |
| HNK | 7760.3 | 300.51 | 100.17 | 7760.3 | 300.51 | 100.17 | |
| 24 | M-HCl | 54930.5 | 1195.53 | 99.63 | 54846.3 | 1193.66 | 99.47 |
| HNK | 7721.2 | 298.98 | 99.66 | 7695.3 | 297.97 | 99.32 | |
| 48 | M-HCl | 54747.4 | 1191.48 | 99.29 | 54537.9 | 1186.84 | 98.90 |
| HNK | 7686.9 | 297.64 | 99.21 | 7642.8 | 295.92 | 98.64 | |
| 1200 / 300 µg/mL (M-HCl / HNK), protected for light | |||||||
| 0 | M-HCl | 55098.6 | 1199.25 | 99.94 | 55098.6 | 1199.25 | 99.94 |
| HNK | 7760.3 | 300.51 | 100.17 | 7760.3 | 300.51 | 100.17 | |
| 24 | M-HCl | 54922.5 | 1195.35 | 99.61 | 54784.8 | 1192.30 | 99.36 |
| HNK | 7746.1 | 299.95 | 99.98 | 7707.5 | 298.45 | 99.48 | |
| 48 | M-HCl | 54777.4 | 1192.14 | 99.34 | 54561.1 | 1187.35 | 98.95 |
| HNK | 7718.6 | 298.88 | 99.63 | 7687.2 | 297.65 | 99.22 | |
CC – calculated concentration, R (%) – recovery in percent.
Table 14.
Experimental data obtained from the study of the M-HCl content of tablets.
| Pharmaceutical product | Pharmaceutical form | Country manufacturer | A (mg) |
Mm (g) |
a (g) |
PA | C (%) |
C1 (%) |
|---|---|---|---|---|---|---|---|---|
| CP – 1 | prolonged-release tablet | France | 500 | 0.7270 | 0.2938 | 36925.8 | 98.62 | 98.59 |
| CP – 2 | tablet | Romania | 850 | 1.0146 | 0.2388 | 37033.9 | 99.91 | 99.20 |
| CP – 3 | film-coated tablet | France | 1000 | 1.1238 | 0.2282 | 36976.7 | 98.28 | 97.78 |
| CP – 4 | film-coated tablet | Germany | 1000 | 1.1065 | 0.2243 | 37093.1 | 98.76 | 98.48 |
| CP – 5 | prolonged-release tablet | France | 1000 | 1.4549 | 0.2931 | 37056.1 | 99.28 | 98.95 |
A – declared content (mg), Mm – average weight of a tablet (g), a – tablet powder (g), PA – Peak area, C% - percent content in tablet, C1% - percent content in tablet (method developed previously) [4], S = 90.3852: slope of the calibration curve, Int = – 901.5302: intercept of the calibration curve.
Table 15.
Experimental data obtained from the study of the HNK content of capsules.
| Pharmaceutical product | Pharmaceutical form | Country manufacturer | A (mg) |
Mm (g) |
a (g) |
PA | C (%) |
|---|---|---|---|---|---|---|---|
| HNK – 1 | capsules | UK | 150 | 0.1471 | 0.1002 | 5083.6 | 97.84 |
| HNK – 2 | capsules | Romania | 150 | 0.1513 | 0.1000 | 5048.5 | 100.14 |
| HNK – 3 | capsules | EU | 250 | 0.2445 | 0.1004 | 5099.9 | 97.70 |
| HNK – 4 | capsules | Romania | 250 | 0.2497 | 0.1002 | 5104.2 | 100.07 |
A – declared content (mg), Mm – average weight of a tablet (g), a – tablet powder (g), PA – Peak area, C% - percent content in tablet, S = 51.1980: slope of the calibration curve, Int = – 67.5673: intercept of the calibration curve.
Table 16.
Experimental data obtained from the study of the M-HCl / HNK content of prolonged release tablets.
Table 16.
Experimental data obtained from the study of the M-HCl / HNK content of prolonged release tablets.
| Pharmaceutical product | Pharmaceutical form | A (mg) |
Mm (g) |
a (g) |
PA | C (%) |
|---|---|---|---|---|---|---|
| P – 1 | prolonged-release tablet | 400 (M-HCl) 100 (HNK) |
0.8126 | 0.8040 | 36567.1 (M-HCl) 5069.2 (HNK) |
99.62 (M-HCl) 100.63 (HNK) |
| P – 2 | prolonged-release tablet | 400 (M-HCl) 100 (HNK) |
0.8098 | 0.8000 | 37004.3 (M-HCl) 5043.4 (HNK) |
100.99 (M-HCl) 100.26 (HNK) |
A – declared content (mg), Mm – average weight of a tablet (g), a – tablet powder (g), PA – Peak area, C% - percent content in tablet, S = 90.3852 (M-HCl) and 51.1980 (HNK): slope of the calibration curve, Int = – 901.5302 (M-HCl) and – 67.5673 (HNK): intercept of the calibration curve.
Table 17.
Analytical Eco-Scale system greenness assesment for development method.
| Development method | Number of pictograms* | Hazard** | Penalty points (PP)*** |
|---|---|---|---|
| REAGENTS | |||
| Methanol | 3 | 2 | 6 |
| Acetic acid (glacial) | 2 | 2 | 4 |
| SAMPLE PREPARATION | |||
| Dilution with ethanol:water (2:1) | 3 | 2 | 6 |
| INSTRUMENTS | |||
| Liquid chromatography (LC) | ≤ 1.5 kWh per sample | 1 | |
| UV-VIS detection | < 0.1 kWh per sample | 0 | |
| Ultrasound | < 0.1 kWh per sample | 0 | |
| WASTE | |||
| 1-10 mL (g) waste / sample | 3 | ||
| No treatment waste | 3 | ||
| Occupational hazard | Analytical process hermetization | - | |
| Total penalty points | 23 | ||
| Analytical Eco-Scale Score | 77 | ||
* Number of pictograms on the reagent packaging, ** Hazard factor according GHS guidelines, *** Penalty points are the product of the number of pictograms and hazards in case of reagents or a fixed number for a particular criteria [66].
Table 18.
AGREE assesment for the method developed.
| Principle AGREE | Observations |
|---|---|
| Principle 1 | Sampling procedure: remote sensing without sample damage |
| Principle 2 | Sample size: 0.1 mL |
| Principle 3 | Analytical device positioning: At-line |
| Principle 4 | No of major steps: 3 or fewer |
| Principle 5 | Automated and miniaturized method: manual, none or miniaturized |
| Principle 6 | Derivatization: none |
| Principle 7 | Waste generated and proper management: 10 mL |
| Principle 8 | Number of analytes/run and samples analysed per hour: 2 and 6 |
| Principle 9 | Most energy – intensive technique used: LC (HPLC) |
| Principle 10 | Source of reagents: none of the reagents are from bio-based sources |
| Principle 11 | Toxic reagents / solvents: Yes (methanol) / 8.5 mL per run |
| Principle 12 | Operator safety: none |
Table 19.
Design matrix as three factors, three levels (CCD) for optimization of the HPLC method for HNK and M-HCl determination.
Table 19.
Design matrix as three factors, three levels (CCD) for optimization of the HPLC method for HNK and M-HCl determination.
| Run | Run order | Coded factors level | ||
|---|---|---|---|---|
| Factor 1 | Factor 2 | Factor 3 | ||
| 1 | 1 | -1 | -1 | -1 |
| 2 | 13 | 0 | -1 | -1 |
| 3 | 3 | +1 | -1 | -1 |
| 4 | 5 | -1 | -1 | 0 |
| 5 | 17 | 0 | -1 | 0 |
| 6 | 7 | +1 | -1 | 0 |
| 7 | 9 | -1 | -1 | +1 |
| 8 | 15 | 0 | -1 | +1 |
| 9 | 11 | +1 | -1 | +1 |
| 10 | 21 | -1 | 0 | -1 |
| 11 | 25 | 0 | 0 | -1 |
| 12 | 23 | +1 | 0 | -1 |
| 13 | 20 | -1 | 0 | 0 |
| 14 | 27 | 0 | 0 | 0 |
| 15 | 18 | +1 | 0 | 0 |
| 16 | 22 | -1 | 0 | +1 |
| 17 | 26 | 0 | 0 | +1 |
| 18 | 24 | +1 | 0 | +1 |
| 19 | 2 | -1 | +1 | -1 |
| 20 | 14 | 0 | +1 | -1 |
| 21 | 4 | +1 | +1 | -1 |
| 22 | 6 | -1 | +1 | 0 |
| 23 | 19 | 0 | +1 | 0 |
| 24 | 8 | +1 | +1 | 0 |
| 25 | 10 | -1 | +1 | +1 |
| 26 | 16 | 0 | +1 | +1 |
| 27 | 12 | +1 | +1 | +1 |
| Level of factor | ||||
| Parameter | Low (–1) | Intermediate (0) | High (+1) | |
| A: % Methanol | 85 | 87.5 | 90 | |
| B: pH | 2 | 3 | 4 | |
| C: Flow (mL/min) | 1 | 1.25 | 1.5 | |
Disclaimer/Publisher’s Note: The statements, opinions and data contained in all publications are solely those of the individual author(s) and contributor(s) and not of MDPI and/or the editor(s). MDPI and/or the editor(s) disclaim responsibility for any injury to people or property resulting from any ideas, methods, instructions or products referred to in the content. |
© 2024 by the authors. Licensee MDPI, Basel, Switzerland. This article is an open access article distributed under the terms and conditions of the Creative Commons Attribution (CC BY) license (http://creativecommons.org/licenses/by/4.0/).
Copyright: This open access article is published under a Creative Commons CC BY 4.0 license, which permit the free download, distribution, and reuse, provided that the author and preprint are cited in any reuse.


