Submitted:
04 July 2024
Posted:
05 July 2024
You are already at the latest version
Abstract
Human serum albumin (HSA) corona formation at polymer microparticles of a spheroidal shape was studied using dynamic light scattering and laser Doppler velocimetry (LDV). Physicochemical characteristics of the albumin comprising, the zeta potential and the isoelectric point were determined as a function of pH for various ionic strengths. Analogous characteristics of the polymer particles were carried out. The adsorption of albumin on the particles was monitored by electrophoretic mobility measurements (LDV). The stability of the HSA functionalized particle suspensions under various pHs and their electrokinetic properties were determined. The deposition kinetics of the particles on mica, silica and gold sensors were determined in situ by optical microscopy, AFM and by the quartz microbalance (QCM) under diffusion and flow conditions. The obtained results were interpreted in terms of the coarse-grained random sequential adsorption model that allowed to estimate the range of applicability of QCM for determining deposition kinetics of virus and bacteria at abiotic surfaces.
Keywords:
albumin coronas at particles
; bacteria deposition
; deposition of albumin polymer particle conjugates
; HSA functionalized particles
; spheroidal polymer particles
; quartz microbalance measurements
; zeta potential of albumin corona
1. Introduction
Adsorption of proteins at nano- and micro-sized particles is important for biosensing, enzymatic catalysis, bioreactors, immunological assays aimed at the detection of virus and bacteria infections, for example SARS-CoV-2, Salmonella, E. Coli. [1,2,3,4].
Given its essential significance, adsorption of proteins at nanoparticles, which is referred to as corona formation, was extensively investigated both for single molecule systems and for mixtures [5,6,7,8,9,10,11,12,13,14,15,16,17,18,19,20,21,22,23,24,25,26,27]. However, a quantitative interpretation of the obtained results was hindered because of the reversibility of adsorption and the tendency of the functionalized particles to aggregate.
A more reliable experiments can be conducted for particles with the size above 100 nm (microparticles) functionalization with antibodies [1,2,3] or blood serum proteins such as fibrinogen or HSA [28,29] because they form more stable suspensions. Thanks to this advantage, the corona formation in microparticles can be effectively monitored using the electrophoretic mobility measurements and quantitatively interpreted in terms of theoretical approaches [30].
However, no results were reported for the interesting case of protein corona formation at anisotropic polymer particles. Such functionalized particles can mimic the behavior of viruses composed of a core part containing RNA or DNA genome encapsulated by a hydrophobic membrane stabilized by various proteins [31,32,33,34,35]. Additionally, in the case of coronaviruses such as the SARS-CoV-2, spike protein are flexibly incorporated into the membrane [36,37,38,39,40] enabling virus attachment to various bio-receptors and to abiotic surfaces. This process plays an essential role in virus inactivation and removal by filtration comprising various kinds of masks.
Because of basic significance, the attachment of viruses and bacteria to various surfaces was often investigated by the quartz crystal microbalance (QCM) technique enabling sensitive, in situ, real time kinetic measurements under diffusion and flow conditions. For example interesting studies based on the QCM were reported for bacteria strains exhibiting a spheroidal shape [41], inter alia E. Coli, Salmonella [42,43,44] and soil bacteria [45]. Unfortunately, no attempt was undertaken to quantify the obtained results and to elucidate physical mechanisms of bacteria attachment. One can expect that scientific impact of such tedious experiments could be enhanced if appropriate reference results obtained for well-characterized particles and sensors were available.
It is postulated that the polymer particles functionalized in a controlled way by adsorption of protein coronas can be used as reliable reference systems for acquiring essential information about mechanisms of virus and bacteria deposition on abiotic surfaces. In this work attention is focused on the spheroidal polymer microparticle and human serum albumin (HSA) conjugates, which have not been studied previously in the literature. The main advantage of the albumin is that its basic physicochemical properties, such as the molar mass, primary, secondary structures and its shape are known [29,46,47]. Additionally, HSA forms stable solutions in electrolyte solution of various pHs and ionic strengths.
The adsorption mechanism of albumin at microparticles of a spherical shape was theoretically studied applying coarse-grained, Monte-Carlo type approaches [29]. These data can be exploited for a proper interpretation of the albumin corona formation investigations for spheroidal particles performed in this work. The progress of HSA adsorption is monitored under in situ conditions by the Laser Doppler velocimetry (LDV) yielding the electrophoretic mobility of the functionalized particles, which is converted to the zeta potential and interpreted in terms of a theoretical model. Subsequently, deposition of the particles at abiotic surfaces such as mica used as a reference, silica and gold sensors, is thoroughly investigated, which represents the main goal of this work.
Because of the use of complementary theoretical and experimental methods, the obtained results will furnish reliable information about mechanism of bioparticle deposition on solid/electrolyte interfaces, and about the range of applicability of the QCM method for such kinetic measurements.
2. Results and Discussion
2.1. Physicochemical Characteristics of Albumin and Polymer Particles
In order to facilitate a quantitative interpretation of the corona formation and particle deposition experiments, physicochemical characteristics of HSA and the polymer particle suspensions were acquired applying the above described techniques.
The diffusion coefficient of HSA molecules at pH range 3.5 to 5 and NaCl concentration of 10 to 30 mM directly measured by DLS was equal to 6.30.3×10-7 cm2 s-1. This corresponds to the hydrodynamic diameter calculated from the Stokes–Einstein relationship equal to 7.9±0.4 nm. These values are similar to previously reported in References [29] indicating that the HSA solutions were stable under these physicochemical conditions.
The dependencies of the albumin molecule zeta potential on pH for NaCl concentrations of 1, 10 and 30 mM are shown in Figure 1a. As can be seen, at smaller pHs the zeta potential was positive for all NaCl concentrations attaining 36±2 mV at pH 4 in 10 mM NaCl. However, for larger pHs it rapidly decreased changing sign at pH 5. At pH 7.4 and 10 mM NaCl the zeta potential attained a negative value of - 36±2 mV.
Physicochemical characteristics were also carried out for the polymer particles. The dependence of their zeta potential on pH, calculated using the Ohshima formula for NaCl concentrations of 1, 10 and 30 mM are shown in Figure 1b. The zeta potential was negative for the entire range of pHs assuming -40±2 mV and -50±3 mV at pH 4 and 7.4, respectively for 10 mM NaCl.
On the other hand, the diffusion coefficient of the particles determined by DLS was practically independent of pH and equal to 1.2×10⁻⁸ cm2 s-1 for the NaCl concentration of 10 mM. This corresponds to the hydrodynamic diameter of 400 ±20 nm, calculated from the Stokes-Einstein formula. It should be mentioned that the hydrodynamic diameter alone, defined as the size of an equivalent sphere having the same diffusion coefficient, does not furnish information about the shape and true dimensions of the particles. These parameters were derived from scanning electron microscopy (SEM) micrographs, see Figure 2, as an average taken from ca. 100 particles. Thus, the particle dimensions were 1100±50×220±20×220±20 nm, with the size distribution dispersity of ca 5%. It was also confirmed that their shape can be approximated by a prolate spheroid with the longer to shorter axis ratio λ= a/b of 5 and the cross-section area in the side-on orientation equal to 0.19 mµ2.
2.2. Formation of Albumin Corona at Polymer Particles
Functionalization of the spheroidal particles by adsorption of HSA was carried out according to the procedure described in Ref. [29] where the changes in the electrophoretic mobility were in situ monitored by the LDV technique. The electrophoretic mobility of the particles acquired as a function of the initial albumin concentration was converted to the zeta potential and interpreted in terms of the electrokinetic model. It is worth mentioning that the time of corona formation at the polymer particles is very short compared to the adsorption at planar substrates and does not depend on the protein concentration. Using the formula derived in Reference [48] and the parameters pertinent to our measurements: the bulk particle concentration after mixing of 50 mg L-1, dH = 400 nm, and the protein diffusion coefficient of 6.2×10⁻⁷ cm2 s-1 one can calculate that the corona formation time was equal to ca 0.1 s, which is considerable shorter than the experimental incubation time.
In Figure 3 the dependence of the zeta potential of particles on the initial concentration of HSA in the suspension acquired for pH 4 and 10 mM NaCl is shown. As can be seen, the initially negative zeta potential of the particles rapidly increased with the albumin concentration (denoted by cp) and became positive for cp larger than 0.5 mg L-1. For still larger concentrations of albumin the zeta attained the plateau value of 15 mV, which was markedly lower than the bulk zeta potential of HSA molecules equal to 36 mV.
One can observe at for the initial albumin concentration above 1 mg L-1 a saturated monolayer is formed at polymer particles. The mass coverage of the albumin layer can be calculated from the formula
whereis the protein mass coverage, conveniently expressed mg m-2,is the protein solution volume and is the net surface area of the particles given by
where is the particle volume, is the particle suspension concentration and ,are the surface area and mass of a single particle, respectively.
Considering that for spheroids
where is the polymer particle density and is the correction function of the axis ratio parameter accounting for the increase in the specific surface area compared to spherical particles given by
Considering Equations 2,3 one obtains the following formula for the mass average of albumin on the spheroidal particles
For spheres, where = 1, and for equal volumes of the protein and the particles Equation 5 simplifies to the usual form [29,49]
where is the spherical particle diameter.
Considering the following parameters pertinent to the corona formation experiments: cpol = 100 mg L-1, , b = 110 nm, = 5, = 1.06 g cm-3 one can calculate from Equations 4,5 that the monolayer coverage of albumin on the particles was equal to ca 0.5 mg m-2 for cb = 1 mg L-1.
In order to obtain a more precise estimation of the monolayer coverage, the results shown in Figure 3 were interpreted in terms of the general electrokinetic model developed in References [30,48] using the following formula for the zeta potential of polymer particles covered by a protein layer, denoted by was derived
where is the zeta potential of the particles with the protein corona, is the dimensionless protein coverage, ζi is the zeta potential of the polymer particles, ζp is the zeta potential of the protein in the bulk, and are the dimensionless functions. The Fi function describes the damping of the flow near particle surface by the adsorbed molecule layer and the Fp function characterizes the contribution to the zeta potential stemming from the electric double-layer surrounding the protein molecules. These functions were calculated in References [30] applying the multipole expansion method. The dimensionless coverage occurring in Equation 7 is connected with the mass coverage via the constitutive dependence
where Sg is the characteristic cross-section area of the albumin molecule, is the Avogadro number andis the molar mass of albumin, equal to 66,400 g mol-1.
The theoretical results calculated from Equations 7,8 adequately reflected the experimental data for smaller than 1.3 mg L-1 (see Figure 3) whereas at larger protein concentration the particle zeta potential attained the plateau value of 15 mV (this is depicted as the dashed horizontal line). Using this limiting concentration one can calculate from Equation 8 that the mass coverage of the protein corona was equal to 0.65 mg m-2.
It is interesting to mention that an identical value was previously determined for silica sensor using the OWLS method [50], whereas in Reference [51] the value of 0.6 mg m-2 was obtained by optical reflectometry. In Reference [29] obtained 0.7 mg m-2 for recombinant HSA layer on negatively charged polystyrene latex particle having the diameter of 800 nm.
In the next series of experiments the stability and of the spheroidal particles functionalized by the albumin corona, hereafter referred to as SHSA, was determined. The results, shown in Figure 4 (for pH 4, 10 mM NaCl) were expressed as the dependence of the particle hydrodynamic diameter and the zeta potential as a function of the storage time. As can be seen, the changes in the hydrodynamic diameter and the zeta potential were negligible for the storage time up to 1600 min (27 h) that confirms an adequate stability of their suspensions.
It should be mentioned, however, that for the pH within the range 4.5 to 6.5 the hydrodynamic diameter of the particles markedly increased attaining a maximum value of ca. 1100 nm, see Figure 5a. Most probably this increase is caused by a reversible association of the SHSA particles under end-on orientations in fibrous-like structures. This hypothesis is supported by the dependence of the zeta potential of the SHSA particles on pH (see Figure 5b). As can be seen, zeta potential of the particles abruptly decreased with pH and vanished at pH 4.7, that can be treated as their isoelectric point. Such a low zeta potential value promoted a reversible particle association at pH around 5. At pH larger than 7 the zeta potential of the SHSA particles approached the zeta potential of the bare particles (marked as curve 2 in Figure 5b).
2.3. Deposition of the SHSA Particles on Abiotic Surfaces
The deposition kinetics of the SHSA particles (bulk concentration 50 mg L-1, pH 4, 10 mM NaCl) on bare mica under diffusion is shown in Figure 6. As can be seen, the particle surface concentration (directly determined by the optical microscope enumeration technique) linearly increased with the square root of the deposition time. This behavior was adequately interpreted in terms of the theoretical results derived from the hybrid random sequential adsorption (RSA) approach, [30,48], depicted as the solid red line in Figure 6.
The results shown in Figure 6 confirm that the theoretical predictions calculated from the RSA model agree with the experimental data for t1/2 up to 14 min1/2 (ca. 200 min). This fact enables to conclude that the particle deposition kinetics attained the maximum value pertinent to a barrier-less transport conditions [48]. However, one should mention, that such kinetic experiments are tedious to perform because they require an image analysis of the deposited particles layers acquired at discrete time intervals. Hence, they are not recommended for routine measurements but can rather serve as useful reference data for the interpretation of experiments performed by other techniques, such as the quartz microbalance (QCM), where the acquired signal cannot be directly related to the real particle coverage. On the other hand, an essential advantage of the QCM technique is that it yields real-time, and quasi-continuous signals that is the sensor oscillation frequency and dissipation changes, which can be related to real coverage upon a proper calibration [52,53,54,55]. Usually, the QCM kinetic measurements are carried out under flow conditions in order to accelerate the experimental run. However, this markedly increases the consumption of the particles, which is disadvantageous for expensive solutes such as proteins, virus or bacteria or the functionalized spheroidal particles, produced in a tedious synthesis. Therefore, in this work, the measurements were predominantly carried out under diffusion transport conditions that manifold reduced the consumption of SHSA particles. Primarily, in these experiments the dependence of the frequency shift on the deposition time was recorded for various overtones (1 to 11 in our case). Then, the apparent QCM coverage, was calculated from the commonly used formula often referred to as the Sauerbrey equation [55]
where Δf is the frequency shift, and Cs is the Sauerbrey constant equal to 0.177 mg m-2 Hz-1 for the 5 MHz AT cut quartz sensor [55].
A typical kinetic run recorded at pH 4, 10 mM NaCl, the bulk SHSA particle concentration of 50 mg L-1 and the silica sensor is shown in Figure 7a as the dependence of the QCM coverage calculated from Equation 9 on the time. For comparison, in Figure 7b analogous results for the bare spheroidal particles without HSA corona deposited on PAH functionalized sensor are also presented.
As shown in Figure 7a, the particle coverage abruptly increased with the time and attained after 1100 min plateau values of 20 and 5 mg m-2 at for the first and the 11th overtone, respectively. Interestingly, the change in the particle coverage was negligible upon switching to the pure electrolyte flow (shown as the arrow and the dashed line), which can be interpreted as negligible desorption of particles. Analogous, results were obtained in the case of the bare spheroidal particle deposition on the silica sensor functionalized by the PAH macro-ion according to the procedure described in Reference [56], see Figure 7b. This similarity of the deposition kinetics indicates that the basic mechanism of the bare and functionalized spheroids was the same. One should mention that such a significant decrease in the QCM coverage calculated using Equation 9 with the overtone number was also observed in deposition kinetic experiments carried out for nano- and microparticles [55,57,58] as well as for viruses [33,35]. In the case of particles forming a stiff contact with the sensor this effect can be attributed to hydrodynamic forces acting on the particle layer whose relative significance, compared to the inertia force, decreases with the oscillation frequency, i.e., the overtone number [57].
For larger particles especially for spheroids, a decisive role plays the hydrodynamic slip effect, also inducing significant differences in the QCM coverage predicted from Equation 9 for various overtones [56]. This indicates that the interpretation of virus and bacteria deposition kinetics investigate by QCM can be rather ambiguous without considering an adequate theoretical background developed in References [56]. It was shown that the under the hydrodynamic slip regime, a more appropriate transformation of the frequency changes to obtain particle coverage has the following form
where is the dimensionless correction factor of the order of unity mainly depending on the sensor roughness.
The exact value of can be determined from the solution of the diffusion equation with the boundary condition at the sensor surface derived from the random sequential adsorption (RSA) approach [56], which were carried out without introducing any empirical parameters.
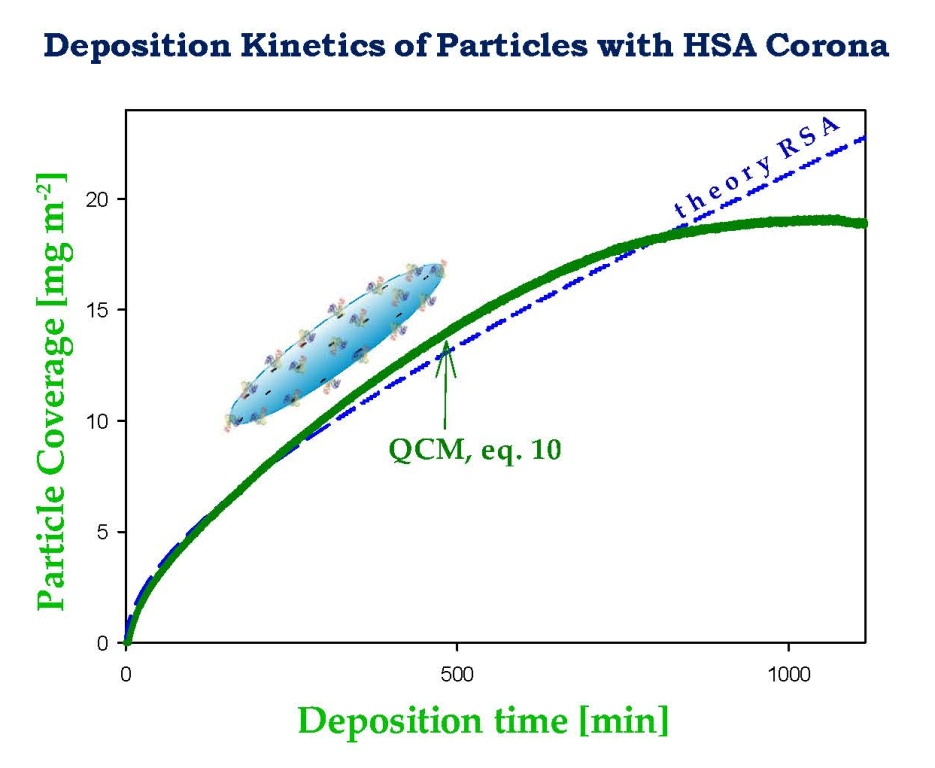
Kinetics of the SHSA particle deposition at silica sensor expressed using the transformation defined by Equation 10 (with equal unity) are shown in Figure 8. As can be seen, the dependencies of the coverage on the deposition time calculated using Equation 10 for various overtones almost coincide with each other. This confirms the utility of this transformation because one does need to arbitrarily chose the overtone number. In order to increase the precision of the QCM measurements and decrease the noise ratio, one can also calculate the kinetics averaged over all overtones, which is shown as the solid green line in Figure 8. As can be seen, the overtone averaged kinetics reasonably agrees with that derived from the RSA modeling (dashed blue line in Figure 8). A quantitative agreement for the deposition time below 800 min can be achieved assuming that the correction factor equal to 0.9. This indicates that the QCM results transformed according the proposed method can be applied for comparative studies of particle deposition kinetics under various physicochemical condition. Comparison of SHSA particle deposition kinetics on the silica and the gold/PAH sensors acquired at pH 4, 10 mM NaCl using the above transformation is shown in Figure 9. It can be seen that kinetic runs calculated from Equation 10 (averaged over the overtones) for the bare spheroids on the gold/PAH sensor and the SHSA particles at the bare silica were practically identical for shorter deposition time. However, at longer times, the deposition of the SHSA particles was less effective, which was probably caused by a lower adhesion strength of the latter particles.
The utility of the approach based on the above transformation is also confirmed by the results shown in Figure 10 where the SHSA deposition kinetics on the silica sensor at pH 4 and 7.4 are compared. One can observe that the deposition kinetics at pH 7.4 becomes practically negligible in comparison with pH 4 where it attained a maximum effectiveness governed by the bulk transport rate. It is worth mentioning that this behavior well correlates with the decrease in the particle zeta potential shown in Figure 5b, from 20 to -50 mV at pH 4 and 7.4, respectively, whereas the zeta potential of the silica sensor was negative at both pHs, and equal to -40 and -50 mV, respectively. This behavior suggests that electrostatic interactions, which were predicted to be attractive at pH 4 and repulsive at pH 7.4, played a decisive role in the deposition of the SHSA particles.
Analogous results were reported in References [33,34] presenting results of QCM investigations of several bacteriophages deposition at silica and gold sensors modified by self-assembled amine- and carboxyl-terminated layers (SAMs). Electrophoretic mobility measurements showed that the capsids exhibited a positive zeta potential for pH below 5 and negative otherwise, analogously as in our case for the polystyrene particles with the HSA corona. It was confirmed in Reference [33,34] that the deposition kinetics of MS2 virus at the negatively charged carboxyl terminated self-assembled monolayer decreased with pH and vanished at pH 6.
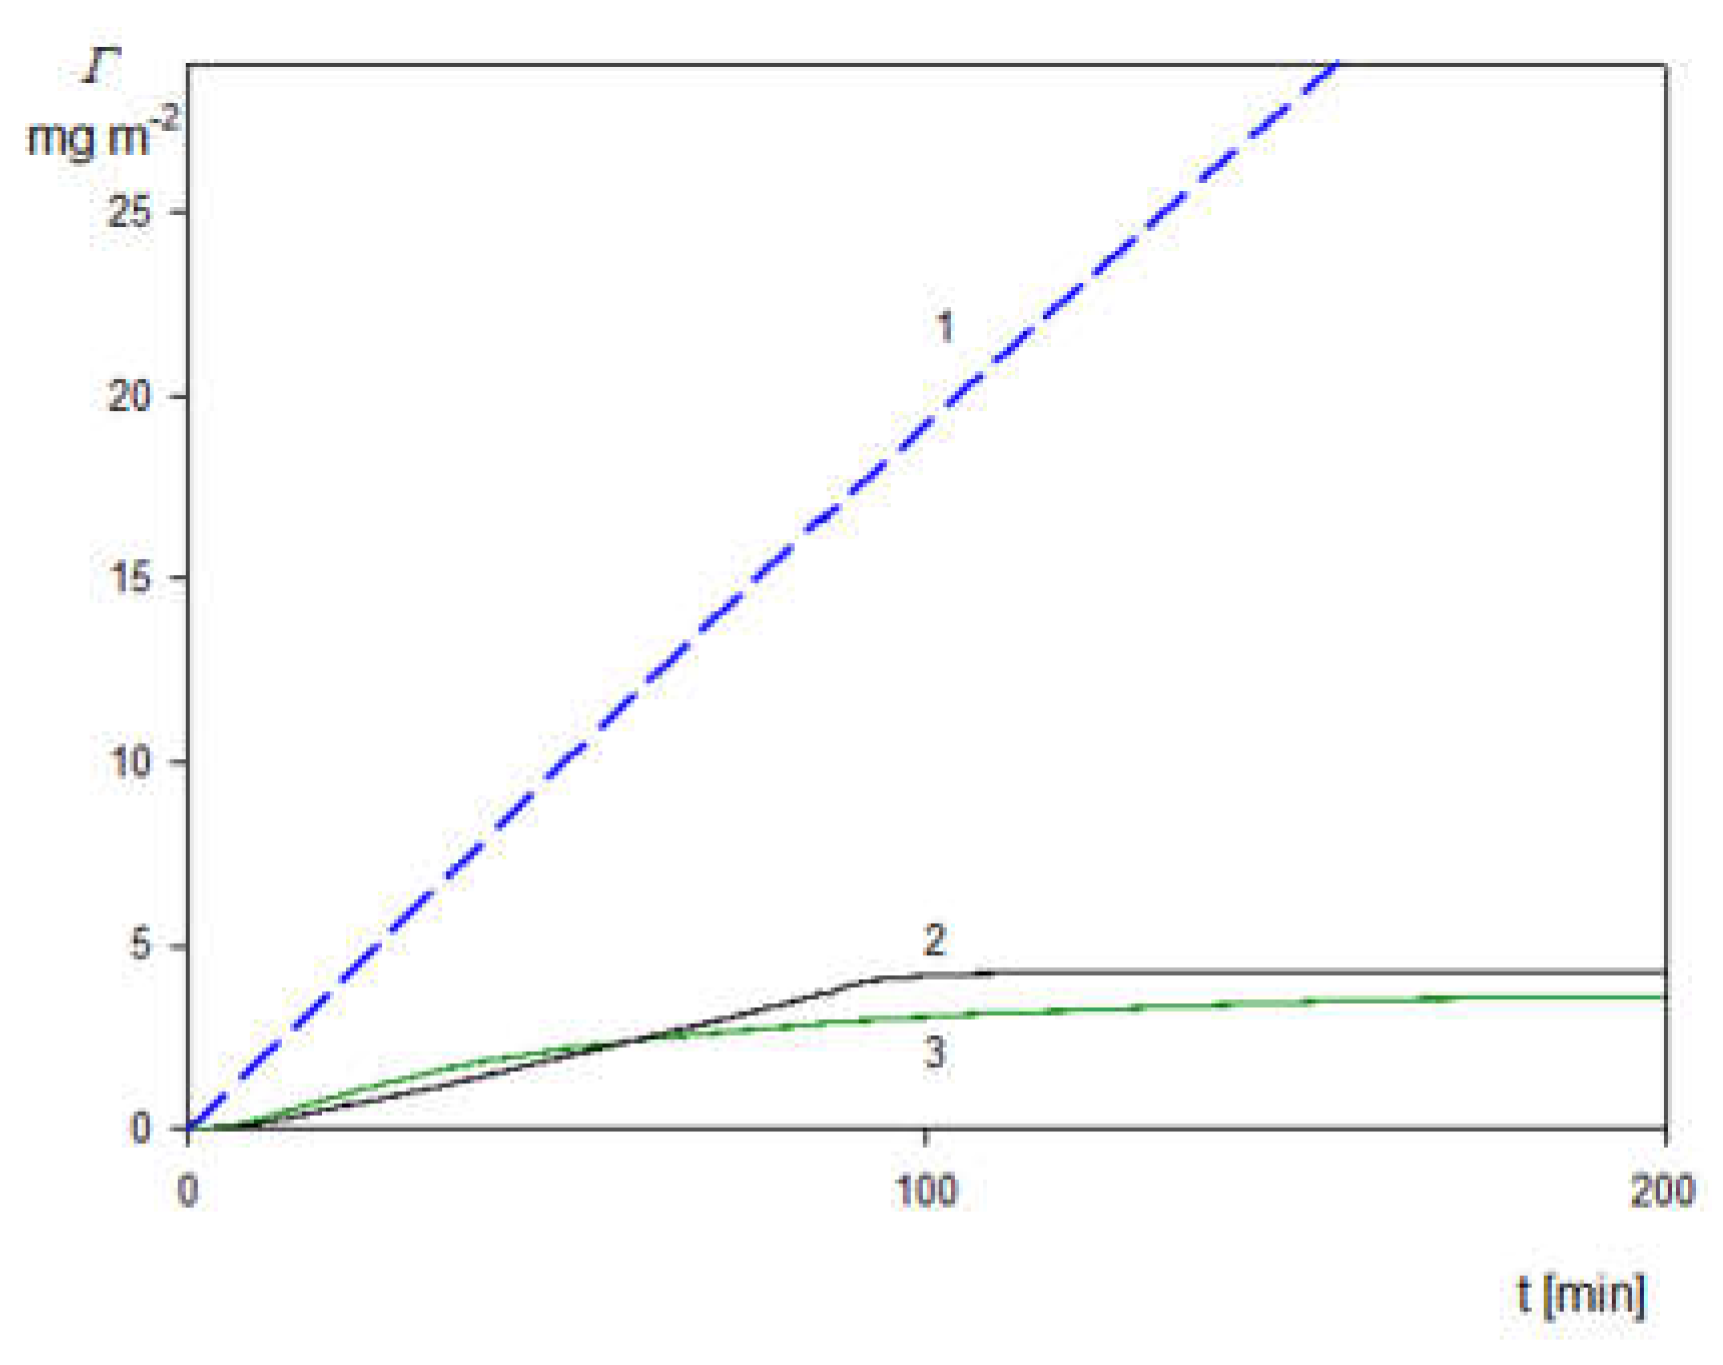
Additional QCM experiments were performed with the aim to determine the influence of flow on the deposition kinetics of the SHSA particles acquired under different pHs. The results presented in Figure 11 quite unexpectedly indicate that both at pH 4 and 7.4 the deposition rate of the SHSA particles was practically negligible compared to that observed for the bare spheroidal particles (shown as the dashed blue dashed line in Figure 11). This effect can be interpreted as due to the flow induced desorption of the particles from the sensor because of the appearance of hydrodynamic shearing forces. Apparently these forces exceeded the particle/sensor adhesion force because of their low zeta potential equal to 20 and -50 mV for pH 4 and 7.4, respectively.
Therefore, the results presented in Figure 11 indicate that in the case of the functionalized particles bearing protein coronas, the QCM measurements carried out under diffusion conditions furnish more reliable results compared to these carried out under flow conditions.
3. Materials and Methods
Human serum albumin (nominal protein content of 99%) used in this work was supplied by (Sigma-Aldrich (Merck) St. Louis, MO, USA) in the form of a lyophilized powder having the fatty acid content below 0.02%. Other chemical reagents: sodium chloride, sodium hydroxide, hydrochloric acid, sulfuric acid and hydrogen peroxide (Sigma Aldrich (Merck) St. Louis, MO, USA) were used without additional purification. Ultrapure water was obtained using the Milli-Q Elix&Simplicity 185 purification system from Millipore (Merck Group, Dermstadt, Germany).
Poly(styrene/α-tert-butoxy-ω-vinylbenzyl-polyglycidol) (PS/PGL) spheroidal microparticles were obtained according to the method previously described in Reference [59,60]. This process consisted of three main steps i) synthesis of α-tert-butoxy-ω-vinylbenzyl-polyglycidol (PGL) macromonomer, ii) synthesis of P(S/PGL) microspheres using styrene and PGL macromonomer initiated with potassium persulfate, in water iii) preparation of spheroidal particles P(S/PGL) from the spherical ones applying the stretching of poly(vinyl alcohol) (PVA) films containing embedded P(S/PGL) microspheres and finally, chemical modification of spheroidal particles to introduce a negative charge. The particle chemical composition was characterized by X-ray photoelectron spectroscopy (XPS), performed using the PHl 5000 VersaProbe - Scanning ESCA Microprobe (ULVAC-PHI, Japan/USA) instrument at a base pressure below 5×10⁻⁹ mbar. The size distribution and morphology of particles was characterized by scanning electron microscopy using a JEOL 5500LV apparatus (Akishima, Japan).
Ruby mica supplied by Continental Trade, Poland was used for the HSA adsorption kinetic measurements investigated by optical microscopy and atomic force microscopy (AFM). Thin sheets of mica were freshly cleaved before each experiment and used without any pretreatment.
The bulk concentration of albumin in the stock solution, prepared by dissolving the powder under controlled pH and ionic strength, was spectrophotometrically determined using the procedure described in References [29]. The concentrated stock solution was diluted by pure electrolyte of a fixed pH and ionic strength to a desired concentration before each experiments.
The diffusion coefficients of HSA molecules and polymer particles were determined by dynamic light scattering (DLS) using the Zetasizer Nano ZS (Malvern). Respective hydrodynamic diameters were calculated from the Stokes-Einstein equation.
The electrophoretic mobility of the, functionalized spheroidal particles and HSA molecules was measured by the Laser Doppler Velocimetry (LDV) technique using the Zetasizer Nano ZS device. Using the electrophoretic mobility data the corresponding zeta potentials were calculated using the using the Ohshima [61] and Henry [62] formulae, respectively.
The optical microscopy measurements of the adsorption kinetics were conducted using the inverted microscope (LABOPHOT-2) under the dark field illumination. The microscope was oriented horizontally with the objective axis perpendicular to the diffusion cell wall made of mica sheet. This was advantageous because possible disturbances stemming from particle sedimentation were eliminated.
Atomic force microscopy (AFM) measurements were carried out using the NT-MDT OLYMPUS IX71 device with the SMENA scanning head. The measurements were performed in semi-contact mode using silicon probes and polysilicon cantilevers HA-NC ETALON with resonance frequencies of 140 kHz +/- 10% or 235 kHz +/- 10%.
The QCM deposition kinetic experiments were performed according to the standard procedure described in References [52,53,54,55]. Initially, a stable base line for the pure electrolyte (NaCl) at fixed ionic strength and pH was obtained. Afterward, the particle suspension was flushed through the cell at a fixed flow rate. After a prescribed time, the pure electrolyte solution of the same pH and ionic strength was flushed in order to study particle desorption. The sensors with deposited particle layers were examined after completing the desorption run by ambient air AFM. The gold/quartz/silicon dioxide (SiO2) sensors used in experiments were supplied by Q-Sense, Gothenburg, Sweden whereas the bare gold sensors used in experiments were supplied by QuartzPro, Jarfalla, Sweden. Both sensor types were characterized by the fundamental frequency of 5 MHz. They were cleaned before each experiment in a mixture of 95% sulfuric acid (H2SO4) and hydrogen peroxide (30%) in volume ratio 3:2 for 10 minutes. Afterward, the sensor was rinsed by deionized water at 80°C for 30 min. and dried out in a stream of a nitrogen gas. The roughness of sensors was examined by semi-contact mode by AFM imaging carried out under ambient conditions. The root mean square (rms) roughness of the gold /silica and the bare gold sensors were equal to 1.0 ± 0.1 and 1.5 ± 0.2 nm, respectively.
pH of the protein solutions was adjusted in the range of 3 to 5 by the addition of HCl, whereas pH of 7.4 was fixed by the PBS buffer and larger pHs were adjusted by NaOH.
The temperature of experiments was fixed at 298 ± 0.1K.
4. Conclusion
Formation of albumin coronas at polymer particles of a spheroidal shape was effectively monitored by the LDV method and quantitatively interpreted in terms of the electrokinetic model. It was confirmed that the physicochemical properties of the particles comprising their size and zeta potential were stable for prolonged storage time.
A useful procedure for an effective interpretation of the deposition kinetics results derived from QCM for the particle bearing protein coronas was developed. It is based on Equation 10, which enabled transformation of the kinetic runs obtained for various overtones to one universal dependence.
It was confirmed that the deposition kinetics of the particles under diffusion at pH 7.4 was negligible in comparison with pH 4, which correlated with the decrease in their zeta potential. This effect was interpreted as the indication of an electrostatic mechanism of particle deposition.
It was also shown that the QCM investigation carried out under diffusion rather than under flow conditions were more reliable. There are two major advantages of such measurements (i) a significant decrease in the consumption of the expensive solutes (ii) elimination of the ortho-kinetic (induced by the flow) aggregation of the particles in the cell by hydrodynamic shearing forces.
One can argue that obtained results furnished reliable information about deposition mechanism of functionalized spheroidal particle, and about the range of applicability of the QCM method for such kinetic measurements. These data can be used as useful references for the interpretation of bioparticle deposition at solid/electrolyte interfaces, especially at QCM sensors.
Author Contributions
M.N.-R. - Data curation, investigation and writing—original draft, review & editing, formal analysis. M.S. - Data curation, investigation, artwork preparation, writing. Z.A. - Conceptualization, writing—original draft, supervision, review & editing. Spheroids synthesis and characteristics - T.B. –Data curation, supervision, D.M. – investigation, formal analysis. M.G – investigation, data curation, formal analysis. All authors have read and agreed to the published version of the manuscript.
Funding
This work was supported by the Statutory activity of the Jerzy Haber Institute of Catalysis and Surface Chemistry PAS and by the Research Project of the National Science Center (Poland) UMO-2018/29/BST8/ 01721 (synthesis of the spheroidal particles).
Institutional Review Board Statement
Not applicable.
Informed Consent Statement
Not applicable.
Data Availability Statement
The data is available on request.
Acknowledgments
This work was supported by the Statutory activity of the Jerzy Haber Institute of Catalysis and Surface Chemistry PAS and by the Research Project of the National Science Center (Poland) UMO-2018/29/BST8/ 01721 (synthesis of the spheroidal particles).
Conflicts of Interest
The authors declare no conflict of interest.
Sample Availability
Tested samples are available from the corresponding author (M.N.-R) on request.
References
- Dávalos-Pantoja, L.; Ortega-Vinuesa, J.L.; Bastos-González, D.; Hidalgo- Álvarez, R. Colloidal stability of IgG- and IgY-coated latex microspheres. Colloids Surf. B: Biointerfaces. 2001, 20, 165–175. [Google Scholar] [CrossRef] [PubMed]
- Martín-Rodríguez, A.; Ortega-Vinuesa, J.L.; Hidalgo-Álvarez, R. Interfacial electrokinetics and electrophoresis. In Surfactant Science, 1st ed.; Á.V. Delgado (Ed.); Publisher: Marcel Dekker, Inc., New York, Basel, 2002, pp. 641–670. [CrossRef]
- Kawaguchi, H., Latex Diagnosis, Encyclopedia of Biocolloid and Biointerface Science 2V Set, 1st ed.; Hiroyuki Ohshima (Ed.); John Wiley& Sons INC, 2016, Volume 2, Chapter 50. ISBN: 978-1-118-54276-7.
- Chen, P.; Ding, F.; Cai, R.; Javed, I.; Yang, W.; Zhang, Z.; Li, Y.; Davis, Th.P.; Ke, P.Ch.; Chen, Ch. Amyloidosis inhibition, a new frontier of the protein corona. Nano Today. 2020, 35, 100937. [Google Scholar] [CrossRef] [PubMed]
- Cedervall, T.; Lynch, I.; Lindman, S.; Berggard, T.; Thulin, E.; Nilsson, H.; Dawson, K.D.; Linse, S. Understanding the nanoparticle–protein corona using methods to quantify exchange rates and affinities of proteins for nanoparticles. PNAS. 2007, 104, 2050–2055. [Google Scholar] [CrossRef] [PubMed]
- Milani, S.; Bombelli, F.B.; Pitek, A.S.; Dawson, K.A.; Radler, J. Reversible Versus Irreversible Binding of Transferrin to Polystyrene Nanoparticles: Soft and Hard Coronas. ACS Nano. 2012, 6, 2432–2541. [Google Scholar] [CrossRef] [PubMed]
- Monopoli, M.P.; Aberg, Ch.; Salvati, A.; Dawson, K.A. Biomolecular coronas provide the biological identity of nanosized materials. Nat. Nanotechnol. 2012, 7, 779–786. [Google Scholar] [CrossRef] [PubMed]
- Treuel, L.; Brandholt, S.; Maffre, P.; Wiegele, S.; Shang, L.; Nienhaus, G.U. Impact of Protein Modificationon the Protein Corona on Nanoparticles and Nanoparticle-Cell Interactions. ACS Nano 2014, 8, 503–513. [Google Scholar] [CrossRef] [PubMed]
- Lee, Y.K.; Choi, E.J.; Webster, T.J.; Kim, S.H.; Khang, D. Effect of the protein corona on nanoparticles for modulating cytotoxicity and immunotoxicity. Int. J. Nanomed. 2015, 10, 97–113. [Google Scholar] [CrossRef]
- Winzen, S.; Schoettler, S.; Baier, G.; Rosenauer, C.; Mailaender, V.; Landfestera, K.; Mohr, K. Complementary Analysis of the Hard and Soft Protein Corona: Sample Preparation Critically Effects Corona Composition. Nanoscale 2015, 7, 2992–3001. [Google Scholar] [CrossRef] [PubMed]
- Bertoli, F.; Garry, D.; Monopoli, M.P.; Salvati, A.; Dawson, K.A. The Intracellular Destiny of the Protein Corona: A Study on its Cellular Internalization and Evolution. ACS Nano. 2016, 10, 10471–10479. [Google Scholar] [CrossRef]
- Schöttler, S.; Landfester, K.; Mailänder, V. Controlling the Stealth Effect of Nanocarriers through Understanding the Protein Corona. Angew. Chem. Int. Ed. 2016, 55, 8806–8815. [Google Scholar] [CrossRef] [PubMed]
- Kokkinopoulou, M.; Simon, J.; Landfester, K.; Mailänder, V.; Lieberwirth, I. Visualization of the protein corona: towards a biomolecular understanding of nanoparticle-cell-interactions. Nanoscale. 2017, 9, 8858–8870. [Google Scholar] [CrossRef] [PubMed]
- Baimanov, D.; Cai, R.; Chen, Ch. Understanding the Chemical Nature of Nanoparticle-Protein Interactions. Bioconjugate Chem. 2019, 30, 1923–1937. [Google Scholar] [CrossRef] [PubMed]
- Weiss, A.C.G.; Krüger, K.; Besford, Q.A.; Schlenk, M.; Kempe, K.; Förster, S.; Caruso, F. In Situ Characterization of Protein Corona Formation on Silica Microparticles Using Confocal Laser Scanning Microscopy Combined with Microfluidics. ACS Appl. Mater. Interfaces. 2019, 11, 2459–2469. [Google Scholar] [CrossRef]
- Marichal, L.; Giraudon-Colas, G.; Cousin, F.; Thill, A.; Labarre, J.; Boulard, Y.; Aude, J.Ch.; Pin, S.; Renault, J.P. Protein-Nanoparticle Interactions: What Are the Protein-Corona Thickness and Organization? Langmuir 2019, 35, 10831–10837. [Google Scholar] [CrossRef] [PubMed]
- Zeng, Li.; Gao, J.; Liu, Y.; Gao, J.; Yao, L.; Yang, X.; Liu, X.; He, B.; Hu, L.; Shi, J.; Song, M.; Qu, G.; Jiang, G. Role of protein corona in the biological effect of nanomaterials: Investigating methods. Trends Anal. Chem. 2019, 118, 303–314. [Google Scholar] [CrossRef]
- Wang, H.; Ma, R.; Nienhaus, K.; Nienhaus, G.U. Formation of a Monolayer Protein Corona around Polystyrene Nanoparticles and Implications for Nanoparticle Agglomeration. Small. 2019, 15, 1900974. [Google Scholar] [CrossRef]
- Malaspina, D.C.; Pérez-Fuentes, L.; Drummond, C.; Bastos-González, D.; Faraudo, J. Protein-surface interactions at the nanoscale: Atomistic simulations with implicit solvent models, Curr. Opin. Colloid Interface Sci. 2019, 41, 40–49. [Google Scholar] [CrossRef]
- Lee, J.G.; Lannigan, K.; Shelton, W.A.; Meissner, J.; Bharti, B. Adsorption of Myoglobin and Corona Formation on Silica Nanoparticles. Langmuir. 2020, 36, 14157–14165. [Google Scholar] [CrossRef]
- Nienhaus, K.; Wang, H.; Nienhaus, G.U. Nanoparticles for biomedical applications: exploring and exploiting molecular interactions at the nano-bio interface. Mater. Today Adv. 2020, 5, 100036. [Google Scholar] [CrossRef]
- Li, H.; Wang, Y.; Tang, Q.; Yin, D.; Tang, Ch.; He, E.; Zou, L.; Peng, Q. The protein corona and its effects on nanoparticle-based drug delivery systems. Acta Biomater. 2021, 129, 57–72. [Google Scholar] [CrossRef]
- Martínez-Negro, M.; González-Rubio, G.; Aicart, E.; Landfester, K.; Guerrero-Martínez, A.; Junquera, E. Insights into colloidal nanoparticle-protein corona interactions for nanomedicine applications. Adv. Colloid Interface Sci. 2021, 289, 102366. [Google Scholar] [CrossRef] [PubMed]
- Mishra, R.K.; Ahmad, A.; Vyawahare, A.; Alam, P.; Khan, T.H.; Khana, R. Biological effects of formation of protein corona onto nanoparticles, Int. J. Biol. Macromol. 2021, 175, 1–18. [Google Scholar] [CrossRef] [PubMed]
- Niaz, T. , Sarkar, A.; Mackie, A.; Imran, M. Impact of albumin corona onmucoadhesion and antimicrobial activity of carvacrol loaded chitosan nano-delivery systems under simulated gastro-intestinal conditions. Int. J. Biol. Macromol. 2021, 169, 171–182. [Google Scholar] [CrossRef]
- Farshbaf, M.; Valizadeh, H.; Panahi, Y.; Fatahi, Y.; Chen, M.; Zarebkohan, A.; Gao, H. The impact of protein corona on the biological behavior of targeting nanomedicines. Int. J. Pharm. 2022, 614, 121458. [Google Scholar] [CrossRef] [PubMed]
- Wang, W.; Zhong, Z.; Huang, Z.; Fu, F.; Wang, W.; Wu, L.; Huang, Y.; Wu, Ch.; Pan, X. Two different protein corona formation modes on Soluplus® nanomicelles. Colloids Surf. B: Biointerfaces. 2022, 218, 112744. [Google Scholar] [CrossRef] [PubMed]
- Żeliszewska, P.; Wasilewska, M.; Cieśla, M.; Adamczyk, Z. Deposition of Polymer Particles with Fibrinogen Corona at Abiotic Surfaces under Flow Condition. , Molecules 2021, 26, 6299. [Google Scholar] [CrossRef] [PubMed]
- Adamczyk, Z.; Nattich-Rak, M.; Dąbkowska, M.; Kujda-Kruk, M. Albumin Adsorption at Solid Substrates; A Quest for a Unified Approach. J. Colloid Interface Sci. 2018, 514, 769–790. [Google Scholar] [CrossRef] [PubMed]
- Adamczyk, Z.; Sadlej, K.; Wajnryb, E.; Nattich, M.; Ekiel-Jeżewska, M.; Bławzdziewicz, J. Streaming Potential Studiem of Colloid, Polyelectrolytes and Protein Deposition. Adv. Colloid Interface Sci. 2010, 153, 1–29. [Google Scholar] [CrossRef] [PubMed]
- Dogic, Z.; Fraden, S. Ordered phases of filamentous viruses. Curr. Opin. Colloid Interface Sci. 2006, 11, 47–55. [Google Scholar] [CrossRef]
- Buitenhuis, J. Electrophoresis of fd-virus particles: experiments and an analysis of the effect of finite rod lengths. Langmuir. 2012, 28, 13354–13363. [Google Scholar] [CrossRef]
- Armanious, A.; Aeppli, M.; Jacak, R.; Refardt, D.; Sigstam, T.; Kohn, T.; Sander, M. Viruses at Solid–Water Interfaces: A Systematic Assessment of Interactions Driving Adsorption. Environ. Sci. Technol. 2016, 50, 732–743. [Google Scholar] [CrossRef] [PubMed]
- Dang, H.T.T.; Tarabara, V.V. Virus deposition onto polyelectrolyte-coated surfaces: A study with bacteriophage MS2. J. Colloid Interface Sci. 2019, 540, 155–166. [Google Scholar] [CrossRef] [PubMed]
- de Martín Garrido, N.; Crone, M.A.; Ramlaul, K.; Simpson, P.A.; Freemont, P.S.; Aylett, CH.H.S. Bacteriophage MS2 displays unreported capsid variability assembling T = 4 and mixed capsids. Mol. Microbiol. 2020, 113, 143–152. [Google Scholar] [CrossRef] [PubMed]
- Turoňová, B.; Sikora, M.; Schürmann, C.; Hagen, W.J.H.; Welsch, S.; Blanc, F.E.C.; von Bülow, S.; Gecht, M.; Bagola, K.; Hörner, C.; van Zandbergen, G.; Landry, J.; de Azevedo, N.T.D.; Mosalaganti, S.; Schwarz, A.; Covino, R.; Mühlebach, M.D.; Hummer, G.; Locker, J.K.; Beck, M. In situ structural analysis of SARS-CoV-2 spike reveals flexibility mediated by three hinges. Science. 2020, 370, 203–208. [Google Scholar] [CrossRef]
- Ken, Z.; Oton, J.; Qu, K.; Cortese, M.; Zila, V.; McKeane, L.; Nakane, T.; Zivanov, J.; Neufeldt, C.J.; Cerikan, B.; Lu, J.M.; Peukes, J.; Xiong, X.; Kräusslich, H.-G.; Scheres, S.H.W.; Bartenschlager, R.; Briggs, J.A.G. Structures and distributions of SARS-CoV-2 spike proteins on intact virions. Nature. 2020, 588, 498–502. [Google Scholar] [CrossRef]
- Wu, Y.; Wang, F.; Shen, C.; Peng, W.; Li, D.; Zhao, C.; Li, Z.; Li, S.; Bi, Y.; Yang, Y.; et al. A noncompeting pair of human neutralizing antibodies block COVID-19 virus binding to its receptor ACE2. Science 2020, 368, 1274–1278. [Google Scholar] [CrossRef]
- Mishra, P.M.; Uversky, V.N.; Nandi, C.K. Serum albumin-mediated strategy for the effective targeting of SARS-CoV-2. Medical Hypotheses 2020, 140, 109790. [Google Scholar] [CrossRef]
- Adamczyk, Z.; Batys, P.; Barbasz, J. SARS-CoV-2 virion physicochemical characteristics pertinent to abiotic substrate attachment, Curr. Opin. Colloid Interface Sci. 2021, 55, 101466. [Google Scholar] [CrossRef]
- Wang, Y.; Hammes, F.; Duggelin, M.; Egli, Th. Influence of Size, Shape, and Flexibility on Bacterial Passage through Micropore Membrane Filters. Environ. Sci. Technol. 2008, 42, 6749–6754. [Google Scholar] [CrossRef]
- Ngo, V.K.Th.; Nguyen, D.G.; Nguyen, H.P.U.; Tran, V.M.; Nguyen, Th.Kh.M.; Huynh, T.P.; Lam, Q.V.; Huynh, Th.D.; Truong, Th.N.L. Quartz crystal microbalance (QCM) as biosensor for the detecting of Escherichia coli O157:H7. Adv. Nat. Sci.: Nanosci. Nanotechnol. 2014, 5, 045004. [Google Scholar] [CrossRef]
- Strauss, J.; Kadilak, A.; Cronin, Ch.; Mello, Ch.M.; Camesano, T.A. Binding, inactivation, and adhesion forces between antimicrobial peptide cecropin P1 and pathogenic E. coli. Colloids Surf. B: Biointerfaces. 2010, 75, 156–164. [Google Scholar] [CrossRef] [PubMed]
- Olsson, A.L.J.; Wargenau, A.; Tufenkji, N. Optimizing Bacteriophage Surface Densities for Bacterial Capture and Sensing in Quartz Crystal Microbalance with Dissipation Monitoring. ACS Appl. Mater. Interfaces. 2016, 8, 13698–13706. [Google Scholar] [CrossRef] [PubMed]
- Taneja, P.; Manjuladevi, V.; Gupta, R. K.; Kumar, S.; Gupta, K. K. Facile ultrathin film of silver nanoparticles for bacteria sensing. Colloids Surf. B: Biointerfaces. 2020, 196, 111335. [Google Scholar] [CrossRef] [PubMed]
- Peters Jr, T. All About Albumin: Biochemistry. Genetics and Medical Applications. Academic Press. Elsevier, Amsterdam, Netherlands 1996. ISBN 0080527043, 9780080527048.
- Kragh-Hansen, U., Minchiotti, L., Galliano, M., Peters Jr. T. Human serum albumin isoforms: genetic and molecular aspects and functional consequences. Biochim. Biophys. Acta. 2013, 1830, 5405–5417. [CrossRef] [PubMed]
- Adamczyk, Z.; Morga, M.; Nattich-Rak, M.; Sadowska, M. Nanoparticle and bioparticle deposition kinetics. Adv. Colloid Interface Sci. 2022, 302, 102630. [Google Scholar] [CrossRef] [PubMed]
- Nattich-Rak, M.; Sadowska, M.; Motyczyńska, M.; Adamczyk, Z. Mimicking Pseudo-Virion Interactions with Abiotic Surfaces: Deposition of Polymer Nanoparticles with Albumin Corona. Biomolecules MDPI. 2022, 12, 1658. [Google Scholar] [CrossRef]
- Wasilewska, M.; Adamczyk, Z.; Pomorska, A.; Nattich-Rak, M.; Sadowska, M. Human Serum Albumin Adsorption Kinetics on Silica: Influence of Protein Solution Stability. Langmuir. 2019, 35, 2639–2648. [Google Scholar] [CrossRef] [PubMed]
- Nattich-Rak, M.; Kosior, D.; Morga, M.; Adamczyk, Z. Kinetics of Human Serum Albumin Adsorption on Polycation Functionalized Silica. Biomolecules. 2024, 14, 531. [Google Scholar] [CrossRef] [PubMed]
- Höök, F.; Vörös, J.; Rhodahl, M.; Kurrat, R.; Böni, P.; Ramsden, J.J.; Textor, M.; Spencer, N.D.; Tengvall, P.; Gold, J.; Kasemo, B. A comparative study of protein adsorption on titanium oxide surfaces using in situ ellipsometry, optical waveguide lightmode spectroscopy, and quartz crystal microbalance/dissipation. Colloids Surf. B: Biointerfaces. 2002, 24, 155–170. [Google Scholar] [CrossRef]
- Makaraviciute, A.; Ruzgas, T.; Ramanavicius, A.; Ramanaviciene, A. Antibody fragment immobilization on planar gold and gold nanoparticle modified quartz crystal microbalance with dissipation sensor surfaces for immunosensor applications. Anal. Methods. 2014, 6, 2134. [Google Scholar] [CrossRef]
- Plikusiene, I.; Maciulis, V.; Juciute, S.; Ramanavicius, A.; Balevicius, Z.; Slibinskas, R.; Kucinskaite-Kodze, I.; Simanavicius, M.; Balevicius, S.; Ramanaviciene, A. Investigation of SARS-CoV-2 nucleocapsid protein interaction with a specific antibody by combined spectroscopic ellipsometry and quartz crystal microbalance with dissipation. J. Colloid Interface Sci. 2022, 626, 113–122. [Google Scholar] [CrossRef] [PubMed]
- Adamczyk, Z.; Sadowska, M.; Żeliszewska, P. Applicability of QCM-D for Quantitative Measurements of Nano- and Microparticle Deposition Kinetics: Theoretical Modeling and Experiments. Anal. Chem. 2020, 92, 15087–15095. [Google Scholar] [CrossRef] [PubMed]
- Sadowska, M.; Nattich-Rak, M.; Morga, M.; Adamczyk, Z.; Basinska, T.; Mickiewicz, D.; Gadzinowski, M. Anisotropic Particle Deposition Kinetics from Quartz Crystal Microbalance Measurements: Beyond the Sphere Paradigm. Langmuir. 2024, 40, 7907−7919. [Google Scholar] [CrossRef] [PubMed]
- Tarnapolsky, A.; Freger, V. Modeling QCM-D response to deposition and attachment of microparticles and living cells. Anal. Chem. 2018, 90, 13960–13968. [Google Scholar] [CrossRef] [PubMed]
- Grunewald, C.; Schmudde, M.; Noufele, C. N.; Graf, C.; Risse, T. Ordered structures of functionalized silica nanoparticles on gold surfaces: Correlation of quartz crystal microbalance with structural characterization. Anal. Chem. 2015, 87, 10642–10649. [Google Scholar] [CrossRef] [PubMed]
- Ho, C.C.; Keller, A.; Odell, J.A.; Ottewill, R.H. Preparation of monodisperse ellipsoidal polystyrene particles. Colloid Polym. Sci. 1993, 271, 469–479. [Google Scholar] [CrossRef]
- Komar, P.; Gosecka, M.; Gadzinowski, M.; Gosecki, M.; Makowski, T.; Slomkowski, S.; Basinska, T. Core-shell spheroidal microparticles with polystyrene cores and rich in polyglycidol shells. Polymer. 2018, 146, 6–11. [Google Scholar] [CrossRef]
- Ohshima, H. Approximate Analytic Expression for the Electrophoretic Mobility of Moderately Charged Cylindrical Colloidal Particles. Langmuir. 2015, 31, 13633–13638. [Google Scholar] [CrossRef]
- Henry, D.C. The cataphoresis of suspended particles. Part I.—The equation of cataphoresis. Proc. R. Soc. A. London. 1931, 133. [Google Scholar] [CrossRef]
Figure 1.
Part a. Dependence of the zeta potential calculated from the Henry formula of HSA molecules on pH: 1. (▲) 1 mM NaCl; 2. (●) 10 mM NaCl; 3. (♦) 30 mM NaCl. Dependence of the zeta potential of the spheroidal particles calculated using the Ohshima formula on pH: 1. (♦) 30 mM NaCl; 2. (●) 10 mM NaCl; 3. (▲) 1 mM NaCl, The lines represent the guide for the eyes.
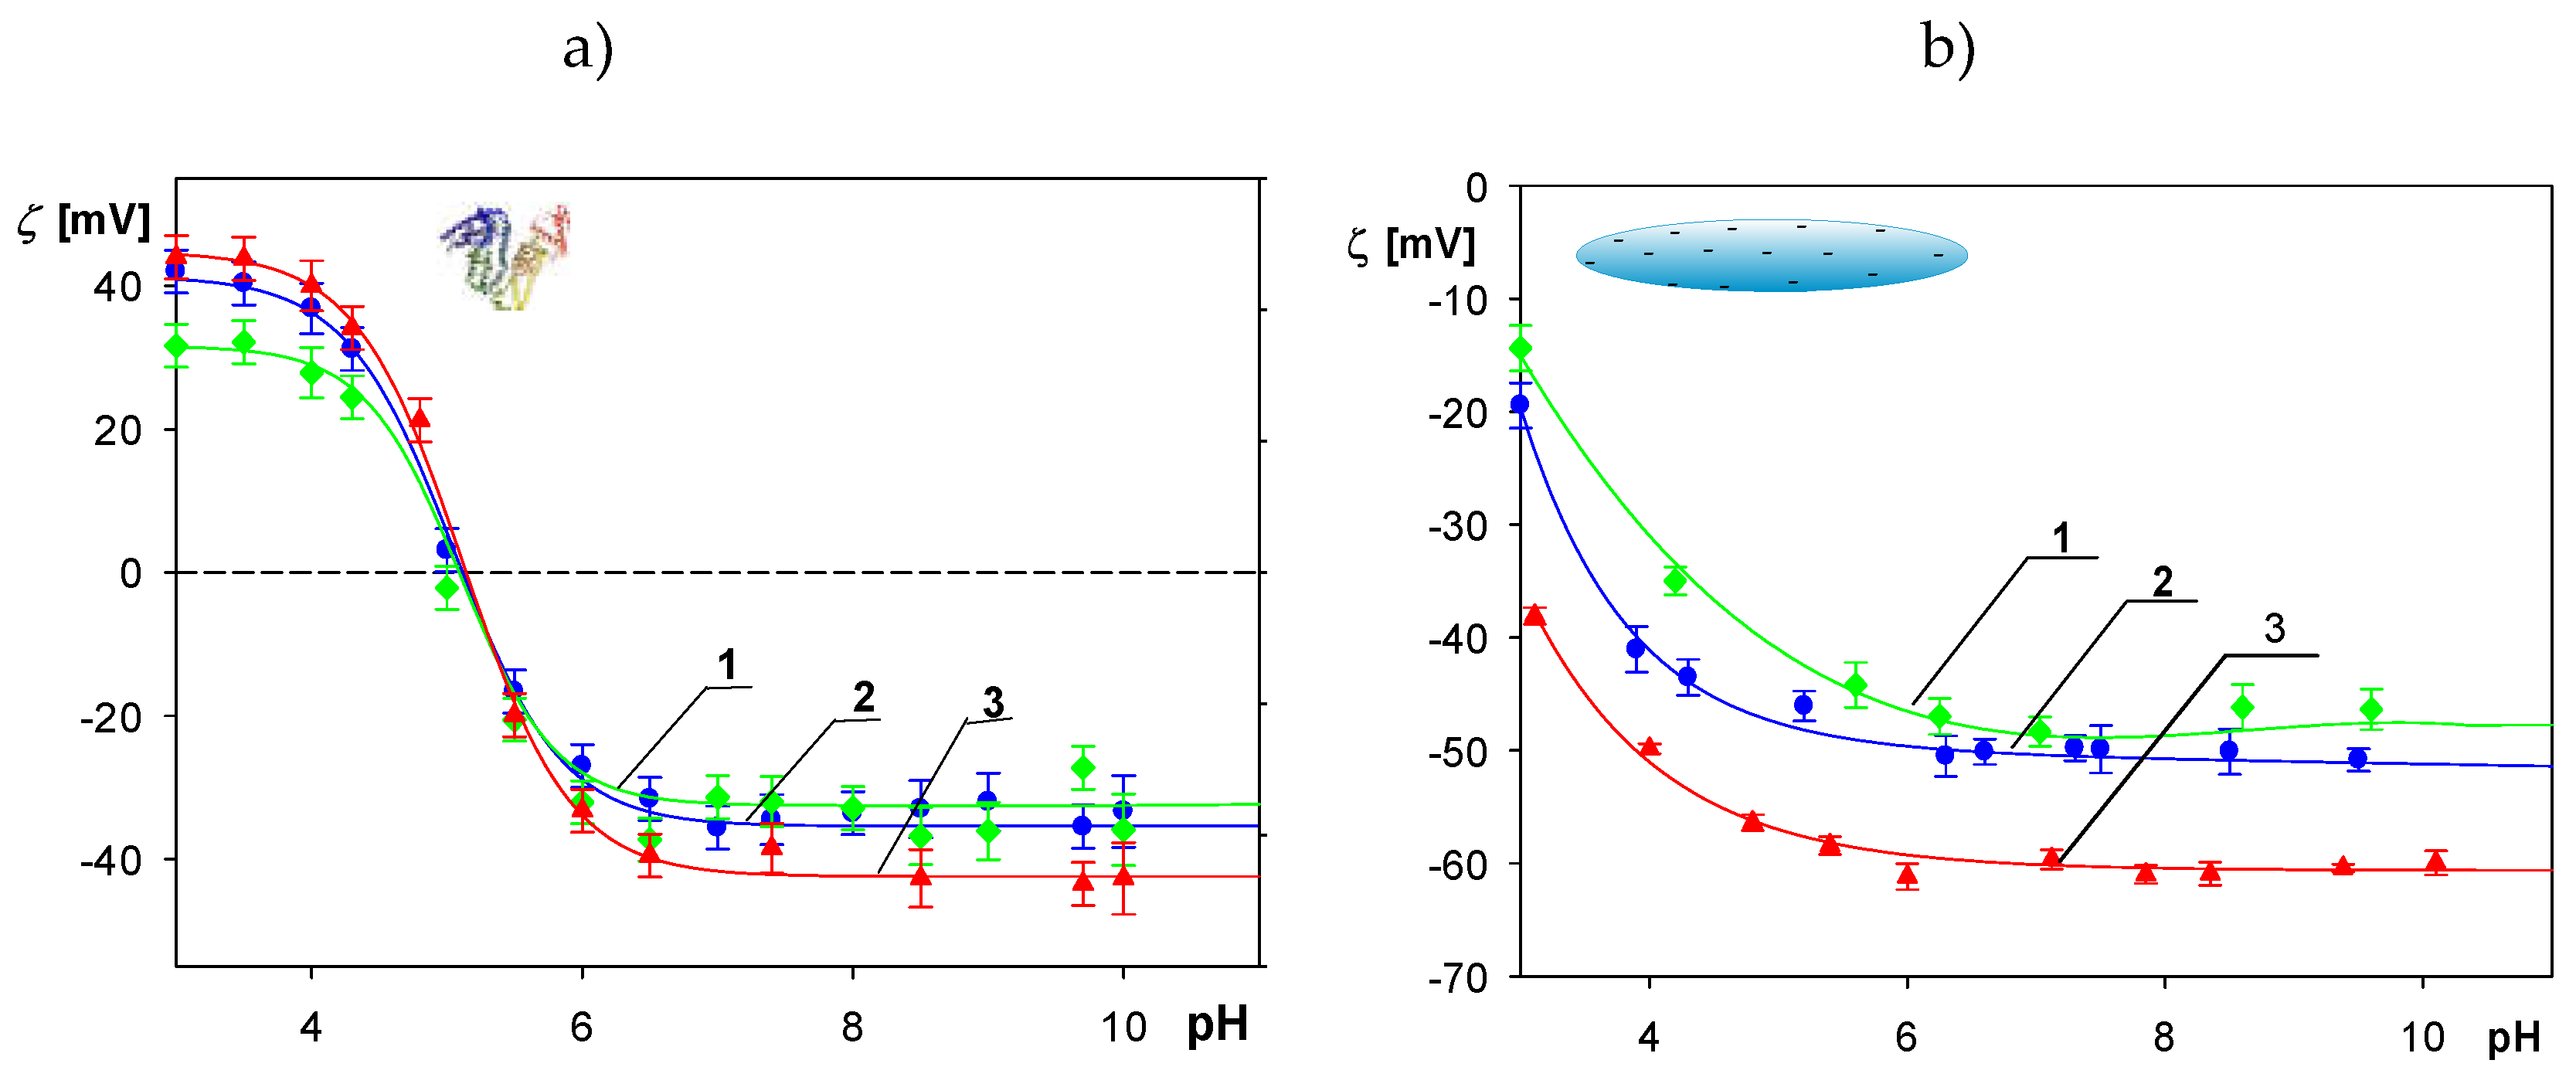
Figure 2.
The SEM micrograph of the P(S/PGL) particle layer.
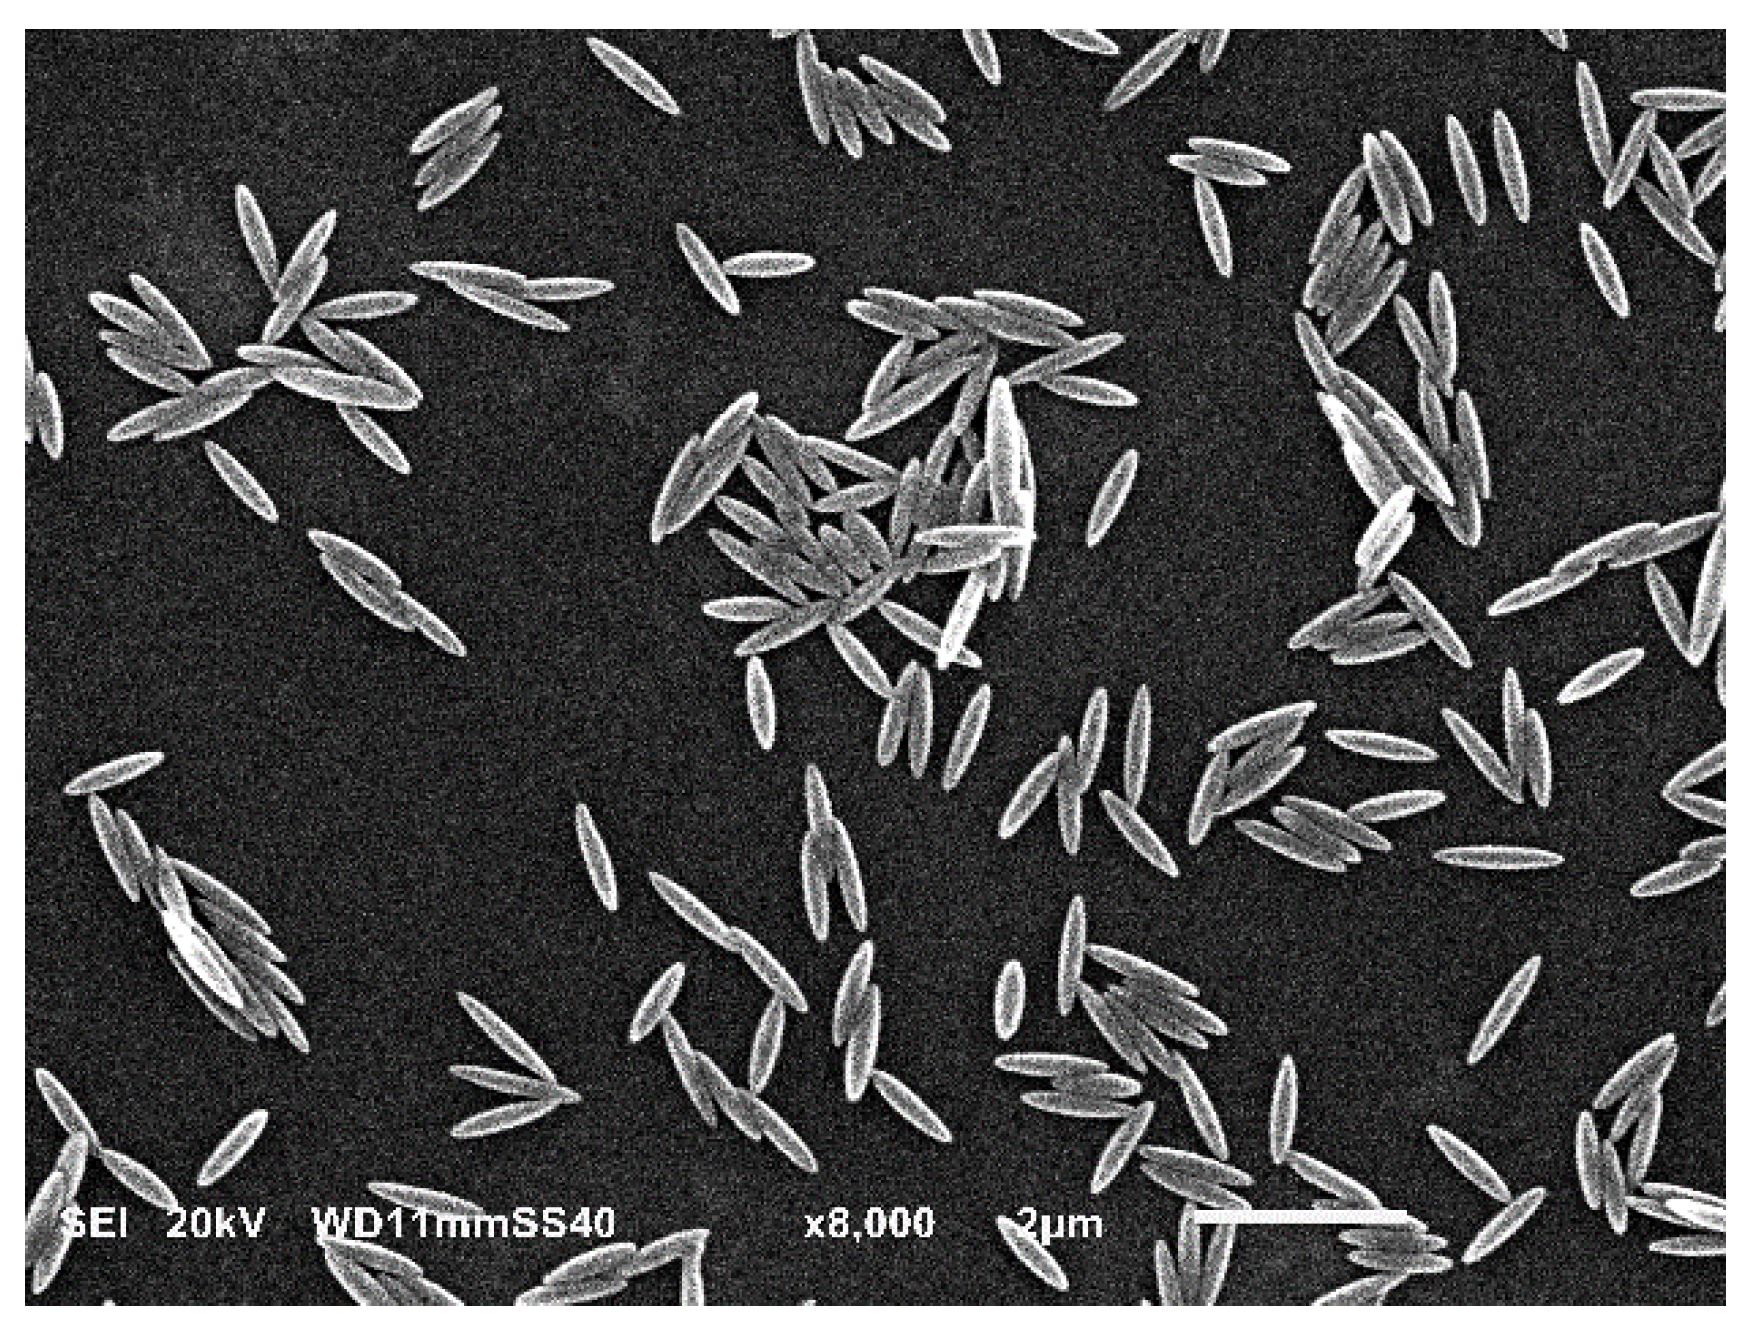
Figure 3.
Dependence of the zeta potential of the polymer particle on the initial HSA concentration in the suspension cp ; (●) experimental results derived from the LDV measurements lower horizontal axis; experimental conditions: 10 mM NaCl, pH 4, initial particle concentration 100 mgL-1. The upper horizontal axis shows the nominal protein coverage calculated from Equation 6. The solid red line shows the theoretical results calculated from Equations 7,8, and the dashed /dotted horizontal line shows the linear fit of the experimental data for larger protein concentration.
Figure 4.
a) Dependence of the hydrodynamic diameter of the SHSA polymer particles on the storage time, pH 4, 10 mM NaCl. The dashed line shows the average value of the hydrodynamic diameter of equal to 390 nm. b) dependence of the zeta potential of the particles on the storage time, pH 4, 10 mM NaCl. The solid line shows the average value of the zeta potential of 15 mV.
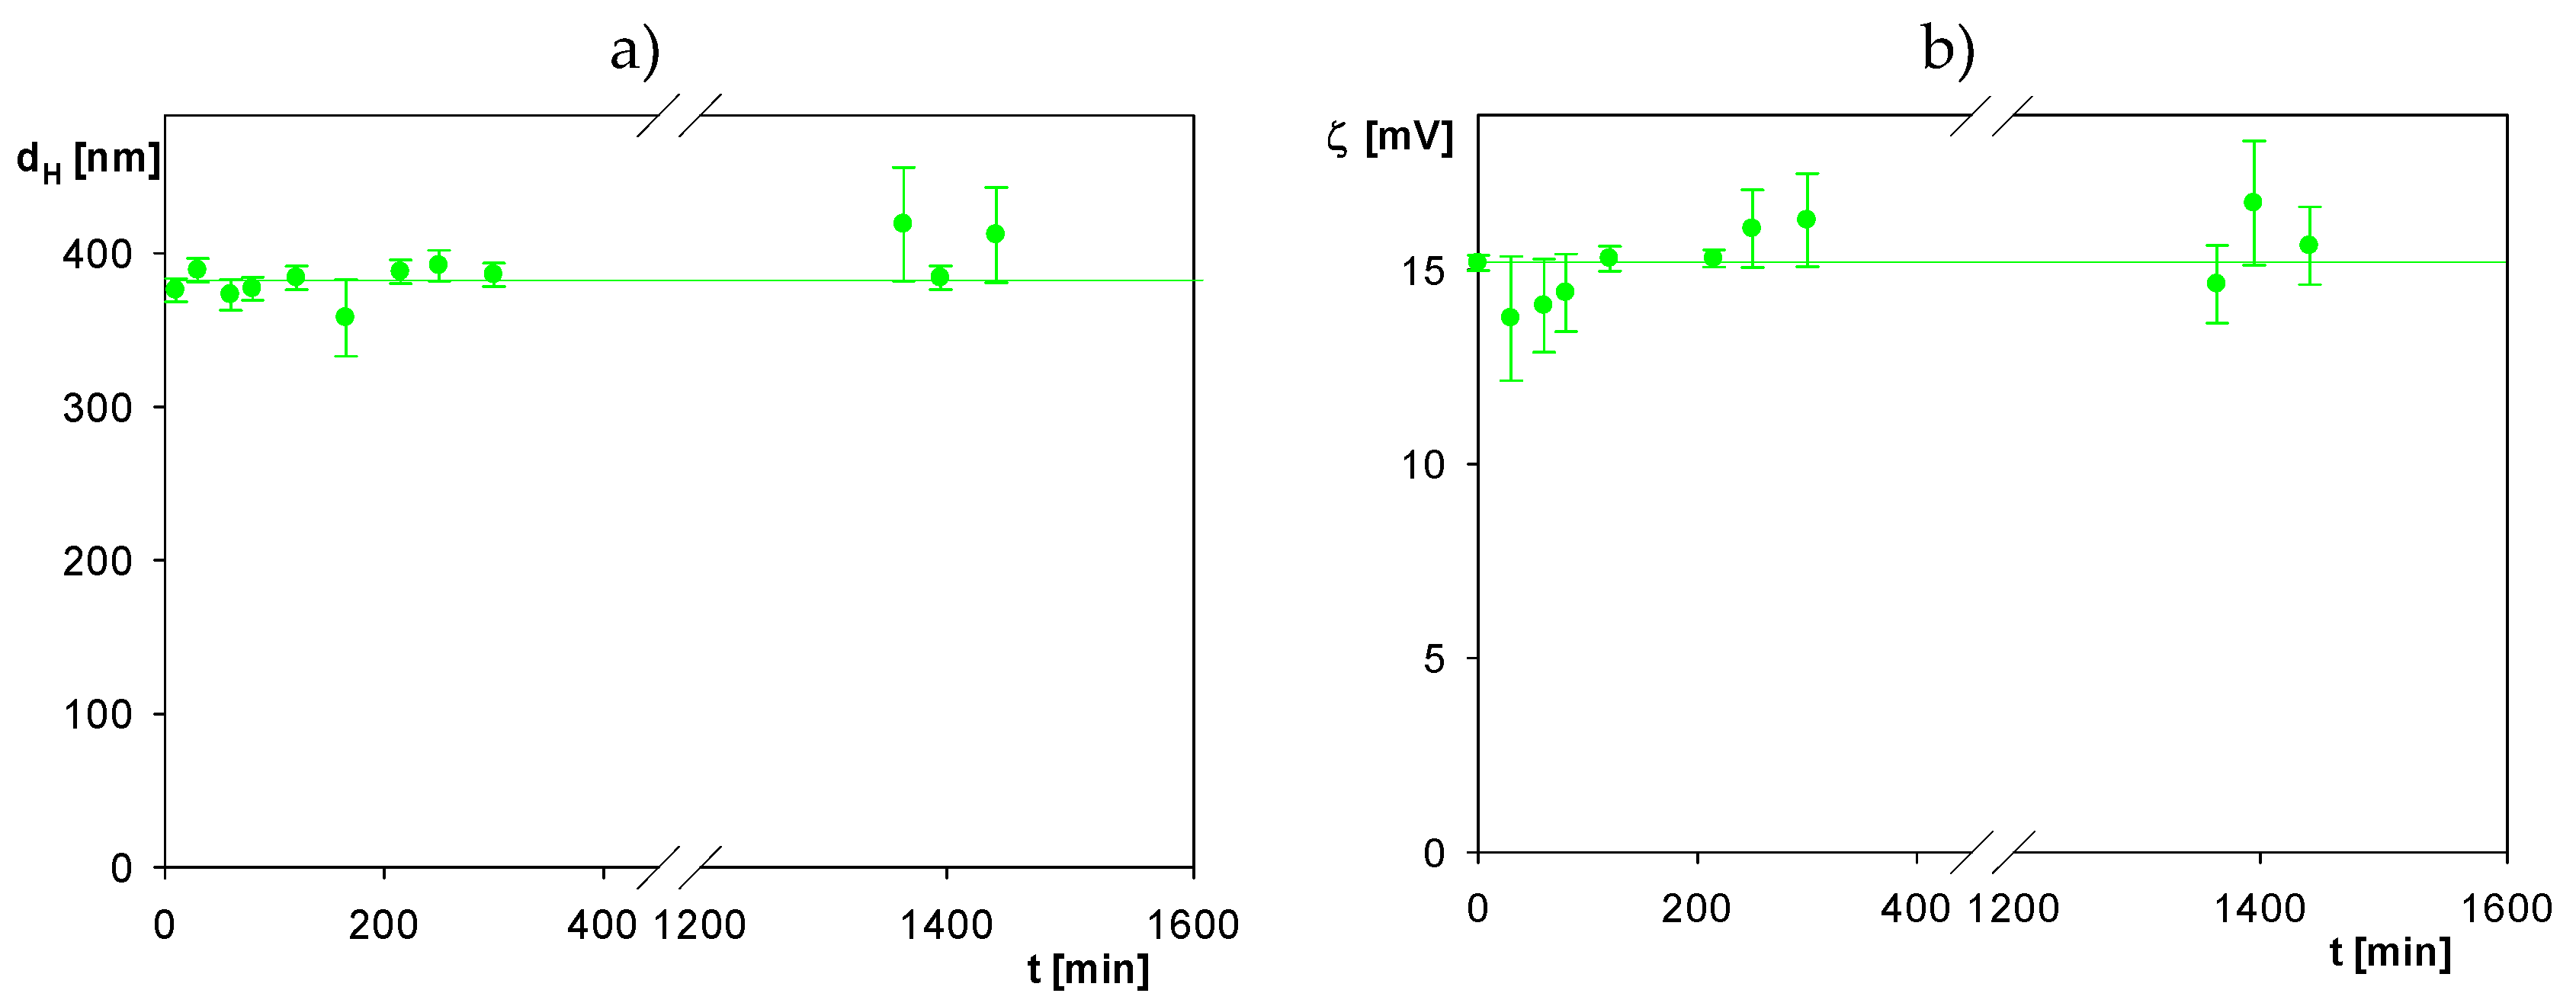
Figure 5.
a) Hydrodynamic diameter of the SHSA polymer particles vs pH, 10 mM NaCl, the lines represent guides to the eyes. b) (●) zeta potential of the SHSA particles vs pH, (●) zeta potential of the bare polymer particles vs pH, 10 mM NaCl; the solid lines 1,2 are guides for the eyes.
Figure 5.
a) Hydrodynamic diameter of the SHSA polymer particles vs pH, 10 mM NaCl, the lines represent guides to the eyes. b) (●) zeta potential of the SHSA particles vs pH, (●) zeta potential of the bare polymer particles vs pH, 10 mM NaCl; the solid lines 1,2 are guides for the eyes.
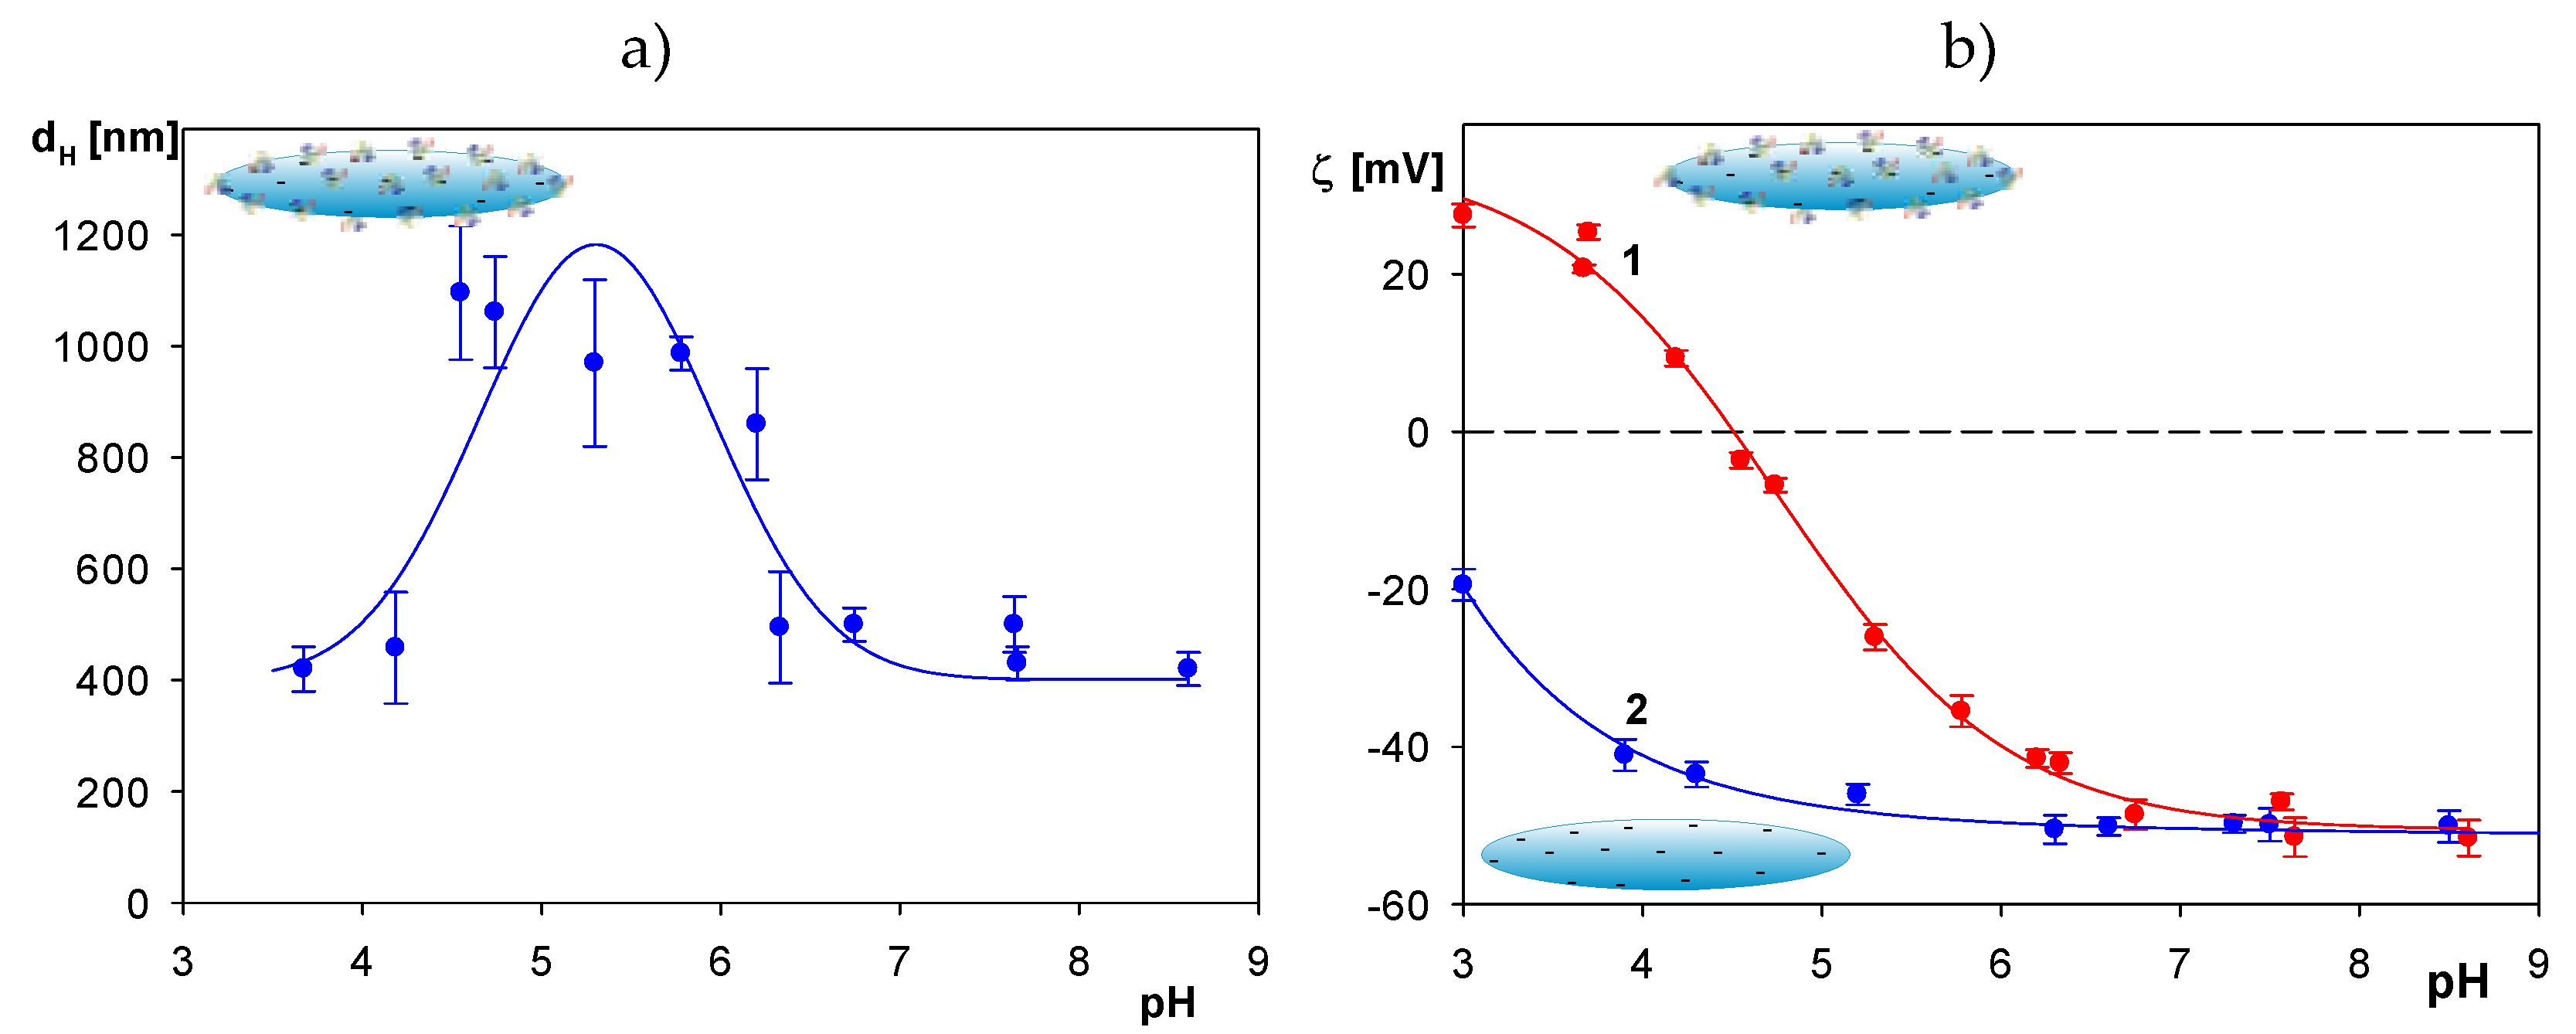
Figure 6.
SHSA particles deposition kinetics at bare mica under diffusion presented as the dependence of its surface concentration N on t1/2 [min1/2], the corona coverage 0.65 mg m-2, pH 4, 10 mM NaCl, particle bulk concentration 50 mg L-1. The green points represent the experimental results obtained by in situ optical microscopy (horizontal inverted microscope orientation, dark field illumination, magnification 20 times). The inset shows the image of the particle layer characterized by N = 0.12 µm-2. The black points show the reference results obtained for the bare spheroid deposition on PAH functionalized mica. The solid red line shows the theoretical results derived from the random sequential adsorption (RSA) model.
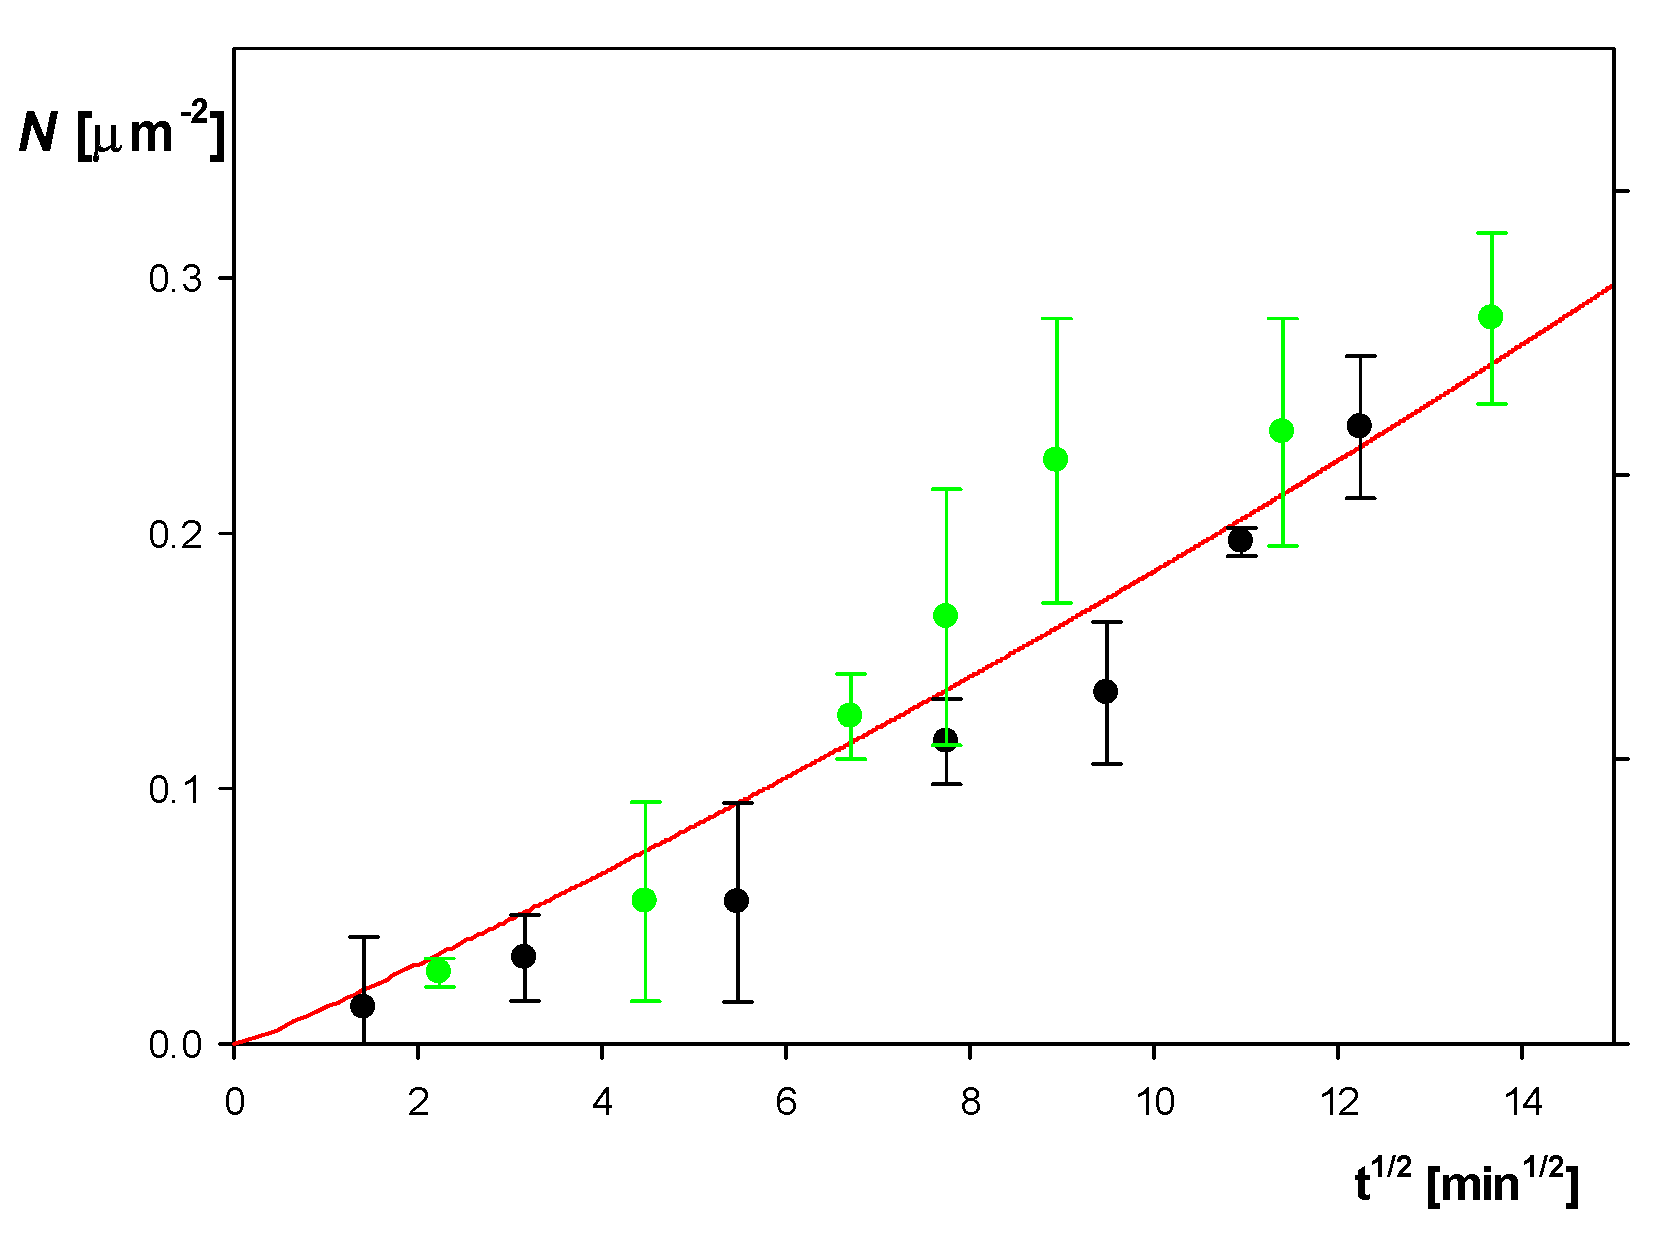
Figure 7.
a) Kinetics of SHSA particle deposition at the silica sensor under diffusion derived from QCM measurements; pH 4, 10 mM NaCl, cb = 50 mg L-1. The solid lines show the experimental data derived from Equation 9 for the various overtones (1 to 11). The inset shows the image of the particle layer at the sensor acquired by AFM. b) Reference results for the bare spheroid deposition at PAH modified silica sensor, pH 4, 10 mM NaCl, cb = 50 mg L-1. The solid lines show the experimental data derived from Equation 9 for various overtones.
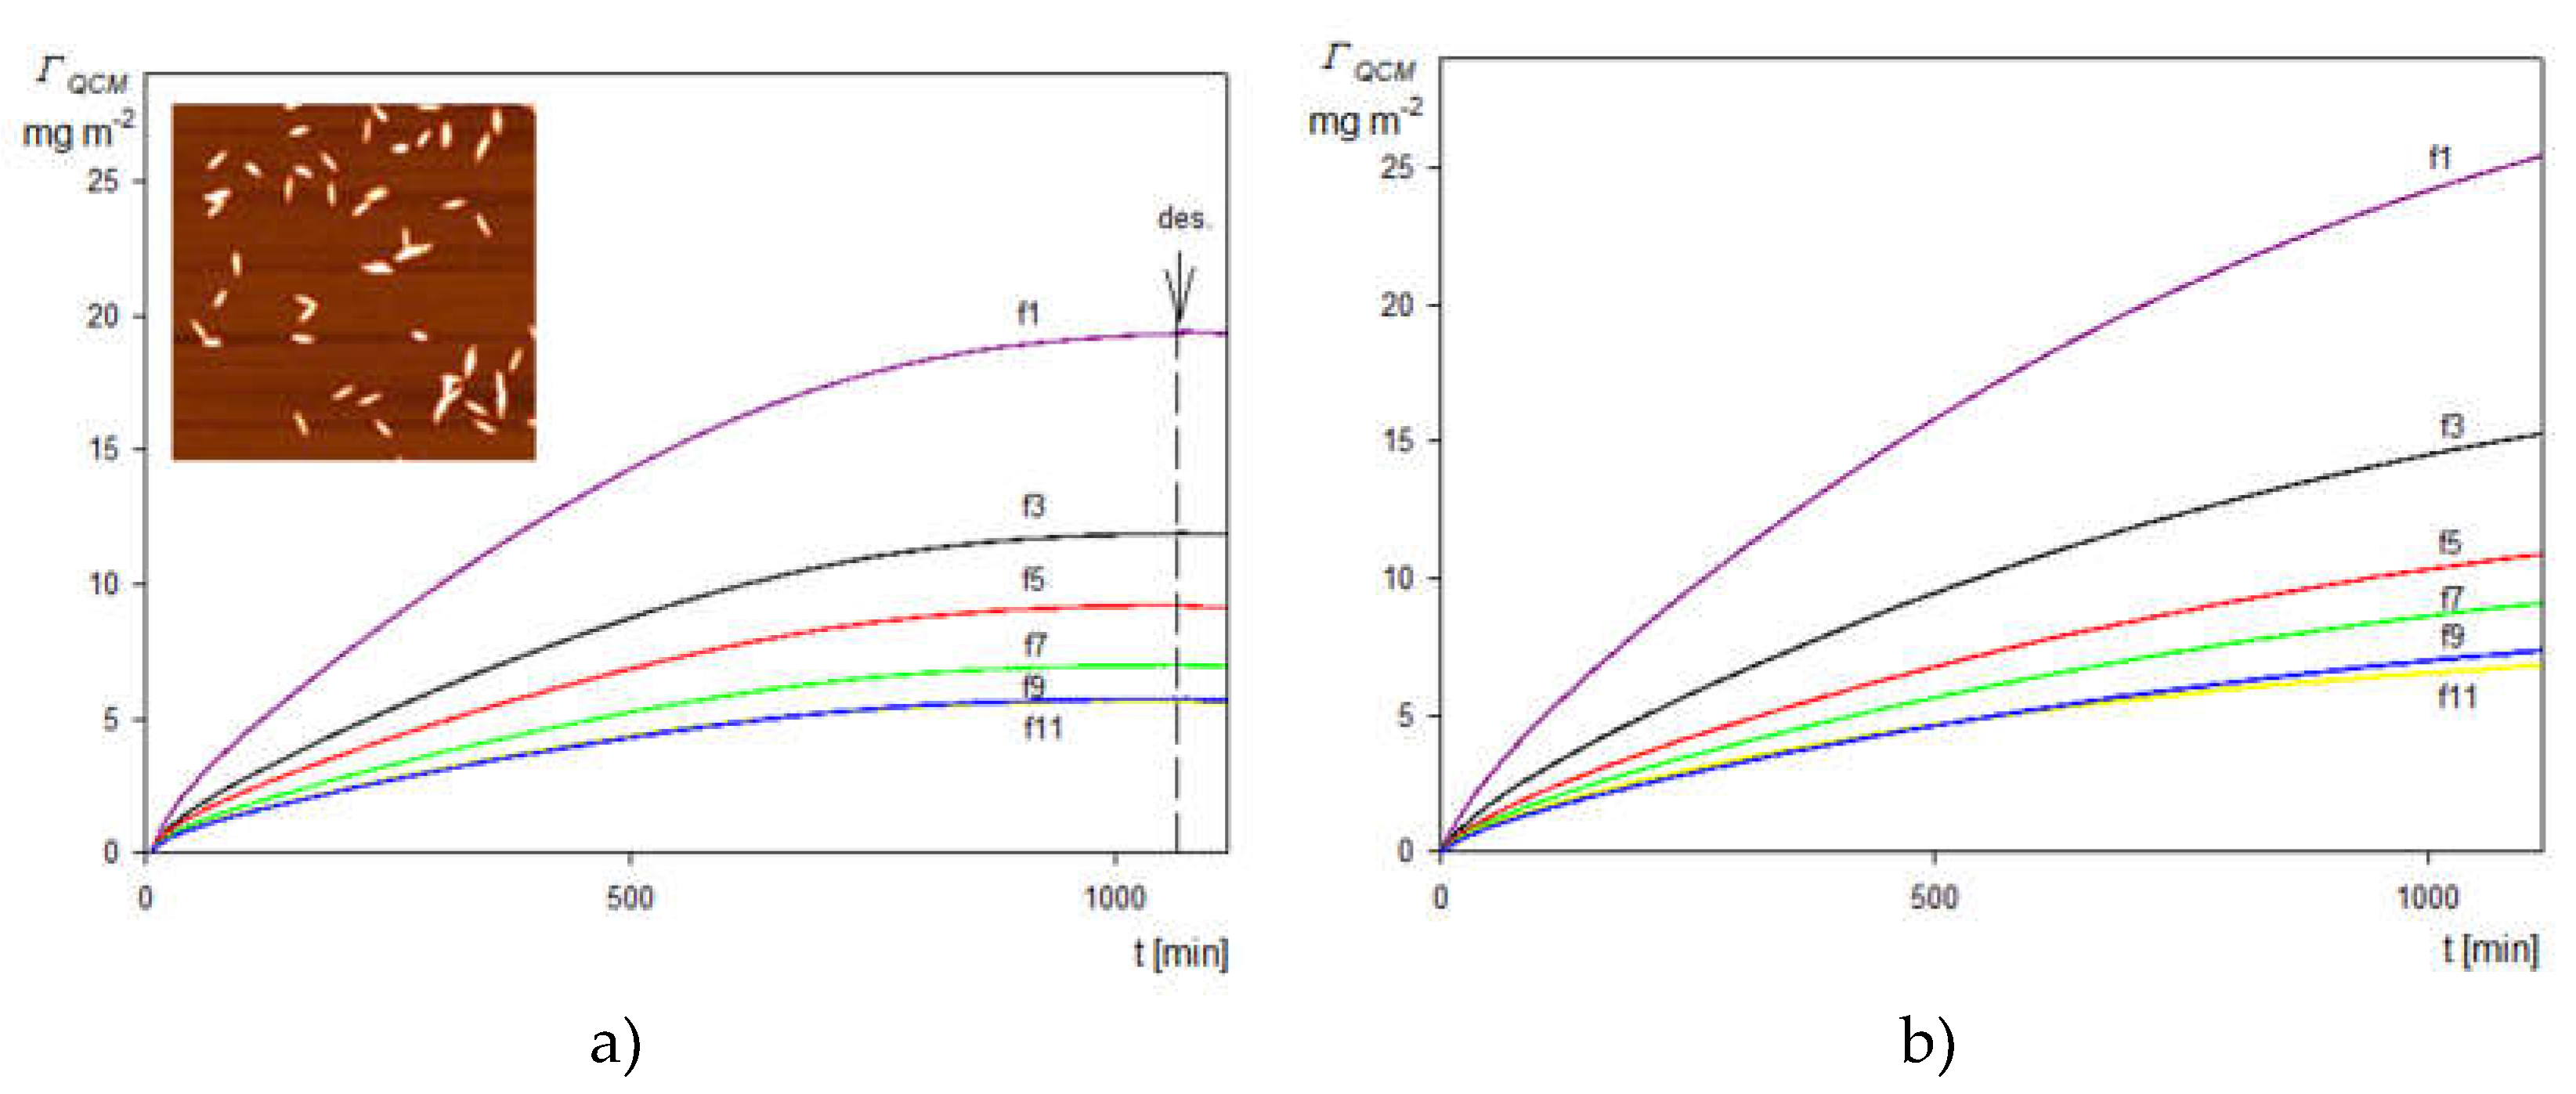
Figure 8.
Kinetics of SHSA particle deposition on silica sensor under diffusion: pH 4, 10 mM NaCl, cb = 50 mg L-1. The solid lines represent the QCM coverage calculated from Equation 10 for various overtones, the green solid line shows the kinetic averaged over all overtones, and the dashed blue line shows the theoretical results calculated from the RSA model.
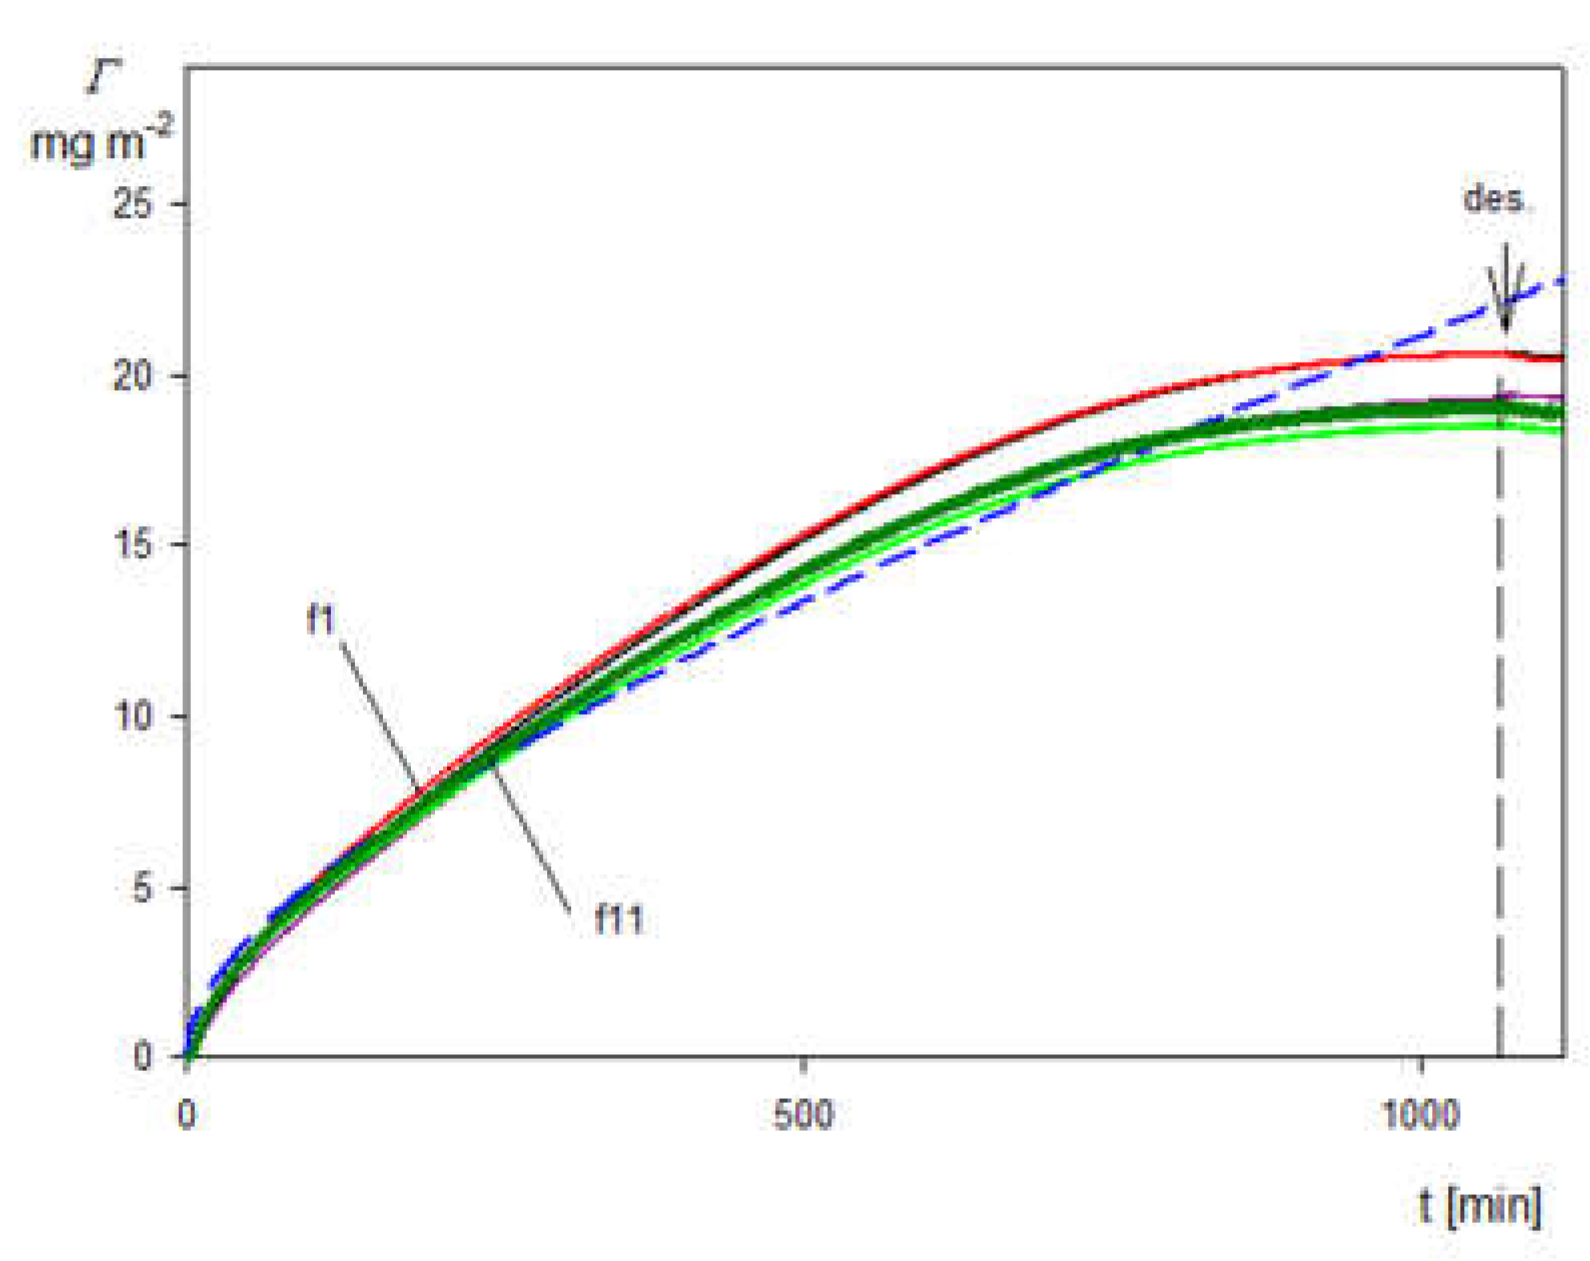
Figure 9.
Comparison of SHSA particle deposition on different sensors under diffusion: pH 4, 10 mM NaCl, cb = 50 mg L-1. The solid red line shows the kinetics calculated using Equation 10 and averaged over the overtones for the gold/PAH sensor and the green line shows the corresponding kinetics for the silica sensor acquired under the same experimental conditions.
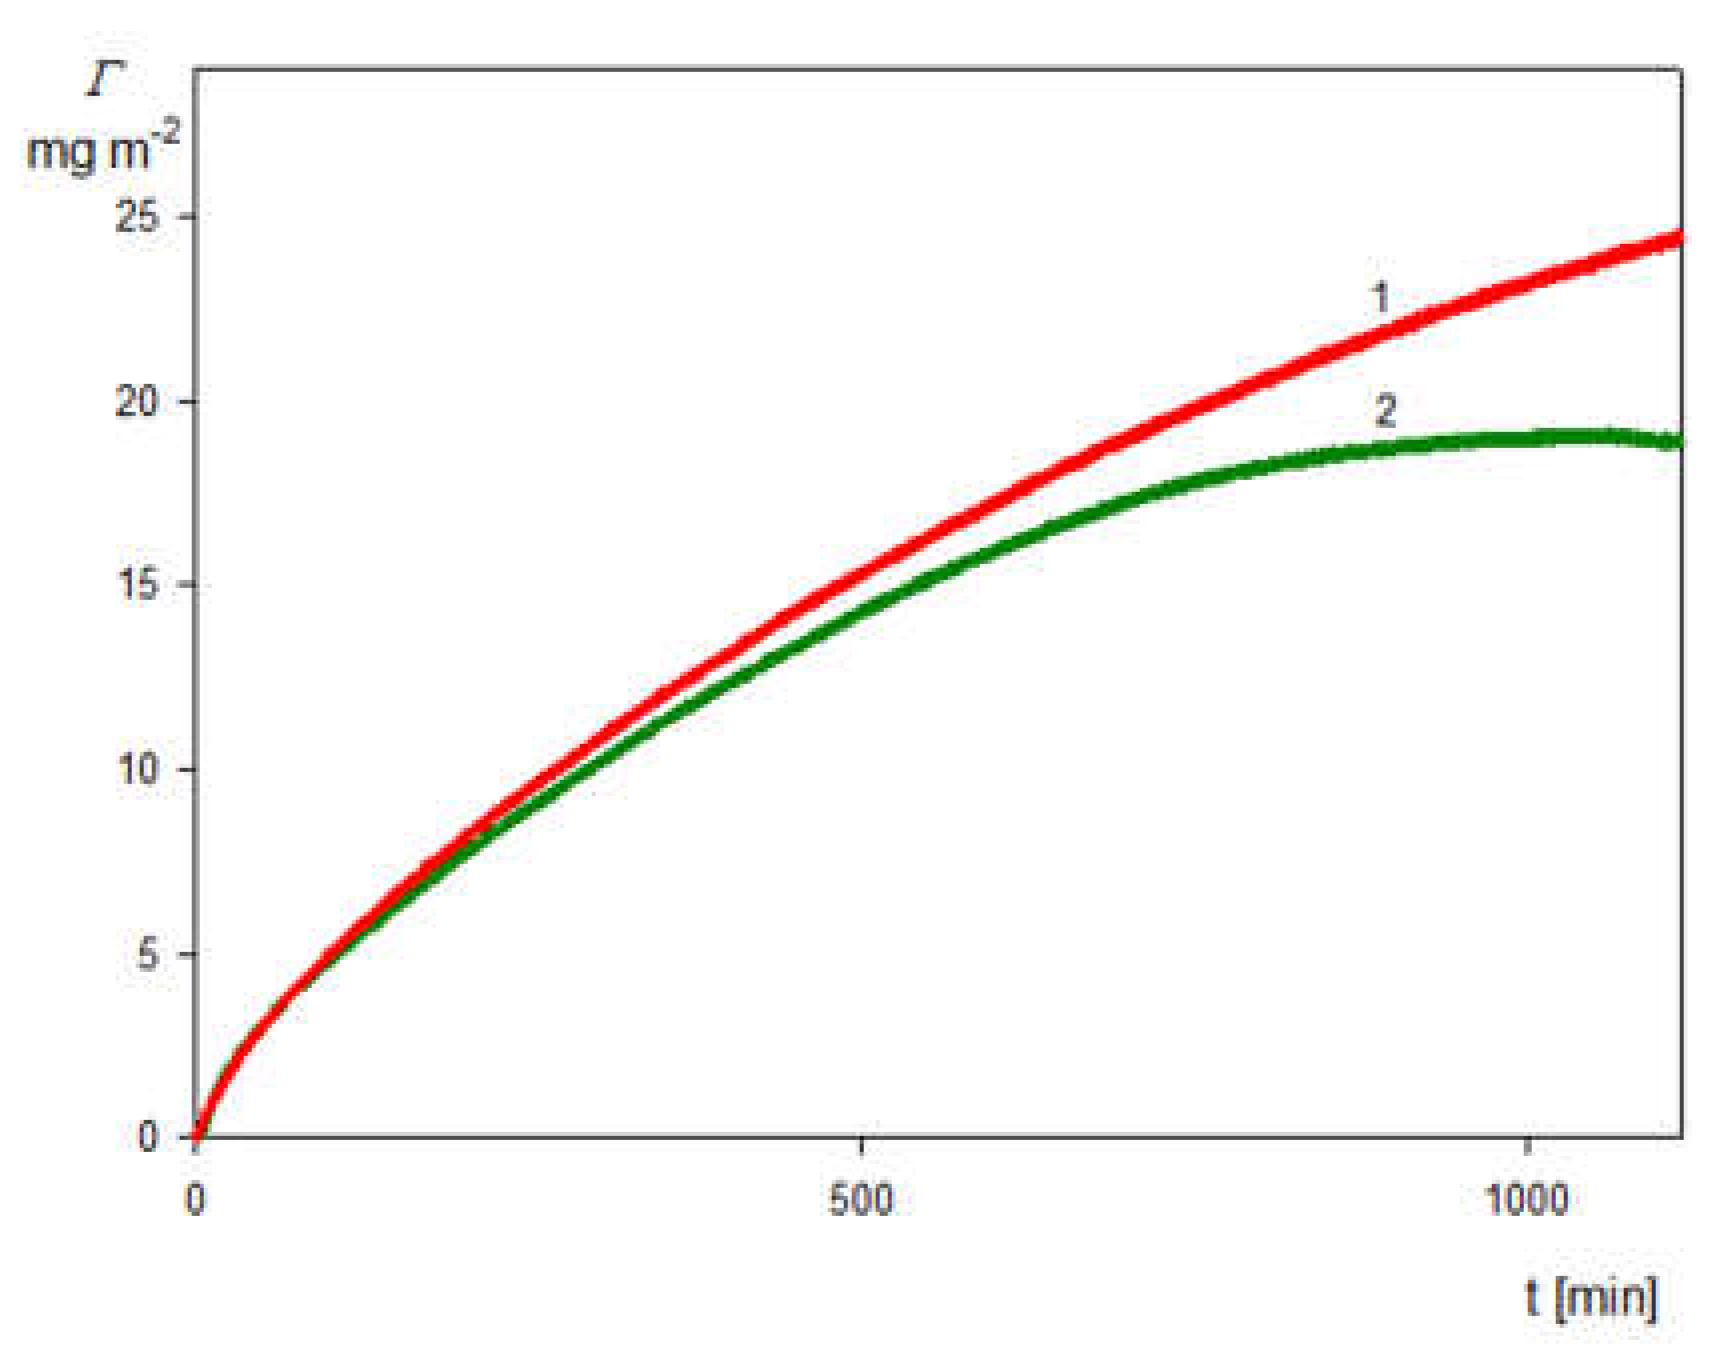
Figure 10.
Kinetics of the SHSA particle deposition on silica sensor under diffusion at different pHs calculated using Equation 10; 10 mM NaCl, cb = 50 mg L-1. 1. Green line pH 4, 2. Black line pH 7.4.
Figure 10.
Kinetics of the SHSA particle deposition on silica sensor under diffusion at different pHs calculated using Equation 10; 10 mM NaCl, cb = 50 mg L-1. 1. Green line pH 4, 2. Black line pH 7.4.
Figure 11.
Kinetics of the SHSA particle deposition on silica sensor under flow at different pHs calculated using Equation 10; 10 mM NaCl, cb = 50 mg L-1, flow rate 2.5×10⁻³ ml s-1. 1. Dashed blue line shows the kinetic for bare spheroidal particles on the silica/PAH sensor, 2. Black line pH 7.4, 3. Green line pH 4.
Disclaimer/Publisher’s Note: The statements, opinions and data contained in all publications are solely those of the individual author(s) and contributor(s) and not of MDPI and/or the editor(s). MDPI and/or the editor(s) disclaim responsibility for any injury to people or property resulting from any ideas, methods, instructions or products referred to in the content. |
© 2024 by the authors. Licensee MDPI, Basel, Switzerland. This article is an open access article distributed under the terms and conditions of the Creative Commons Attribution (CC BY) license (http://creativecommons.org/licenses/by/4.0/).
Copyright: This open access article is published under a Creative Commons CC BY 4.0 license, which permit the free download, distribution, and reuse, provided that the author and preprint are cited in any reuse.


