Submitted:
04 July 2024
Posted:
04 July 2024
You are already at the latest version
Abstract
Industrial buildings have numerous energy-losing equipment, such as engines, ovens, boilers, and heat exchangers. Energy losses are related to inefficient energy use and lousy work conditions for the people inside the buildings. This work is devoted to the recovery of lost energy from industrial buildings. Firstly, the residual energy of the building is extracted to be used to warm water. Consequently, the work conditions of the people inside industrial buildings can be improved by maintaining the adequate temperature. The recovery energy is done by the multipurpose heat pump system (HP system). The working fluid used in the HP system is R134a, which is a traditional and cheap working fluid. The thermophysical properties of R134a are obtained through the PC-SAFT equation of state. This work presents a performance mapping based on the intercepted areas framework to evaluate which working conditions are the optimal operating variables. The latter depends on several key parameters, such as compressor work, heat delivery, heat absorbed, and exergetic efficiency. The results show that the optimal work conditions are found at different condenser and evaporator temperatures, and that may be limited by what the designer considers a good performance of the heat pump system.
Keywords:
Heat pump
; energy efficiency
; heated water
; air conditioning
; PC-SAFT
; Exergy
; Efficiency
1. Introduction
The efficient use of energy is a trendy topic due to the high increase in energy demand and the search for more environmentally friendly energy sources [1,2,3]. Among the broad spectrum of possibilities for exploiting residual thermal energy, the organic Rankine cycles (ORCs) are one of the most promising and investigated alternatives [4,5]. The ORCs are one of the most popular and well-known technologies in this area for taking advantage of residual heat from processes, such as combustion and hot flows. However, the work production from ORCs requires significant energy from low-temperature thermal energy (LTTE) sources. Other technologies that may benefit from LTTE are thermal energy accumulators (TEA) [6,7], drying technologies [8,9], and heat pumps (HP) [10,11].
In most cases, mechanical work produces electric energy. TEAs accumulate LTTE for immediate or later use, such as the heating process. Drying technologies direct the LTTE to reduce the humidity of some materials, such as food, wood, and clothes. HP technologies absorb LTTE for delivery to other places. All the mentioned technologies have in common that they work are based on low-temperature thermal energy, i.e., under 200 °C [12,13]. Generally, energy sources near the ambient temperature are excluded from their utilisation in ORC. The aforementioned sources can be exploited using heat pumps by correctly selecting the working fluids.
Industrial buildings use equipment that generates residual heat, such as engines, ovens, boilers, and heat exchangers, to name a few; these buildings reach temperatures around 40 ºC. The heat generated by the mentioned equipment can change conditions and wellness inside an industrial building by increasing the temperature [14,15]. Therefore, the temperature and energy losses need to be controlled. On the one hand, the building’s interior temperature must be limited to a maximum of around 27 ºC [16] to avoid deterioration of the workers’ work conditions, generating health issues [17]. On the other hand, converting energy losses into useful sources laterally helps reduce energy consumption, reduce pollution, and increase economic competitiveness.
Heat pumps may take advantage of very low temperatures where other technologies cannot operate [18,19]. In addition to using the LTTE to heat a place or substance, HPs can lower the temperature inside an industrial building [20,21]. The above involves investing electric energy in a compressor to multiply the heat absorbed and deliver it to a medium to increase its temperature [22]. As mentioned, the translated heat can be used to warm another fluid or for direct heating. In the first scenario, the most common requirement is hot-water production. Remarkably, water is always necessary. Despite this, water storage is not an economically suitable process [23]. To address the aforementioned issue, there have been proposals for innovative solutions to utilise this resource effectively [10,11,18,19,22,24,25,26].
Min et al. [22] deep analyse the heat pump performance is severely degraded as the temperature of the heat source is decreased. This results in a serious mismatch of heat pump output and space heating demand for air source heat pumps. Zhao et al. [18] investigate the thermal performance of the water-source heat pump water heater system. The study uses a prototype cycle in a heating mode. The influence of the vapour flows and the evaporator performance is established.
Esfahni et al. [19] present a novel approach for addressing the water and cooling demand in climate-change-vulnerable regions. The system includes a multi-effect system based on heat pumps. Oh et al. [24] use a dynamic process simulator to model different layouts of a heat pump system for the building water treatment. Pitarch et al. [25] analyse the critical equipment to improve in these cycles, including the external conditions. Hervás-Blasco et al. [10] present the experimental results of a new water-to-water heat pump composed of the basic heat pump components for water. Stene et al. [26] test a carbon dioxide heat pump by a simulation in space heating and heating water scenarios, and both function simultaneously. Finally, Ammar et al. [11] present a complete review of heat recovery studies, including high and low-grade temperature sources. Various aspects influencing the decision-making for low-grade heat recovery in the process industry are discussed.
This work is dedicated to analysing the key parameters for determining the optimal operational conditions for a multipurpose HP system. This heat pump is used to preserve adequate work conditions in an industrial building and produce hot water. As a first approach to this novel equipment, R134a is utilised as the working fluid, and the analysed parameters are the HP coefficient of performance (COP), the compressor energy demand, the heating capacity of the condenser, and the heat absorbed by the evaporator. Additionally, the exergetic efficiency of the isobaric processes is evaluated as a measurement of the effectiveness of both critical aspects of the system. The optimal operation variables are established to fulfil the two purposes of the system: heating water on demand and promoting the healthiness of the workers of an industrial building.
2. Methodology
2.1. Description of the System
Figure 1 shows a novel heat pump system (HP system) based on a vapour compression cycle. The main objective is to use the thermal residual energy from industrial buildings to heat water. Moreover, the system has a complementary objective. The above purpose is to lower the air temperature in industrial buildings to improve workers’ welfare. The HP system is composed of a compressor, a condenser, a valve expander, and an evaporator. The compressor unit compresses the refrigerant, (1) to (2i), at the condenser pressure. The condenser unit delivers energy, from point (2i) to (3), to the water to raise its temperature. Then, the valve strangles the refrigerant pass, from (3) to (4), to the evaporator work pressure. The evaporator unit absorbs heat from (4) to (1v) from the industrial building.
Figure 2 shows the temperature vs entropy diagram of a refrigerant detailing the system’s fundamental points. The points highlight the four main processes: (1) to (2) reversible compression process, (1) to (2i) irreversible compression process, (2) to (3) isobaric process heat delivery, (3) to (4) isoenthalpic expansion, and (4) to (1v) isobaric heat absorption process. Additionally, Figure 2 shows the water heating profile in the blue line and the air cooling profile in the crimson line. Both temperature profiles, water (w) and air (a), show the inlet temperature (in), the middle temperature (m), and the outlet temperature (out). The middle temperature is defined as the minimum temperature necessary to promote heat transfer between the water and the refrigerant. These points are fundamental in the thermal and exergetic analysis of the system.
The coefficient of performance of a HP, , is used to evaluate the performance of the system based on a vapour compression cycle. The heat pump COP is given by
where is the condenser heat, is the evaporator heat, W is the compressor thermodynamic work, and COP is the coefficient of performance of a vapour compression cycle. Further, , and , being the mass or molar flow in the HP system.
Compressor power input and condenser heat delivery also can be expressed as enthalpy differences. For instance, the compressor power is given by
while for the condenser heat delivery, the heat yields
Correspondingly, the heat absorbed in the evaporator from the industrial building can be written as
Now, considering an exergy approach, the flow-specific exergy [5] can be defined as
where the subscripts k concern the flow while the subscript 0 represents the dead-point condition fixed at the surrounding temperature, which is given by 293.15 K.
In an adiabatic heat exchanger system with two flows, the exergy supplied is the decrease in the hot-flow exergy. In contrast, the exergy recovered is the increase in the cold-flow exergy, as long as it is not at a lower temperature than the surroundings [5,6]. Therefore, the exergetic efficiency between the condenser as a heater and the water yields
where is water mass flow and is working fluid mass flow.
Moreover, the exergetic efficiency between the evaporator as a cooler and the air industrial building yields
where is air mass flow.
As expected, the evaporator temperature is lower than the ambient temperature. Consequently, the previously selected reference cannot be used as the dead-point temperature. For this reason, a second reference is defined to evaluate the exergetic efficiency of the evaporator, . This second dead-point temperature is defined as a temperature 5 K lower than the evaporator temperature in each scenario of analysis.
2.2. Case of Study
This study employs the SECOP compressor model SC10GHH as a compressor unit for the HP system. Table 1 shows the technical characteristics of the SECOP compressor that limit this study [27]. The displaced volume of the compressor, , is fixed. The compressor has a revolution per minute limit range for its use, depending on the motor [28]. For this study 2900 rpm is considered (motor with a pair of poles, 50 Hz).
On the one hand, the compressor operation is operationally limited by the saturation temperature and pressure. On the other hand, a performance range is determined by both the compressor’s lifetime and spoilage. Finally, to determine the refrigerant mass flow that can move the compressor, a technical-mathematical expression is used [29], which is given by
The latter expression considers in m3 h−1, the volumetric performance, , and the working fluid density in the compressor inlet, . Further, is a function of the compression relation, and as
Table 1 shows the condenser and evaporator temperature limit conditions. Additionally, Table 1 displays the water’s initial and air temperatures. The limit condition of the compressor determines the condenser temperature. The evaporator temperature is given by the operating temperature of a compressor that can be used for high back Pressure application, HBP [30]. HBP applications, such as heat pump systems, should be used for high evaporation temperatures. The SECOP compressor, categorised as an HBP compressor, should operate for an evaporator temperature between –10 to 20 °C [30]. The above is considered a regular use of the turbomachine [27,30].
2.3. Modelling
The water that is wanted to heat begins at an initial temperature, 20 °C. The temperature that can reach the water, , is determined by the heat delivery by the HP system condenser.
The enthalpy and entropy are fundamental properties to evaluate key parameters like and condenser exergetic efficiency. Then, to calculate the air enthalpy and entropy, a second-order polynomial is fitted to render the water data, which are given by
The water to heat begins at an initial temperature, 20 °C. The temperature reached by the water, , is determined by the delivery heat by the HP system. The water properties are obtained by the IAPWS multiparametric equation [31].
The air that is wanted to be cooled begins at a fixed initial temperature, 40 °C, and the desired temperature in the industrial building also is fixed, 27 °C. The air is modelled using the standard air assumptions [32]. The enthalpy and entropy are fundamental to evaluating and evaporator exergetic efficiency. Then, to calculate the air enthalpy and entropy, a second-order polynomial is fitted to render the air data, which are given by
and
where the constants of Equations (11) and (13) are presented in the Table 2. The subscript r concerns an arbitrarily selected value for the enthalpy or entropy.
The working fluid used in this study is R134a. R134a is the most popular refrigerant used on a global level [33,34]. R134a is used as the working fluid for the heat pump. The aforementioned working fluid is the most popular refrigerant worldwide [33,34]. For the accurate modelling of the R134a properties, the PC-SAFT equation of state (EOS) is utilised [35,36]. PC-SAFT EOS is one of the most used versions of SAFT-family EOS [37,38] and is highly recognised for its versatility and accuracy. Many different working fluids have been successfully modelled with this approach [39,40,41]. In a general form, these EOSs are expressed as a sum of different contributions to the residual Helmholtz energy of a specific compound, . For a simple compound, this construction is reduced to
The superscripts in Equation (13) concern hard-chain and dispersive contributions, respectively [35]. The total Helmholtz energy function is the sum of the residual contribution and the ideal contribution, i.e., , where the ideal contribution is given by
In Equation (14), R is the universal gas constant and and are the thermodynamic temperature and pressure of a reference state, , respectively. Meanwhile, corresponds to the value of the Helmholtz energy function of the perfect gas at the same reference. Additionally, is the isobaric heat capacity of the perfect gas. The isobaric heat capacity is usually expressed in a polynomial form as
Table 3 summarises the parameter for the reference EOS and for the perfect-gas isobaric heat capacity.
Furthermore, to simplify the analysis, the system is considered to have steady-state conditions in all components, and the heat and friction losses in the system are neglected.
3. Results
Figure 3 shows the three key parameters: compressor power input, delivery heat by the condenser to the water, and COP. The parameters are calculated for three different compressor performances, i.e., 100, 80, and 60 %. The above is for evaluating the compressor performance during a standard compressor life-cycle. Moreover, the key parameters are calculated as a function of the evaporator’s and condenser’s saturation temperatures.
The contour plots presented in Figure 3 highlight the optimisation direction of each variable with the arrows in their margins. For instance, the compressor power grows as the condenser and evaporator temperatures increase. In this case, the optimisation path is opposite to the arrow because consuming less energy in the compression stage is desirable. In the case of the delivered heat, this variable increases with the evaporator temperature and decreases with the condenser temperature.
A compressor that uses a minor amount of energy to perform the same compression labour is more beneficial. Figure 3a show the compressor power input for the design volumetric flow of the equipment. Figure 3a also illustrate the temperature range of the condenser and evaporator for different compressor efficiency values where the minor compression power is reached. As expected, a minor compression power is reached for higher compressor efficiency. Moreover, minor compressor power is located in minor condenser and evaporator temperatures. Underlining the crucial role of the condenser in a heat pump, its objective is to deliver a significant amount of energy to a substance, in this case, water.
Figure 3b present the condenser’s heat delivery to the water. The temperature range of the condenser and evaporator for different performance compressor values, where the heat delivery is maximised, is also illustrated in Figure 3b. It is noticeable that a minor heat delivery is achieved for higher compressor performance. Furthermore, significant heat delivery is found at a lower condenser temperature and higher evaporator temperatures, as indicated by the two arrows that guide the direction of this significant heat delivery.
As mentioned, the COPHP represents the ratio between the heat delivery and the amount of energy consumed by the compressor. Therefore, a larger COPHP denotes better performance. Figure 3c show the COPHP at the three selected efficiencies. As expected, greater COPHP can be found for higher compressor performance. As in the case of the delivery heat, the parameter is more sensitive to the changes in the evaporator temperature than to the condenser. This fact is expected due to both variables are narrowly related.
Figure 4 show the absorbed heat by the HP evaporator, the refrigerant mass flow, and the refrigerant inlet density of the compressor. As in Figure 4, the contour plots are a function of the evaporator’s and condenser’s saturation temperatures. Non of the aforementioned parameters change with the compressor’s isentropic efficiency.
One of the goals of this heat pump is to absorb a significant amount of heat from industrial buildings. This process is crucial for the efficient operation of the system. Figure 4a visually represents the condenser and evaporator’s temperature range where the most heat is absorbed. It’s important to note that greater heat absorption occurs at a lower condenser temperature and higher evaporator temperatures, as indicated by the two arrows that guide the direction of greater heat absorption.
The mass flow is a function of , , and . Considering that is fixed by the compressor’s technical characteristic. Therefore, the mass flow is directly proportional to and . A greater value means moving more refrigerant mass in a specified volume is possible. The straightforward functionality of shows that decreasing the compression ratio yields an increase in . Therefore, a larger refrigerant flow in the system. It is essential to point out that a greater mass flow generates greater delivery and absorption of heat. However, it also generates a greater consume compressor power input. Particularly, the evaporator temperature impacts the density of the compressor suction. In contrast, the condenser temperature does not affect this variable, as seen in Figure 4b. The absorbed heat and refrigerant mass flow are softly sensitive to the condenser temperature, with the evaporator temperature being their major influence.
The compressor outlet temperature is a critical parameter when evaluating the water outlet temperature. This temperature represents the higher temperature reached by the heat pump. Figure 5a depict the compressor outlet temperature at the same variables as the previous analysis. As expected, two demeanours are observed in these figures. Firstly, the temperature is stable depending on the evaporator and condenser temperatures, with the condenser temperature being the most sensitive variable. With less isentropic compression, the evaporator temperature becomes more important, and the temperature can reach higher temperatures. However, the efficiency loss in compression can cause other handicaps in the process [43].
Calefaction and sanitary water lie in a temperature range of around 35.0 to 55.0 °C [10]. The temperature that the water can reach is shown in Figure 5b. It is expected that fewer efficiencies in the compressor will give warmer water. However, as mentioned above, compression efficiency is not a variable in established equipment. Moreover, the water temperature distribution depends almost exclusively on the condenser temperature. The arrows in Figure 5b help to find the maximum water temperature. The latter is located at a larger condenser temperature and lower evaporator temperature. It is considering the water application temperature range mentioned previously. It can be said that from a condenser temperature of 42.5 ºC, for any evaporator temperature and any compressor performance, water temperatures can be found useful for water calefaction and sanitary application.
The heat exchange in the condenser, as a main aim of the process, is essential. For this reason, the exergetic efficiency of this process is analysed and depicted in Figure 5c following Equation (6). The condenser temperature drives the exergetic production. The above is related to the temperature reached by the compressor outlet and the similarity between the profiles of the water and the working fluid in the superheated zone of the refrigerant. Furthermore, less efficiency in the compression yields a decrease in the the exergetic efficiency.
The water quantity is as important as its temperature. Clearly, both parameters are linked because the heat source has a limit for the heat source. Furthermore, it is also related to the number of possible services to use hot water [44]. Figure 6a shows the heated water flow obtained by the HP system. The compressor efficiency of Figure 6a is 80 %. The selection is made given that the water flow is not sensitive to the efficiency of the turbomachinery. The volume of water significatively varies with both temperatures. The optimal point of operation for heated water production is decreasing the evaporator and condenser temperature.
One of the most crucial variables in HP’s design is the airflow that can be cooled from the industrial building. This airflow plays a pivotal role in maintaining the desired temperature within the building, making it a key factor in the overall system design. Additionally, a higher capacity to cool an air volume is related to the time the system takes to reach the comfortable industrial building temperature, as seen in Table 1.
Figure 6b shows the HP cooling capability, as in the case of Figure 6a, this variable is independent of the compressor efficiency, and it is fixed at 80 %. The behaviour of this variable is similar to that of the hot water supply. However, the dependence on the condenser temperature is more prominent. Furthermore, the exergetic efficiency in the cold air supply is displayed in Figure 6c. The greater exergetic efficiency is reached at high temperatures of the evaporator and independent of the condenser temperature. The above yield optimisation opportunities, setting the best combination of evaporator and condenser temperature to operate an HP.
Nine of the twelve analysed variables are displayed in Figure 7. The parameters are evaluated as a deviation given by
where X is the key parameter, the subscript, ref, denotes the reference parameter, and the subscript (i) the ith key parameter. The reference value is selected depending on the variable at the minimum or maximum value presented in the range of the studied temperatures.
Figure 7 shows the deviation, P, of the critical parameters. Some of the selected parameters effectively vary as the compressor efficiency changes. However, the variation is slight, and an isentropic efficiency of 80 % is selected as in previous cases. The arrows in the Figures help locate the maximum deviation of the parameters. Therefore, the good performance of an HP can be limited by a contour of a mixed percentage. For example, a limit variation of 70 % could be established as a good performance of the HP system.
Figure 7 shows the deviation, P, of the critical parameters. Some of the selected parameters effectively vary as the compressor efficiency changes. However, the variation is slight, and an isentropic efficiency of 80 % is selected as in previous cases. The arrows in the Figures help locate the maximum deviation of the parameters. Therefore, the good performance of an HP can be limited by a contour of a mixed percentage. For example, a limit variation of 70 % could be established as a good performance of the HP system. Figure 7a shows that the good performance area for the compressor work is located in all evaporator temperature ranges up to a condenser temperature equal to 48 °C. and in all condenser temperature ranges up to an evaporator temperature equal to 0 °C. In addition, Figure 7b shows the superior performance area for the heat delivery is located in all condenser temperature ranges from an evaporator temperature close to 0 °C and 5 °C for condenser temperatures of 40 and 57 °C, respectively
Figure 8 shows the overlapping of each acceptable performance area generated by key parameters related to a variation minor to 70 %. The above allows visualizing the generation of sub-areas associated with the number of overlapping good performance areas. In this figure, if more areas overlap, more key parameters will meet the acceptable performance. Figure 8a shows the key parameter quantity contained in the areas generated by the overlapping (Roman numerals). Moreover, Figure 8b shows the key parameter types contained in the areas generated by the overlapping (see Figure 7). It is important to mention that heat and cooler exergetic efficiencies are not included in Figure 8 because the cited parameters never reach deviations over 70 %. Only one area contains all key parameters (IX). However, the major quantity of key parameters is located at greater evaporator temperatures. The areas that contain fewer key parameters are located at lower evaporator temperatures. temperatures.
4. Conclusions
This work has been dedicated to a profound analysis of an HP system’s performance, a crucial aspect of energy efficiency. The primary goal is to recover residual thermal energy from industrial buildings, a task of significant importance. The study focuses on two key objectives: the recovery of energy for heating water and industrial building air conditioning, both of which play a vital role in energy conservation.
A set of key parameters was analysed to evaluate the HP system’s performance. The above gives a reference frame concerning the operational conditions of the condenser and evaporator, where it is possible to find the optimal values for the analysing parameters.
Additionally, this work presents an approach based on areas associated with a fixed value. Results show that the optimal operational condition is larger evaporator and low condenser temperatures. In a general vision, many areas are encountered near high evaporator temperatures while the condenser temperatures lie in a wide range. The above also allows moving in considerable ranges of water temperatures associated with several applications and requirements. In addition, it contributes to the industrial building’s air conditioning to promote good work conditions.
Author Contributions
Conceptualization, J. González, L. González; methodology, J. González and L. González, and H. Quinteros-Lama; validation, J. Romero, H. Quinteros-Lama and . M. Garrido; formal analysis, J. González, N. Saavedra, L. González; investigation, J. González, J. Romero, N. Saavedra; resources, J. González, and H. Quinteros-Lama; writing-original draft preparation, J. González, H. Quinteros-Lama; writing-review and editing, N. Saavedra, J. M. Garrido and H. Quinteros-Lama; visualization, J. Romero, L. gonzález, J. González and H.Quinteros-Lama; supervision, J. gonzález, J.M. Garrido and H. Quinteros-Lama; project administration, H. quinteros-Lama and J.M. Garrido; funding acquisition, J.M. Garrido. All authors have read and agreed to the published version of the manuscript.
Acknowledgments
J. González acknowledges funding from FONDEF (Code. VIU23P0023), Chile. H.Q.-L. and J.M.G. acknowledge funding from FONDECYT, Chile (Grant No. 1240765 and No. 1230236) and FOVI220054.
Conflicts of Interest
The authors declare no conflict of interest.
Abbreviations
The following abbreviations are used in this manuscript:
| COP | Coefficient of performance |
| EOS | Equation of state |
| HP | Heat Pump |
| LTTE | Low-temperature thermal energy |
| PC-SAFT | Pertubed-Chain Statistical Associating Fluid Theory |
References
- Al-Mansour, F. Energy efficiency trends and policy in Slovenia. Energy 2011, 36, 1868–1877. [CrossRef]
- de la Rue du Can, S.; Letschert, V.; Agarwal, S.; Park, W.Y.; Kaggwa, U. Energy efficiency improves energy access affordability. Energy for Sustainable Development 2022, 70, 560–568. [CrossRef]
- Chen, T.; Zhang, Y.; Jiang, C.; Li, H. How does energy efficiency affect employment? Evidence from Chinese cities. Energy 2023, 280, 128071. [CrossRef]
- González, J.; Llovell, F.; Garrido, J.M.; Quinteros-Lama, H. A rigorous approach for characterising the limiting optimal efficiency of working fluids in organic Rankine cycles. Energy 2022, 124191, 254. [CrossRef]
- Yekoladio, P.J.; Bello-Ochende, T.; Meyer, J.P. Thermodynamic analysis and performance optimization of organic rankine cycles for the conversion of low-to-moderate grade geothermal heat. International Journal of Energy Research 2015, 39, 1256–1271. [CrossRef]
- Peyrovedin, H.; Haghbakhsh, R.; Duarte, A.R.C.; Shariati, A. Deep Eutectic Solvents as Phase Change Materials in Solar Thermal Power Plants: Energy and Exergy Analyses. Molecules 2022, 27. [CrossRef]
- Daniarta, S.; Nemś, M.; Kolasiński, P.; Pomorski, M. Sizing the Thermal Energy Storage Device Utilizing Phase Change Material (PCM) for Low-Temperature Organic Rankine Cycle Systems Employing Selected Hydrocarbons. Energies 2022, 15. [CrossRef]
- Bellocchi, S.; Guizzi, G.L.; Manno, M.; Pentimalli, M.; Salvatori, M.; Zaccagnini, A. Adsorbent materials for low-grade waste heat recovery: Application to industrial pasta drying processes. Energy 2017, 140, 729–745. [CrossRef]
- Urbano, D.G.; Aquino, A.; Scrucca, F. Energy Performance, Environmental Impacts and Costs of a Drying System: Life Cycle Analysis of Conventional and Heat Recovery Scenarios. Energies 2023, 16, 1523. [CrossRef]
- Hervás-Blasco, E.; Navarro-Peris, E.; Barceló-Ruescas, F.; Corberán, J.M. Improved water to water heat pump design for low-temperature waste heat recovery based on subcooling control. International Journal of Refrigeration 2019, 106, 374–383. [CrossRef]
- Ammar, Y.; Joyce, S.; Norman, R.; Wang, Y.; Roskilly, A.P. Low grade thermal energy sources and uses from the process industry in the UK. Applied Energy 2012, 89, 3–20. [CrossRef]
- Bianchi, M.; De Pascale, A. Bottoming cycles for electric energy generation: Parametric investigation of available and innovative solutions for the exploitation of low and medium temperature heat sources. Applied Energy 2011, 88, 1500–1509. [CrossRef]
- Brogioli, D.; La Mantia, F. Heat recovery in energy production from low temperature heat sources. AIChE Journal 2019, 65, 980–991. [CrossRef]
- Lee, J.Y.; Chen, P.Y. Optimization of Heat Recovery Networks for Energy Savings in Industrial Processes. Processes 2023, 11. [CrossRef]
- Pandey, G.K.; Sikha, S.S.; Thakur, A.; Yarlagadda, S.S.; Thatikonda, S.S.; Baiju suja, B.; Mystkowski, A.; Dragašius, E.; Gundabattini, E. Thermal Mapping and Heat Transfer Analysis of an Induction Motor of an Electric Vehicle Using Nanofluids as a Cooling Medium. Sustainability (Switzerland) 2023, 15. [CrossRef]
- Borgeson, S.; Brager, G. Comfort standards and variations in exceedance for mixed-mode buildings. Building Research and Information 2011, 39, 118–133. [CrossRef]
- Singh, S.; Hanna, E.G.; Kjellstrom, T. Working in Australia’s heat: Health promotion concerns for health and productivity. Health Promotion International 2015, 30, 239–250. [CrossRef]
- Zhao, Z.; Zhang, Y.; Mi, H.; Zhou, Y.; Zhang, Y. Experimental research of a water-source heat pump water heater system. Energies 2018, 11. [CrossRef]
- Janghorban Esfahani, I.; Ifaei, P. Optimal Design of a Renewable-Energy-Driven Integrated Cooling–Freshwater Cogeneration System. Processes 2024, 12, 1164. [CrossRef]
- Masip, X.; Navarro-Peris, E.; Corberán, J.M. Influence of the thermal energy storage strategy on the performance of a booster heat pump for domestic hot water production system based on the use of low temperature heat source. Energies 2020, 13. [CrossRef]
- Dávila, P.; Bourouis, M.; Francisco Nicolalde, J.; Martínez-Gómez, J. Modelling and analysis of a compression/resorption heat pump system with a zeotropic mixture of acetone/CO2. Applied Thermal Engineering 2023, 227. [CrossRef]
- Min, M.; Kim, Y.; Lee, S.; Ko, C. Performance evaluation of a water-to-water heat pump with a floor panel heating system. KSME International Journal 1999, 13, 642–649. [CrossRef]
- Ritchie, M.J.; Engelbrecht, J.A.; Booysen, M.J. Which strategy saves the most energy for stratified water heaters? Energies 2021, 14. [CrossRef]
- Oh, S.; Cho, Y.; Yun, R. Raw-water source heat pump for a vertical water treatment building. Energy and Buildings 2014, 68, 321–328. [CrossRef]
- Pitarch, M.; Hervas-Blasco, E.; Navarro-Peris, E.; Corberán, J.M. Exergy analysis on a heat pump working between a heat sink and a heat source of finite heat capacity rate. International Journal of Refrigeration 2019, 99, 337–350. [CrossRef]
- Stene, J. Residential CO2 heat pump system for combined space heating and hot water heating. International Journal of Refrigeration 2005, 28, 1259–1265. [CrossRef]
- SECOP. Technical Data Model SC10GHH. Technical Data 2023, 1, 1–4. https://www.secop.com/fileadmin/user_upload/SEPS/datasheets/en/sc1212g_104g8280_r134a_220v_50hz_03-2024_ds.pdf.
- Portal, E.E. Electrical characteristic of the motor, 2024.
- Moshinsky, M. Chapter 3. In Manual de refrigeración; Reverté, 2012.
- SECOP. SECOP LBP-MBP-HBP COMPRESSORS: Evaporation Pressures, 2023.
- Wagner, W.; Pruß, A. The IAPWS Formulation 1995 for the Thermodynamic Properties of Ordinary Water Substance for General and Scientific Use. Journal of Physical and Chemical Reference Data 2002, 31, 387–535. [CrossRef]
- Keenan, J.; Chao, J.; Kaye, J. Gas Tables: Thermodynamic Properties of Air Products of Combustion and Component Gases, Compressible Flow Functions; Wiley, 1980.
- Siddiqui, M.U.; Owes, A.; Al-Amri, F.G.; Saeed, F. Recent developments in the search for alternative low-global-warming-potential refrigerants: A review. International Journal of Air-Conditioning and Refrigeration 2020, 28. [CrossRef]
- Shaik, S.V.; Babu, T.P. Theoretical Performance Investigation of Vapour Compression Refrigeration System Using HFC and HC Refrigerant Mixtures as Alternatives to Replace R22. Energy Procedia 2017, 109, 235–242. [CrossRef]
- Gross, J.; Sadowski, G. Perturbed-Chain SAFT: An equation of state based on a perturbation theory for chain molecules. Industrial & Engineering Chemistry Research 2001, 40, 1244 – 1260. [CrossRef]
- Gross, J.; Sadowski, G. Application of the Perturbed-Chain SAFT equation of state to associating systems. Industrial & Engineering Chemistry Research 2002, 41, 5510 – 5515. [CrossRef]
- Chapman, W.G.; Gubbins, K.E.; Jackson, G.; Radosz, M. SAFT: equation-of-state solution model for associating fluids. Fluid Phase Equilibria 1989, 52, 31 – 38. [CrossRef]
- Chapman, W.G.; Gubbins, K.E.; Jackson, G.; Radosz, M. New reference equation of state for associating liquids. Industrial & Engineering Chemistry Research 1990, 29, 1709 – 1721. [CrossRef]
- González, J.; Llovell, F.; Garrido, J.M.; Quinteros-Lama, H. Accurate and Model-Free Control Function for a Single Stage Transcritical Refrigerator Cycle. ACS Omega 2020, 5, 19217–19226. [CrossRef]
- Parvaneh, K.; Rasoolzadeh, A.; Shariati, A. Modeling the phase behavior of refrigerants with ionic liquids using the QC-PC-SAFT equation of state. Journal of Molecular Liquids 2019, 274, 497–504. [CrossRef]
- Cea-Klapp, E.; Polishuk, I.; Canales, R.I.; Quinteros-Lama, H.; Garrido, J.M. Estimation of Thermodynamic Properties and Phase Equilibria in Systems of Deep Eutectic Solvents by PC-SAFT EoS. Industrial & Engineering Chemistry Research 2020, 59, 22292–22300. [CrossRef]
- González, J.; Llovell, F.; Garrido, J.M.; Quinteros-Lama, H. Selection of a suitable working fluid for a combined organic Rankine cycle coupled with compression refrigeration using molecular approaches. Fluid Phase Equilibria 2023, 572, 113847. [CrossRef]
- Yang, L.; Zhao, L.X.; Zhang, C.L.; Gu, B. Loss-efficiency model of single and variable-speed compressors using neural networks. International Journal of Refrigeration 2009, 32, 1423–1432. [CrossRef]
- Willem, H.; Lin, Y.; Lekov, A. Review of energy efficiency and system performance of residential heat pump water heaters. Energy and Buildings 2017, 143, 191–201. [CrossRef]
Figure 1.
A schematic representation of a heat pump system for hot water by absorbing industrial building residual thermal energy.
Figure 1.
A schematic representation of a heat pump system for hot water by absorbing industrial building residual thermal energy.
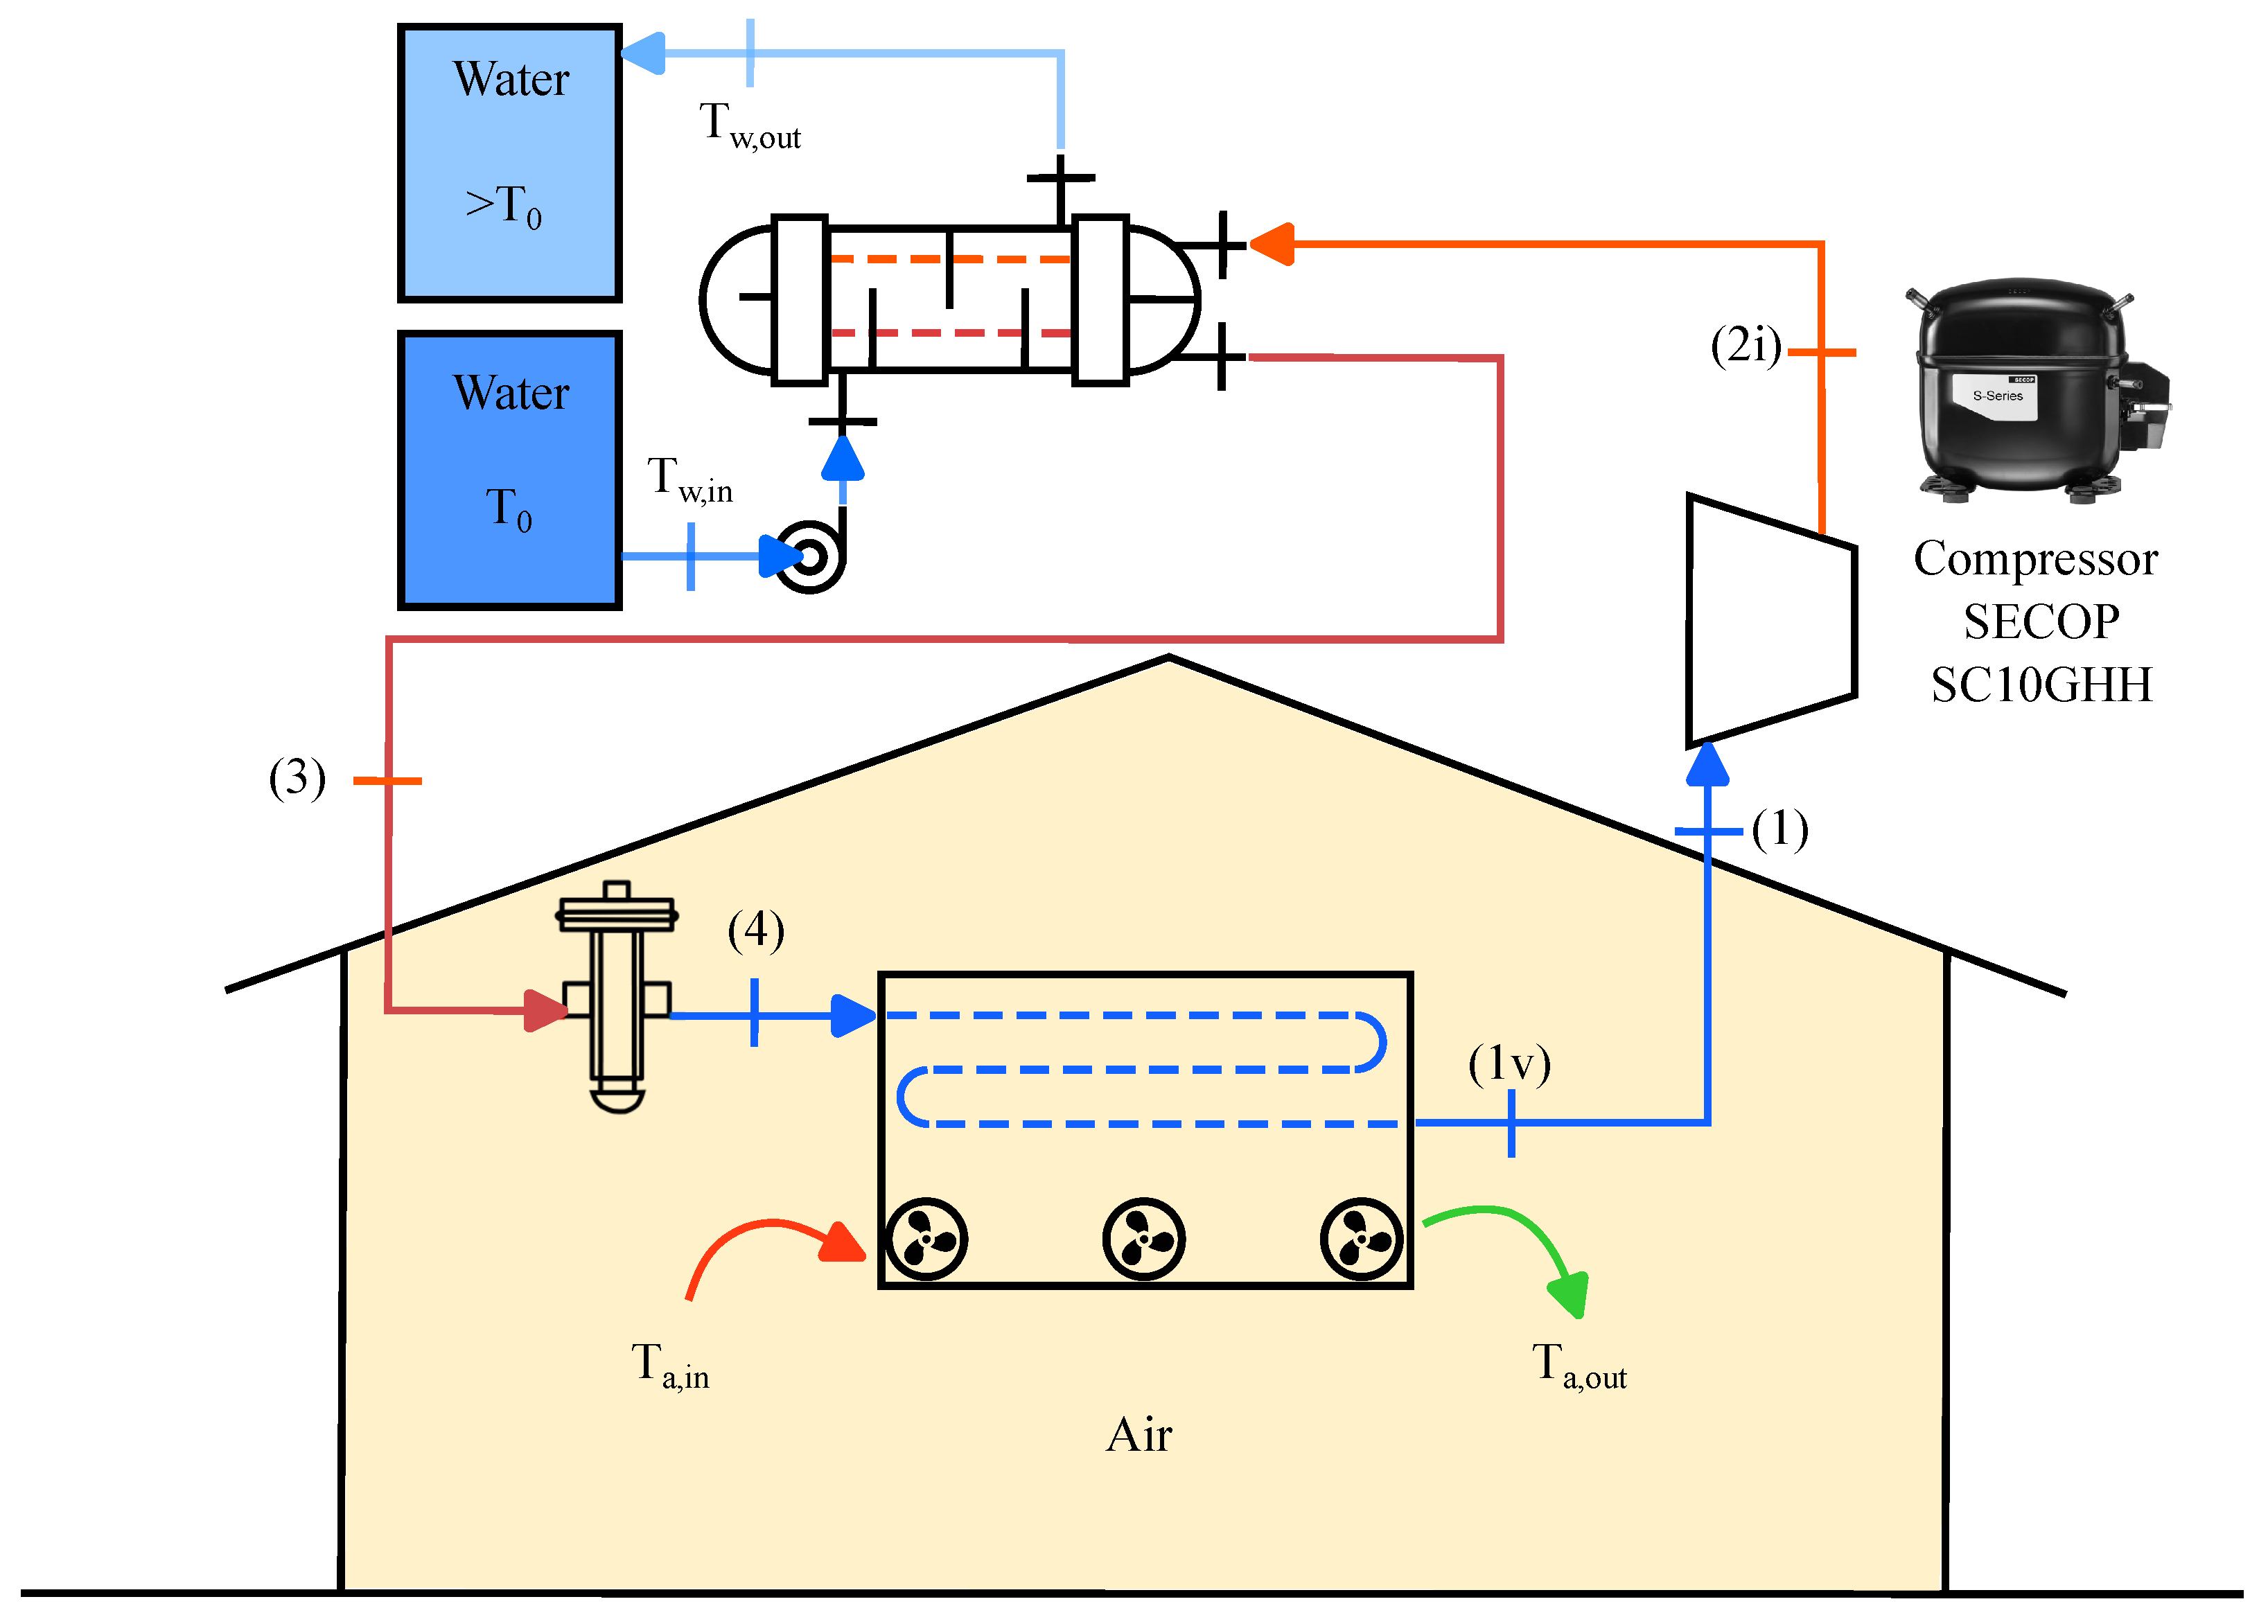
Figure 2.
Schematic illustration of the HP system in the temperature vs entropy projection displaying water heating and the cooling air temperature profiles for the industrial building.
Figure 2.
Schematic illustration of the HP system in the temperature vs entropy projection displaying water heating and the cooling air temperature profiles for the industrial building.
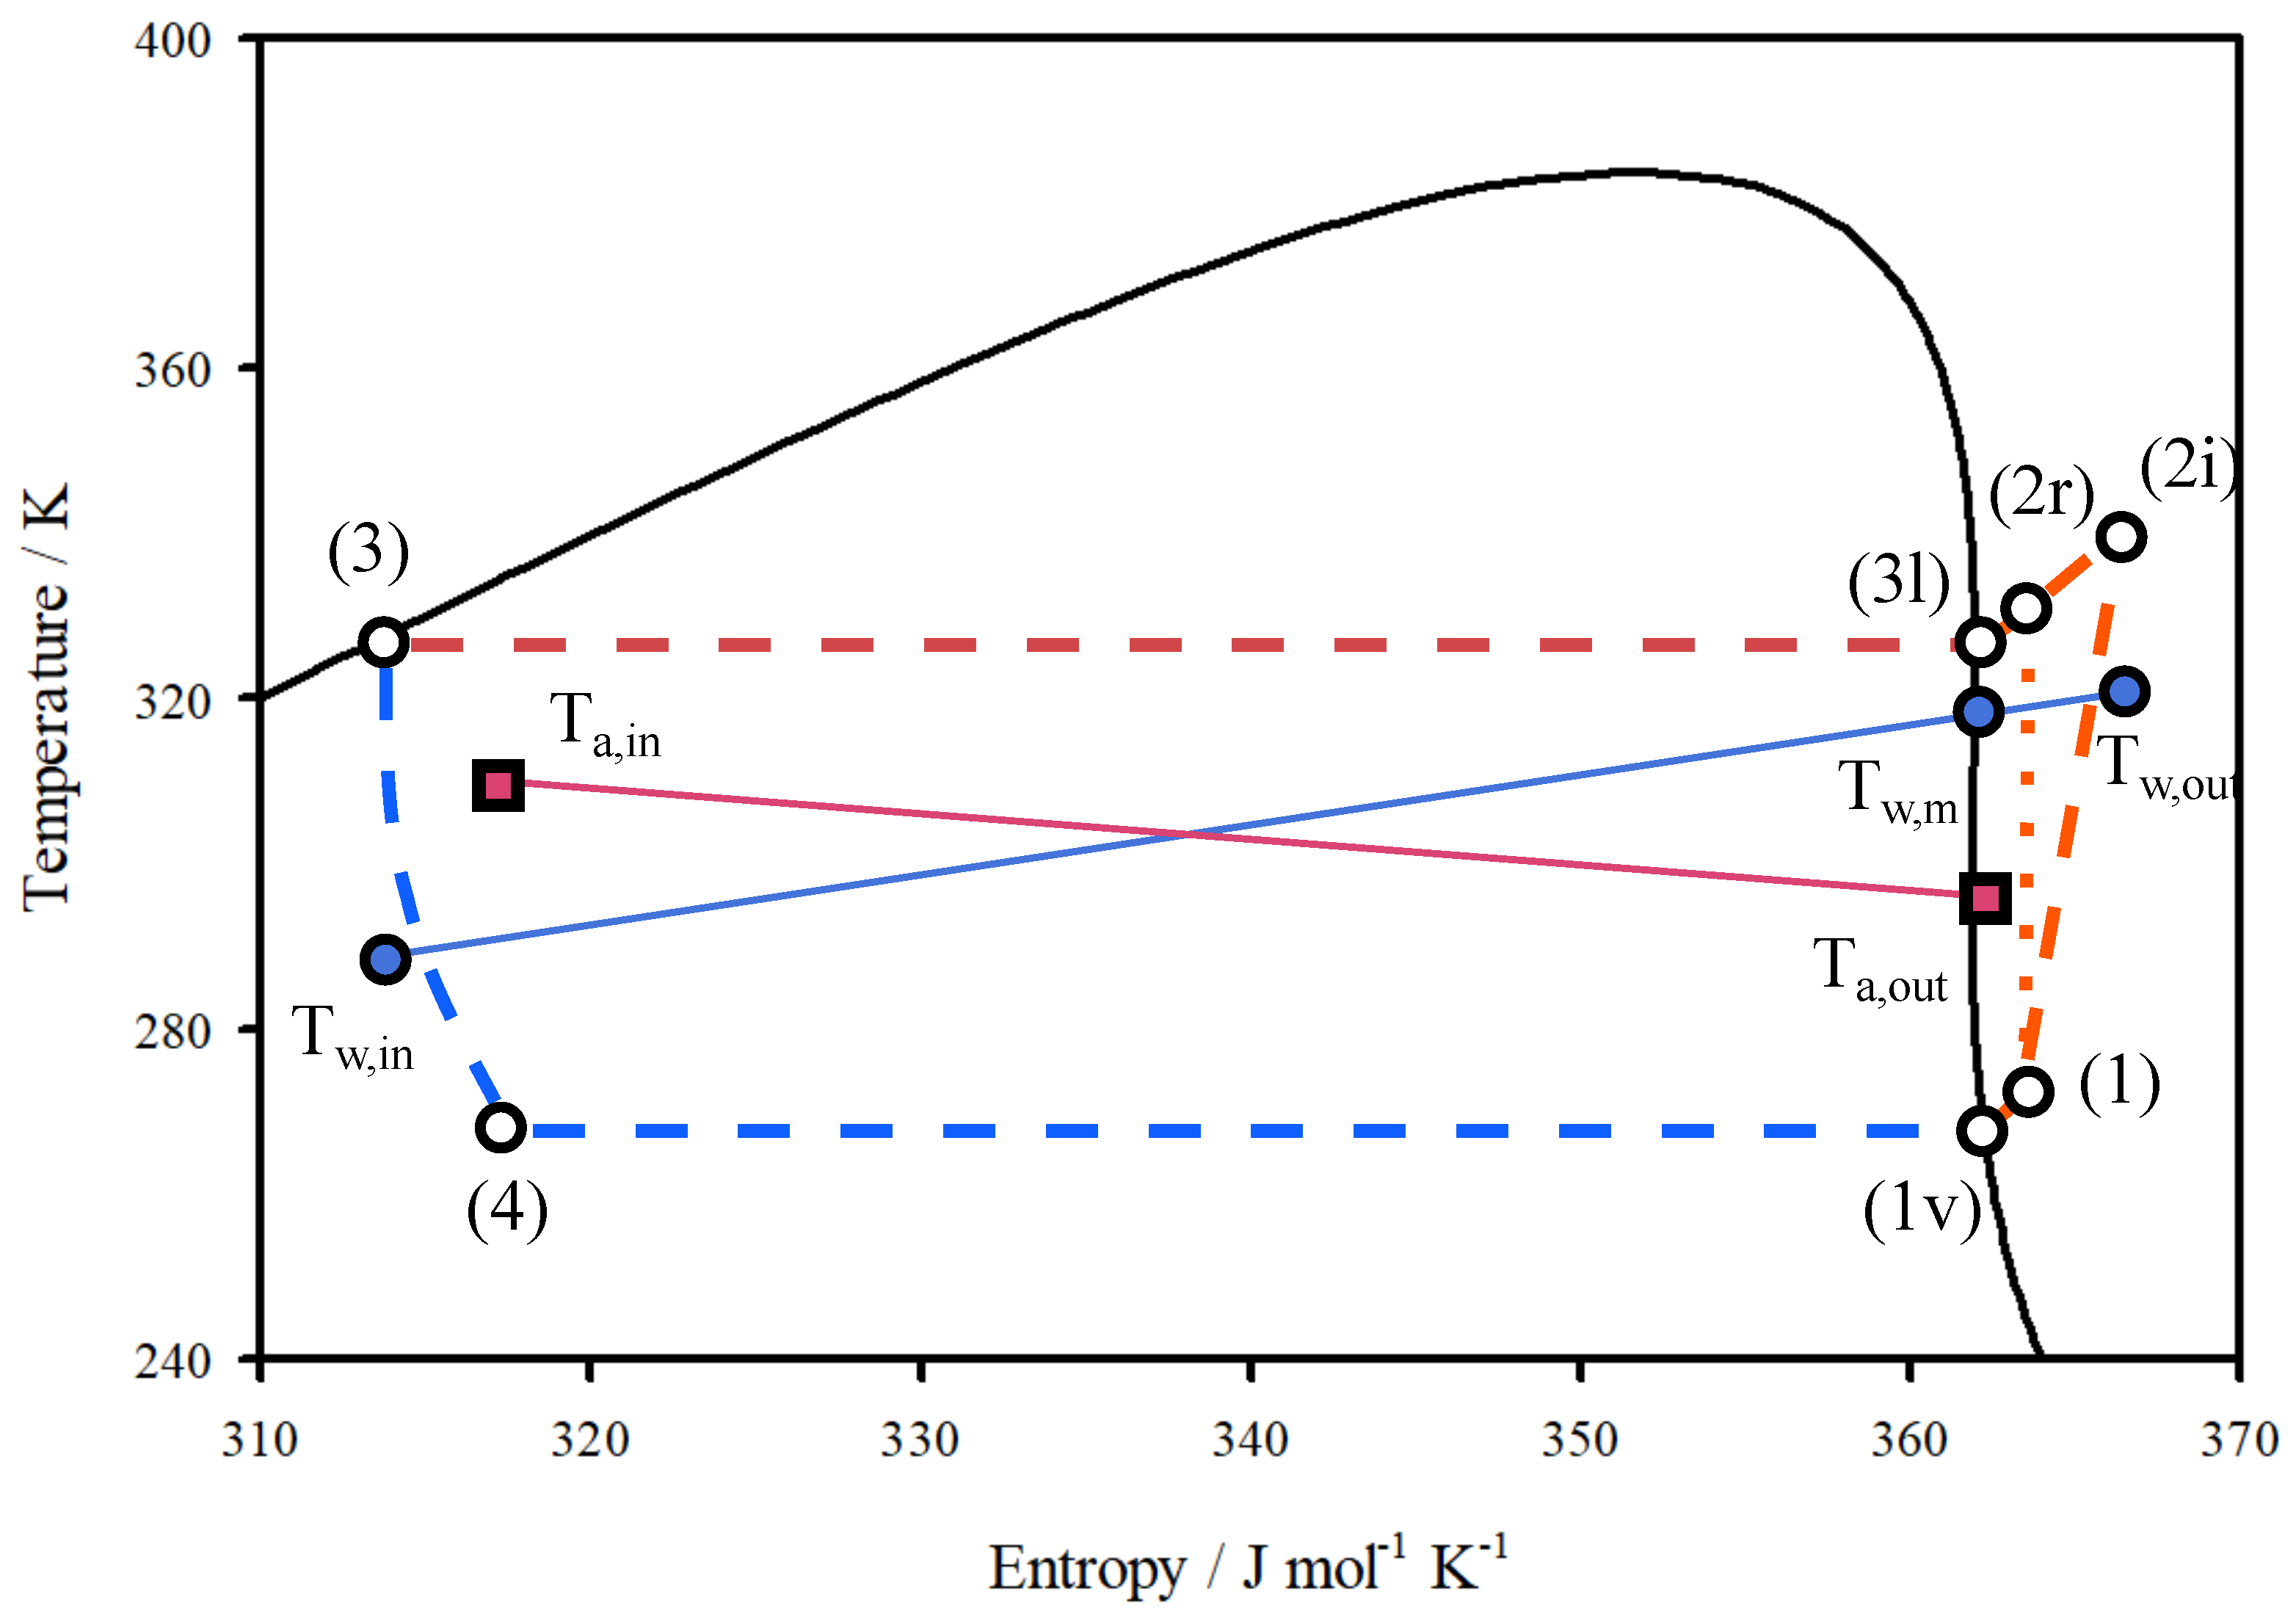
Figure 3.
Contour plots at different isentropic efficiency of the compressor (100, 80 and 60 %) for the a) compressor power, b) heat delivery, and c) the coefficient of performance, COP.
Figure 3.
Contour plots at different isentropic efficiency of the compressor (100, 80 and 60 %) for the a) compressor power, b) heat delivery, and c) the coefficient of performance, COP.
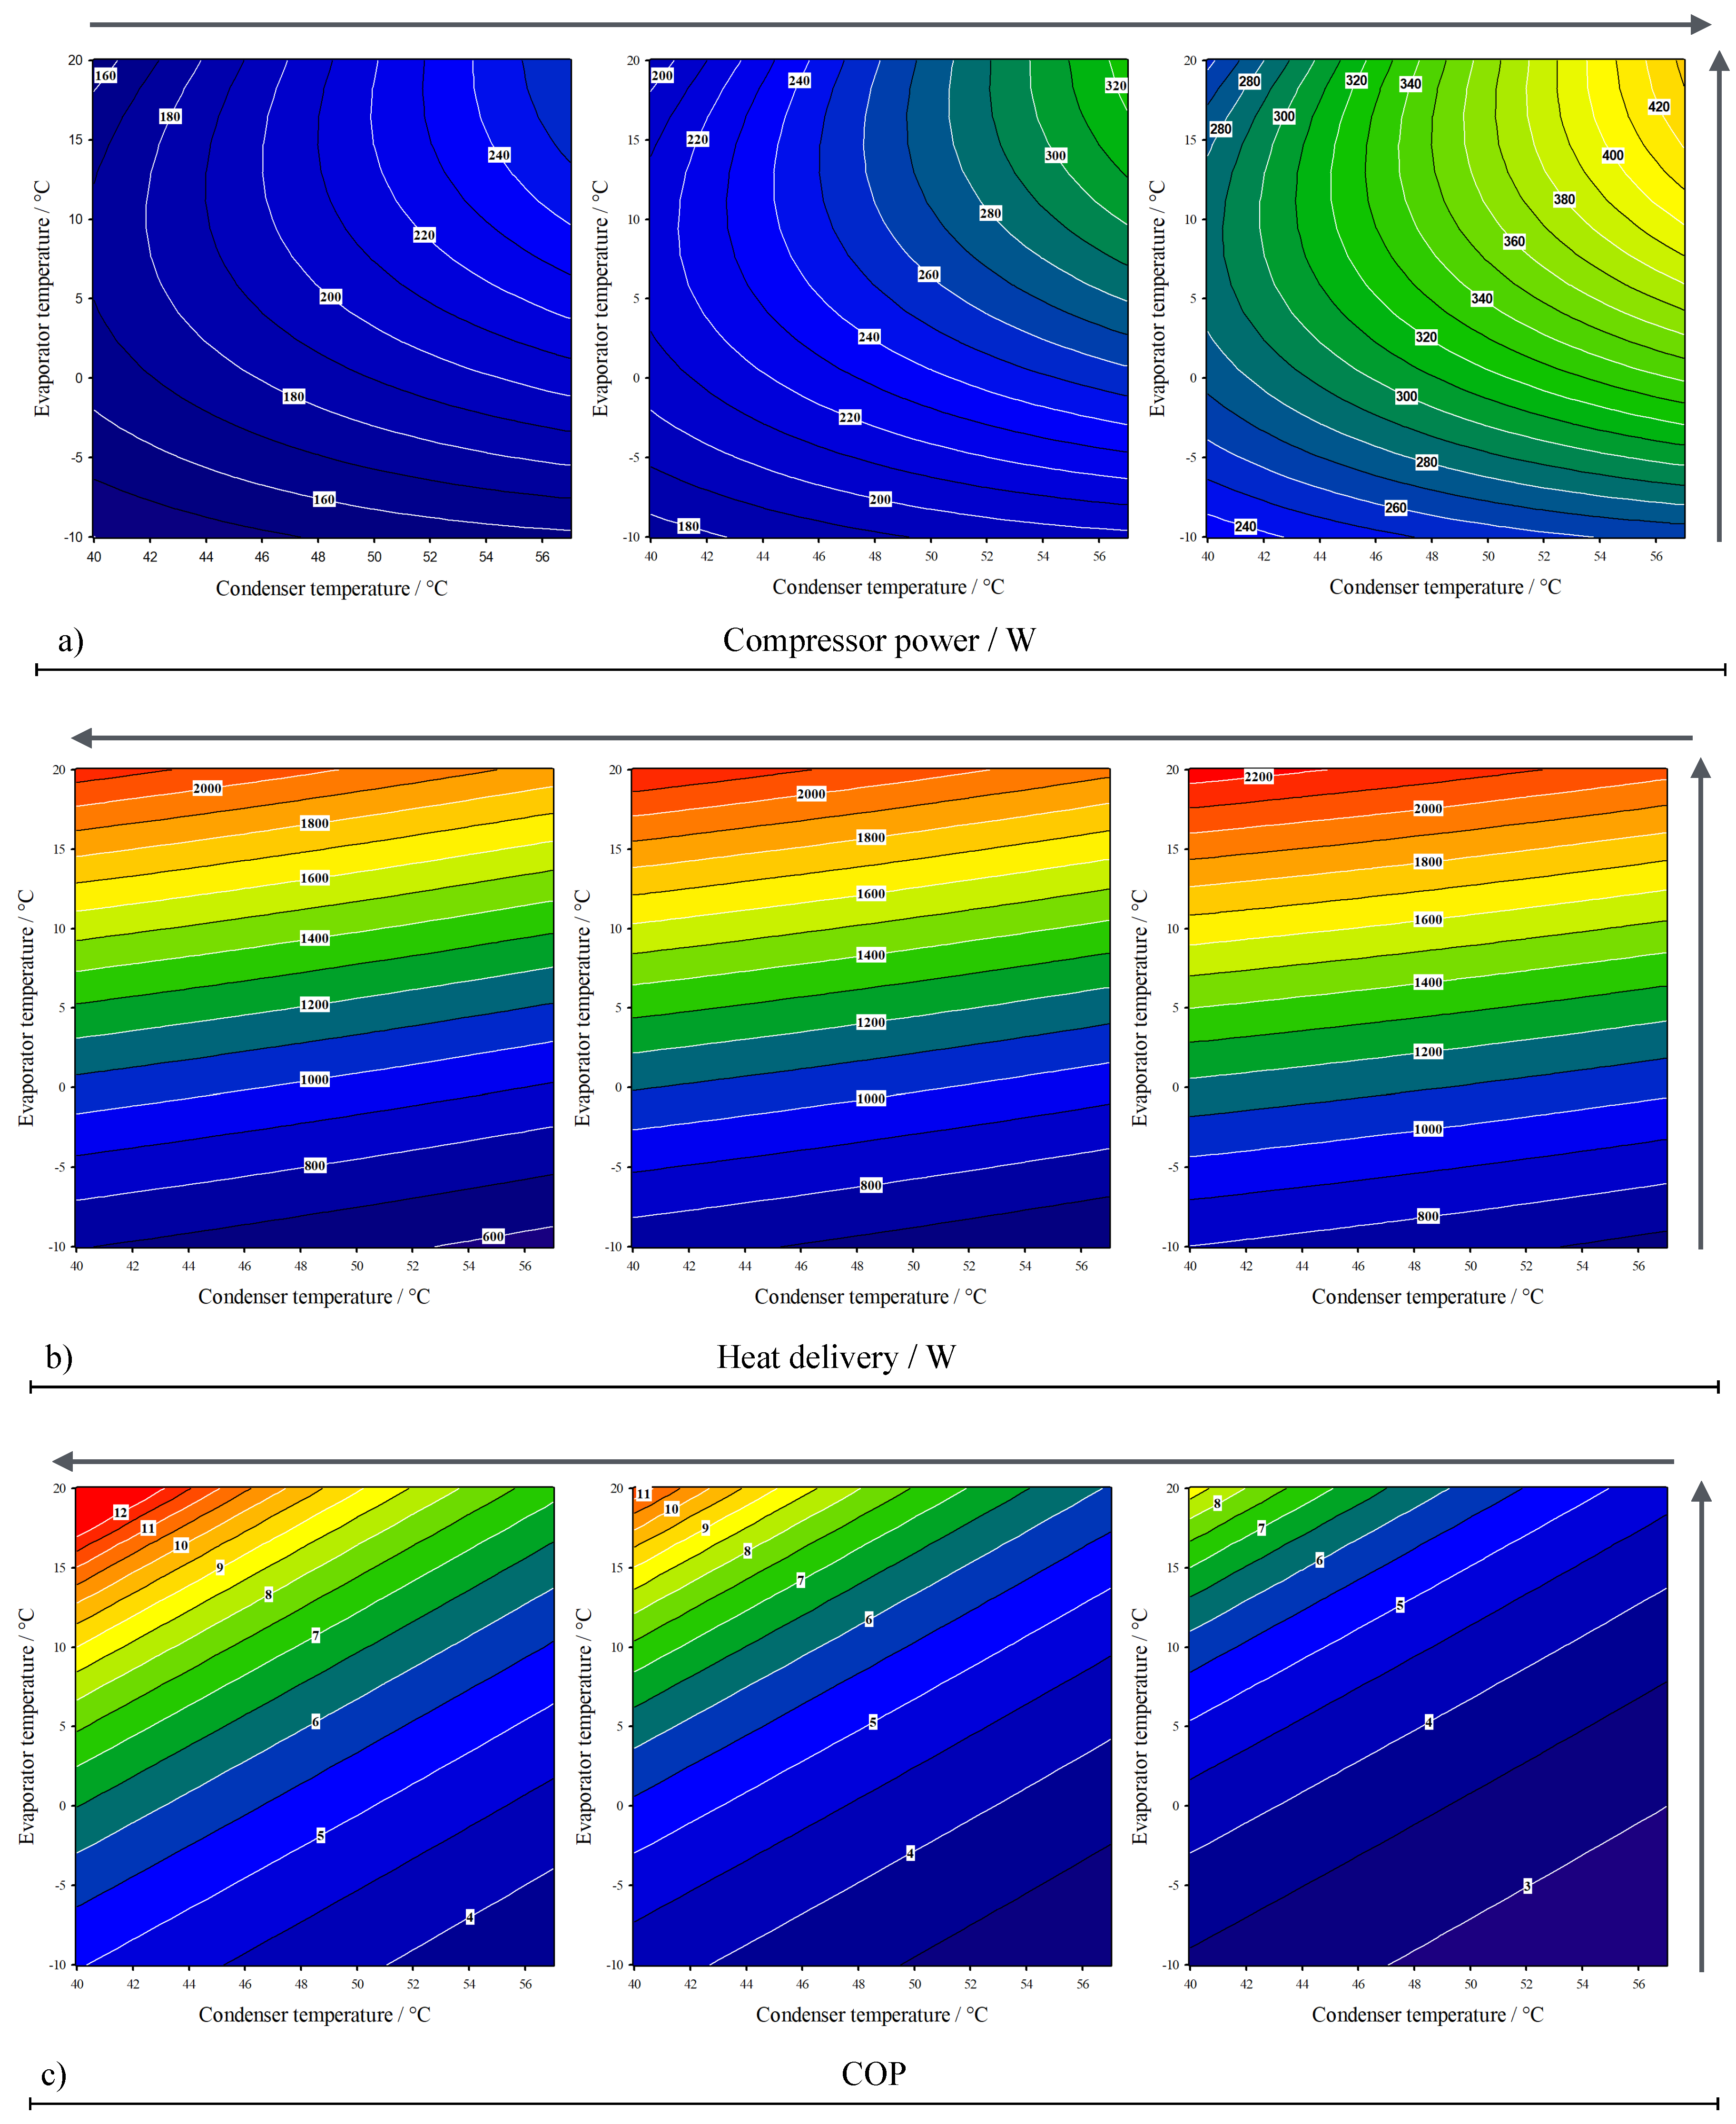
Figure 4.
Contour plots at 80 % isentropic efficiency of the compressor for a) absorbed heat, b) density at the inlet of the compressor, and c) the refrigerant mass flow in the system.
Figure 4.
Contour plots at 80 % isentropic efficiency of the compressor for a) absorbed heat, b) density at the inlet of the compressor, and c) the refrigerant mass flow in the system.
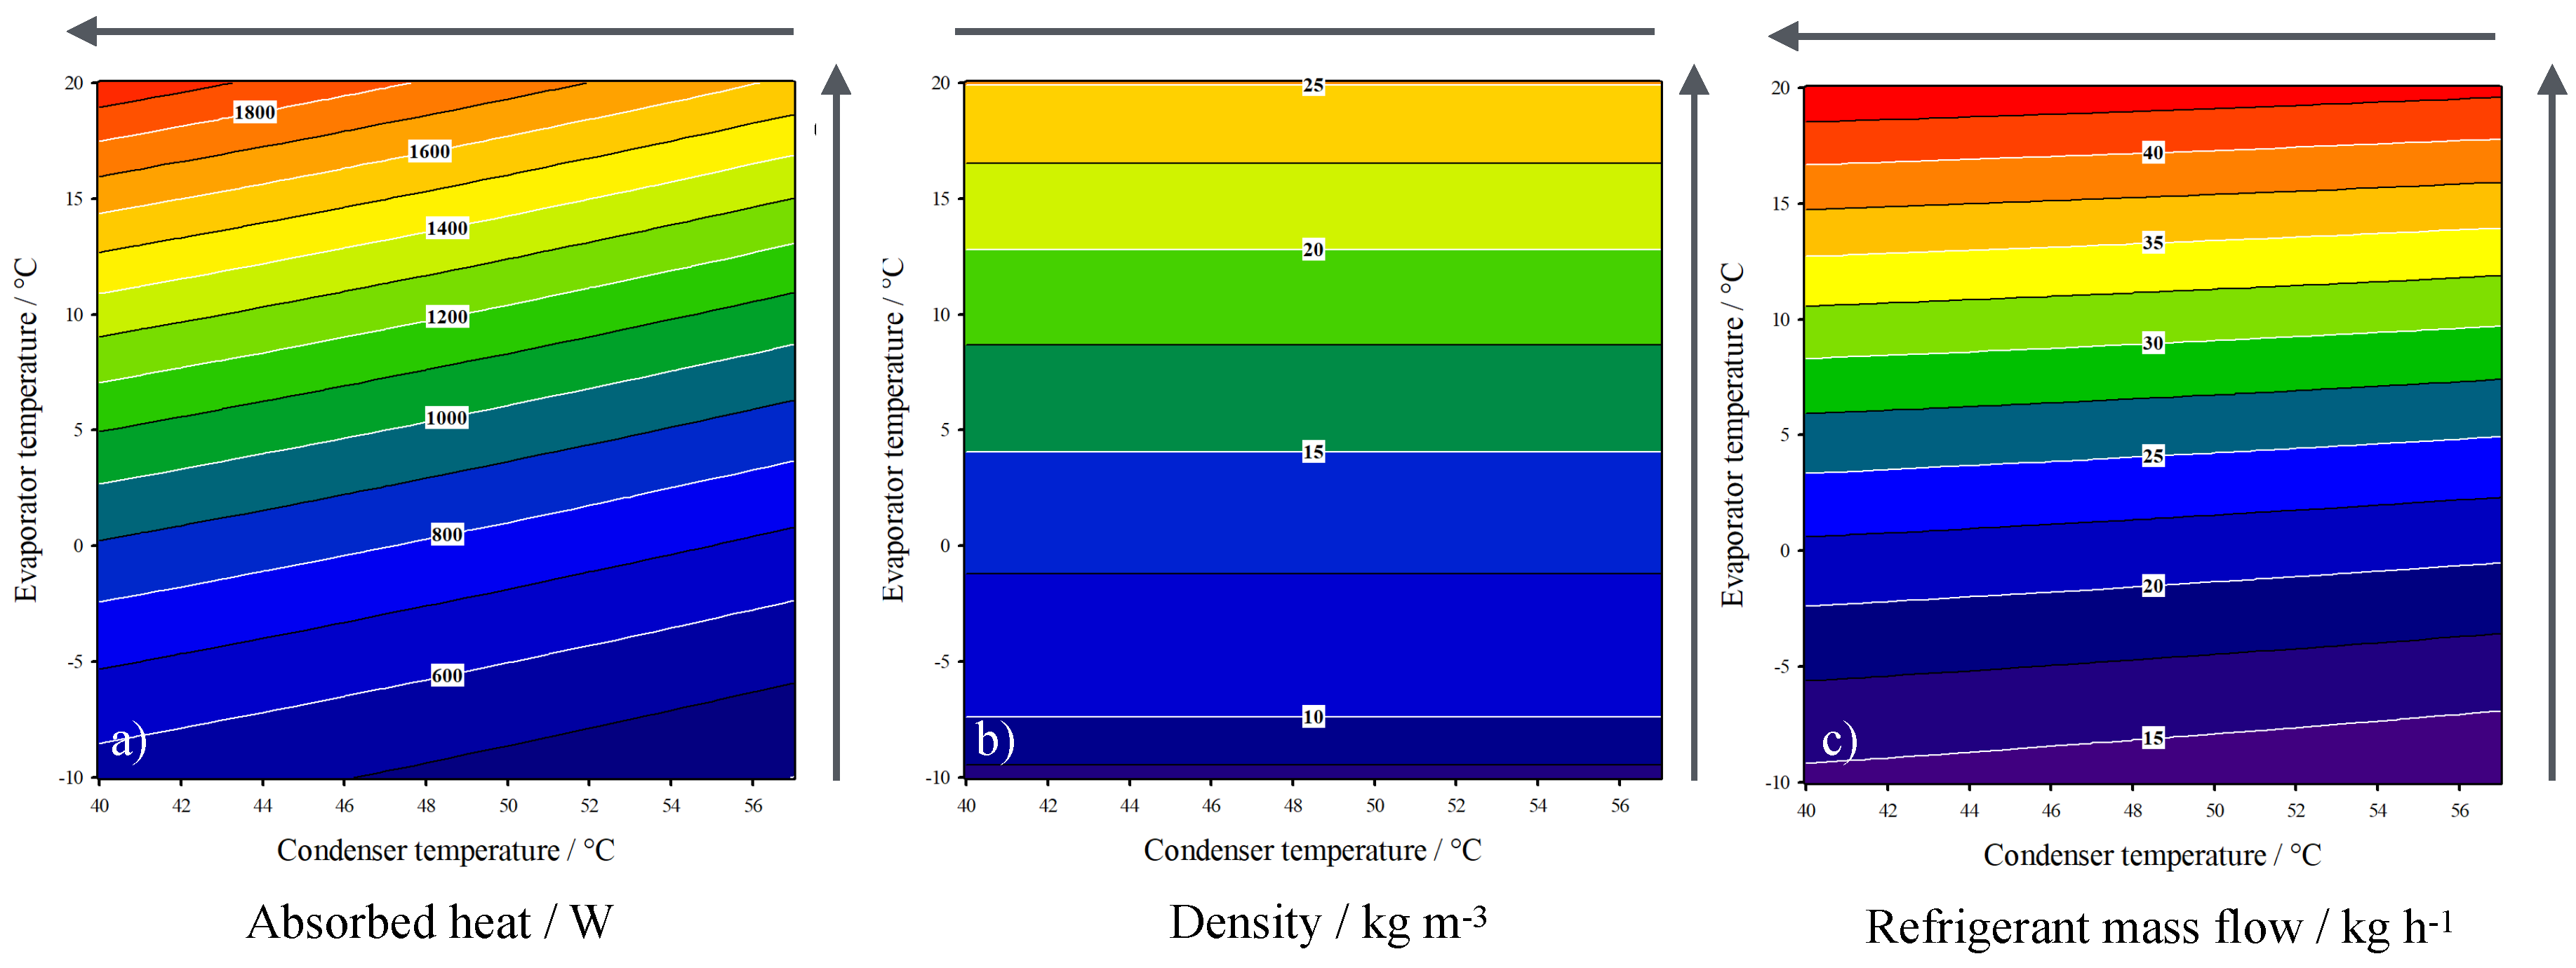
Figure 5.
Contour plots at different isentropic efficiency of the compressor (100, 80 and 60 %) for the a) compressor outlet temperature, b) water outlet temperature, and c) the heater exergetic efficiency.
Figure 5.
Contour plots at different isentropic efficiency of the compressor (100, 80 and 60 %) for the a) compressor outlet temperature, b) water outlet temperature, and c) the heater exergetic efficiency.
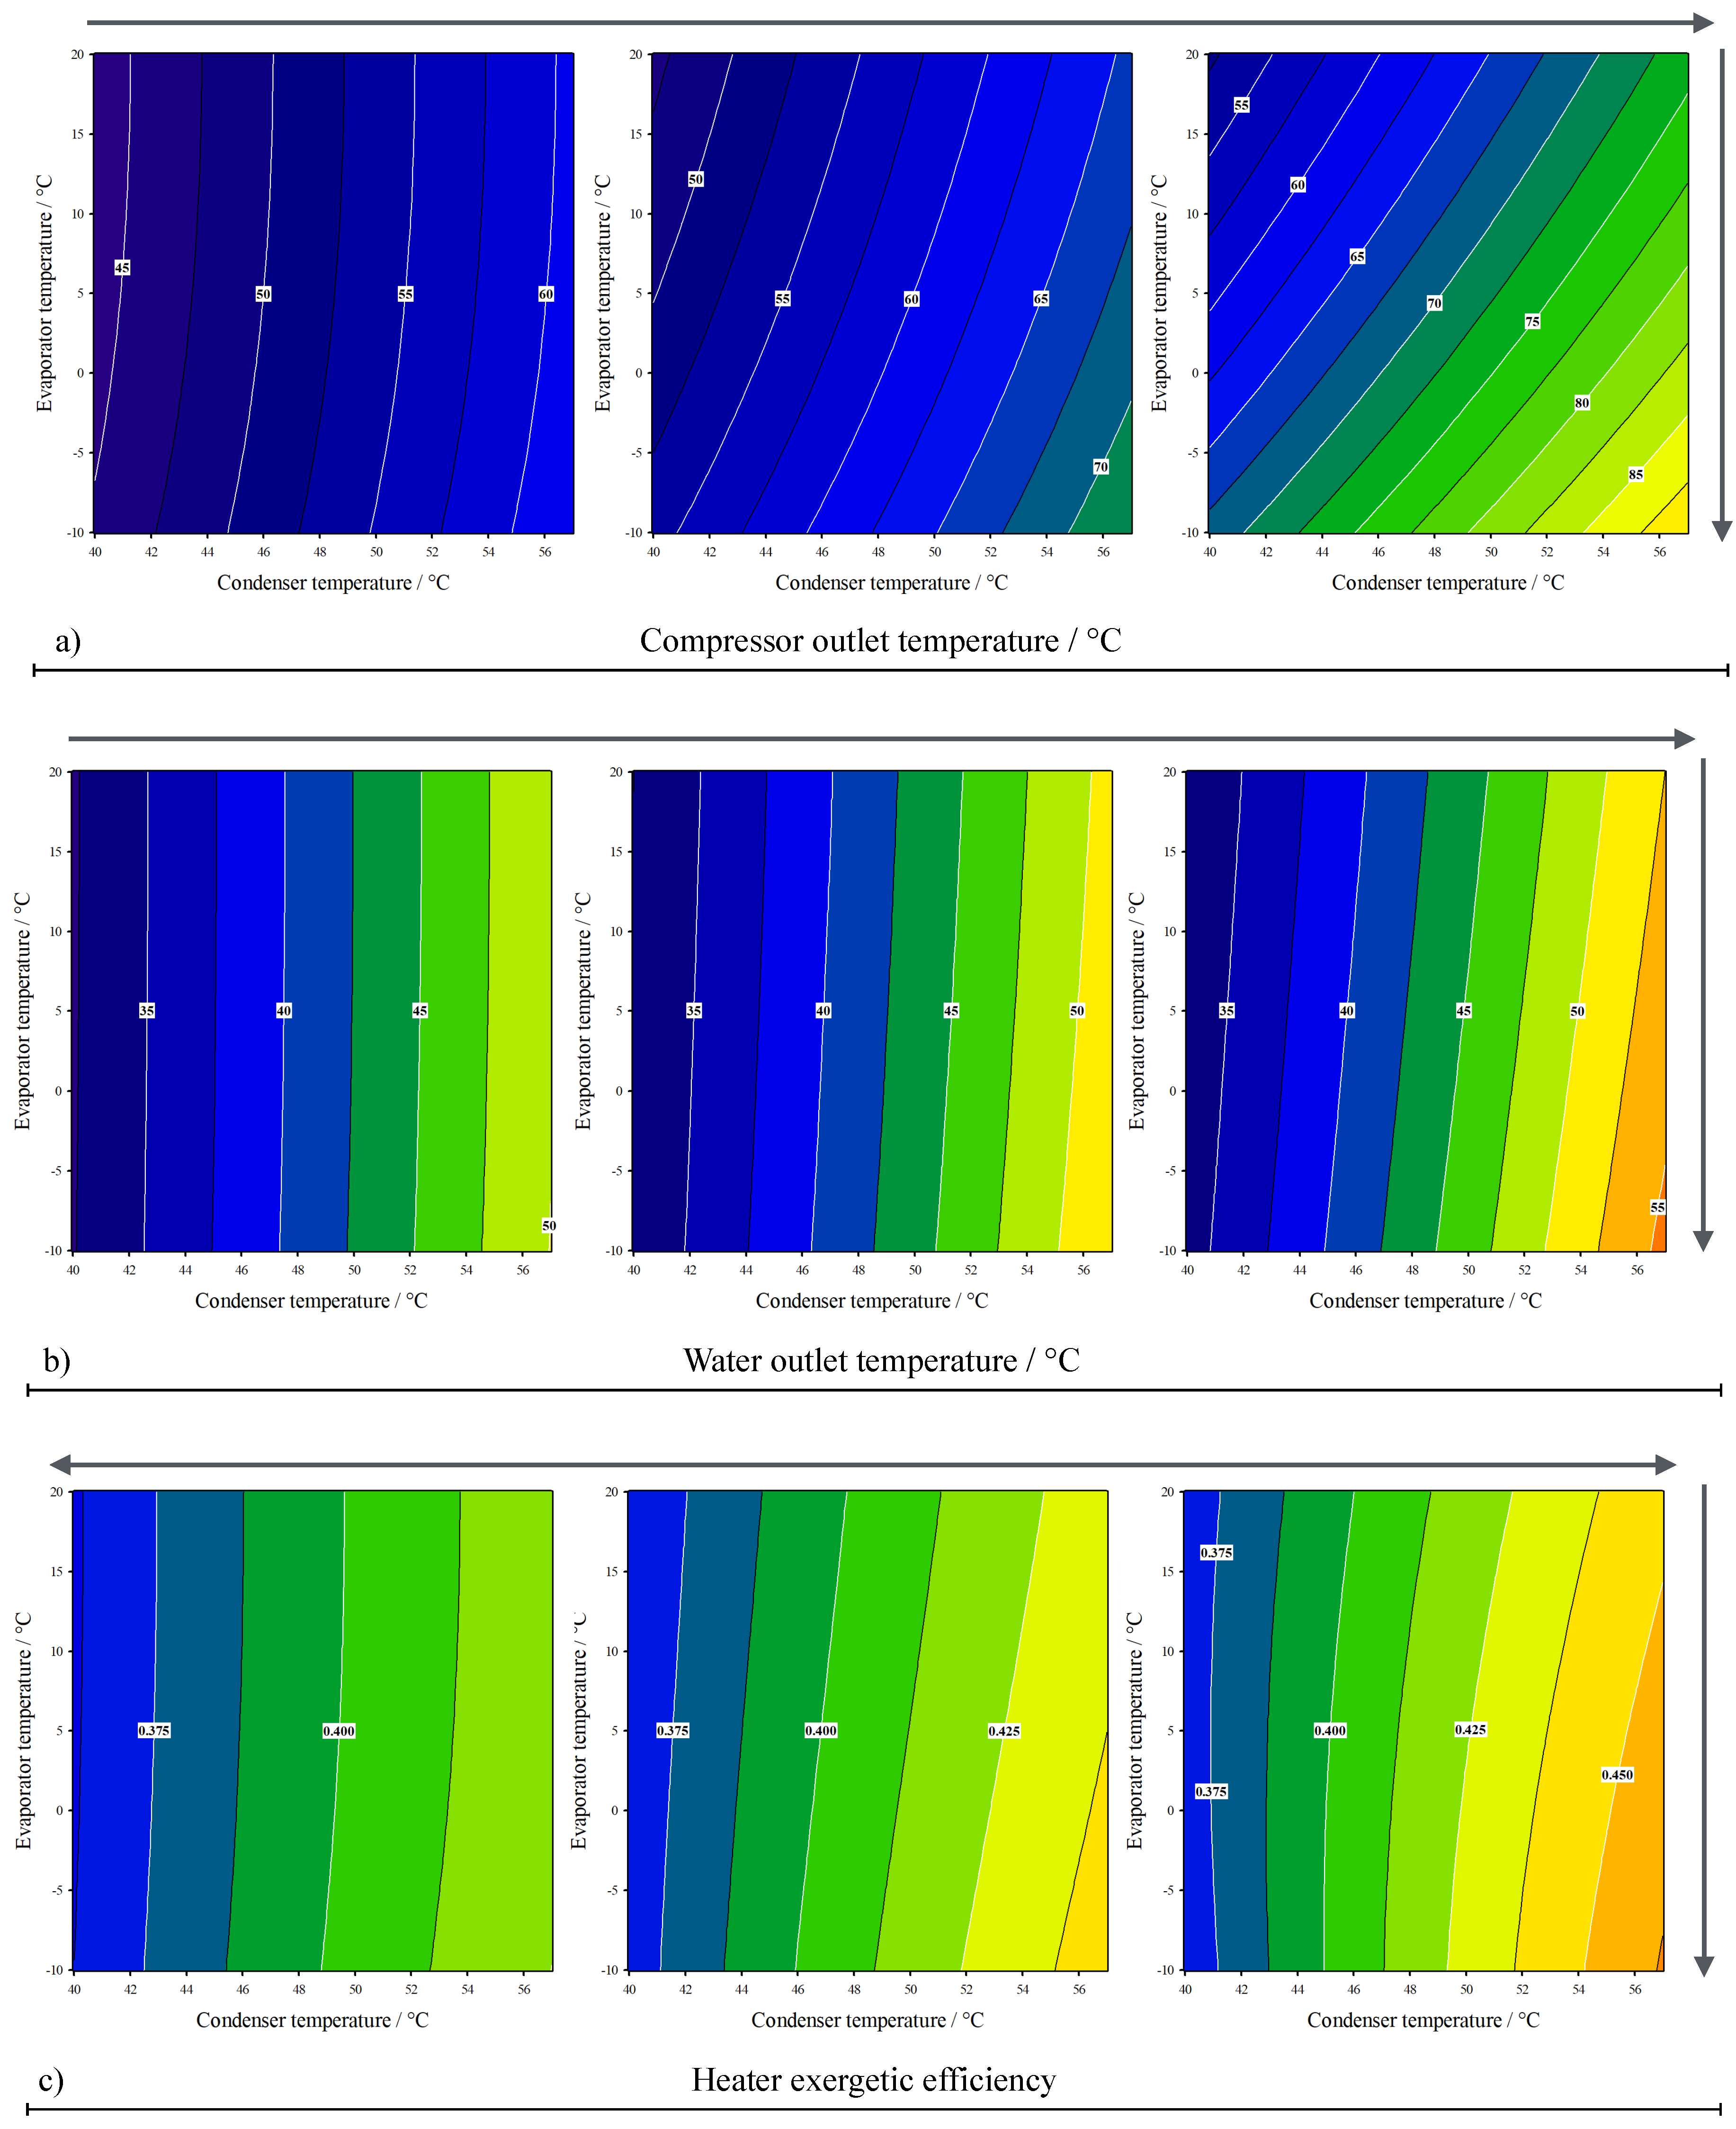
Figure 6.
Contour plots at 80 % isentropic efficiency of the compressor for a) volumetric water flow, b) volumetric airflow, and c) the cooler exergetic efficiency.
Figure 6.
Contour plots at 80 % isentropic efficiency of the compressor for a) volumetric water flow, b) volumetric airflow, and c) the cooler exergetic efficiency.
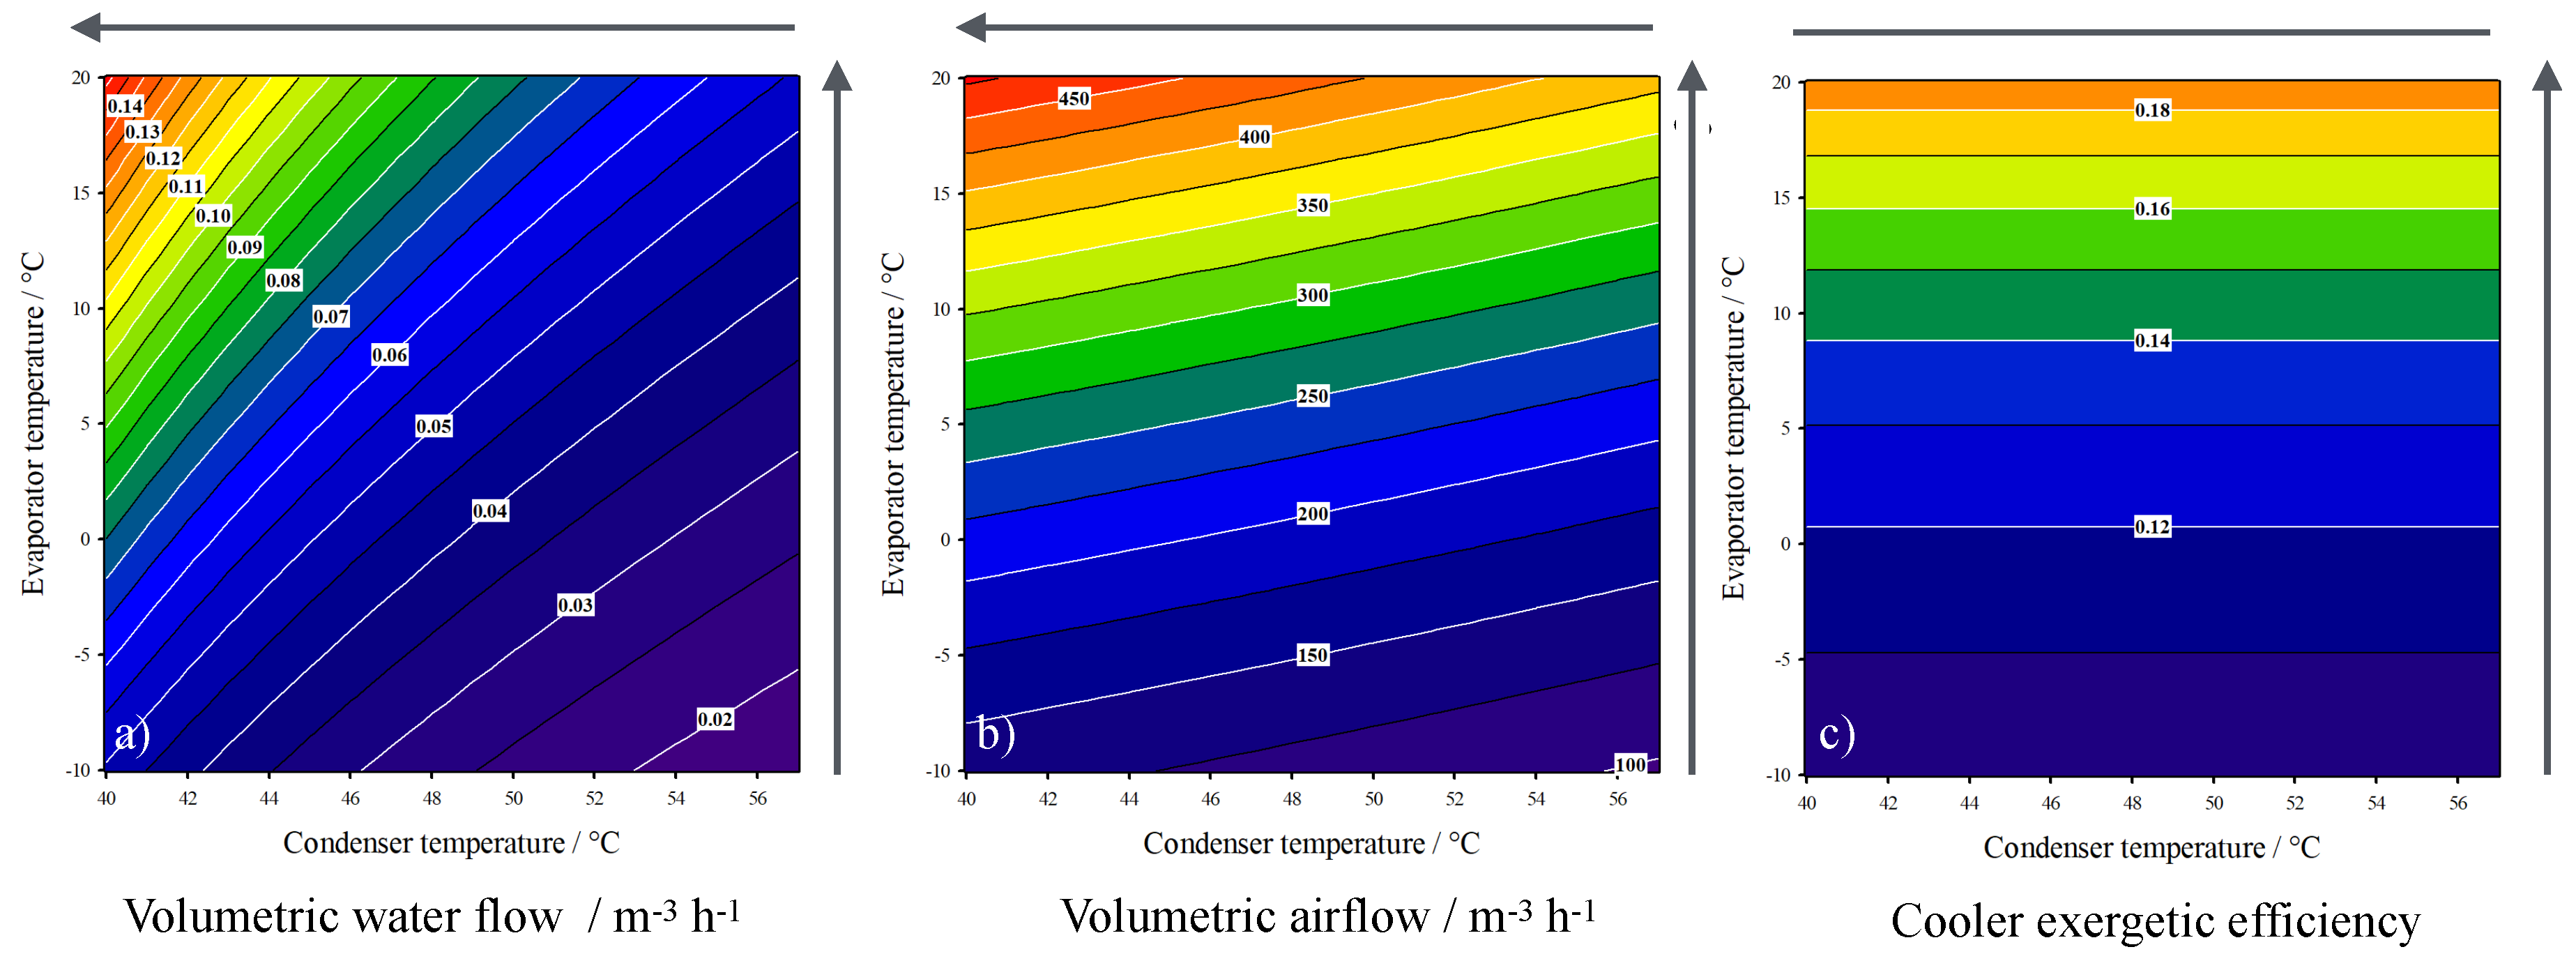
Figure 7.
Contour plots of the percentual deviation with respect to the optimal value in the range of the studied condenser and evaporator temperatures at 80 % isentropic efficiency of the compressor for the nine critical variables
Figure 7.
Contour plots of the percentual deviation with respect to the optimal value in the range of the studied condenser and evaporator temperatures at 80 % isentropic efficiency of the compressor for the nine critical variables
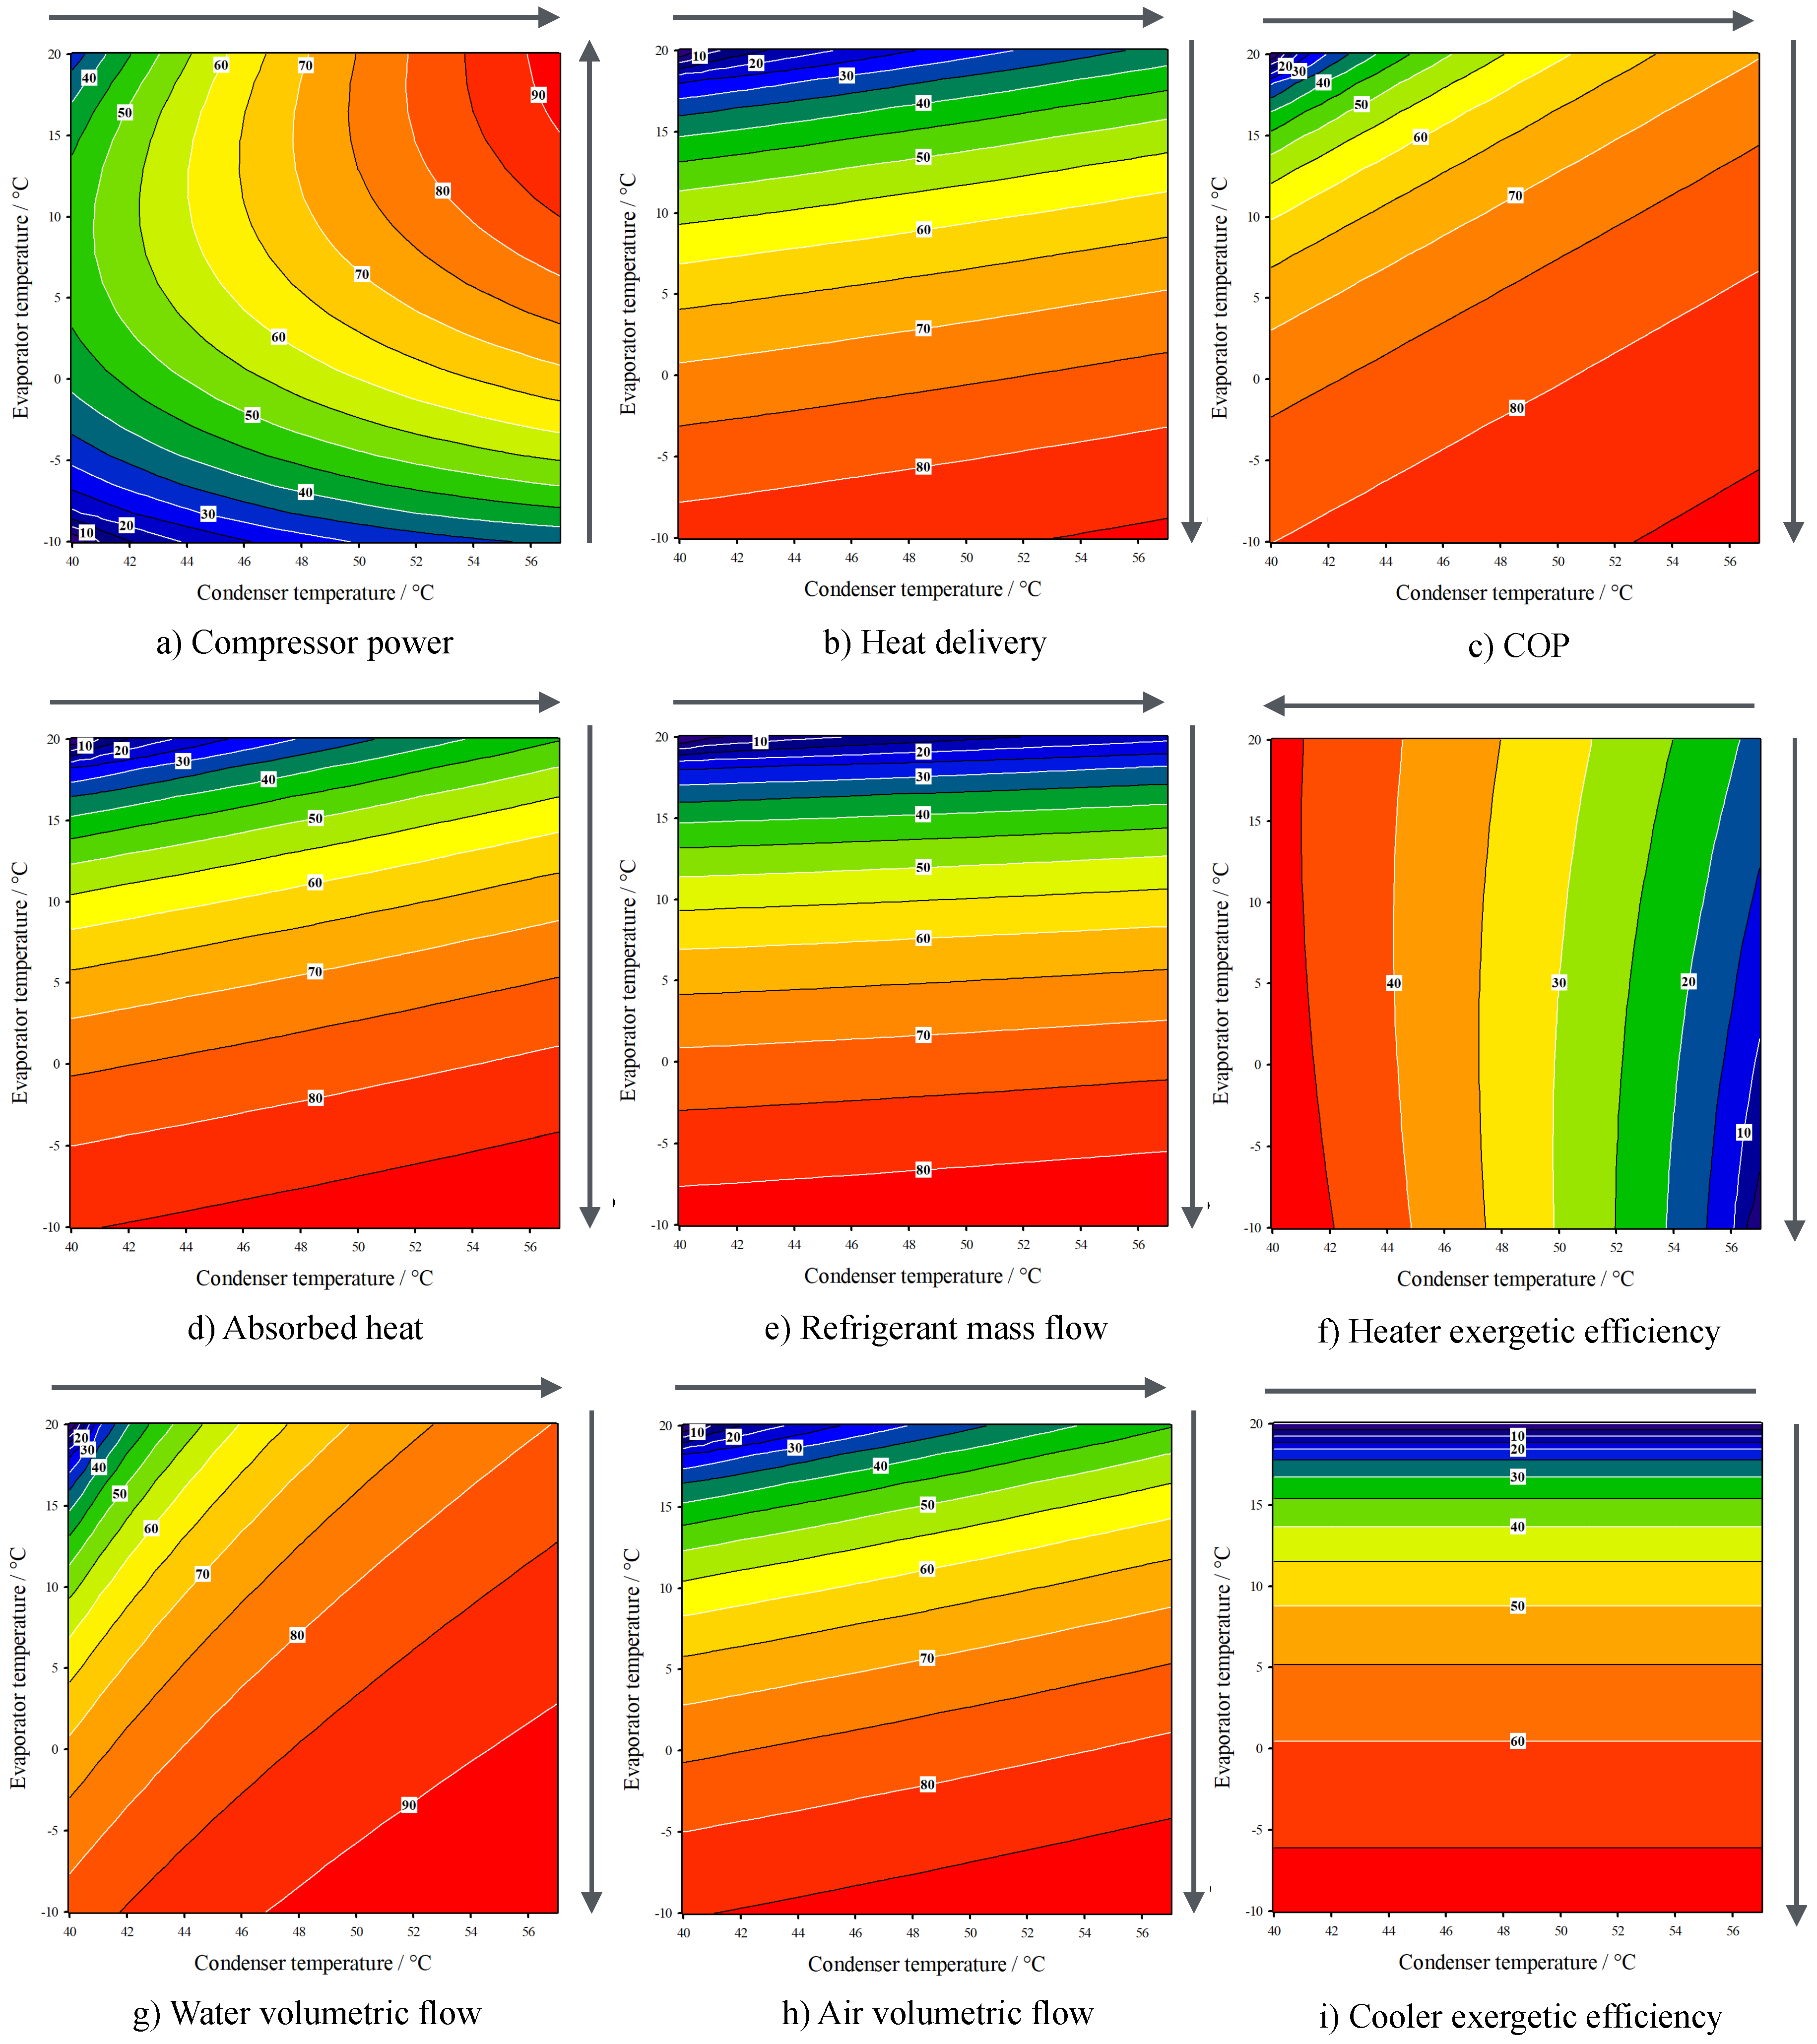
Figure 8.
Overlapping map of the global performance of the describing heat pump considering a 70 % limit for all the key variables.
Figure 8.
Overlapping map of the global performance of the describing heat pump considering a 70 % limit for all the key variables.
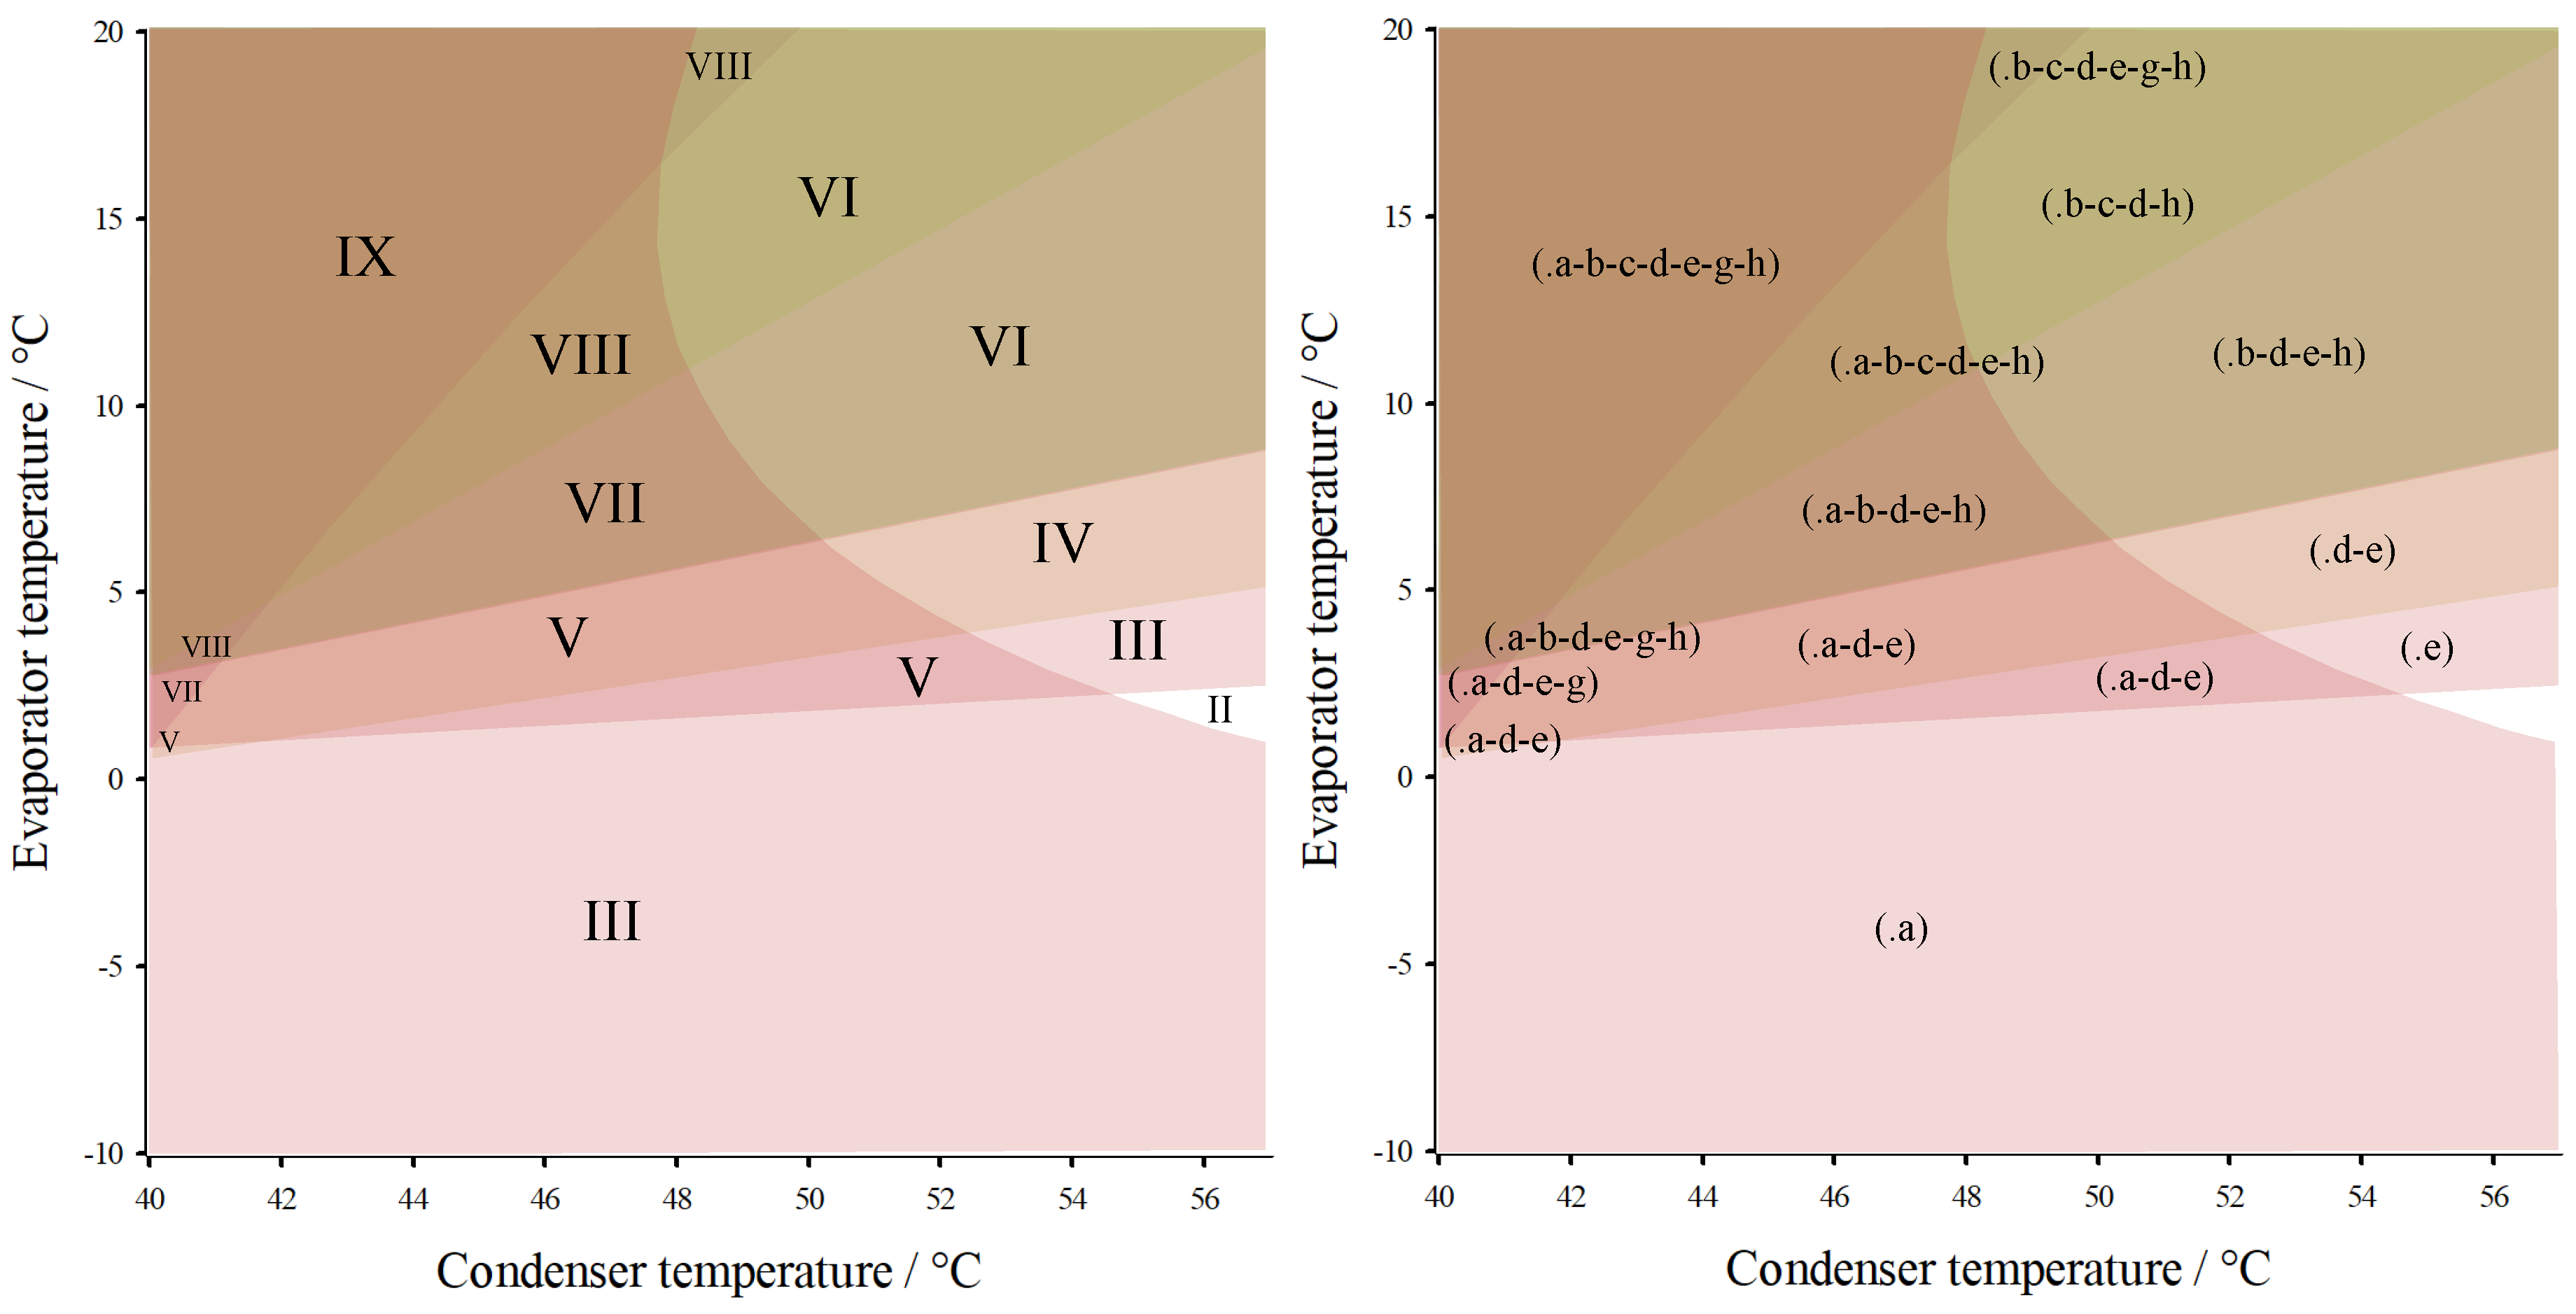

Table 1.
Input parameters and boundary conditions considered in this study.
| Value | Range | |
|---|---|---|
| HP system compressor technical conditions | ||
| Displaced volume | 10.29 cm3 | – |
| Revolutions per minute | 2900.00 rpm | 2900.00 to 3500.00 rpm |
| Pressure operation maximum | 1600.00 kPa | – |
| Temperature operation maximum | 330.15 K | – |
| Isentropic performance | – | 60 to 100 % |
| General boundary and limit conditions | ||
| Condenser temperature | – | 313.15 to 330.15 K |
| Evaporator temperature | – | 263.15 to 293.15 K |
| Initial water temperature | 293.15 K | – |
| Initial industrial building temperature | 313.15 K | – |
| Comfort industrial building temperature | 297.15 K | – |
| i | |||
|---|---|---|---|
| 1 | J kg−1 | J kg−1 K−1 | J kg−1 K−2 |
| 5.8341 | 9.6110 | 6.6642 | |
| 2 | J kg−1 K−1 | J kg−1 K−2 | J kg−1 K−3 |
| 0.4713 | 4.9931 | –2.9897 |
Table 3.
[42].
Table 3.
[42].
| R134a | m | |||
|---|---|---|---|---|
| Residual | m−10 | K | ||
| 3.2483 | 3.0157 | 170.60 | ||
| Ideal gas | ||||
| 7.4912 | 0.01707 | –6.0249 | –115348.62 |
Disclaimer/Publisher’s Note: The statements, opinions and data contained in all publications are solely those of the individual author(s) and contributor(s) and not of MDPI and/or the editor(s). MDPI and/or the editor(s) disclaim responsibility for any injury to people or property resulting from any ideas, methods, instructions or products referred to in the content. |
© 2024 by the authors. Licensee MDPI, Basel, Switzerland. This article is an open access article distributed under the terms and conditions of the Creative Commons Attribution (CC BY) license (http://creativecommons.org/licenses/by/4.0/).
Copyright: This open access article is published under a Creative Commons CC BY 4.0 license, which permit the free download, distribution, and reuse, provided that the author and preprint are cited in any reuse.


