
Submitted:
30 March 2025
Posted:
31 March 2025
You are already at the latest version
Abstract
Event data loggers are frequently used to record the date and time of tip events in tipping-bucket rain gauges. The HOBO® pendant event data logger is one such commercially-available device commonly used for this purpose. It can record the contact closure of a TBGR reed switch at a maximum timing resolution of 1 second, tied to the timing of the logger clock, which is set each time the logger is launched. These event loggers are ideal for the routine recording of rainfall. This paper addresses the issue of whether they can also be relied upon when estimating short-term intensities, for which they were not designed. New experiments show that for a series of switch closures at fixed intervals other than exact multiples of 1 s, the HOBO® logger fails to record evenly-spaced tip events. Thus, for example, with pulses at fixed 2.75 s intervals, the logger records some events as occurring at 2 s intervals, and others at 3 s intervals. This quantization error means that there can be large errors in the logged time between bucket tip events. In natural rainfall, tip events can occur at any time, and inter-tip times, from which intensity can be estimated, will generally not be an integral number of seconds. Consequently, particularly in intense rain, the logger behaviour just described can lead to erroneous estimates of the rainfall rate estimated from the duration of individual inter-tip times. Possible solutions are discussed.
Keywords:
tipping bucket rain gauge
; quantization error
; rainfall intensity
; inter-tip time
; event data logger
1. Introduction
Tipping bucket rain gauges (TBRGs)
are probably the most widely-deployed type of rain gauge globally (Molini et
al. 2005
[1]
, Muñoz et
al. 2016
[2]
). They
provide a simple and direct physical measurement of the volume of water
collected by a funnel that is made to a standard, nominated diameter (often 203
mm, or approximately 8 inches). The gauge data consist of Gregorian date- and
time-stamped records of time of arrival of quantities of rain represented by
fixed bucket volumes (typically about 6.5 mL, the equivalent of 0.2 mm depth
over the area of the collecting funnel). These are sometimes aggregated to 5
minute or other integration times before being logged. Because the measurement
is direct and has a clear physical basis, TBRGs are considered to provide the
best 'ground truth' point-based rainfall data against which less direct
rainfall recording methods can be calibrated. These indirect methods include
for instance the monitoring of the degree of attenuation of ground-based or
satellite telecommunications signals that result from the occurrence of rain
falling across the signal path (Kim and Kwon 2018
[3]
).
As a result of their widespread
deployment by national weather agencies and in general climatological and
hydrological research, the performance of TBRGs has been extensively studied
(Fankhauser 1998
[4]
,
Overgaard et al. 1998
[5]
, Habib et al. 2001
[6]
, La Barbera et al. 2002
[7]
, Ciach 2003
[8]
,
Hodgkinson et al. 2004
[9]
, Santana et al. 2018
[10]
, Kochendorfer et al. 2017
[11]
, Segovia-Cardozo et al. 2021
[12]
, 2023
[13]
). In
particular, Zhou et al. (2019)
[14]
evaluated the performance of a HOBO® tipping bucket rain gauge
equipped with an event logger.
Their analysis however
was primarily on the accuracy of hourly rainfall amounts and the influence of
wind and rainfall intensity on the accuracy of rainfall data. The event logger
tested in the current work is of the same kind as used by Zhou et al. (2019)
[14]
, which log the time of each
individual bucket tip. Some TBRGs log only the number of tips per clock minute.
The evaluations of TBRG performance have established that there are multiple
issues relating to site selection, including exposure to wind that can cause
undesirable turbulence around the collecting orifice of a rain gauge, and in
the correct measurement and recording of oblique, wind-driven rain.
Intermittency during rain is difficult to record with TBRGs, because a bucket
may remain only partly filled when rain ends, or be partially full when rain
begins, such that the timing of rain onset and ending cannot reliably be
judged. Various systematic errors also arise from the TBRG mechanism itself.
Under-recording of rainfall amounts is a well-documented error source. This
arises because inflow from the collecting funnel to a tipping-bucket during its
tipping (with a duration of ~ 0.5 s, Duchon et al. 2014
[15]
, Liao et al. 2020
[16]
) is unmeasured, and the
associated error becomes worse at higher intensities. TBRGs also tend to
over-record at low intensities, when the buckets appear to tip before they have
filled with their calibrated water volume. This may be due to ripple effects in
the water pooled inside the bucket, which cause premature over-balancing. In
order to reduce these systematic errors, many TBRGs are equipped with a small
syphon, designed to ensure a less variable rate of inflow to the bucket
mechanism across a wide range of rainfall intensities. The steadier inflow
makes calibration more straightforward. Many TBRGs available commercially claim
that measurement inaccuracies amount to less than a few percent, at least
within a restricted range of intensities. However, these specifications refer
only to the TBRG mechanism itself (ignoring external sources of error such as
wind or inappropriate site selection) and frequently require that careful
annual re-calibration be undertaken. Furthermore, they relate to the
measurement of rainfall amount (depth) over some (generally unspecified)
integration time such as 1 h, and not to the assessment of short-term rainfall
intensities.
Short-term rainfall intensities,
for example over periods of minutes, are important in many fields. Areas of
importance include urban flash-flood generation, and soil erosion processes and
agrochemical wash-off. An important contemporary area of relevance is in the
detection of intensification of rainfall connected with ongoing climatic
variability and change. There is evidence that short-term intensities over
periods of minutes are increasing more rapidly than over longer durations such
as hourly rates. Secular change in annual maximum 5-minute rainfalls in
Australia, as an example, was investigated by Bates et al. (2015)
[17]
.
Whilst short-term intensities are
important, the various sources of measurement error mean that TBRGs are not
ideal intensity recording devices. It is often considered that the time between
successive tip events (the inter-tip time, or ITT) can be used as a measure of
short-term intensity. Individual ITTs have been used to derived estimates of
moment-to-moment rainfall intensities in multiple studies including Wang et al.
(2008)
[18]
and Song
et al. (2017)
[19]
.
Additional studies were cited by Dunkerley (2024). The ITTs involved in
estimating intensity in this way warrant careful consideration. For a standard
collecting funnel of 203 mm (approx. 8 inches) diameter (area = 323.65 cm2),
1 mm of rain yields a water volume of 32.365 mL. The capacity of a tipping
bucket designed to have a volume equivalent to 0.2 mm of rainfall would
therefore need to be 20% of this, or ~ 6.47 mL. Further, during 1 hour, the
rain volume collected by such a gauge at a rainfall intensity of 50 mm h-1
would be (50 x 32.365) mL, or 1618.25 mL. Then, with a bucket capacity of 6.47
mL there would be ~ 250 tip events per h, and therefore a mean ITT of 14.4 s.
This would be reduced to a mean ITT of 7.2 s at 100 mm h-1, and to
3.6 s at 200 mm h-1. Higher intensities (perhaps lasting only
minutes, during intensity bursts) would result in even briefer ITTs, including
2.0 s at 350 mm h-1. Gorman (2003)
[20]
evaluated the suitability of TBRGs for deployment by the Australian
Bureau of Meteorology. Test were run to a maximum intensity of 500 mm h-1,
for which the ITT would be ~ 1.4 s.
Syphons (if fitted to a TBRG),
whilst being advantageous for the measurement of cumulative rain depth, perturb
short-interval intensity data because there is a delay while the syphon is
filling (just as there is during the filling of a tipping-bucket) during which
no rain is detected, and because syphons typically empty at a fast rate
equivalent to a rainfall rate of about 260 mm h-1
[21]
. This results in more rapid
tipping of the bucket mechanism than would be expected in light of the actual
open-field rainfall intensity. In operation, the syphon chamber accumulates
water until the syphon draining level is reached, at which point it discharges
very rapidly into the tipping buckets. Only the mean ITT over a period of
perhaps 15 minutes can then be taken to reflect the mean rainfall rate because
of the syphon-induced alternation of long ITTs (syphon filling) and short ITTs
(syphon emptying). This means that intensity cannot be estimated from
individual ITTs, if the TBRG is syphon-equipped. 'Straight-through' gauges are
to be preferred for the estimation of short-term intensities. Further analysis
of these issues was presented by Dunkerley (2024)
[21]
Dunkerley (2024)
[22]
.
These relationship between
intensity and ITT can be summarised in the relation ITT = 720 / RR, where ITT
is in seconds and intensity (actually rainfall rate) RR is in mm h-1.
ITTs can be very long, as well as brief. For instance, at 5 mm h-1,
the ITT would be almost 2.5 minutes, and would exceed 12 minutes at 1 mm h-1.
Thus, during natural rainfall of fluctuating intensity, we can expect ITTs to
range from perhaps a few seconds to more than several minutes, and extending to
tens of minutes in very light rain. For the accurate estimation of short-term
rainfall intensity, measurements of tip times with resolutions of seconds are
clearly required.
1.1. Capacity of Event Data Loggers to Record Brief ITTs
If we consider how an event data
logger with the specifications of the HOBO® event logger might record a series
of short ITTs during intense rainfall, we encounter some difficulties which are
explored next. The operation of such a logger involves recording the time of
occurrence of each tip with a resolution of 1 second. Commonly, a magnet
attached to the bucket tilting mechanism is used to close a reed switch mounted
at a central position. The tip time that is logged corresponds with the closure
of the reed switch when the buckets pass through the horizontal position,
during the tipping event. This moment comes a few hundred ms after the full
bucket begins to tip, but before it reaches the new inclined rest position and
drains, and corresponds roughly to the mid-point of the 0.5 s tipping time.
If tip events occurred exactly at
intervals that were a precise, integral number of seconds (2 s, 5 s or 10 s
apart, and so on) then the event logger would be capable of faithfully
recording the clock second in which each tip event occurred. However, if the
tip events are not an integral number of seconds apart, then the time of
occurrence of successive tip events shifts with respect to the boundaries of
the clock-seconds which are the basis of the event logging process. This
quantization error is illustrated in
Figure
1
. Of course, natural rainfall would be expected to
exhibit primarily non-integral ITTs, with the individual ITTs changing from
moment to moment, as the intensity fluctuated, and
Figure 1
is simply an attempt
to illustrate the challenges of timing short-duration ITTs.
Figure 1
(A) shows a hypothetical timeline with 8 logger clock-seconds
marked above the horizontal time line. Reed switch closures at fixed intervals
of 1.5 s are marked by arrows below the time line. The first ITT includes
seconds 1 and 2, with a resulting duration of 1 s (too short). The second ITT
spans seconds 2 to 4, with a resulting duration of 2 s (too long) and this
pattern then repeats.
Figure 1
(B) is the same, but for reed switch closures every 3.5 s. Here the
first ITT spans seconds 1 to 4, with a resulting duration of 3 s (too short)
and the second ITT spans seconds 4 to 8, resulting in a duration of 4 s (too
long). This sequence would also repeat.
Figure
1
thus illustrates how non-integral periods between
bucket tip events (reed switch closures), when recorded with an event logger
that only has 1 s resolution, result in apparent ITTs that are either too brief
or too long. In the case of
Figure 1
(B), the erroneously short ITT of 3 s over-estimates the intensity
by about 14%, and the erroneously long ITT of 4 s under-estimates the intensity
by the same amount. The apparent (erroneous) spread of ITTs thus leaves an
uncertainty of almost 30% in the intensity judged from a sequence of ITTs. In
the case of
Figure 1
(A), the error is larger, at about 33%, and hence the aggregate
uncertainty in intensity estimates from a sequence of ITTs is very large, at
about 66%.
It should be noted that in
addition to a 1 second quantization, HOBO® event loggers have a 0.5 s lockout
period, designed to eliminate recording of the contact-bounce that commonly
arises in mechanical switches, including reed switches, as spurious tip events.
Reed switches are described in basic electronics texts (e.g. Sinclair 2001).
There can be multiple contact 'bounce' closures over several ms, and that
bounce may continue for 100 ms or longer, if the magnetic field designed to
trigger reed switch contact closure is weak. Given that the lock-out period is
shorter than the 1 s resolution of the event logger, it does not affect the
ability of the logger to record correctly the timing of tip events more than 1
s apart. However, the problem of non-integral ITTs remains. The consequences of
non-integral ITTs was explored in a series of lab experiments, described next.
These were intended to collect data akin to the hypothetical examples in
Figure 1
, but by direct
measurement using an event data logger fed with precisely-timed switch closure
signals. Owing to the 0.5 s lockout period, event loggers with 1 s resolution
cannot record events more closely spaced than 0.5 s.
In light of the foregoing brief
account of TBRGs and of the use of ITTs to estimate short-term rainfall
intensities, the objective of the work reported here was to explore the extent
to which an event data logger can satisfactorily log the bucket tip events of a
TBRG, especially during intense rainfall when the ITTs can be only seconds in
duration. This was done through the use of accurately-timed switch closures at
integral and non-integral intervals that were fed to the event data logger.
Methods are outlined in detail next.
2. Materials and Methods
Controlled laboratory bench tests
were devised to address the objective just set out. In-house code was prepared
for an Arduino R4 Minima microcontroller (clock speed 48 MHz), to generate a
succession of brief signal pulses at known intervals of time. The signal pulses
(output voltages) triggered a small 5 V relay. The relay closure was equivalent
to the reed switch closure in a TBRG, and the normally-open (NO) contacts of
the relay were connected to the inputs of a HOBO® event data logger. This was
done to see how well the event logger was able to record switch closures at
non-integral intervals, such as 2.5 s, 2.75 s, 3.5 s, 4.25 s, and so on. If the
interpretations contained in
Figure 1
are correct, then difficulties would be expected in logging both
events too closely spaced in time for the logger time resolution (1 s) and
those separated by non-integral periods (e.g. 3.5 seconds). Non-integral
intervals could be expected to occur commonly in natural rainfall, though not
of course at the precise values just mentioned.
The tested intervals between relay
closures ranged from 0.5 s to 5.0 s in increments of 250 ms. Thus, 19 different
pulse spacings were tested. For each, 25 repetitive closures were generated,
and then the pulse spacing was adjusted to the next nominated interval. When
data at all pulse spacings had been collected, the code halted. During the
test, the details of the timing of each pulse were written to an SD memory
card, including the Gregorian date and time with a precision of 1 ms - 1,000
times better than the 1 s timing resolution of the HOBO® event logger. These
were then read into a spreadsheet for processing. The data logged by the HOBO®
data logger were downloaded using Hoboware® software and read into a
spreadsheet. The apparent ITTs between successive switch closures were compared
with the known values that were electronically generated, from the SD card
files written by the microcontroller. The 25 repetitive relay closures at each
interval between relay closures allowed 24 intervening ITTs to be calculated
for each series of relay closures.
3. Results
It was found that the event logger
was able to record correctly the ITTs in all sequences of switch closures that
were separated by an integral number of seconds, viz. 1 s, 2 s, 3 s, 4 s, and 5
s (
Table 1
).
However, in all cases of non-integral ITTs, the logger was unable to record the
correct durations.
The results in Table 1 show that for all non-integral pulse spacings, the ITTs recorded by the event logger are a mix of ITTs that are too long and ITTs that are too short. The standard deviations of the apparent ITTs lie in the range 0.44 - 0.51 s. Only the mean ITT, calculated across all 24 ITTs, is correct. These inaccuracies result from the 1 second quantization arising from the logger clock timing.
The erroneous apparent ITTs recorded by the HOBO® event logger exhibited systematic patterns related to the changing offset between the actual ITTs and the boundaries of the clock seconds employed by the event logger. For instance, at a pulse spacing of 2.75 s, the apparent logged ITTs were arranged as three ITTs of 3 s duration, one ITT of 2 s duration, three ITTs of 3 s duration, and so on in a repeating pattern. For a pulse spacing of 2.25 s, the pattern of apparent ITTs from the event logger was three ITTs of 2 s, one ITT of 3 s, three ITTs of 2s, and so on in a repeating pattern. For a pulse spacing of 1.5 s, the sequence was alternating ITTs of 1 s and 2 s. A few examples showing the 24 recorded ITTs for non-integral intervals between switch closures are shown in Table 2.
4. Discussion
The results presented here demonstrate that event data loggers exemplified by the HOBO® event logger tested, and which are limited to 1 s resolution in the timing of reed switch closure events, have difficulty in faithfully recording ITTs that are not integral numbers of seconds. This occurs even when, as in the experiments reported here, the switch closures occur at constant, non-integral intervals longer than the minimum time of 1 s that the logger can record.
The explanation is as follows. When two switch closures are separated by more than an integral number of seconds, say 2.25 s or 4.1 s, the position of the pulse as seen on the time axis of Figure 1 progressively shifts in relation to the fixed clock-second boundaries set by the data logger clock. When the first switch closure occurs by chance close to the end of a clock second, and the next closure occurs say 1.5 s later, the entire intervening clock second is skipped. This makes the apparent ITT derived from the event logger data span 2 clock seconds, and the apparent ITT is 2 s, not the correct value of 1.5 s. This is an error of 25% in the estimated ITT. In the case of the 2.25 s pulses tested here, some ITTs calculated from the event logger data were 3 s in duration. This is an error of 44.4%, and this would translate to an error of the same size in the rainfall intensity estimated from such an erroneous ITT. Clearly, therefore, we must add event data logger timing errors to the systematic errors of tipping bucket filling and emptying, and syphon filling and emptying, discussed earlier which also affect the sequence of ITTs. Since all three error sources may act concurrently, they may introduce considerable bias in rainfall intensities estimated from unaggregated ITTs in TBRG data. Drift in the clocks of event data loggers is very small (typically no more than minutes per month). This is negligible in relation to the duration of rainfall events, and is ignored here as a further source of error. It is important to note that the errors just mentioned are only of significance in the estimation of short-term, high rainfall intensities. At low intensities, for instance less than 5 mm h-1, ITTs grow to durations of minutes rather than seconds, and the timing errors reported here are less important. For non-integral numbers of seconds, the 1 - 2 s uncertainty described here would remain, but be of no real significance to estimates of rainfall rates. For example, a 1 s uncertainty declines to be 1% of an expected ITT of 100 s, which is the equivalent of 7.2 mm h-1. The associated uncertainty in this case would be < 0.1 mm h-1.
In natural rainfall, intensity fluctuates from moment to moment, and ITTs are likewise very variable. This means that it is impossible to know whether ITTs derived from TBRG records of intense rainfall reflect the actual ITT, or are perturbed by the time quantisation problem associated with limited event data logger time resolution. It seems highly likely that many ITTs during intense rainfall are indeed perturbed by such errors, with an uncertainty of about 1 s. This is precisely the same kind of problem that attends the interpretation of ITTs collected using a syphon-equipped TBRG (Dunkerley 2024), but from quite a different cause. It is worth noting that an additional potential cause of irregular ITTs is uneven calibration of the two tipping buckets. If the stop-screws of the two buckets are adjusted to slightly different positions, then even in rain of constant intensity, there would be two slightly different filling times, and two slightly different ITTs.
To illustrate the possible consequences of the timing resolution issue, the ITT record of a rainfall event lasting 7.8 h, recorded in northern Australia is, analysed. The observations were collected using a RIMCO 8020 TBRG with 0.2 mm sensitivity, linked to a HOBO® event data logger. The unadjusted ITTs are compared with the adjusted record in which the shortest ITTs (the most intense bursts of rain) are adjusted to show the effects of a ± 1 s uncertainty (Figure 2). The rainfall record as logged shows several intensity peaks, including four of > 100 mm h-1, as well as several smaller peaks > 40 mm h-1. The record illustrates well the high temporal resolution of rainfall intensity that is in principle available from unaggregated ITTs. The ITTs associated with the intensity peaks include four ITTs of 4 s duration, and others of 5 s and 6 s duration. If these ITTs are shifted in duration by ± 1 s, as might have occurred as a result of the time quantisation problem, then the intensity peaks are significantly altered (Table 3). Thus, the four ITTs of 4 s duration might in fact have been close to 3 s, or close to 5 s, and it is impossible to know the actual value. Thus, the four unadjusted intensity peaks of 180 mm h-1 (4 s ITT) might have been as low as 144 mm h-1 (if the ITT was in fact 5 s) or as high as 240 mm h-1 (if the ITT was in fact 3 s). This is a range of uncertainty of ~ 100 mm h-1. Given the importance of intensity bursts in dislodging soil particles, establishing overland flow, and other processes, this uncertainty is not helpful in documenting the intense components of a rainfall climate. For the short rainfall event in Figure 2, the mean rainfall rate of the unadjusted data is 23.9 mm h-1. However, after adjusting only the ITTs associated with the small number of intensity peaks > 40 mm h-1, this increases by 5.4% to 25.2 mm h-1 if the ITTs are shortened by 1 s or falls by 3.4% to 23.1 mm h-1 if the ITTs are lengthened by 1 s. The change in the mean rainfall rate of any particular rainfall event would clearly depend on both the number of intensity peaks during the event, and their individual intensities (ITTs).
What can be done to improve the estimation of high rainfall intensities over short time intervals, such as the 10 s ITTs equivalent to 72 mm h-1? Even at this unexceptional intensity, a 1 s uncertainty amounts to about 10%, or ~ 7 - 8 mm h-1. Evidently, employing an event data logger with higher timing resolution would remove some of this uncertainty. This should be readily possible if an event data logger is assembled from one of the high-clock-speed microcontrollers now available at quite low cost (e.g. < US$20). This can be exemplified by the R4 Minima used in the present experiments, for which ms timing is straightforward. There are other possible methods of avoiding the kinds of uncertainty discussed here. One method that offers better capability is the use of acoustic methods (Dunkerley 2020 [23], Wang et al. 2022 [24]) where there are no delays at all associated with bucket or syphon filling or emptying, and the acoustic signal of rain can be recorded with << 1 ms resolution if required, including even the arrival of individual drops. This is done by analysing the voltage recorded at a suitable microphone, or perhaps, with a suitable piezo-electric transducer. In common forms of audio recording, the sampling frequency is 44.1 kHz, during which the voltage at the microphone is sampled every 0.02 ms. This provides more than sufficient temporal resolution for the confident estimation of rainfall intensity.
5. Conclusions
At high rainfall intensities, the limited timing precision of event data loggers such as the HOBO® event logger results in considerable uncertainty in estimating the true time interval between bucket tip events in a TBRG. This is essentially a quantization problem. In turn, this also makes estimates of rainfall intensity that could in principle be made from unaggregated ITTs equally uncertain. It is emphasised that these issues only relate to the estimation of high rainfall intensities (i.e., short ITTs). Timing issues become negligible in rainfall of low intensity. However, intensity bursts are critical in many areas, so that the performance limitations identified here need to be borne in mind when high rainfall intensities need to be interpreted from TBRG records.
Funding
This research received no external funding.
Data Availability Statement
Data are available from the author upon reasonable request.
Conflicts of Interest
The authors declare no conflicts of interest.
References
- Molini:, A.; Lanza, L.G.; La Barbera, P. Improving the accuracy of tipping-bucket rain records using disaggregation techniques. Atmospheric Research 2005, 77, 203–217. [Google Scholar] [CrossRef]
- Muñoz, P.; Celleri, R.; Feyen, J. Effect of the Resolution of Tipping-Bucket Rain Gauge and Calculation Method on Rainfall Intensities in an Andean Mountain Gradient. Water 2016, 8, 534. [Google Scholar] [CrossRef]
- Kim, M.-S.; Kwon, B.H. Rainfall Detection and Rainfall Rate Estimation Using Microwave Attenuation. In Atmosphere, 2018; Vol. 9.
- Fankhauser, R. Influence of systematic errors from tipping bucket rain gauges on recorded rainfall data. Water Science and Technology 1998, 37, 121–129. [Google Scholar] [CrossRef]
- Overgaard, S.; El-Shaarawi, A.H.; Arnbjerg-Nielsen, K. Calibration of tipping bucket rain gauges. Water Science and Technology 1998, 37, 139–145. [Google Scholar] [CrossRef]
- Habib, E.; Krajewski, W.F.; Kruger, A. Sampling Errors of Tipping-Bucket Rain Gauge Measurements. Journal of Hydrologic Engineering 2001, 6, 159–166. [Google Scholar] [CrossRef]
- La Barbera, P.; Lanza, L.G.; Stagi, L. Tipping bucket mechanical errors and their influence on rainfall statistics and extremes. Water Science and Technology 2002, 45, 1–9. [Google Scholar] [CrossRef] [PubMed]
- Ciach, G.J. Local Random Errors in Tipping-Bucket Rain Gauge Measurements. Journal of Atmospheric and Oceanic Technology 2003, 20, 752–759. [Google Scholar] [CrossRef]
- Hodgkinson, R.A. , Pepper, T.J., & Wilson, D.W. Evaluation of tipping bucket rain gauge performance and data quality. 2: Agency, U.K, 2004. [Google Scholar]
- Santana, M.A.A.; Guimarães, P.L.O.; Lanza, L.G. Development of procedures for calibration of meteorological sensors. Case study: calibration of a tipping-bucket rain gauge and data-logger set. Journal of Physics: Conference Series 2018, 975, 012006. [Google Scholar] [CrossRef]
- Kochendorfer, J.; Rasmussen, R.; Wolff, M.; Baker, B.; Hall, M.E.; Meyers, T.; Landolt, S.; Jachcik, A.; Isaksen, K.; Brækkan, R. , et al. The quantification and correction of wind-induced precipitation measurement errors. Hydrol. Earth Syst. Sci. 2017, 21, 1973–1989. [Google Scholar] [CrossRef]
- Segovia-Cardozo, D.A.; Rodríguez-Sinobas, L.; Díez-Herrero, A.; Zubelzu, S.; Canales-Ide, F. Understanding the Mechanical Biases of Tipping-Bucket Rain Gauges: A Semi-Analytical Calibration Approach. In Water, 2021; Vol. 13.
- Segovia-Cardozo, D.A.; Bernal-Basurco, C.; Rodríguez-Sinobas, L. Tipping Bucket Rain Gauges in Hydrological Research: Summary on Measurement Uncertainties, Calibration, and Error Reduction Strategies. Sensors (Basel) 2023, 23. [Google Scholar] [CrossRef] [PubMed]
- Zhou, Z.; Yong, B.; Liu, J.; Liao, A.; Wang, N.; Zhu, Z.; Lu, D.; Li, W.; Zhang, J. Preliminary Evaluation of the HOBO Data Logging Rain Gauge at the Chuzhou Hydrological Experiment Station, China. Advances in Meteorology 2019, 2019, 5947976. [Google Scholar] [CrossRef]
- Duchon, C.; Fiebrich, C.; Grimsley, D. Using High-Speed Photography to Study Undercatch in Tipping-Bucket Rain Gauges. Journal of Atmospheric and Oceanic Technology 2014, 31, 1330–1336. [Google Scholar] [CrossRef]
- Liao, M.; Liu, J.; Liao, A.; Cai, Z.; Huang, Y.; Zhuo, P.; Li, X. Investigation of Tipping-Bucket Rain Gauges Using Digital Photographic Technology. Journal of Atmospheric and Oceanic Technology 2020, 37, 327–339. [Google Scholar] [CrossRef]
- Bates, B. , Evans, J., Green, J., ….Zheng, F. Development of intensity - frequency - duration information across Australia.; Engineers Australia: Canberra, Australia: Engineers Australia, 50pp, 2015; 50p. [Google Scholar]
- Wang, J.; Fisher, B.L.; Wolff, D.B. Estimating Rain Rates from Tipping-Bucket Rain Gauge Measurements. Journal of Atmospheric and Oceanic Technology 2008, 25, 43–56. [Google Scholar] [CrossRef]
- Song, Y.; Han, D.; Rico-Ramirez, M.A. High temporal resolution rainfall rate estimation from rain gauge measurements. Journal of Hydroinformatics 2017, 19, 930–941. [Google Scholar] [CrossRef]
- Gorman, J.D. Evaluation of the RIMCO precipitation gauge tipping bucket model 7499; 672; Commonwealth Bureau of Meteorology: Melbourne, 2003. [Google Scholar]
- Dunkerley, D. Syphons in tipping bucket rain gauges: How do they affect rainfall intensity estimates derived from inter-tip times? Journal of Hydrology 2024, 639, 131629. [Google Scholar] [CrossRef]
- Dunkerley, D. Judging Rainfall Intensity from Inter-Tip Times: Comparing ‘Straight-Through’ and Syphon-Equipped Tipping-Bucket Rain Gauge Performance. In Water, 2024; Vol. 16.
- Dunkerley, D. Acquiring unbiased rainfall duration and intensity data from tipping-bucket rain gauges: A new approach using synchronised acoustic recordings. Atmospheric Research 2020, 244, 105055. [Google Scholar] [CrossRef]
- Wang, X.; Wang, M.; Liu, X.; Glade, T.; Chen, M.; Xie, Y.; Yuan, H.; Chen, Y. Rainfall observation using surveillance audio. Applied Acoustics 2022, 186, 108478. [Google Scholar] [CrossRef]
Figure 1.
Schematic timelines illustrating the interaction of bucket tip events (reed switch closures, marked by arrows below the line) and event data logger clock seconds (numbered 1 to 8 above the line). A: events evenly-spaced at 1.5 second intervals. B: events evenly-spaced at 3.5 s intervals.
Figure 1.
Schematic timelines illustrating the interaction of bucket tip events (reed switch closures, marked by arrows below the line) and event data logger clock seconds (numbered 1 to 8 above the line). A: events evenly-spaced at 1.5 second intervals. B: events evenly-spaced at 3.5 s intervals.
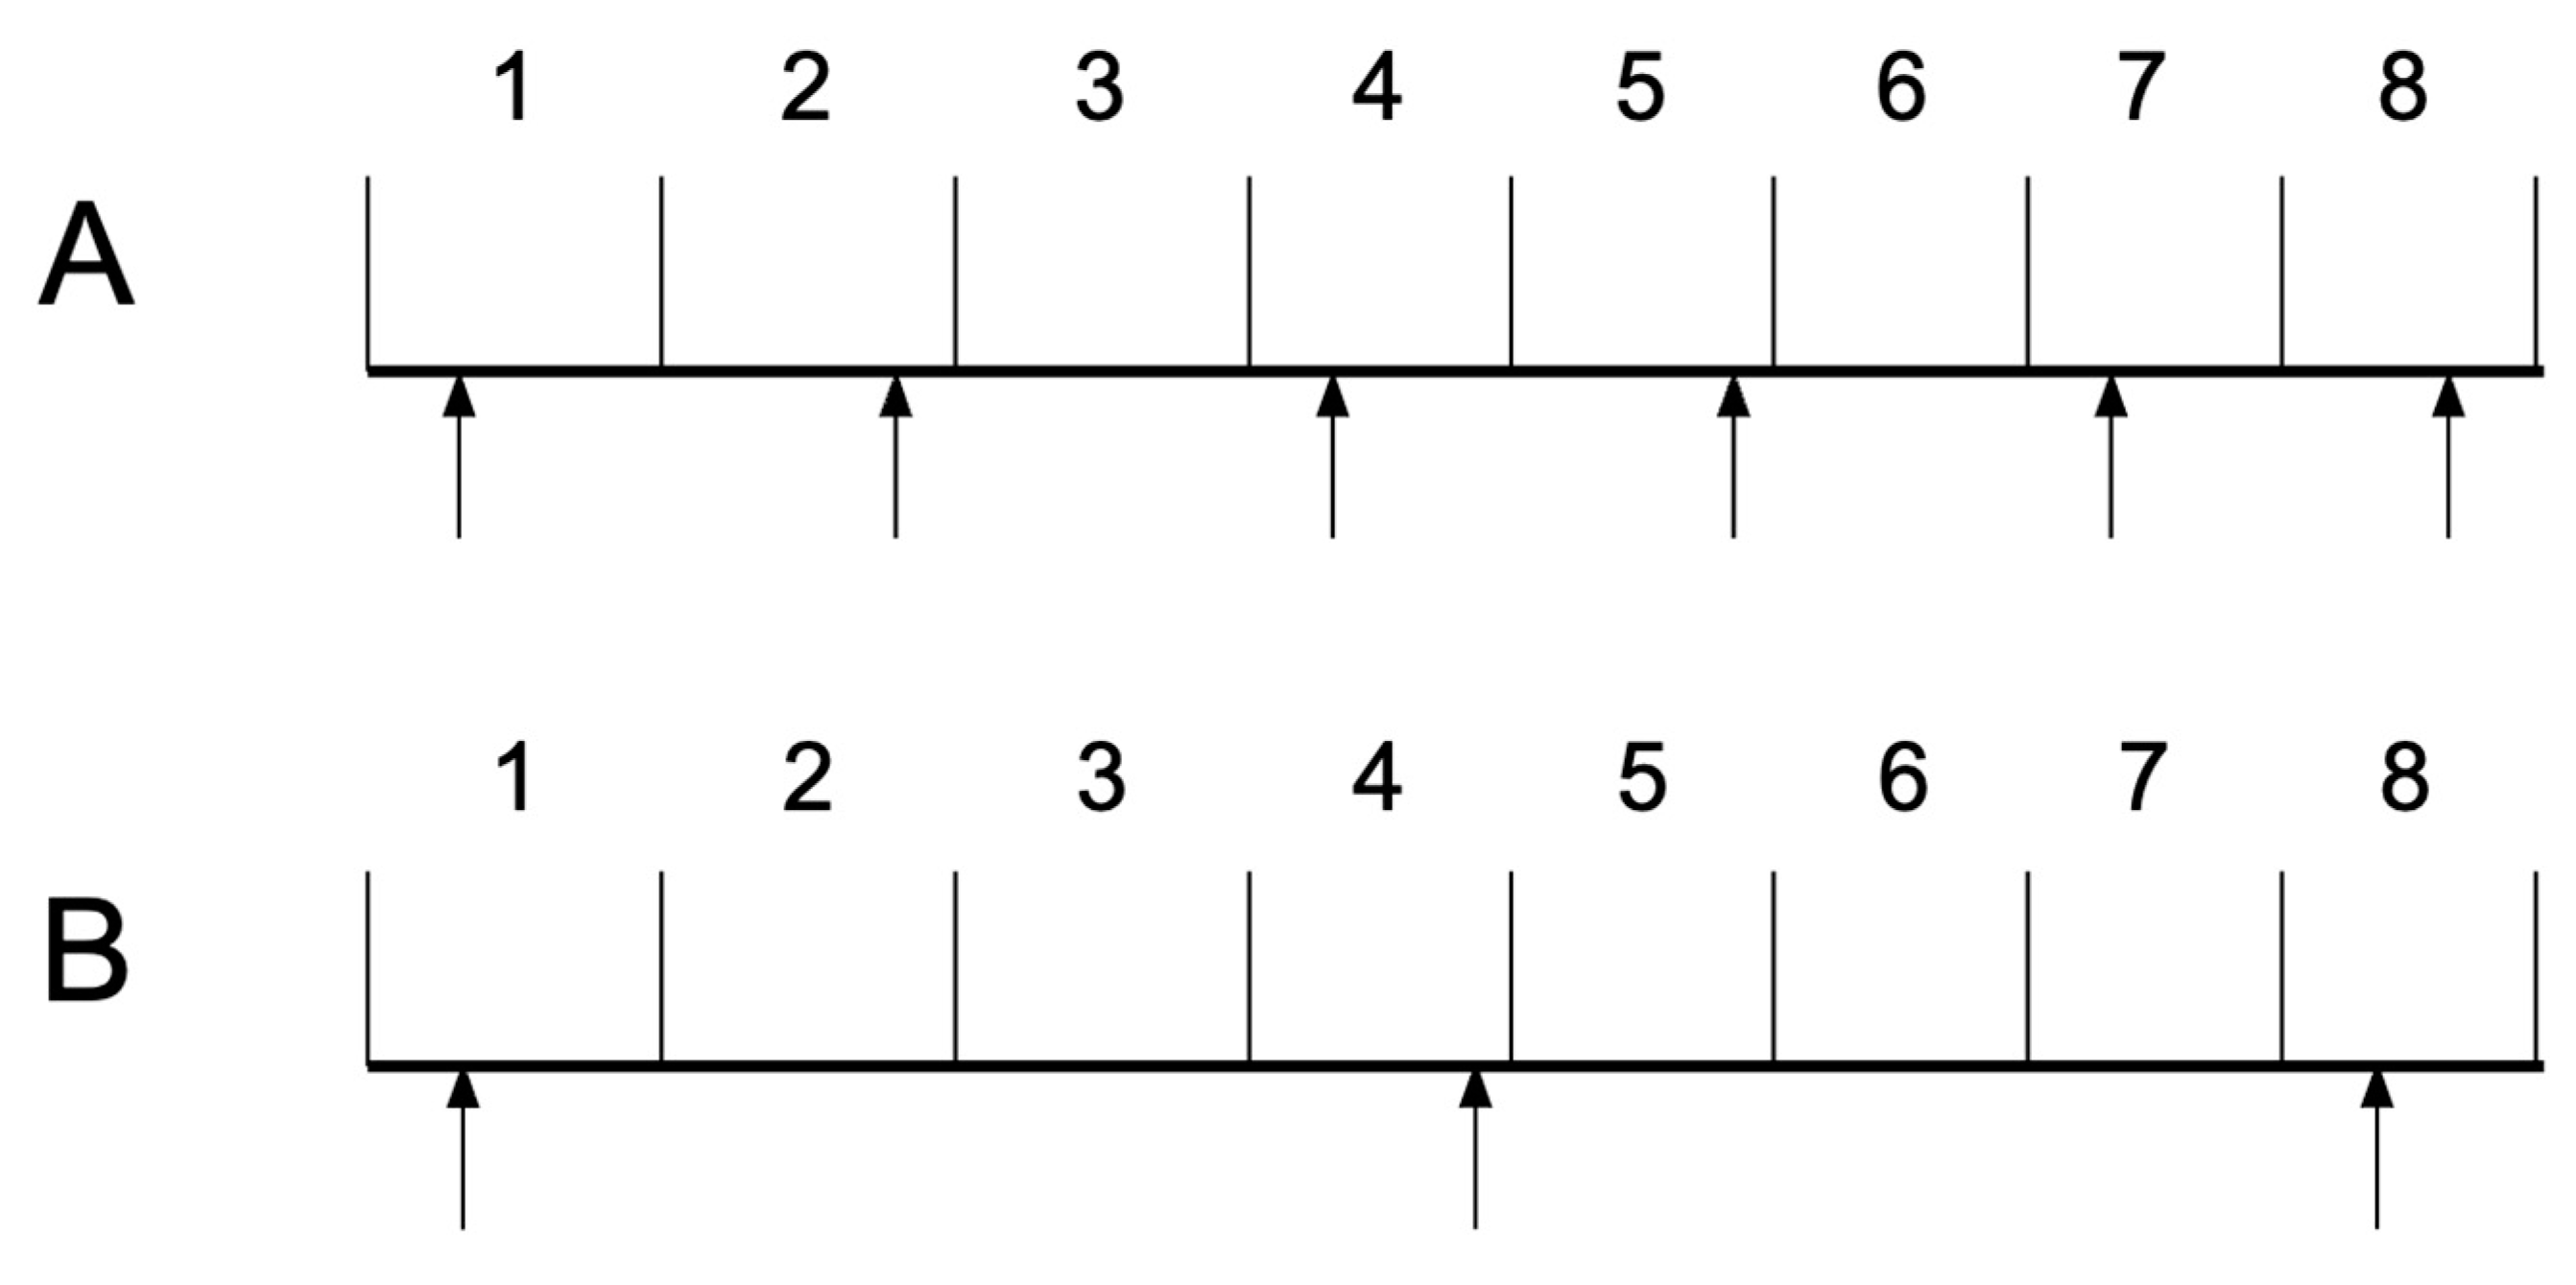
Figure 2.
Intensity during a 7.8-hour rainfall event as judged from inter-tip times (ITTs) derived from event data logger records. Panel A shows the original data. Panel B shows the changed intensity peaks when all ITTs for peaks > 40 mm h-1 are shortened by 1 s. Panel C shows the data when all ITTs for peaks > 40 mm h-1 are lengthened by 1 s. Horizontal axis shows Modified Julian dates, and runs from 22 February 2016 to 23 February 2016. On the time axis, 57441 marks midnight on 22 February. 0.1 Modified Julian Day has a duration of 2.4 h. Thus the Figure includes approximately the last 5 hours of 22 February and the first 5 hours of 23 February. See text for details.
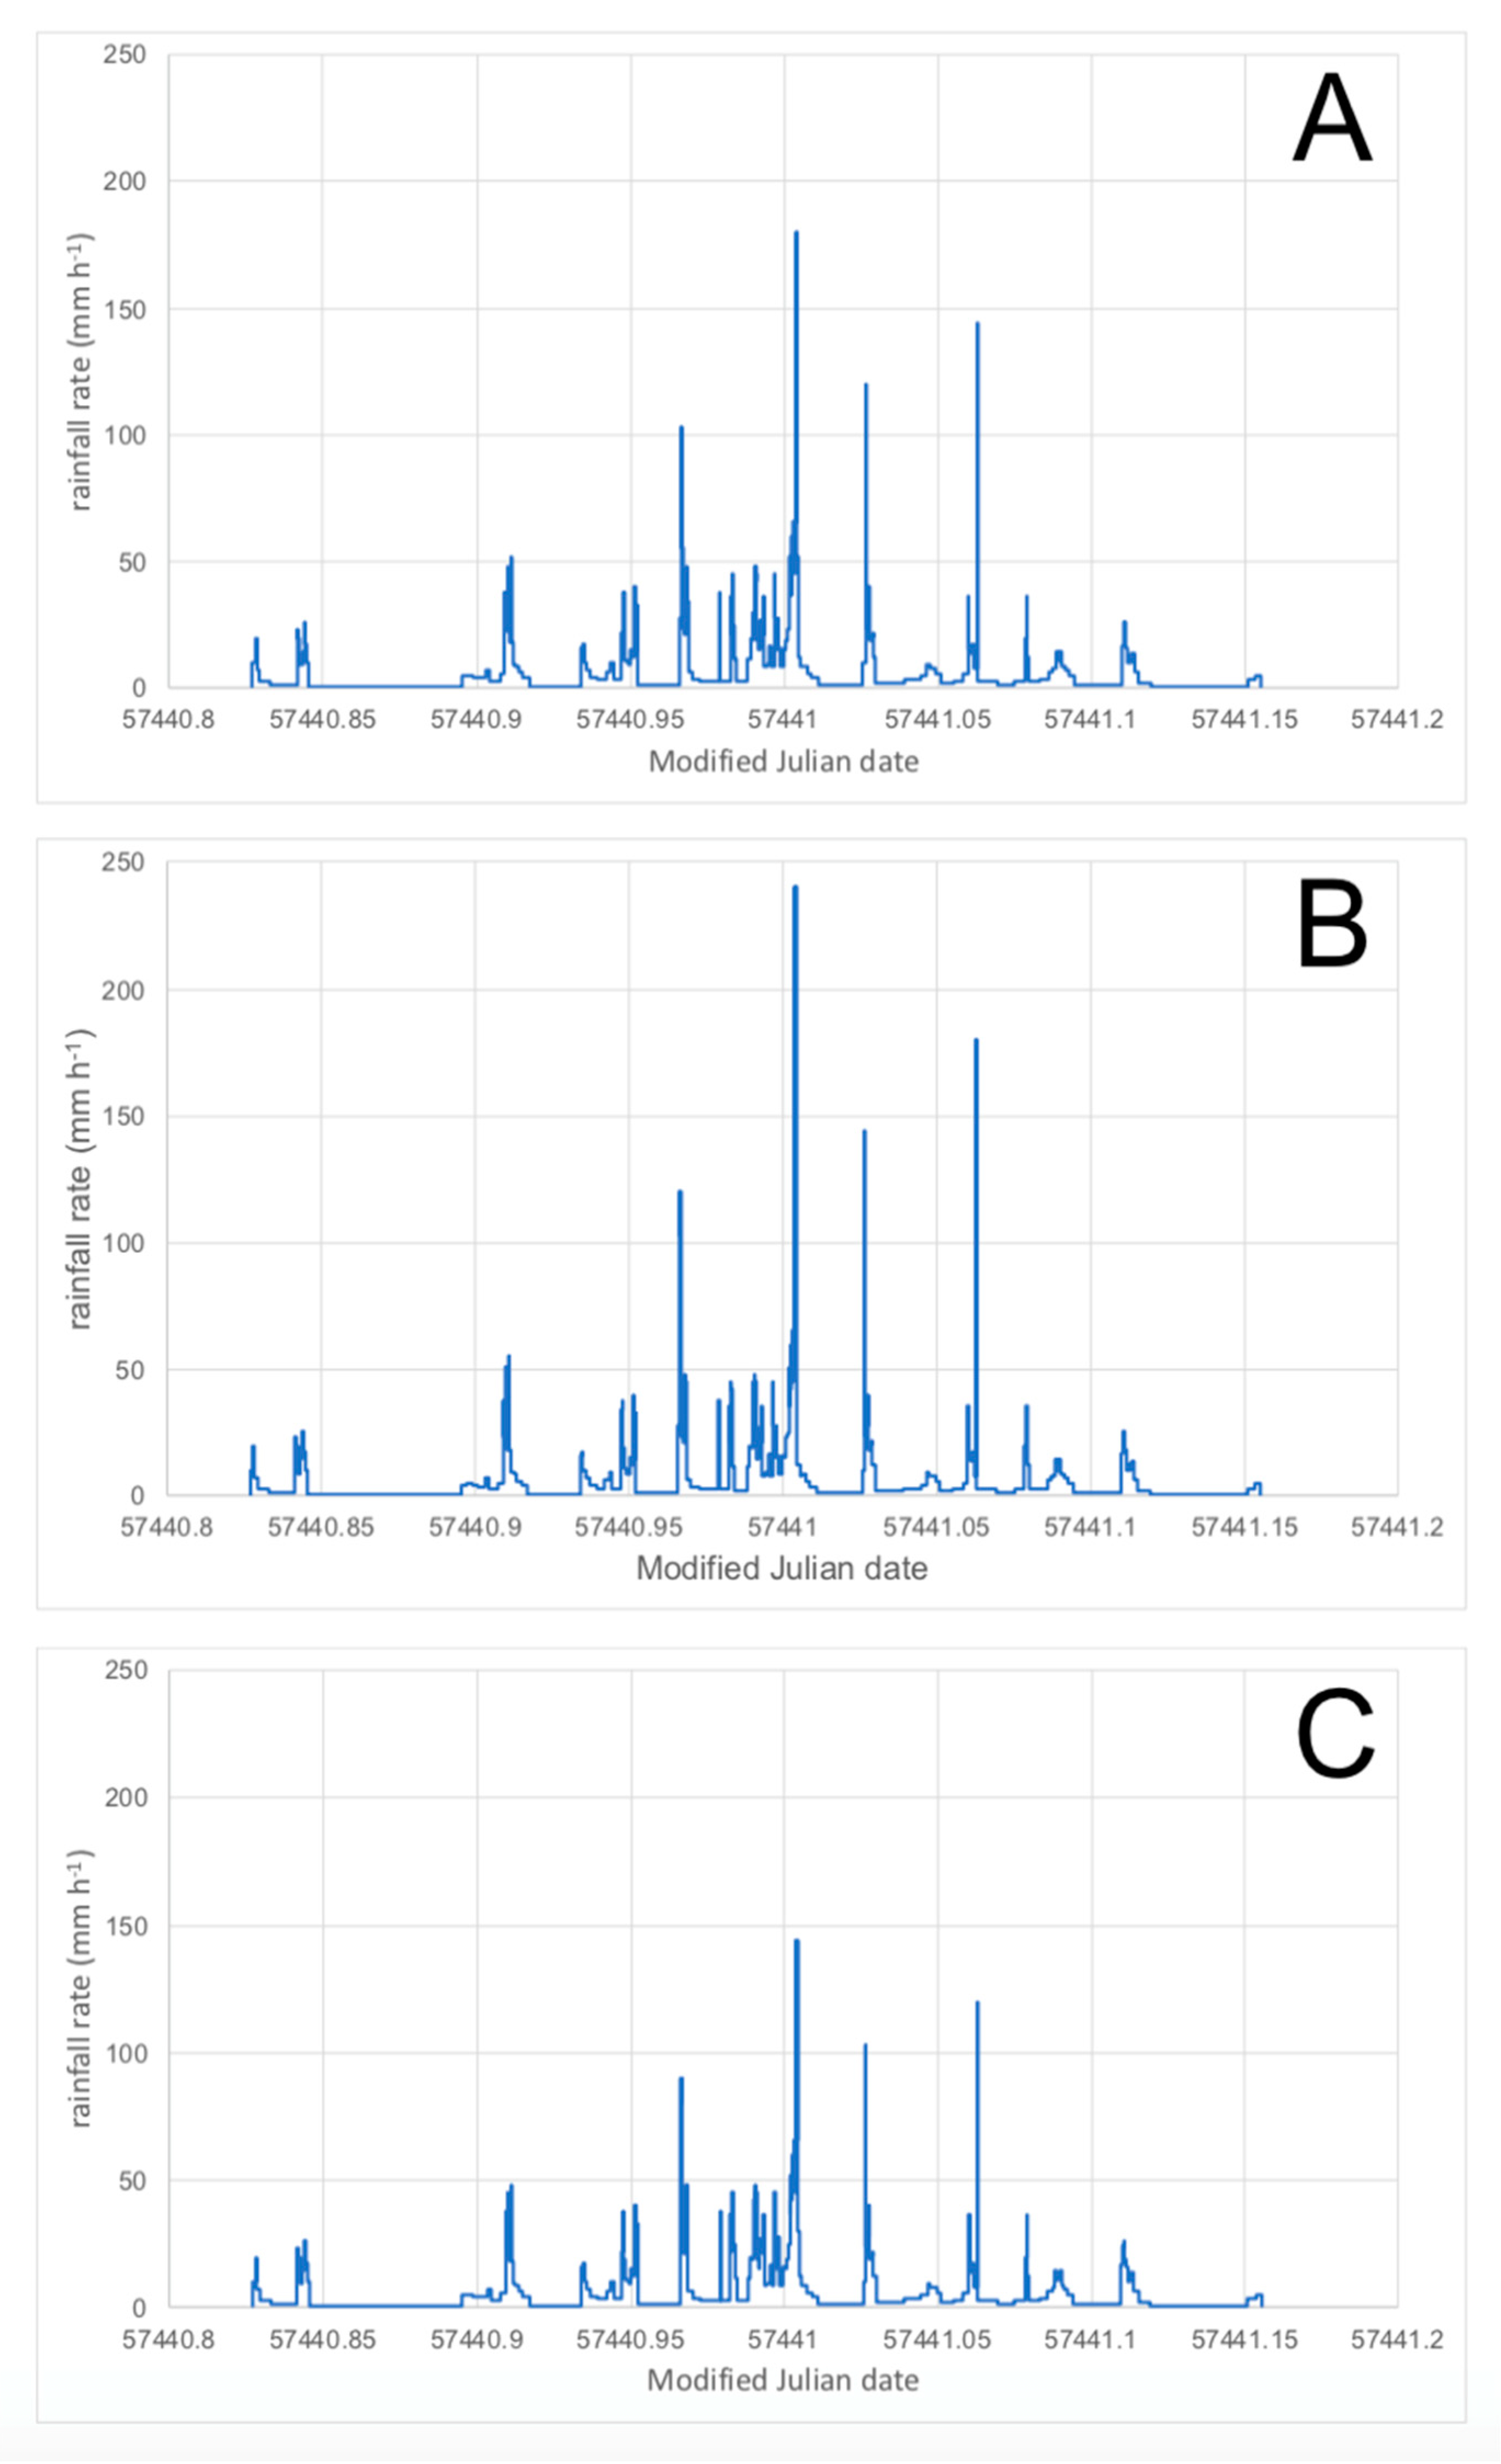

Table 1.
Details of the apparent ITTs recorded by the HOBO® event data logger for sequences of 25 relay switch closures at intervals ranging from 5 s to 0.5 s. Means and standard deviations refer to the 24 ITTs falling between the 25 switch closures.
Table 1.
Details of the apparent ITTs recorded by the HOBO® event data logger for sequences of 25 relay switch closures at intervals ranging from 5 s to 0.5 s. Means and standard deviations refer to the 24 ITTs falling between the 25 switch closures.
| Interval Between Successive Relay Closures (s) | Mean ITT Recorded by HOBO® Event Logger (s) | Durations of the 24 Individual ITTs Recorded by the HOBO® Event Logger | Standard Deviation of ITTs Recorded by HOBO® Event Logger (s) |
|---|---|---|---|
| 5.0 | 5.0 | all 5 s | 0.0 |
| 4.75 | 4.75 | 6 of 4 s; 18 of 5 s | 0.44 |
| 4.5 | 4.5 | 12 of 4 s; 12 of 5 s | 0.51 |
| 4.25 | 4.25 | 18 of 4 s; 6 of 5 s | 0.44 |
| 4.0 | 4.0 | all 4 s | 0.0 |
| 3.75 | 3.71 | 8 of 3 s; 16 of 4 s | 0.46 |
| 3.5 | 3.45 | 13 of 3 s; 11 of 4 s | 0.51 |
| 3.0 | 3.0 | all 3 s | 0.0 |
| 2.75 | 2.75 | 6 of 2 s; 18 of 3 s | 0.44 |
| 2.5 | 2.5 | 12 of 2 s; 12 of 3 s | 0.51 |
| 2.25 | 2.25 | 18 of 2 s; 6 of 3 s | 0.44 |
| 2.0 | 2.0 | all 2s | 0.0 |
| 1.75 | 1.75 | 6 of 1 s; 18 of 2 s | 0.44 |
| 1.5 | 1.5 | 12 of 1 s; 12 of 2 s | 0.51 |
| 1.25 | 1.25 | 18 of 1 s; 6 of 2 s | 0.44 |
| 1.0 | 1.0 | all 1 s | 0.0 |
| 0.75 | 1.0 | all 1 s | 0.0 |
| 0.5* | 1.0 | all 1 s | 0.0 |
* only 12 switch closures were recorded from the 25 0.5 s pulses, and all were recorded erroneously as being 1 s apart.
Table 2.
Individual values of the 24 ITTs recorded by the HOBO® event data logger for 5 representative non-integral intervals between switch closures, from 1.5 s to 4.75 s.
Table 2.
Individual values of the 24 ITTs recorded by the HOBO® event data logger for 5 representative non-integral intervals between switch closures, from 1.5 s to 4.75 s.
| ITT No. | Interval Between the 25 Repeated Switch Closures | ||||
|---|---|---|---|---|---|
| 4.75 s | 3.75 s | 2.5 s | 1.75 s | 1.5 s | |
| 1 | 5 | 4 | 3 | 2 | 1 |
| 2 | 5 | 3 | 2 | 2 | 2 |
| 3 | 5 | 4 | 3 | 1 | 1 |
| 4 | 4 | 4 | 2 | 2 | 2 |
| 5 | 5 | 4 | 3 | 2 | 1 |
| 6 | 5 | 3 | 2 | 2 | 2 |
| 7 | 5 | 4 | 3 | 1 | 1 |
| 8 | 4 | 4 | 2 | 2 | 2 |
| 9 | 5 | 4 | 3 | 2 | 1 |
| 10 | 5 | 3 | 2 | 2 | 2 |
| 11 | 5 | 4 | 3 | 1 | 1 |
| 12 | 4 | 4 | 2 | 2 | 2 |
| 13 | 5 | 4 | 3 | 2 | 1 |
| 14 | 5 | 3 | 2 | 2 | 2 |
| 15 | 5 | 4 | 3 | 1 | 1 |
| 16 | 4 | 4 | 2 | 2 | 2 |
| 17 | 5 | 4 | 3 | 2 | 1 |
| 18 | 5 | 3 | 2 | 2 | 2 |
| 19 | 5 | 4 | 3 | 1 | 1 |
| 20 | 4 | 4 | 2 | 2 | 2 |
| 21 | 5 | 4 | 3 | 2 | 1 |
| 22 | 5 | 3 | 2 | 2 | 2 |
| 23 | 5 | 4 | 3 | 1 | 1 |
| 24 | 4 | 4 | 2 | 2 | 2 |
Table 3.
Effect of quantisation uncertainty in ITT durations during the rainfall event portrayed in Figure 2. The shortest ITT (and peak rainfall rate) are tabulated for the raw data as logged, and for data adjusted by the ITTs of intensity peaks of > 40 mm h-1 being either shortened or lengthened by 1 s. See text for details.
| data | unadjusted ITTs | ITTs shortened by 1 s for peaks > 40 mm h-1 | ITTs lengthened by 1 s for peaks > 40 mm h-1 |
|---|---|---|---|
| mean ITT (s) | 141.7 | 141.7 | 141.8 |
| shortest ITT (s) | 4 | 3 | 5 |
| mean rainfall rate (mm h-1) | 23.9 | 25.2 | 23.1 |
| maximum rainfall rate (mm h-1) | 180 | 240 | 144 |
Disclaimer/Publisher’s Note: The statements, opinions and data contained in all publications are solely those of the individual author(s) and contributor(s) and not of MDPI and/or the editor(s). MDPI and/or the editor(s) disclaim responsibility for any injury to people or property resulting from any ideas, methods, instructions or products referred to in the content. |
© 2025 by the authors. Licensee MDPI, Basel, Switzerland. This article is an open access article distributed under the terms and conditions of the Creative Commons Attribution (CC BY) license (http://creativecommons.org/licenses/by/4.0/).
Copyright: This open access article is published under a Creative Commons CC BY 4.0 license, which permit the free download, distribution, and reuse, provided that the author and preprint are cited in any reuse.


