

Submitted:
02 July 2024
Posted:
03 July 2024
You are already at the latest version
Preprints on COVID-19 and SARS-CoV-2
Abstract
Background: Humankind have faced unexperienced pandemic events since 2020. After COVID-19 pandemic is calming down, we felt the need to verify whether in-hospital mortality had worsened compared to pre-pandemic conditions due to the COVID-19 pandemic. Objective: To test the hypothesis that daily food consumption is associated with in-hospital mortality during hospitalization and to provide baseline data to examine the effects of COVID-19 in post-pandemic exists or not. Methods: All hospitalized patients staying in a single institution on the third Thursday of May, August, November, and the following next February were included. Compared data: 1) among four seasons, 2) between age < vs.
Keywords:
single-day survey
; hospital mortality
; hospital food consumption
; scheduled admission
; seasonality
1. Introduction
The total number of cases reported to WHO worldwide 686,632,076, and the total number of deaths is now 6,855,479 on June, 2024 [1]. This statistic is based on a world population of 811,900,000, so it can be said that 8.5% of the world population has been infected with COVID-19, 1% of infected patients have died, and survived remaining 99% have survived. While 99% of patients survived and returned to society after COVID-19 infection, it is necessary to verify whether a history of COVID-19 infection affects post-pandemic outcomes. Therefore, in this study, we would like to provide baseline data obtained in the pre-pandemic period for the post-pandemic period on factors influencing in-hospital mortality of scheduled admission patients to determine whether the COVID-19 pandemic has impacted on in-hospital mortality of these inpatients. To accomplish this purpose, we analyzed predictors of outcomes for inpatients with scheduled admissions obtained in the pre-COVID period in the one-day-per-season cross-sectional survey across four seasons.
1.1. Findings of the Previous Study, Which Showed an Association between in-Hospital Food Consumption and in-Hospital Mortality in Patients with NOT Scheduled BUT Emergency Admission
Before completing this study for scheduled admitted patients, we conducted the same styled study as the present study to determine the same effects on in-hospital mortality in patients with emergency admission for four seasons. In this study, significantly higher in-hospital mortality was found in the following patients: 1) emergency versus scheduled admissions, 2) in all four seasons, and 3) whose in-hospital food consumption was < 75% of requirement [2,3]. However, contrary to our prediction, no seasonal differences in in-hospital mortality were observed when comparing emergency admission data across four seasons. In-hospital mortality in emergency patients is independent of season. The present study aims to determine whether the finding that smaller eater with higher mortality is limited to emergency patients or occurs also in elective patients. If so, it will be found that reduced dietary consumption is an important predictor of in-hospital mortality regardless of the type of hospitalization. Conversely, if this finding was not observed in scheduled admitted patients, why is in-hospital food consumption not a predictor of in-hospital mortality only in emergent admitted patients? To address these clinical questions, this study was conducted.
1.2. Objective
To test the hypothesis that daily food consumption during hospitalization of patients scheduled for hospitalization is associated with in-hospital mortality in a one-day cross-sectional survey across four seasons.
2. Materials and Methods
2.1. Participants
All hospital inpatients on the study day were enrolled as study subjects. Data were collected from the subjects’ electronic medical records. The details of collected data and their timing of collection during hospitalization are shown (Supplementary Table 1).
The subjects were divided into four subgroups according to the season of the study, S1, S2, S3, S4, for group of spring, summer, autumn and winter, respectively (Supplementary Figure 1).
2.2. Study Design
An international cross-sectional point survey of patients with or at risk of malnutrition [4,5,6], called as the nutritionDay (nDay), has been conducted once a year. This nDay is held worldwide on a fixed date, the third Thursday of November. However, our concerned were that the results of a survey conducted on a single day in November might be different depending on the season. To address this concern, we conducted additional one-day cross-sectional surveys in the other three seasons, in addition to the November, using the same conditions as for nDay. The study dates for the three seasons other than November in this study, similar to the third Thursday as the original day set in nDay, were set to the third Thursday of May, August, and February of the following year for the three seasons. The reason for choosing the Thursday was stated to avoid weekend effects.
All data collected was analyzed using the following four methods. The details of these methods were as same as our previously published elsewhere [2]. Exclusion criteria included patients in the following three categories, which were the same as in the previously published analysis: 1) age < 18 years old, 2) admission style was emergency, non-scheduled, 3) any of missing data.
2.3. Four Seasons’ Analysis
Data were compared separately among the four seasons to test for seasonal differences in subject demographics, in-hospital food consumption, and outcome measures such as in-hospital mortality.
In subsequent analyses, all four groups of S1, S2, S3, S4 (ΣS in Supplementary Figure 1) were pooled to proceed to session 2.4 and 2.5. In the following session 2.4 and 2.5, to confirm whether there were differences in outcomes such as in-hospital motility according to age and food consumption on the study day, all subjects were divided into two groups according to age (2.4.) and in-hospital food consumption (2.5.).
2.4. Age Analysis
All subjects were divided into two subgroups by aged, 75 years or older and under 75 years, then all data were compared.
2.5. In-Hospital Food Consumptionanalysis and in-Hospital Mortality
All subjects in group ΣS of combined all four seasons’ subjects were divided into two subgroups according to in-hospital food consumption with respect to two cutoffs set at 50% and 75% of requirement in methods 3-1 and 3-2, respectively. Here, we set the cutoffs at 50% and 75% because they seemed relatively easy to assess at a glance, such as half or three-quarters of a whole served in-hospital food, and were considered clinically feasible.
2.6. Multivariate Analysis
A multivariate analysis as logistic regression analysis was performed to identify the predictive factors for the in-hospital mortality of patients in group ΣS.
2.7. Statistical Analysis
Data are presented as median, 25th percentile, and 75th percentile. The Mann-Whitney U test was used for differences in median values between two groups, the Kruskal-Wallis test for comparisons between four groups, and the χ2 test or Fisher’s exact test for differences in proportions between groups. Multivariate logistic regression analysis with adjusted odds ratio’s for in-hospital mortality was performed. The adjusted odds ratios, 95% confidence intervals and their P-values represent the odds of in-hospital mortality after adjusting for the covariates listed in the table. A statistically significant difference was considered significant when p < 0.05. Statistical analysis was performed with SPSS version 29 (IBM, Armonk, NY, USA).
3. Results
The total number of hospitalized patients on the four study days of the four seasons was 671. There were 38 cases under the age of 18, 50 cases with missing data and 218 cases with emergency admission. After excluding all these cases, 365 cases remained. These cases were proceeded in the further analyses in method 1 and thereafter (Figure 1).
3.1. Results of Session 2.3
Compared all collected data among four groups in four seasons, not only demographics and in-hospital food consumption amounts, but in-hospital mortality and the length of stay in hospital were not significantly different. In addition, no significant differences were also observed in all aspects, including CRP as the index of inflammation (Table 1). This finding is interpreted to mean that there is no seasonality in in-hospital mortality in patients with scheduled admission.
Compared all collected data among four groups in four seasons, not only demographics and amounts of in-hospital food consumption, but in-hospital mortality as the primary outcome measure and the length of stay in hospital as the second one were not significantly different among four season groups. From these findings, in the case of patients with scheduled admission, the subjects of this study, there are not only no seasonal differences in age, body size, severity of comorbidity (CCI), but also no seasonal differences in in-hospital mortality outcomes. Analyses with * exclude subjects who missed lunch ,and ⁑ exclude subjects who died during hospitalization.
Abbreviations, ADL: Activity of Daily Living, BMI: Body Mass Index, CCI: Charlson Comorbidity Index, CRP: C-reactive protein, IDDSI: International Dysphagia Diet Standardisation Initiative, LOS: Length of stay in hospital.
3.2. Results of Session 2.4
Assuming that outcomes such as in-hospital mortality is associated with older age, we examined the effect of age by comparing the two subgroups between those aged 75 years and older and those younger than 75 years. As the result, no significant differences were observed in any of the outcome measures, such as in-hospital mortality (Table 2).
After combining all data of four seasons because there were no seasonal differences among them as shown in result 2, all description parameters of patients with subgroup of aged >= 75 years and < 75 years old were not significantly different. Not only that, in-hospital mortality as the primary outcome, the length of stay (LOS), the highest CRP during the entire hospital stay, and the death rate during hospitalization within 30 days were not also significantly different. From these results, in patients with scheduled admission, we found that there were no differences in any characteristics other than age, food intake, or outcome measures such as in-hospital mortality between the two subgroups: those aged 75 years or older and those younger than 75 years. In other words, in patients with a scheduled admission, age is not associated with outcome in this study, contrary to what was previously thought. Analyses with * exclude subjects who missed lunch ,and ⁑ exclude subjects who died during hospitalization.
Abbreviations, ADL: Activity of Daily Living, BMI: Body Mass Index, CCI: Charlson Comorbidity Index, CRP: C-reactive protein, IDDSI: International Dysphagia Diet Standardisation Initiative, LOS: Length of stay in hospital.
3.3. Results of Session 2.5
To clarify the extent to which in-hospital nutritional inadequacy affects in-hospital mortality, we established two cutoff values for nutritional inadequacy: 50% and 75% of hospital food, in session 2.5. In both analyses, CCI, ADL, and in-hospital mortality, the highest CRP during hospitalization were all significantly worse in subjects whose in-hospital food consumption was less than 50% (Table 3) and 75% (Table 4), respectively.
In these two analyses, considering a priori that 75% ingestion is detected earlier than 50% consumption, we set the cutoff value at 75% will detect patients with poor outcomes earlier.
3.4. Results of Session 2.6
In-hospital mortality and factors associated with in-hospital food consumption < 75% were analyzed using logistic regression analyses. The factors associated with in-hospital mortality were CCI and in-hospital food consumption (Table 5).
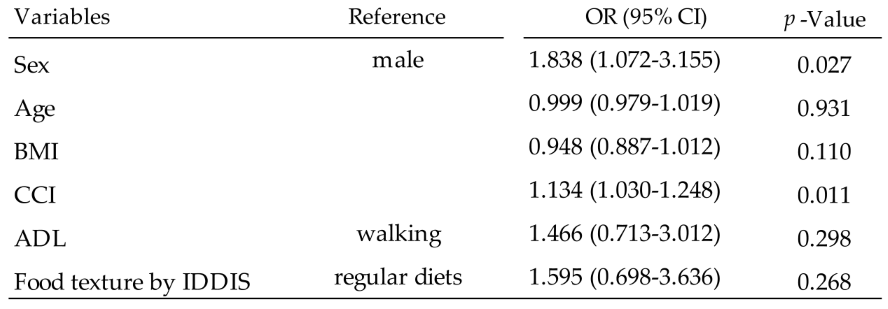
In addition, the factors associated with food consumption < 75% identified in method 3 were female and higher CCI of comorbidity (Table 6).
4. Discussion
4.1. The Need to Examine Whether the COVID-19 Pandemic Had an Effects on in-Hospital Mortality due to COVID History
Based on worldwide statistics, 8.5% of the world population has been infected with COVID-19, 1% of infected patients have died, and survived remaining 99% have survived [1]. In other words, it can be assumed that 99% of the patients saved will continue to be hospitalized with a history of COVID-19.
The reason for conducting this study was the need to verify whether in-hospital mortality had worsened compared to pre-pandemic conditions due to the COVID-19 pandemic that has been an unprecedented human event. If the result in the post-pandemic period is different from that in the pre-pandemic period, it would indicate that the pandemic had an effect on mortality, and its association factor might include food consumption, and the cut-off value for food consumption therefore needs to be reassessed.
4.2. Which Nutritional Assessment Tool Was Most Used during the COVID-19 Pandemic and Which Include Food Consumption Assessment among Them?
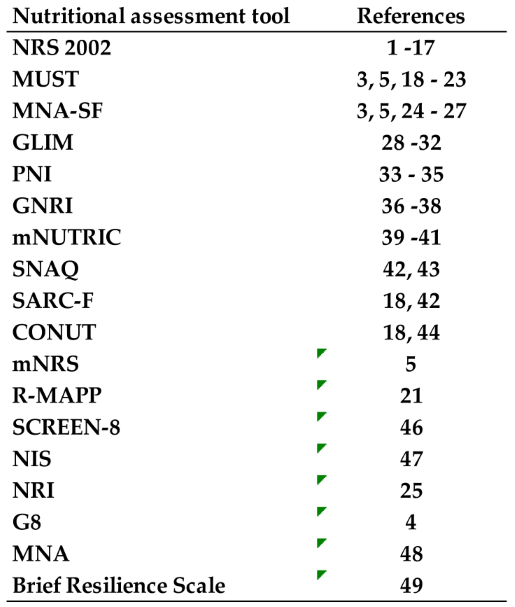
1743 articles were collected as the articles studying the nutritional assessment tool in patients with COVID-19 searched on June, 2024 through PubMed platform, the first place of reported articles’ number was NRS2002, followed by MUST, GLIM, PNI, and GNRI (Figure 2 and Supplementary Table 2, with 49 references added in supplementary references, excluding those listed at the end of the article).
Looking at Figure 2 (and supplementary Table 2), the number of publications using nutritional assessment tools for COVID-19 patients was highest for NRS2002 with 17. The NRS2002 is the only assessment tool with a cut-off value of 75% of the in-hospital food consumption obtained in this study and may be the optimal tool for early detection of malnutrition in COVID-19 patients. The NRS 2002 consists of two steps to assess nutritional status and food consumption is assessed in the second stage after the first stage assessment is completed. Given that the results of our study showed that 75% of dietary consumption is relevant in predicting mortality, food consumption assessment with the cut-off value at 75% must be moved to the first stage in NRS 2002. In our previous study, the same result as the result of this was proved [2]. Another analysis also stated that low in-hospital food consumption is associated with in-hospital mortality [7]. However, these were limited in emergency admission or subspecialty word such as surgical [7,8,9]. To the best of our knowledge, this our present study is the first to successfully prove that a smaller eater less than 75% of hospital food is associated with high in-hospital mortality regardless of admission style.
4.3. A Novel Cutoff Value of In-Hospital Food Consumption Setting at 75% of Requirements
The nutritional screening tools utilized also in pandemic period were all the same as them in pre-pandemic. Therefore, it is the same that the cutoff value setting at 75% was not considered also in post-pandemic period. In post-pandemic period also in-hospital food consumption amount in inpatients could be item to identify malnutrition whether early or late. In various nutritional screening tools, the cutoff value of food consumption associated with malnutrition is set at varying from 50% to 75% of requirement in GLIM and NRS 2002 [10,11,12], respectively. The other tools do not describe specific food consumption decrease, such as subjective global assessment (SGA) [13], MNA [14], MNA-SF [15,16], MST [17]. As noted in our research [2], in-hospital food consumption is an important predictor of in-hospital mortality. Setting the cutoff for in-hospital food consumption at 75% instead of 50% theoretically allows for earlier identification of poor outcomes and earlier initiation of nutritional intervention. This is consistent with the results of the previous study in the emergency admitted patients. Therefore, it could be concluded that a smaller eater < 75% of in-hospital food is predictor of in-hospital mortality regardless of admission style or season.
Looking at the previously published studies, when cutoff value was set at 75% of energy and protein requirement, ORs of longer stay in hospital were 1.59 (95% Confidence interval, 1.49 – 1.70) and 1.36 (95% CI, 1.27 – 1.45), respectively [18]. However, this analysis did not achieve the deference of mortality which must be stronger than length of hospitalization. Another study also analyzed eating < 75% of offered and concluded that small eater < 75% was associated with almost two times higher mean CRP [19,20].
The outcome measures in these reports were length of hospital stay and CRP. However, there was one other study that examined the relationship between mortality and 75% food intake [21]. The subjects were patients with chronic obstructive pulmonary disease (COPD), with a median age of 75 years, but no association between mortality and disease was found. The difference between our study and this one is that the subjects were limited to COPD patients who had a long history of chronic malnutrition associated with COPD, and the median mean induction period was short at 9.0 days (95% CI, 9.0-11.0). In comparison to these studies, our study included older subjects with many comorbidities, and in subjects who were already severely malnourished, food intake < 75% of requirement is considered a predictor of mortality.
4.4. Strength and Limitations of the Present Study
The strength of this paper is that it showed that total food consumption of three meals per day was a factor associated with in-hospital mortality. In addition, the cut-off value was able to show an effective life of 75%, which has the potential to detect malnutrition earlier than the conventional 50%.
It is also warranted to highlight the weaknesses of this study. First, we have not taken into account the other cut-off values, such as 80% or 90%, that would allow us to detect malnutrition even earlier. However, it is currently unclear whether it is possible to clearly distinguish between 75% and 80% or 90% and whether this 5% or 15% difference affects the outcome. Second, there is no guarantee that the newly proposed cut-off of 75% of requirement for in-hospital food consumption will detect malnutrition and poor outcomes as early as the 50% cut-off. Further study is needed to verify this. Third, it is unclear whether the same or worse results are obtained on weekends, as this survey was conducted on a weekday to avoid weekend effects. It is also unclear whether the results obtained this time apply to all weekdays or are limited to Thursdays. Fourth, As with the day of the week issue, there is also a seasonal issue. As to whether the same results would be obtained in months other than the January months of each season in which the one-day survey was conducted this time (February, May, August, and November), we did not examine all eight other months, so the results are limited to the January months of each season in which the survey was conducted. The additional eight untested months need to be surveyed. Lastly, the number is not appropriately enough to draw the conclusive findings. Further large prospective studies on other weekdays or weekends are needed.
4.5. Proposal of Study Protocol
The results of our current and previous studies show that before the pandemic, in-hospital mortality was poor for hospitalized patients admitted on weekdays, regardless of whether the admission was scheduled or emergency, and regardless of the four seasons. We propose a protocol to test whether this result has changed after the COVID-19 pandemic, similar to this study. If this verification shows that the OR of in-hospital food consumption on in-hospital mortality is high, it would suggest the possibility that the COVID-19 pandemic, the first human experience, may have had a long-term effects on in-hospital mortality.
Study protocol to propose is exactly as same as this study, including scheduled and emergency admission. Furthermore, the data collected and the outcome measures are the same. Then, the ORs of food consumption on in-hospital mortality between pre- and post-COVID-19 mortality are compared.
As the results of proposed study protocol, if the OR of the post-pandemic is higher than that of the pre-pandemic, as shown in this study, these must show the existence of an effects of food consumption on mortality and vice versa. This study protocol is, to our knowledge, the first to test the effects of food consumption in the post-COVID-19 on in-hospital mortality in the clinical nutritional areas.
5. Conclusions
A small eater of in-hospital food < 75% during hospitalization was associated with significantly higher in-hospital mortality in patients with scheduled hospitalization in the pre-pandemic period. Then, a study protocol is proposed to test the existence of effects of COVID-19 in the same study in the post-COVID-19 period.
Supplementary Materials
The following supporting information can be downloaded at the website of the paper posted on Preprints.org, for supplementary references that were shown in Appendix A table..
Author Contributions
Authors made the following contribution to the manuscript: HM, AT, TA formulated the original idea, HM completed the database search, data extraction and analysis, HM, TA drafted the manuscript, YH, EY reviewed and revised the manuscript for important intellectual content, and all authors provided final approval of the version to be submitted.
Funding
None to declare.
Institutional Review Board Statement
I The ethical considerations were approved by the Ethic Committee of the studied hospital and the approval number is 2017-200. In order to obtain ethics committee approval, an opt-out procedure was published in the hospital and on the website, stating that patients admitted during the study period who did not wish to participate should inform the hospital of their wishes.
Informed Consent Statement
Patient consent was waived by providing an opt-out statement and no refusal was taken from the participants. This was approved by the institutional ethics committee.
Data Availability Statement
We encourage all authors of articles published in MDPI journals to share their research data. In this section, please provide details regarding where data supporting reported results can be found, including links to publicly archived datasets analyzed or generated during the study. Where no new data were created, or where data is unavailable due to privacy or ethical restrictions, a statement is still required. Suggested Data Availability Statements are available in section “MDPI Research Data Policies” at https://www.mdpi.com/ethics.
Acknowledgments
We would like to express our deep gratitude to all participants for creating this study design and results. Through their support, this study could contribute to the advancement of clinical nutrition and outcomes.
Conflicts of Interest
None to declare.
Appendix A

Table A1.
The list of nustritonal assessment tools used for COVID-19 patients and their reference number. The list is arranged in descending order of the number of papers that reported nutritional assessment tools used in COVID-19 patients during the COVID-19 pandemic, and their reference paper numbers are shown. Details of the reference papers are given in the supplementary table. From this table, Figure 2 was graphically made.
Table A1.
The list of nustritonal assessment tools used for COVID-19 patients and their reference number. The list is arranged in descending order of the number of papers that reported nutritional assessment tools used in COVID-19 patients during the COVID-19 pandemic, and their reference paper numbers are shown. Details of the reference papers are given in the supplementary table. From this table, Figure 2 was graphically made.
 |
References
- CoronaBoard. https://coronaboard.com/global/. Accessed June, 9th, 2024.
- Miyata H, Tsunou A, Hokotachi Y, Amagai T. Daily food deprivation as a predictor of in0hospital mortality with 75% cutoff. J Food Nutr. 2024;10:101.
- Charlson ME, Carrozzino D, Guidi J, Patierno C. Charlson comorbidity index: A critical review of clinimetric properties. Psychother Psychosom. 2022; 91(1): 8-35. [CrossRef]
- Fischer A, Veraar C, Worf I, Tarantino S, Kiss N, Schuh C, Hiesmayr M. More Nutritional Support on the Wards after a Previous Intensive Care Unit Stay: A nutritionDay Analysis in 136,667 Patients. Nutrients. 2023;15(16):3545. [CrossRef]
- Böhne SEJ, Hiesmayr M, Sulz I, Tarantino S, Wirth R, Volkert D. Recent and current low food intake - prevalence and associated factors in hospital patients from different medical specialities. Eur J Clin Nutr. 2022 Apr 11. [CrossRef]
- Kiss N, Hiesmayr M, Sulz I, Bauer P, Heinze G, Mouhieddine M, Schuh C, Tarantino S, Simon J. Predicting Hospital Length of Stay at Admission Using Global and Country-Specific Competing Risk Analysis of Structural, Patient, and Nutrition-Related Data from nutritionDay 2007-2015. Nutrients. 2021; 13(11):4111. [CrossRef]
- Böhne SEJ, Hiesmayr M, Sulz I, Tarantino S, Wirth R, Volkert D. Recent and current low food intake - prevalence and associated factors in hospital patients from different medical specialities. Eur J Clin Nutr. 2022; 76: 1440-8. [CrossRef]
- Walicka M, Tuszyńska A, Chlebus M, Sanchak Y, Śliwczyński A, Brzozowska M, et al. Predictors of in-hospital mortality in surgical wards: a multivariable retrospective cohort analysis of 2,800,069 hospitalizations. World J Surg. 2021; 45(2): 480-7. [CrossRef]
- Chen L, Chen L, Zheng H, Wu S, Wang S. Emergency admission parameters for predicting in-hospital mortality in patients with acute exacerbation of chronic obstructive pulmonary disease with hypercapnic respiratory failure. BMC Pulm Med. 2021; 21: 258. [CrossRef]
- Kondrup, J. Allison SP, Elia M, Plauth M. ESPEN guidelines for nutrition screening 2002. Clin Nutr. 2003; 22: 415-21. [CrossRef]
- Jensen GL, Cererholm T, Correia MITD, Gonzalez MC, Fukushima R, Higashiguchi T, et al. GLIM criteria for the diagnosis of malnutrition- A consensus report from the global clinical nutrition community. JPEN J Parenter Enteral Nutr. 2019; 43(1): 32-40. [CrossRef]
- Cererholm T, Jensen GL, Correia MITD, Gonzalez MC, Fukushima R, Higashiguchi T, et al. GLIM criteria for the diagnosis of malnutrition- A consensus report from the global clinical nutrition community. Clin Nutr. 2019; 38: 1-9. [CrossRef]
- Detsky AS, McLaughlin JR, Baker JP, Johnston N, Whittaker S, Mendelson RA, et al. What is subjective global assessment of nutritional status? JPEN J Parenter Enteral Nutr. 1987; 11:8-13. [CrossRef]
- Vellas B, Guigoz Y, Garry PJ, Nourhashemi F, Bennahum D, Lauque S, Albarede JL. The mini nutritional assessment (MNA) and its use in grading the nutritional state of elderly patients. Nutrition. 1999; 15(2): 116-22. [CrossRef]
- Rubinstein LZ, Harker JO, A Salvà, Y Guigoz, B Vellas. Screening for undernutrition in geriatric practice: developing the short-form mini-nutritional assessment (MNA-SF). J Gerontol A Bio Sci Med Sci. 2001; 56(6):M366-72. [CrossRef]
- Kaiser MJ, Bauer JM, Ramsch C, Ulter W, Guigoz Y, Cederholm T, et al. Validation of the mini nutritional assessment short-form (MNA-SF): a practical tool identification of nutritional status. J Nutr Health Aging. 2009; 13(9): 782-8. [CrossRef]
- Ferguson J, Capra S, Bauer J, Banks M. Development of a valid and reliable malnutrition screening tool for adult hospital patients. Nutrition. 1999;15:458-64. [CrossRef]
- Mikkelsen S, Tobberup R, Skadhauge LB, Rasmussen HH, Holst M. “More2Eat” in patients at nutritional risk during hospital stay lowers the risk of three-month mortality. Clin Nutr ESPEN. 2023; 57: 29-38. [CrossRef]
- Pourhasan M, Sieske L, Janssen G, Babel N, Westhoff TH, Wirth R. The impact of acute changes of inflammation on appetite and food intake among older hospitalized patients. Br J Nutr. 2020; 124: 1069-75. [CrossRef]
- Pourhasan M, Böttger Janssen G, Sieske R, Wirth R. Association of inflammation with food intake in older hospitalized patients. J Nutr Health Aging. 2018; 22(5): 589-93. [CrossRef]
- Ingadottri AR, Beck AM, Baldwin C, Weekes CE, Geirdottir OG, Ramel A, et al. Association of energy and protein intakes with length of stay, readmission and mortality in hospitalized patients with chronic obstructive pulmonary disease. Be J Nutr. 2018; 119: 543-51. [CrossRef]
Figure 1.
The flow diagram of the study. Abbreviations, E: Patients with emergency admission, S: Patients with scheduled admission.
Figure 1.
The flow diagram of the study. Abbreviations, E: Patients with emergency admission, S: Patients with scheduled admission.
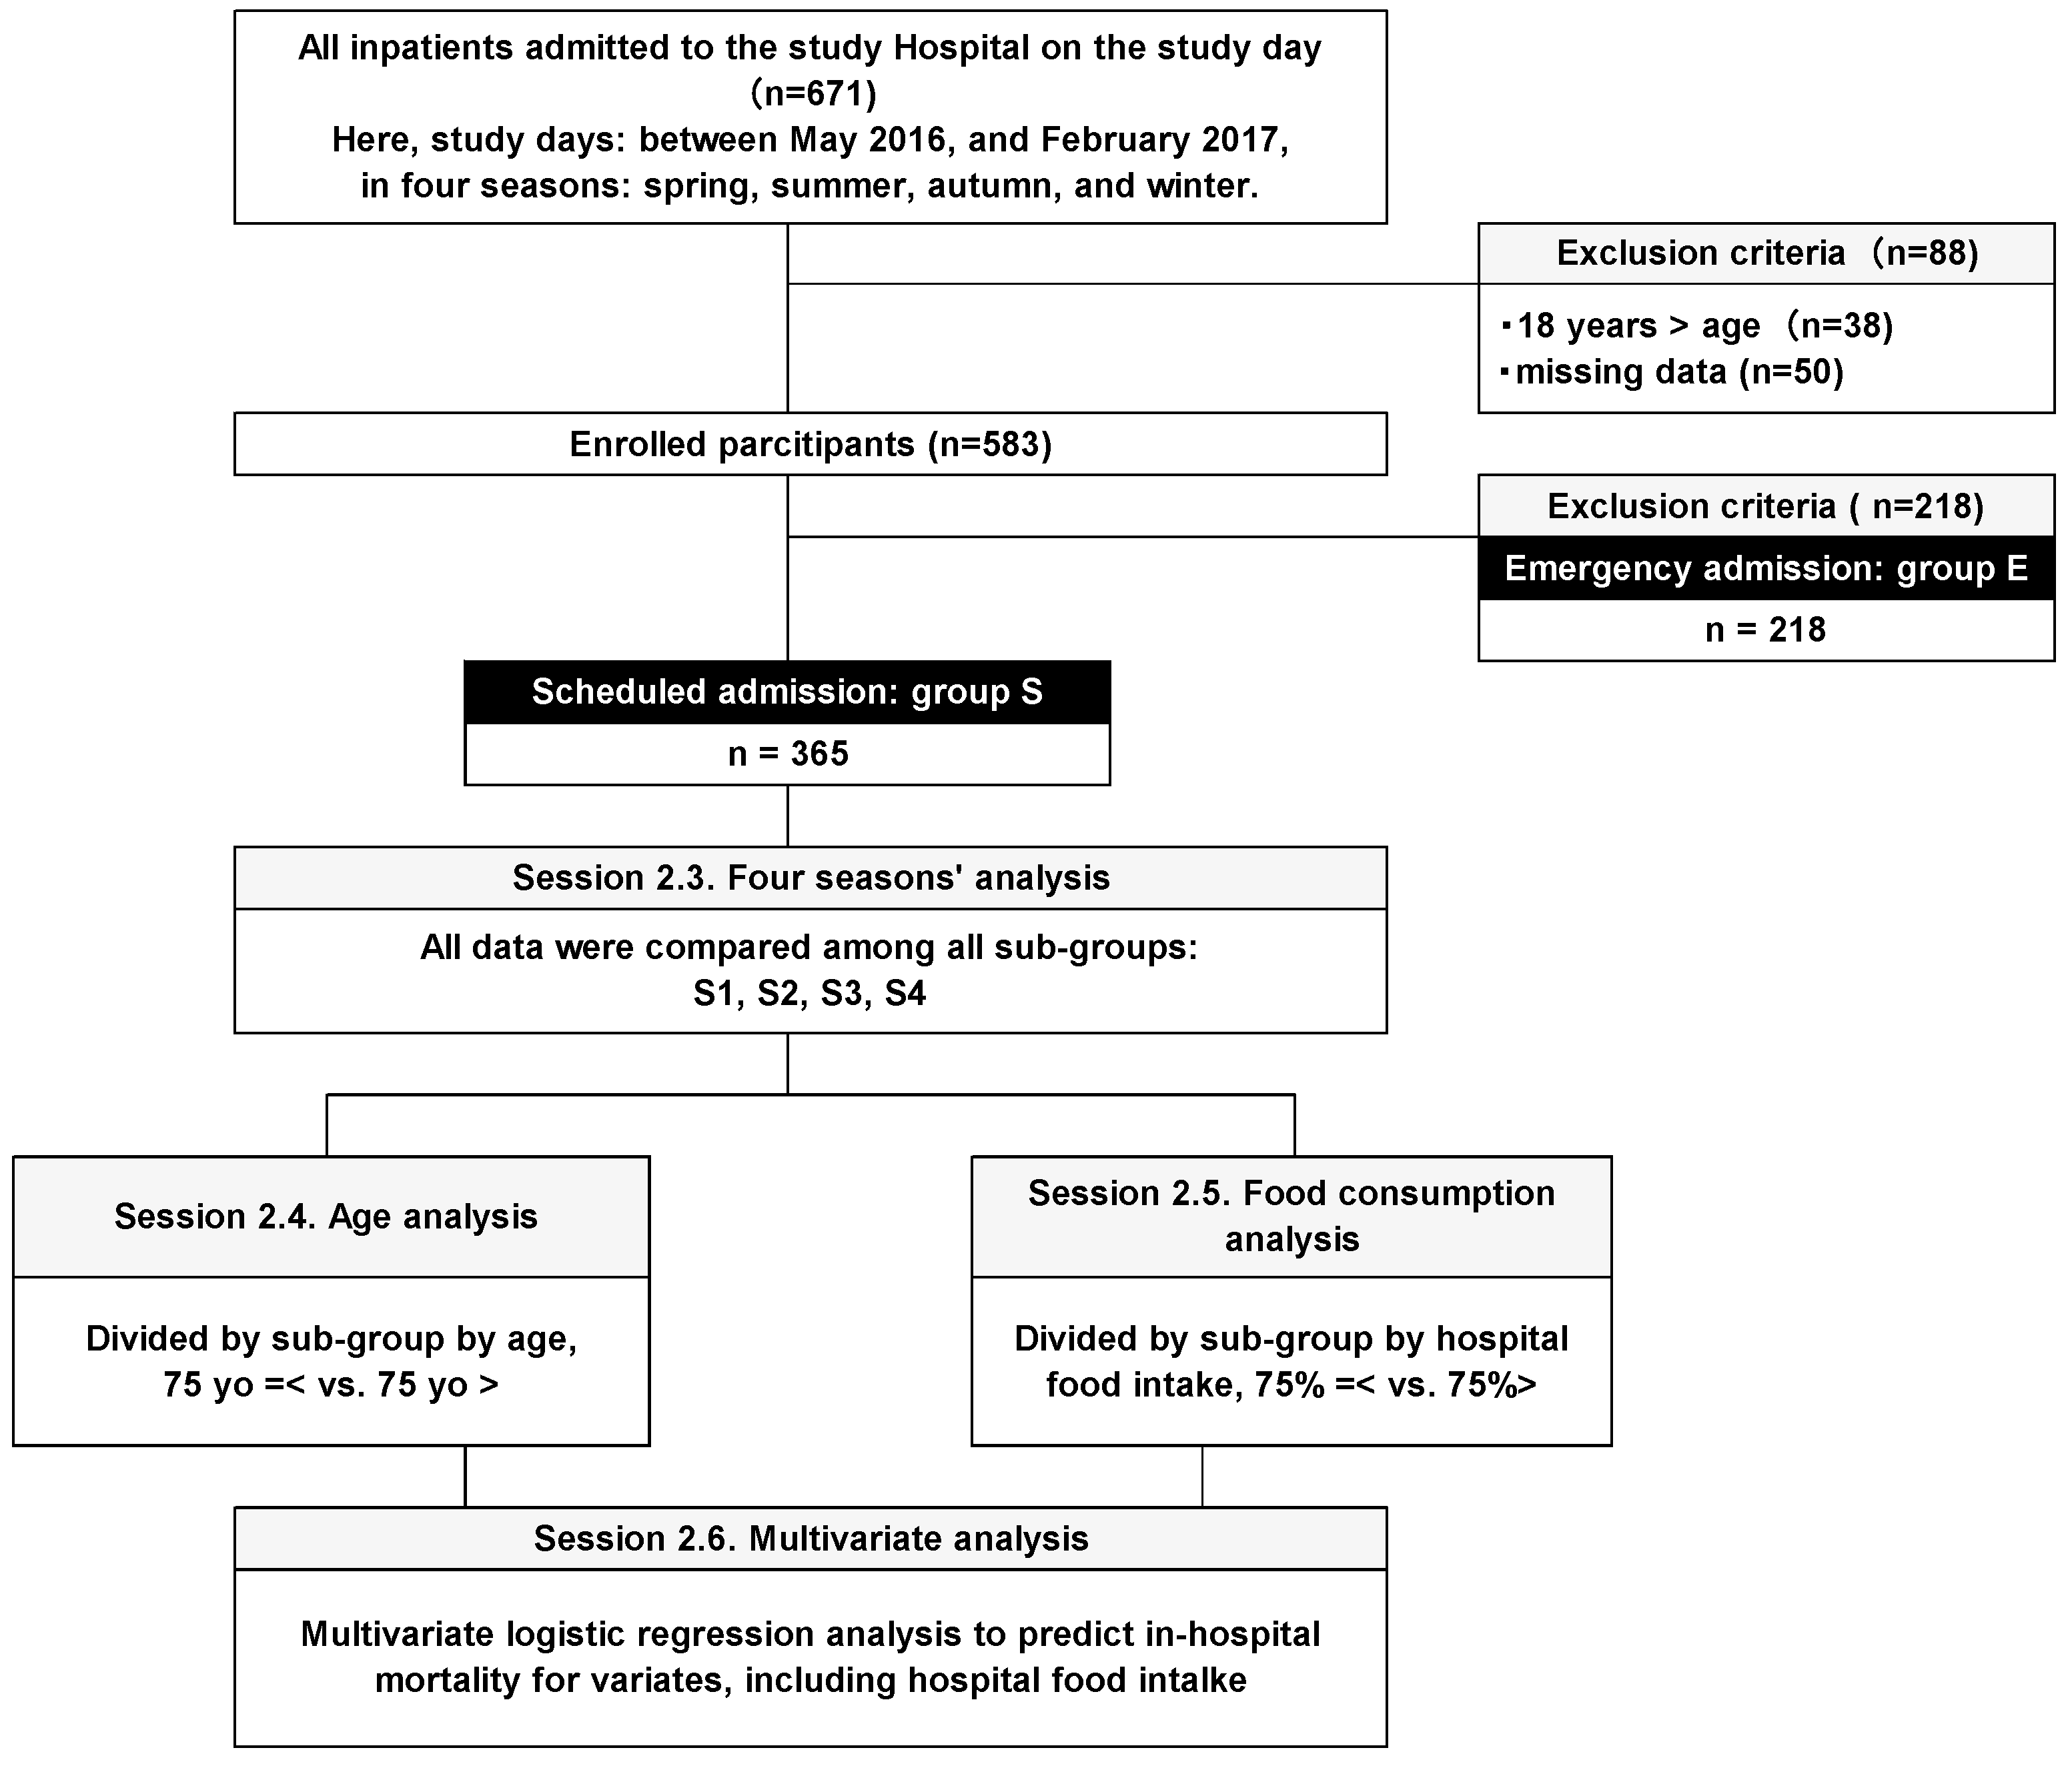
Figure 2.
The results of review of 1743 articles studying nutritional assessment for patients with COVID-19. The line graph and the numbers next to it represent a comparison of the number of papers that studied each nutrition assessment tool. The bars represent the total number of subjects included in each study. The left Y-axis represents the total number of COVID-19 patients assessed with each nutritional assessment tool, and the right Y-axis represents the number of articles assessing COVID-19 patients with each nutritional assessment tool. The number of publications using nutritional assessment tools for COVID-19 patients was highest for NRS2002 with 17. The NRS2002 is the only assessment tool with a cut-off value of 75% of the in-hospital food intake obtained in this study and may be the optimal tool for early detection of malnutrition in COVID-19 patients.
Figure 2.
The results of review of 1743 articles studying nutritional assessment for patients with COVID-19. The line graph and the numbers next to it represent a comparison of the number of papers that studied each nutrition assessment tool. The bars represent the total number of subjects included in each study. The left Y-axis represents the total number of COVID-19 patients assessed with each nutritional assessment tool, and the right Y-axis represents the number of articles assessing COVID-19 patients with each nutritional assessment tool. The number of publications using nutritional assessment tools for COVID-19 patients was highest for NRS2002 with 17. The NRS2002 is the only assessment tool with a cut-off value of 75% of the in-hospital food intake obtained in this study and may be the optimal tool for early detection of malnutrition in COVID-19 patients.
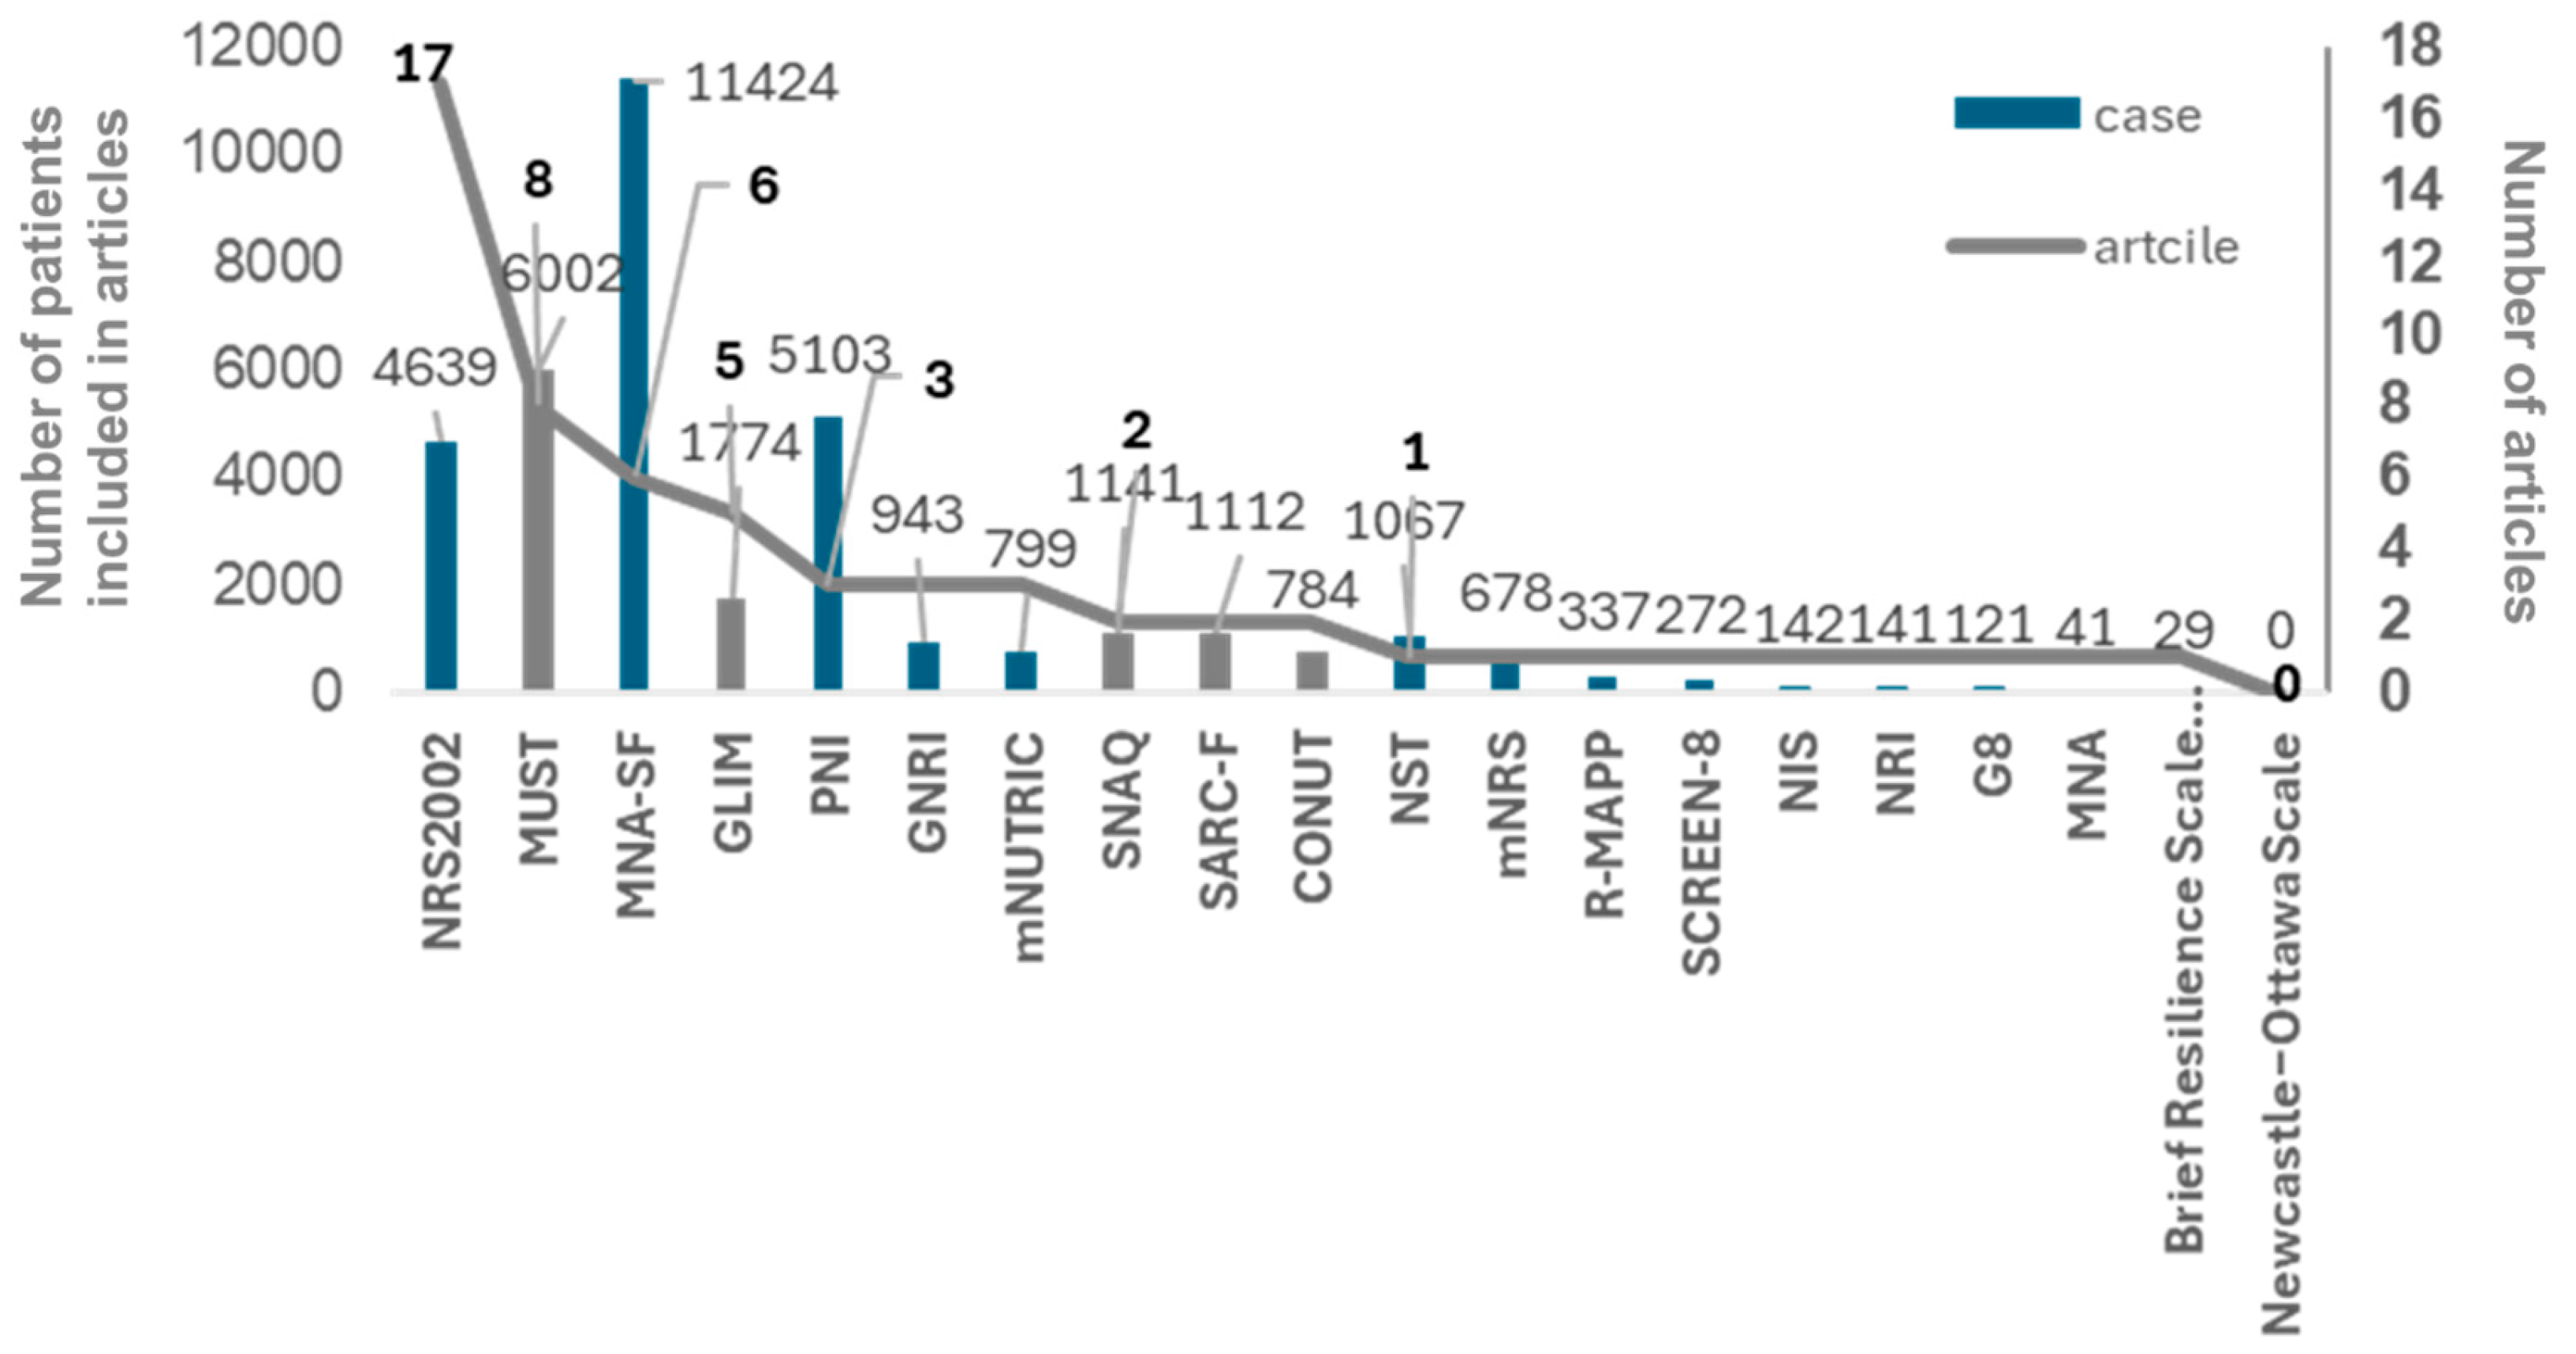
Table 1.
The Results of four seasons’ analysis in session 2.3.
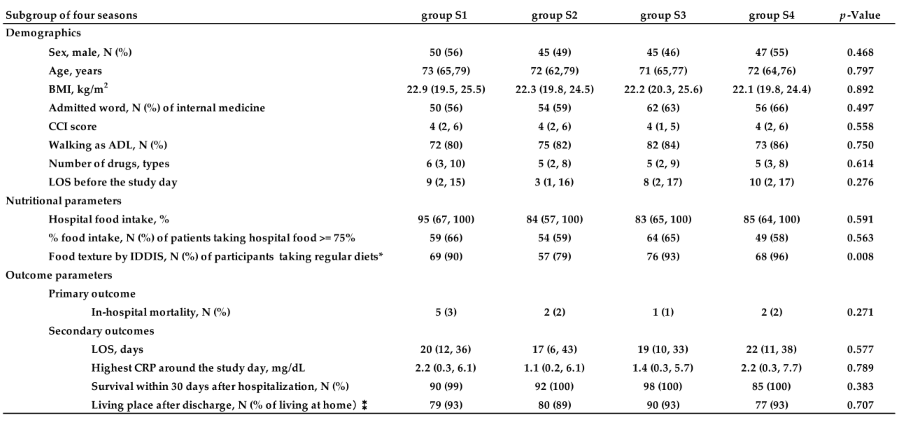 |
Table 2.
Results of age analysis in session 2.4.
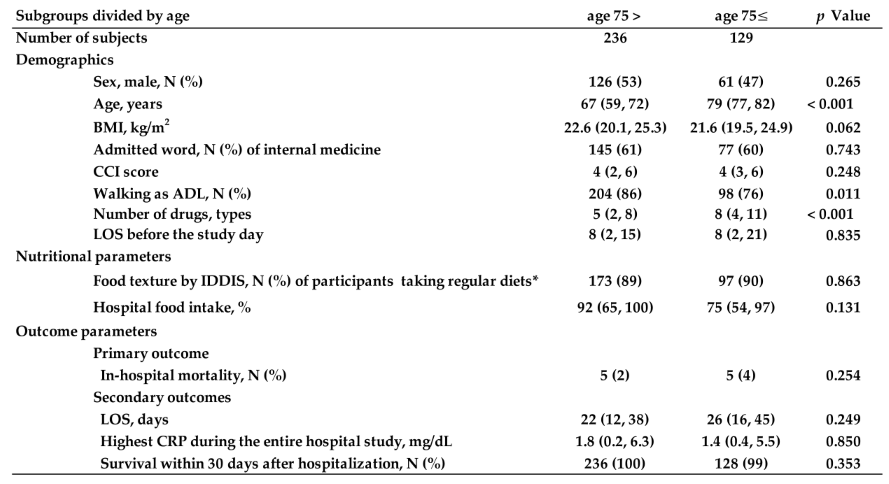 |
Table 3.
Results of hospital food consumption of cutoff value set at 50% in session 2.5.. In the results of setting the cutoff of hospital food intake at 50% in session 2.5., CCI, ADL of walking ability, in-hospital mortality, and the highest CRP during hospitalization were all worse in patients with less than each cutoff. Abbreviations, ADL: Activity of Daily Living, BMI: Body Mass Index, CCI: Charlson Comorbidity Index, CRP: C-reactive protein, IDDSI: International Dysphagia Diet Standardisation Initiative, LOS: Length of stay in hospital.
Table 3.
Results of hospital food consumption of cutoff value set at 50% in session 2.5.. In the results of setting the cutoff of hospital food intake at 50% in session 2.5., CCI, ADL of walking ability, in-hospital mortality, and the highest CRP during hospitalization were all worse in patients with less than each cutoff. Abbreviations, ADL: Activity of Daily Living, BMI: Body Mass Index, CCI: Charlson Comorbidity Index, CRP: C-reactive protein, IDDSI: International Dysphagia Diet Standardisation Initiative, LOS: Length of stay in hospital.
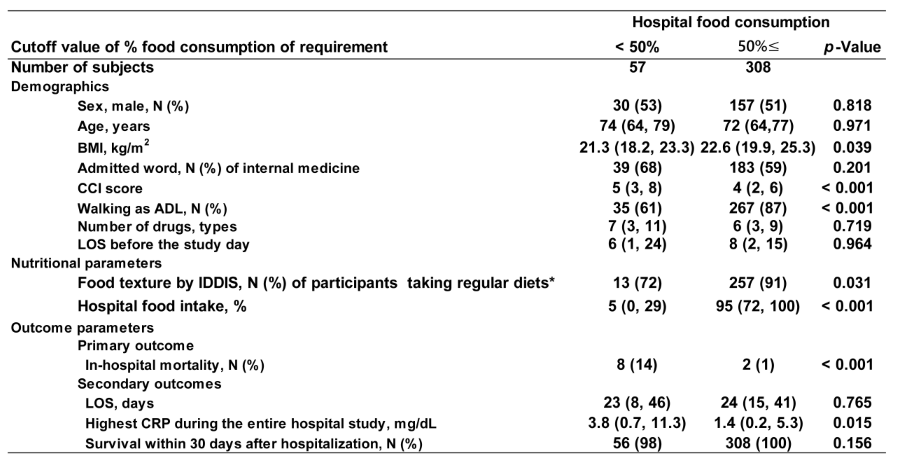 |
Table 4.
Results of hospital food consumption of cutoff value set at 75% in session 2.5.. In the results of setting the cutoff of hospital food intake at 75%, The same results were shown like Table 3. Comparing these two results of session 2.5., setting the cutoff at 75% is expected to provide earlier identification of malnutrition, leading to early nutritional intervention and improved outcome. Abbreviations, ADL: Activity of Daily Living, BMI: Body Mass Index, CCI: Charlson Comorbidity Index, CRP: C-reactive protein, IDDSI: International Dysphagia Diet Standardisation Initiative, LOS: Length of stay in hospital.
Table 4.
Results of hospital food consumption of cutoff value set at 75% in session 2.5.. In the results of setting the cutoff of hospital food intake at 75%, The same results were shown like Table 3. Comparing these two results of session 2.5., setting the cutoff at 75% is expected to provide earlier identification of malnutrition, leading to early nutritional intervention and improved outcome. Abbreviations, ADL: Activity of Daily Living, BMI: Body Mass Index, CCI: Charlson Comorbidity Index, CRP: C-reactive protein, IDDSI: International Dysphagia Diet Standardisation Initiative, LOS: Length of stay in hospital.
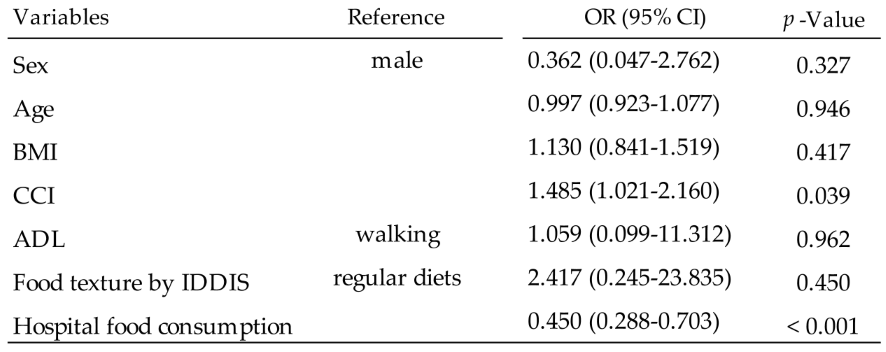 |
Table 5.
Results of logistic regression analysis to find factors associated with In-Hospital mortality. Among the seven variants analyzed, CCI and in-hospital food consumption were significant OR with a significant p-value. Abbreviations, ADL: Activity of Daily Living, BMI: Body Mass Index, CCI: Charlson Comorbidity Index, CI: confidence interval, IDDSI: International Dysphagia Diet Standardisation Initiative, OR: odds ratio.
Table 5.
Results of logistic regression analysis to find factors associated with In-Hospital mortality. Among the seven variants analyzed, CCI and in-hospital food consumption were significant OR with a significant p-value. Abbreviations, ADL: Activity of Daily Living, BMI: Body Mass Index, CCI: Charlson Comorbidity Index, CI: confidence interval, IDDSI: International Dysphagia Diet Standardisation Initiative, OR: odds ratio.
 |
Table 6.
Results of logistic regression analysis to find factors associated with in-hospital food consumption less than 75% of requirement. Among the six variants analyzed, CCI was a significant OR with a significant p-value. Abbreviations, ADL: Activity of Daily Living, BMI: Body Mass Index, CCI: Charlson Comorbidity Index, CI: confidence interval, IDDSI: International Dysphagia Diet Standardisation Initiative, OR: odds ratio.
Table 6.
Results of logistic regression analysis to find factors associated with in-hospital food consumption less than 75% of requirement. Among the six variants analyzed, CCI was a significant OR with a significant p-value. Abbreviations, ADL: Activity of Daily Living, BMI: Body Mass Index, CCI: Charlson Comorbidity Index, CI: confidence interval, IDDSI: International Dysphagia Diet Standardisation Initiative, OR: odds ratio.
 |
Disclaimer/Publisher’s Note: The statements, opinions and data contained in all publications are solely those of the individual author(s) and contributor(s) and not of MDPI and/or the editor(s). MDPI and/or the editor(s) disclaim responsibility for any injury to people or property resulting from any ideas, methods, instructions or products referred to in the content. |
© 2024 by the authors. Licensee MDPI, Basel, Switzerland. This article is an open access article distributed under the terms and conditions of the Creative Commons Attribution (CC BY) license (http://creativecommons.org/licenses/by/4.0/).
Copyright: This open access article is published under a Creative Commons CC BY 4.0 license, which permit the free download, distribution, and reuse, provided that the author and preprint are cited in any reuse.


