Submitted:
29 June 2024
Posted:
02 July 2024
You are already at the latest version
Abstract
Transportation contributes significantly to greenhouse gas emissions, with electrification offering a promising solution. This study evaluates the degradation of State of Health (SOH) over 2.5 years for electrified buses under different charging protocols: DC Fast charging and Flash charging. The vehicles’ models, charging protocols, and financial implications are discussed. High-level simulations reveal that after 2.5 years, the Flash charging vehicle’s SOH reaches 88.93%, while the DC fast charging vehicle reaches 89.46%, showing a 0.47% difference. This slight variance is attributed to Flash charging vehicles avoiding full charge/discharge cycles, reducing battery aging impact.
Considering this minimal SOH degradation difference, the choice between DC Fast charging and Flash charging primarily hinges on capital expenditure disparities. Flash charging, with its lower initial battery capacity and reduced capital costs, presents a compelling alternative for city busoperators seeking to electrify their fleets.
Keywords:
Electric Buses
; DC Fast Charging
; Flash Charging
; Battery Health
; State of Health
; State of Charge
; Lithium-ion batteries
1. Introduction
Transportation contributes significantly to greenhouse gas (GHG) emissions, accounting for 28% of the total GHG emissions in the United States [1]. Electrification of buses, especially in urban settings, presents a viable solution to mitigate these emissions. Among sustainable electric transit buses, three popular types are the electric trolley bus, fuel cell electric bus, and battery electric bus (BEB) [2]. However, the electric trolley bus is less practical due to the expensive catenary system, and the fuel cell electric bus encounters issues with hydrogen production, storage, and transportation. Therefore, the battery electric bus stands out as the most advantageous option. [2].
Battery electric buses can employ various onboard battery systems, including pure battery systems, small batteries with large supercapacitors, large batteries with small supercapacitors, and pure supercapacitors [2]. Studies show that a system powered solely by on-board batteries is the most energy-efficient. Throughout their lifecycle, pure battery electric buses can lower CO2 emissions by over 19% compared to diesel buses[2]. Charging strategies for BEBs include overnight, opportunity, and flash charging. Overnight charging occurs during non-operational hours, minimizing the impact on the electrical grid. Opportunity charging provides power for several minutes at terminals, while flash charging supplies power for a few seconds at each stop, best satisfying operational demands. However, flash charging can lead to increased costs due to high electricity demand charges [2].
One of the main challenges in integrating battery electric buses into bus fleets is scheduling battery charging while taking into account route timing constraints and battery charge levels. [3]. To address this, innovative solutions such as the standby bus concept are proposed [4]. In this approach, a bus with a low battery is driven to a charging station, and its passengers are moved to a fully charged backup bus, ensuring uninterrupted service. After recharging, the original bus then serves as the standby bus. [4].
The charging of e-bus batteries can impact the peak demand on the main grid, particularly when multiple batteries are charged simultaneously, potentially leading to increased energy costs. To mitigate this, battery swapping at charging stations can be employed instead of conventional charging methods [5]. In the context of electrification of buses in city driving conditions, DC Fast charging or Flash charging are viable charging options. Vehicles compatible with DC fast charging have larger battery sizes that support vehicle operation throughout the day, and are charged at night using fast charging stations that are compatible with the combined charging system (CCS), Tesla Supercharger, or CHadeMO connector [6]. On the contrary, vehicles compatible with Flash charging protocols have smaller battery sizes and are charged at passenger alighting points using overhead pantographs compatible with the SAEJ3105 charging standard [7].
This paper evaluates the state of health (SOH) degradation over a 2.5 year period for electrified buses, comparing DC fast charging and flash charging protocols. By capturing the differences, the study aims to provide city bus operators with informed recommendations for advancing the electrification of bus fleets. The subsequent sections will detail the high-level protocol and vehicle modeling aspects, discuss the specifics of the charging protocols, and examine the financial implications in terms of capital and operational expenditures.
2. Literature Review
As mentioned in the introduction, there are various studies related to the topic of electric buses. In [8], J. Whitaker et al. created a scheduling framework to balance the use of slow and fast chargers, with fixed bus routes and charger locations. They developed a constrained network flow Mixed-Integer Linear Program (MILP) to optimize charger scheduling and determine the required number of chargers to maintain battery state of charge thresholds. By applying their method to a randomly generated schedule for thirty buses, the results demonstrated that their approach could identify optimal charging plans while accounting for time-of-use (TOU) costs. This method worked for both fixed and variable numbers of chargers. The optimal plans achieved cost reductions of up to 20.9% compared to a threshold-based plan and up to 12.3% compared to an optimal strategy that disregards TOU costs.To assist municipalities and transit authorities in making informed decisions about electrifying their transit bus systems, M. Kharouf et al. [2] developed a mixed-integer linear programming model. This model aims to determine the optimal electrification strategy by considering the actual bus operation schedule and electric utility demand charges. It identifies the ideal battery size for each bus, the type and distribution of fast charging infrastructure, and the capacity and location of energy storage systems. Additionally, the model evaluates the best combination of flash and opportunity charging modes.A novel dynamic approach for transitioning a battery electric bus (BEB) fleet, which incorporates the perspectives of both stakeholders, is proposed in [3]. This approach involves several stages, beginning with the input stage that determines the optimal depot location, fleet size, and charging infrastructure. It also establishes the charging schedules and route assignments.B. Zeng et al.[4] examined the issue of scheduling electric buses and planning charging infrastructure, considering constraints such as service levels, battery power limitations, and charging capacity. Their proposed model is nonlinear integer programming, which they later converted into a mixed integer linear programming (MILP) model for efficient solving using commercial solvers like CPLEX. Results from case studies indicate that replacing buses can enhance the operational efficiency of the EB system compared to battery swapping. For instance, charger utilization rates may increase by 14.3%, while passengers’ travel time and total costs could decrease by 15.5% and 7.75%, respectively.In[5], the battery swapping method is employed to devise the most efficient schedule for charging E-bus batteries, considering energy costs and the peak-to-average ratio (PAR). These E-bus battery swapping stations incorporate photovoltaic (PV) power generation. To identify optimal conditions, three metaheuristic algorithms are utilized: the binary bat algorithm (BBA), whale optimization algorithm (WOA), and grey wolf optimizer (GWO). Simulation results indicate that integrating an optimal battery charging schedule with a PV power generation system in an E-bus battery swapping station can notably lower energy costs and the Peak-to-Average Ratio (PAR) compared to standard battery charging methods used at charging stations. G. Ferro et al.[9] addressed an optimization problem centered on planning service stations for recharging a fleet of electric buses (EBs) used in public transportation. This task involves choosing appropriate sites for stations from a predefined list of eligible locations and determining their capacity, including the number of sockets and maximum output power. Furthermore, the optimization problem considers assigning different bus lines to the activated stations and determining the size of the bus fleet. In [10], the study examines the Hess-ABB Tosa, an 18-meter bus equipped by ABB with a comprehensive traction system, optimized with an onboard charger, a 40kWh energy-storage unit, and an automatic energy transfer system at stops. Along its route of 1.8 km, there are two recharge points: the Flash Station at Palexpo, providing a power supply of 400kW for 15 seconds, and a second station at the airport, where a power supply of 200kW is applied for 3-4 minutes. In the literature review, it is evident that no study has compared various charging methods regarding their impact on battery life. This paper aims to bridge this gap by evaluating the State of Health (SoH) of batteries after undergoing identical drive cycles over a 2.5-year period. We also compare the financial aspects of Flash and DC fast charging stations.
3. High-Level Simulation Description and Vehicle Modeling
Figure 1 shows the simulation protocol that is used to establish the difference in degradation for both the protocols. At first, the two vehicles are modeled differently in terms of their battery size and vehicle mass. Since the DC fast charging bus requires a larger capacity, it requires additional weight, and is converse for the Flash charging bus. The vehicle dynamics simulation parameters are consolidated in Table. 1 The battery voltage for both the buses is 800 V; the DC fast charging bus has a battery capacity of 325 kWh, while the Flash charging bus has a battery capacity of 81.25 kWh, which reduces its vehicle mass by 1.5 tonnes. At a single day’s level, both the buses are run through a Manhattan drive cycle sequentially for 18 hours. The DC fast charging vehicle is run through a constant current-constant voltage (CC-CV) charging phase at the end of the 18 hours shift. The flash charging vehicle is run through a 600 kW charging pulse for 15 seconds, at the end of each Manhattan drive cycle of 3.3 km, where the charge in the battery is replenished. Figure 2 shows the variation in the vehicle currents in both the vehicle types

Table 1.
Vehicle Dynamics Parameters of the DC Fast and Flash Charging buses.
| Parameter | Unit | DC Fast Charging Bus | Flash Charging Bus |
|---|---|---|---|
| Vehicle Mass | kg | 15500 | 14000 |
| Wheel Diameter | inches | 39.60629921 | 39.60629921 |
| Density of Air | kg/m3 | 1.2754 | 1.2754 |
| Coefficient of Drag | 0.65 | 0.65 | |
| Front Contact Area m2 | 7.8 | 7.8 | |
| Gear Ratio | 4 | 4 | |
| Pack Capacity | kWh | 325 | 81.25 |
| Energy Density | kWh/kg | 0.16 | 0.16 |
| Battery Weight | kg | 2031.25 | 507.81 |
4. Types of Charging Protocols
4.1. DC Fast Charging
The installation of fast charging stations in the power market is fast increasing, which has a variety of negative and beneficial effects on the grid, environment, and economy [11]. The benefits of FCS on distributed grid systems include the use of V2G technologies, increased economy, and stable electricity during peak hours [12]. However, negative impacts such as impulsive EV fleet load, higher power density FCS, reduced voltage stability, decreased power, and quality, increase in sudden charging demand, more losses, and reduced battery life (due to heating/overloading) of power transformers can have an impact on various operating constraints [12]. The full driving range of an ICE car can be restored in a matter of minutes by replacing the fuel tank. With charging speeds of up to 350 kW [13], fast charging aims to close this gap. Because fast charging is associated with lower range anxiety among consumers, its availability is projected to lead to increasing EV adoption [14]. Because fast charging generates a large amount of heat in battery cells, care must be taken to keep the cell temperature within an acceptable range and the temperature uniformity within an acceptable limit in order to minimise cell degradation and prevent thermal runaway [15]. Advances in power electronics, battery packaging, and management have allowed charging times to be reduced. New standards are required for equipment capable of providing this charging power. CHAdeMO, one of the fast charger standard groups, has developed a next-generation ultra-high-power charging standard for this purpose [6]. OppCHARGE is another charge connection standard established for e-buses that is becoming more popular in Europe [16]. Overall, fast charging is a vital component in making EVs more practical and appealing to a larger spectrum of consumers. To become a feasible and sustainable choice for electric vehicle owners, advancements in charging infrastructure, battery technology, and grid integration are required. There are many different fast charging stations in Table 2, and three important ones are provided:
There are many charging protocols for lithium-ion cells, but the standard one is constant current constant voltage (CCCV) charging. In this protocol, first, the cell is charged with a constant current (Ich) until the voltage of the cell reaches the voltage that is intended for charging (Vch). Following this, the cell voltage (Vch) is kept constant, which causes the charging current to decrease gradually. This phase ends when the charging current drops below a predefined threshold (Iend) or when a set maximum charging time (tmax) is surpassed. It is also referred to as the constant voltage (CV) phase. Ich mostly influences the charging process’s speed, whilst Vch and Iend control the capacity utilization. The charging profile used in our case is provided below:
Figure 3.
CC-CV DC Fast Charging Profile at 250 kW peak charging power.
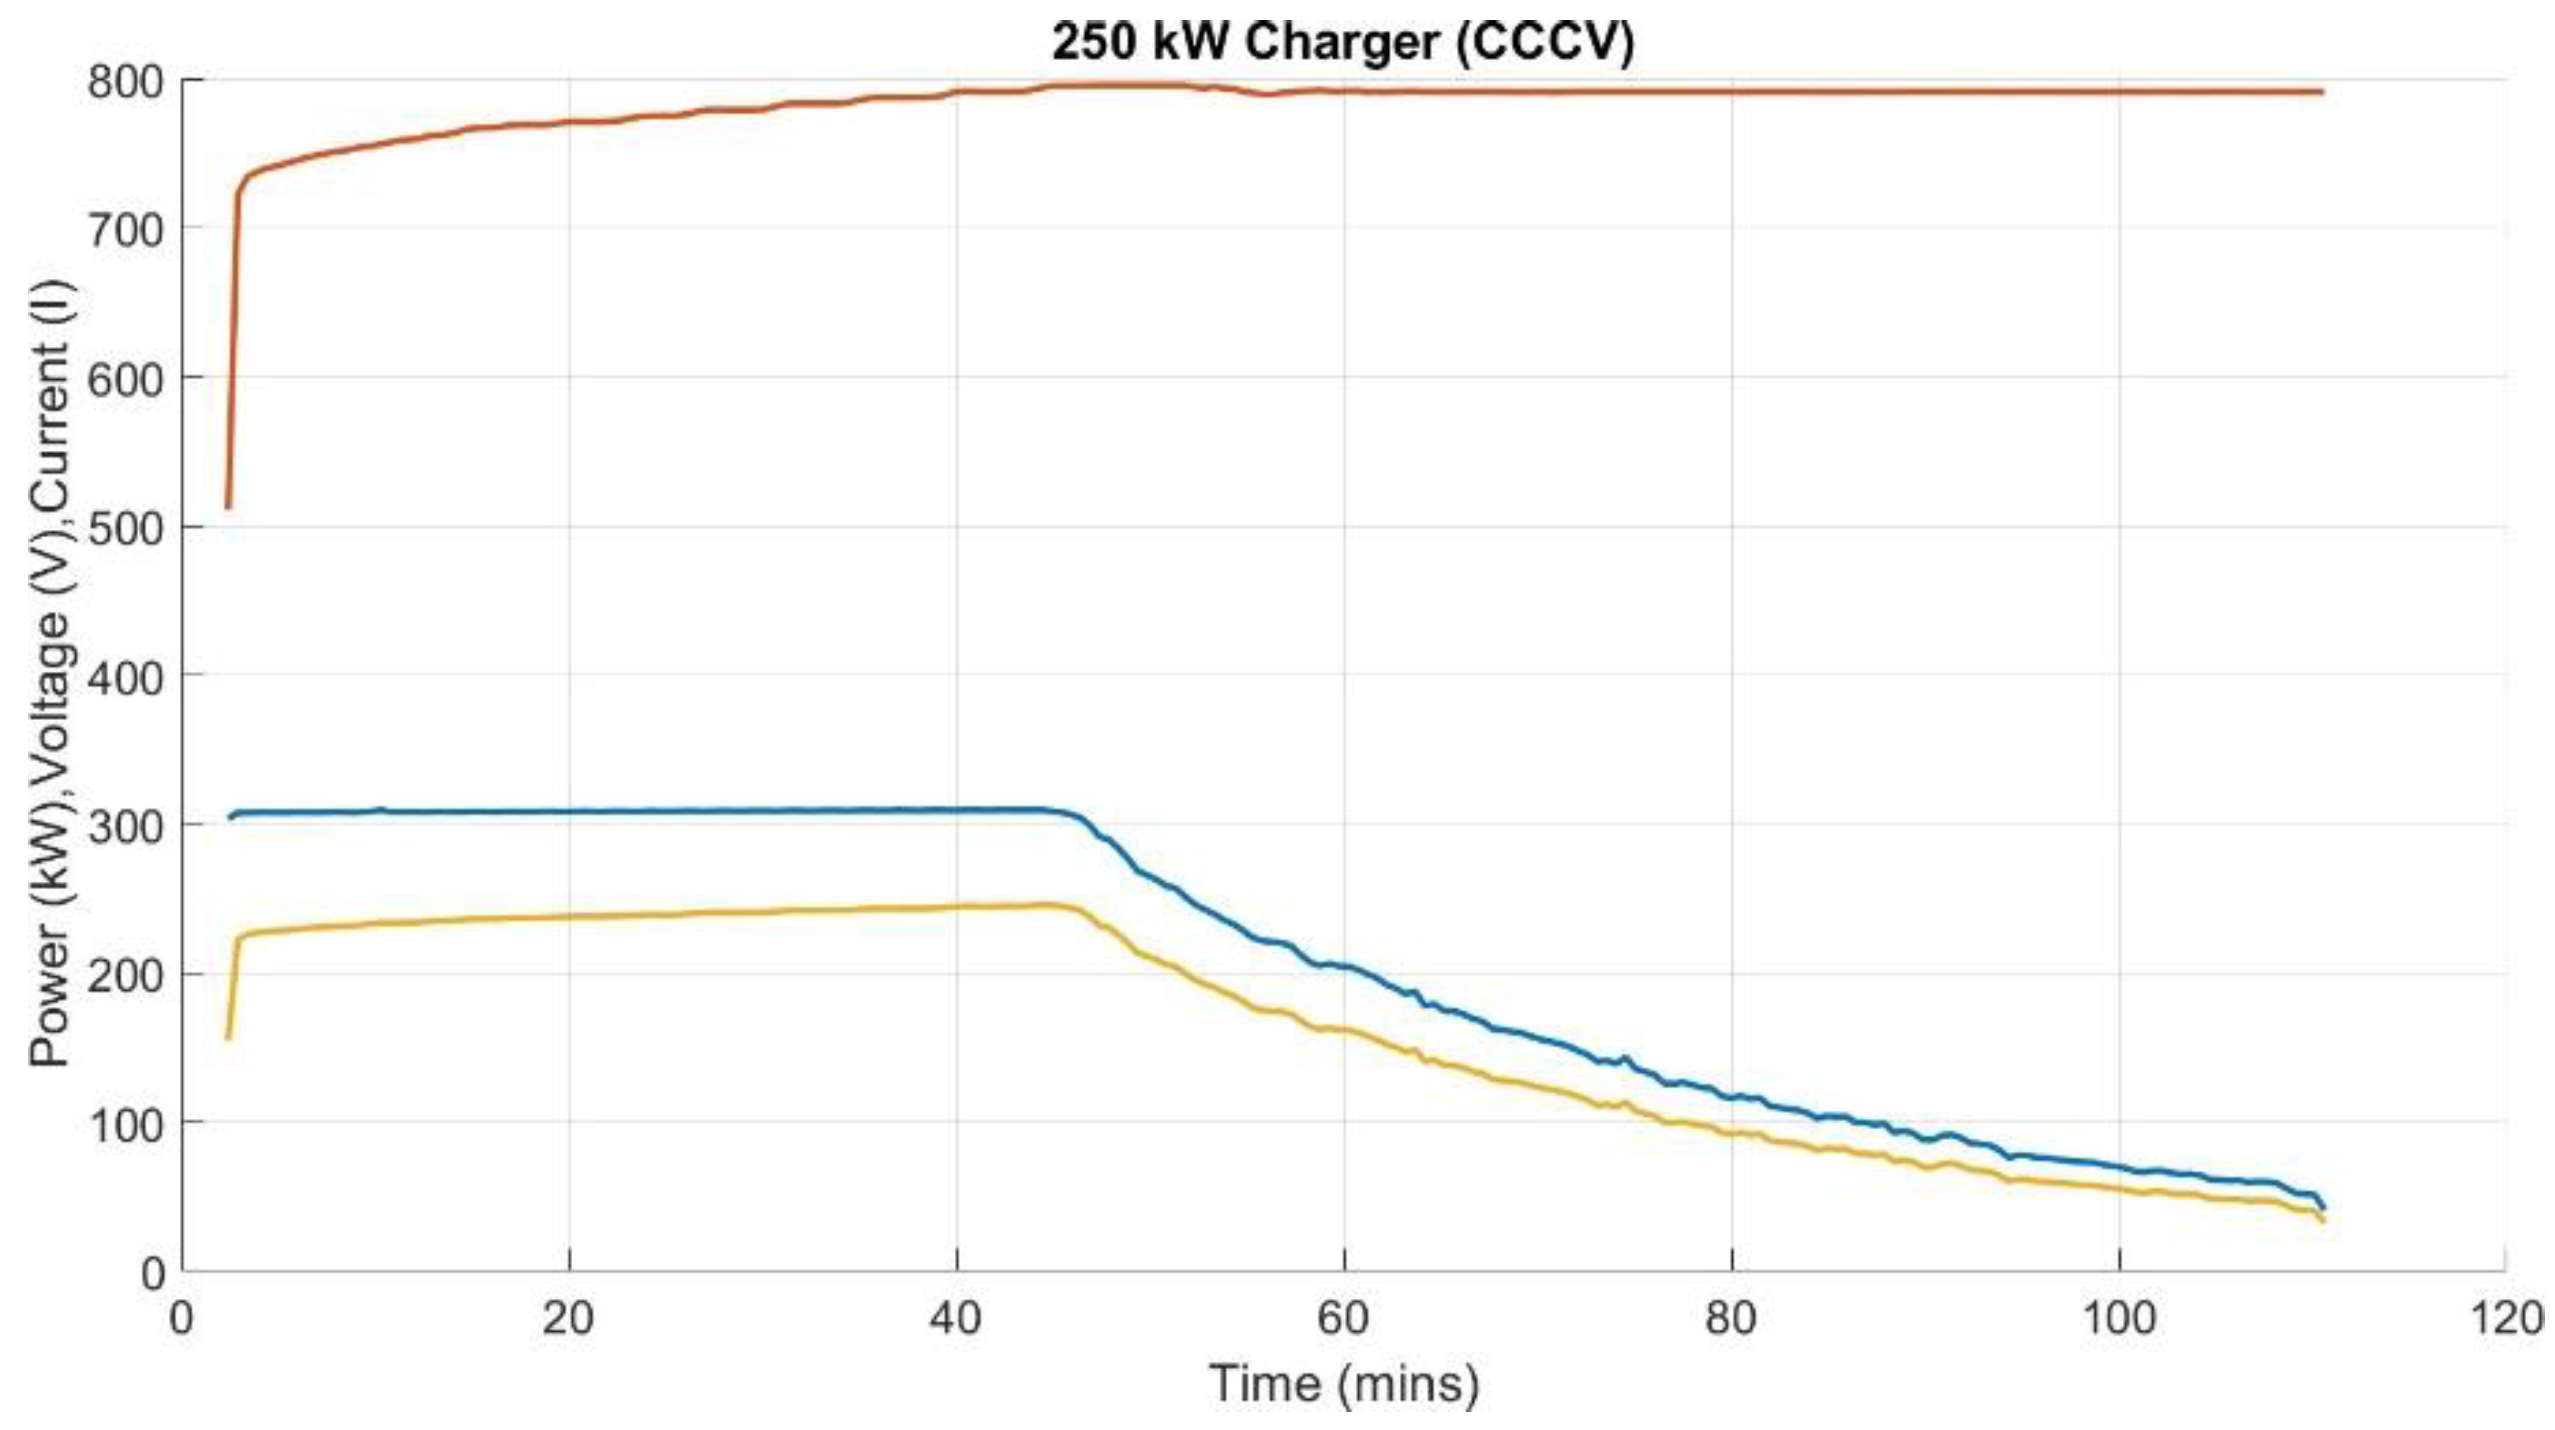
The voltage of the battery pack is shown in the red line, and the current is shown in the blue line. In this profile, Ich is equal to 308 A, and it keeps flowing for almost 45 minutes until the voltage of the pack reaches its nominal value (780 V). Maximum power which is considered for this charger is equal to 250 kW. The power curve is shown as well. As can be seen, the charger reaches its maximum power, at the end of constant current mode.
4.2. Flash Charging
Flash charging is one of the fast charging methods that delivers high power (around 600kW) into the electric bus battery in a very short time (15-20 s). This has negative effects on the distribution network by increasing the ”high peak short-term demand” on the power grid [20]. Conventionally, electric bus technology requires charging the buses overnight at the depot. After a successful trial run of their electric bus system, TOSA, ABB and its partners have unveiled a substitute. At specified stops and the terminal station, the buses can quickly recharge in 15 seconds instead of depending on overhead lines [21]. The TOSA project, which stretched from the Geneva airport to the Palexpo exhibition centre, was completed in Switzerland. In this instance, the charging power and time were 600 kW and 20 seconds, respectively. With its 69kWh battery, the bus’s capacity was around one-third that of a typical electric bus. Each driving cycle had a distance of 12 km, 50 stops, and 13 flash charging stations in total [22]. Rechargeable TOSA buses are novel in that they can carry a large number of passengers (133 passengers) and run solely on electricity, which means that overhead wires are not required. On top of the buses are small, light batteries that are part of the equipment. A robotic arm on the roof of the bus extends automatically to connect to the overhead charging station when it reaches certain stops. This connection is made using a ”flash” charging technique, which allows for a 15-second recharge. While this corresponds to the average time for people to disembark and board, there is still enough time to accrue the energy needed to get to the next charging station at a later stop or the terminal [21]. In our case, which is Manhattan bus drive cycle, the whole cycle is 3.33 km and we considered that we have just one flash charging station at the end of the cycle.
5. Battery Modeling
A Li-ion battery’s state of health (SOH) is a major cause of concern, given that it is a limiting factor towards the usable time and performance of the end application. Considering the application of an electric vehicle, where the battery is the primary energy storage device, the range and performance (0-60 mph time, maximum speed) ratings are typical metrics that are considered during purchase of a car. With usage of the car, the range of the vehicle reduces, which is an effect of ageing of the battery. At the same time, its performance capability also diminishes, that results in limitation of the maximum power that can be drawn from the battery, and is also a result of ageing. SOH is a metric which is used to determine the available capacity of the battery pack due to ageing factors. Typically, a battery is defined to reach end of life (EOL) when the SOH degrades to 80 percent[23]. Degradation of SOH results in increase of the cell’s internal resistance, as high as 2 times its 198 nominal value at the beginning of the cell’s life [24]. When a cell reaches end of life, it is 199 typically transitioned into energy storage applications [25].
To design a battery for the EV-bus application, the battery cell should be able to sustain long hours of operation (12-18 hrs). Apart from the normal operation during the day the cell should be able to charge quickly (up to 3C rate) via DC fast charging or flash charging. Thus we need a cell that matches the above-mentioned criteria along with the high cell life. Based on these parameters we selected the A123 LiFePO4 26650 cells.
5.1. Cell Parameters
The specifications of the A123 LiFePO4 26650 are given in Table 3. The SOC-OCV relation for the A123 cell is depicted in Figure 4. The battery degrades over the period of 4000 cycles for 100 percent DOD. The battery degradation depends on the C-rate at which the cell charges and discharges as well as the ambient temperature of the cell. At higher temperatures and C-rates the battery degrades faster. The degradation of the A123 cell is given in the battery data sheet as in Figure 5.
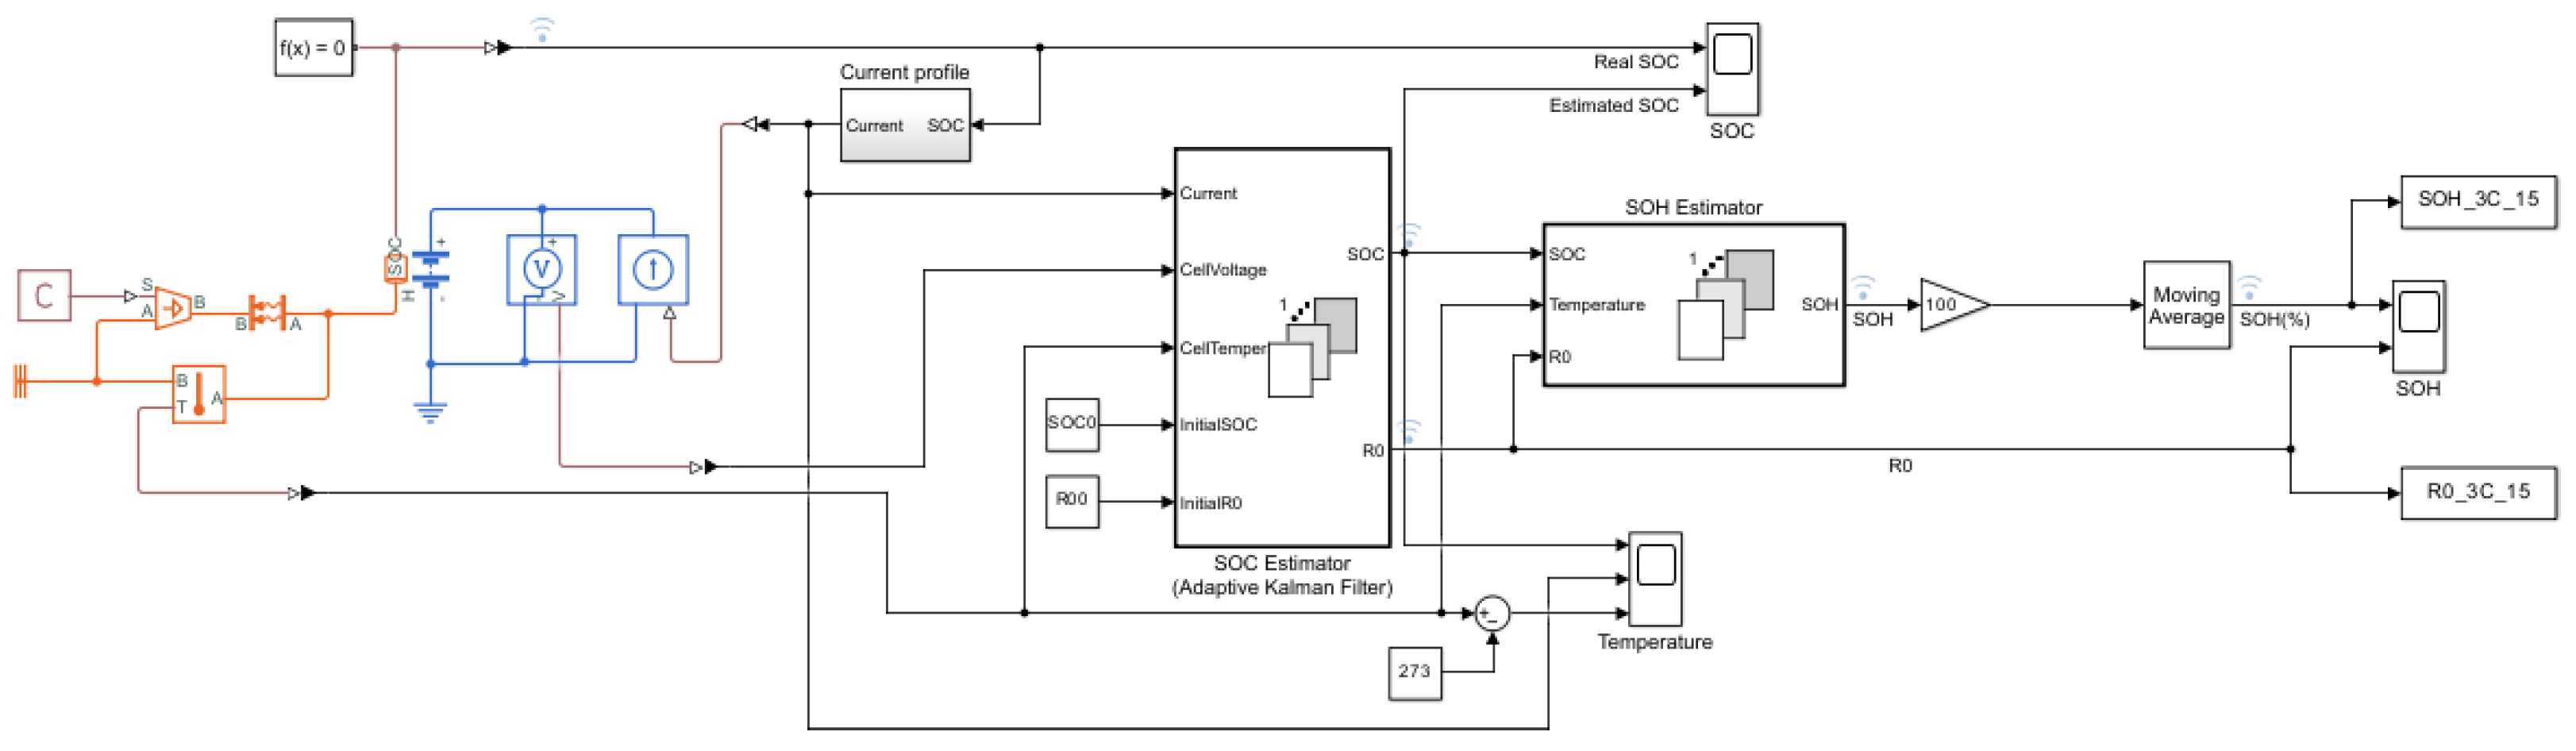
5.2. Electro-Thermal Modeling of A123 Cell
The electro-thermal model for the battery is developed in Matlab/Simulink. The model consists of electrical parameters and thermal modeling for the air cooling of the battery as shown in Figure 6. Apart from the battery, the model contains an unscented Kalman filter to estimate the battery SOC as well as series resistance (R0). The calculated SOC and R0 are then fed into the SOH estimator. Here the actual resistance of the battery is compared with the new and end-of-life battery resistances. The SOH of the battery is given in 1.
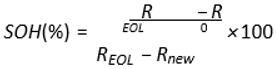
Figure 4.
The SOC-OCV curve of A123 LiFePO4 26650.
Figure 5.
A123 Battery capacity fading with number of cycles.
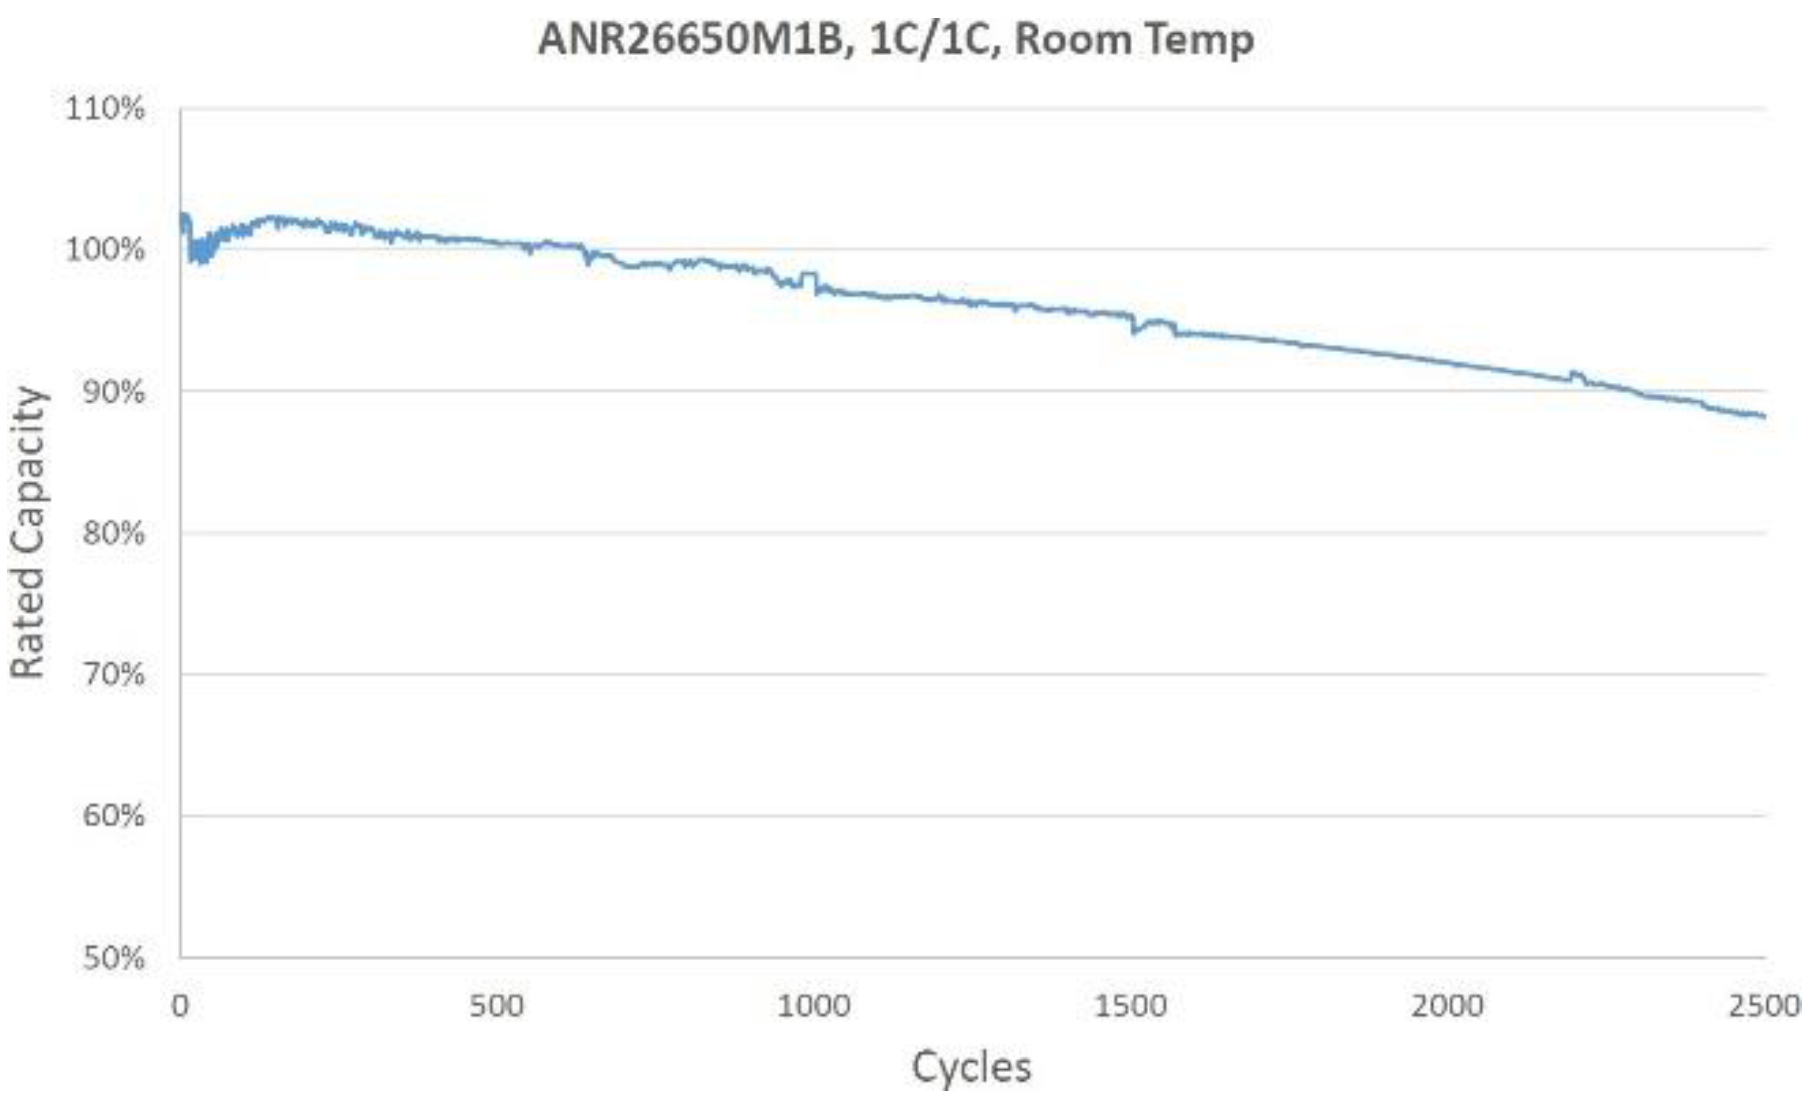
Figure 6.
Matlab A123 Model.
5.3. A123 Electrothermal Model
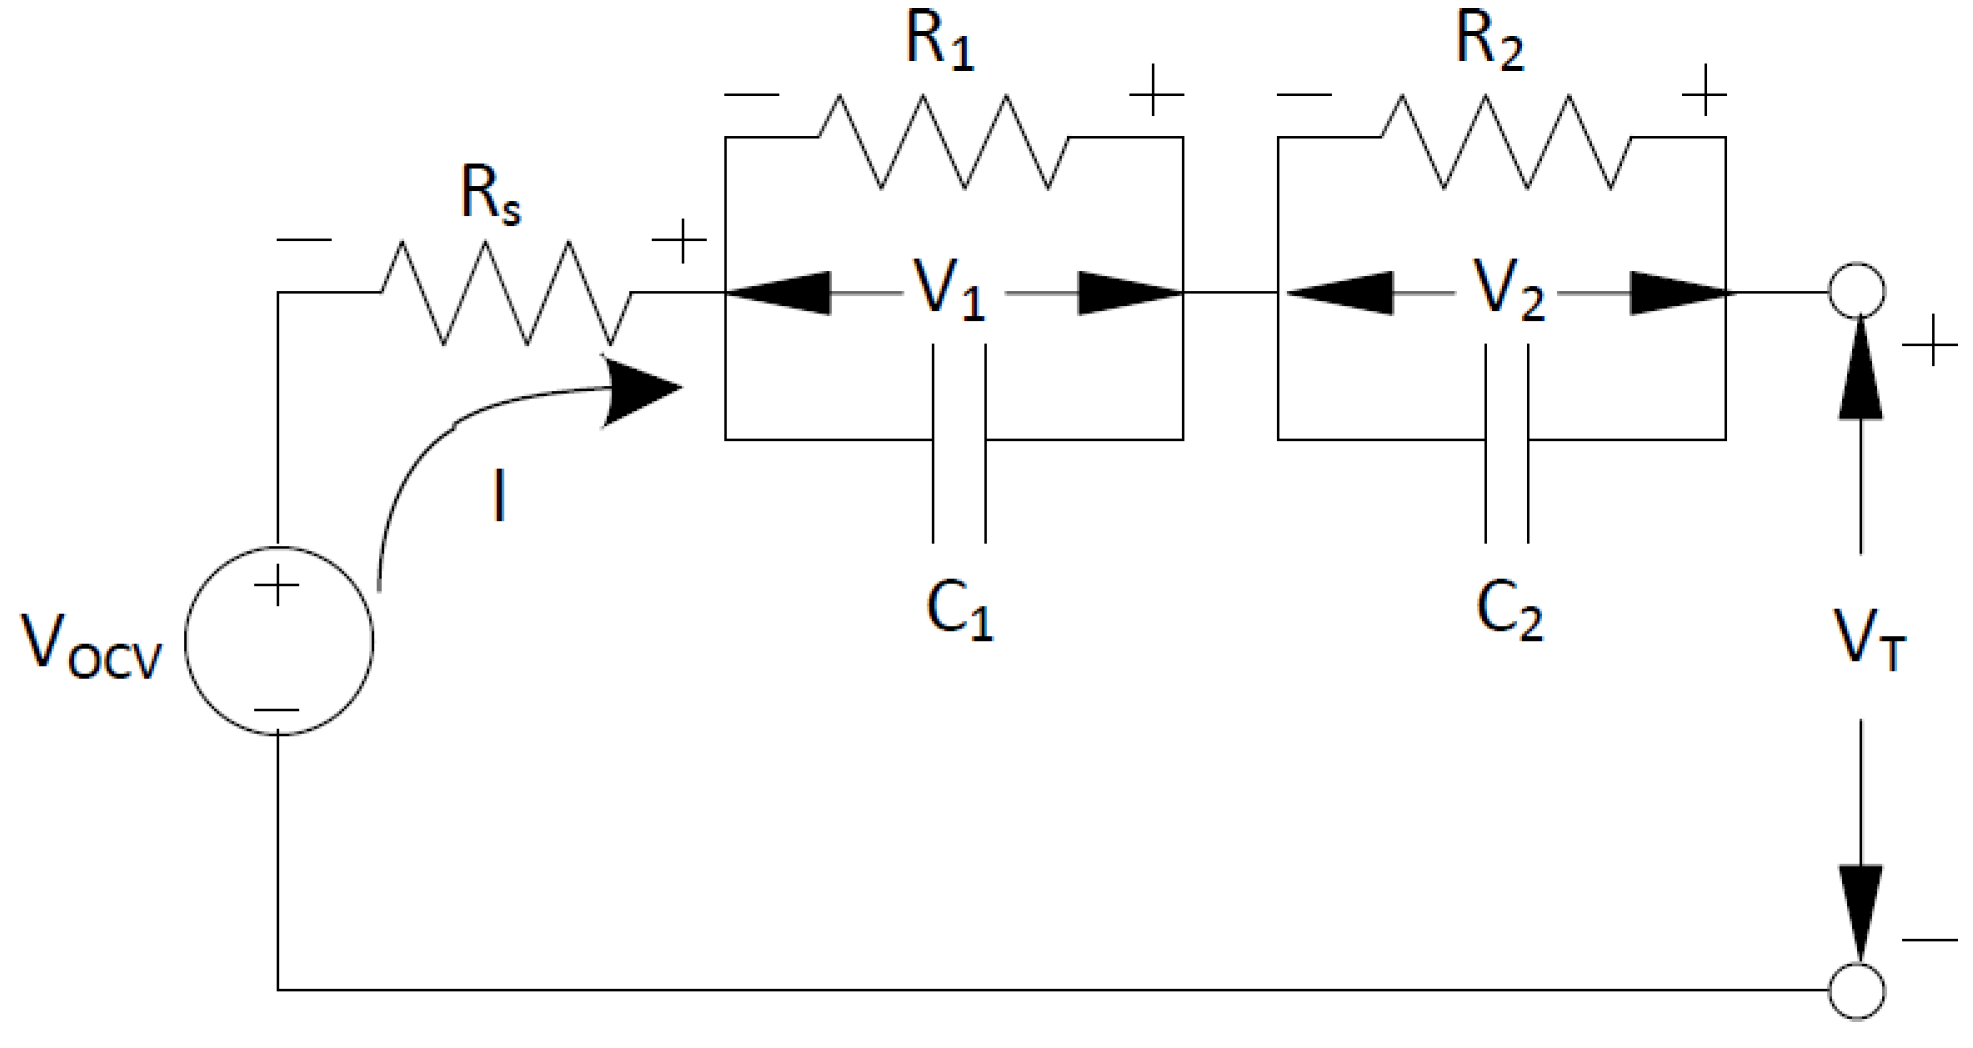
The electrothermal model specifications are given in Table 4. The lumped thermal model of the A123 cell is depicted in the IV. For the equivalent cell model, the R-RC-RC network is implemented as shown in Figure 8.
Figure 7.
Cell lumped parameter with two states representing the core and surface temperatures.
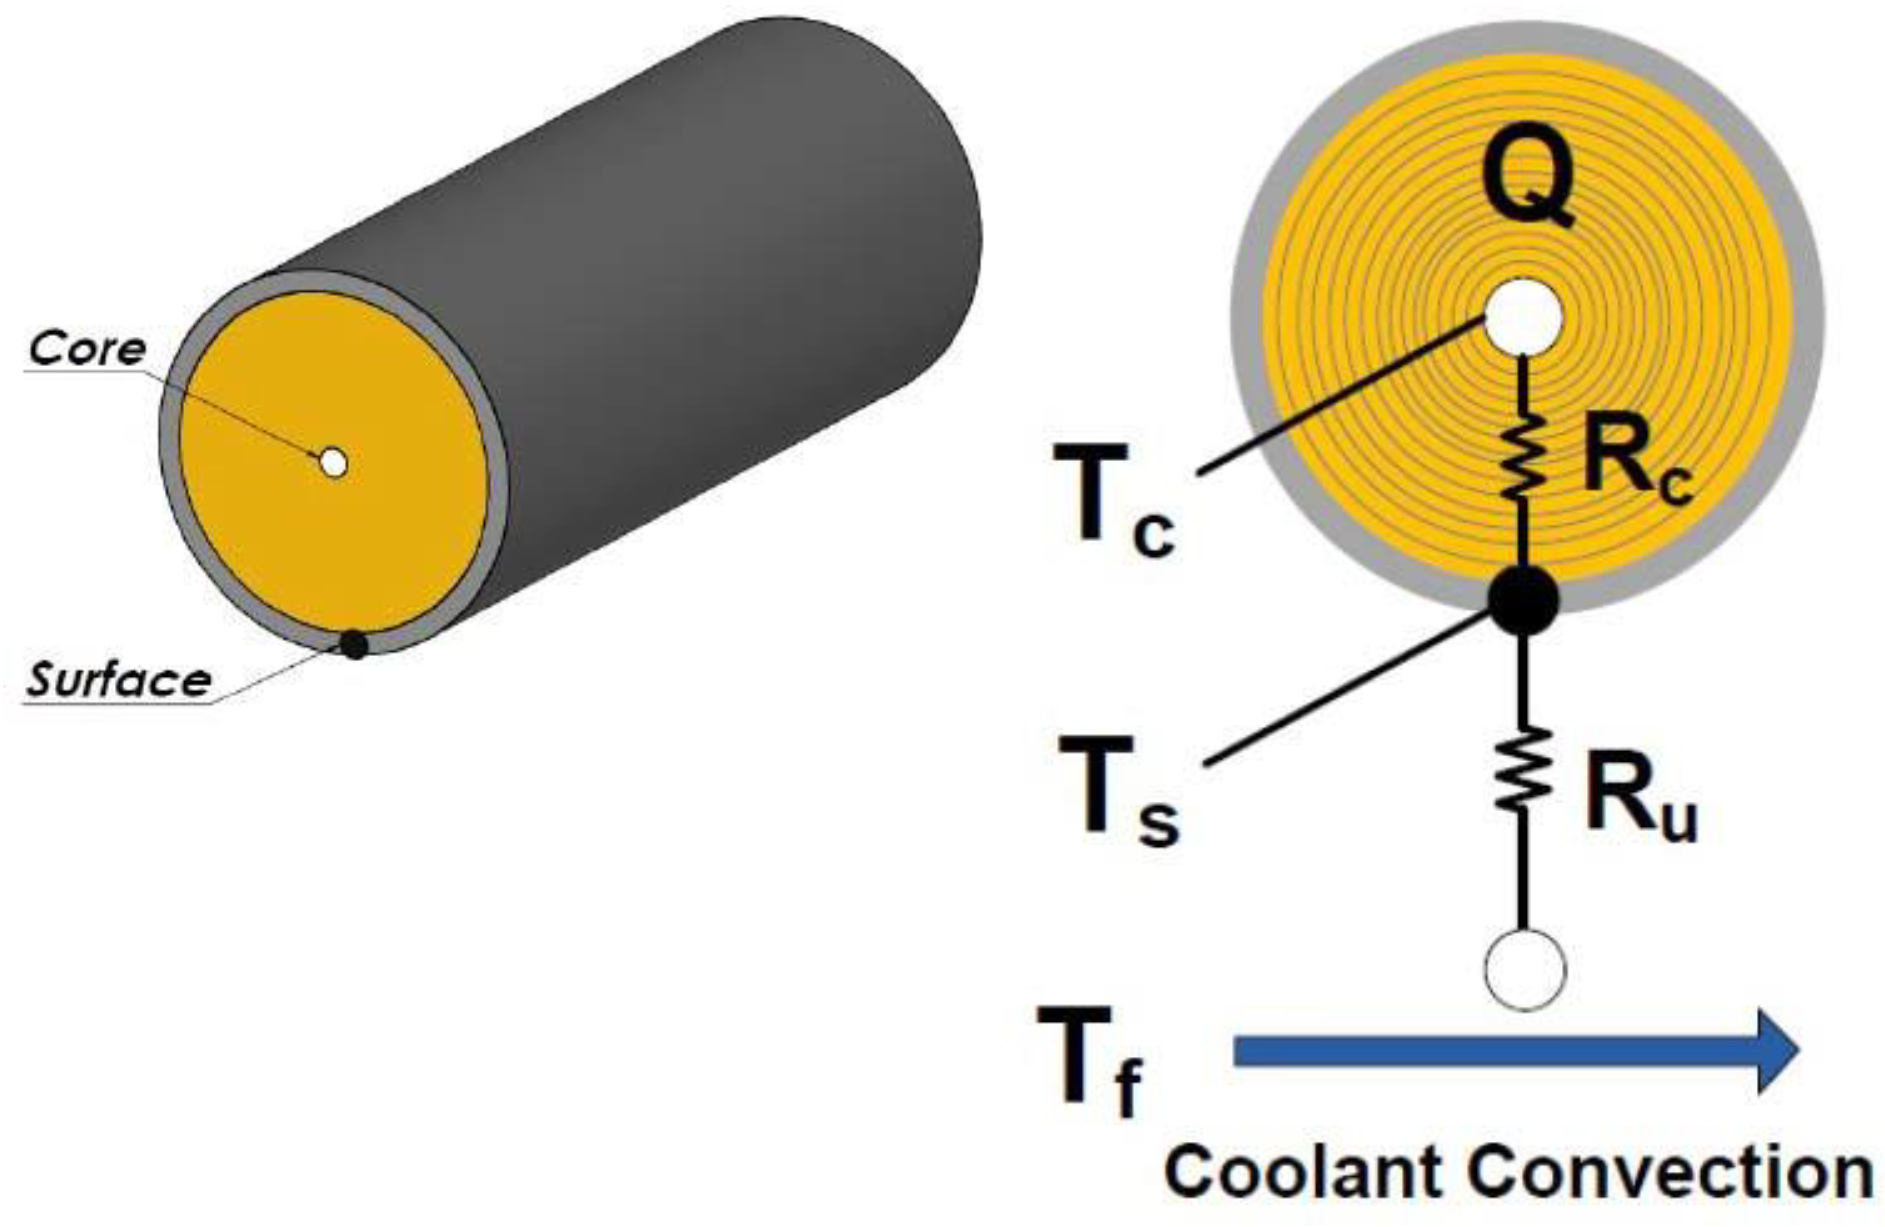
Figure 8.
Single cell equivalent model.
5.4. Simulation Results for the A123 Cells
To examine the effects of aging on the battery, the cell is tested at different temperatures and current ratings. The Matlab model charges and discharges the battery model at different C-rates and temperatures for 100 % DOD. To examine the effects of temperature on battery aging, the cell is tested for two different temperatures, 15◦C and -5◦C. The internal resistance R0 and the battery SOH are given in Figure 9 and Figure 10. As expected the internal resistance is higher for the lower temperatures, also the battery degrades faster at the higher temperatures. The cell is then tested for different C-rates at 15◦C, and the effect of different charge/discharge currents on the SOH and internal resistance (R0) is shown in Figure 11 and Figure 12.
6. Financial Aspects
First of all, we compare the cost of the battery pack in each of the buses. The battery pack in the case charged by the DC fast charger has a capacity of 325 kWh; however, in the flash charging case, it has a capacity of 82 kWh. Assuming a price of 151 dollars per kWh for manufacturing the packs [28], the cost of the battery packs is 49,075 dollars for DC fast charging and 12,382 dollar for Flash charging, respectively. For DCFC, we can break down the cost of charging into the capital cost, installation cost, and maintenance cost. The capital cost for one unit of a DC fast charger (with a power range of 150–350 kW) varies between 45,000 and over 100,000 dollars depending on the manufacturer [29]. Installation costs vary based on the complexity of your site and the amount of labor required, with an average installation cost typically ranging between 40,000 and 150,000 dollars [29]. The maintenance cost, according to the US Department of Energy [30], is up to 400 dollar annually per charger.
7. Conclusion
Figure 13 shows the SOH degradation curve in the DC fast charging and Flash charging protocols. The degradation trajectory of both methods shows that after 2.5 years, the flash charging vehicle’s SOH reaches 88.93 percent, while that of the DC fast charging vehicle reaches 88.46 percent. This amounts to a 0.47 percent difference in the SOH of both vehicles.
This is anticipated, since the Flash charging vehicle is never subjected to a full charge or discharge cycle, and the reduced depth of discharge has a lower impact from the cycling aging of the battery pack. Since the difference in SOH degradation over 2.5 years is just 0.47 percent, the capital expenditure difference between DC fast charging and Flash charging methods is the major factor in determining the choice of deployment.
References
- Poorfakhraei, A.; Narimani, M.; Emadi, A. A Review of Multilevel Inverter Topologies in Electric Vehicles: Current Status and Future Trends. IEEE Open Journal of Power Electronics 2021, 2, 155–170. [CrossRef]
- Kharouf, M.; Abdelaziz, M. Battery Electric Bus System Schedule-Based Optimization. In Proceedings of the 2021 IEEE Electrical Power and Energy Conference (EPEC). IEEE, 2021, pp. 402–407.
- Hanna, M.O.; Shaaban, M.F.; Salama, M.M. Comprehensive Transition Plan for Battery-Electric Bus Fleets Considering Utility Constraints. IEEE Transactions on Industry Applications 2023.
- Zeng, B.; Wu, W.; Ma, C. Electric bus scheduling and charging infrastructure planning considering bus replacement strategies at charging stations. IEEE Access 2023.
- Boonraksa, T.; Boonraksa, P.; Pinthurat, W.; Marungsri, B. Optimal Battery Charging Schedule for a Battery Swapping Station of an Electric Bus With a PV Integration Considering Energy Costs and Peak-to-Average Ratio. IEEE Access 2024.
- Wang, L.; Qin, Z.; Slangen, T.; Bauer, P.; van Wijk, T. Grid Impact of Electric Vehicle Fast Charging Stations: Trends, Standards, Issues and Mitigation Measures - An Overview. IEEE Open Journal of Power Electronics 2021, 2, 56–74. [CrossRef]
- Pradhan, R.; Keshmiri, N.; Emadi, A. On-Board Chargers for High-Voltage Electric Vehicle Powertrains: Future Trends and Challenges. IEEE Open Journal of Power Electronics 2023, 4, 189–207. [CrossRef]
- Whitaker, J.; Droge, G.; Hansen, M.; Mortensen, D.; Gunther, J. A Network Flow Approach to Battery Electric Bus Scheduling. IEEE Transactions on Intelligent Transportation Systems 2023, PP, 1–12. [CrossRef]
- Ferro, G.; Minciardi, R.; Parodi, L.; Robba, M. Optimal location and line assignment for electric bus charging stations. IEEE Systems Journal 2023.
- Ortenzi, F.; Orchi, S.; Pede, G. Technical and economical evalutation of hybrid flash-charging stations for electric public transport. In Proceedings of the 2017 IEEE International Conference on Industrial Technology (ICIT). IEEE, 2017, pp. 549–554.
- Ahmad, F.; Iqbal, A.; Ashraf, I.; Marzband, M.; khan, I. Optimal location of electric vehicle charging station and its impact on distribution network: A review. Energy Reports 2022, 8, 2314–2333. [CrossRef]
- ElMenshawy, M.; Massoud, A. Modular Isolated DC-DC Converters for Ultra-Fast EV Chargers: A Generalized Modeling and Control Approach. Energies 2020, 13. [CrossRef]
- F. Lambert, “Porsche is bringing its ultra-fast electric car charging stations to the us,” 2017.
- Lempert, J.; Kollmeyer, P.J.; He, M.; Haußmann, M.; Cotton, J.S.; Emadi, A. Cell selection and thermal management system design for a 5C-rate ultrafast charging battery module. Journal of Power Sources 2022, 550, 232121. [CrossRef]
- Kim, U.S.; Yi, J.; Shin, C.B.; Han, T.; Park, S. Modelling the thermal behaviour of a lithium-ion battery during charge. Journal of Power Sources 2011, 196, 5115–5121. [CrossRef]
- OppCharge, “Oppcharge - fast charging of electric vehicles,” 2023.
- ABB, “Dc fast charger fact sheet: Abb terra 53 cj charging a 2015 nissan leaf,” 2016.
- Tesla, “Tesla supercharger v3,” 2021.
- ABB, “Terra hp high power charging ul,” 2021.
- Shadnam Zarbil, M.; Vahedi, A.; Azizi Moghaddam, H.; Khlyupin, P.A. Design and Sizing of Electric Bus Flash Charger Based on a Flywheel Energy Storage System: A Case Study. Energies 2022, 15. [CrossRef]
- A.-M. Brouet, “Tosa buses power up for less,” 2018.
- ABB, “Ideal pantograph charging solution to charge fully automated electric buses. abb.com. available online: https://global.abb/group/en/technology/did-you-know/pantograph-up-for-electric-bus .” 2022.
- Atalay, S.; Sheikh, M.; Mariani, A.; Merla, Y.; Bower, E.; Widanage, W.D. Theory of battery ageing in a lithium-ion battery: Capacity fade, nonlinear ageing and lifetime prediction. Journal of Power Sources 2020, 478, 229026. [CrossRef]
- Barcellona, S.; Colnago, S.; Dotelli, G.; Latorrata, S.; Piegari, L. Aging effect on the variation of Li-ion battery resistance as function of temperature and state of charge. Journal of Energy Storage 2022, 50, 104658. [CrossRef]
- Lee, C.; Jo, S.; Kwon, D.; Pecht, M.G. Capacity-Fading Behavior Analysis for Early Detection of Unhealthy Li-Ion Batteries. IEEE Transactions on Industrial Electronics 2021, 68, 2659–2666. [CrossRef]
- “A123 LiFePO4 Specifications., https://lithiumwerksbatteries.com/lithiumwerks-anr26650m1b-3-3-volt-2-5ah-lithium-iron-phosphate-lifepo4-battery-1000/.
- “lithium-ion-battery-pack-prices,(https://about.bnef.com/blog/lithium-ion-battery-pack-prices-rise-for-first-time-to-an-average-of-151- kwh/),” 2023.
- “Price of dc fast charger station, (https://www.mckinsey.com/features/mckinsey-center-for-future-mobility/our-insights/can-public-ev-fastcharging-stations-be-profitable-in-th.
- “Maintenance costs of charging stations (https://afdc.energy.gov/fuels/electricityinfrastructuremaintenanceandoperation.html : : text = while.
Figure 1.
DC Fast and Flash Charging Evaluation Protocol for SOH degradation.
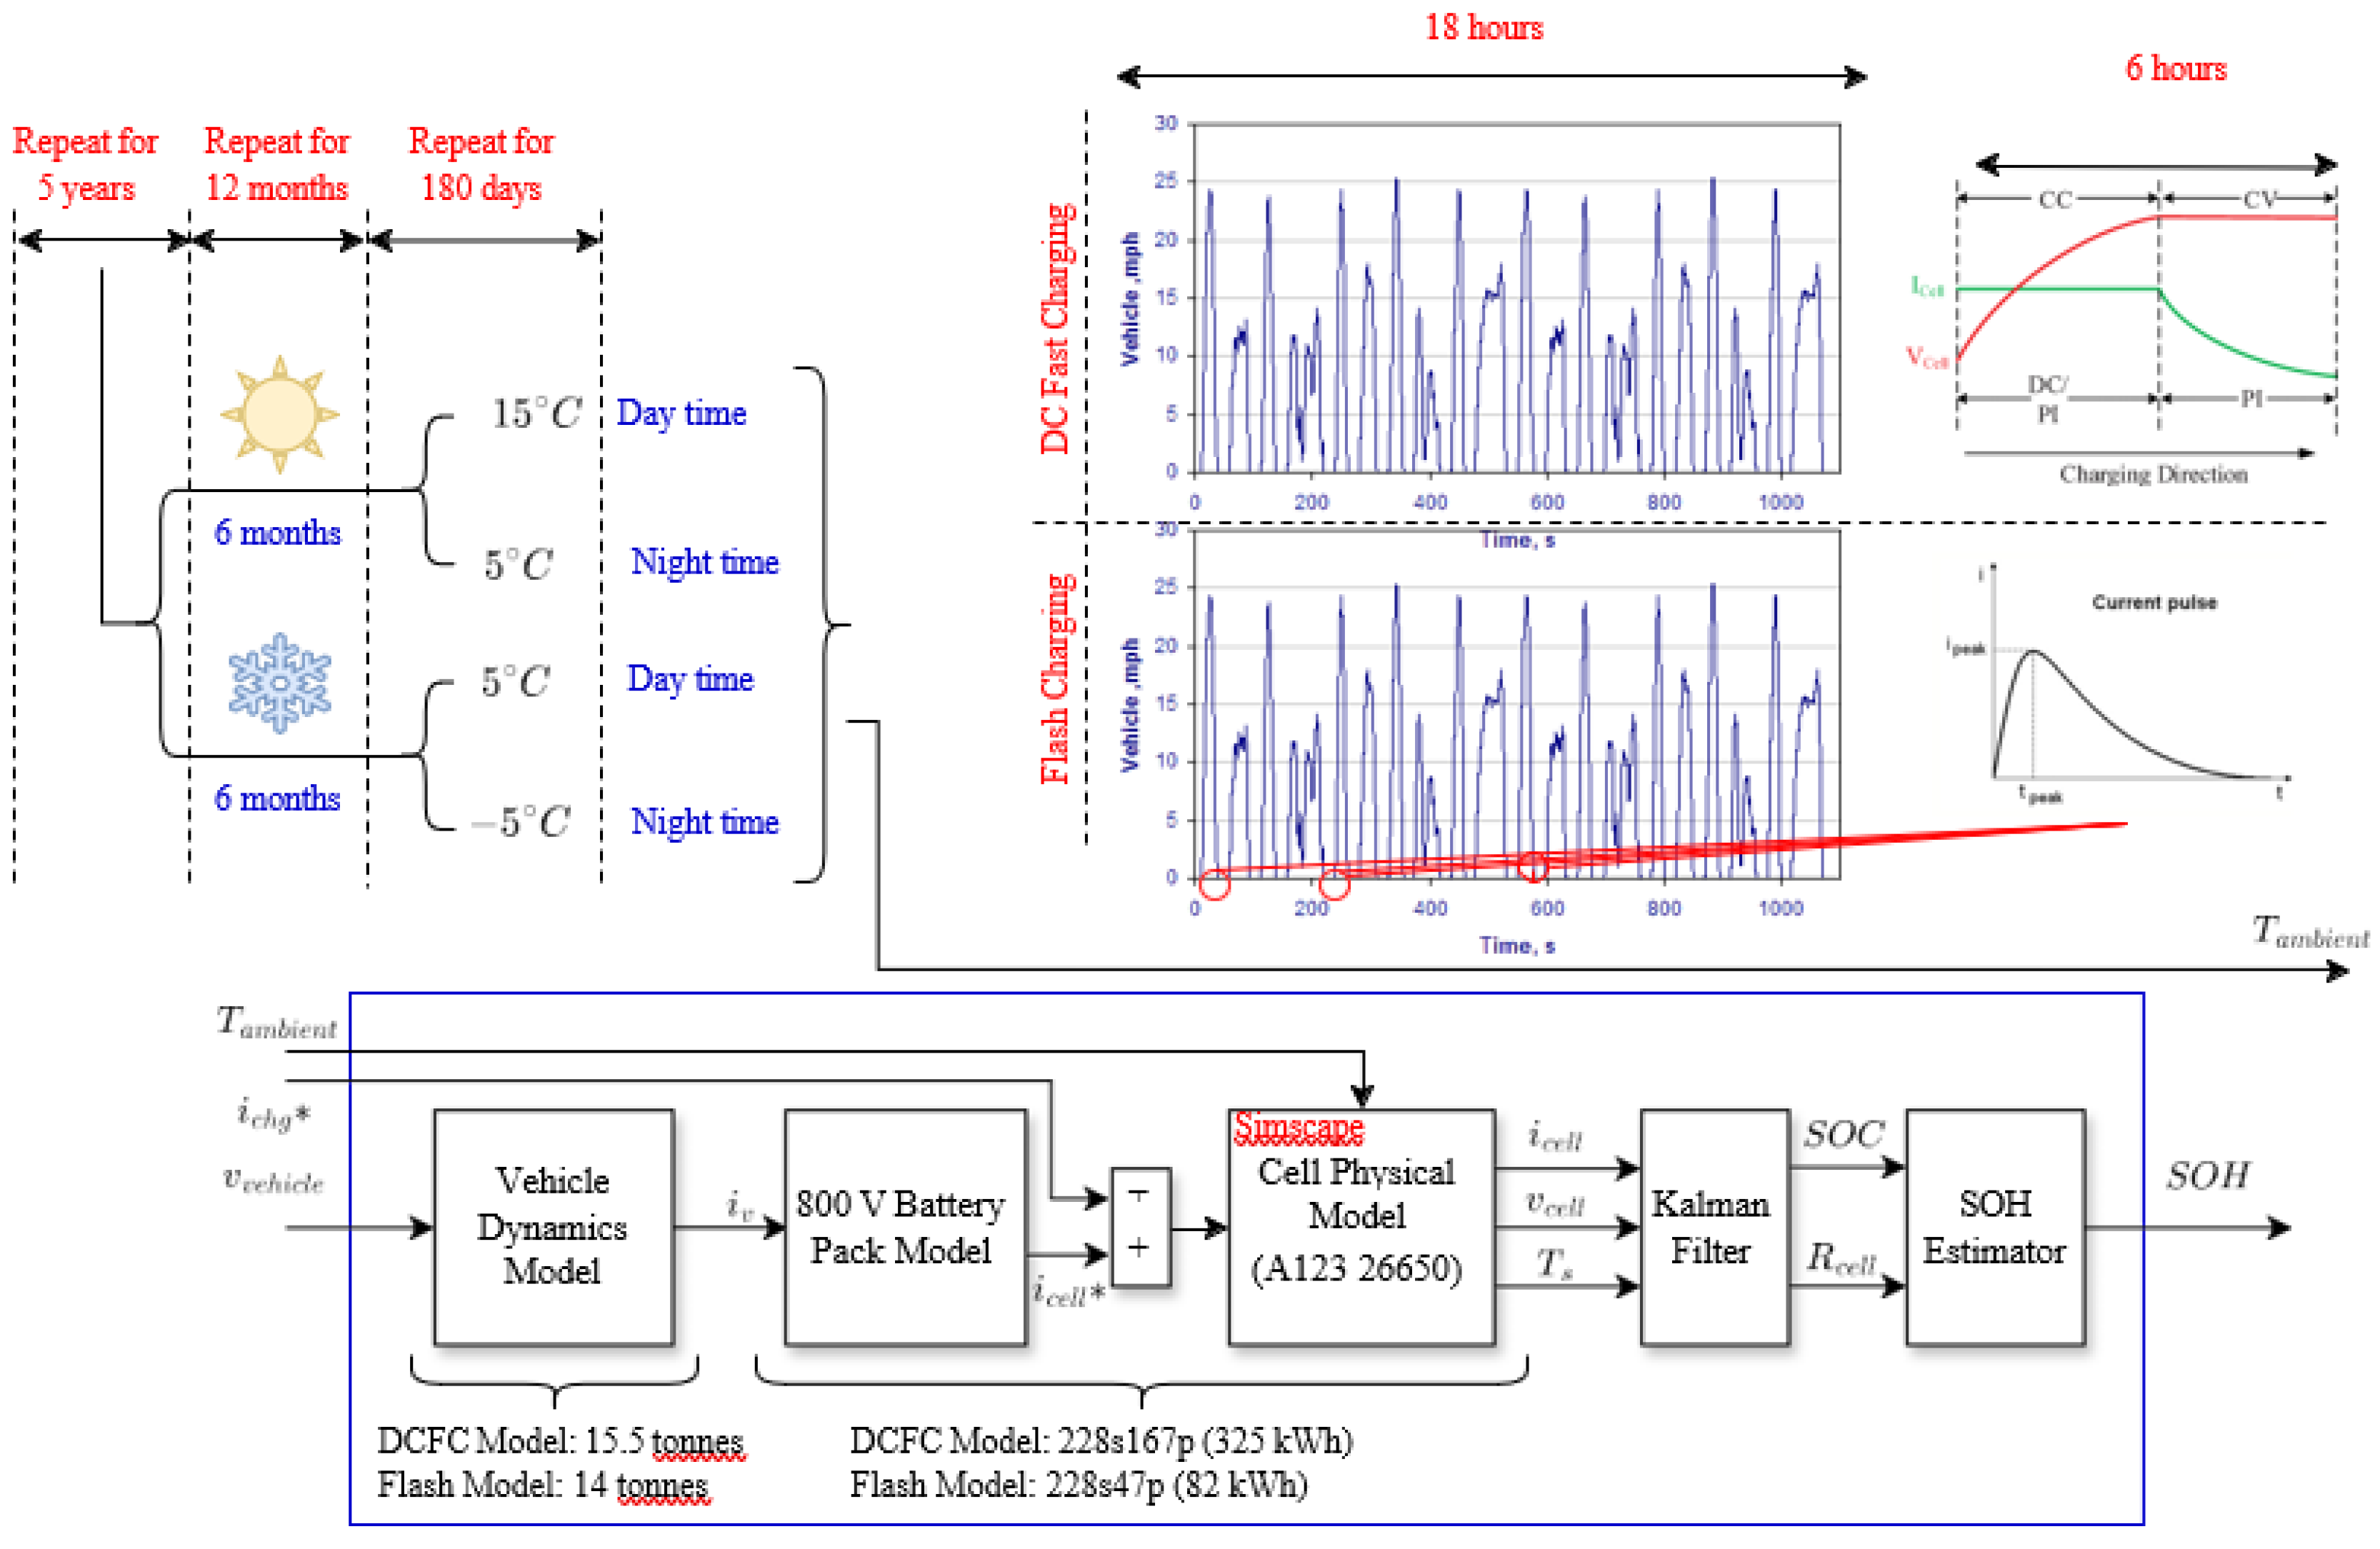
Figure 2.
DC Fast and Flash Charging Vehicle Cell Currents in one Manhattan Drive Cycle.
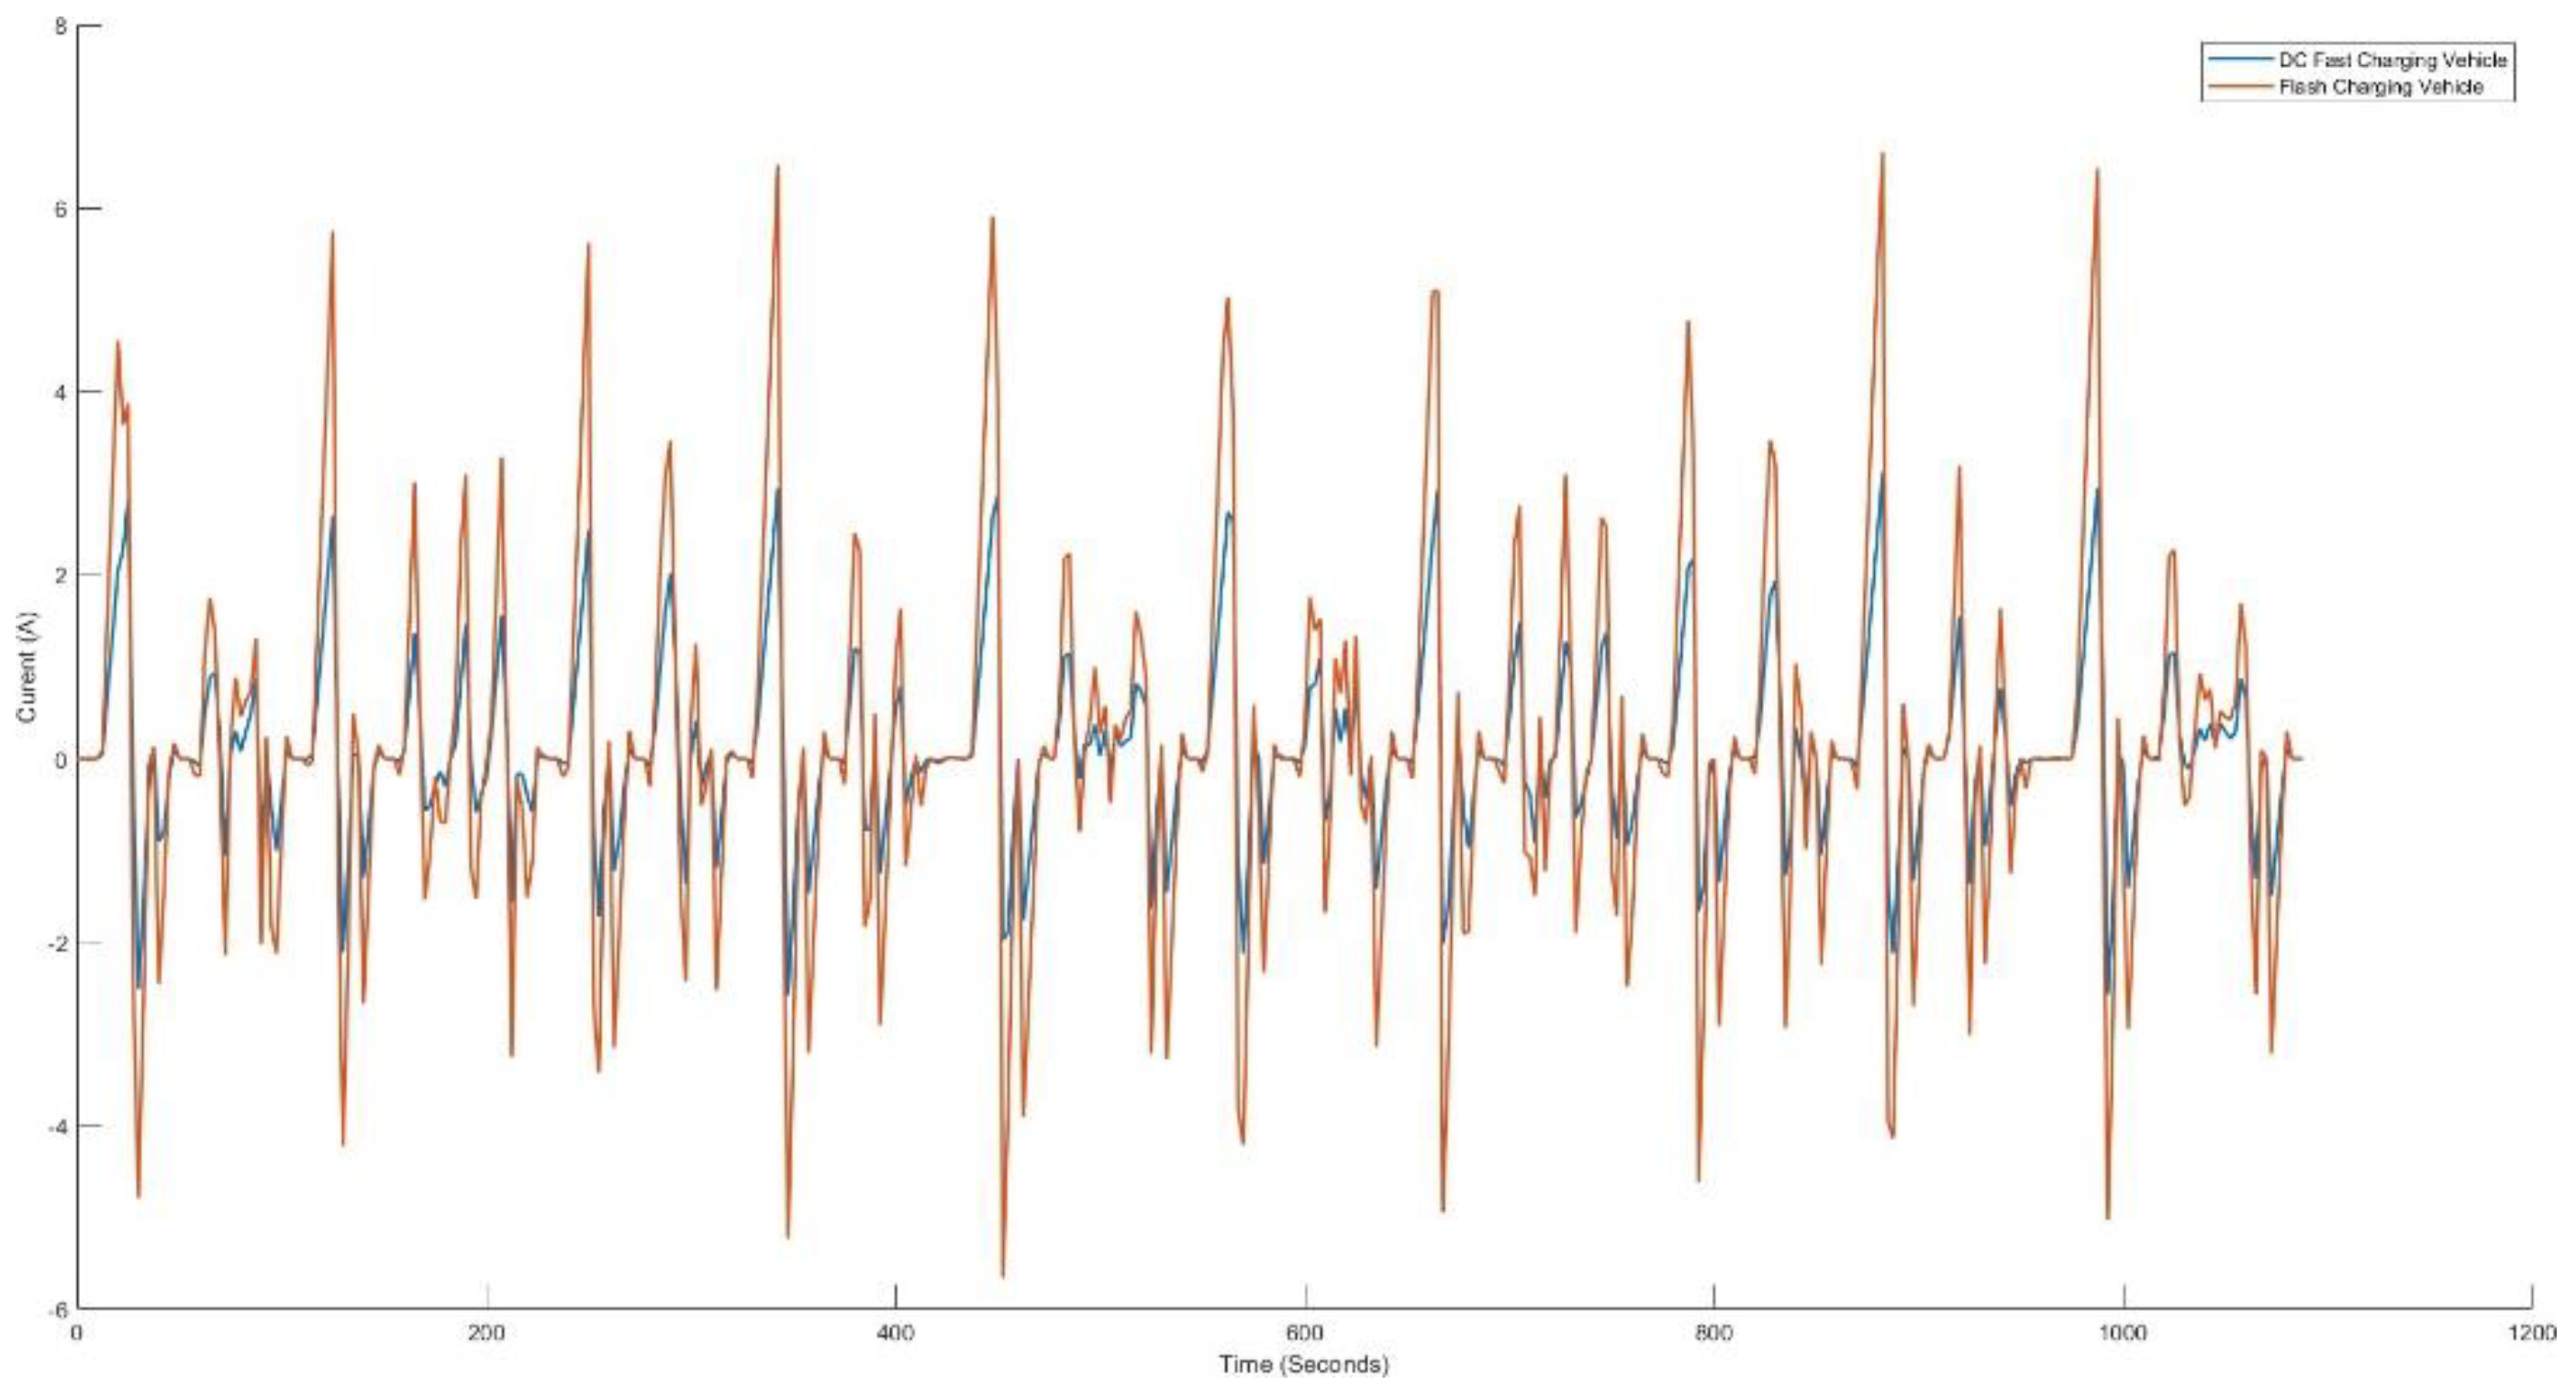
Figure 9.
Battery SOH degradation over 1000 cycles at 1C with different temperatures.
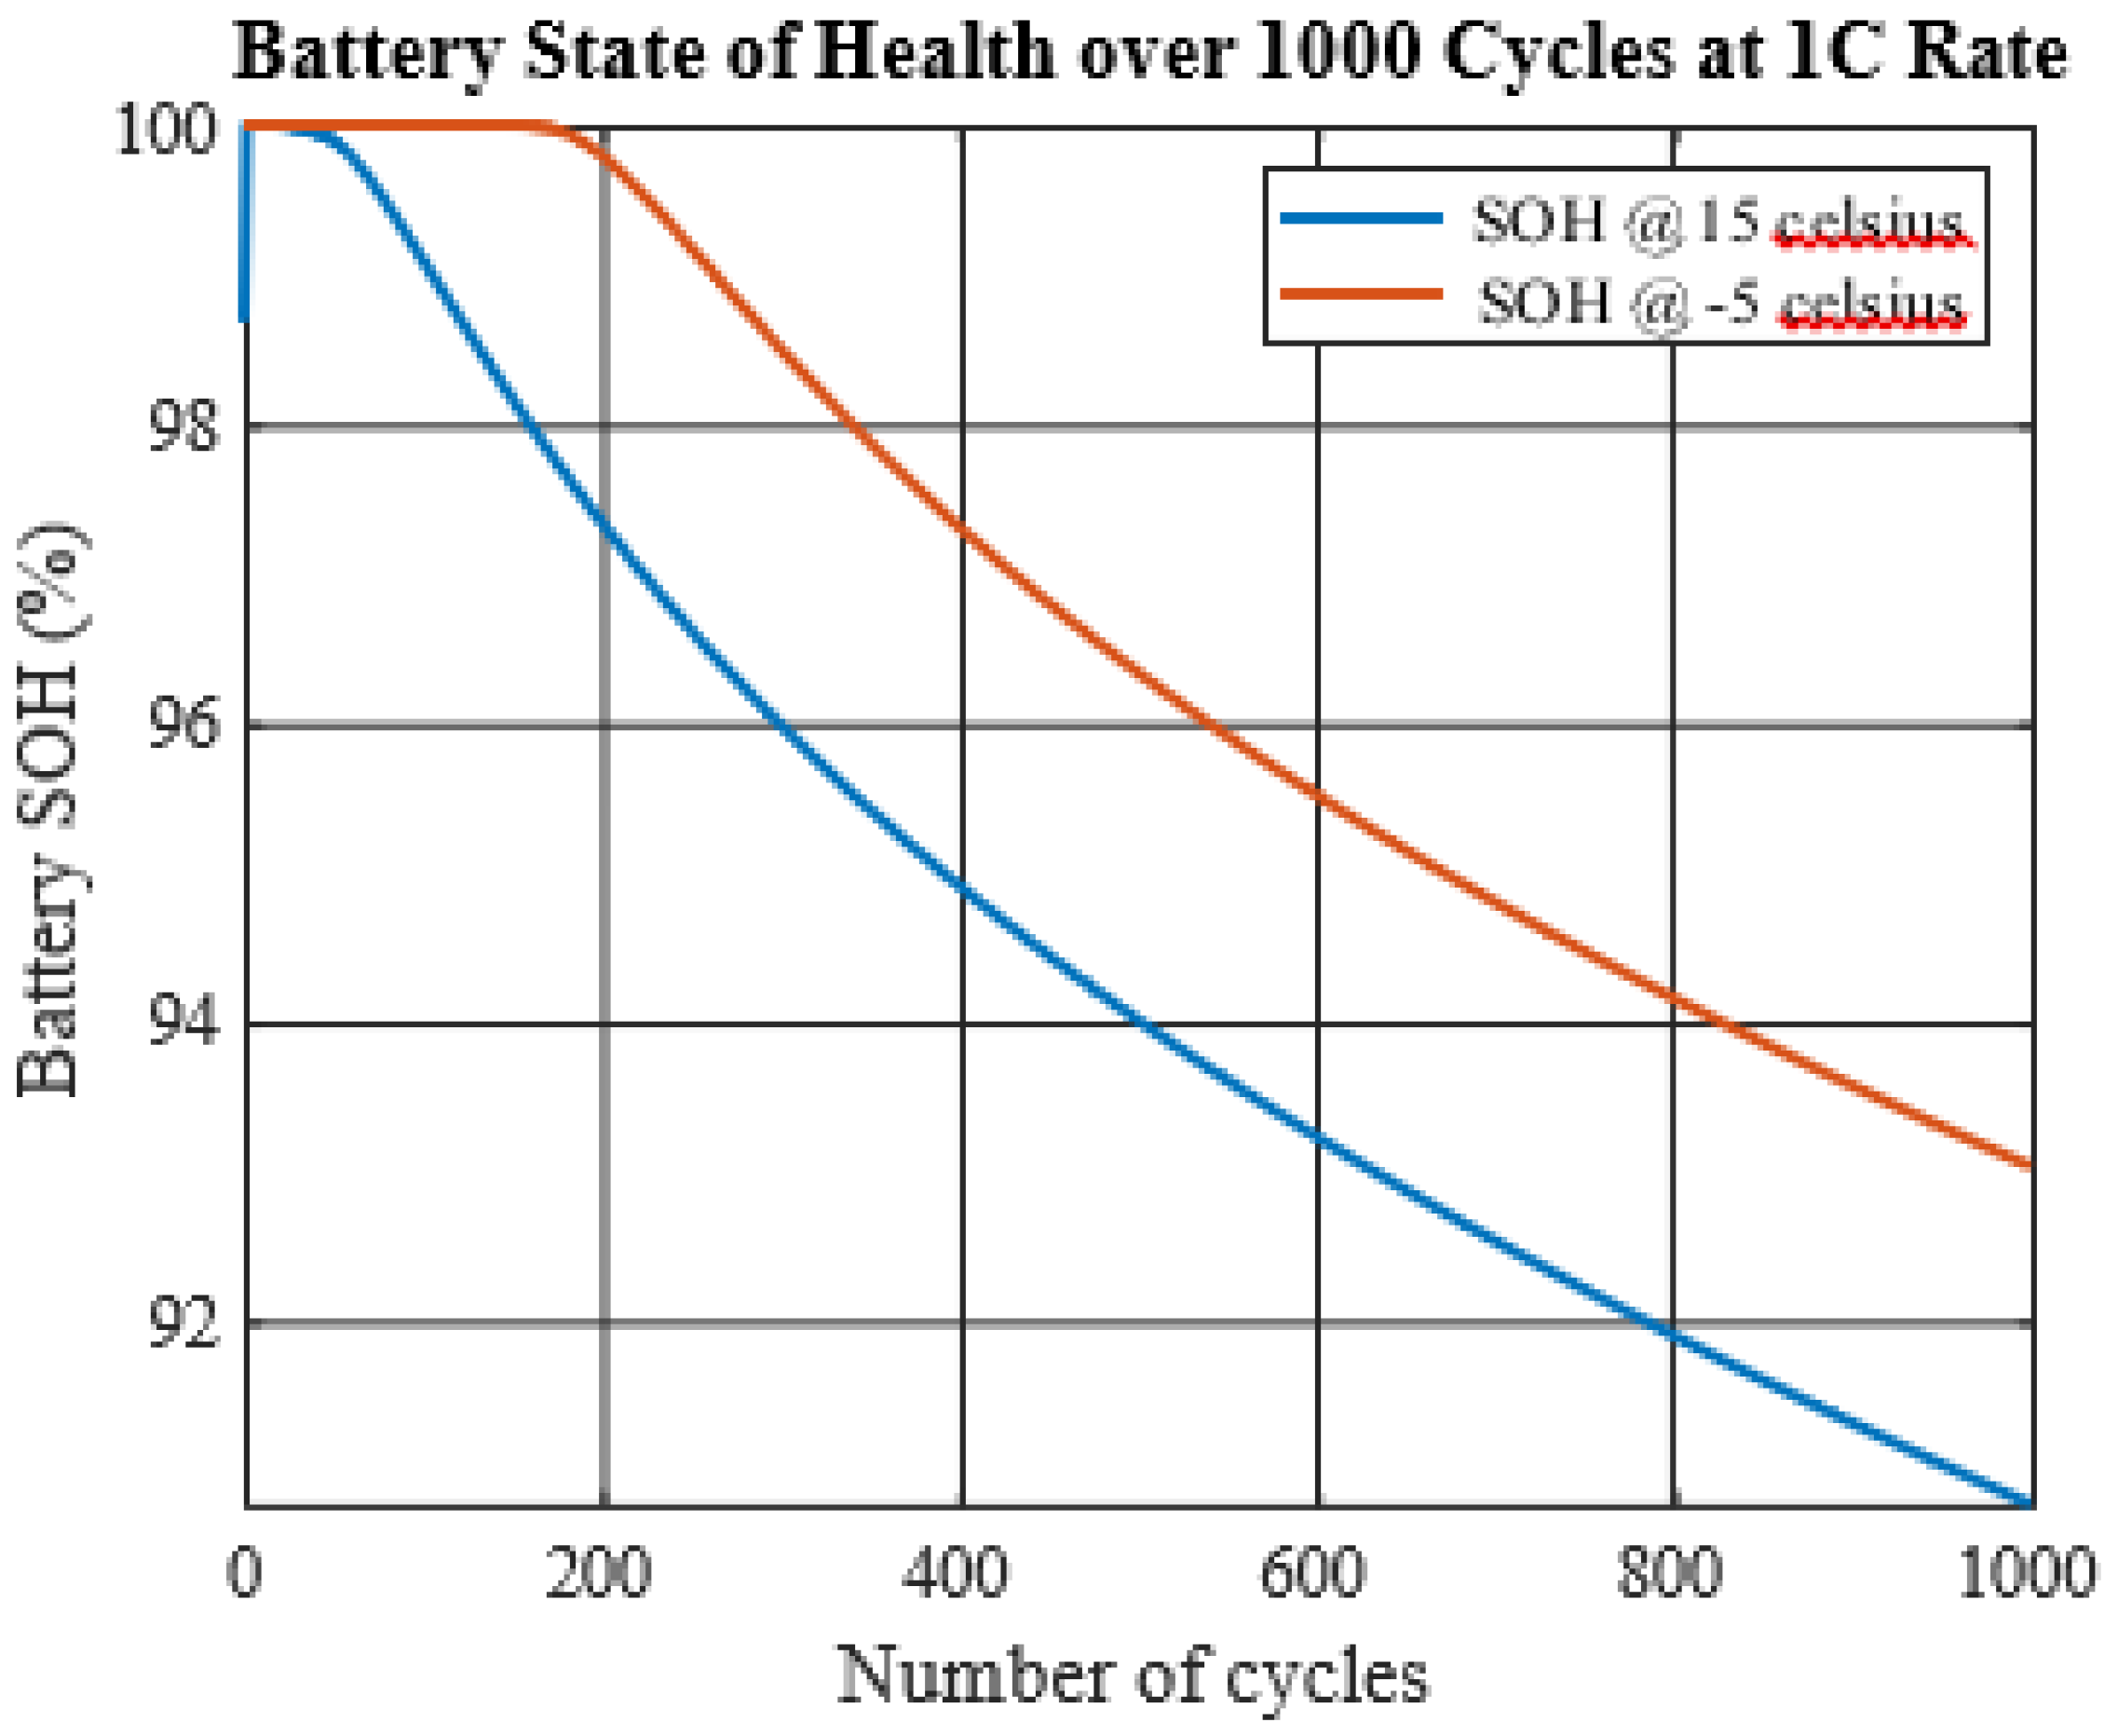
Figure 10.
Battery resistance aging over 1000 cycles at 1C with different temperatures.
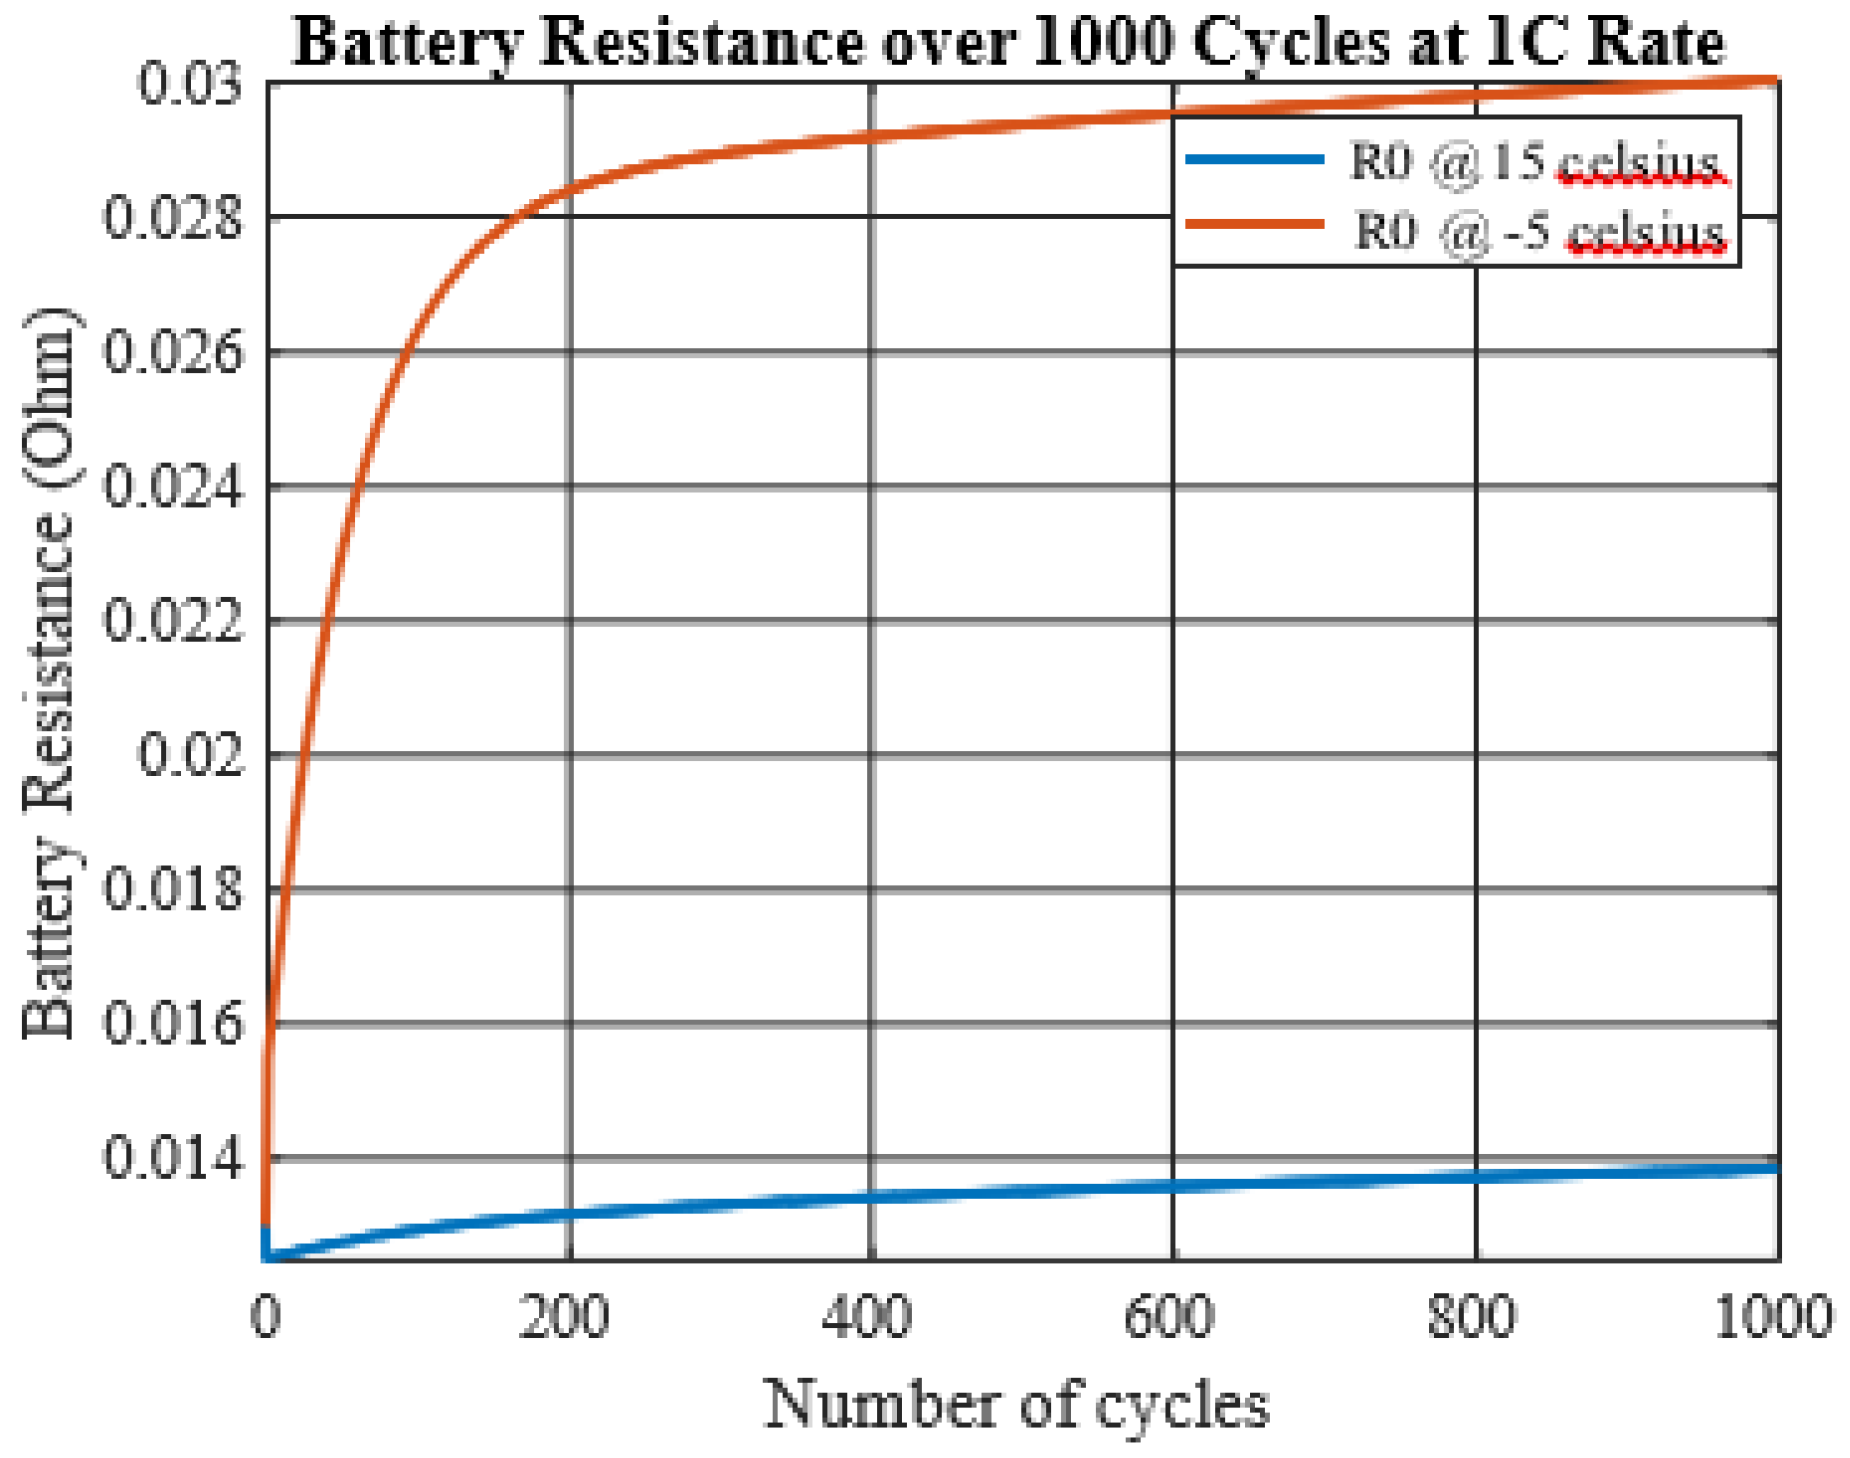
Figure 11.
Battery SOH degradation over 1000 cycles with different C-rated at 15◦C.
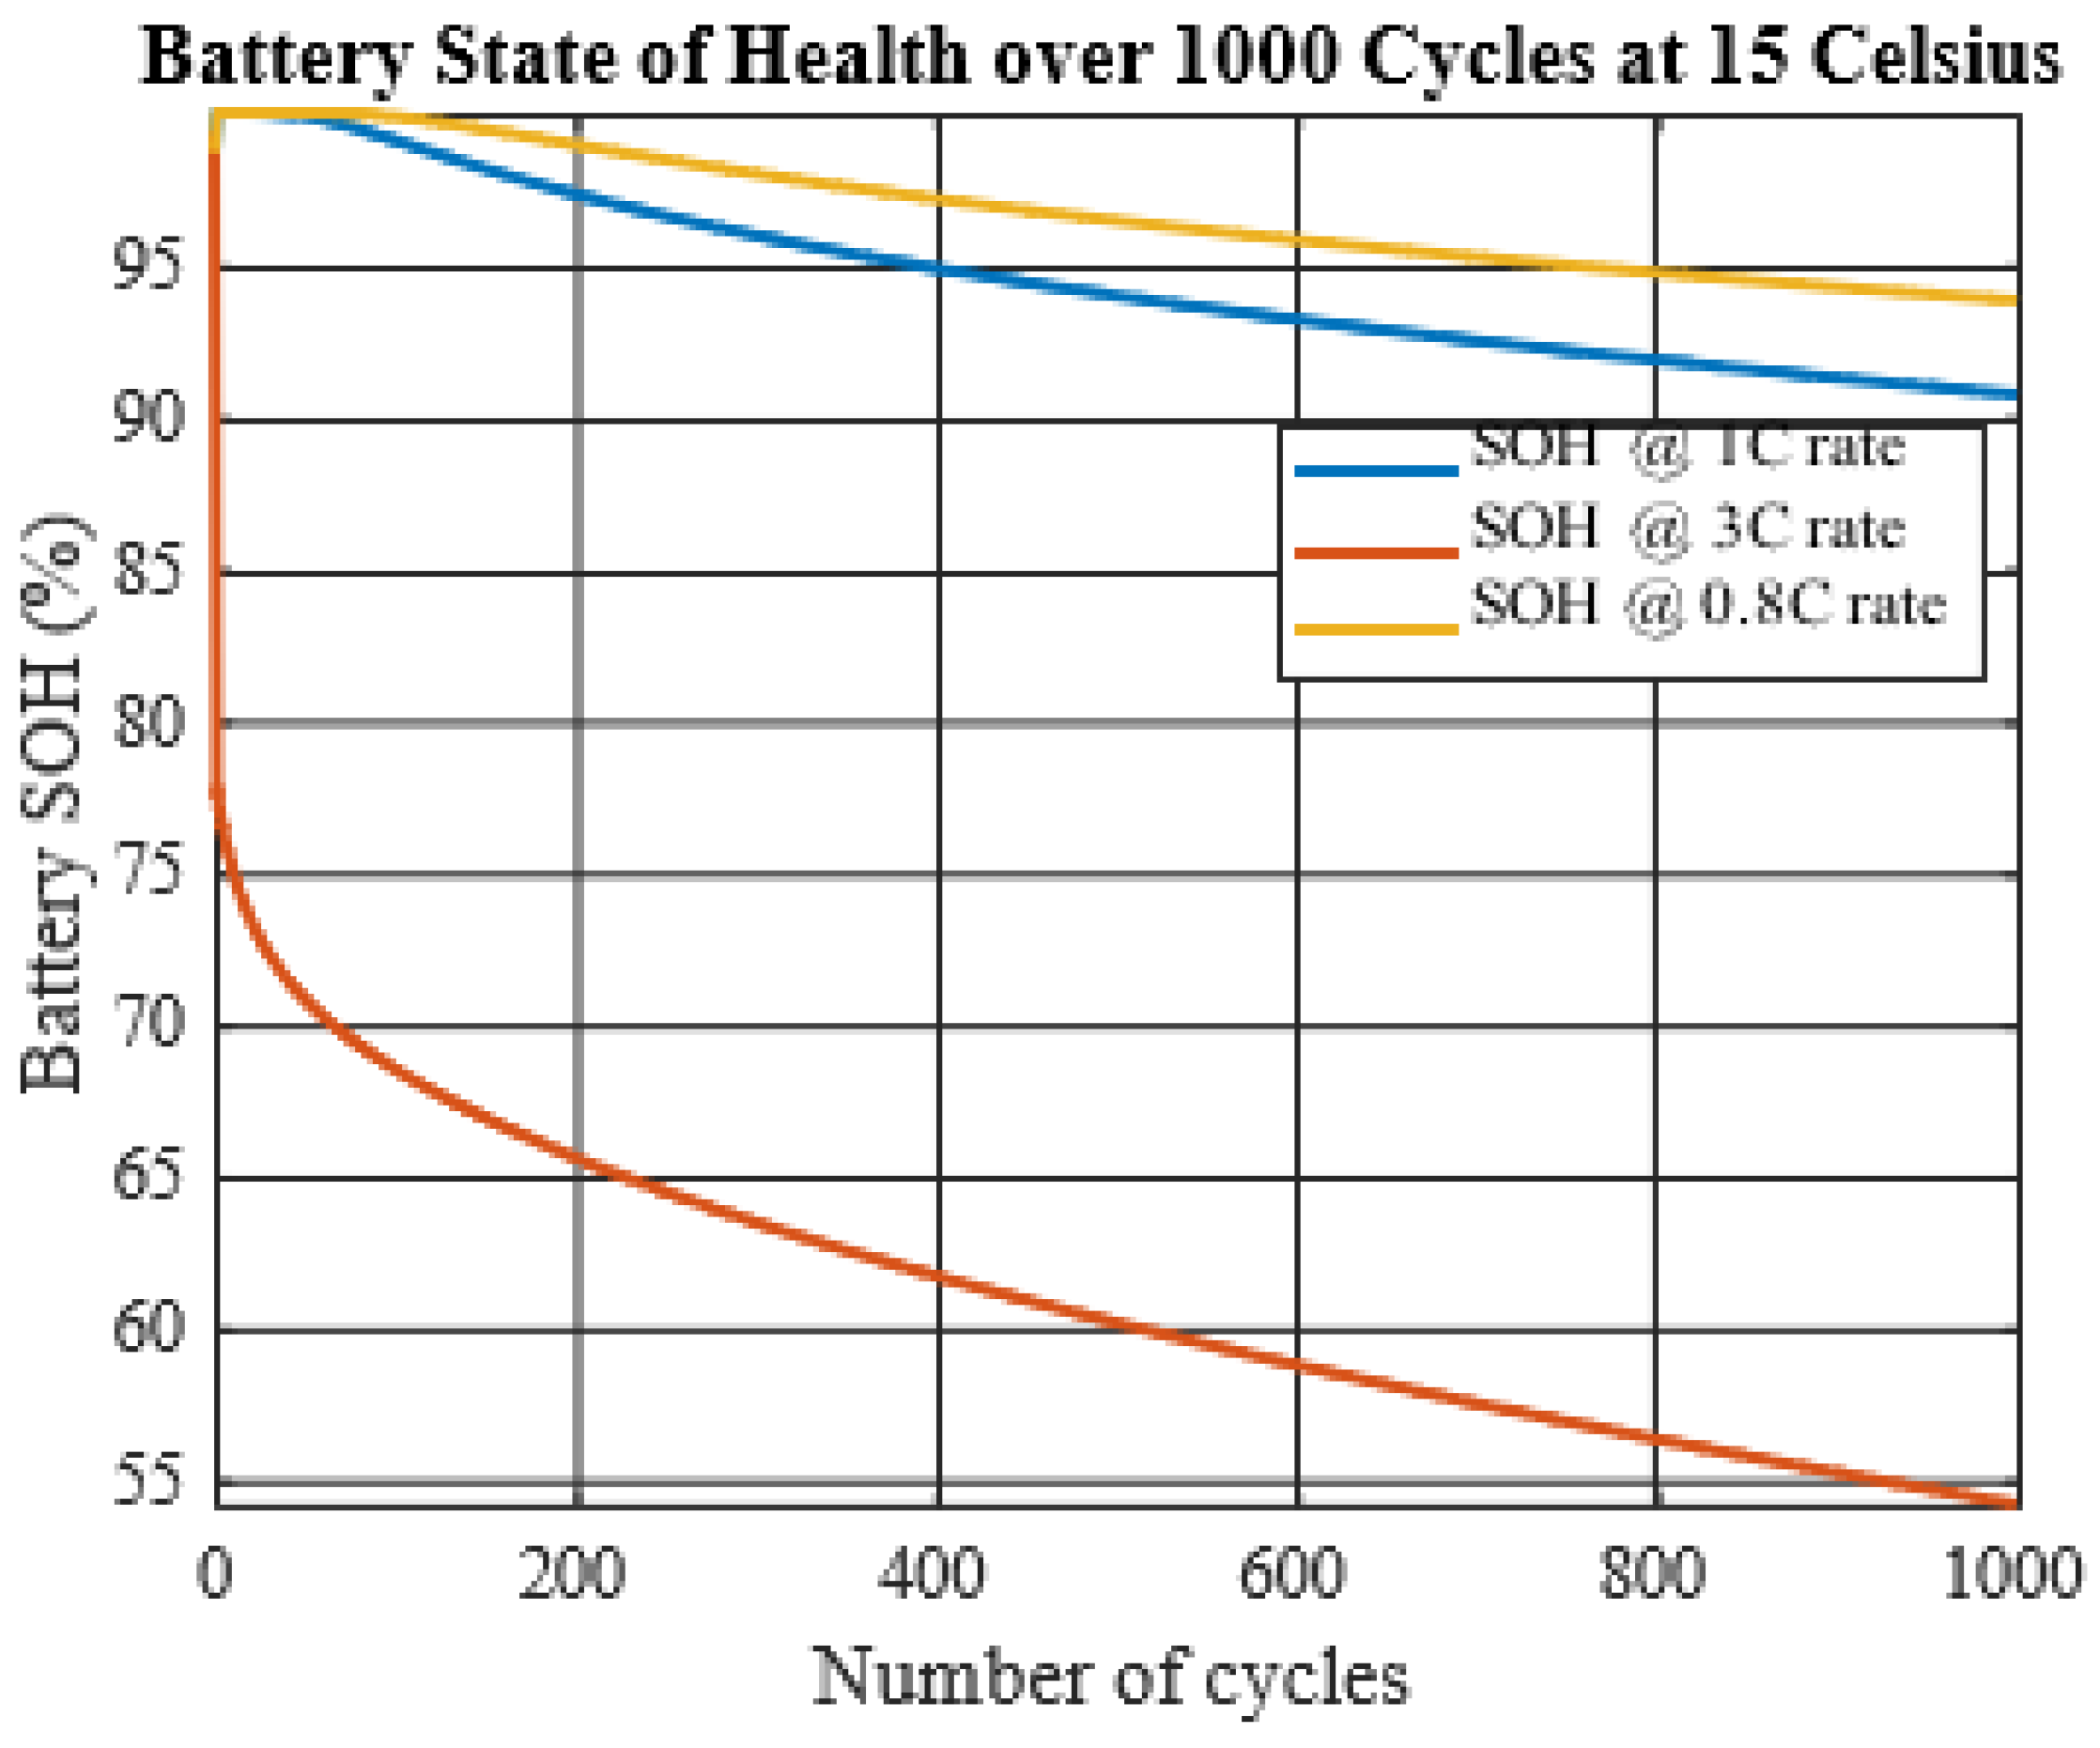
Figure 12.
Battery resistance aging over 1000 cycles with different C-rated at 15◦C.
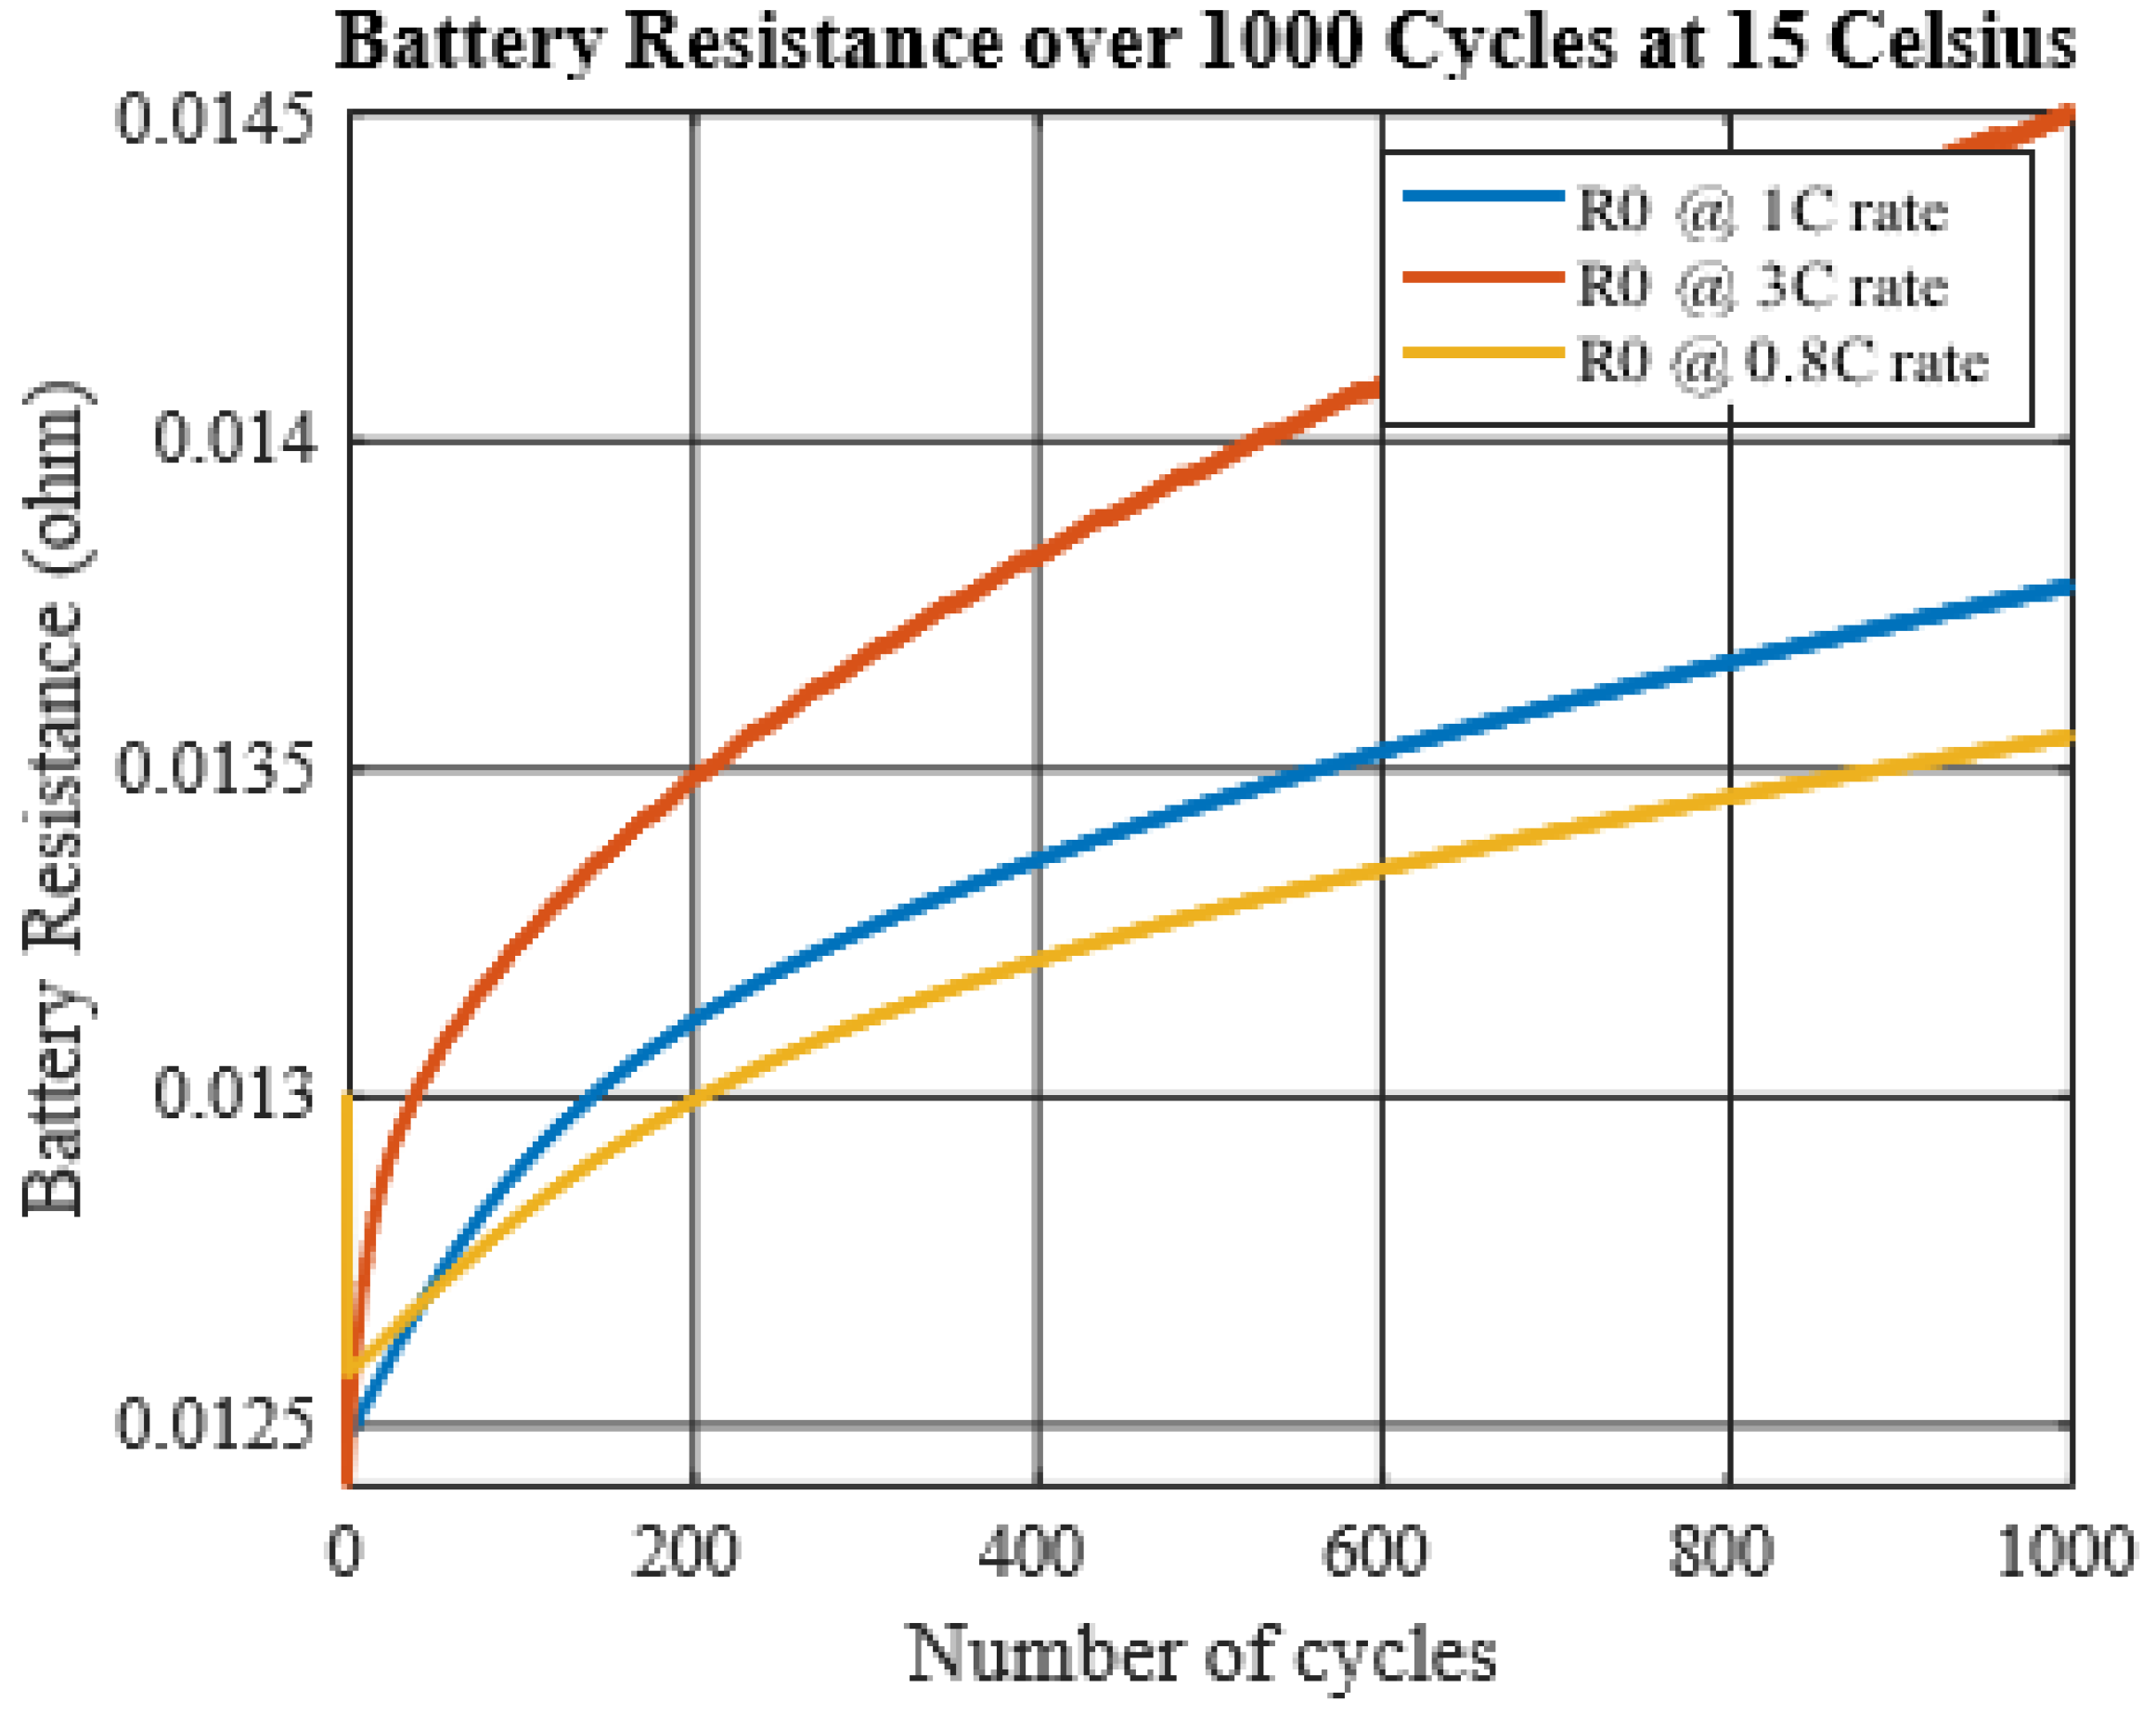
Figure 13.
SOH degradation in the DC fast charging and Flash charging scenario for 2.5 years.
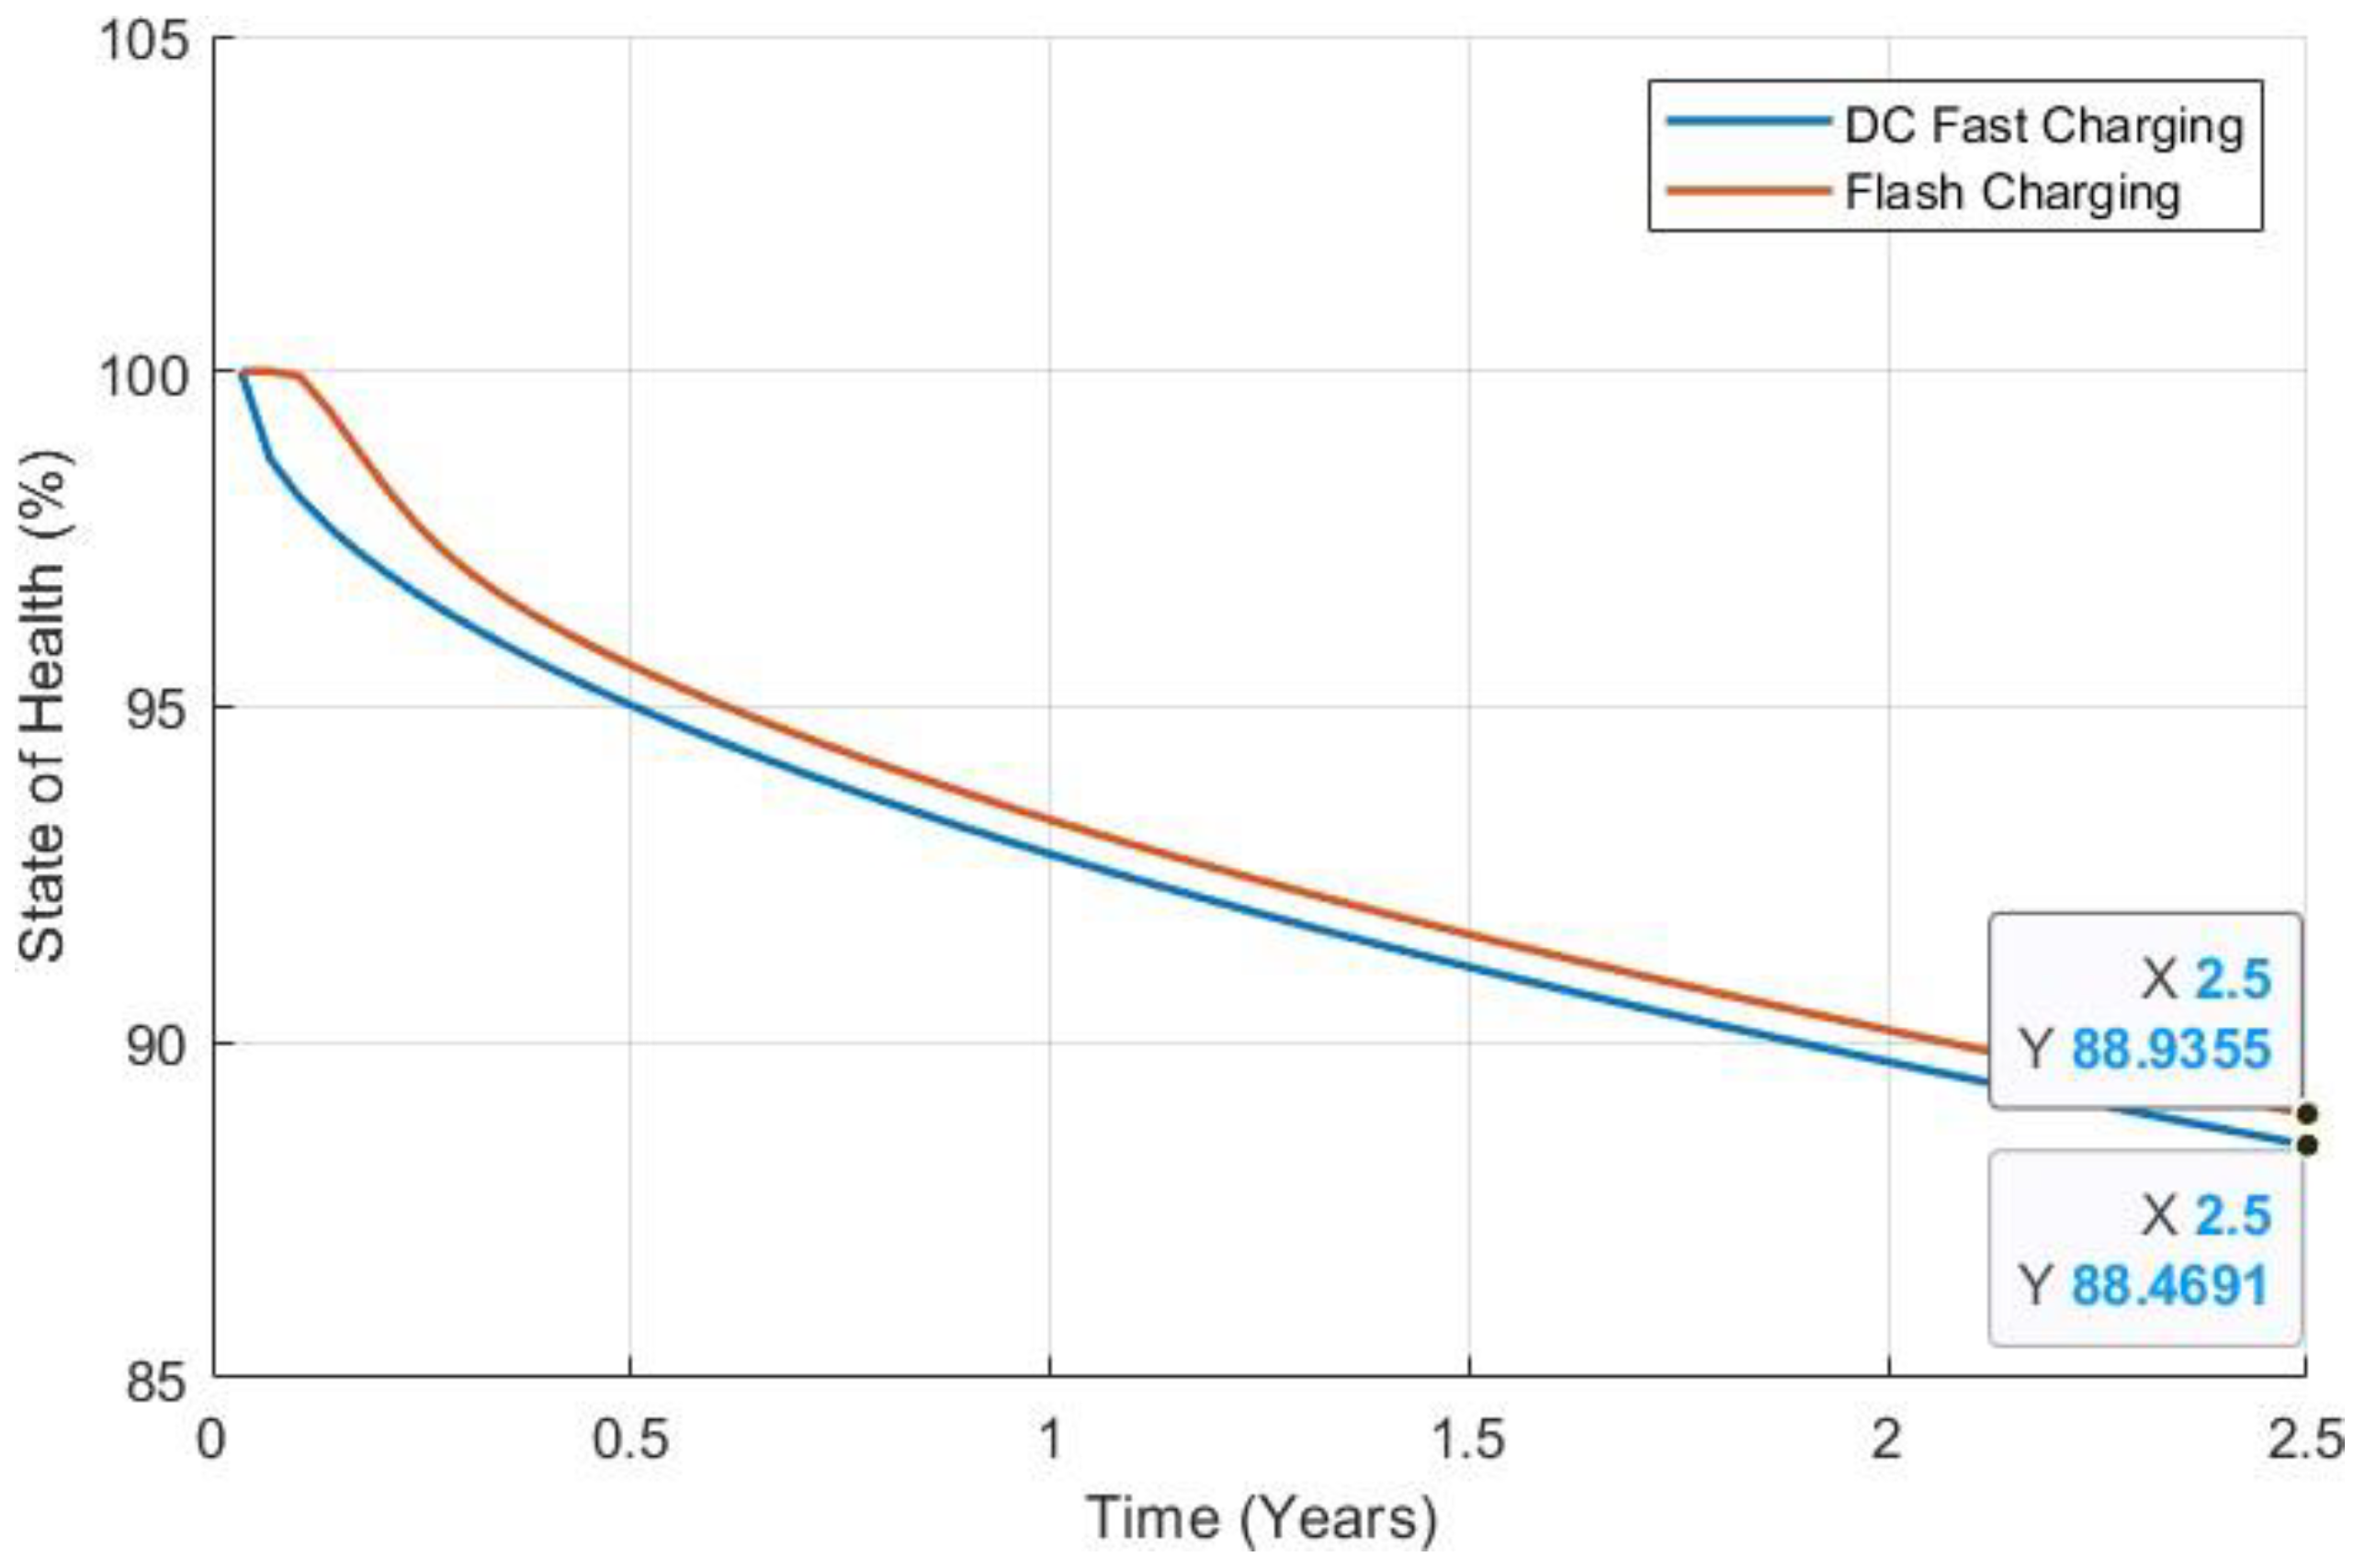
Table 2.
Specification of key DC fast charging standards.
| Manufacturer Model | ABB Terra 53 [17] | Tesla V3 Supercharger [18] | ABB Terra HP [19] |
|---|---|---|---|
| Maximum Power | 50 kW | 250 kW | 350 kW |
| Output Voltage | 200 - 500 V | 50 - 500 V | 150 – 920 V |
| Output Current (max) | 120 A | 630 A | 375 A |
| Parameters | Ratings |
|---|---|
| Voltage | 3.3 V |
| Capacity @ 23◦C Typ (Min) | 2.6 Ah (2.5) |
| Energy @ 23◦C | 8.25 Wh |
| Specific Power | 2600 W/kg |
| Impedance (1KHz AC) | Typ 6 mΩ |
| Cycle Life at 1C/1C, 100 percent DOD | > 4000 cycles |
| Max Continuous Discharge Current | 50 A |
| Max Pulse Discharge Current (10s) | 120 A |
| Minimum Voltage / HPPC Pulse 2 V / | 1.6 V |
| Temperature | 30◦C to 55◦C |
| Recommended Charge Current | 3 A |
| Max Continuous Charge Current | 10 A |
| Max Pulse Charge Current (10s) | 20 A |
| Float Voltage | 3.45 V |
| Recommended charge V and Cut-off Current | 3.6 V, taper to 125mA |
| Temperature Range | 0◦C to 55◦C |
Table 4.
A123 thermal specifications.
| CS(J/K) | Cc(J/K) | Rs(K/W) | Rc(K/W) |
| 4.5 | 62.7 | 1.94 | 3.19 |
Disclaimer/Publisher’s Note: The statements, opinions and data contained in all publications are solely those of the individual author(s) and contributor(s) and not of MDPI and/or the editor(s). MDPI and/or the editor(s) disclaim responsibility for any injury to people or property resulting from any ideas, methods, instructions or products referred to in the content. |
© 2024 by the authors. Licensee MDPI, Basel, Switzerland. This article is an open access article distributed under the terms and conditions of the Creative Commons Attribution (CC BY) license (http://creativecommons.org/licenses/by/4.0/).
Copyright: This open access article is published under a Creative Commons CC BY 4.0 license, which permit the free download, distribution, and reuse, provided that the author and preprint are cited in any reuse.


