Submitted:
30 June 2024
Posted:
02 July 2024
You are already at the latest version
Abstract
Abrus precatorius is a medicinal herb originated from Southeast Asia and native to India. The Hindustani centre of origin was found to possess lot of variability especially with respect to seed color. However, no previous researchers have focused on studying the variability by including the entire variability of the region. A total of 99 accessions were analyzed for its biochemical components like moisture content, total phenols, antioxidants, ash content, protein content, total monomeric anthocyanin and flavonols. Principal component analysis (PCA) shown that first three components viz., seed color, phenols and antioxidants are major principal components that contribute to 80.86% of total variability in the germplasm. The dendrogram constructed based on the biochemical data and by using the software Darwin version 6.0. formed three main clusters i.e. cluster 1, cluster 2 and cluster 3 which contain 55 accessions, 40 accessions and 1 accession respectively. Seed color was found to be the main criteria based on which the Abrus accessions were grouped. Accessions from different clusters also differ for their mean phytochemical constituents. Germplasm curators / plant breeders can select such elite genotypes and utilize them in crop improvement programmes.
Keywords:
Principal component analysis
; Biplot analysis
; Cluster analysis
; Abrus precatorius
; Medicinal herb
1. Introduction
Medicinal plants have been essential to maintaining human health since prehistoric times. Numerous biochemical substances with possible health advantages may be found in these plants [1]. Abrus precatorius L. (also known Indian liquorice) is a medicinal plant originated from Southeast Asia and native to India [2]. It belongs to pea family, fabaceae and is the only representative genus of the tribe, Abreae. It is mostly found in drier areas in the tropical regions. The plant is well adapted to a wide range of environmental conditions and commonly found as weeds throughout the plains and forest land [3]. The Abrus plant is a perennial, slender, twinning herbaceous plant with a cylindrical stem and smooth bark. It twines around other plants and has oblong, pinnate compound leaves. The plant produces numerous flowers in clusters, with colors ranging from dull purple to dark purple or white and the plant develops dark brown pods with red and black seeds [4]. The fruit is legume or pod-shaped and flat appressed. The plant's wild nature allows it to remain dormant under unfavorable conditions, facilitated by its hard seed coat [5]. Traditional medicine uses this herb for its anti-cancer [6], nerve-tonic [7], and skin cancer remedies [8]. Hepatitis, bronchitis, and colic disorders are among the conditions for which its roots, leaves, and seeds are employed as remedies [9]. The oil extract from the plant has antibacterial qualities and is used to treat hair loss [10]. Essential amino acids are found in the roots, while the leaves and decoctions are utilized to treat colic illnesses [9]. In addition, baldness and snake bites are treated using rattan seeds [11]. Plants generate a diverse array of phytochemical substances, rendering them valuable in the treatment of numerous ailments. Abrus precatorius, despite its toxic nature, has numerous biomedical applications including antimicrobial [12], wound healing, and antioxidant properties [13,14]. Its leaf extracts have shown potential antibacterial and anthelmintic properties against bacteria and fungi [15], and can treat diabetes [16]. Indian liquorice has nephroprotective properties [17] and antiviral activity against COVID-19 protease [18]. Overall, Abrus precatorius has potential as a natural drug for various health issues. Medicinal plants include many biochemicals such as phenolic compounds, terpenoids, flavonoids, and alkaloids [19]. Plants generate a diverse array of phytochemical substances, rendering them valuable in the treatment of numerous ailments [20]. Since natural medicines derived from plants make up more than 40% of contemporary medications, medicinal plants are essential to the pharmaceutical industry and drug research. Phytochemistry, the study of medicinal plants and their biochemicals, is a significant area in natural medicine and drug development [21]. Despite the fact that Abrus precatorius has several biochemicals and phytoconstituents in it, one of the primary obstacles to its widespread use as a tropical medicinal plant is ignorance of its importance and knowledge about its medical benefits. There are very few reports about the phytoconstituents of different germplasm of Abrus precatorius. This present investigation was carried out to explore the principal component analysis and cluster analysis as tools for studying the variability of Abrus precatorius germplasm.
2. Materials and Methods
2.1. Seed materials and Its Multiplication
The seeds were received from the Indian National Genebank, National Bureau of Plant Genetic Resources (NBPGR), New Delhi, India. Based on the germination percentage of seeds, a total of 99 accessions were selected. On the basis of seed color, the accessions can be categorized into red and black combination (77 accessions), pink and brown combination (5 accessions), cream and brown combination (2 accessions), complete black (3 accessions) and complete white (12 accessions). With the exception of northeast India, these accessions reflect the various agro-ecological zones found across India. However the seeds supplied were very less in quantity. Therefore, the selected accessions were multiplied at two locations, which were NBPGR Experimental Centre in Issapur, New Delhi (location I) and the NBPGR Regional Station in Ranchi (location II). All the accessions were grown in natural condition. After maturity, the seeds were harvested from different accessions of Abrus precatorius. The collected seeds from 99 accessions were used for the evaluation of biochemical analysis at NBPGR, New Delhi, India.
2.2. Biochemical Analysis of Abrus Seeds
2.2.1. Total Moisture Content
A thermo gravimetric technique called the oven method [22] with slight modification is used to determine the sample's moisture content. The weighing bottles were cleaned and place in oven at 100±5°C for overnight drying. The dry weight of weighing bottle was noted. Seed samples of 3-4 grams were grinded and placed in dried weighing bottle. The samples were thoroughly mixed by oscillating the closed bottle for three times and note the weight .The weighing bottle is finally placed in an air oven set at 130±5°C for two hours. To determine the moisture content, the weight of the sample after drying is divided by the weight of the empty bottle. The seed sample's original and final weights are then weighed to determine the moisture content.
2.2.2. Total Phenol Content
The total phenol content is estimated by using method followed by Bray and Thrope 1954 [23]. This assay uses the reduction of Folin-Ciocalteu Reagent (FCR) to measure the total phenols in the sample and it involves redox reaction. The samples were prepared by grinding the seeds with 80% ethanol and centrifuge it. The resulting sample is then diluted in test tubes, dried and FCR reagent was added into it. After cooling, add 2 mL of 20% Na2CO3 for 1 hour. The absorbance is measured at 630 nm. The total phenols are calculated using a standard graph, which is then plotted and results were expressed as Gallic Acid Equivalents (GAE) in g/ 100g.
2.2.3. Antioxidant Activity
The Antioxidant activity of Abrus seeds was determined by the method standardized by Benzie and strain [24]. This technique uses antioxidants at a lower pH to reduce the complex Ferric-tripyridyltriazine (Fe3+-TPTZ) to a blue-colored Ferrous-tripyridyltriazine (Fe2+-TPZ) complex form. A stock solution of Gallic acid standard, 0.1 M acetate buffer, 20 mM ferric chloride, and 10 mM tripyridyltriazine (TPTZ) were among the reagents used. Mixing these chemicals in a 10:1:1 ratio yields the FRAP reagent. 100 µL of sample was taken and 2200 µL of newly made FRAP reagent is added. The final volume was make up to 2500 µL by using water. After vortexing the test tubes, they are allowed to incubate at room temperature for half an hour. Absorbance measurements are made at 593 nm when the indigo blue hue is generated. The same process is used to prepare the standards and blanks. The results were expressed in mg/ 100 g of gallic acid equivalents (GAE).
2.2.4. Total Ash Content
The total ash content in the seed samples were estimated by a method that is followed by Horwitz [25]. Ash content is the inorganic residue that is left behind after organic materials and water was removed using heat and oxidizing chemicals. It is assessed in grams of ash per 100 grams of sample and aids in determining the overall amount of minerals present. The idea is to burn out organic materials (<550°C) and to find out the portion of inorganic substance left. By burning at temperatures higher than 650°C, which volatilize inorganic salts and inhibit ignition, the amount of ash content is ascertained. Weight of the ash content was measured after taking weight of crucible at 100°C and ash content was calculated.
2.2.5. Total Protein Content
The protein content in the seed samples were measured by using Dumas method [25]. The Dumas technique examines the overall amount of nitrogen in an organic matrix sample to determine protein composition. The DUMAS instrument was linked to the balance. The sample crucibles were put in a 90-slot auto sampler. The seed samples were then burned at 950 °C in a high oxygen atmosphere, converting nitrogen oxides to nitrogen with the help of a copper-platinum catalyst and measuring the result using a thermal conductivity detector. For the purpose of measuring nitrogen, the instrument was calibrated using HPLC grade L-aspartic acid. The protein percentage was calculated by adding the nitrogen concentration.
2.2.6. Total Monomeric Anthocyanin Pigment Content
Anthocyanin pigment concentration in total was estimated using the pH Differential technique [25]. It entails monitoring the reversible color change of monomeric anthocyanin in response to a pH. The concentration of pigments is shown by the absorbance measurement at 520 nm. Since degraded anthocyanin absorb at both pH 4.5 and 1.0 and do not change color, they cannot be identified. Weigh 0.1 g of grinded seed material and then add 0.1N HCl. Centrifuge the contents and record the absorbance at 520 and 700 nm. The absorbance at various pH values is used to calculate the pigment content. The result obtained is expressed in unit: mg / 100g of cyanidin-3-glucoside equivalent.
2.2.7. Total Flavonoid Content
The total flavonoid content in the sample was estimated using Oomah method [26]. The Oomah method forms an acid stable and acid labile compound with maximal absorbance at 360 nm, which is a technique for measuring flavonols. The amount of flavones in the samples is estimated based on the graph. The results are expressed as quercetin equivalent/g of sample.
2.3. Statistical Analysis
The data was recorded with three replications and the design used in conducting the experiment was Completely Randomized Design. The recorded observations were analysed using the software XLSTAT version 2022.1 and DARwin (Dissimilarity Analysis and Representation for Windows) version 6.0.021. Principal component analysis and biplot analyses were done using the software XLSAT. DARwin software was used for the UPGMA (un-weighted pair group method for arithmetic mean) cluster analysis.
3. Results
3.1. Principal Component Analysis (PCA)
3.1.1. Eigen Values and Variability (%)
Principal component analysis was a non-parametric method for extracting necessary information from a complex data set [27,28]. The Eigen values and variability (%) of various principal components which was based on the biochemical parameters was represented in Table 1 and the scree plot was depicted in Figure 1. It was observed that the first three components (PC1 to PC3) have eigen values greater than 1 (Kaiser rule). Therefore F1 to F3 can be considered as the major principal components that contribute to 80.86% of total variability in the genotypes.
3.1.2. Factor Loading
The result of factor loading based on the biochemical data was given in Table 2. Factor loading displays the correlation of specific variable on the respective principal component. It can be noted that the first principal component (F1) had significant positive correlation with four of the original variables i.e. total phenols, antioxidants, total monomeric anthocyanin and flavonols. In the first principal component (F1), all the other variables had loadings close to zero which indicates that they had a weak influence on the component. The second principal component (F2) had significant association with two variables i.e. positive correlation with moisture content and protein content. The third principal component (F3) had significant positive correlation with only one variable i.e. ash content.
3.1.3. Biplot Analysis
The biplot technique was used to determine the determine the relationship among different variables [29,30]. The biplot analysis based on the principal component 1 (F1) and principal component 2 (F2) was shown in Figure 2. These two components together contribute to 66.38% of the total variability. In that principal component 1 (F1) contributes to 50.49 % of total variability, whereas principal component 2 (F2) contributes to 15.89 % of the total variability. The samples were shown with red colored dots and the biochemical parameters were shown as vectors (arrows). The vectors of total phenols, antioxidants, total monomeric anthocyanin and flavonols were more parallel to the axis of principal component 1 (F1). This indicates the greater contribution of these variables only to principal component 1 (F1). Similarly, the vectors of moisture content and protein content were more parallel to the axis of principal component 2 (F2). This indicates the greater contribution of these variables only to principal component 2 (F2).
The correlation between these variables can be studied based on the angle between the vectors. A smaller acute angle depicts the positive correlation between variables, a right angle depicts no correlation and larger obtuse angle shows the negative correlation between them. From the figure 2, it was noted that there exists a very strong positive correlation between total phenols, antioxidants, total monomeric anthocyanin and flavonols. The observations (red colored dots) marked with red colored circle depicts the Abrus accessions with the complete white, cream + brown and pink + brown seed color. These accessions were recorded with comparatively lesser amount or complete absence of total phenols, antioxidants, total monomeric anthocyanin and flavonols. Similarly the observations (red colored dots) near the centre (0, 0) shows Abrus accessions with Red + black seed color. These accessions were observed with medium amount of total phenols, antioxidants, total monomeric anthocyanin and flavonols. Few of them (Red + black colored accessions) were recorded with comparatively higher amount of antioxidants. Three completely black colored accessions (IC0405311, IC0401666 and IC0605143) were encircled with yellow colored circle. These accessions were having the highest amount of total phenols, total monomeric anthocyanin, and flavonols. They were also observed with higher amounts antioxidants when compared with all complete white, cream + brown and pink + brown accessions and some Red + black colored accessions.
3.2. Cluster Analysis
Cluster analysis was used to separate a group of accessions into a number of homogenous groups [31,32]. The dendrogram was constructed based on the biochemical data and by using the software Darwin version 6.0.021. It forms three main clusters as shown in Figure 3 i.e. cluster 1, cluster 2 and cluster 3. The cluster wise groupings of all the 99 accessions were given in Table 3. In the main cluster 1, the completely black colored accessions distinguish itself from all other Red + black colored accessions. These accessions were marked with black colored circle and grouped as sub-cluster 1a. In the main cluster 2 (contains 40 accessions), few accessions distinguish itself from other Red + black colored accessions. These accessions were classified into sub-cluster 2a and sub-cluster 2b. The sub-cluster 2a was later divided into sub-cluster 2a (i) and sub-cluster 2a (ii). The sub-cluster 2a (i) consists of completely white colored accessions and sub-cluster 2a (ii) cream + brown colored accessions, whereas sub-cluster 2b contains pink + brown colored accessions. The main cluster 3 contains only one Red + black seeded accessions.
The cluster wise mean values of different groups were given in Table 4. The sub-cluster 1a (consists of completely black colored accessions) was recorded with highest cluster mean value for total phenols (42.47 mg/g of GAE), antioxidants (13.60 mg/g of GAE), total monomeric anthocyanin (49.80 mg/100g of cyanidin 3-glucoside equi.) and flavonols (63.54 mg/g of quercitin equivalent). Similarly, the sub-cluster 2b (consists of pink+brown colored accessions) was observed with highest cluster mean value for moisture content (13.07%) and protein content (18.54%). The Red + black colored accession in main cluster 3 recorded the highest cluster mean value for ash content (4.00%). The sub-cluster 2a (i) (consists of white colored accessions) was recorded with lowest cluster mean value for total phenols (18.57 mg/g of GAE), antioxidants (1.13 mg/g of GAE) and flavonols (26.84 mg/g of quercitin equivalent). The complete white colored accessions [sub-cluster 2a (i)], cream + brown colored accessions [sub-cluster 2a (ii)] and Pink + brown colored accessions [sub-cluster 2b] had no monomeric anthocyanin content. The sub-cluster 2a (ii) with cream + brown colored accessions was observed with lowest cluster wise mean value for moisture content (11.64 %). Similarly, the sub-cluster 2b with pink + brown colored accessions was observed with lowest cluster wise mean value for ash content (3.12 %) whereas the Red + black seeded accessions in main cluster 2 was marked with lowest cluster wise mean value for protein content (17.69 %).
4. Discussion
Principal component 1, principal component 2 and principal component 3 have contributed a share of 50.49%, 15.89% and 14.48% of total variability respectively. All the remaining four components have Eigen value less than one. Hence, the contribution of these components to the total variability was less. These four components are minor components because they are of little use to the plant breeder. Aleem et al. [28] conducted the principal component analysis, biplot analysis and cluster analysis in the evaluation of genetic diversity for cauliflower varieties. They had characterized 19 varieties by using thirteen morphological traits. In their study, it was reported that the first three factors have contributed to 80.87% of total variability. Further, they observed that principal component 1, principal component 2 and principal component 3 have individually contributed 49.81%, 22.62% and 8.44% respectively. Ajaykumar et al. [33] studied the PCA among seven treatments in mugbean by using 13 morphological characters. They also observed that only 5 out of 13 components were having the eigen values of greater than 0.5 and these five principal component have contributed 85.35% of the total variability. The remaining eight components have contributed only 14.65% of total variability. In our present investigation, we have observed that PC1 was majorly influenced by total phenols, antioxidants, total monomeric anthocyanin and flavonols. In PC2, the moisture content and protein content had a great impact. Similarly, the PC3 was highly associated with ash content. Aleem et al. [28] reported in their research that the PC1 was mainly affected by curd weight, plant weight and curd yield. PC2 was influenced by plant height to extreme and leaf length. Similarly, PC3 was correlated with number of leaves. The biplot analysis of our present study shows that there exists very strong positive correlation between total phenols, antioxidants, total monomeric anthocyanin and flavonols. Ajaykumar et al. [33] studied the principal component analysis by using data of morphological characters from mung bean. In their study, they reported that all the traits have acute angles between themselves in biplot analysis. It shows that there exists no negative correlation between them. The variable that had shown zero or lesser relation were dry matter production and pod length. Maia et al. [34] used the biplot analysis for agro-industrial characteristics of Anacardium spp. From their analysis, it was observed that firmness was having the negative correlation with length, peduncle and total weight. Mahato et al. [35] studied genetic diversity by principal component analysis of yield attributing traits in Katarni Derived Rice Lines. From their biplot analysis, it was observed that plant height, flag leaf length and fragrance have formed acute angle. This shows that these traits were strong and positively associated. Similar positive correlation was observed between panicle length with amylase content and gelatinization temperature, length/ breadth ratio with the rice kernel length and breadth, the grain yield per plant and number of tillers per plant. In their experiment, they also observed some negative association also i.e. the vectors have formed an obtuse angle. These traits include number of grains per panicle which was negatively associated with kernel breadth. Similar negative correlation was observed between 50% flowering and thousand seed weight. In the cluster analysis of Abrus germplasm, the accessions were grouped mostly on the basis of color. The main cluster 1 consists of 58 accessions (including 55 Red +black accessions and 3 completely black colored accessions in sub-cluster 1a). The main cluster 2 contains 40 accessions [(including 21 Red + black accessions, 12 completely white coloured accessions in sub-cluster 2a (i), 5 cream + brown coloured accessions in sub-cluster 2a (ii) and 2 pink + brown accessions in 2b]. IC0310855 was the only red+black colored accession which falls under cluster 3. The grouping of accessions among different clusters does not have any association with the geographic location from where it was collected. Aleem et al. [28] have studied the cluster analysis in 19 late season cauliflower genotypes. Based on their study, the varieties were grouped into 3 clusters on the basis of their morphological data. However, based on the PCA biplot analysis distinct grouping of these accessions have not observed. Based on the cluster wise mean values of Abrus accessions, the pharmaceutical companies can choose accessions that fall under cluster 1a which was reported with highest amount of antioxidant (13.60 mg/g). These accessions can be utilized in curing the degenerative diseases.
Author Contributions
Conceptualization, R.B. and V.G.; methodology, P.S.; software, S.R., P.P. and K.A.; validation, P.S.; formal analysis, P.S.; investigation, R.B.; resources, P.S. and V.G.; data curation, P.S.; writing—original draft preparation, P.S.; writing—review and editing, S.R., P.P., K.A., R.B. and V.G.; visualization, S.R., P.P. and K.A.; supervision, V.G.; project administration, V.G.; funding acquisition, P.S. All authors have read and agreed to the published version of the manuscript.
Funding
The authors were thankfull to University Grants commission (UGC) for the financial assistance in the form of Senior Research Fellowship (No. 3791/NET-DEC 2018 to P. S.).
Data Availability Statement
All data are contained within the article. Additional details are available from the corresponding author, P.S., upon reasonable request.
Acknowledgments
The authors acknowledge the Indian Agricultural Research Institute (IARI), University Grants commission, Division of Germplasm conservation and Division of Germplasm Evaluation at National Bureau of Plant Genetic Resources (NBPGR) for providing the necessary facilities.
Conflicts of Interest
The authors declare no conflicts of interest. The funders had no role in the design of the study; in the collection, analyses, or interpretation of data; in the writing of the manuscript; or in the decision to publish the results.
References
- Awuchi, C.G. Medicinal plants: the medical, food, and nutritional biochemistry and uses. Int. J. Adv. Acad. Res. 2019, 5, 220–241. [Google Scholar]
- Akbar, S.; Akbar, S. Abrus precatorius L. (Fabaceae/Leguminosae). Handbook of 200 Medicinal Plants: A Comprehensive Review of Their Traditional Medical Uses and Scientific Justifications, 1st ed.; Springer: New York, United States, 2020; pp. 21–32. [Google Scholar] [CrossRef]
- Prabha, M.; Perumal, C.; Kumar, P.; Soundarrajan, S.; Srinivasan. S.R. Pharmacological activities of Abrus precatorius (L.) seeds. Int. J. Pharm. Sci. Res. 2015, 3, 195–200. [Google Scholar] [CrossRef]
- Prabakaran, S.; Bhardwaj, R.; Gupta, V. Profiling Total Phenolic Content of Different Seed Colored Germplasm of Ratti (Abrus precatorius). Indian j. Plant Genet. Res. 2021, 34, 90–92. [Google Scholar] [CrossRef]
- Kumar, S.; Parveen, F.; Narain, P. Medicinal plants in the Indian arid zone, 1st ed.; CAZRI bulletin, Jodhpur, India, 2005; pp. 3.
- Sofi, M.S.; Sateesh, M.K.; Bashir, M.; Ganie, M.A.; Nabi, S. Chemopreventive and anti-breast cancer activity of compounds isolated from leaves of Abrus precatorius L. 3 Biotech. 2018, 8, 1–14. [Google Scholar] [CrossRef] [PubMed]
- Mondal, S.; Ghosh, D.; Anusuri, K.C.; Ganapaty, S. Toxicological studies and assessment of pharmacological activities of Abrus precatorius L.(Fabaceae) ethanolic leaves extract in the management of pain, psychiatric and neurological conditions: An in-vivo study. J. Appl. Pharm. Sci. 2017, 7, 207–216. [Google Scholar]
- Bhatia, M.; Siddiqui, N.A.; Gupta, S. Abrus Precatorius (L.): An Evaluation of Traditional Herb. Indo American J. Pharm. Res. 2013, 3, 3–4. [Google Scholar]
- Bhakta, S.; Das, S.K. The medicinal values of Abrus precatorius: a review study. J. Adv. Biotechnol. Exp. Ther. 2020, 3, 84–91. [Google Scholar] [CrossRef]
- Sandhya, S.; Chandrasekhar, J.; David, B.; Vinod, K.R. Potentiality of hair growth promoting activity of aqueous extract of Abrus precatorius Linn. on Wistar albino rats. J. nat. remedies. 2012, 12, 1–11. [Google Scholar] [CrossRef]
- Solanki, A.; Zaveri, M. Pharmacognosy, phytochemistry and pharmacology of Abrus precatorius leaf: A review. Int. J. Pharm. Sci. Rev. Res. 2012, 13, 71–76. [Google Scholar]
- Adelowotan, O.; Aibinu, I.; Aednipekun, E.; Odugbemi, T. The in-vitro antimicrobial activity of Abrus Precatorius (L.) fabaceae extract on some clinical pathogens. Niger. Postgrad. Med. J. 2008, 15, 32–37. [Google Scholar] [CrossRef]
- Gul, M.Z.; Ahmad, F.; Kondapi, A.K.; Qureshi, I.A.; and Ghazi, I.A. Antioxidant and antiproliferative activities of Abrus precatorius (L.) leaf extracts - an in-vitro study. BMC Complement Altern. Med. 2013, 13, 1–12. [Google Scholar] [CrossRef] [PubMed]
- Palvai, V.R.; Mahalingu, S.; Urooj, A. Abrus precatorius (L.) leaves: antioxidant activity in food and biological systems, pH and temperature stability. Int. J. Med. Chem. 2014, 2014, 1–7. [Google Scholar] [CrossRef]
- Molgaard, P.; Nielsen, S.B.; Rasmussen, D.E.; Drummond, R.B.; Makaza, N.; Andreassen, J. Anthelmintic screening of Zimbabwean plants traditionally used against schistosomiasis. J. Ethnopharmacol. 2001, 74, 257–264. [Google Scholar] [CrossRef] [PubMed]
- Vadivel, K.; Thangabalan, B.; Mahathi, K.; Sindhuri, T.K.; Srilakshmi, T.; Babu, S.M. Evaluation of in-vitro anthelminthic activity of the crude aqueous leaf extracts of Abrus precatorius (L.). J. Pharm. Res. 2012, 5, 2767–2768. [Google Scholar]
- Sohn, S.H.; Lee, E.Y.; Lee, J.H.; Kim, Y.; Shin, M.; Hong, M.; Bae, H. Screening of herbal medicines for recovery of acetaminophen-induced nephrotoxicity. Environ. Toxicol. Pharmacol. 2009, 27, 225–230. [Google Scholar] [CrossRef] [PubMed]
- Oladimeji, A.V.; Valan, M.F. Molecular docking study of bioactive compounds of Abrus precatorius (L.) as potential drug inhibitors against covid-19 protein 6lu7. Kala sarovar. 2020, 23, 18–32. [Google Scholar] [CrossRef]
- Saxena, M.; Saxena, J.; Nema, R.; Singh, D.; Gupta, A. Phytochemistry of medicinal plants. J. Pharmacogn. Phytochem. 2013, 1, 168–182. [Google Scholar] [CrossRef]
- Anand, U.; Jacobo-Herrera, N.; Altemimi, A.; Lakhssassi, N. A comprehensive review on medicinal plants as antimicrobial therapeutics: potential avenues of biocompatible drug discovery. Metabolites. 2019, 9, 258. [Google Scholar] [CrossRef] [PubMed]
- Egbuna, C.; Kumar, S.; Ifemeje, J.C.; Ezzat, S.M.; Kaliyaperumal, S. Phytochemicals as lead compounds for new drug discovery. 1st ed.; Elsevier: Amsterdam, The Netherlands, 2019: pp. 76-78.
- Chen, C. Evaluation of air oven moisture content determination methods for rough rice. Biosyst. Eng. 2003, 86, 447–457. [Google Scholar] [CrossRef]
- Bray, H.G.; Thorpe, W.V. Analysis of phenolic compounds of interest in metabolism. Methods Biochem. Anal. 1954, 1, 27–52. [Google Scholar] [CrossRef]
- Benzie, I.F.; Strain, J.J. The ferric reducing ability of plasma (FRAP) as a measure of antioxidant power: The FRAP assay. Anal. Biochem. 1996, 239, 70–76. [Google Scholar] [CrossRef]
- Horwitz, W.; Albert, R.; Deutsch, M.J.; Thompson, N.J. Precision parameters of methods of analysis required for nutrition labeling. Part I. Major nutrients. J. Assoc. Off. Anal. Chem. 1990, 73, 661–680. [Google Scholar] [CrossRef] [PubMed]
- Oomah, B.D.; Martinez, A.C.; Pina, G.L. Phenolics and antioxidative activities in common beans (Phaseolus vulgaris L.). J. Sci. Food Agric. 2005, 85, 935–942. [Google Scholar] [CrossRef]
- Raj, P.; Kumar, A.; Satyendra, S.; Singh, S.P.; Kumar, M.; Kumar, R.R.; Prasad, B.D.; Kumar, S. Principal component analysis for assessment of genetic diversity in rainfed shallow lowland rice (Oryza sativa L). Curr. Appl. Sci. Technol. 2020, 39, 256–261. [Google Scholar] [CrossRef]
- Aleem, S.; Tahir, M.; Sharif, I.; Aleem, M.; Najeebullah, M.; Nawaz, A.; Batool, A.; Khan, M.I.; Arshad, W. Principal component and cluster analyses as a tool in the assessment of genetic diversity for late season cauliflower genotypes. Pakistan J Agri. Res. 2021, 34, 176–83. [Google Scholar] [CrossRef]
- Yan, W.; Rajcan, I. Biplot Analysis of Test Sites and Trait Relations of Soybean in Ontario. Crop Sci. 2002, 42, 11–20. [Google Scholar] [CrossRef] [PubMed]
- Girgel, U. Principle component analysis (PCA) of bean genotypes (Phaseolus vulgaris L.) concerning agronomic, morphological and biochemical characteristics. Appl. ecol. environ. res. 2021, 19, 1999–2011. [Google Scholar] [CrossRef]
- Bratchell, N. Cluster analysis. Chemometrics and Intelligent Laboratory Systems. 1989, 6, 105–125. [Google Scholar] [CrossRef]
- Lee, N.; Yoo, H.; Yang, H. Cluster analysis of medicinal plants and targets based on multipartite network. Biomol. 2021, 11, 546. [Google Scholar] [CrossRef]
- Ajaykumar, R.; Harishankar, K.; Chandrasekaran, P.; Navinkumar, C.; Sekar, S.; Sabarinathan, C.; Reddy, B.K. Principle component analysis (PCA) and character interrelationship of irrigated blackgram [Vigna mungo (L.) Hepper] influenced by liquid organic biostimulants in Western Zone of Tamil Nadu. Legume Res. 2023, 46, 346–52. [Google Scholar] [CrossRef]
- Maia, M.C.; Almeida, A.D.; Araujo, L.B.; Dias, C.D.; deOliveira, L.C.; Yokomizo, G.K.; Rosado, R.D.; Cruz, C.D.; Vasconcelos, L.F.; Lima, P.D.; Macedo, L.M. Principal component and biplot analysis in the agro-industrial characteristics of Anacardium spp. Eur. Sci. J. 2019, 15, 21–31. [Google Scholar] [CrossRef]
- Mahto, D.; Singh, P.K.; Parveen, R.; Nahakpam, S.; Kumar, M. Estimation of genetic diversity by principal component analysis of yield attributing traits in Katarni Derived Lines. Journal of Rice Res. 2022, 15, 63–69. [Google Scholar] [CrossRef]
Figure 1.
Scree plot of principal component analysis based on various biochemical parameters of Abrus precatorius germplasm.
Figure 1.
Scree plot of principal component analysis based on various biochemical parameters of Abrus precatorius germplasm.
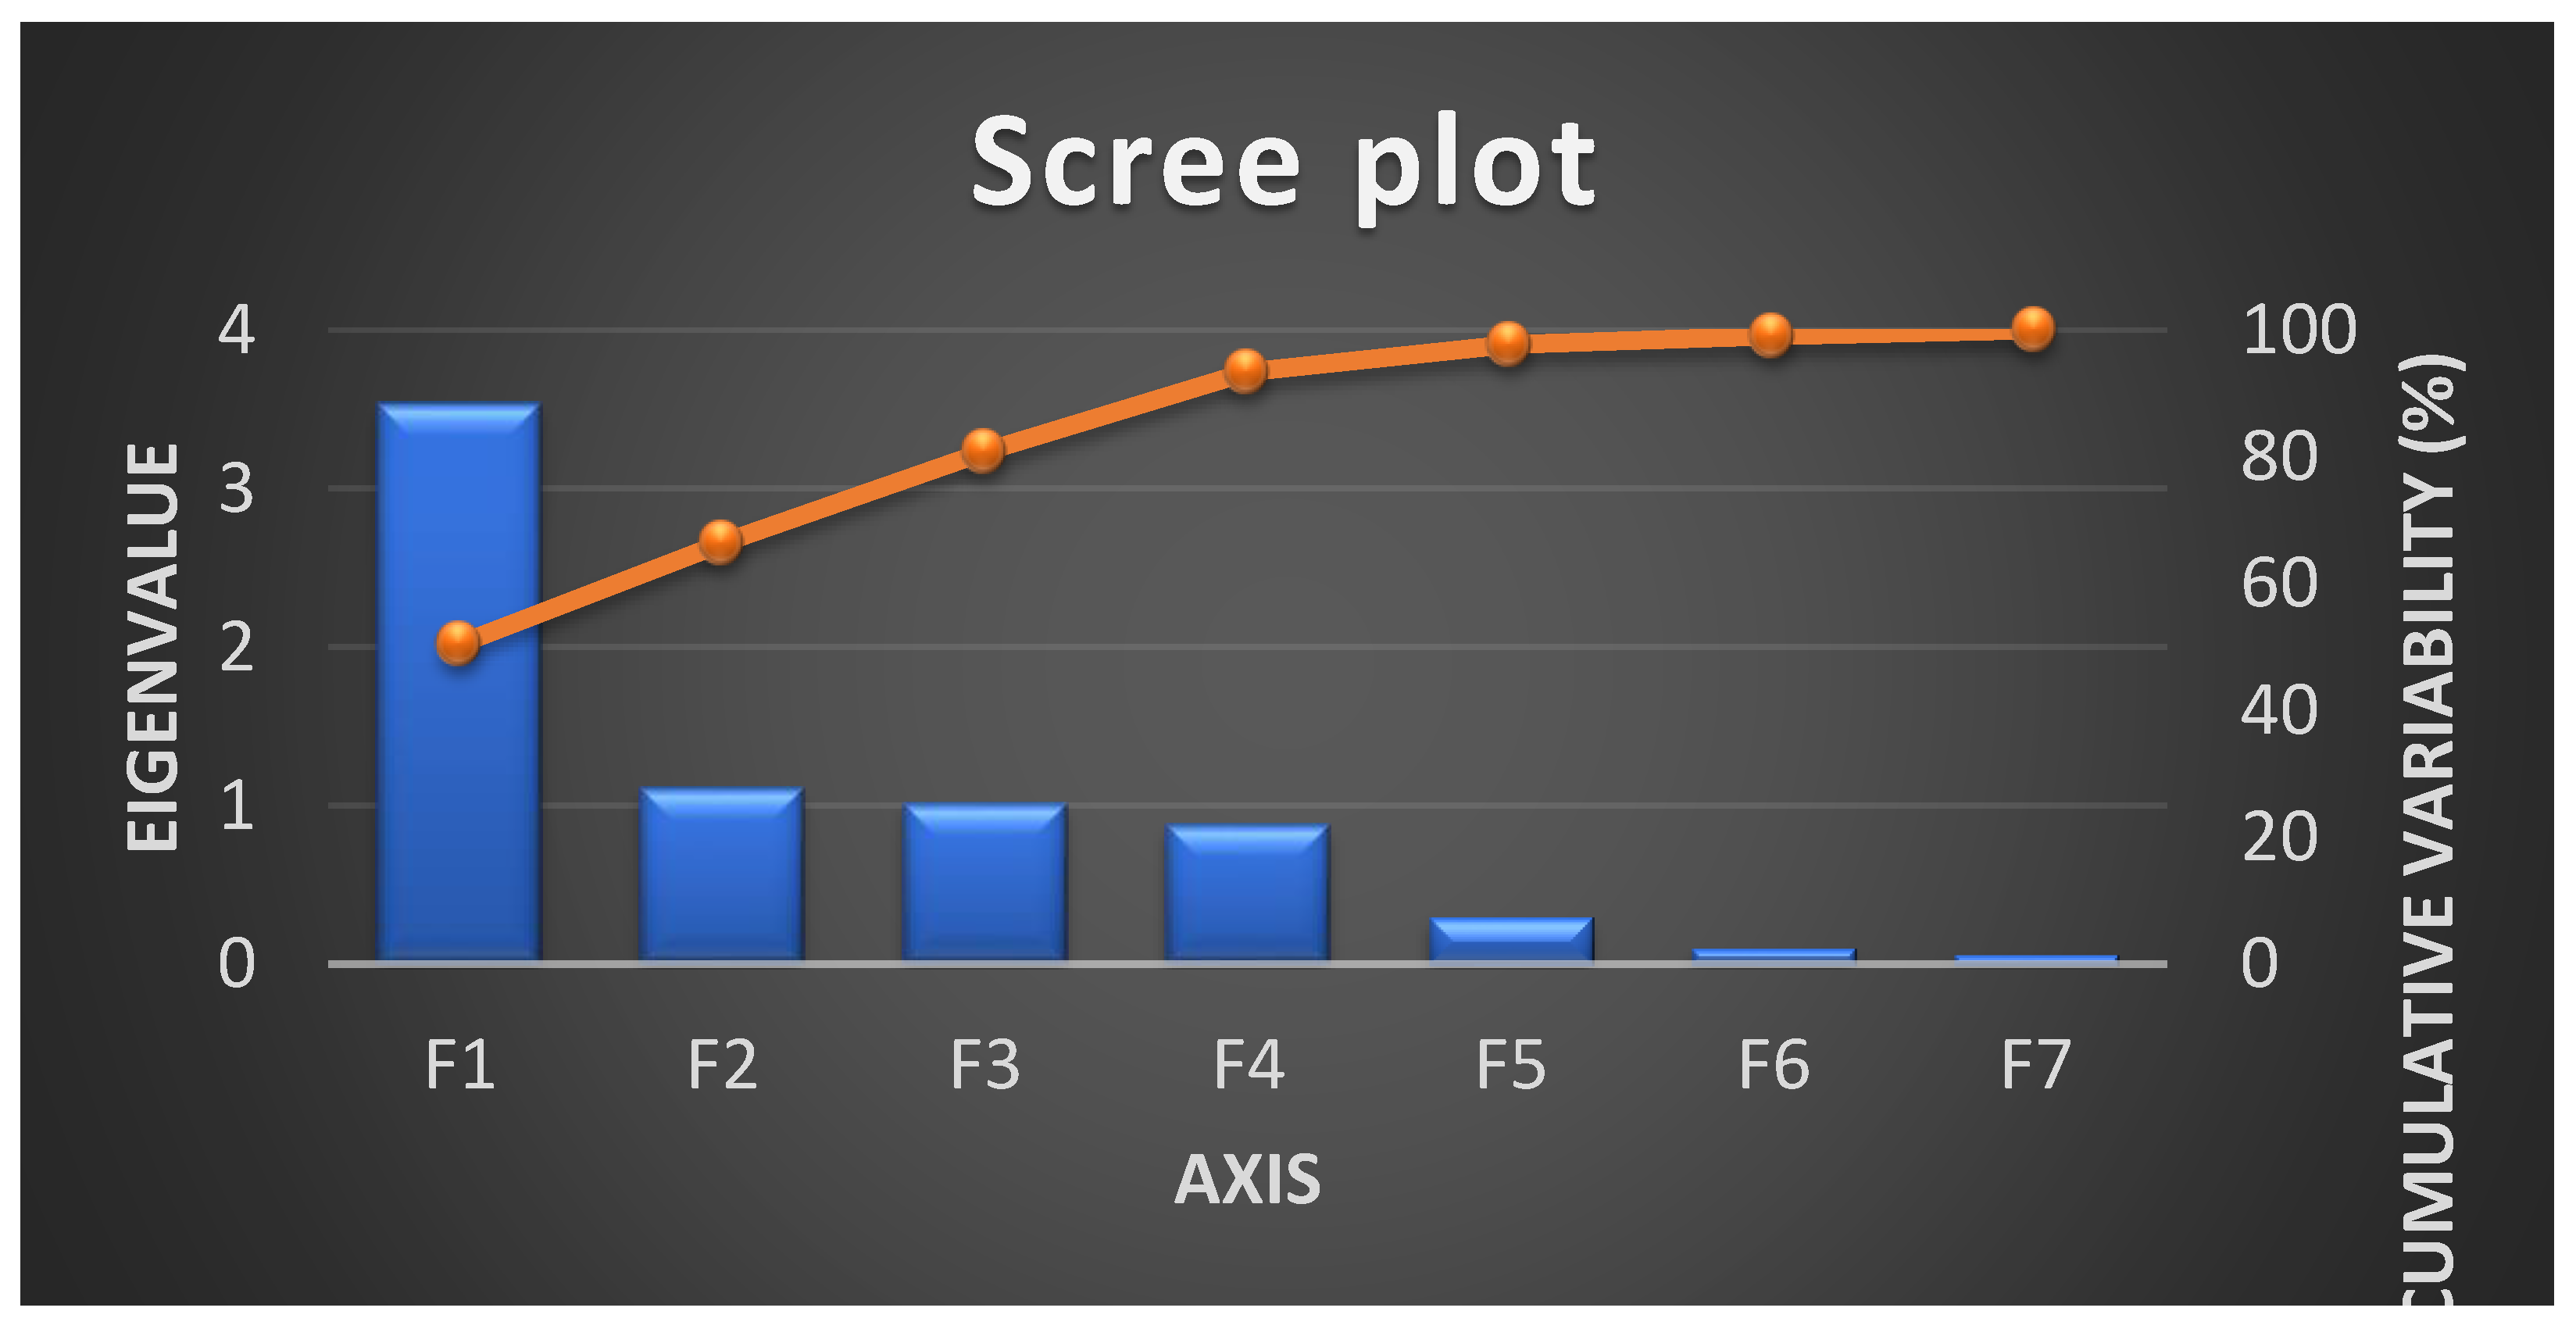
Figure 2.
Biplot of principal component analysis based on biochemical parameters of Abrus precatorius accessions.
Figure 2.
Biplot of principal component analysis based on biochemical parameters of Abrus precatorius accessions.
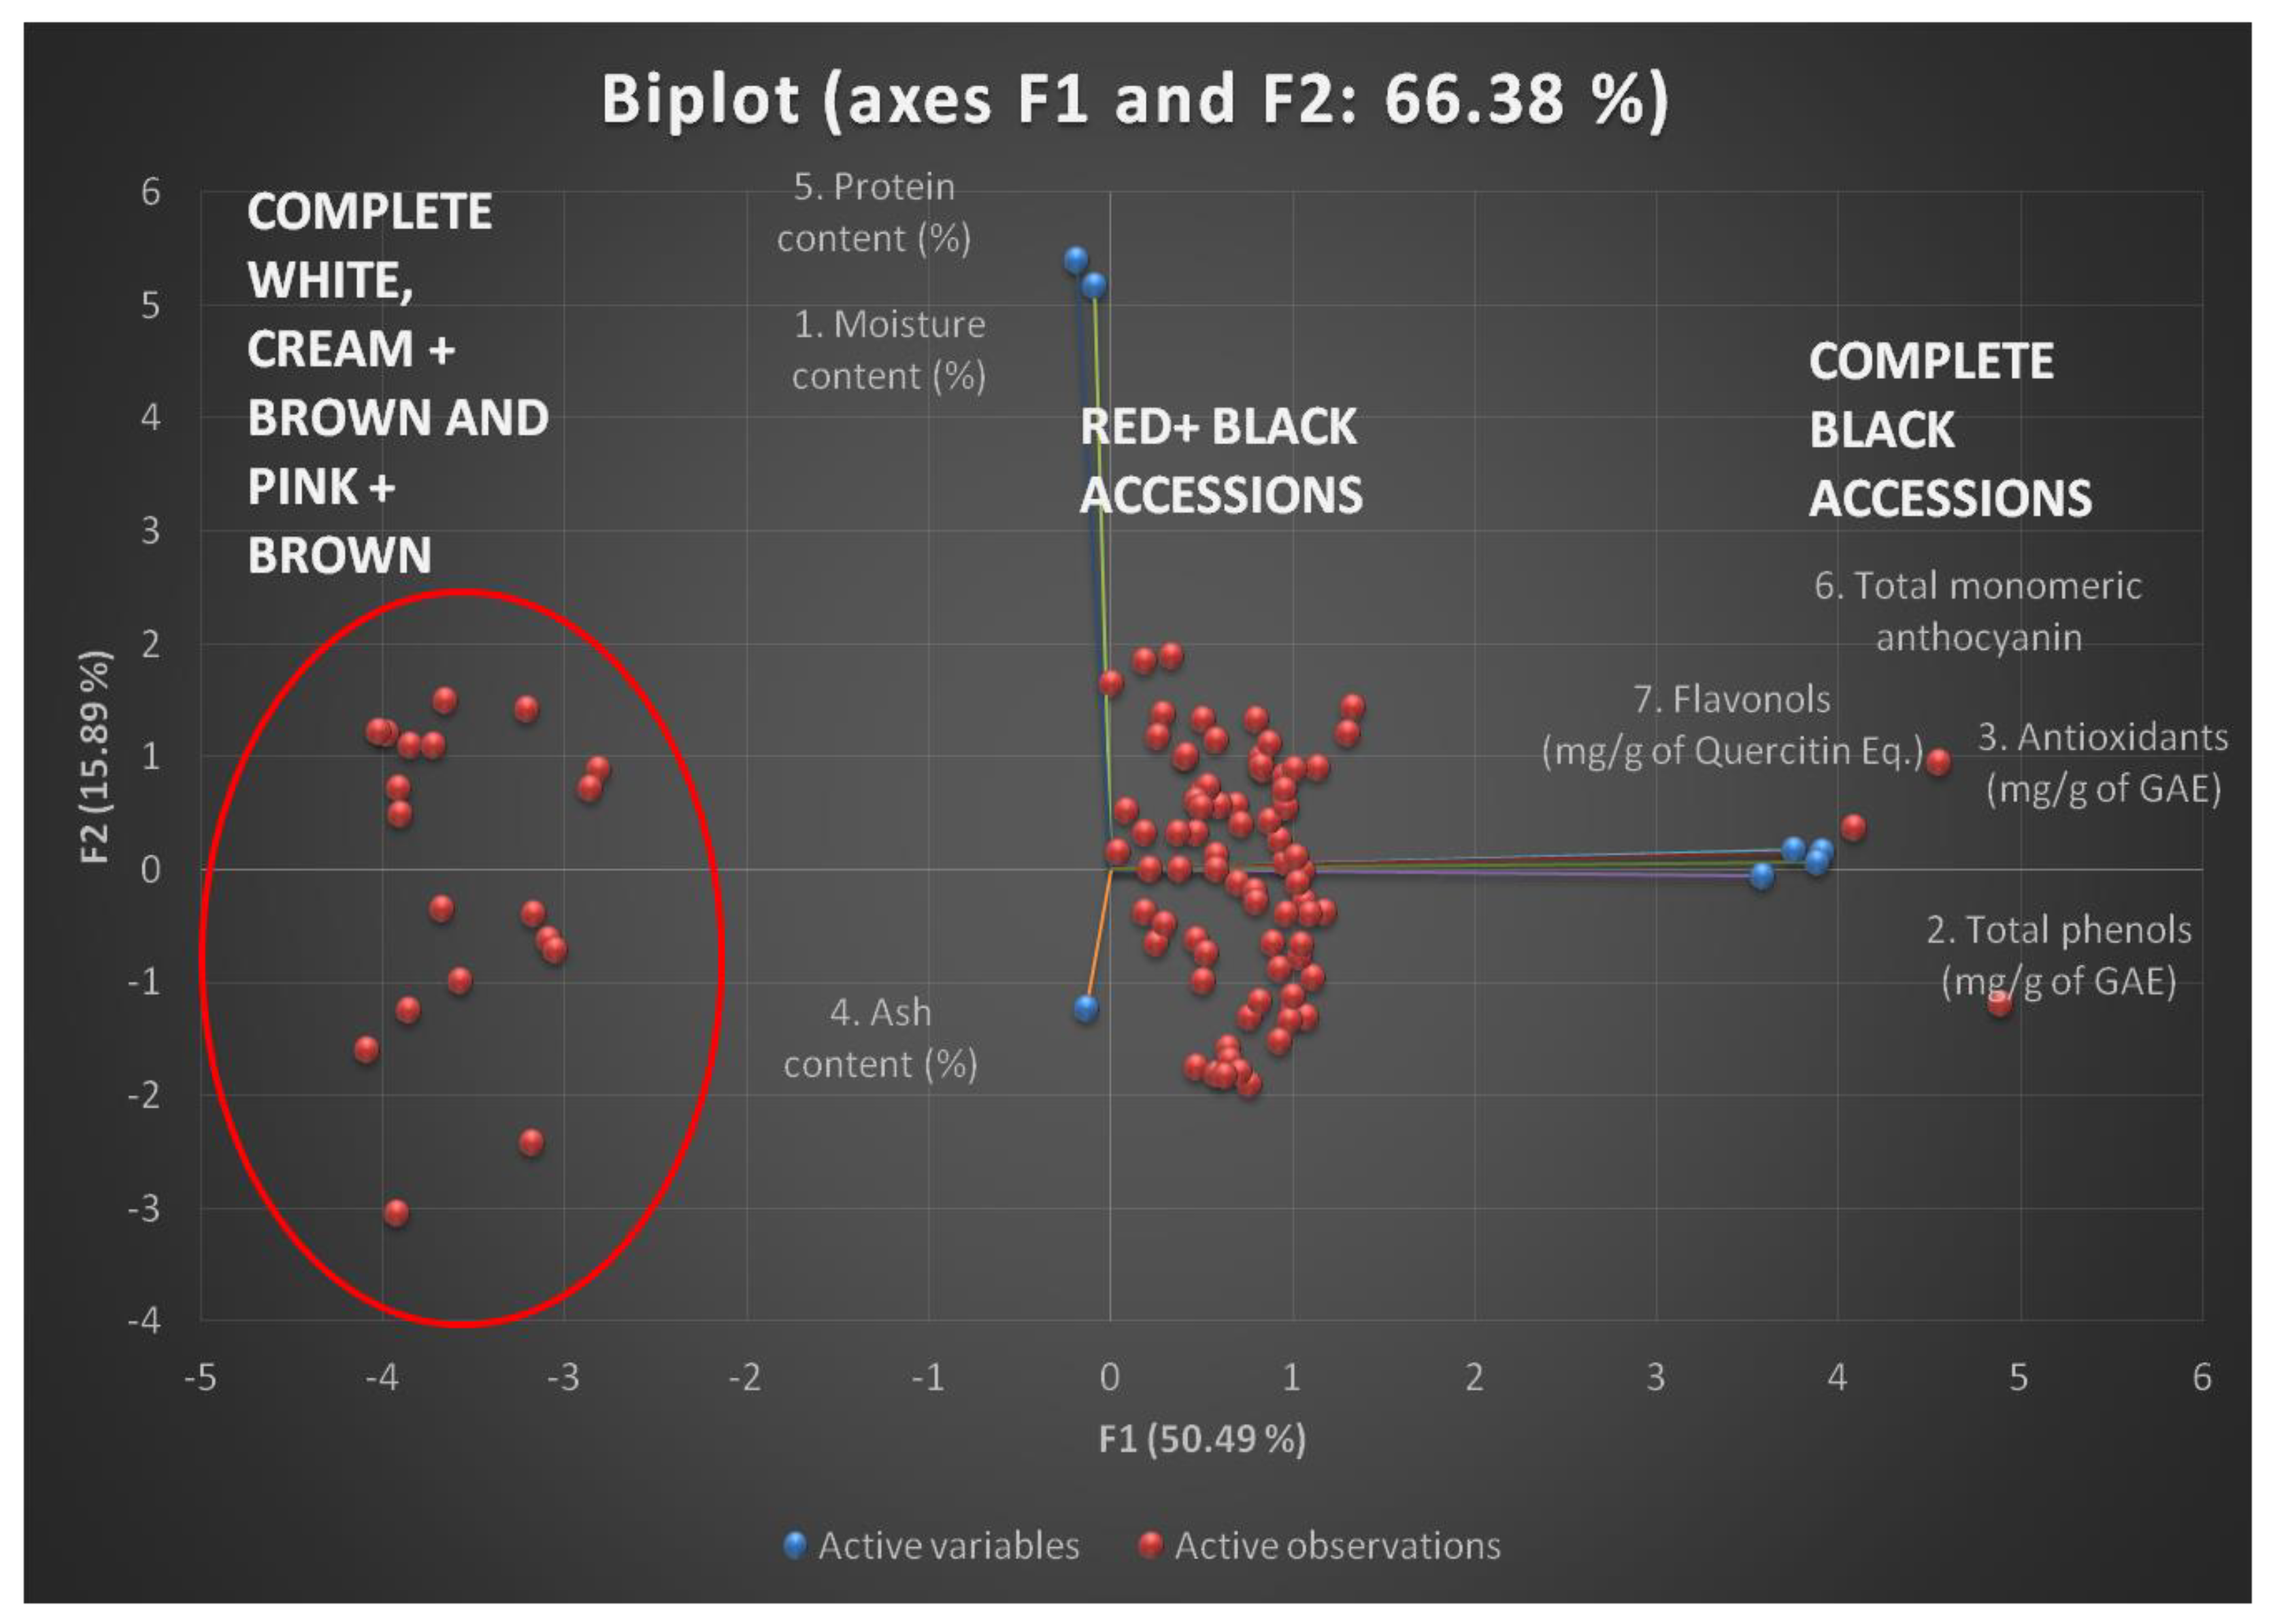
Figure 3.
Dendrogram and cluster analysis based on the biochemical parameters of Abrus precatorius accessions.
Figure 3.
Dendrogram and cluster analysis based on the biochemical parameters of Abrus precatorius accessions.
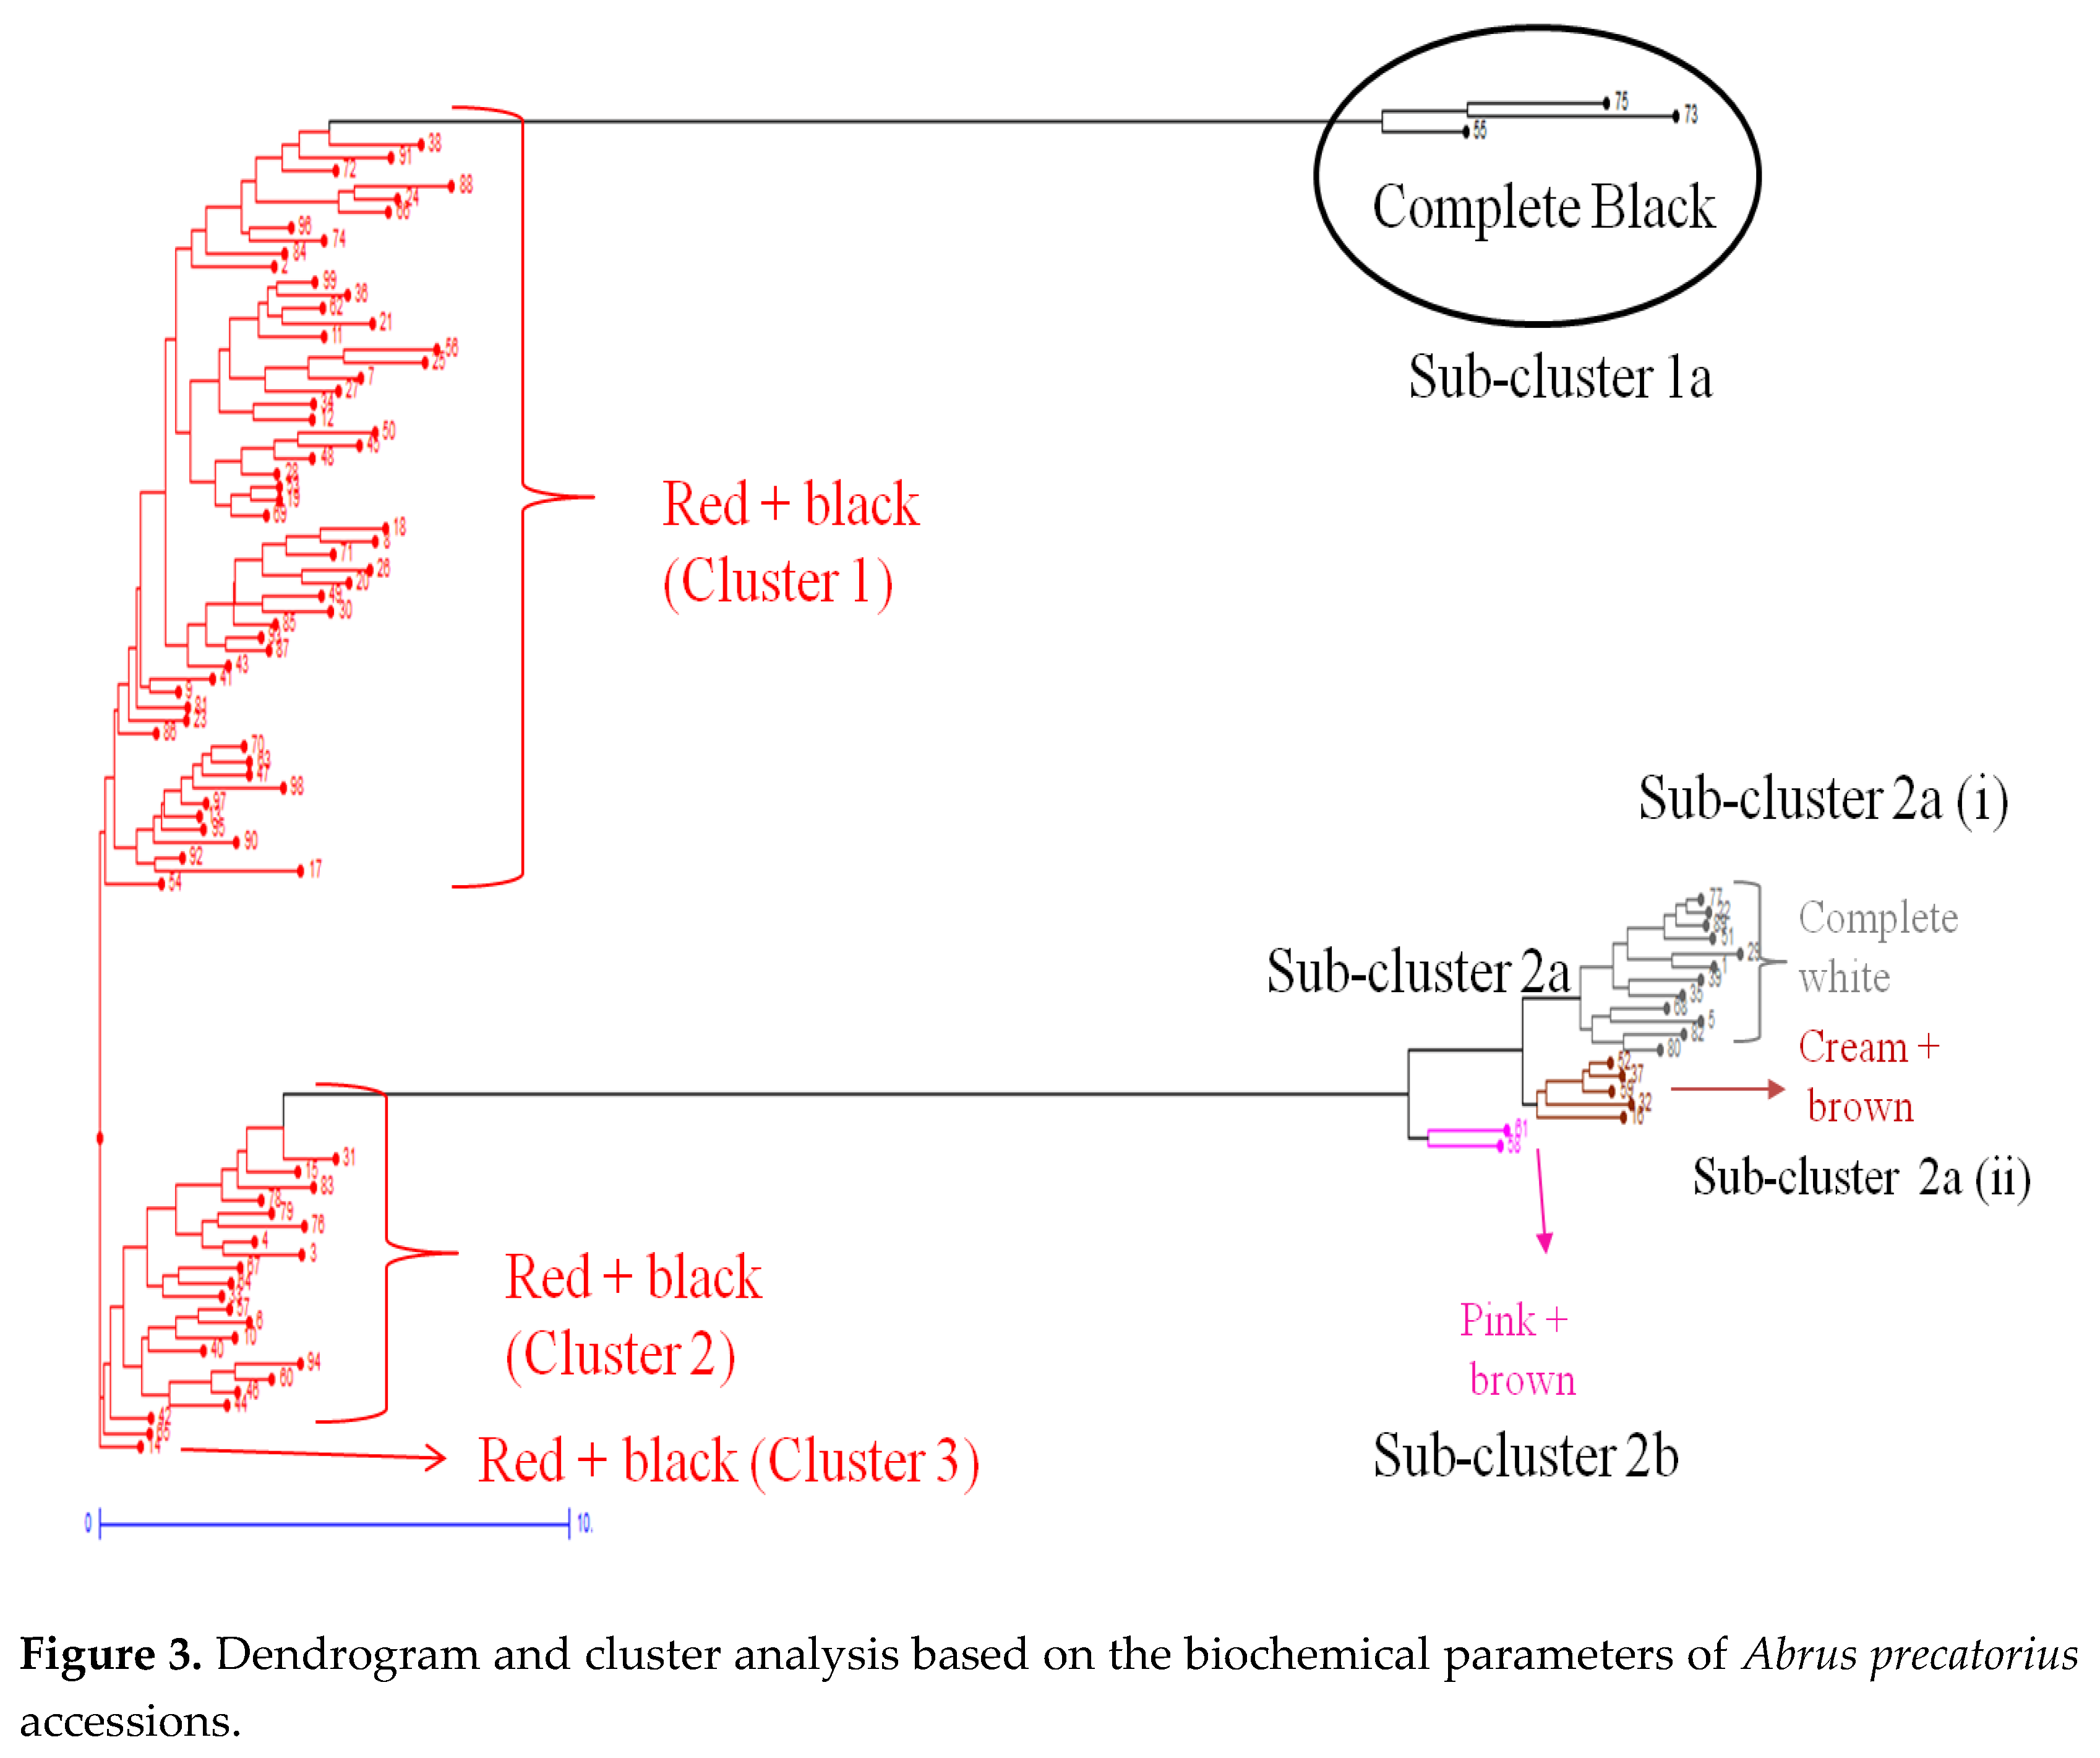

Table 1.
Eigen values and variability % of different principal components based on various biochemical parameters of Abrus precatorius germplasm.
Table 1.
Eigen values and variability % of different principal components based on various biochemical parameters of Abrus precatorius germplasm.
| F1 | F2 | F3 | F4 | F5 | F6 | F7 | ||
| Eigenvalue | 3.53 | 1.11 | 1.01 | 0.88 | 0.30 | 0.10 | 0.06 | |
| Variability (%) | 50.49 | 15.89 | 14.48 | 12.59 | 4.23 | 1.42 | 0.90 | |
| Cumulative % | 50.49 | 66.38 | 80.86 | 93.45 | 97.68 | 99.10 | 100.00 |
Table 2.
Factor loadings of five principal components which was based on the biochemical analysis in the Abrus precatorius accessions.
Table 2.
Factor loadings of five principal components which was based on the biochemical analysis in the Abrus precatorius accessions.
| F1 | F2 | F3 | F4 | F5 | |||||||||
| 1. Moisture content (%) |
-0.022 | 0.719* | 0.353 | -0.596 | 0.050 | ||||||||
| 2. Total phenols (mg/g of GAE) |
0.888* | -0.008 | 0.006 | 0.084 | 0.438 | ||||||||
| 3. Antioxidants (mg/g of GAE) |
0.933* | 0.024 | 0.049 | -0.051 | -0.295 | ||||||||
| 4. Ash content (%) |
-0.033 | -0.171 | 0.932* | 0.316 | -0.010 | ||||||||
| 5. Protein content (%) |
-0.046 | 0.751* | -0.127 | 0.645 | -0.033 | ||||||||
| 6.Total monomeric anthocyanin (mg/100g of C3G) |
0.971* | 0.021 | 0.008 | -0.013 | -0.119 | ||||||||
| 7. Flavonols (mg/g of QE) |
0.964* | 0.010 | -0.027 | 0.013 | 0.001 | ||||||||
GAE – Gallic acid equivalent; C3G - Cyanidin-3-glucoside; QE - Quercetin equivalent. * indicates significant association between the principal component and biochemical parameters
Table 3.
Cluster wise groupings of 99 Abrus precatorius accessions studied on the basis of biochemical parameters.
Table 3.
Cluster wise groupings of 99 Abrus precatorius accessions studied on the basis of biochemical parameters.
| Cluster | Sub- cluster | Accessions | Count |
|---|---|---|---|
| 1 | - | IC0553765, IC0400421, IC0397770, IC0322320, IC397936, IC0564539, IC0553727, IC0262948, IC0260022, IC0385638, IC0469946, IC0418116, IC0345234, IC261421, IC0526820, IC0391898, IC0329886 , IC0526819, IC0564695, IC0392859, IC0261023, IC0469934, IC0261408, IC0469932, IC0261401, IC0263057, IC0392836, IC0470438, IC0470922, IC0418103, IC0552617, IC0308748, IC0310646, IC0281057, IC0617322, IC0385619, IC0420958, IC0391888, IC0553504, IC0469963, IC0418119, IC0617321, IC0469967, IC0627451, IC0371792, IC0337216, IC0418115, IC0538733, IC0605146, IC0370449, IC0619016, IC0306236, IC376080, IC0469931 and IC0418097 | 55 |
| a | IC0401666, IC0405311 and IC0605143 | 3 | |
| 2 | - | IC0564732, IC0418120, IC0430717, IC0349804, IC0588655, IC0337202, IC0418096, IC0263011, IC0391892, IC0400325, IC0392838, IC0315333, IC0469939, IC0316266, IC0405295, IC0405304, IC0385520, IC0310926, IC0280795, IC0369145 and IC0400380 | 21 |
| 2a (i) | IC0400492, IC0545109, IC0430870, IC0311747, IC0322486, IC0392840, IC0385635, IC0254919, IC0603047, IC0385644, IC0310647 and IC0395270 | 12 | |
| 2a (ii) | IC0349819, IC0306198, IC0392839, IC0470979 and IC0392846 | 5 | |
| 2b | IC0405305 and IC 392860 | 2 | |
| 3 | - | IC0310855 | 1 |
Table 4.
Mean values of different cluster based on seven biochemical parameters in Abrus precatorius accessions.
Table 4.
Mean values of different cluster based on seven biochemical parameters in Abrus precatorius accessions.
|
Cluster |
Sub- cluster |
Seed color |
1. Moisture content (%) |
2.Total phenols (mg/g of GAE) |
3. Antioxidants (mg/g of GAE) |
4. Ash content (%) |
5. Protein content (%) |
6.Total monomeric Anthocyanin (mg/100g of C-3-G.) |
7. Flavonols (mg/g of QE) |
|---|---|---|---|---|---|---|---|---|---|
| 1 | - | Red + black | 12.37 | 27.61 | 12.11 | 3.24 | 18.05 | 28.63 | 45.31 |
| a | Complete black | 12.17 | 42.47 | 13.60 | 3.27 | 18.10 | 49.80 | 63.54 | |
| 2 | - | Red + black | 12.26 | 27.91 | 12.67 | 3.34 | 17.69 | 25.22 | 44.16 |
| 2a (i) | Complete white | 12.43 | 18.57 | 1.13 | 3.40 | 18.11 | 0.00 | 26.84 | |
| 2a (ii) | Cream + brown | 11.64 | 23.69 | 1.96 | 3.13 | 17.84 | 0.00 | 27.66 | |
| 2b | Pink + brown | 13.07 | 23.07 | 2.37 | 3.12 | 18. 54 | 0.00 | 33.28 | |
| 3 | - | Red + black | 12.30 | 28.39 | 12.84 | 4.00 | 18.25 | 27.37 | 43.63 |
GAE – Gallic acid equivalent; C3G - Cyanidin-3-glucoside; QE - Quercetin equivalent.
Disclaimer/Publisher’s Note: The statements, opinions and data contained in all publications are solely those of the individual author(s) and contributor(s) and not of MDPI and/or the editor(s). MDPI and/or the editor(s) disclaim responsibility for any injury to people or property resulting from any ideas, methods, instructions or products referred to in the content. |
© 2024 by the authors. Licensee MDPI, Basel, Switzerland. This article is an open access article distributed under the terms and conditions of the Creative Commons Attribution (CC BY) license (https://creativecommons.org/licenses/by/4.0/).
Copyright: This open access article is published under a Creative Commons CC BY 4.0 license, which permit the free download, distribution, and reuse, provided that the author and preprint are cited in any reuse.


