Submitted:
01 July 2024
Posted:
01 July 2024
You are already at the latest version
Abstract
Increasing nitrogen use efficiency (NUE) by improving agricultural practices, soil knowledge and implementing precision agriculture, is essential to reduce the overuse of fertilisers and increase nutrient retention. This study aimed to optimise N management in agriculture by establishing a critical N dilution curve (CNDC) and analysing variations in NUE and N nutrition index (NNI) among different crops under various treatments. Using a Bayesian model, the CNDC was determined as %Nc = 3.63 * PDM-0.71. The results presented that plant dry matter (PDM) and plant N content (PNC) varied significantly with crop type and sampling moments. Strong positive correlations are presented by PDM with N uptake (NUp) (0.89) and NNI (0.88), along with an inverse correlation with critical N concentration (-0.95). The study found that crops under irrigation conditions had higher NUp and higher NNI. This study provides valuable insights into the influence of key management decisions on the N nutritional status of annual ryegrass-based forage crops. The results highlight the critical role of accurate and conscious decision-making in improving NUE and crop yields, emphasising the complex interactions between biomass production and N dynamics in crops. The conclusions allow significant benefits to be realised, contributing to the sustainability of agricultural systems.
Keywords:
critical nitrogen concentration
; data-driven approach
; crop yield
; site-specific analysis
; sustainability
; variable rate fertilisation.
1. Introduction
The instability and high level of fertiliser prices is a problem. Fertiliser costs represent for farmers in the European Union, on average, around 6% of input costs and can reach up to 12% for arable crop producers [1]. Increasing nitrogen use efficiency (NUE) by improving agricultural practices, soil knowledge and implementing precision agriculture, as well as strengthening pollution prevention through nitrate action programmes, are essential to reduce the overuse of fertilisers and increase nutrient retention. These efficiency gains, as well as leading to clear benefits, will reduce tensions in the world market [1,2]. Adapting the agronomic practices is essential and has the potential to stabilise or increase yields, especially in mediterranean areas, in response to the specific regional constraints [3].
Diagnosing the crop’s N nutritional status based on the plant’s N concentration relies on the concept of critical N concentration (%Nc), which is defined by the N concentration required to achieve maximum vegetative growth [4]. The dilution of N in plant tissues during crop growth has been widely discussed by various authors, who have applied different mathematical models to describe it. Initially, Lemaire et al., [5] established the concept of the critical N dilution curve (CNDC). This allometric approach describes the decline in %Nc as the accumulation of plant dry matter (PDM; t ha-1). By measuring %Nc, it is possible to determine its N Nutrition Index (NNI), quantifying the intensity of the deficit or luxury consumption of the macronutrient [6]. For a given amount of PDM, NNI can be estimated by comparing the current plant N concentration (PNC; %) with the %Nc calculated by the CNDC [7]. An NNI value equal to or close to 1 means the crop is at the optimum value to achieve maximum yield. This value can be used as a yield and quality reference to correct gaps in crop management [8]. It should be noted that the NNI can only diagnose the N status of the crop but cannot quantify the dose of N to be applied in top dressing, especially when the NNI is less than 1.
Makowski et al., [9] were concerned that these CNDC’s (sequential method) did not have the level of uncertainty with which they predict the %Nc and recommended the Bayesian model (hierarchical method) to estimate the parameters of the CNDC from experimental data in a single step. Using freely available software, the model can estimate the curve parameters directly from the PDM-PNC data pair. Lacasa et al., [10] compared both statistical methods and evaluated their performance, considering different observation times throughout the crop cycle, different fertiliser doses, and different levels of measurement accuracy. They presented that the sequential models result in poor statistical properties of the estimated parameters and overestimate the %Nc values. The estimates of N requirements to reach N sufficiency levels exceeded the values estimated by the hierarchical model by around 30 to 100 kg N ha-1. Lacasa et al., [10] corroborate the model presented by Makowski et al., [9] indicating that its use reduces the risk of over-fertilization.
In addition, losses of N into the environment have become a major concern. The knowledge of the NUE and its components is important to determine crop N requirements and to define N fertilisation strategies that reduce N losses and, consequently, the risks of environmental contamination [11]. Variations in N use parameters could be expected for the same value of the NNI, because of different PDM values in response to genotype (G) x management (M) x environmental (E) conditions. Quantitatively assessing N use parameters in response to the N nutrition index will enhance our understanding of how these parameters vary under different G x M x E conditions. This is achieved by isolating the effects of nutritional status and biomass on these parameters. Additionally, this approach will help define a reference value for N use parameters under optimal N nutritional status. This reference value can be used to benchmark N management practices aimed at improving NUE in sustainable agricultural systems [12].
In this paper, we will i) find the CNDC that most closely matches our database in annual ryegrass-based forage crops, using the Bayesian method, and estimate the NNI; ii) assess the relationship between forage yield, N use parameters, and the NNI in response to different ryegrass-based crops, N treatments, rainfed vs irrigated crops, and different moments of crops cycle.
2. Materials and Methods
2.1. Field Experiments
The experimental trials were conducted in Herdade da Comenda - Innovation Centre of the National Institute for Agricultural and Veterinary Research (INIAV), in Caia, Elvas, Portugal (38°53’38.52‘N and 7°3’19.01′W) during the 2022-2023 autumn/winter agricultural season. The trial design followed a split-plot randomised block model [13,14]. The main block had 3 doses of N topdressing (N0, N1 and N2 with 0, 120 and 200 kg ha-1 of fertiliser with 27% N, respectively). The sub-blocks had two different forage crops, and the sub-sub-blocks had two irrigation management scenarios (rainfed vs irrigated). The plots in the blocks had a total size of 2 x 8 metres (Figure 1). Each plot was replicated 4 times, totalling 48 plots. They were set up in a flat location to avoid influencing potential runoff of water or nutrients.
The crops of i) annual ryegrass and ii) forage intercropping based on annual ryegrass and clovers (Table 1), were sown separately with an inter-row of 0.18 m and a depth of 0.01 m. The sowing doses were 1,400 seeds m-2 for annual ryegrass and 4,070 seeds m-2 for intercropping [15], seeded on 7th November 2022. Before sowing, on 28th October 2022, sufficient doses of phosphorus (16.1 kg ha-1 P2O5) and potassium (13.8 kg ha-1 K2O) were applied, along with a dose of N (27.6 kg ha-1 N) distributed evenly across all the plots to ensure correct crop emergence. Irrigation was also applied evenly at this time. Weeds and diseases were controlled following good experimental practices.
The predominant soil at the test site, according to the FAO classification, is a Luvisol which corresponds to a type of Mediterranean soil Pag and Sr [16], and the climate, according to Köppen-Geiger is Csa [17].
At two stages in the crop cycle (ryegrass tillering - t1; ryegrass stem elongation - t2), plants were cut 5 cm above the ground in a sub-sampling area (1 m × 1 m) at the northernmost point of each plot. In total, 98 samples were collected. These samples included all vegetation above the cutting height within the area, allowing for the estimation of plant fresh matter. The samples were dried in an oven at 60 °C until they reached a constant dry weight (approximately 24-48 hours). After drying, the samples were weighed to determine the PDM. They were then ground and analysed using the Kjeldahl method [18] to estimate the PNC. This process collected the PDM-PNC data pair for each plot.
2.2. Fit CNDC
The R code created by Makowski et al. [9] was used to adjust the CNDC, in which the PDM-PNC data pairs from each experiment plot were entered. CNDC settings were developed in RStudio©v.2023.4.3.2 with R©rjags Package v. 4-15 CRAN Repository [19,20]. With this adjustment, the values of the A1 and A2 parameters of the CNDC (Equation 1) were estimated, using the most appropriate curve for estimating the %Nc of these crops, installed by no-till in sandy soil, in this particular year.
where %Nc is the total concentration of N in the forage (which produces an amount of plant dry matter (PDM; t ha-1), expressed in g N kg-1 of forage PDM; A1 is the coefficient that represents the %Nc of the forage at 1 t PDM ha-1; and A2 is the coefficient that characterises the pattern of decrease in %Nc during crop growth [21].
%Nc = A1 x PDM-A2,
Since the model for calculating the CNDC should not incorporate data pairs with PDM of less than 1 t ha-1, of the 96 initial pairs, only 58 were considered for adjusting the N curve. The %Nc was calculated based on the PNC of annual ryegrass and intercropping together, because, given the similarities in the crops, other authors have already proven that the values of the CNDC parameters do not change from one crop to another [22,23]. The curves achieved by other authors in fodder crops, already described in the introduction and specified in Table 2, were considered.
Following the Lemaire et al., [5] CNDC validated for fescue, Greenwood et al., [24] proposed simplifying by creating a general curve for C3 crops and another for C4 crops. However, other authors created and validated CNDCs specifically for forage crops such as rainfed annual ryegrass [11], timothy grass [25], perennial ryegrass [26], irrigated annual ryegrass, oats and again for fescue [27], and hybrid-annual ryegrass [6]. These curves differ, and the value of A1 varies between 3.2 and 6.3, and the value of A2 is between 0.26 and 0.71 (Table 1). These variations prove the consensus presented by most authors that these curves vary depending on the year (climatic conditions), the crop, the variety and the crop management practised.
2.3. N Use Parameters and NNI
NUE and its two parameters: N uptake (NUp; Equation 2) and N uptake efficiency (NUpE; Equation 3) were calculated according to that presented by Marino et al., [11].
NUp = PDM x PNC,
NUp is the N uptake by the crop in kg ha-1, expressing the amount of N absorbed in PDM per hectare. It is the result of multiplying PDM with PNC. Equation 3 presents the formula for calculating NUpE.
NUpE = [(NUp fertilized plot – NUp control plot)/N applied] x 100,
NUpE (N Uptake Efficiency) measures the efficiency of N utilization in percentage. It is calculated by the difference in N absorption (NUp) between the fertilized plots and the control plots, divided by the amount of N applied (kg ha⁻¹). Finally, the calculation of NUE (N Use Efficiency) is present in Equation 4:
NUE = (PDM of N-fertilized plot – PDM of control plot)/N applied,
NUE (kg kg⁻¹ N) represents the amount of PDM produced per kg of N applied. It is calculated by dividing the difference between the PDM of the fertilised plot (kg ha⁻¹) and the PDM of the control plot (kg ha⁻¹) by the amount of N applied (kg ha⁻¹).
Knowing the value of PNC and %Nc, it was possible to calculate the NNI using the ratio between these two parameters (Equation 5):
where PNC is the actual concentration of the N in plants and %Nc is the optimum concentration of N in the plant.
2.4. Statistical Analysis
A statistical and inferential analysis was carried out to begin analysing the general data, including the coefficient of variation, standard deviation and interquartile analysis, in RStudio©v.2023.4.3.2 with R©psych Package v. 2.4.3 CRAN Repository [19,28]. The data was then grouped by crop, moment, N treatment, irrigation management and the dependent variables (the parameters PDM, PNC, NUp, NUpE, %Nc and NNI).
The Shapiro-Wilk test was applied to each dependent variable as a normality test. Variables with a non-normal distribution were analysed using the Kruskal-Wallis test and those with a normal distribution were analysed using ANOVA, as present in Figure 2.
The post-hoc analyses that followed the Kruskal-Wallis test were Dunn’s test in RStudio©v.2023.4.3.2 with R©dunn.test Package v. 1.3.6 CRAN Repository [19,29]. In the case of post-hoc analyses following ANOVA, Tukey’s HSD test was used.
Finally, a correlation matrix was used to find strong relationships between the dependent variables.
3. Results
3.1. Critical N Dilution Curve
The CNDC of the crops under study was established using the Bayesian statistical model, according to Makowski et al., [9]. The confidence interval (CI) associated with all the data (PDM and PNC) recorded was 97.5%. Samples with PDM less than 1 t ha-1 were excluded from the curve fitting. The A1 and A2 parameters range from 3.18 to 3.87 and 0.53 to 0.72, respectively. Finally, the CNDC that was determined is %Nc = 3.63 * PDM-0.71 (Table 3).
Figure 3 presents the distribution of the estimated A1 (a) and A2 (b) parameters.
3.2. Variations of Crops N Use Parameters and NNI
To analyse and interpret the data for the dependent variables, various descriptive and inferential statistics were examined for the two variables and the results are present in Table 4.
The variables vary in sample size, but all are relatively large and provide statistically robust results. The parameters PDM and PNC have positive asymmetry, with PDM (0.67) and PNC (0.66) indicating a longer tail to the right. PDM has negative kurtosis (-0.58), indicating a flatter distribution. Indicating a more pointed distribution, PNC has positive kurtosis (0.27).
The NUp presents an asymmetrical distribution to the right and positive kurtosis, indicating a more pointed distribution than normal. The NUpE presents high variability and large amplitude, but the distribution is relatively symmetrical and flat. The NUE has high variability, large amplitude and a symmetrical distribution, but it is flatter than normal. The %Nc presents a slightly right symmetrical and flat distribution. The NNI has an asymmetrical distribution to the right and is more pointed than normal. Most variables present high variability and do not follow a normal distribution (except for NUpE and NUE). As for asymmetry and kurtosis, most variables present positive asymmetry (on the right) and several have negative kurtosis (flat distributions).
The histograms in Figure 4 provide a graphical analysis of these results.
The PDM histogram confirms that this variable has a slightly asymmetrical distribution to the right, with most values concentrated between 0 and 3.5 tonnes ha-1. The distribution of PNC is slightly asymmetrical to the right, with most values between 1.5 and 2 %. The distribution of NUp is also asymmetrical to the right, as are the distributions of NUpE (slightly asymmetrical), %Nc and NNI. Only the NUE distribution is centred. NUp has the most concentrated values between 20 and 80 kg ha-1, NUE between -20 and 40 kg N ha-1, %Nc between 1.5 and 2.5 %, and NNI between 0.5 and 1.5. NUpE presents negative values, which indicate possible measurement problems or extreme conditions.
The boxplots present in Figure 5 provide a view of the quartiles, medians and extreme values, as well as some outliers for each variable.
All the boxplots indicate the presence of outliers at the top. These boxplots confirm that the PDM median is close to 1.5 t ha-1, the PNC median is close to 1.6 %, the NUp median is close to 45 kg ha-1, the NUpE median is close to 30 %, the NUE median is close to 10 kg N ha-1, and finally the %Nc and NNI medians are close to 2 % and 1, respectively.
The Q-Q plots in Figure 6 compare the data distribution with the theoretical normal distribution.
All the Q-Q Plots present deviations from the straight-line points, especially at the ends. This deviation is significant mainly for NUp and very large for NUpE, which confirms the presence of outliers.
After removing the outliers, the statistical analysis was carried out, and the cleaned data is presented in Table 5.
3.1.1. Variables with Non-Normal Distribution
The data for the PDM, PNC, NUp, %Nc and NNI variables do not follow a normal distribution, so the Kruskal-Wallis test was used as a non-parametric alternative to assess the influence of the factors: Crop, Moment, Irrigation and N treatment factors. The results of the Kruskal-Wallis test are presented in Table 6.
The results of the Kruskal-Wallis test indicate that there is a significant difference between the Crop groups for PDM and a highly significant difference between the Moment groups also for PDM. Among the Irrigation groups, there is marginal significance for the same variable. There is no significant difference between the N treatment groups for PDM.
For PNC, there is a highly significant difference between the Crop groups and a significant difference between the Moment groups. There is no significant difference between the Irrigation and N treatment groups for PNC.
The NUp has a significant difference by Irrigation, and there is a marginal influence between Crop and N treatment groups. Moment was not considered for NUp because the data is only from t2. At t1, the application of N and water had not yet taken place.
The Moment groups present a highly significant difference for %Nc and NNI. The Irrigation groups present a marginal difference in both %Nc and NNI, the Crop groups only present a marginal difference in %Nc, and the N treatment groups present no significance in either %Nc or NNI.
For the factors that presented some significance, post hoc analyses were carried out to identify which groups differed from one another. The Dunn’s test was used for multiple comparisons. The results are presented in Table 7.
The PDM presents significant differences in several comparisons. Between crops, the comparison results in an adjusted p-value of 0.0197, indicating a significant difference (p<0.05). The comparison between moments reveals a highly significant difference with an adjusted p-value of 0.0000 (p < 0.001). The difference between irrigation methods is also significant, with an adjusted p-value of 0.0335 (p<0.05).
For PNC, the comparison between crops is significant, with an adjusted p-value of 0.0001 (p<0.001). The difference is also highly significant between moments, with an adjusted p-value of 0.0009 (p<0.001).
The NUp presents a highly significant difference between the water treatments, with an adjusted p-value of 0.0090 (p<0.01). Comparisons between N0 and N1 are significant, as they present an adjusted p-value of 0.0363 (p<0.05), while N0 vs N2 and N1 vs N2 present no significant differences.
The %Nc differs significantly between crops, with an adjusted p-value of 0.0292 (p<0.05). The comparison between t1 and t2 is highly significant, with an adjusted p-value<0.001. Between Rainfed and Irrigated, the difference is significant, with an adjusted p-value of 0.0391.
The NNI presents highly significant differences between the water treatments, with an adjusted p-value <0.001. Between t1 and t2, the difference is also significant, with an adjusted p-value of 0.0252.
In these boxplots, the annual ryegrass crop has lower medians for PDM, PNC and %Nc than the intercropped crop. Both PDM and PNC had higher medians in t2 compared to t1. These PNC values indicate that the crop was under stress and therefore lacking in nutrient N at t1. As can be seen in the %Nc boxplot, at t1 the PNC should be higher at earlier stages of the crop and decrease as the cycle progresses. The results also indicate that %Nc was higher in rainfed compared to irrigated conditions.
The boxplots in Figure 8 present that N absorption was higher than on rainfed land, with the medians presenting a difference of approximately 10 kg N ha-1. The median value for irrigated NNI was also higher than for non-irrigated. In terms of N treatments, N1 had the highest median NUp values, followed by N2. This indicates that the N absorbed by the plants was higher in the plots that were fertilised with 120 kg fertiliser ha-1. Finally, the boxplot presenting the median NNI per moment indicates that the median NNI at the first sampling moment was just above 0.6 and at the second moment it was very close to 1, corroborating the statement that the crops were in N deficit at t1, and were well nourished at t2.
3.1.2. Variables with Normal Distribution
For the NUE and NUpE variables (p-values <0.05 in the Shapiro-Wilk test) there is not enough evidence to reject the null hypothesis of normality. ANOVA, which assumes that the model’s residuals are normally distributed, was considered adequate and was applied to these two dependent variables (Table 9).
The results of the ANOVA test indicate that, for the NUpE and NUE variables, there are no significant differences in the means between the groups based on the Crop, Irrigation and N treatment factors.
Figure 9 presents the boxplots illustrating the results of the ANOVA test.
3.3. Relationships between NNI and N Use Parameters
To understand the relationship between the study’s dependent variables, a correlation matrix was created. The results of the correlation matrix are presented in Figure 9.
Figure 10.
Bivariate analysis of the dependent variables under study: (a) b-plots; (b) correlation matrix.
Figure 10.
Bivariate analysis of the dependent variables under study: (a) b-plots; (b) correlation matrix.
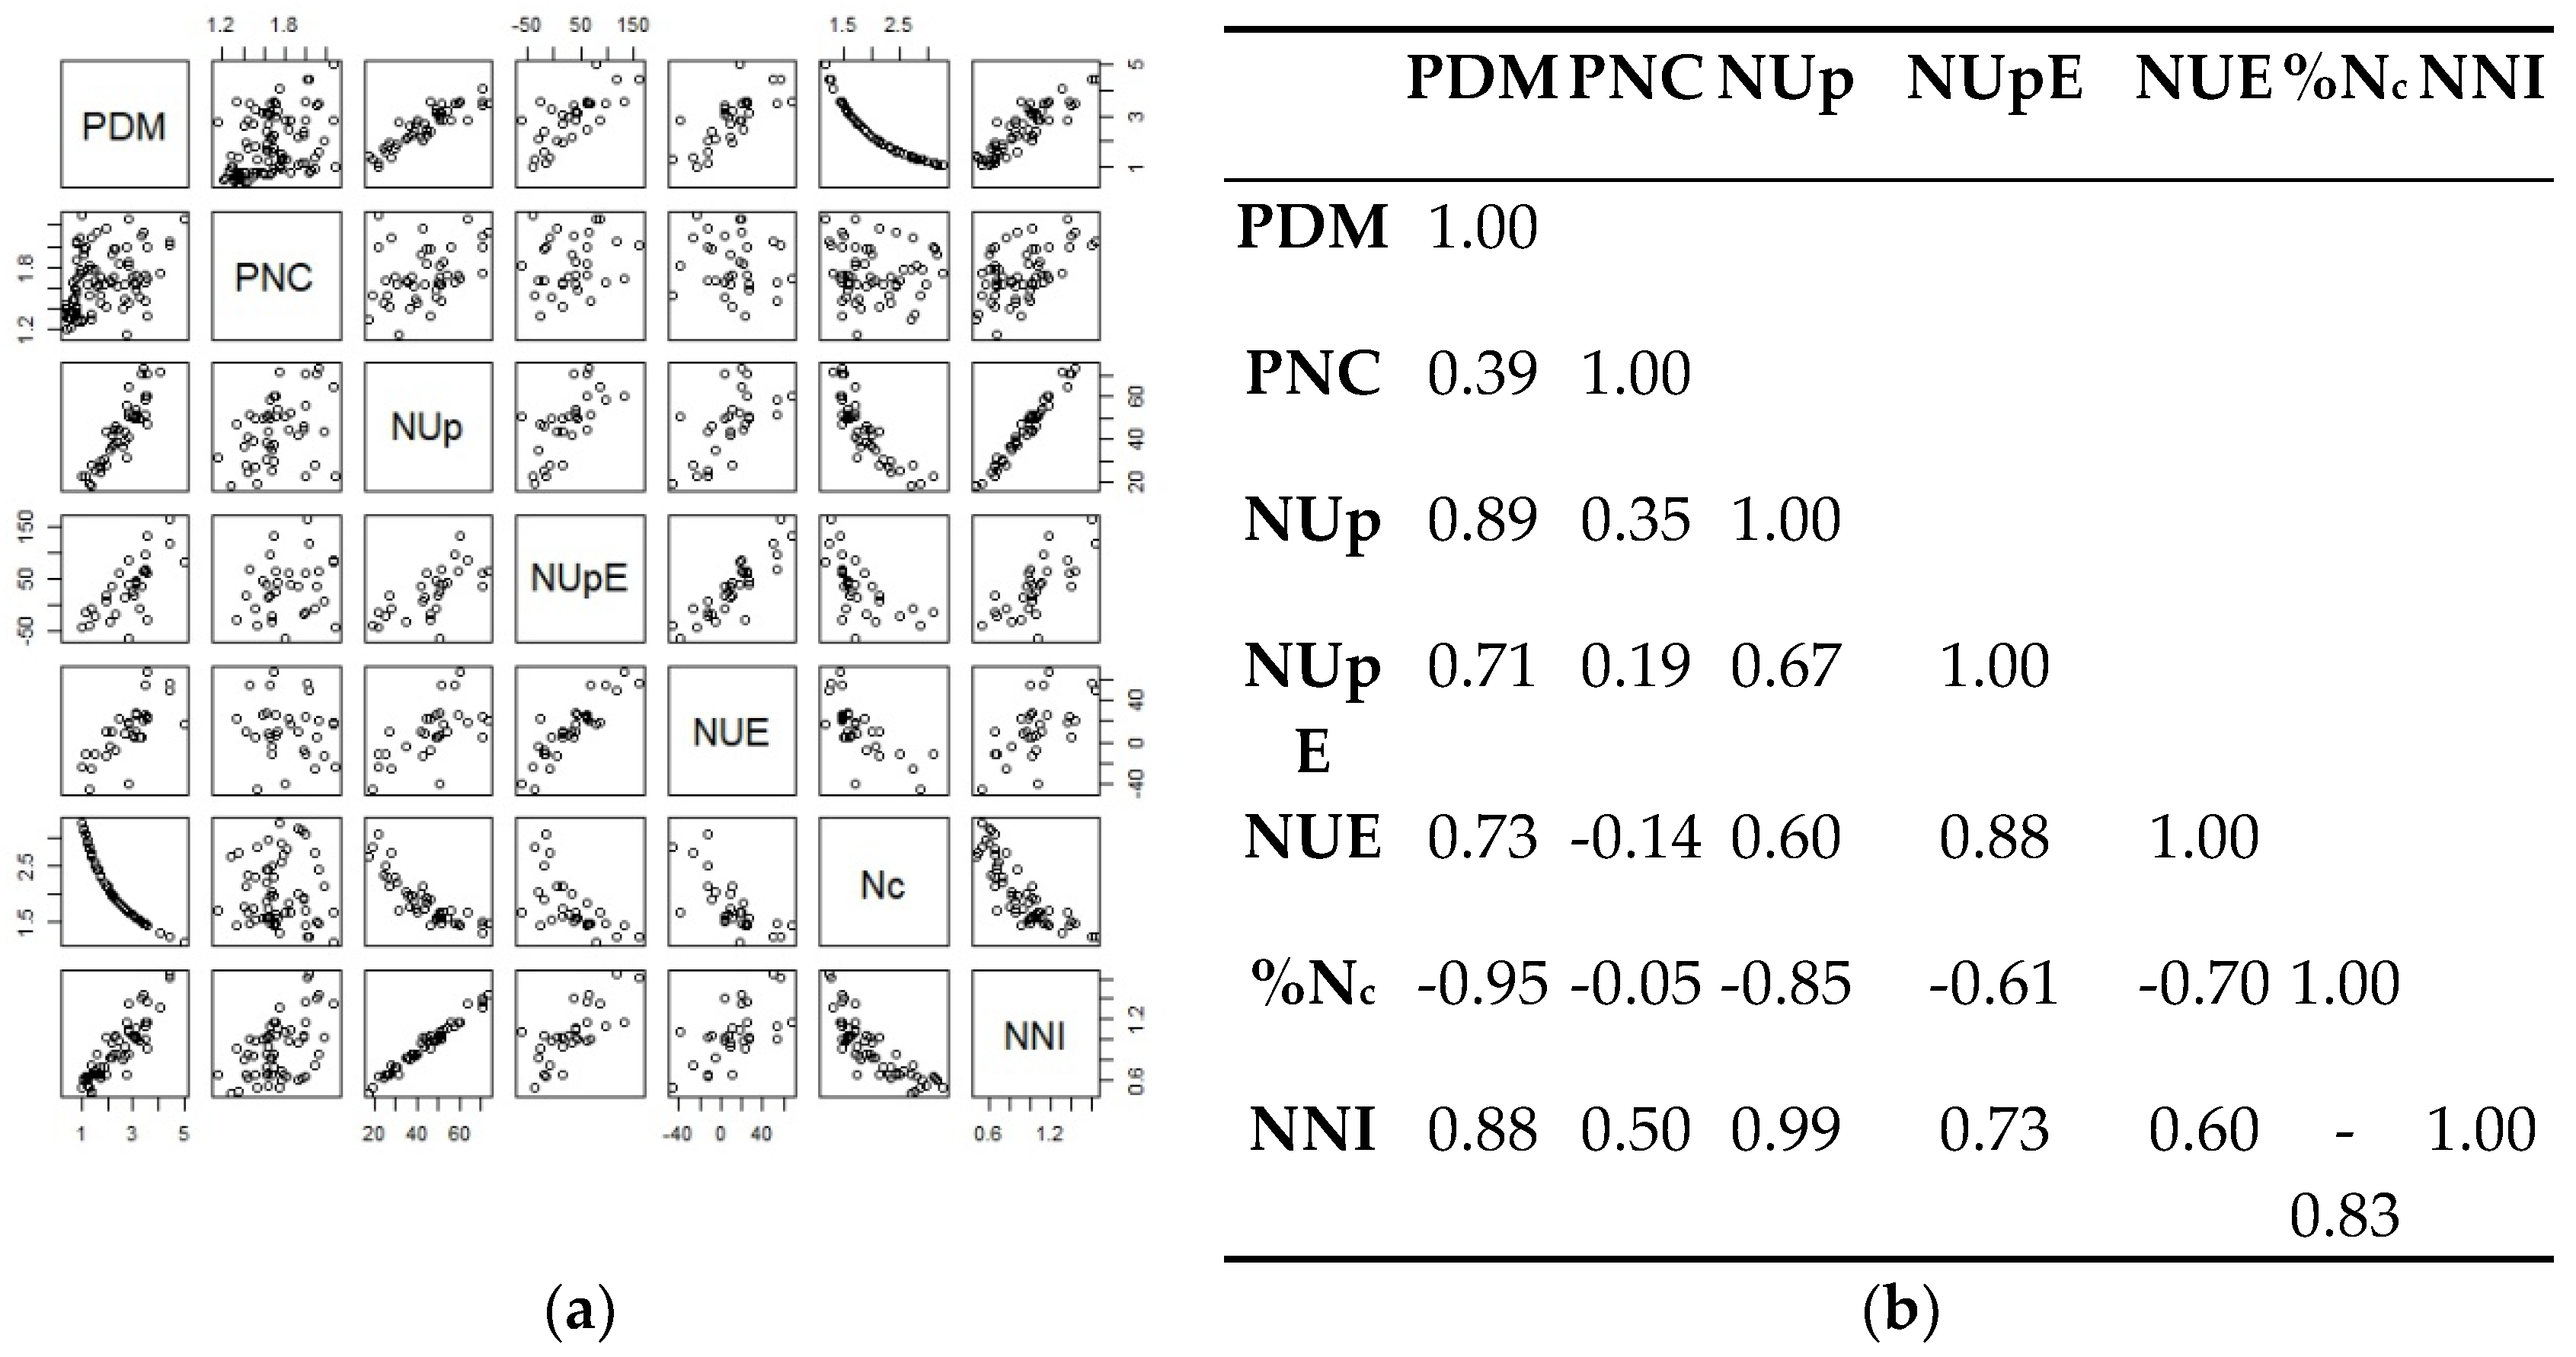
PDM presents a strong positive correlation (0.89) with NUp. The results present a very strong inverse relationship (-0.95) between PDM and %Nc and a strong relationship (0.88) with NNI. NUp has a strong inverse relationship (-0.85) with %Nc and an almost perfect relationship (0.99) with NNI. NUpE has a strong positive correlation (0.88) with NUE. Finally, %Nc has a strong inverse relationship (-0.83) with NNI.
4. Discussion
CNDC
The use of the Bayesian statistical model was pivotal in establishing the CNDC in this study. The parameters A1 and A2, ranging between 3.18 to 3.87 and 0.53 to 0.72 respectively, are consistent with existing research, indicating the reliability of the determined CNDC (%Nc = 3.63 * PDM-0.71). Compared to the curves of the references consulted and shown in Table 2, A1 is very close to the lowest A1 values, while A2 is close to the highest A2 values. A lower A1 value was recorded for oats (3.2) [27], irrigated annual ryegrass (3.5) [27], and a very close value for timothy grass (3.7) [25]. This means that these were the G x M x E with a critical N concentration value for sites with 1 t ha-1 most similar to the conditions in this trial. All the other crops considered as prior information registered a higher A1. In terms of A2, the value recorded was one of the highest, comparable only to the value achieved in perennial ryegrass by Gislum & Boelt [26]. All the other crops have lower A2 values and therefore a tendency for the N content in plant tissues to decrease more sharply. The decrease in %Nc is very slight. This insight allows the N fertilisation manager to know that under optimum conditions the PNC should not drop sharply, and to make informed decisions to apply the nutrient in a way that meets the needs of the crop and the product it is intended to produce more sustainably.
The estimated curve allows us to know what the critical N concentration is at each moment of the crop cycle, and to be able to classify the real state of the crop. Two key aspects to bear in mind when applying this technique are the exclusion of data pairs with a PDM lower than 1 t ha-1, and the use of prior information. In this work, the removal of this data meant a considerable reduction in the number of samples available. Still, as identified by Makowski et al., [9], it is a necessary step to ensure that the curve fits practical agricultural scenarios. As the value of %Nc changes with each G x M x E, the fact that there is an effortless way of using a short database, with free software and can be used dynamically, makes it possible to calculate the most appropriate curve for each situation, and also knowing its level of uncertainty, was a great asset in this work, as already mentioned by others authors [9,10,30].
PDM and PNC
The initial statistical analysis revealed that outliers needed exclusion and most parameters didn’t follow a normal distribution, highlighting the variability in field experiments and the necessity for precision agriculture methods. This emphasizes the importance of data analysis, cleaning, and interpretation [9,10,30].
Comparing the two basic variables (PDM and PNC), PDM generally had a more asymmetrical distribution and dispersed values than PNC. Figure 4 confirms that PDM has the most values between 0.3 and 3.5 t ha-1. Similar ranges have been reported as annual ryegrass (0.2 to 3.9 t ha-1 [6] and 0.1 to 3.9 t ha-1 [12]). The PNC distribution has most values between 1.2 and 2.3 %. Sandaña et al., [6] observed a range of PNC in hybrid annual ryegrass of 1.6 to 5.1 % and explained the variations of these traits by N fertilisation rates applied (0, 50, 100, 200, 350, 525 and 700 kg N ha-1) and by the harvest times. The maximum value was also slightly higher in the results achieved by Gislum et al., [26] in perennial ryegrass (0.8 to 4.6 %). However, it should be borne in mind that Sandaña et al., [6] carried out the tests on clay soils with organic matter contents between 10.3 and 14.1 % and Gislum et al., [26] on fine sandy loam soils and the N doses varied between 0 and 200 kg N ha-1, but were made in split applications.
The results indicate that the response of PDM and PNC varies with crops and sampling times. Annual ryegrass produced less PDM, averaging 1 t ha-1, compared to the intercropped crop, which averaged 1.7 t ha-1. However, the PDM values for annual ryegrass vary more and can reach the highest values. Additionally, annual ryegrass recorded lower PNC results than the intercropped crop, with values of 1.45% and 1.75%, respectively. These results corroborate the findings of Louarn et al., [22], indicating that intercropped crops require specific treatments tailored to their species. They help establish a benchmark for PDM and PNC results in these crops. The fact that PDM and PNC do not respond to the irrigation strategy and N treatments suggests that other factors, possibly soil properties or initial N status, play a more crucial role. More studies are needed to understand how different species compositions influence PDM and PNC production and the importance of N management strategies.
N Use Parameters and NNI
The results show that NUp (mean: 44.0 and range: 18-73 kg ha-1) responds to the Irrigation. While the plants that were irrigated had an average NUp of 50 kg ha-1, the rainfed plants had an average of 40 kg ha-1. The results also show a different plant response between the N0 and N1 N treatments. Sandaña et al., [12] recorded NUp ranges between 4.9 and 134.0 kg ha-1 and between 3.7 and 101.0 kg ha-1. In addition to achieving higher NUp values, they indicate that NUp responds mainly to N treatments, but also to harvest time.
NUpE (mean: 32.9 and range: -62–162 %) and NUE (mean: 11.8 and range: -46–68 kg kg N ha-1) did not respond to the crop groups, irrigation and N treatment studied. This suggests that these factors do not affect NUE and NUpE within the range studied, highlighting the potential for other agronomic practices to improve these efficiencies. Even so, the results show that in these G x M x E scenarios, plants absorb an average of 32.9% of the total N from the fertiliser. This absorption efficiency means that, on average, for every kg of N applied, the crop produces 11.8 kg more PDM. Sandaña et al., [12] indicate that under their experimental conditions, annual ryegrass produces an average of 36.6 kg of PDM per kg of N absorbed. This result is close to the 40.5 kg of PDM achieved in this study. Marino et al., [11] achieved similar results when applied 50 kg N ha-1 (44.2 and 52.2 kg PDM kg-1) and results below when applied a higher dose, of 250 kg N ha-1 (17.61 and 15.02 PDM kg-1).
The %Nc decreases as the crop cycle progresses, from 3.2 % at t1 to 1.2 % at t2. %Nc shows minimum values (1.2 %) equal to those of the PNC achieved but shows a maximum value (3.2 %) higher than the maximum value shown in the PNC (2.3 %). The average %Nc (2.0 %) is also higher than the average PNC (1.66 %). These results indicate that critical N concentrations were not reached. These results are reflected in the NNI results presented below. Other authors [12] have recorded higher %Nc values in the early stages of crop cycles, reaching 4.6 %. The %Nc responds very well to the Moment and the average decreases from 2.8 % at t1 to 1.7 % at t2. This result means that these would be the optimum PNC values for the crops to be in the optimum nutritional state and ensure that the crops express their productive potential. However, in t1 the PNC value was well below the %Nc value, reaching only 1.5 %. In t2 the average PNC value has already reached the %Nc value. This difference between PNC and %Nc translates into an average NNI of 0.65 in t1 and 1.00 in t2. The NNI responds not only to Moment but also to Irrigation. The NNI values achieved in this study (mean: 0.91 and range: 0.48–1.63) indicate that the plants were in deficit of the macronutrient in the moment t1. In future studies, changes will be made to guarantee the good nutrition of the plants in the crucial first stages of development. Similar ranges of values were achieved by other authors in annual ryegrass (0.4 – 1.6) [11].
Correlations
The correlation matrix reveals strong relationships between PDM, NUp, %Nc, and NNI, emphasizing the interconnectedness of biomass production and N dynamics. The PDM presents a strong positive correlation (0.89) with NUp, indicating that biomass production is closely linked to the amount of N absorbed by the crop. The solid inverse relationship (-0.95) between PDM and %Nc indicates that an increase in biomass production is linked to a decrease in the critical N concentration in the crop. The base knowledge identified by other authors [4,5,6,7,21,24], was verified and PDM increases exponentially as the crop cycle progresses, and the crop’s optimal N content decreases exponentially. The PDM also has a strong relationship (0.88) with NNI, indicating that plants with a higher NNI produce more biomass [31].
The almost perfect correlation between NUp and NNI highlights that higher NUp enhances the NNI, reinforcing the importance of efficient N management to benefit the N absorption by the plants. Similar insights were achieved in intercropping fodder [32]. The strong correlation between NUpE and NUE indicates that improving NUpE directly enhances overall NUE, which is crucial for sustainable agriculture, following other authors [12,31,33].
Implications for Practical Ryegrass-Based Fodder Crop Production
Implementing CNDC as a diagnostic tool in fodder crop production is highly appealing. The CNDC should be used to determine if additional N application is necessary to increase the PNC above the CNDC at the current biomass level. An increase in PNC through additional N application should ensure that PNC is not a limiting factor for achieving a high PDM yield. Focus should therefore be on using the CNDC in the period of growth (initial stages of crop development) where an application of N has a positive effect on the relative growth rate and the amount of N accumulated in the plant.
The analysis presents that PDM and NUp are strongly interlinked with several other variables, highlighting the importance of proper N management to optimize crop production. In particular, NUpE and NNI in the plant have strong associations that should be considered in agricultural management practices. These relationships highlight the complex interaction between biomass production and the N cycle in plants, providing valuable insights for improving the efficient use of this nutrient.
Additionally, this approach will help define reference values for N use parameters under optimal N nutritional status, such as the %Nc to guarantee a perfect N nutritional status (NNI=1) of ryegrass-based fodder crops, at each key stages of crop development, and NUE (11.8 kg kg N ha-1) and NUpE (32.9 %) to know what to expect in term of use the N fertiliser by the plants. These reference values can be used to benchmark N management practices aimed at improving NUE in sustainable agricultural systems.
The insights highlight the high variability and wide range in the studied parameters underscore the complexity of N dynamics in cropping systems and the need for integrated management approaches. These findings are critical for devising precision N management practices that consider the specific needs of different crops and their growth stages, ultimately enhancing NUE and crop productivity.
5. Conclusions
The study’s findings have significant implications for agricultural practices. Using a Bayesian model, the CNDC was determined as %Nc = 3.63 * PDM-0.71. The established CNDC provides a valuable tool for predicting N requirements and optimizing fertiliser application, thereby improving crop yield and sustainability. Understanding the variations in N use parameters and their relationship with biomass production can inform precision management practices that enhance NUE.
The strong correlations between key variables highlight the importance of integrated nutrient management approaches considering the complex interactions between N dynamics and crop growth. The results presented that plant dry matter (PDM) and plant N content (PNC) varied significantly with crop type and sampling moments. Strong positive correlations are presented by PDM with N uptake (NUp) (0.89) and NNI (0.88), along with an inverse correlation with critical N concentration (-0.95). This study contributes valuable insights into the N dynamics of different crops under varying management practices. The findings underscore the need for precision N management strategies that optimize NUE and support sustainable agricultural production.
In conclusion, this study provides valuable insights into the influence of key management decisions on the N nutritional status of annual ryegrass-based forage crops. By improving NUE through better agricultural data analysis, farmers, agronomists, advisors, and researchers can achieve significant benefits, contributing to the sustainability of agricultural systems. Future research should explore the long-term impacts of these practices on soil health and environmental sustainability to further refine N management recommendations. Exploring the integration of N management with other nutrient management strategies, such as phosphorus and potassium application, or even with organic matter, could lead to even greater improvements in crop yield and nutrient use efficiency. The use of technological innovations such as remote sensing and machine learning, should also be studied, which could increase the precision of N management and enable real-time monitoring of the crop’s nutritional status.
Author Contributions
Conceptualization, L.S., S.B., F.C.L., J.S.S. and L.A.C.; methodology, L.S., S.B. and L.A.C.; software, L.S. and S.B.; validation, L.S. and S.B.; formal analysis, J.S.S. and L.A.C.; investigation, L.S.; resources, F.C.L., J.S.S., and L.A.C.; data curation, L.S.; writing—original draft preparation, L.S.; writing—review and editing, L.S.; visualization, L.S., S.B., F.C.L., J.S.S. and L.A.C.; supervision, L.A.C.; project administration, L.A.C.; funding acquisition, F.C.L., and L.A.C.. All authors have read and agreed to the published version of the manuscript.
Funding
The APC was funded by national funds through the Fundação para a Ciência e a Tecnologia, I.P. (Portuguese Foundation for Science and Technology) by the project UIDB/05064/2020 (VALORIZA—Research Centre for Endogenous Resource Valorization) and by national funds from Fundação para a Ciência e a Tecnologia (FCT), Portugal, through the research unit UIDP/04035/2020 (GeoBioTec).
Data Availability Statement
The original contributions presented in the study are included in the article, further inquiries can be directed to the corresponding authors.
Acknowledgments
The authors would like to thank the National Institute for Agricultural and Veterinary Research (INIAV) for providing the experimental field and the crops installed under the GEEBovMit Project - LA 3.3- PRR-C05-i03-I-000027-LA3.3 - Mitigation of GHG emissions in beef cattle production - pastures, forages and natural additives. The authors would also like to thank the GeoBioTec and VALORIZA research centres.
Conflicts of Interest
The authors declare no conflicts of interest.
References
- European Comission Ensuring Availability and Affordability of Fertilisers.
- European Comission Farm to Fork Strategy.
- Patanita, M.; Tomaz, A.; Ramos, T.; Oliveira, P.; Boteta, L.; Dôres, J. Water Regime and Nitrogen Management to Cope with Wheat Yield Variability under the Mediterranean Conditions of Southern Portugal. Plants 2019, 8, 429. [CrossRef]
- Ulrich, A. Physiological Bases for Assessing the Nutritional Requirements of Plants. Annu Rev Plant Physiol 1952, 3, 207–228. [CrossRef]
- Lemaire, G.; Salette, J.; Sigogne, M.; Terrasson, J.-P.; LEMAIRE Jean SALETTE Monique SIGOGNE Jean-Pierre TERRASSON LNRA, G. Relation Entre Dynamique de Croissance et Dynamique de Prélèvement d’azote Pour Un Peuplement de Graminées Fourragères. I.-Etude de l’effet Du Milieu Relation Entre Dynamique de Croissance et Dynamique de Prélèvement d’azote Pour Un Peuplement de Graminées Fourragères. I. — Etude de l’effet Du Milieu; 1984; Vol. 4;.
- Sandaña, P.; Lobos, I.A.; Pavez, P.B.; Moscoso, C.J. Validation of a Critical Nitrogen Dilution Curve for Hybrid Ryegrasses. Grass and Forage Science 2019, 74, 370–380. [CrossRef]
- Lemaire, G.; Meynard, J.M. Use of the Nitrogen Nutrition Index for the Analysis of Agronomical Data. In Diagnosis of the Nitrogen Status in Crops; Springer Berlin Heidelberg: Berlin, Heidelberg, 1997; pp. 45–55.
- Hoogmoed, M.; Neuhaus, A.; Noack, S.; Sadras, V.O. Benchmarking Wheat Yield against Crop Nitrogen Status. Field Crops Res 2018, 222, 153–163. [CrossRef]
- Makowski, D.; Zhao, B.; Ata-Ul-Karim, S.T.; Lemaire, G. Analyzing Uncertainty in Critical Nitrogen Dilution Curves. European Journal of Agronomy 2020, 118, 126076. [CrossRef]
- Lacasa, J.; Makowski, D.; Hefley, T.; Fernandez, J.; van Versendaal, E.; Lemaire, G.; Ciampitti, I. Comparison of Statistical Methods to Fit Critical Nitrogen Dilution Curves. European Journal of Agronomy 2023, 145, 126770. [CrossRef]
- Marino, M.A.; Mazzanti, A.; Assuero, S.G.; Gastal, F.; Echeverría, H.E.; Andrade, F. Nitrogen Dilution Curves and Nitrogen Use Efficiency During Winter–Spring Growth of Annual Ryegrass. Agron J 2004, 96, 601–607. [CrossRef]
- Sandaña, P.; Lobos, I.A.; Pavez, P.B.; Moscoso, C.J. Nitrogen Nutrition Index and Forage Yield Explain Nitrogen Utilization Efficiency in Hybrid Ryegrasses under Different Nitrogen Availabilities. Field Crops Res 2021, 265, 108101. [CrossRef]
- Oral, E. Effect of nitrogen fertilization levels on grain yield and yield components in triticale based on ammi and gge biplot analysis. Appl Ecol Environ Res 2018, 16, 4865–4878. [CrossRef]
- Perez, C.M.; Juliano, B. 0; Liboon, S.P.; Alcantara, J.M.; Cassman, K.G. Effects of Late Nitrogen Fertilizer Application on Head Rice Yield, Protein Content, and Grain Quality of Rice; 1996;
- Ryan-Salter, T.P.; Black, A.D. Yield of Italian Ryegrass Mixed with Red Clover and Balansa Clover. Proceedings of the New Zealand Grassland Association 2012, 201–207. [CrossRef]
- Cardoso, J. A Classificação de Solos de Portugal. In Boletim de Solos do SROA; 1974; Vol. 17, pp. 14–46.
- Köppen, W. Versuch Einer Klassifikation Der Klimate, Vorzugsweise Nach Ihren Beziehungen Zur Pflanzenwelt. Geogr Z 1900, 6, 593–611.
- Kjeldahl, J. Neue Methode Zur Bestimmung Des Stickstoffs in Organischen Körpern. Fresenius’ Zeitschrift für analytische Chemie 1883, 22, 366–382. [CrossRef]
- R Core Team R: A Language and Environment for Statistical Computing 2023.
- Martyn Plummer; Alexey Stukalov; Matt Denwood Package Rjags 2024.
- Lemaire, G.; Gastal, F. N Uptake and Distribution in Plant Canopies. In Diagnosis of the Nitrogen Status in Crops; Springer Berlin Heidelberg: Berlin, Heidelberg, 1997; pp. 3–43.
- Louarn, G.; Bedoussac, L.; Gaudio, N.; Journet, E.-P.; Moreau, D.; Steen Jensen, E.; Justes, E. Plant Nitrogen Nutrition Status in Intercrops– a Review of Concepts and Methods. European Journal of Agronomy 2021, 124, 126229. [CrossRef]
- Soussana, J.; Arregui, M. Impact de l’association Sur Le Niveau de Nutrition Azotée et La Croissance Du Ray-Grass Anglais et Du Trèfle Blanc;
- GREENWOOD, D.J.; LEMAIRE, G.; GOSSE, G.; CRUZ, P.; DRAYCOTT, A.; NEETESON, J.J. Decline in Percentage N of C3 and C4 Crops with Increasing Plant Mass. Ann Bot 1990, 66, 425–436. [CrossRef]
- Bélanger, G.; Ziadi, N. Phosphorus and Nitrogen Relationships during Spring Growth of an Aging Timothy Sward. Agron J 2008, 100, 1757–1762. [CrossRef]
- Gislum, R.; Boelt, B. Validity of Accessible Critical Nitrogen Dilution Curves in Perennial Ryegrass for Seed Production. Field Crops Res 2009, 111, 152–156. [CrossRef]
- Agnusdei, M.G.; Assuero, S.G.; Lattanzi, F.A.; Marino, M.A. Critical N Concentration Can Vary with Growth Conditions in Forage Grasses: Implications for Plant N Status Assessment and N Deficiency Diagnosis. Nutr Cycl Agroecosyst 2010, 88, 215–230. [CrossRef]
- William Revelle Package Psych 2024.
- Alexis Dinno Package Dunn.Test 2024.
- Fernandez, J.A.; van Versendaal, E.; Lacasa, J.; Makowski, D.; Lemaire, G.; Ciampitti, I.A. Dataset Characteristics for the Determination of Critical Nitrogen Dilution Curves: From Past to New Guidelines. European Journal of Agronomy 2022, 139, 126568. [CrossRef]
- Dordas, C. Nitrogen Nutrition Index and Leaf Chlorophyll Concentration and Its Relationship with Nitrogen Use Efficiency in Barley ( Hordeum Vulgare L.). J Plant Nutr 2017, 40, 1190–1203. [CrossRef]
- Louarn, G.; Chabbi, A.; Gastal, F. Nitrogen Concentration in the Upper Leaves of the Canopy Is a Reliable Indicator of Plant N Nutrition in Both Pure and Mixed Grassland Swards. Grass and Forage Science 2020, 75, 127–133. [CrossRef]
- Dordas, C.A. Nitrogen Nutrition Index and Its Relationship to N Use Efficiency in Linseed. European Journal of Agronomy 2011, 34, 124–132. [CrossRef]
Figure 1.
Location and design of experiment field.
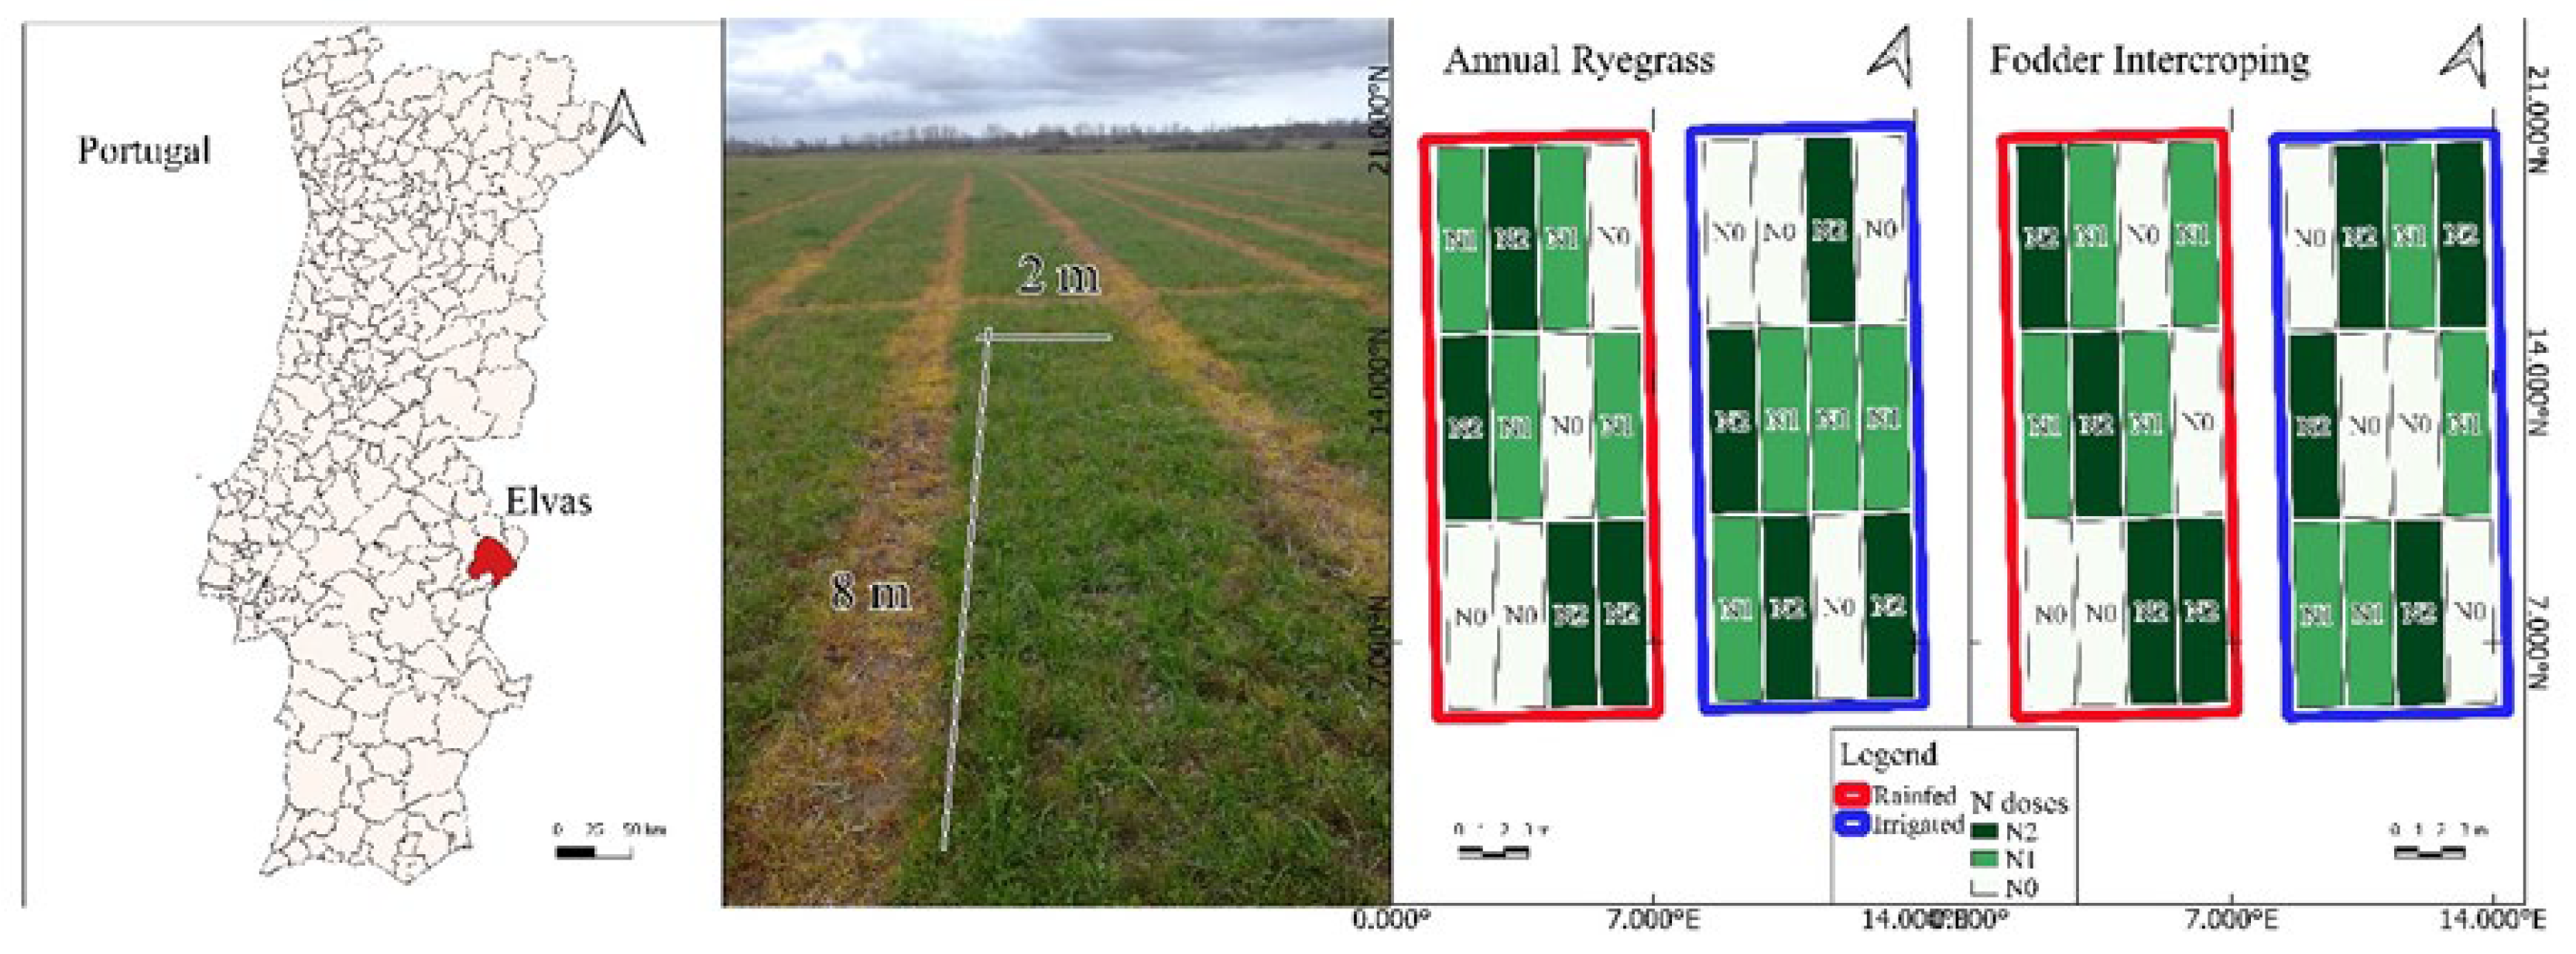
Figure 2.
Diagram of the statistical data analysis procedure.
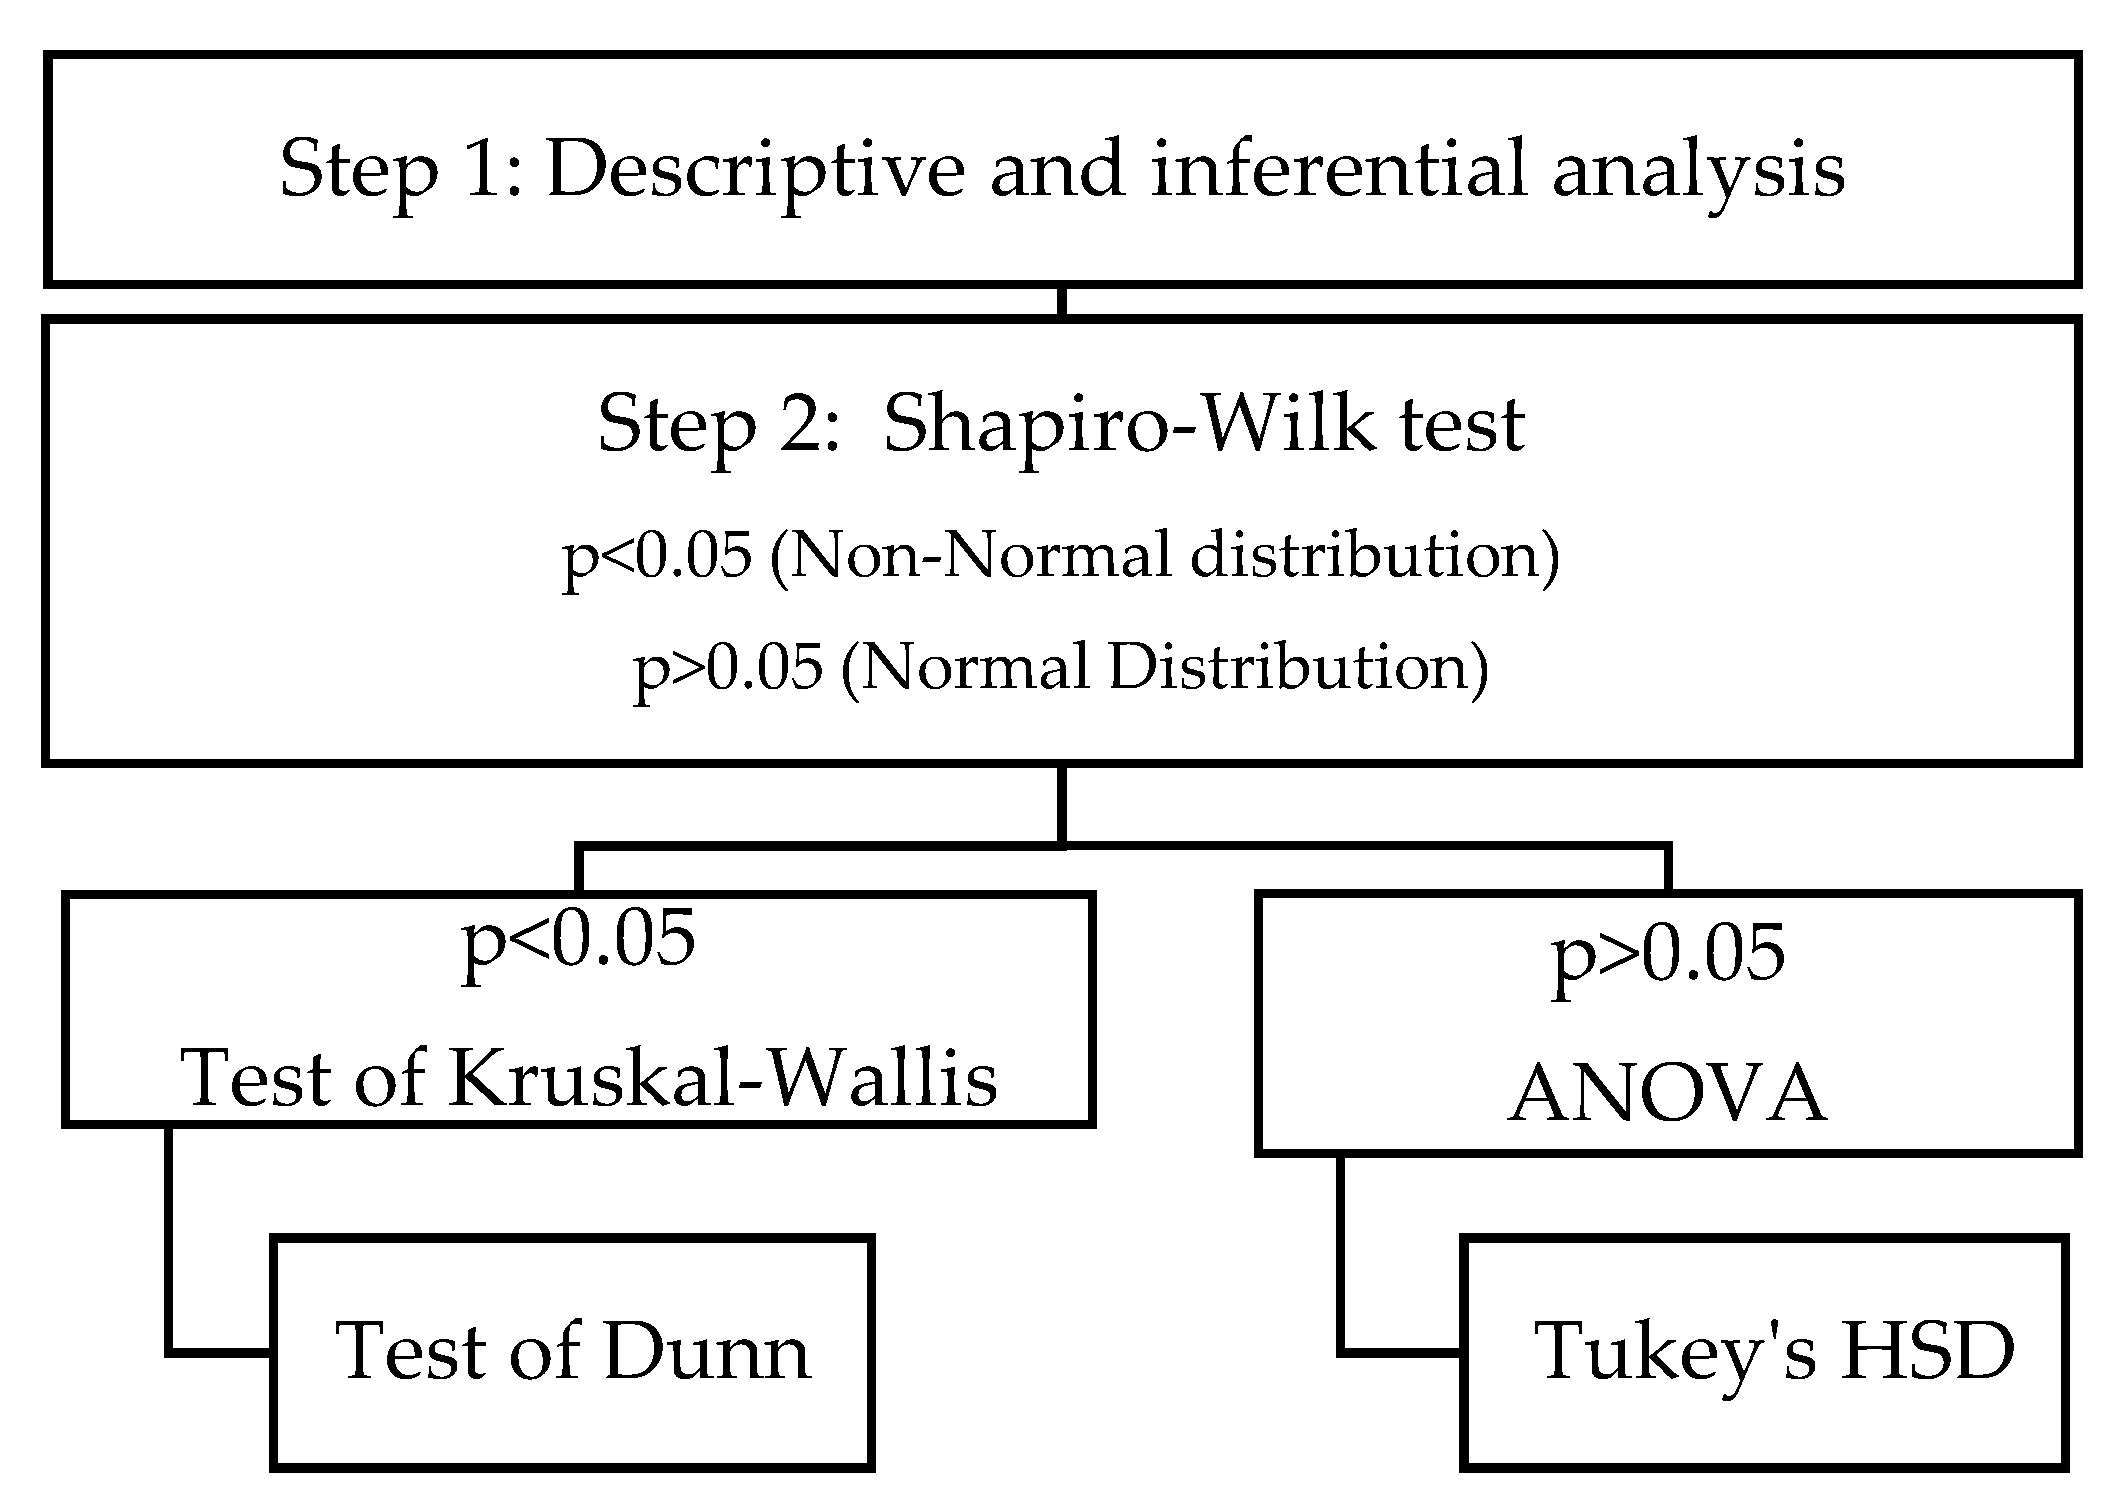
Figure 3.
Estimated values at CI 97.5% of parameters A1 (a in %) and A2 (b in %).
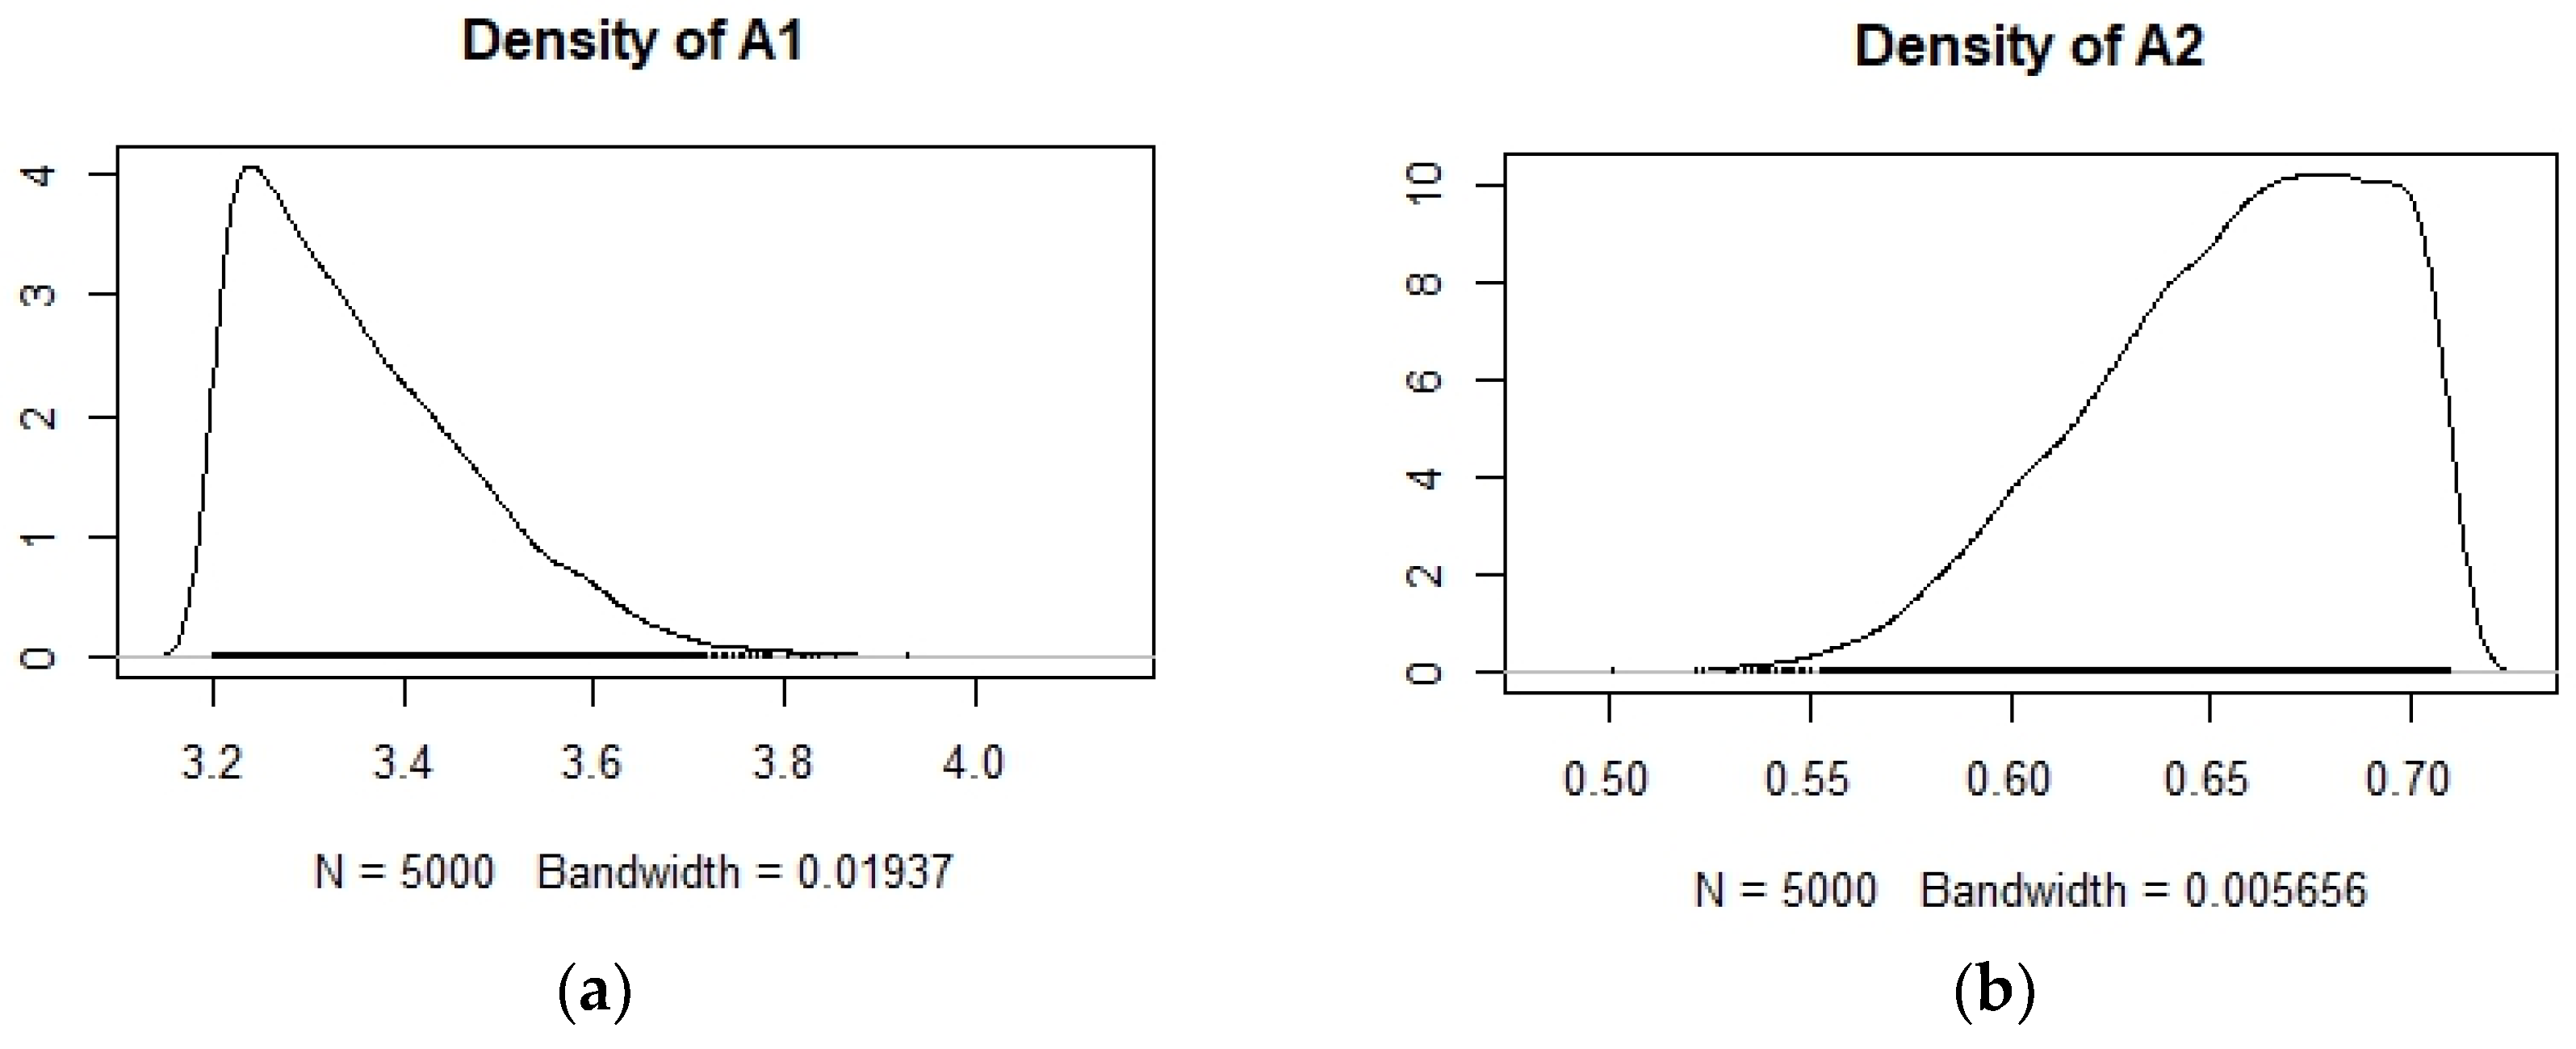
Figure 4.
Histograms of the distribution of the values of the dependent variables.
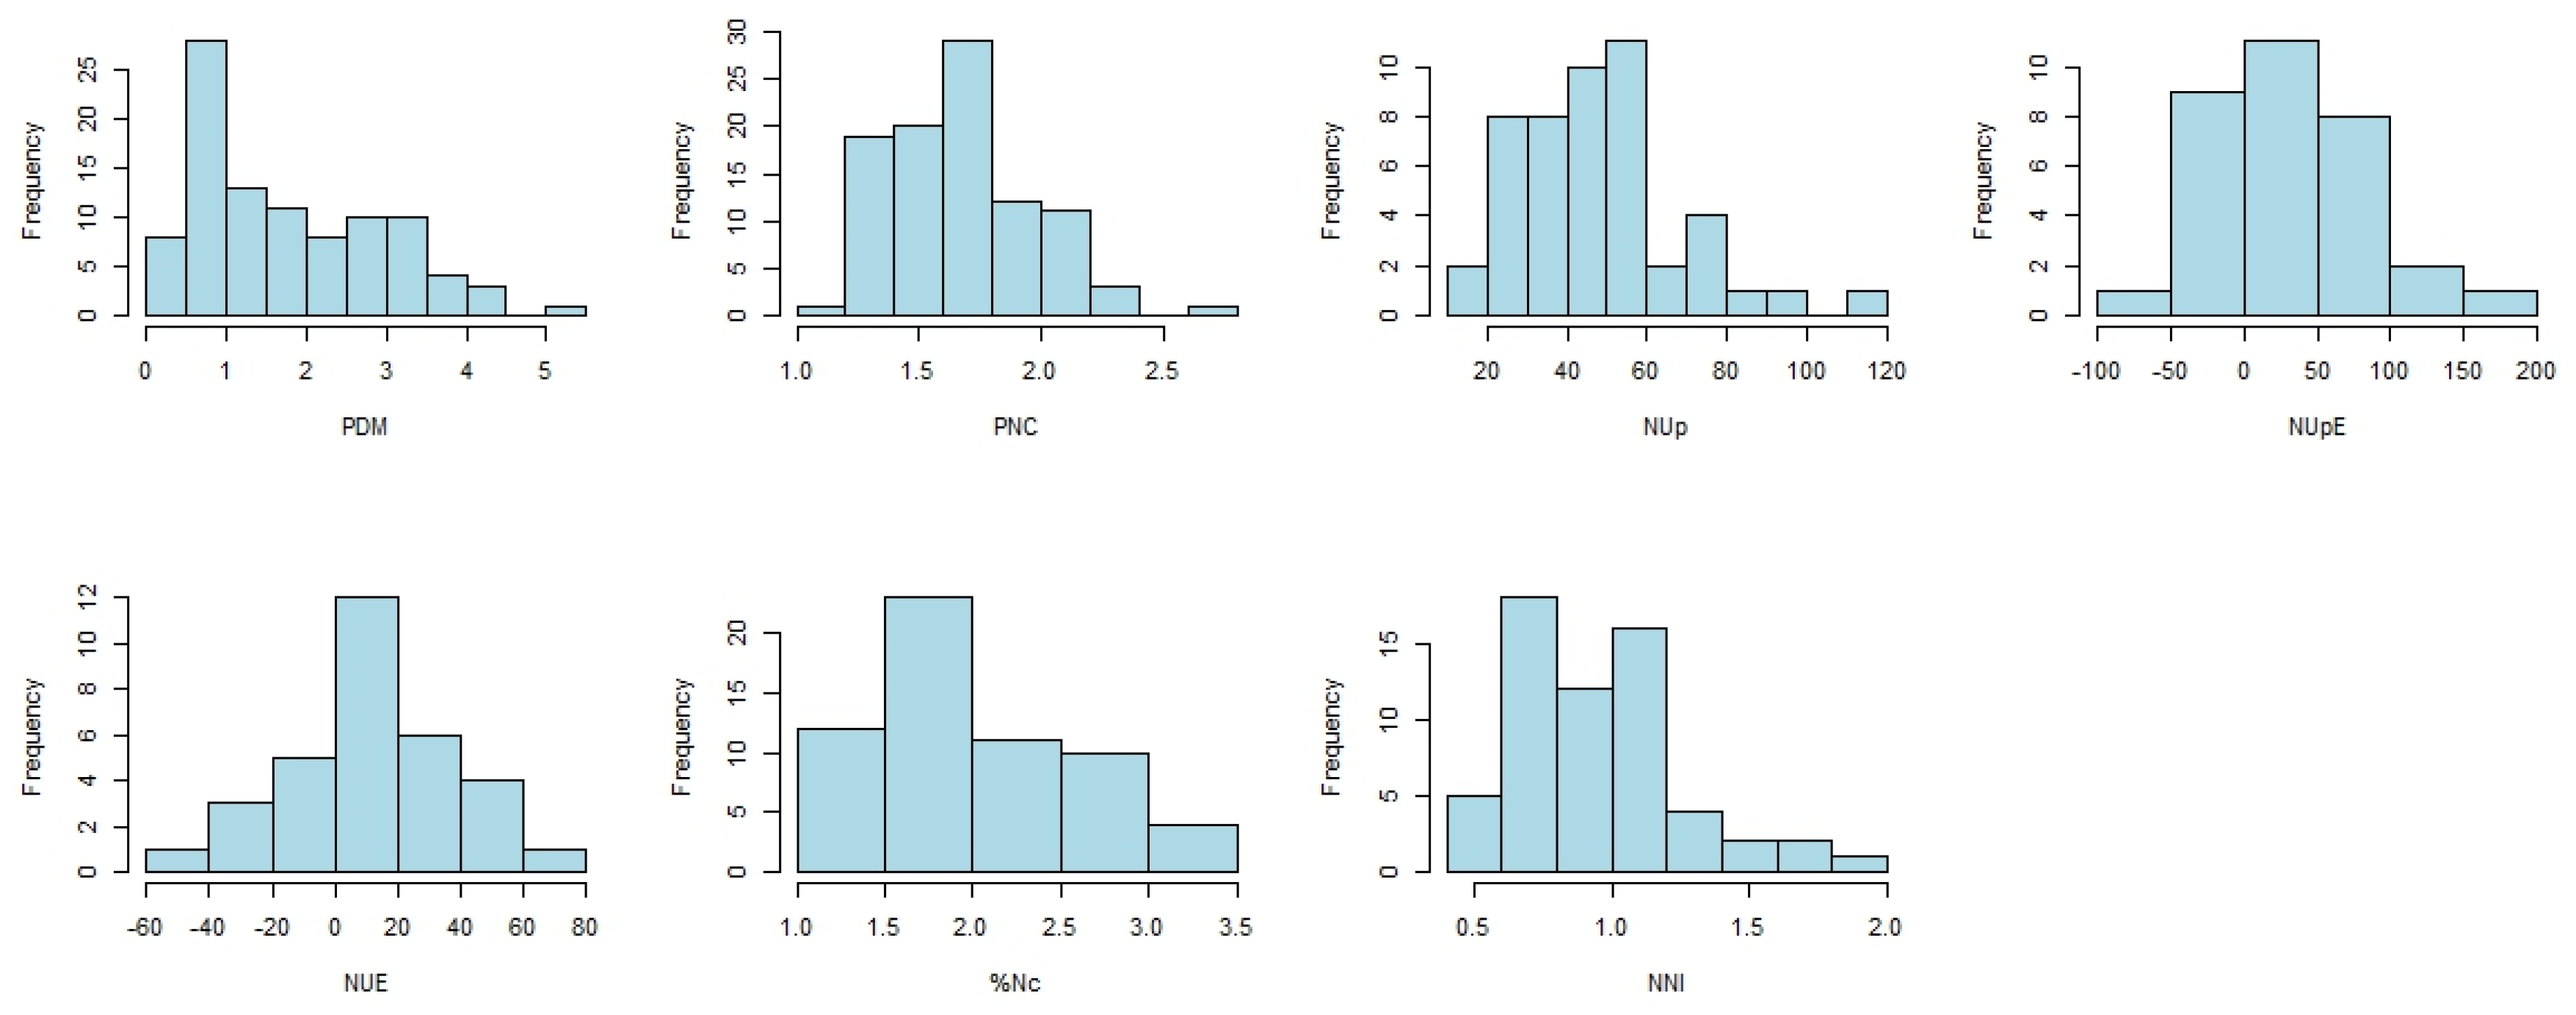
Figure 5.
Boxplots of the distribution of the values of the dependent variables.
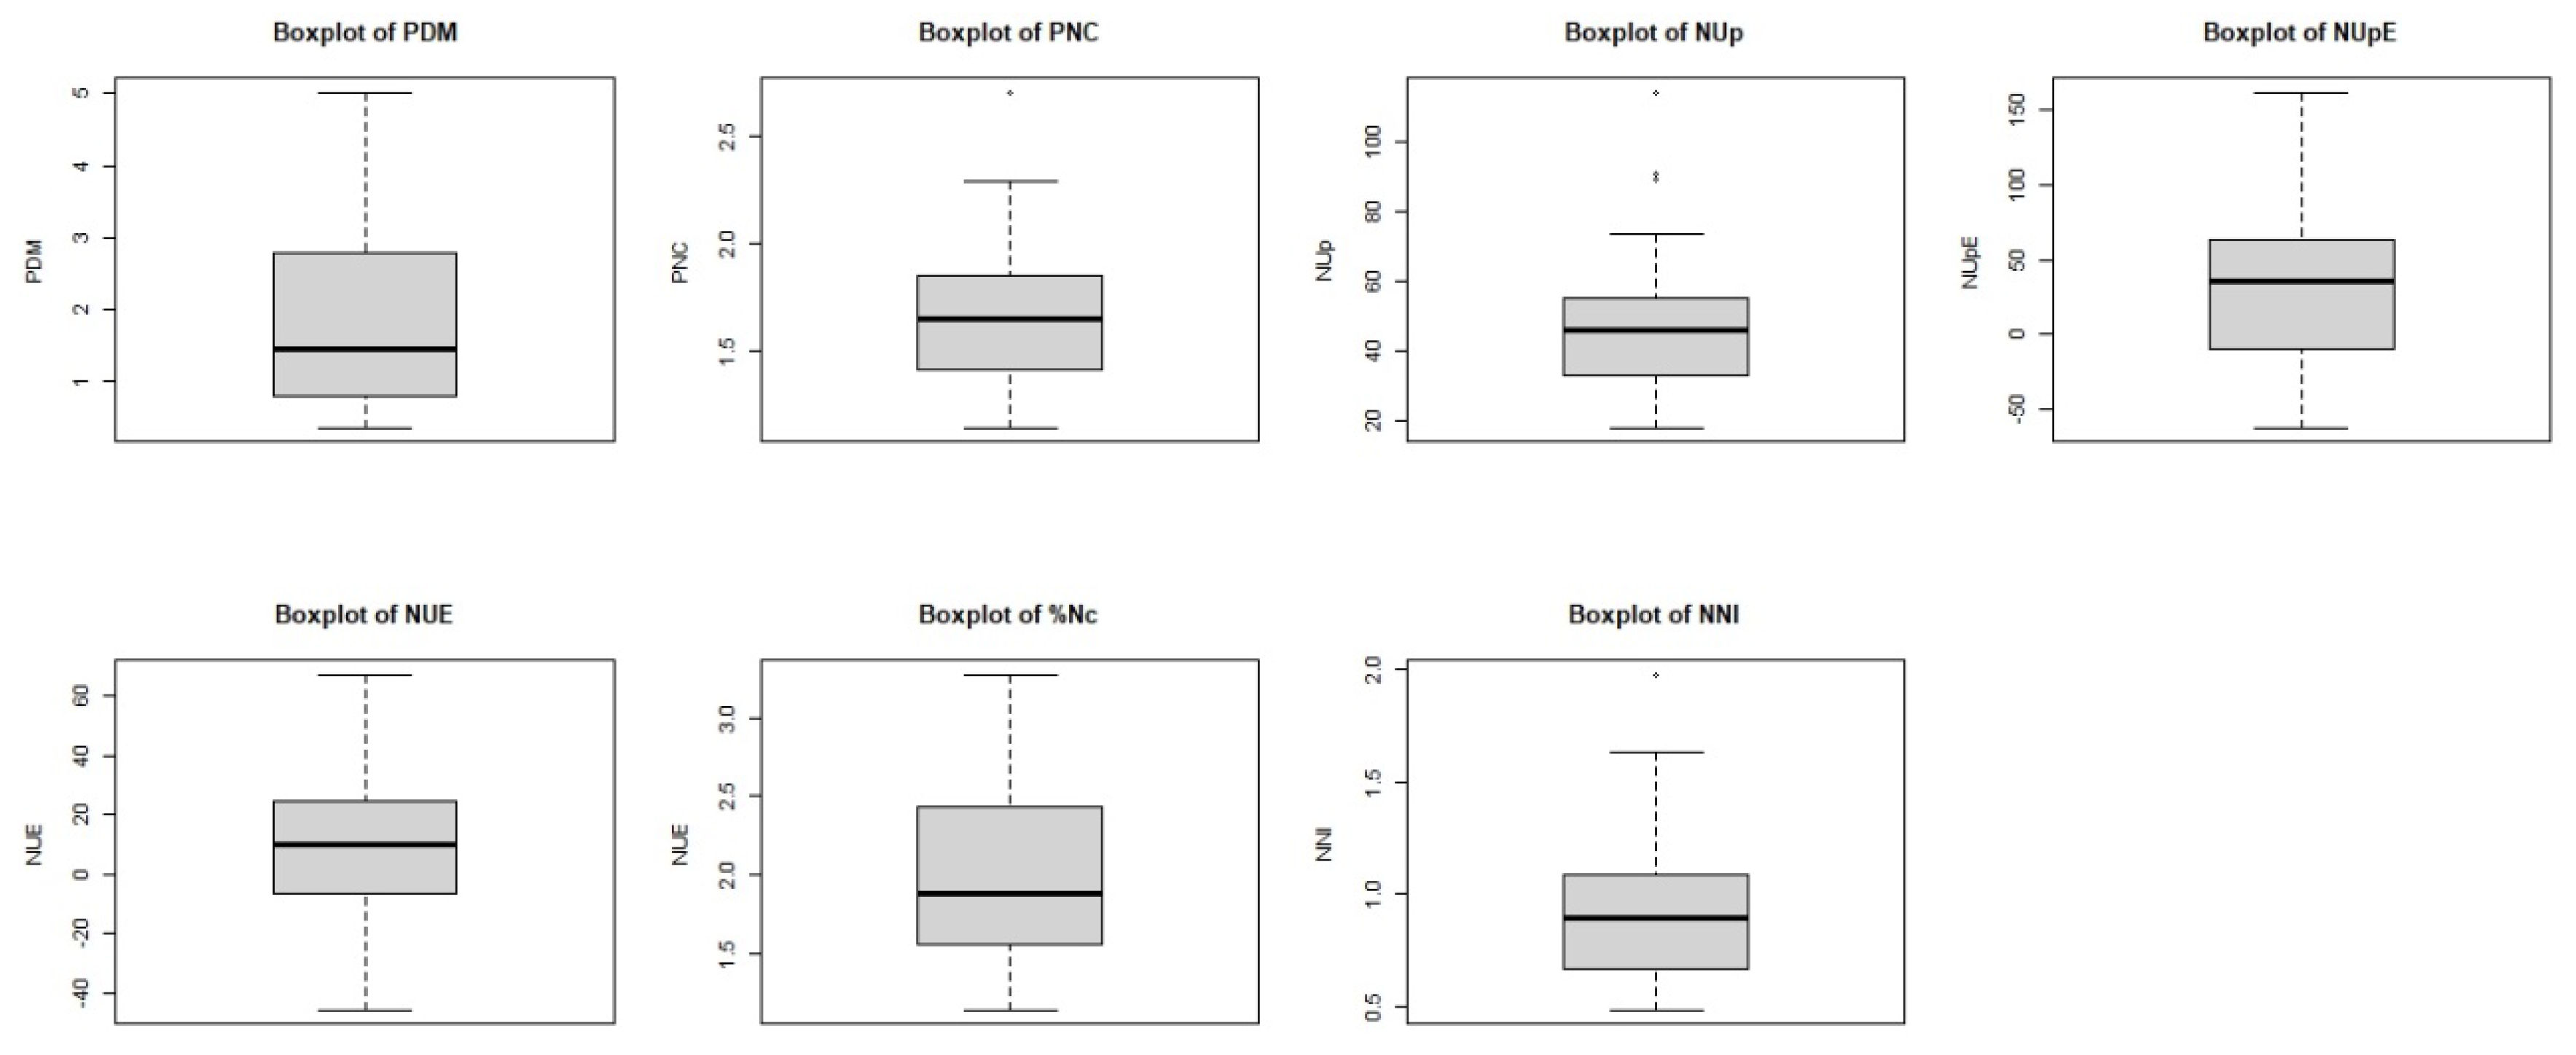
Figure 6.
Q-Q Plots of the dependent variables studied.
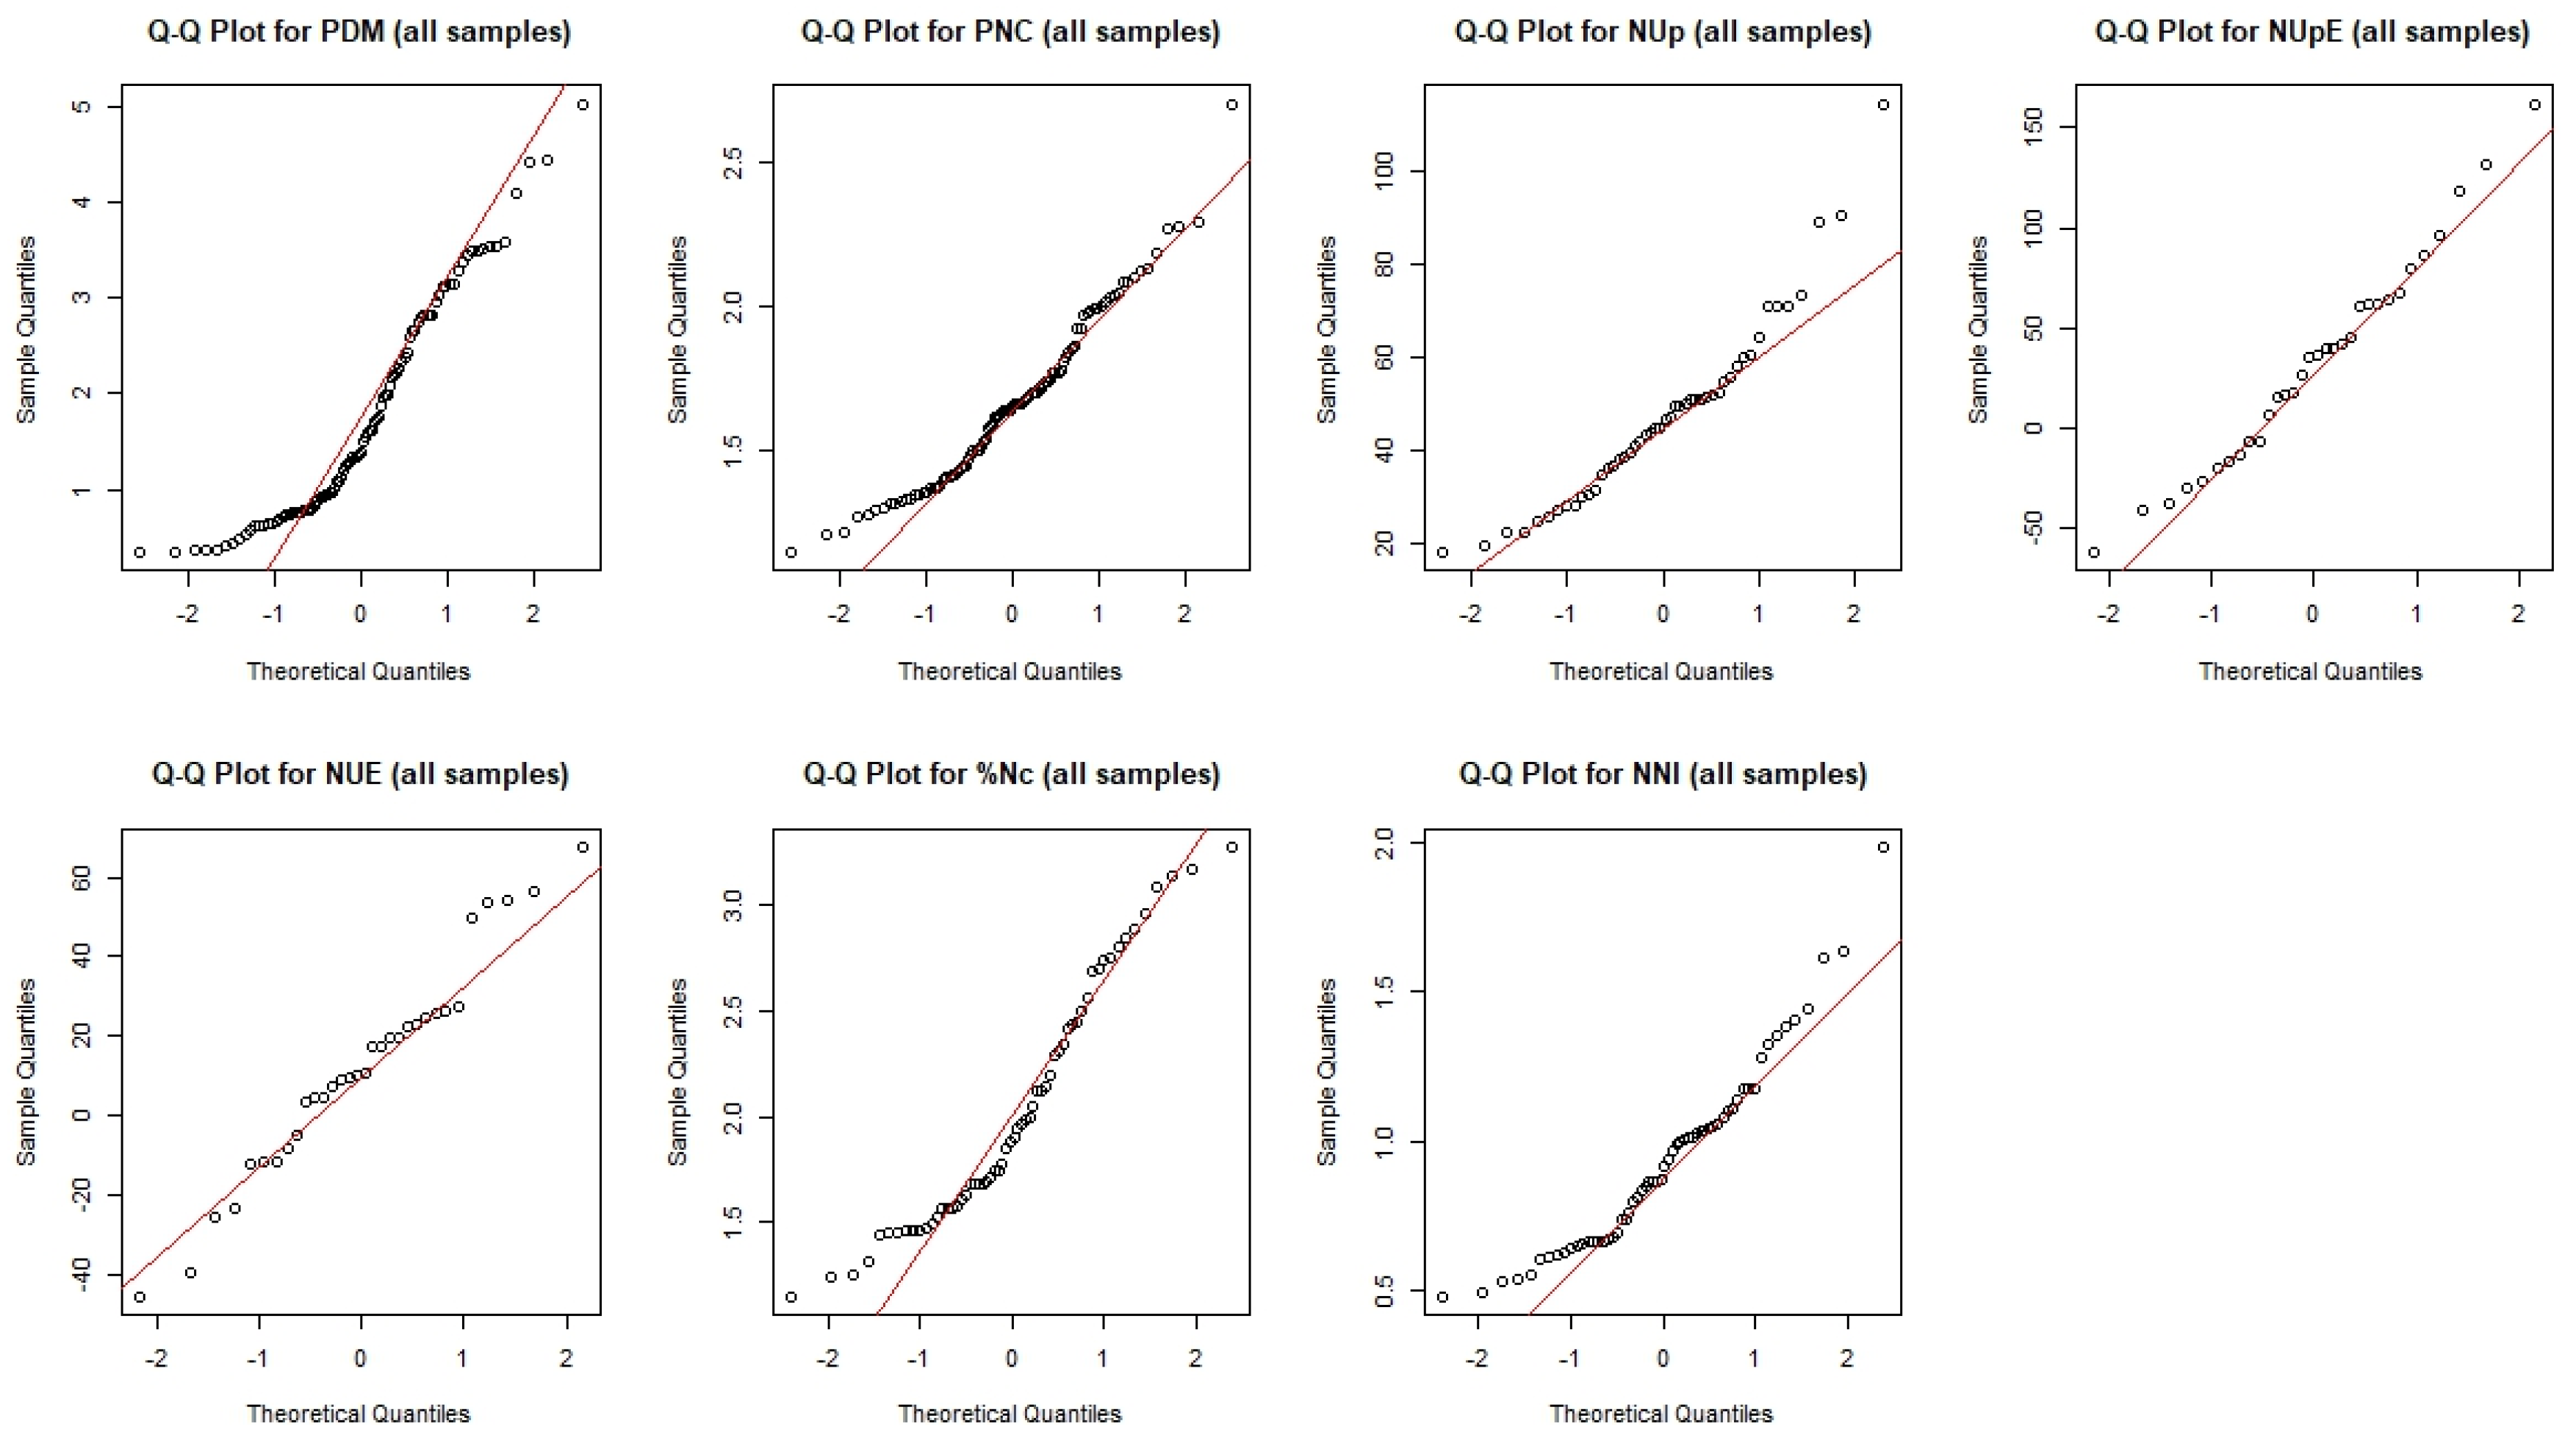
Figure 7.
Boxplots of Crop and Moment groups for the PDM, PNC and %Nc variables, and boxplot of Irrigation groups for %Nc.
Figure 7.
Boxplots of Crop and Moment groups for the PDM, PNC and %Nc variables, and boxplot of Irrigation groups for %Nc.
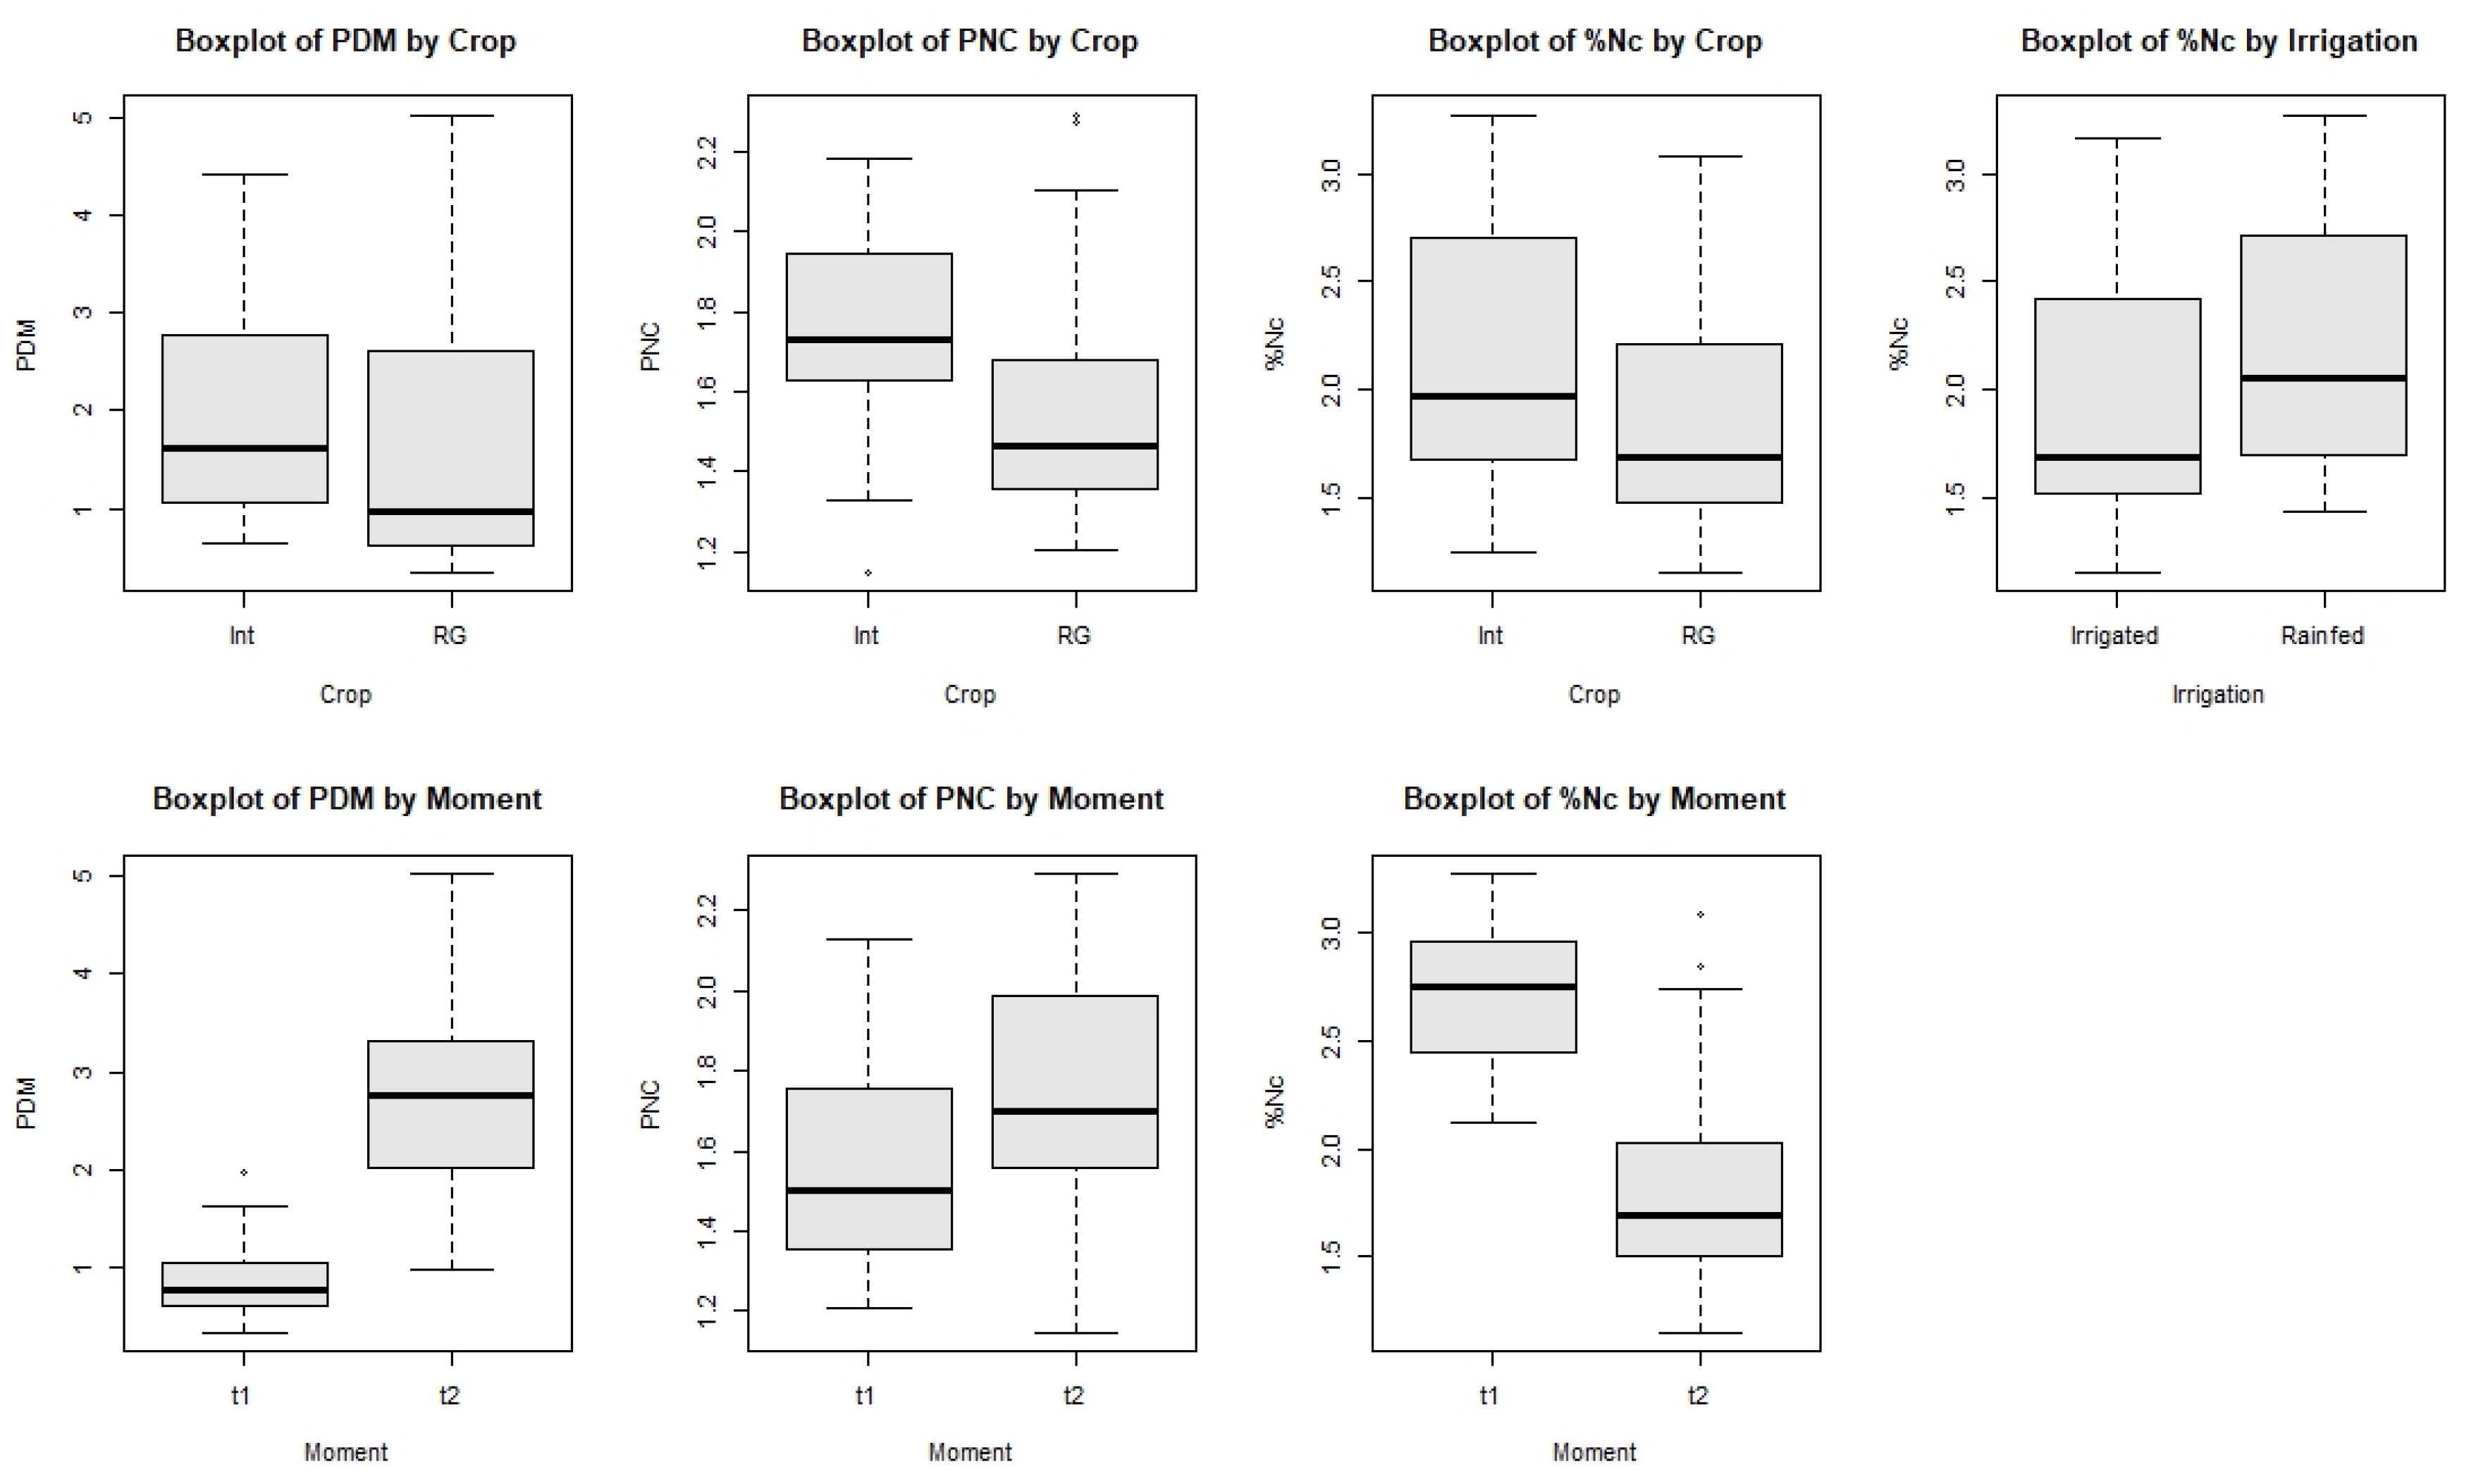
Figure 8.
Boxplots of Irrigation groups for the variables NUp and NNI, boxplot of N treatment groups for NUp, and Moment groups for NNI.
Figure 8.
Boxplots of Irrigation groups for the variables NUp and NNI, boxplot of N treatment groups for NUp, and Moment groups for NNI.
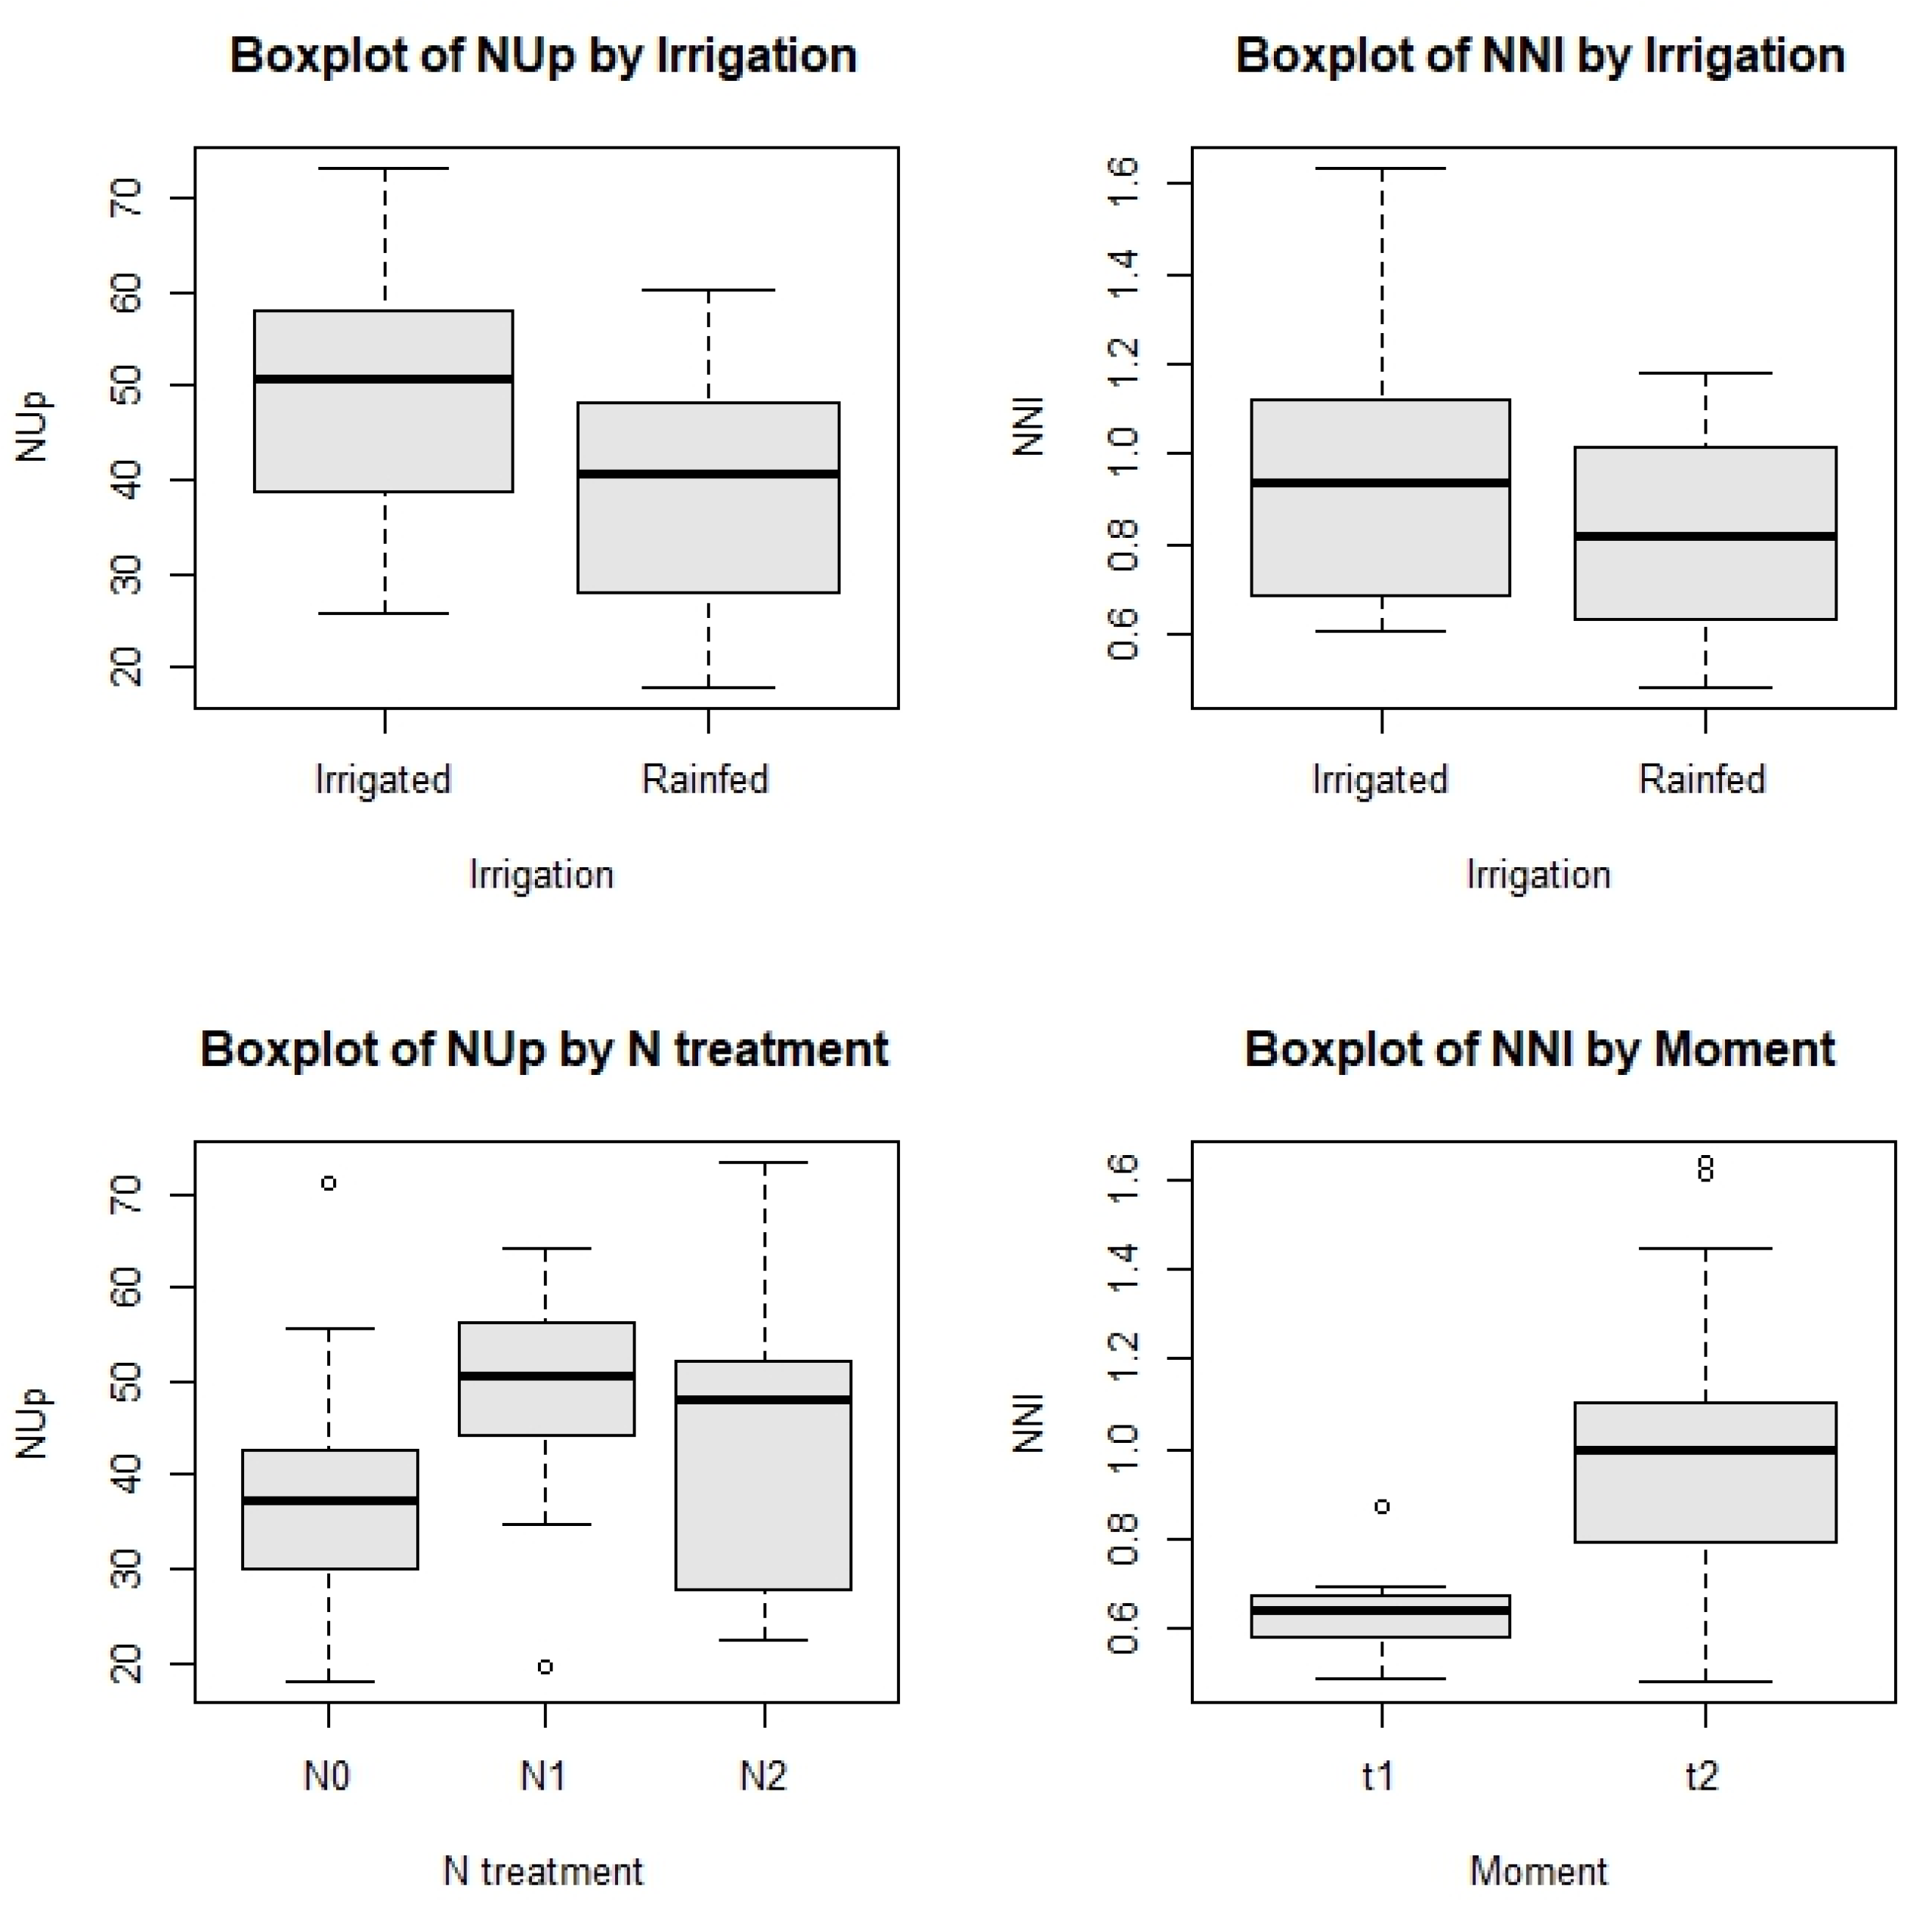
Figure 9.
Boxplots of groups for the variables NUpE and NUE.
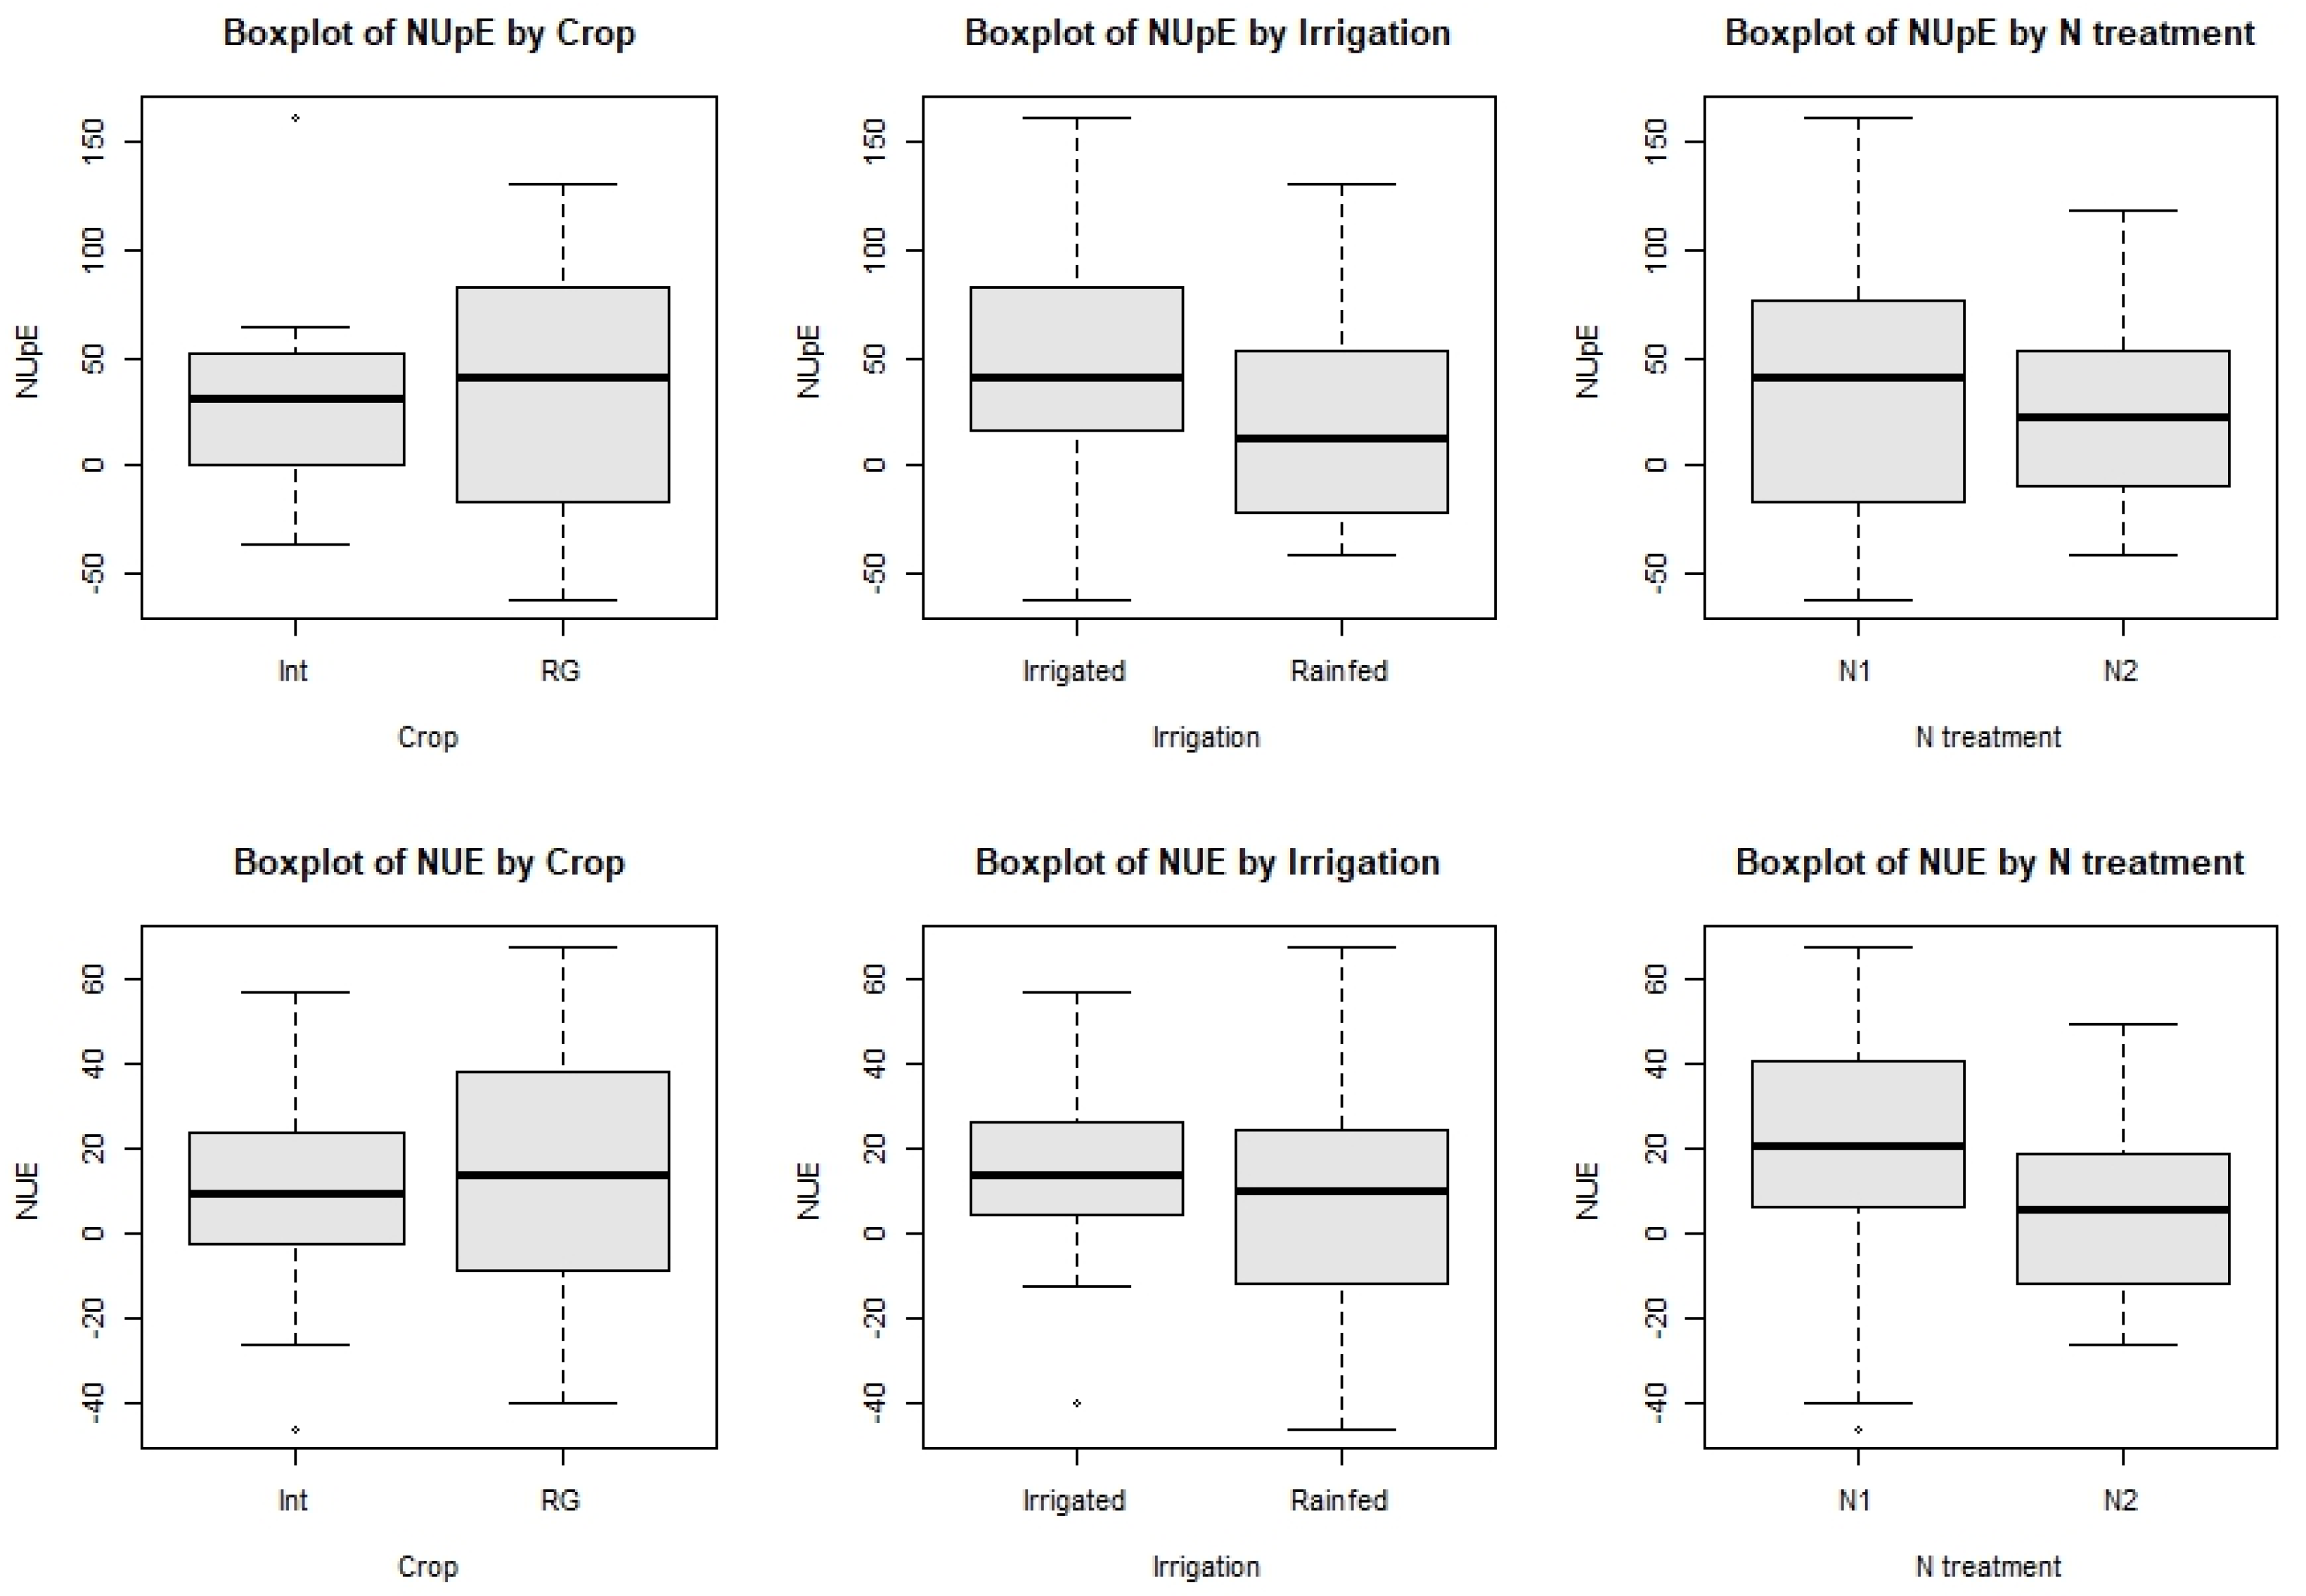

Table 1.
Main characteristics of ryegrass-based forage crops used.
| Crop | Species and Varieties | Percent in the Crop (%) | Seeds m-2 |
|---|---|---|---|
| Annual ryegrass (RG) | Lolium multiflorum L. cv Diamond T | 100 | 1,400 |
| Intercropping ryegrass-based (Int) |
Lolium multiflorum L. cv Hellen | 67 | 1,531 2,5391 |
| Trifolium vesiculosum. cv Comm | 10 | ||
| Trifolium resupinatum. cv Lightning | 17 | ||
| Trifolium michellanium. cv Balansa Paradana | 6 |
1 The value present represents the sum of the number of seeds of the three clover varieties.
Table 2.
Prior information was used on A1 and A2 coefficients for fodder crops.
| Crop/Species | A1 | A2 | Ref. |
|---|---|---|---|
| Festuca arundinacea Schreb. and Dactylis glomerata L. | 4.8 | 0.32 | [5] |
| C3 crops | 5.7 | 0.50 | [24] |
| Lolium multiflorum L.1 | 4.1 | 0.38 | [11] |
| Pheleum pratense L. | 3.7 | 0.35 | [25] |
| Lolium perenne L. | 6.3 | 0.71 | [26] |
| Lolium multiflorum L. 2 | 3.5 | 0.36 | [27] |
| Festuca arundinacea Schreb. | 4.7 | 0.55 | [27] |
| Avena sativa L. | 3.2 | 0.26 | [27] |
| Minimum | 3.2 | 0.26 | |
| Maximum | 6.3 | 0.71 |
1 rainfed annual ryegrass; 2 irrigated annual ryegrass.
Table 3.
Estimated data for coefficients A1 and A2.
| CI 97.5% | Mean | SD | Naive SE | Time-Series SE | |
|---|---|---|---|---|---|
| A1 | 3.634 | 3.356 | 0.119 | 0.00 | 0.00 |
| A2 | 0.708 | 0.657 | 0.036 | 0.00 | 0.00 |
A1 – %Nc of the forage at 1 t PDM ha-1; A2 – coefficient that characterises the pattern of decrease in %Nc during crop growth; CI – Confidence Interval; SD – Standard deviation; SE – Standard Error.
Table 4.
Descriptive and inferential statistics were conducted for the parameters: PDM, PNC, NUp, NUpE, NUE, %Nc, and NNI.
Table 4.
Descriptive and inferential statistics were conducted for the parameters: PDM, PNC, NUp, NUpE, NUE, %Nc, and NNI.
| PDM (t ha-1) |
PNC (%) |
NUp (kg ha-1) |
NUpE (%) |
NUE (kg kg N ha-1) |
%Nc (%) |
NNI | |
|---|---|---|---|---|---|---|---|
| n | 96 | 96 | 48 | 32 | 32 | 60 | 60 |
| mean | 1.78 | 1.67 | 47.33 | 32.92 | 11.82 | 2.03 | 0.94 |
| sd | 1.15 | 0.3 | 19.58 | 52.87 | 26.97 | 0.56 | 0.31 |
| median | 1.44 | 1.65 | 45.65 | 35.52 | 10.29 | 1.89 | 0.90 |
| trimmed | 1.69 | 1.65 | 45.57 | 30.11 | 11.95 | 1.98 | 0.91 |
| mad | 1.15 | 0.32 | 15.41 | 54.74 | 22.75 | 0.61 | 0.33 |
| min | 0.34 | 1.15 | 17.92 | -62.11 | -45.69 | 1.15 | 0.48 |
| max | 5.02 | 2.7 | 114.27 | 161.99 | 67.53 | 3.27 | 1.98 |
| 1st Qu. | 0.78 | 1.42 | 34.01 | -8.16 | -6.03 | 1.57 | 0.67 |
| 3rd Qu. | 2.76 | 1.85 | 54.72 | 62.79 | 24.68 | 2.43 | 1.08 |
| range | 4.68 | 1.56 | 96.35 | 224.11 | 113.22 | 2.13 | 1.50 |
| skew | 0.67 | 0.66 | 1.05 | 0.38 | 0.00 | 0.55 | 0.90 |
| kurtosis | -0.58 | 0.27 | 1.47 | -0.42 | -0.35 | -0.86 | 0.77 |
| se | 0.12 | 0.03 | 2.83 | 9.35 | 4.77 | 0.07 | 0.04 |
| w | 0.92 | 0.96 | 0.93 | 0.97 | 0.97 | 0.93 | 0.94 |
| p-value (Shapiro-Wilk) |
1.25E-05 | 0.0051 | 0.0066 | 0.7937 | 0.5922 | 0.0029 | 0.0037 |
n – number of samples; sd – standard deviation; mad - absolute deviation from median; min – minimum; max – maximum; Qu. – quartile; se – standard error; w – Shapiro-Wilk statistic for normality; PDM – Plant Dry Matter; PNC – Plant Nitrogen Content; NUp – Nitrogen Uptake; NUpE – Nitrogen Uptake Efficiency; NUE – Nitrogen Use Efficiency; %Nc – Critical Nitrogen Concentration; NNI – Nitrogen Nutrition Index.
Table 5.
Descriptive and inferential statistics were conducted for the parameters PDM, PNC, NUp, NUpE, NUE, %Nc, and NNI, excluding outliers.
Table 5.
Descriptive and inferential statistics were conducted for the parameters PDM, PNC, NUp, NUpE, NUE, %Nc, and NNI, excluding outliers.
| PDM (t ha-1) |
PNC (%) |
NUp (kg ha-1) |
NUpE (%) |
NUE (kg kg N ha-1) |
%Nc (%) |
NNI | |
|---|---|---|---|---|---|---|---|
| n | 96 | 95 | 45 | 32 | 32 | 60 | 58 |
| mean | 1.78 | 1.66 | 43.96 | 32.92 | 11.82 | 2.03 | 0.91 |
| sd | 1.15 | 0.28 | 14.63 | 52.87 | 26.97 | 0.56 | 0.28 |
| median | 1.44 | 1.64 | 44.60 | 35.52 | 10.29 | 1.89 | 0.87 |
| trimmed | 1.69 | 1.64 | 43.51 | 30.11 | 11.95 | 1.98 | 0.89 |
| mad | 1.15 | 0.32 | 14.46 | 54.74 | 22.75 | 0.61 | 0.30 |
| min | 0.34 | 1.15 | 17.92 | -62.11 | -45.69 | 1.15 | 0.48 |
| max | 5.02 | 2.29 | 73.29 | 161.99 | 67.53 | 3.27 | 1.63 |
n – number of samples; sd – standard deviation; mad - absolute deviation from median; min – minimum; max – maximum; PDM – Plant Dry Matter; PNC – Plant Nitrogen Content; NUp – Nitrogen Uptake; NUpE – Ni-trogen Uptake Efficiency; NUE – Nitrogen Use Efficiency; %Nc – Critical Nitrogen Concentration; NNI – Nitrogen Nutrition Index.
Table 6.
Results of the Kruskal-Wallis test for dependent variables that do not follow a normal distribution.
Table 6.
Results of the Kruskal-Wallis test for dependent variables that do not follow a normal distribution.
| Factor | Chi-Squared | df | p-Value | Significance1 | |
|---|---|---|---|---|---|
| PDM | Crop | 4.24 | 1 | 0.039 | * |
| Moment | 64.97 | 1 | 7.605e-16 | *** | |
| Irrigation | 3.36 | 1 | 0.067 | . | |
| N treatment | 0.47 | 2 | 0.790 | ||
| PNC | Crop | 14.64 | 1 | 0.00013 | *** |
| Moment | 9.68 | 1 | 0.0018 | ** | |
| Irrigation | 0.00 | 1 | 0.964 | ||
| N treatment | 4.53 | 2 | 0.104 | ||
| NUp | Crop | 0.40 | 1 | 0.525 | . |
| Irrigation | 5.60 | 1 | 0.018 | * | |
| N treatment | 5.11 | 2 | 0.078 | . | |
| %Nc | Crop | 3.58 | 1 | 0.058 | . |
| Moment | 22.87 | 1 | 1.736e-06 | *** | |
| Irrigation | 3.10 | 1 | 0.078 | . | |
| N treatment | 3.21 | 2 | 0.201 | ||
| NNI | Crop | 1.09 | 1 | 0.298 | |
| Moment | 17.19 | 1 | 3.381e-05 | *** | |
| Irrigation | 3.83 | 1 | 0.050 | . | |
| N treatment | 3.47 | 2 | 0.177 |
1 Signif. Codes: 0 “***”; 0.001”**”; 0.01”*”; 0.05 “.”; 0.1 “ “; 1. Blank cells in the “Significance” column indicate that the p-value did not reach the significance level.
Table 7.
Dunn’s test results for the groups that presented significance in the Kruskal-Wallis test.
| Parameter | Approach | z-Value | Adjusted p-Value |
Significance1 |
|---|---|---|---|---|
| PDM | Int vs RG | 2.0591 | 0.0197 | * |
| t1 vs t2 | -8.0604 | 0.0000 | *** | |
| Rainfed vs Irrigated | 1.8319 | 0.0335 | * | |
| PNC | Int vs RG | 3.8260 | 0.0001 | *** |
| t1 vs t2 | -3.1114 | 0.0009 | *** | |
| NUp | Int vs RG | 0.6358 | 0.2625 | |
| Rainfed vs Irrigated | 2.3661 | 0.0090 | ** | |
| N0 vs N1 | -2.2544 | 0.0363 | * | |
| N0 vs N2 | -1.2223 | 0.3324 | ||
| N1 vs N2 | 0.9766 | 0.4931 | ||
| %Nc | Int vs RG | 1.8929 | 0.0292 | * |
| t1 vs t2 | 4.7819 | 0.0000 | *** | |
| Rainfed vs Irrigated | -1.7608 | 0.0391 | * | |
| NNI | Rainfed vs irrigated | -4.1462 | 0.0000 | *** |
| t1 vs t2 | 1.9563 | 0.0252 | * |
1 Signif. Codes: 0 “***”; 0.001”**”; 0.01”*”; 0.05 “.”; 0.1 “ “; 1. Blank cells in the “Significance” column indicate that the p-value did not reach the significance level. RG – annual ryegrass; Int – Intercropping ryegrass-based; NNI – Nitrogen Nutrition Index.
Table 9.
Results of the ANOVA test for dependent variables that follow a normal distribution.
| Dependent Variable |
Factor | Df Group | Df Residual | Sum of Squares | Mean Squares | F-Value | p-Value | Significance1 |
|---|---|---|---|---|---|---|---|---|
| NUpE | Crop | 1 | 30 | 219.39 | 219.4 | 0.076 | 0.784 | |
| Irrigation | 1 | 30 | 6641.09 | 6641.0 | 2.490 | 0.125 | ||
| N treatment | 1 | 30 | 1525.92 | 1526.0 | 0.538 | 0.469 | ||
| NUE | Crop | 1 | 30 | 301.01 | 301.0 | 0.406 | 0.529 | |
| Irrigation | 1 | 30 | 542.19 | 542.2 | 0.739 | 0.397 | ||
| N treatment | 1 | 30 | 1315.78 | 1315.8 | 1.859 | 0.183 |
1 Significance codes: 0 “***”; 0.001”**”; 0.01”*”; 0.05 “.”; 0.1 “ “; 1. Blank cells in the “Significance” column indicate that the p-value did not reach the significance level.
Disclaimer/Publisher’s Note: The statements, opinions and data contained in all publications are solely those of the individual author(s) and contributor(s) and not of MDPI and/or the editor(s). MDPI and/or the editor(s) disclaim responsibility for any injury to people or property resulting from any ideas, methods, instructions or products referred to in the content. |
© 2024 by the authors. Licensee MDPI, Basel, Switzerland. This article is an open access article distributed under the terms and conditions of the Creative Commons Attribution (CC BY) license (http://creativecommons.org/licenses/by/4.0/).
Copyright: This open access article is published under a Creative Commons CC BY 4.0 license, which permit the free download, distribution, and reuse, provided that the author and preprint are cited in any reuse.


