
Submitted:
29 June 2024
Posted:
02 July 2024
You are already at the latest version
Abstract
Protein glycation impacts enzymatic activity, disrupts metabolic processes, and is associated with chronic degenerative diseases. The human glycolytic enzyme triosephosphate isomerase (HsTIM, TPI1, or HsTPI) is associated with various disorders, such as enzymopathies originating from mutations. It also possesses moonlighting functions and is now recognized as a cancer marker. Previous reports of HsTPI mutants have demonstrated a significant increase of methyl-glyoxal (MGO) due to trioses accumulation. We compared how catalytic activity exerts differen-tial kinetic and structural stability effects due to mutations by tracking fluorescent argpyrimi-dine adduct (ARGp) through interaction with Arginine-MGO. Circular dichroism and fluores-cence spectroscopy were explored in HsTPI-WT and mutants HsTPI-C217K “Like-WT”, HsTPI-N16D accumulated in cancer, and HsTPI-E104D human deficiency mutant, by cysteines accessibility and time loss of activity and unfolding propensity in mutant enzymes with aggre-gates refractory to proteolysis in the C217K. Our study sheds new light on the increased suscep-tibility of mutants to generate MGO adducts due to TPI isomerization of MGO precursor sub-strates. Nevertheless, mutations enhance a negative feedback cycle, in which accumulated MGO access promotes accelerated loss of activity that leads to unfolding and aggregation. The cumu-lative and accelerated increase in MGO adducts, which probably are responsible for the patho-logical state in this TPI variant, are partially reversed by adding MGO-scavenger molecules.
Keywords:
advanced glycation end products (AGEs)
; metabolic dysfunction
; protein relation structure-function
; spectroscopic analysis
; conformational changes
; catalytic aging
; molecular wear
; enzymatic rescue
1. Introduction
The development of chronic degenerative diseases (CDD) is often accompanied by significant metabolic disruptions, frequently exacerbated by high-calorie diets and sedentary lifestyles [1]. Excessive caloric intake leads to hyperglycemia, contributing to Metabolic Syndrome, which is increasingly observed in younger populations [2].
Mounting evidence highlights the interplay between energy metabolism and proteostasis, suggesting that this relationship plays a crucial role in CDD progression. Metabolic disturbances in glycolysis and proteolysis can create a detrimental self-reinforcing cycle that induces the production and accumulation of the trioses dihydroxyacetone phosphate (DHAP) and Glyceraldehyde 3-phosphate (G3P). This results in elevated levels of methylglyoxal (MGO), identified to be a toxic byproduct derived from the degradation of such trioses [3]. MGO induces non-enzymatic post-translational modifications (NE/PTM), which can compromise protein stability and lead to misfolding, as previously reported in TPI from Drosophila [4].
At low doses (0.3 mM), MGO can form adducts with 5-10% of the cellular protein content [5]. These adducts primarily involve arginine (Arg) residues, creating hydroimidazolones adducts (MGO-H). MGO-H1 and MGO-H2 are the predominant form, accounting for over 90% of MGO-derived adducts [6]. MGO can also modify lysine (Lys) residues, generating free radicals like superoxide [7], which increase intracellular oxidative stress within cells [8]. Due to its electrophilic nature and reactivity, MGO binds reversibly to nucleophiles such as thiols, especially glutathione (GSH), as well as to cysteine (Cys) residues in proteins forming hemithioacetals [9]. MGO detoxification occurs via both GSH-independent and GSH-dependent pathways [10]. Nonetheless, in pathological states such as cancer and metabolic syndrome, where glycolytic activity is significantly upregulated (30 to 200-fold respect normal cells), it has been observed that elevated levels of MGO may paradoxically exert a hormetic or dual adaptive effect, promoting cell proliferation [11].
In both normal and pathological conditions, as observed in individuals with CDD [1], these NE/PTMs can induce novel protein functions, excluding their canonical roles through the generation of moonlighting activities. This phenomenon underscores the importance of understanding how NE/PTMs, driven by pathological signals or genetic mutations, underlie disease mechanisms [12]. MGO can accelerate premature aging and contribute to a plethora of chronic degenerative diseases, including arterial hypertension, atherosclerosis, diabetes mellitus, cancer [13], Parkinson's disease [14], and Alzheimer's disease (AD) [15]. These diseases are characterized by the accumulation of proteins with altered metabolic functions due to NE/PTMs, such as albumin [16,17], hemoglobin [18], HSP-27 [19], G3-PDH [20], α-synuclein [21] and TPI [22].
A study on HEK cells overexpressing a double mutant of TPI (Tyr164-Phe and Tyr208-Phe) demonstrated that its nitrotyrosination decreased glycolytic flux due to diminished catalytic activity and elevated MGO production [23]. This effect correlated with higher glycation levels in AD brains and β-sheet aggregate formation in vitro and transgenic mice. The nitro-oxidative environment in AD promotes high levels of 3-nitrotyrosinated TPI, leading to the inhibition of this enzyme, with subsequent increases of MGO levels [23], ultimately contributing to the advanced glycation end-products (AGEs) formation [24].
Glycolytic failure in CDD leads to harmful adduct accumulation and dicarbonyl stress, promoting AGE formation [25]. It has been shown that AGEs, with diverse chemical structures, could be associated with different pathologies, hence, in part, the difficulty in quantifying them [26]. Additionally, these AGEs slowly but irreversibly modify Lys and Arg residues [27], making it possible to classify into non-fluorescent types (e.g., N-ε-(carboxyethyl)lysine [CEL]), carboxymethyl-lysine [CML]) and fluorescent types (e.g., pentosidine, MGO-lysine dimer [MOLD], and ARGp) [28].
The role of TPI is critical in preventing DHAP accumulation (precursor of MGO and AGEs) [29]. This study focuses on the functional and structural changes induced by single mutants of human TPI (HsTPI), particularly the E104D and C217K mutants, linked to regulatory effects on enzyme activity. Unlike the deamidated N16D variant [30], N16D does not exhibit substrate saturation, leading to increased MGO production and ARGp adduct formation. Exposure to G3P or MGO induces structural and functional alterations in these HsTPI mutants, highlighting their susceptibility to MGO and increased ARGp adducts. These changes negatively impact structural stability, accelerating enzymatic inhibition and unfolding. Thus, our results elucidate the impact of some HsTPI mutations on function and structure, providing insights into the severity of HsTPI deficiency, which can be reversed by adding MGO scavenger molecules [31].
2. Results
2.1. Kinetic Analysis Reveals Increased Vmax but Reduced Catalytic Efficiency for C217K Mutant, with N16D Most Detrimentally Affected
Kinetic parameters were determined to elucidate the impact of mutations (N16D, E104D, and C217K) on the catalytic activity of recombinant HsTPI enzymes compared to the wild-type (WT)enzyme. As shown in Table 1, the Vmax values for HsTPI-WT, N16D and E104D mutants were similar, indicating comparable maximal catalytic activities. However, the C217K mutant exhibited a significant increase in Vmax, approximately 3.28 folds than the WT. Despite this elevated Vmax, the C217K variant also showed a 3.82-fold increase in the Km value regarding to WT, indicating a reduced substrate affinity. Consequently, the catalytic efficiency of C217K was similar to WT enzyme, while higher than WT and E104D, was compromised by its higher Km. In contrast, the N16D mutant displayed the most substantial reduction in catalytic efficiency. These results are in concordance with previous reports [30] and highlight differential impacts of the mutations on the catalytic properties of HsTPI, with N16D being the most detrimental (Table 1) [30].
2.2. Cysteine Accessibility Assay Reveals Compact Structure for C217K Mutant and Structural Relaxation in E104D and N16D Mutants
To investigate potential alterations in protein structure due to the observed changes in kinetic parameters, the accessibility of free cysteine (Cys) residues in the recombinant HsTPIs was evaluated under native conditions using 5,5'-dithiobis-(2-nitrobenzoic acid) (DTNB) as a probe. As shown in Figure 1A, the permeability of DTNB to Cys residues varied among the mutants and WT enzymes. C217K exhibited the lowest DTNB accessibility, with minimal Cys derivatization during the first h of incubation, indicating a highly compact structure.
The WT enzyme showed derivatization of approximately 1 Cys per subunit, suggesting moderate accessibility to these residues (Figure 1B). In contrast, the E104D mutant showed a significantly higher and progressive rate of Cys derivatization, with 4 Cys per subunit derivatized within the first hour. This finding supports previous reports that the E104D mutation induces substantial structural relaxation, particularly affecting non-covalent contacts at the protein interface [32]. The N16D mutant displayed the most rapid derivatization with 4 Cys per subunit modified within approximately 20 min. (Figure 1B), reflecting increased porosity and structural relaxation due to deamidation at Asn16, located at the protein interface [30].
Following the addition of a denaturing agent, all enzymes except C217K showed quantification of 5 Cys per subunit (Figure 1B). In contrast, the C217K mutant displayed 4 Cys per subunit, indicating a slightly lower Cys accessibility than the other variants under denatured conditions. This suggests that the Cys residues in these proteins predominantly exist in their thiolate form, reinforcing the notion that the structural integrity of C217K is markedly different from the other mutants.
2.3. G3P Binding Induces Distinct Mobility Shifts in HsTPI Mutants, Suggesting Substrate-Dependent Structural Alterations
In subsequent experiments, the electrophoretic mobility of recombinant enzymes under native conditions was evaluated to elucidate structural alterations resulting from modifications in the protein's net charge. As observed in Figure 2, the electrophoretic profiles of the enzymes were examined both in the absence and the presence of the G3P substrate. G3P induced distinct shifts in electrophoretic mobility for all enzymes compared to the condition without the substrate. However, notable variations were observed among HsTPI enzymes. For instance, in the HsTPI-WT, lane 2 displayed a notable distortion in native electrophoretic (N-PAGE) mobility when G3P was present. Such alteration was even more pronounced in the N16D enzyme, as evident from lane 6 in the presence of the substrate. Further evidence of this effect was observed in the E104D enzyme, particularly in lane 8 (Figure 2).
Remarkably, C217K exhibited the most significant alteration in electrophoretic migration in the presence of the G3P substrate. These observations highlight a progressive and substantial structural transformation induced by different mutations in the presence of the substrate. Therefore, each enzyme appears to exert a unique influence on the native structure in the presence of G3P. The observed variations in electrophoretic mobility suggest that different mutations lead to gradual structural alterations in response to substrate catalysis.
2.4. G3P Incubation Reduces DTNB Accessibility in Mutant HsTPIs, Suggesting MGO-Cys Adduct Formation
We performed Cys titration experiments to evaluate HsTPI enzymes' permeability to DTNB under exhaustive catalysis. Our results revealed a diminished response to Cys derivatization in the enzymes following incubation with G3P 1 mM for 56 h (Figure 3). Notably, the C217K, N16D, and E104D enzymes resist Cys derivatization by DTNB after exposure to the G3P substrate (Figure 3B, 3D, respectively). This resistance suggests a reduced susceptibility to Cys chemical modification. For instance, in the TPI-C217K mutant exposed to the substrate, no increase in TNB formation (generated after Cys derivatization) was observed, even after adding a denaturing agent. This result indicates the thiol-reactive agent's inability to access free Cys residues, potentially due to the formation of MGO adducts (arising from the spontaneous degradation of G3P) with these aminoacyl residues. In contrast, TPI-WT displayed a significant increase in TNB signal after adding a denaturing agent, indicating that Cys residues do not react with MGO. For the N16D and E104D enzymes in the presence of the substrate, the scenario was very similar to that of C217K, with no increase in the TNB signal under denaturing conditions. This suggests a chemical modification of the Cys residues by MGO in the exhaustive catalysis condition.
These results suggest increased G3P substrate adducts in the mutant enzymes, potentially leading to the reaction with Cys residues to form MGO-Cys adducts, thereby preventing their derivatization with DTNB. The structural alterations observed in these mutants facilitate the MGO-glycation reaction of nucleophilic amino acids, such as Lys, Arg, and Cys.
This non-enzymatic glycation process is expected, given that the amino acid sequence of the human TPI enzyme (HsTPI) includes 42 Lys residues (21 per monomer), 16 Arg residues (8 per monomer), and 10 Cys residues (5 per monomer), totalling 68 residues. These 68 residues represent approximately 7.3% of the amino acids in HsTPI, making them potentially susceptible to adduct formation via MGO interaction.
2.5. CD Spectroscopy Reveals G3P-Induced Secondary Structure Alterations and Reduced Thermal Stability in N16D and E104D Mutants
Circular dichroism (CD) experiments were conducted in the absence and presence of the G3P substrate to evaluate the impact on enzyme secondary structure and thermal stability. As shown in Figure 4A, most enzymes exhibited consistent CD profiles, except for the TPI-E104D, which displayed a notable reduction in CD intensity. Notably, the presence of G3P in both E104D and N16D variants displayed significant decreases in their CD spectra compared to other enzymes as shown in Supplementary Table S1, suggesting alterations in secondary structure due to catalytic activity (Figure 4B).
Moreover, thermal stability assessments revealed that the N16D and E104D enzymes exhibited diminished stability, experiencing respective decreases of 8 and 10 °C compared to the HsTPI-WT enzyme (Figure 4C). Notably, incubation of the enzymes with G3P exacerbated these differences in thermal stability loss, particularly in E104D and N16D, accentuating their alterations on global stability (Figure 4D). These findings suggest that the presence of the G3P substrate induces alterations in the secondary structure of enzymes and affects their thermal stability. Specifically, the E104D and N16D enzymes appear susceptible to modifications in secondary structure and thermal stability, indicating a potential relationship between catalytic activity and structural integrity with substrate G3P.
2.6. Fluorescence Spectroscopy Reveals Differential Effects of Mutations on Protein Dynamics and ANSA Binding
Fluorescence emission spectra are a robust technique for elucidating relation between protein dynamics and stability. Thus, we analyzed the intrinsic fluorescence spectra of the enzymes. As shown in Figure 5A, a marginal decrease in signal was observed for the WT, C217K, and N16D. However, the most remarkable difference was found in the E104D enzyme, with a decrease by quenching of fluorescence at 280 nm of 70 arbitrary units (a.u.) in the maximum fluorescence intensity (IFmax).
Besides, to evaluate alterations in global tridimensional structure (3D), extrinsic fluorescence was evaluated using 8-Anilinonaphthalene-1-sulfonic acid (ANSA). In the absence of ANSA, comparable fluorescence spectra hydrophobic patches were observed for the WT, C217K, and E104D enzymes, while an increase was evident for the N16D. In both cases, no discernible exposure of hydrophobic patches to the surface was noted in the enzymes. However, upon the addition of 150 M ANSA, a substantial increase in fluorescence was observed in E104D and N16D, as shown in Figure 5B and Supplementary Table S2. Therefore, mutations have varying effects on protein dynamics and stability. E104D seems to be most affected, potentially exhibiting a less stable and more flexible structure. The results suggest that E104D and N16D mutations might lead to increased exposure of hydrophobic regions on the protein surface.
2.7. Temporal Analysis of Structural Alterations and Kinetics of ARGp Adduct Formation
A temporal analysis of structural alterations was performed to understand the interaction dynamics between the enzymes and MGO. The identification of the fluorescent argpyrimidine (ARGp) adduct was facilitated through a standard curve, allowing for the determination of adduct formation and estimation of the average interaction time with MGO (Supplementary Figure S1A). Under stoichiometric conditions (1:1), a mean saturation of 50 % was observed after 87 h of sample incubation at 37 °C (Supplementary Figure S1B). This was exemplified by the C217K plus-G3P variant (Supplementary Figure S2A,B) analyzed by ARGp signal and extrinsic fluorescence by ANSA. Consequently, experiments were extended up to 96 h of incubation, during which structural alterations were identified in enzymes incubated in the presence of either G3P 2 mM or MGO 1 mM.
2.7.1. Fluorescence Analysis Reveals Increased ARGp Formation and Hydrophobic Patch Exposure in Mutant TPIs upon G3P Incubation
To investigate the effects of G3P catalysis on conformational destabilization, TPIs were carried out by fluorescence studies by determining ARGp adduct signal and ANSA over 96 h of incubation at 37 °C (Figure 6).
In the absence of G3P, the fluorescence signal was minimal (Figure 6A), whereas, upon G3P addition, a progressive increase in fluorescence signal was observed, attributed to ARGp formation. As seen in Figure 6A, the ARGp formation at 96 h shows the differential effect of incubation with the substrate on the mutants vs WT; the N16D enzyme being the most susceptible to ARGp formation, this increased its signal at 395 nm by 3-fold, C217K 2-fold and E104D for 0.6-fold before the signal recorded for WT plus-G3P. Remarkably, this increase was most prominent in the N16D, followed by C217K, E104D, and WT, suggesting augmented ARGp formation in mutant enzymes regarding the WT.
Regarding the ANSA signal, baseline levels were observed without G3P, with slightly higher signals in E104D and N16D enzymes (Figure 6B). However, upon G3P addition, a significant increase in extrinsic fluorescence signal was noted in the mutants, particularly pronounced in N16D, followed by C217K and E104D, while WT maintained a baseline signal (Figure 6B). These findings suggest a correlation between MGO adduct formation and exposure of hydrophobic patches in mutant enzymes, indicating a substantial increase in fluorescence intensity with the presence of G3P, signifying a correlation between ARGp formation and hydrophobic patch exposure in the enzymes. Mutant enzymes, particularly N16D and C217K, exhibit more pronounced changes in fluorescence signals regarding WT, both in terms of ARGp formation and ANSA signal (Figure 6A,B; and Supplementary Figure S3 1A-3A, and S3 1B-3B).
2.7.2. MGO Exposure Induces Enhanced ARGp Formation and Hydrophobic Patch Exposure in N16D and C217K Mutants Compared to WT TPI
Incubation assays were conducted in the presence of MGO to determine the permeability to the inner enzymes. This analysis, as well as the previous experiment with G3P, showed a difference for each enzyme of structural alterations induced by methylglyoxal (MGO), revealing a time-dependent increase in the fluorescence signal of all TPI enzymes, peaking at 96 h of incubation with MGO (Figure 7A), consistent with the mean saturation time of 87 h for ARGp formation (Figure S3B) and exemplified by C217K plus-MGO (Figure S2B). Interestingly, ARGp formation was more pronounced in N16D and C217K mutants compared to the WT enzyme (Figure 7A). Additionally, the ANSA assay exhibited a significant increase in hydrophobic patches in the N16D enzyme, followed by C217K and E104D mutants. At the same time, there was no notable increase in hydrophobic patch exposure in the WT enzyme (Figure 7B). Therefore, exposure of TPI to MGO induces structural alterations, with mutants N16D and C217K showing increased ARGp formation and exposure to hydrophobic patches compared to WT.
Therefore, TPI exposure to MGO induces structural alterations. Significantly, the mutants N16D and C217K exhibit increased formation of ARGp and more exposure to hydrophobic patches compared to the WT enzyme. These showed similarity with the behaviour of hydrophobic patches with a 30-fold increase of the fluorescent signal for C217K, a 53-fold increase for N16D, and 27-fold for E104D at 96 h. (Figure 7B). These results suggest that MGO-induced modifications are more prominent in mutant TPI enzymes, highlighting the importance of understanding the impact of MGO on protein structure and function (Supplementary Figure S4, 1A-3A, and S4 1B-3B), particularly in disease states associated with MGO accumulation.
2.8. TPIs Altered at the Functional and Structural Level by G3P and MGO Are Partially Reversed by MGO Scavenger
Under catalysis, TPI enzymes can alter their structure, and the formation of MGO can synergistically induce further structural alteration. Thus, experiments were conducted to determine changes in enzyme activity and electrophoretic mobility in the presence of G3P and MGO. Residual activity was determined after exposure to G3P or MGO for 24 or 48 h. The residual activity was gradually ablated after incubation with G3P for 24 or 48 h. Although the mutants were more pronounced, such an effect was found. In Figure 8A, incubation with G3P gradually diminished residual activity, with mutants experiencing more pronounced effects than WT. Hence, the dynamic nature of TPI enzymes, influenced by continuous catalysis, allows for structural alterations, which can be further induced by MGO formation.
However, the impact of MGO on TPI activity was less drastic, reaching 50 % inactivation in the mutants (Figure 8B). Conversely, the MGO impact on TPI activity was less severe than G3P, resulting in approximately 50% inactivation in the mutants (Figure 8B). However, adding the scavenger Arg exhibited a protective effect on enzymatic activity plus-G3P or plus-MGO. These results underscore the dynamic interplay between enzyme structure, substrate interaction, and potential protective mechanisms in maintaining enzymatic function under physiological stressors such as the MGO.
Due to this, the echimolar addition of Arg showed a protective effect on enzymatic activity, so TPI enzymes were exposed to Arg scavenger in the presence of G3P and MGO (Figure 8C,D). It is observed that there was a protective effect on the residual enzyme activity in the mutants evaluated. Finally, the N-PAGE showed that the integrity of the electrophoretic mobility of the TPIs was gradually lost under the increment of exposure to G3P and MGO (Figure 8E,F). The above results suggest that TPI enzymes undergo structural alterations under continuous catalysis, which can be further exacerbated by MGO formation. However, some degree of restitution in its integrity was reached under exposure to Arg.
2.9. Structural Alterations by AGEs Formation in HsTPI Induce Aggregation by Protein Cross-Linking
An important point resulting from the direct effect of the glycation originated by NE-PTM caused by MGO is the generation of cross-linking dimers of MGO-Lys (MOLD) and dimer arginine - lysine (MODIC), among others [28]. The spectra data signal obtained by interaction equimolar ARG-MGO was followed during 421 h (Supplementary S1A). These samples were recorded at λ exc. at 325 nm and λ em. of 340-600 nm λ. These results were plotted, and FI λ em at 395 nm plotted vs time to generate the saturation curve fitted by the Michaelis-Menten equation to obtain the kinetics of the ARGp50% signal at 87 h, which allowed us to evidence the increase of ARGp fluorescent adduct signal (Supplementary S1B). G3P or MGO previously glycated HsTPIC217K, an increase in the ARGp adduct fluorescent was observed. These fluorometric scannings were followed by 500 h (Supplementary Figures S2A and S2B, respectively).
The exposure of TPI-C217K to prolonged incubation with G3P or MGO resulted in the formation of the aggregates, exhibiting limited mobility in N-PAGE (Figure 9A). These glycated enzymes by G3P ó MGO showed a high molecular mass (MM) and did not enter in N-PAGE (Figure 9A). They indicated the formation of glycation-modified species, including monomers and higher molecular weight oligomeric forms of HsTPI-C217K. Notably, these soluble aggregates exhibited molecular masses greater than the tetrameric form of TPI, suggesting cross-linking mediated by G3P and MGO glycation (Figure 9B).
3. Discussion
Glycolytic enzymes have been reported to be targets of NE/PTM through the formation of MGO adducts. The MGO adducts are modified by carbamylation at TPI Arg3 and oxidation at Met14 in samples obtained from epithelial cell lines and peripheral blood lymphocytes [34]. Moreover, TPI and glycosylated haemoglobin in mice have been reported to be markers of diabetes [35].
This study delves into how mutations in HsTPI can significantly impact its kinetic stability and protein structure by fostering MGO adduct formation and enzymatic aggregation. Anomalous folding leading to enzyme instability is a known contributor to toxic protein aggregate formation in HsTPI variants associated with pathology [36]. Our investigation compares wild-type HsTPI against mutants resembling C217K, E104D, and the inherently unstable N16D. This comparison elucidates the effects of mutations on intra- or intersubunit contacts, unfolding, and aggregation in HsTPI [37], similar to observations in other proteins like albumin [38].
In a murine AD model, TPI glycation has been detected in the brains of transgenic mice exhibiting β-amyloid plaque formation [35]. We demonstrate that metabolite-induced inhibition and unfolding, under normal or pathological conditions, manifest in changes such as catalytic instability, enzymatic loss, inhibition, structural unfolding, and increased resistance to proteolysis. We observe a negative synergy between the catalytic activity of mutant enzymes, where kinetic instability precedes protein inactivation. The loss of substrate affinity in C217K promotes substrate transformation to MGO. This compensatory effect decreases affinity by substrate, accelerating G3P isomerization and potentially initiating MGO adduct formation and structural instability.
These alterations were previously shown in N16D to drastically decrease cellular activity and increase MGO in breast cancer cells (MDA-MB-231) [39]. Thus, metabolic reprogramming can occur due to increased aerobic glycolysis [40]. This enzyme represented the behaviour of HsTPI in glycolytic cancer cells. It was evidenced by a more significant number of internal cavities that made it more porous and reactive to inhibitory compounds [41], therefore showing increased susceptibility to AGE formation, ranking first in ARGp adduct formation, which in five days under intracellular physiological concentrations reported for MGO, enzymatically inhibits and destabilises the mutant proteins analyzed.
The Cys217 residue in α-helix 7 of HsTPI is pivotal in regulating enzyme catalysis and stability [42]. Mutations disrupting interactions involving Cys217 may directly lead to MGO generation, as seen in C217K, facilitating the acquisition of NE/PTM in HsTPI [43]. This mutant C217K shows similarity in the accessibility of its free Cys to WT, showing a marginal initial effect on structural stability and enzymatic catalysis. However, this same substitution by directed mutagenesis in Giardia lamblia TPI (GlTPI-C222K) was reported to drastically affect catalysis by introducing a positive charge, with decreased kcat/Km < 159-fold vs GlTPI-WT.
Due to the mutation for GlTPI-C222K, It has been reported that the differences in reactivity of Cys217 in HsTPI compared to homologue Cys222 in GlTPI are due to the surrounding environment of these Cys residues [42]. Still, in HsTPI-C217K, this mutant resembled initially like-WT performance by their catalytic efficiency [44].
These are consistent with the change in catalytic constants in both GlTPI and HsTPI enzymes, and active site perturbations are associated with alterations in the regions 212–219 and 231–234 in the case of the deficiency mutant HsTPI-V231M located very close to the active site [45].
The HsTPI-E104D mutant, associated with a human TPI deficiency disease, exhibits normal catalytic activity but diminished 1-fold substrate affinity. Structural alterations in this mutant compromise dimer formation and thermostability, leading to monomerisation under conditions where the wild-type enzyme remains dimeric [46].
Mutant enzymes C217K and E104D show increased structural alterations, commonly linked to conformational changes induced and amplified by enzymatic activity and subsequent misfolding, resulting in MGO adduct formation. Despite no initial reduction in catalytic activity, similar to pathogenic TPI variants, these mutants exhibit decreased activity, highlighting the need for further investigation into cellular processes contributing to TPI deficiency [47].
It has been reported that MGO promotes cell damage by increasing ARGp. As this adduct is formed, one month of diabetes in a model animal may be sufficient to produce ARGp [48]. We show that WT enzyme plus-MGO evidenced structure compaction, but the mutants showed susceptibility to MGO permeability and ARGp adduct formation.
On the other hand, we describe a new approach to exploring the deficiencies of HsTPI or point mutations located at regulatory sites of TPI activity, such as Cys217, that provoked structural instability. Thus, the C217K mutant's behaviour may help unravel the mechanism by which the loss of contacts close to the mutation site can differentially impact the development of functional instability, causing the initial decrease in substrate affinity that induces drastic structural changes observed by biophysical structural probes which confirmed its propensity for denaturation.
An important point is the rate of change of the secondary structure components in the mutant by substrate catalysis. In this sense, the mutant recombinant F240L reported for the human deficiency showed a 6-fold higher activity in purified E. coli extracts than the erythrocytes from patients with the mutation [47]; thus, in the context of molecular turnover due to catalysis, our data agree that enzymatic catalysis in the mutants enzymes differentially alters their stability making them more susceptible to enzymatic inactivation and structural unfolding.
The rate at which mutants unfolded was much faster and accelerated. In the case of the F240L mutant, the loss of its activity may be related to the number of catalytic events that the enzyme can withstand in the patients due to the mutation, thus showing in patients the presence of enzymes worn out by catalysis and whose activity is lower [49], as in our explored conditions plus G3P. This behaviour has not yet been investigated in the recombinant mutant enzymes reported for deficiency, but we show that it quickly showed enzymatic inhibition and no derivatization by DTNB plus-G3P.
The restitution of its structural integrity was observed in the mutant enzymes since at that concentration of substrate plus the Arg scavenger; the MGO did not penetrate the nucleus of the enzyme, did not promote the destabilisation of the active site and inhibited the generation of the ARGp adduct, or interaction with Cys and Lys residues to the core of the molecule, since the presence of protein cavities is related to flexibility and stability. The diffusion of small ligands through globular proteins is a global phenomenon, previously noted by [50], also evidenced in these mutant enzymes.
In this sense, the diffusion of molecules into the crystallographic structure of deamidated HsTPI was more significant [41]. It has been reported that hemi-phosphorylation of HsTPI on Ser20 in one of its subunits allows the formation of a channel that transports the substrate to the active site and functions as a switch, which enhances its catalysis, indicating that heterodimerization and subunit asymmetry are key features so that phosphorylation of Ser20 on HsTPI optionally potentialise its catalysis [51]. However, they have not proved their kinetic stability and structural changes induced by substrate, and they could show the same susceptibility for AGE formation in mutants described for human enzymatic deficiency. Therefore, we can expect that any TPI mutant, due to loss of stability and inclusion of MGO, can observe these changes vs the WT enzyme under the same conditions.
One of the most exciting questions is the reason for the proteic accumulation of deamidated HsTPI in breast cancer cells, as evidenced in [39], since greater proteolytic susceptibility was previously demonstrated in vitro in the recombinant deamidated enzyme [30], and one of the answers to its accumulation, maybe this NE/PTM exerted by MGO over Cys and Lys residues. Because N16D is less active, more porous, and with a greater volume of internal cavities, this facilitates the access of dicarbonyl adducts that interfere in their proteolytic turnover by the proteasome. A similar case was evidenced in the glycation of G6PDH, whose resistance to proteolysis was correlated with increased conformational stability promoted by adducts that were more resistant to proteolytic degradation (also observed in C217K mutant exposed to MGO, Figure S5) in glyoxal-treated fibroblast culture [52] as well as by the formation of adducts of Cys-MGO as a reversible hemithioacetal and stable mercapto-methylimidazole to its glycated enzyme [53].
In these mutants that initially showed WT-like enzyme activity, such as their instability causes a loss of catalysis and delayed cellular enzyme turnover, as well as generalised damage by substrate accumulation and transformation by MGO adduct formation that is increased by TPI enzymatic deficiency by core inclusion of AGEs. These covalent AGE modifications result in functional impairment and the formation of toxic protein inclusions [54], which are probably related to new moonlighting activities, as reported by [49], and the development of pathologic functions. This condition constitutes and leads to the development of CDD by the accumulation of MGO adducts that indirectly modify and significantly alter the intracellular redox system.
We understand the mechanism of the dynamic processes associated with the inactivation and turnover of TPI, which promote the reduction or loss of molecular function. We showed the role that specific TPI point mutations could play in developing chronic degenerative disease. This behaviour derived from the inefficient isomerization of substrates, accumulation, and increase of MGO by inhibition of isomerase activity or, finally, the acquisition of methylglyoxal synthase activity how, has been previously proposed in yeast TPI enzyme where a cut in the active site loop 6 converts the enzyme into a better methylglyoxal synthase [55].
It has been proposed that the best predictor of severity in TPI deficiency in various point mutations is caused by alterations that affect its structural conformation and folding without considering the role of catalytic ageing of this enzyme. However, this study provides elements that show distinctive signatures that should be considered when studying mutations related to this enzymatic deficiency. It displays catalysis-induced structural changes that differentially wear down the mutant enzymes over time.
Previous studies involved in the restitution of activity of TPI identified two compounds, resveratrol and itavastatin, that increase the levels of mutant TPI-E104D protein in a human cellular TPI model of deficiency and TPI deficiency patient cells. These compounds have properties as candidates for repurposing [56]. An increase in protein levels in a TPI deficiency TPIQ181P/E105D suggests that it could benefit not only patients with the common mutation but compound heterozygous patients [31], and resveratrol would represent an almost immediately applicable treatment for current TPI deficiency patients.
Although it is clear that NE/PTM is one of the likely mechanisms underlying the structural alteration of HsTIPI, glycation promotes misfolding, unfolding, inactivation, aggregation, and low proteic rechange. In this case, proteins containing reactive cysteines (prone to forming a thiolate anion at cellular pH) are vulnerable to alterations in the redox balance caused by ROS from alterations in nutritional status [59]. These PTMs can form aggregates due to excessive or chronic consumption of high-calorie foods that accumulate and transform in a proteotoxic cellular environment.
In the future, we intend to explore the determination of specific HsTPI residues involved in PTM development and aggregate formation using mass spectrometry. We foresee the need to enrich this study with other techniques for studying each human deficiency mutant. We propose the use of small-molecule supplements that enzymatically rescue and correct protein folding defects, which can act as scavengers of glycation by MGO and pharmacological chaperones that may reverse TPI deficiency in humans and too for the prevention and general treatment of people with chronic and degenerative diseases.
4. Materials and Methods
4.1. Expression and Purification
Expression and purification of recombinant enzymes were performed as previously reported [30].
4.2. Protein Concentration
Protein quantification in each purification step was performed using the bicinchoninic acid method, with bovine serum albumin (BSA) (BSA, Fraction V, EUROClone Ltd. U.K.; Cat.No. EMR086050) as standard. Protein concentrations of WT enzyme and its single mutants C217K, N16D, and E104D, was calculated using ε280 nm = 32595 M-1 ∙ cm-1, and for proteinase K (Sigma-Aldrich, CatNo. P2308-100MG) ε280 nm = 33380 M-1 ∙ cm-1.
4.3. Enzymatic Activity
From recombinant HsTPI-WT and mutant C217K, N16D and E104D enzymes with ≥95 % purity. The enzyme activity was determined by a coupled system involving the disappearance of NADH (MERCK, CatNo. N1161) at 340 nm [30]. The readings were carried out in a Cary 50 spectrophotometer (Varian, Cary 50) with 5, 3.3, 5, and 60 ng/mL of WT, C217K, E104D and -N16D enzymes, respectively.
4.3.1. Kinetic Constants of the Enzymes
For WT and the C217K mutant, Vmax and Km were obtained by fitting the initial velocity data (G3P concentrations from 0.02 to 4 mM) to the Michaelis-Menten equation (Vi = Vmax[S]/Km+[S]) for non-linear-regression-calculations. The data could not be fitted for the N16D mutant with no saturation at the highest substrate concentrations, and Vmax and Km values were not calculated. For -WT and -C217K, kcat values were derived from Vmax considering a monomer MM of 26682.43 Da. For the N16D mutant, kcat/Km ratios were obtained from the slope of the double reciprocal plots according to kcat/Km=1/m∙[enzyme] (where m represents Km/Vmax) and by the use of the previously indicated MM.
4.4. Native Electrophoresis (N-PAGE)
A method to estimate the structural stability of proteins is by preparing native gels that allow us to recognize through native electrophoresis (N-PAGE) the integrity of the quaternary structure of the protein, as well as the homogeneity between the mass-to-charge ratio present with respect to control. Its N-PAGE were carried out with Tris-Glycine pH 8.5 buffer. The running conditions of the samples containing 5-10 ug of proteins were 3 h at a constant 7 mAmp and subsequently stained with Coomassie Brillant Blue G [30].
4.5. Titration of Free Cysteines
It was carried out with ’Ellman's reagent; briefly, TPI enzymes (330 μg/mL) were added to the quartz cuvette in 100 mM Triethanolamine (TE) buffer (SIGMA Cat. .No.T1502-500G) at pH 7.4 at 25 °C; after addition of 4 mM of cysteine-derivatizing reagent 5,5′-Dithiobis(2-nitrobenzoic) acid (DTNB) (SIGMA, Cat No. D8130-5G) ε=13,600 M-1∙cm-1 at 412 nm and pH 8.0, Cys modification was determined by recording ΔAbs at 412 nm for each enzyme [58].
4.5.1. Susceptibility to Cysteine Derivatising Reagent after Substrate Incubation
Protein samples at 200 μg of protein were incubated for 54 h at 37 °C in TE buffer at pH 7.4 plus-G3P 1 mM in a recirculating bath (LAUDA, Brinkman Ecoline RE106). At the end of the incubations, the protein samples were derivatized with DTNB 4 mM. Therefore, the samples in 600 μL were exposed to 4 mM DTNB, and then readings of the ΔAbs at 412 nm due to TNB formation were recorded for 40 min. SDS 20% was added to denature the protein and expose the non-accessible Cys residues to the derivatising reagent. Readings were recorded at 25 °C in a Cary 50 spectrophotometer. The Abs at 412 nm of the blank containing only 4 mM DTNB was subtracted from each sample to obtain the net increase in Abs.
4.6. Circular Dichroism Spectroscopy (CD)
4.6.1. CD Far Ultra-Violet (CD-UV Far)
The CD spectra were analyzed to show changes in the secondary structure of the enzymes. Samples at 1 mg/mL of control and plus-G3P 1 mM were incubated for 24 h at 37 °C. Protein samples were pre-dialyzed in 25 mM NaH2PO4 buffer at pH 7.4 diluted to 0.1 mg/mL and analyzed using a 0.1 cm quartz cuvette at 25 °C. CD spectra were acquired using a JASCO J-810 spectropolarimeter (Jasco Inc., Easton, MD, USA). Spectra were recorded over the spectral range 260 − 190 nm, with data pitch 0.1 nm, continuous analysis mode, speed 20 nm/min., response 2 sec., bandwidth resolution of 1 nm, and accumulation of 3 samples to obtain CD spectra. The signal of CD spectra of the buffer was subtracted from each sample spectrum. The results were expressed as molar ellipticity (θ), which is defined as:
where the observed degrees (θobs) is the average ellipticity of the residues observed in degrees, (c) is the protein concentration in mg/mL, (MRW) is the average relative mass of the aminoacyl residues (106.72972 Da), and (l) is the path length expressed in cm. The CD spectra obtained were the averages of five scans. The spectra were smoothed through an internal algorithm in the Jasco software package, J-810 for Windows.
θ = θobs (MRW) (100) / lc
The online software BeStSel was used to estimate the content of secondary structure by deconvolution of the spectra obtained by the CD of each enzyme in the far UV (Beta Structure Selection) was carried out [59].
4.6.2. Thermal Stability
For the evaluation of protein thermal stability, protein unfolding was followed as the change in CD signal at 222 nm in a scan from 25 to 90 °C following the temperature increase of 24 °C/h. The unfolded protein fraction and mean denaturation temperature (Tm) values were calculated by recording its molar ellipticity at 222 nm. HsTPI at 100 μg/mL was previously dialysed for the experiments against NaH2PO4 25 mM buffer. From the data obtained, the apparent fraction of denatured subunits (FD) was calculated using the Boltzmann equation:
where: yN and yD are ellipticity values of the native and unfolded fractions, respectively. Both parameters were linear extrapolations of the initial and terminal portions of the curve as a function of increasing temperature.
FD = yN-y/yN-yD
4.7. Intrinsic Fluorescence Spectroscopy
Protein controls HsTPI-WT, C217K, and N16D at 1 mg/mL were previously dialysed in 100 mM TE buffer at pH 7.4 and incubated in a time course from 0, 2, 28, 48, 72, and 96 h at 37 °C, without G3P or MGO. Aliquots were removed each time, and the readings were analyzed at Dil. 1:20 in buffer TE. Each fluorescence intensity reading was obtained on a Perkin-Elmer LS-50 spectrofluorometer in a quartz cuvette with a 1:20 diluted sample (protein at 0.05 mg/mL) in 700 μL. The fluorescence signal of the buffer was subtracted from the protein spectra. Measurements were based on a triplicate of three individual protein preparations. Scans were recorded from 310-500 nm and λ exc. at 280 and 295 nm to obtain emission spectra. The conditions were using exc. and em. slits of 3.5 and scan speed 100 nm∙min−1.
The initial analysis of intrinsic fluorescence (IF) allowed us to determine the changes in maximum fluorescence intensity expressed in arbitrary units (IFmax, a.u.) of each sample of enzyme control. The wavelength emission (λ em.) of IFmax in nm (λ max) was calculated by selecting the point that exhibited the highest FI expressed in arbitrary units (a.u.), as well as spectral centre of masses (SCM) wavelength was calculated according to [60], where (λ) is the wavelength used, (I) are the intensities obtained at each wavelength. In the same form as controls, readings (0 and until 96 h) were performed that allowed the kinetic demonstration of the structural changes induced by both compounds over HsTPI-WT, C217K, and N16D enzymes exposed to G3P or MGO. The results of the fluorescence spectra were plotted (PC Software, Origin Professional).
4.7.1. Analysis of the Protein Formation of the Fluorescent Adduct of ARGp
4.7.1.1. Control Curves of the ARGp Adduct Formation
Based on the method reported by Shipanova et al. [61], control curves of ARGp formation were performed with Arg-MGO as a reference to ARGp formation (ARG-MGO; SIGMA, Cat. A5006-100G and M0252-25ML, respectively) or Arg-G3P (Arg-G3P; SIGMA, Cat. G5376-1G)—samples in an equimolar concentration of 20 mM of each reactant. Sample reads at Dil. 1:20 (G3P or MGO, 1 mM). The same form, C217K protein samples at 1 mg/mL dialysed vs TE buffer at pH 7.4, was incubated at 0 - 500 h at 37 °C with G3P or MGO at 20 mM.
4.7.2. Alterations of the Three-Dimensional Structure G3P or MGO Induced and Evidenced by Intrinsic Fluorescence
The same form as FI of controls was the determination of the structural effect exerted in time over enzymes incubated plus-G3P 2 mM or plus-MGO 1.
4.7.2.1. Kinetic of ARGp Fluorescent Adduct Formation in WT and Mutant Enzymes
Protein samples HsTPI-WT, and C217K and N16D mutants were G3P or MGO treated as in (6 point method above described), but incubated with 2 mM G3P or 1 mM MGO (2, 28, 48, 72 and 96 h) at 37 °C, and then analyzed by λ exc. at 325 nm to obtain λ em. scans at 340-600 nm. The IFmax ARGp λ em. at 395 nm evidenced the formation and increase in time of the fluorescent adduct of ARGp in the enzymes, and the concomitant loss of IFmax and shift of SCM in time course was observed in the treated samples vs their controls. Thus, the formation of ARGp was associated, as previously described [62], with the unfolding and alteration of the protein structure.
4.7.2.2. Extrinsic Fluorescence Assays
To determine the extrinsic fluorescence (EF) by hydrophobic patches exposed to the protein surface was evidenced with 8-Anilino-1-naphthalenesulfonic acid (ANSA) (SIGMA, Cat. No. A1028-100G) in the protein samples exposed at 2 mM G3P or 1 mM MGO (The samples were treated as point six described above). Only that, this was recorded at λ em. 400 to 600 nm with λ exc. 395 nm; the final concentrations of ANSA and HsTPI were 150 μM and 327 μg/mL, respectively, as previously reported [32], and from the λ em., the fluorescence signal at 485 nm was taken to plot the binding of ANSA to the protein over time.
4.8. Effect of Physiological Concentrations of MGO or G3P on HsTPI-WT Enzymes and the C217K and E104D Mutant
Experiments were performed with 15 μg enzyme samples incubated at 1 mg/mL with different concentrations of MGO or G3P, from 0, 10, 50,100, 250, 500, 750, until 1000 and 2000 μM. To determine the effect of the addition of MGO scavenger for protein samples at the highest concentration of G3P or MGO (were added iso stoichiometrically Arg at 1000 μM or 2000 μM, respectively). Arg was used to prevent protein glycation with an MGO scavenger. Samples were incubated in TE buffer for 24 and 48 h at 37 °C in a recirculating bath (LAUDA Brinkmann, EcoLine RE106). In the end, residual TPI activity was determined. Native-PAGE (N-PAGE) was simultaneously performed to observe the charge of quaternary structure and structural instability due to alterations in protein.
4.8.1. On enzyme Activity
The residual activity of HsTPI-WT, and mutant C217K and E104D enzymes was determined at each incubation time to observe enzymatic inhibition within the intracellular range of normal concentrations of G3P or MGO explored in the enzymes. To determine residual enzyme activities, 1 mM of G3P substrate was added to the coupled reaction.
4.8.2. Enzyme Stability and Migration Pattern in Native and SDS-PAGE of Glycated TPIs
After incubation of HsTPI-WT, C217K and E104D by 24 or 48 h at 37 °C, N-PAGEs were run for 3 h at 7 mA.; in Tris buffer 13 mM (Tris, MP Biomedicals, Cat. No. SKU:02103133.1) and 96 mM Glycine (J.T. Baker, Cat. No. 4057-02), at pH 8.5 to show changes of quaternary structure or charge, unfolding and aggregation by the effect of G3P or MGO were performed with 5-10 μg of protein per lane. Electrophoresis were carried out in an electrophoretic chamber (Hoeffer SE250 Mighty Small II Mini Vertical Electrophoresis Unit) with 0.75 mm thick gels to determine the effect on the structural integrity of the enzymes vs their control without G3P or MGO vs treatments.
4.9. Western Blot of the Enzymes Exposed to MGO and G3P
The extensive alterations in C217K, N-PAGE, and SDS-PAGE were carried out to show the structural alteration and instability due to adduct formation. Protein samples of C217K mutant previously incubated plus-G3P or plus-MGO (20 mM) by 500 h at 37 °C samples were loaded 5 μg/lane in N-PAGE to appreciate the alteration due to adducts formation and modifications over quaternary structure, and 10 μg/lane in SDS-PAGE at 12% to evidenced aggregates originated by G3P or MGO incubations by 500 h in C217K enzyme.
Protein samples of this enzyme C217K incubated MGO or G3P (20 mM) were revealed, and the presence of ARGp adduct was evidenced by Western blot vs anti-MGO and anti-HsTPI. Briefly, 1.5 μg of protein treated was loaded per lane on SDS-PAGE 12%, and lane 1 included prestained relative mass standards (MWM) (BioRad Kaleidoscope™ Prestained Protein Standards #1610375). Electrophoresis was carried out for ½ h to 90 V and 65 min. at 185 V.
Electrophoretic SDS-PAGE gel, as well as PVDF membranes (Amersham™ Western blotting membrane Hybond®P, PVDF 0.22 μm, Cat. No. GE10600021), were embedded in absolute methanol (J.T. Baker grade HPLC, CatNo. 9093-03) and equilibrated in transfer buffer Trizma-base 24 mM, (SIGMA, Cat. No. T1503-500G); 192 mM Glycine (MP, Cat. No. 194825); 0.1 % SDS (SIGMA Cat.No. L4390-500G) and 20% Methanol at pH 8.3 for 15 min, of shaking. The PVDF membrane was transferred for 1 h at 20 V. in a horizontal transfer chamber (BIO-RAD, Trans-Blot® SD Semi-Dry Electrophoretic Transfer Cell Cat.No. 170-3940).
After transfer, the membranes were blocked with TBS-Tween-20 buffer (TBS-T) + 8% BSA at pH 7.6, in constant shaking for 1 h at room temperature. TBS-T buffer (10 mM Trizma-Base; 150 mM NaCl (VWR Cat.No. 0241-2.5KG); 0.1% Tween 20) was used to perform 2 washes, each for 10 min.
The membranes were incubated in TBS-T (0.1 %) + BSA 1% overnight at 4 °C and shaken (10 mL) with 1st Ac anti-methylglyoxal (α-MGO) (ABCAM, [9F11] ab243074) at Dil. 1:1000; or 1st Ab anti-HsTPI (α-HsTPI) 1:1000 (SantaCruz H11, Cat.No. sc-166785 HRP). After incubation, 3 washes were given in TBS-T for 10 min at room temperature.
Subsequently, 2nd Ab, peroxidase-bound anti-mouse IgG (Cell Signaling HRP-linked, Cat.No. 7076s) was added in TBS-T at 1:3000 + BSA 1% for 1 h at room temperature and shaked; subsequently, three washes of TBS-T for 10 min each. Detection of target proteins was carried out with luminol Santacruz Biotec (ImmunoCruz Western Blotting Luminol Reagent, Cat.No. sc-2048; Santacruz Biotechnology, Inc.) in a transilluminator (Bio-Rad, ChemiDoc XRS+ Gel Imaging System).
4.10. Refractory Proteolysis in C217K Glycated by MGO
Limited proteolysis of AGEs-modified C217K enzyme vs WT HsTPI and C217K enzymes without exposure to MGO but incubated by 500 h were proteolyzed vs Proteinase K. The proteolytic susceptibility of C217K without or plus-MGO was determined to evidence the higher MM species as aggregates that could be refractory to proteolysis; therefore, the samples WT, C217K. Briefly, the proteolysis kinetics in mol.-mol. ratio, 1:0.265, at 1 mg/mL vs Proteinase K, respectively, with controls WT, and C217K and C217K plus-MGO were incubated in Proteinase K (SIGMA-Aldrich Cat.No. P2308-1G) to carry out kinetic proteolysis in enzymes incubates since (0, 30, 65, 130 180, 210, 240, 270 and 300 min.) in a recirculation batch at 30 °C. The reactions of proteolytic digestions were arrested with 5 mM Phenylmethylsulfonyl fluoride (PMSF, SIGMA, Cat.No. 78830-5G). After the stop de reactions of digestion, the residual activity of controls and proteolyzed HsTPI was obtained for both enzymes according to Section 4.3. The samples were loaded in a 16 % SDS-PAGE previously added 0.4 M DTT and boiled for five min. The method was previously described in [30].
Supplementary Materials
The following supporting information can be downloaded at: www.mdpi.com/xxx/s1. Table S1. Table of Circular Dichroism spectra deconvolution data. Table S2. Table of intrinsic fluorescence parameters of HsTPI-WT, C217K, N16D, and E104D mutants. Figure S1. Standard curve of fluorescent ARGp adduct formation. Figure S2. Kinetics of ARGp adduct formation in HsTPI-C217K. Figure S3. Analysis of structural effects exerted by G3P on TPIs. Figure S4. Analysis of structural effect exerted by MGO on TPIs. Figure S5. Refractory proteolysis in C217K glycated by MGO.
Author Contributions
Conceptualization, I.M.-M., G.H.-A., S.E-F.; methodology, I.M.-M., G.H.-A., I.G-T., G.L.-V., L.A.F.-L., and S.G.-M.; software, S.E.-F.; validation, I.M.-M., and L.A.F.L.; formal analysis, I.M.-M., and S.E.-F; investigation, I.M.-M., S.E.-F., G.H.-A.; resources, S.E.-F., L.A.F.-L.; original draft preparation, I.M.-M.; writing—review and editing, I.M.-M., S.E.-F., G.L.-V., I.G-T., S.G.-M., and L.A.F.-L.; visualization, L.A.F.-L., G.H.-A., and (S.G.-M.); supervision, I.M.-M, and S.E.-F.; project administration, I.M.-M.; funding acquisition, S.E.-F and L.A.F.-L.
Funding
This work was funded by the Program: Recursos Fiscales para la Investigación del Instituto Nacional de Pediatría, 2019/072 and Ciencia de Frontera 2023, CONAHCYT CF-2023-1-811 (S.E.-F.); and 2020/016 (L.A.F.-L.).
Institutional Review Board Statement
Not applicable.
Informed Consent Statement
Not applicable.
Data Availability Statement
Not applicable.
Conflicts of Interest
The authors declare no conflict of interest.
References
- Di Renzo, L.; Gualtieri. P.; De Lorenzo, A. Diet, Nutrition and Chronic Degenerative Diseases. Nutrients. 2021 Apr 20;13(4):1372. [CrossRef]
- Saklayen M.G. The Global Epidemic of the Metabolic Syndrome. Curr Hypertens Rep. 2018 Feb 26;20(2):12. [CrossRef]
- Hipkiss, A.R. On the Relationship between Energy Metabolism, Proteostasis, Aging and Parkinson's Disease: Possible Causative Role of Methylglyoxal and Alleviative Potential of Carnosine. Aging Dis. 2017 May 2;8(3):334-345. [CrossRef]
- Gnerer, J.P.; Kreber, R.A.; Ganetzky, B. wasted away, a Drosophila mutation in triosephosphate isomerase, causes paralysis, neurodegeneration, and early death. Proc Natl Acad Sci U S A. 2006 Oct 10;103(41):14987-93. [CrossRef]
- Chaplen, F.W. Incidence and potential implications of the toxic metabolite methylglyoxal in cell culture: A review. Cytotechnol. 1998 May;26(3):173-83. [CrossRef]
- Rabbani, N.; Thornalley, P.J. Methylglyoxal, glyoxalase 1 and the dicarbonyl proteome. Amino Acids. 2012 Apr;42(4):1133-42. [CrossRef]
- Suji, G.; Sivakami, S. DNA damage during glycation of lysine by methylglyoxal: assessment of vitamins in preventing damage. Amino Acids. 2007 Nov;33(4):615-21. [CrossRef]
- Shah, S.A.; Sujib. G.; Bhorc, V.M.; Alia, A.; and Sivakami, S. Methylglyoxal Binding to Bovine Liver Catalase Results in Loss of Activity and Heme Dislocation. Trends Pept. Prot. Sci.; 4 2019: e5.
- Kold-Christensen, R.; Johannsen, M. Methylglyoxal Metabolism and Aging-Related Disease: Moving from Correlation toward Causation. Trends Endocrinol Metab. 2020 Feb;31(2):81-92. [CrossRef]
- Alfarouk, K.O.; Alqahtani, S.S.; Alshahrani, S.; Morgenstern, J.; Supuran, C.T.; Reshkin, S.J. The possible role of methylglyoxal metabolism in cancer. J Enzyme Inhib Med Chem. 2021 Dec;36(1):2010-2015. [CrossRef]
- Leone, A.; Nigro, C.; Nicolò, A.; Prevenzano, I.; Formisano, P.; Beguinot, F.; Miele, C. The Dual-Role of Methylglyoxal in Tumor Progression - Novel Therapeutic Approaches. Front Oncol. 2021 Mar 22;11:645686. [CrossRef]
- Xu, D.; Shao, F.; Bian, X.; Meng, Y.; Liang, T.; Lu, Z. The Evolving Landscape of Noncanonical Functions of Metabolic Enzymes in Cancer and Other Pathologies. Cell Metab. 2021 Jan 5;33(1):33-50. [CrossRef]
- Dornadula, S.; Elango, B.; Balashanmugam, P.; Palanisamy, R.; Kunka Mohanram, R. Pathophysiological insights of methylglyoxal induced type-2 diabetes. Chem Res Toxicol. 2015 Sep 21;28(9):1666-74. [CrossRef]
- Gupta, R.; Kumar, P.; Computational Analysis Indicates That PARP1 Acts as a Histone Deacetylases Interactor Sharing Common Lysine Residues for Acetylation, Ubiquitination, and SUMOylation in Alzheimer's and Parkinson's Disease. ACS Omega. 2021 Feb 19;6(8):5739-5753. [CrossRef]
- Wesseling, H.; Mair, W.; Kumar, M.; Schlaffner, C.N.; Tang, S.; Beerepoot, P.; Fatou, B.; Guise, A.J.; Cheng, L.; Takeda, S.; Muntel, J.; Rotunno, M.S.; Dujardin, S.; Davies, P.; Kosik, K.S.; Miller, B.L.; Berretta, S.; Hedreen, J.C.; Grinberg, L.T.; Seeley, W.W.; Hyman, B.T.; Steen, H.; Steen, J.A. Tau PTM Profiles Identify Patient Heterogeneity and Stages of Alzheimer's Disease. Cell. 2020 Dec 10;183(6):1699-1713.e13. [CrossRef]
- Barnaby, O.S.; Cerny, R.L.; Clarke, W.; Hage, D.S. Comparison of modification sites formed on human serum albumin at various stages of glycation. Clin Chim Acta. 2011 Jan 30;412(3-4):277-85. [CrossRef]
- Qiu, H.Y.; Hou, N.N.; Shi, J.F.; Liu, Y.P.; Kan, C.X.; Han, F.; Sun, X.D. Comprehensive overview of human serum albumin glycation in diabetes mellitus. World J Diabetes. 2021 Jul 15;12(7):1057-1069. [CrossRef]
- Guo, W.; Zhou, Q.; Jia, Y.; Xu, J. Increased Levels of Glycated Hemoglobin A1c and Iron Deficiency Anemia: A Review. Med Sci Monit. 2019 Nov 7;25:8371-8378. [CrossRef]
- Sakamoto, H.; Mashima, T.; Yamamoto, K.; Tsuruo, T. Modulation of heat-shock protein 27 (Hsp27) anti-apoptotic activity by methylglyoxal modification. J Biol Chem. 2002 Nov 29;277(48):45770-5. [CrossRef]
- Barinova, K.V.; Serebryakova, M.V.; Melnikova, A.K.; Medvedeva, M.V.; Muronetz, V.I.; Schmalhausen, E.V. Mechanism of inactivation of glyceraldehyde-3-phosphate dehydrogenase in the presence of methylglyoxal. Arch Biochem Biophys. 2023 Jan 1;733:109485. [CrossRef]
- Uceda, A.B.; Frau, J.; Vilanova, B.; Adrover, M. Glycation of α-synuclein hampers its binding to synaptic-like vesicles and its driving effect on their fusion. Cell Mol Life Sci. 2022;79(6):342. [CrossRef]
- Rodríguez-Bolaños, M.; Perez-Montfort, R. Medical and Veterinary Importance of the Moonlighting Functions of Triosephosphate Isomerase. Curr Protein Pept Sci. 2019;20(4):304-315. [CrossRef]
- Guix, F. X.; Ill-Raga, G.; Bravo, R.; Nakaya, T.; de Fabritiis, G.; Coma, M.; Miscione, G.P.; Villà-Freixa, J.; Suzuki, T.; Fernàndez-Busquets, X.; Valverde, M.A.; de Strooper, B.; Muñoz, F.J. Amyloid-dependent triosephosphate isomerase nitrotyrosination induces glycation and tau fibrillation. Brain. 2009;132(Pt 5):1335-1345. [CrossRef]
- Bourgognon, J.M.; Spiers, J.G.; Robinson, S.W.; Scheiblich, H.; Glynn, P.; Ortori, C.; Bradley, S.J.; Tobin, A.B.; Steinert, J.R. Inhibition of neuroinflammatory nitric oxide signaling suppresses glycation and prevents neuronal dysfunction in mouse prion disease. Proc Natl Acad Sci U S A. 2021 Mar 9;118(10):e2009579118. [CrossRef]
- Rabbani, N.; Thornalley, P.J. Dicarbonyl stress in cell and tissue dysfunction contributing to ageing and disease. Biochem Biophys Res Commun. 2015;458(2):221-226. [CrossRef]
- Abdelkader, H.; Mustafa, W.W.; Alqahtani, A.M.; Alsharani, S.; Al Fatease, A.; Alany, R.G. Glycation-induced age-related illnesses, antiglycation and drug delivery strategies. J Pharm Pharmacol. 2022 Nov 4;74(11):1546-1567. [CrossRef]
- Gomes, R.A.; Sousa Silva, M.; Vicente Miranda, H.; Ferreira, A.E.; Cordeiro, C.A.; Freire, A.P. Protein glycation in Saccharomyces cerevisiae. Argpyrimidine formation and methylglyoxal catabolism. FEBS J. 2005;272(17):4521-4531. [CrossRef]
- Perrone, A.; Giovino, A.; Benny, J.; Martinelli, F. Advanced Glycation End Products (AGEs): Biochemistry, Signaling, Analytical Methods, and Epigenetic Effects. Oxid Med Cell Longev. 2020 Mar 18;2020:3818196. [CrossRef]
- Allaman, I.; Bélanger, M.; Magistretti, P.J. Methylglyoxal, the dark side of glycolysis. Front Neurosci. 2015;9:23. [CrossRef]
- de la Mora-de la Mora, I.; Torres-Larios, A.; Enríquez-Flores, S.; Méndez, S.T.; Castillo-Villanueva, A.; Gómez-Manzo, S.; López-Velázquez, G.; Marcial-Quino, J.; Torres-Arroyo, A.; García-Torres, I.; Reyes-Vivas, H.; Oria-Hernández, J. Structural effects of protein aging: terminal marking by deamidation in human triosephosphate isomerase. PLoS One. 2015 Apr 17;10(4):e0123379. [CrossRef]
- VanDemark, A.P.; Hrizo, S.L.; Eicher, S.L.; Kowalski, J.; Myers, T.D.; Pfeifer, M.R.; Riley, K.N.; Koeberl, D.D.; Palladino, M.J. Itavastatin and resveratrol increase triosephosphate isomerase protein in a newly identified variant of TPI deficiency. Dis Model Mech. 2022 May 1;15(5):dmm049261. [CrossRef]
- De La Mora-De La Mora, I.; Torres-Larios, A.; Mendoza-Hernández, G.; Enriquez-Flores, S.; Castillo-Villanueva, A.; Mendez, S.T.; Garcia-Torres, I.; Torres-Arroyo, A.; Gómez-Manzo, S.; Marcial-Quino, J.; Oria-Hernández, J.; López-Velázquez, G.; Reyes-Vivas, H. The E104D mutation increases the susceptibility of human triosephosphate isomerase to proteolysis. Asymmetric cleavage of the two monomers of the homodimeric enzyme. Biochim Biophys Acta. 2013 Dec;1834(12):2702-11. [CrossRef]
- Farzadfard, A.; König, A.; Petersen, S.V.; Nielsen, J.; Vasili, E.; Dominguez-Meijide, A.; Buell, A.K.; Outeiro, T.F.; Otzen, D.E. Glycation modulates alpha-synuclein fibrillization kinetics: A sweet spot for inhibition. J Biol Chem. 2022 May;298(5):101848. [CrossRef]
- Donnellan, L.; Young, C.; Simpson, B.S.; Acland, M.; Dhillon, V.S.; Costabile, M.; Fenech, M.; Hoffmann, P.; Deo, P. Proteomic Analysis of Methylglyoxal Modifications Reveals Susceptibility of Glycolytic Enzymes to Dicarbonyl Stress. Int J Mol Sci. 2022 Mar 28;23(7):3689. [CrossRef]
- Pereira Morais, M.P.; Marshall, D.; Flower, S.E.; Caunt, C.J.; James, T.D.; Williams, R.J.; Waterfield, N.R.; van den Elsen, J.M. Analysis of protein glycation using fluorescent phenylboronate gel electrophoresis. Sci Rep. 2013;3:1437. [CrossRef]
- Oliver, C.; Timson, D.J. In silico prediction of the effects of mutations in the human triose phosphate isomerase gene: Towards a predictive framework for TPI deficiency. Eur J Med Genet. 2017 Jun;60(6):289-298. [CrossRef]
- Tajes, M.; Guivernau, B.; Ramos-Fernández, E.; Bosch-Morató, M.; Palomer, E.; Guix, F.X.; Muñoz, F.J. The pathophysiology of triose phosphate isomerase dysfunction in Alzheimer's disease. Histol Histopathol. 2013 Jan;28(1):43-51. [CrossRef]
- Ahmed, A.; Shamsi, A.; Khan, M.S.; Husain, F.M.; Bano, B. Methylglyoxal induced glycation and aggregation of human serum albumin: Biochemical and biophysical approach. Int J Biol Macromol. 2018;113:269-276. [CrossRef]
- Enríquez-Flores, S.; Flores-López, L.A.; De la Mora-De la Mora, I.; García-Torres, I.; Gracia-Mora, I.; Gutiérrez-Castrellón, P.; Fernández-Lainez, C.; Martínez-Pérez, Y.; Olaya-Vargas, A.; de Vos, P.; López-Velázquez, G. Naturally occurring deamidated triosephosphate isomerase is a promising target for cell-selective therapy in cancer. Sci Rep. 2022 Mar 7;12(1):4028. [CrossRef]
- Vaupel, P.; Multhoff, G. Revisiting the Warburg effect: historical dogma versus current understanding. J Physiol. 2021 Mar;599(6):1745-1757. [CrossRef]
- Enríquez-Flores, S.; Flores-López, L.A.; García-Torres, I.; de la Mora-de la Mora, I.; Cabrera, N.; Gutiérrez-Castrellón, P.; Martínez-Pérez, Y.; López-Velázquez, G. Deamidated Human Triosephosphate Isomerase is a Promising Druggable Target. Biomolecules. 2020 Jul 15;10(7):1050. [CrossRef]
- Olivares-Illana, V.; Riveros-Rosas, H.; Cabrera, N.; Tuena de Gómez-Puyou, M.; Pérez-Montfort, R.; Costas, M.; Gómez-Puyou A. A guide to the effects of a large portion of the residues of triosephosphate isomerase on catalysis, stability, druggability, and human disease. Proteins. 2017 Jul;85(7):1190-1211. [CrossRef]
- Romero, J.M.; Carrizo, M.E.; Curtino, J.A. Characterization of human triosephosphate isomerase S-nitrosylation. Nitric Oxide. 2018 Jul 1;77:26-34. [CrossRef]
- Hernández-Alcántara, G.; Torres-Larios, A.; Enríquez-Flores, S.; García-Torres, I.; Castillo-Villanueva, A.; Méndez S.T.; de la Mora-de la Mora, I.; Gómez-Manzo, S.; Torres-Arroyo, A.; López-Velázquez, G.; Reyes-Vivas, H.; Oria-Hernández J. Structural and functional perturbation of Giardia lamblia triosephosphate isomerase by modification of a non-catalytic, non-conserved region. PLoS One. 2013 Jul 22;8(7):e69031. [CrossRef]
- Cabrera, N.; Torres-Larios, A.; García-Torres, I.; Enríquez-Flores, S.; Perez-Montfort, R. Differential effects on enzyme stability and kinetic parameters of mutants related to human triosephosphate isomerase deficiency. Biochim Biophys Acta Gen Subj. 2018 Jun;1862(6):1401-1409. [CrossRef]
- Rodríguez-Almazán, C.; Arreola, R.; Rodríguez-Larrea, D.; Aguirre-López, B.; de Gómez-Puyou, M.T.; Pérez-Montfort, R.; Costas, M.; Gómez-Puyou, A.; Torres-Larios, A. Structural basis of human triosephosphate isomerase deficiency: mutation E104D is related to alterations of a conserved water network at the dimer interface. J Biol Chem. 2008 Aug 22;283(34):23254-63. [CrossRef]
- Ralser, M.; Heeren, G.; Breitenbach, M.; Lehrach, H.; Krobitsch, S. Triose phosphate isomerase deficiency is caused by altered dimerization--not catalytic inactivity--of the mutant enzymes. PLoS One. 2006 Dec 20;1(1):e30. [CrossRef]
- Kim, J.; Kim, N.H.; Sohn, E.; Kim, C.S.; Kim, J.S. Methylglyoxal induces cellular damage by increasing argpyrimidine accumulation and oxidative DNA damage in human lens epithelial cells. Biochem Biophys Res Commun. 2010 Jan 1;391(1):346-51. [CrossRef]
- Myers, T.D.; Palladino, M.J. Newly discovered roles of triosephosphate isomerase including functions within the nucleus. Mol Med. 2023 Jan 31;29(1):18. [CrossRef]
- Brunori, M. Structural dynamics of myoglobin. Biophys Chem. 2000;86(2-3):221-230. [CrossRef]
- Schachner, L.F.; Soye, B.D.; Ro, S.; Kenney, G.E.; Ives, A.N.; Su, T.; Goo, Y.A.; Jewett, M.C.; Rosenzweig, A.C.; Kelleher, N.L. Revving an Engine of Human Metabolism: Activity Enhancement of Triosephosphate Isomerase via Hemi-Phosphorylation. ACS Chem Biol. 2022 Oct 21;17(10):2769-2780. [CrossRef]
- Bulteau, A.L.; Verbeke, P.; Petropoulos, I.; Chaffotte, A.F.; Friguet, B. Proteasome inhibition in glyoxal-treated fibroblasts and resistance of glycated glucose-6-phosphate dehydrogenase to 20 S proteasome degradation in vitro. J Biol Chem. 2001 Dec 7;276(49):45662-8. [CrossRef]
- Coukos, J.S.; Lee, C.W.; Pillai, K.S.; Liu, K.J.; Moellering, R.E. Widespread, Reversible Cysteine Modification by Methylglyoxal Regulates Metabolic Enzyme Function. ACS Chem Biol. 2023 Jan 20;18(1):91-101. [CrossRef]
- Sakai-Sakasai, A.; Takeda, K.; Suzuki, H.; Takeuchi, M. Structures of Toxic Advanced Glycation End-Products Derived from Glyceraldehyde, A Sugar Metabolite. Biomolecules. 2024 Feb 8;14(2):202. [CrossRef]
- Sun, A.Q.; Yüksel, K.U.; Gracy, R.W. Limited proteolysis of triose-phosphate isomerase and characterization of the catalytically active peptide complex. J Biol Chem. 1993;268(36):26872-26878.
- Vogt, A.; Eicher. S.L.; Myers, T.D.; Hrizo, S.L.; Vollmer, L.L.; Meyer, E.M.; Palladino, M.J. A High-Content Screening Assay for Small Molecules That Stabilize Mutant Triose Phosphate Isomerase (TPI) as Treatments for TPI Deficiency. SLAS Discov. 2021 Sep;26(8):1029-1039. [CrossRef]
- Ford, A.E.; Denicourt, C.; Morano, K.A. Thiol stress-dependent aggregation of the glycolytic enzyme triose phosphate isomerase in yeast and human cells. Mol Biol Cell. 2019 Mar 1;30(5):554-565. [CrossRef]
- Ellman, G.; Lysko, H. A precise method for the determination of whole blood and plasma sulfhydryl groups. Anal Biochem. 1979 Feb;93(1):98-102.
- Micsonai, A.; Moussong, É.; Wien, F.; Boros, E.; Vadászi, H.; Murvai, N.; Lee, Y.H.; Molnár, T.; Réfrégiers, M.; Goto, Y.; Tantos, Á.; Kardos, J. BeStSel: webserver for secondary structure and fold prediction for protein CD spectroscopy. Nucleic Acids Res. 2022 Jul 5;50(W1):W90-W98. [CrossRef]
- Hernández-Alcántara, G.; Rodríguez-Romero, A.; Reyes-Vivas, H.; Peon, J.; Cabrera, N.; Ortiz, C.; Enríquez-Flores, S.; De la Mora-De la Mora, I.; López-Velázquez, G. Unraveling the mechanisms of tryptophan fluorescence quenching in the triosephosphate isomerase from Giardia lamblia. Biochim Biophys Acta. 2008 Nov;1784(11):1493-500. [CrossRef]
- Shipanova, I.N.; Glomb, M.A.; Nagaraj, R.H. Protein modification by methylglyoxal: chemical nature and synthetic mechanism of a major fluorescent adduct. Arch Biochem Biophys. 1997 Aug 1;344(1):29-36. [CrossRef]
- Perween, S.; Abidi, M.; Faiz Faizy, A. Moinuddin. Biophysical changes in methylglyoxal modified fibrinogen and its role in the immunopathology of type 2 diabetes mellitus. Int J Biol Macromol. 2022 Mar 31;202:199-214. [CrossRef]
Figure 1.
Permeability by derivatization of free Cys in WT-HsTPI, C217K, N16D, and E104D mu-tants under native conditions (A), and the quantification of derivatized Cys (B). The samples containing 200 µg of protein were incubated for 54 h at 37 °C in TE buffer at pH 7.4 plus-G3P 1 mM. These samples were exposed to DTNB 4 mM, and the absorbance was monitored at 412 nm for 60 min. after SDS was added by complete denatured. Asterisks show the addition of SDS 10 %. HsTPI-WT (black squares). E104D mutant (green diamonds). C217K mutant (red circles). N16D mutant (blue triangles). These results were representative of qualitatively identical duplicate experiments.
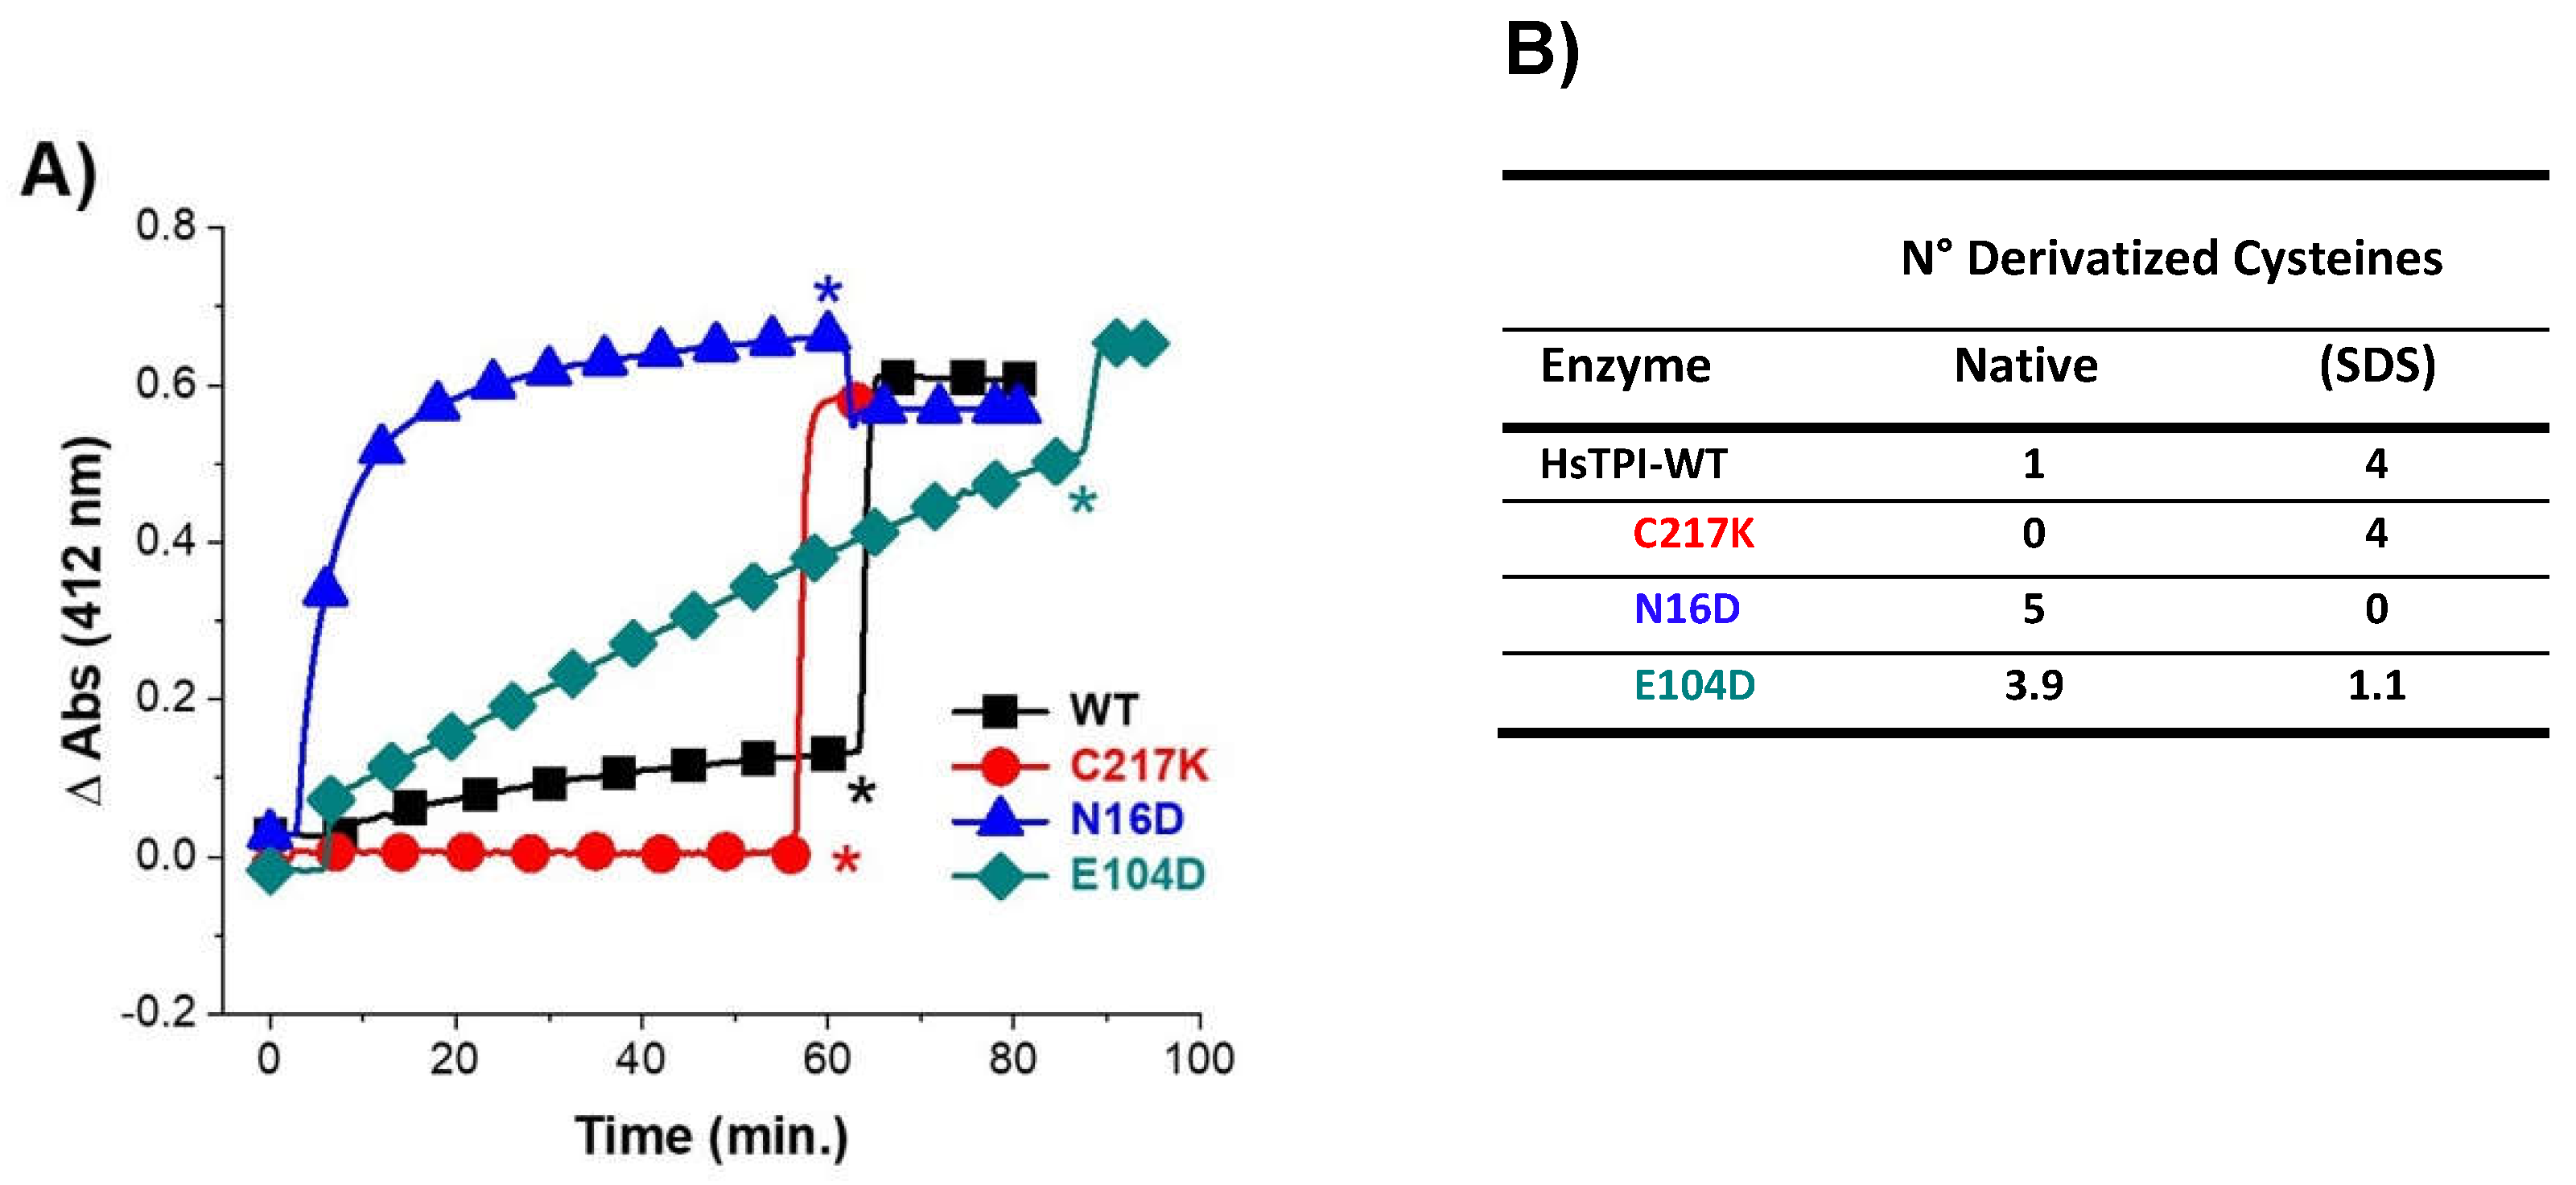
Figure 2.
Enzyme catalysis induces differential electrophoretic mobility patterns. Enzyme samples were incubated for 48 h at 37 °C without or plus-G3P 1 mM. Lanes 1-2 show the differences between WT enzymes without and with-G3P, respectively (black). Lanes 3-4 show C217K mutant (red). Lanes 5-6 N16D mutant (blue). Lanes 7-8 E104D mutant (green). 10 µg protein/lane, (*) plus-G3P were loaded. The N-PAGE is representative of is representative of three independent experiments.
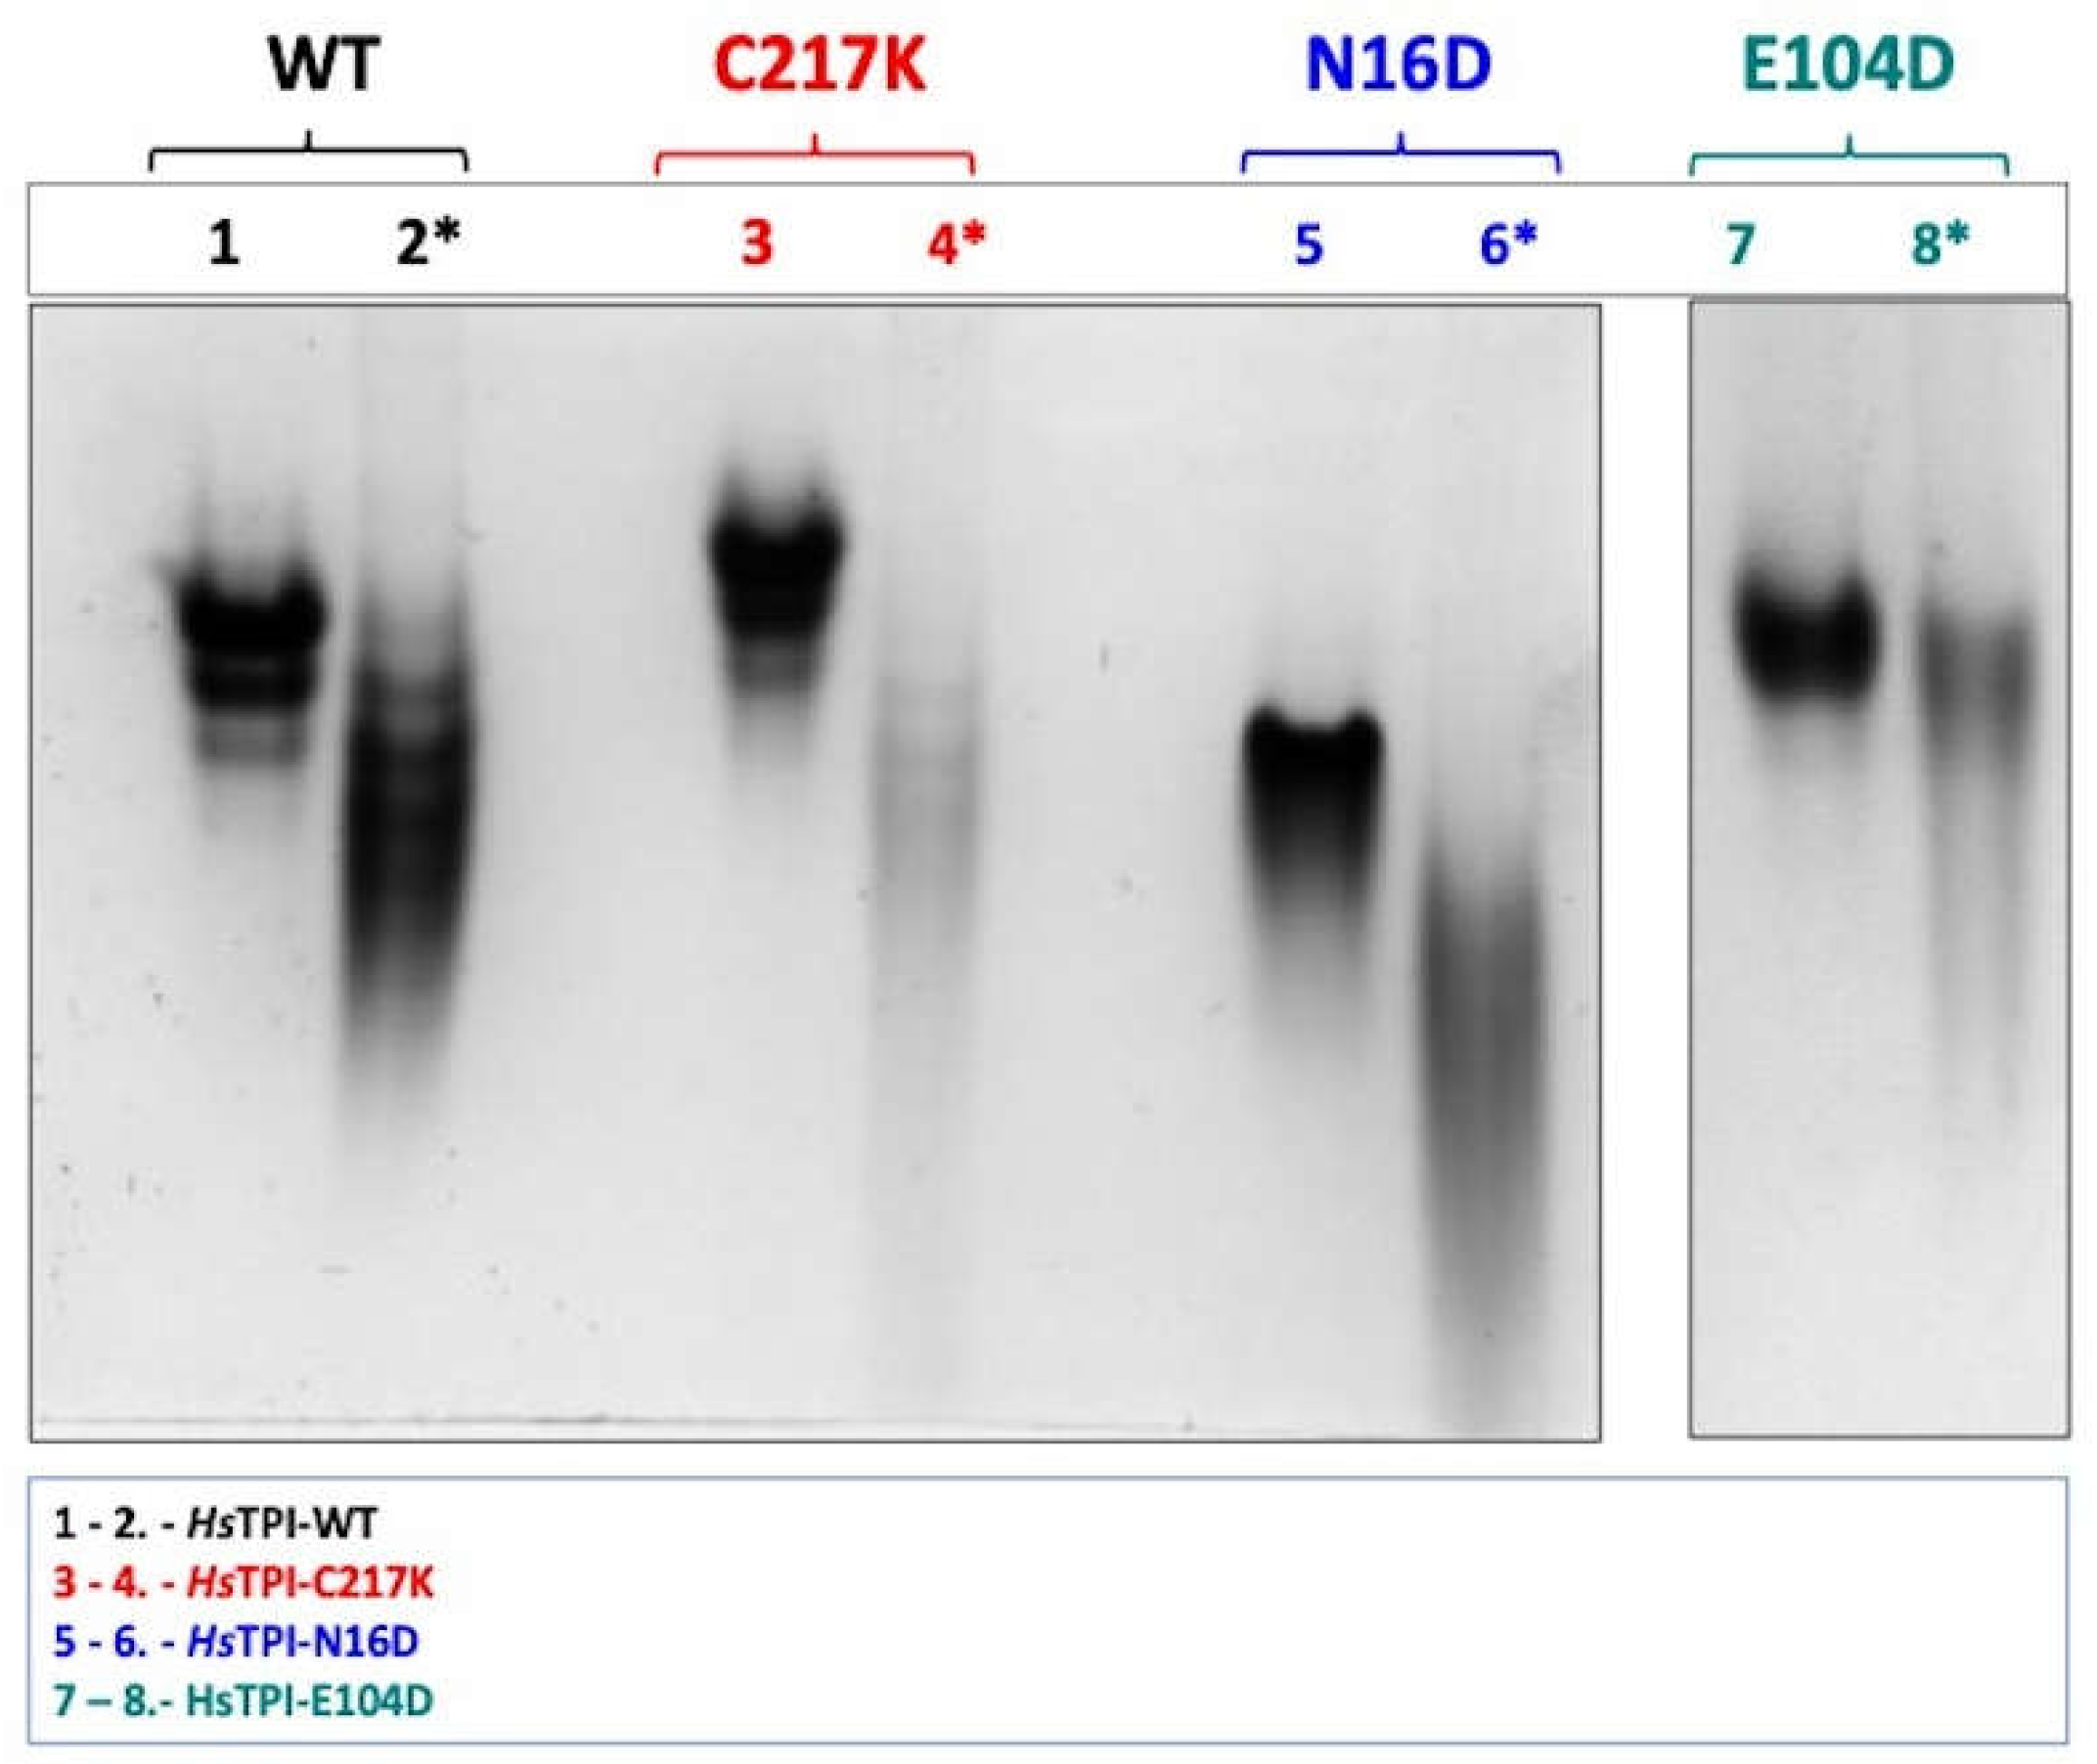
Figure 3.
Differential derivatization of Cys residues in HsTPI-WT, C217K, N16D, and E104D in the presence of G3P. After incubation of (A) WT (black squares), (B) C217K (red circles), (C) N16D (blue triangles), and (D) E104D (green diamonds), the access to Cys residues by DTNB was monitored. The enzymes G3P free samples are shown as open figures (controls). The filled figures are enzymes previously incubated for 56 h at 37 °C with G3P 1 mM. After 40-50 min. with DTNB 4 mM was added SDS. The absorbance of blank plus G3P was subtracted from each sample. Experiments were performed in triplicate.
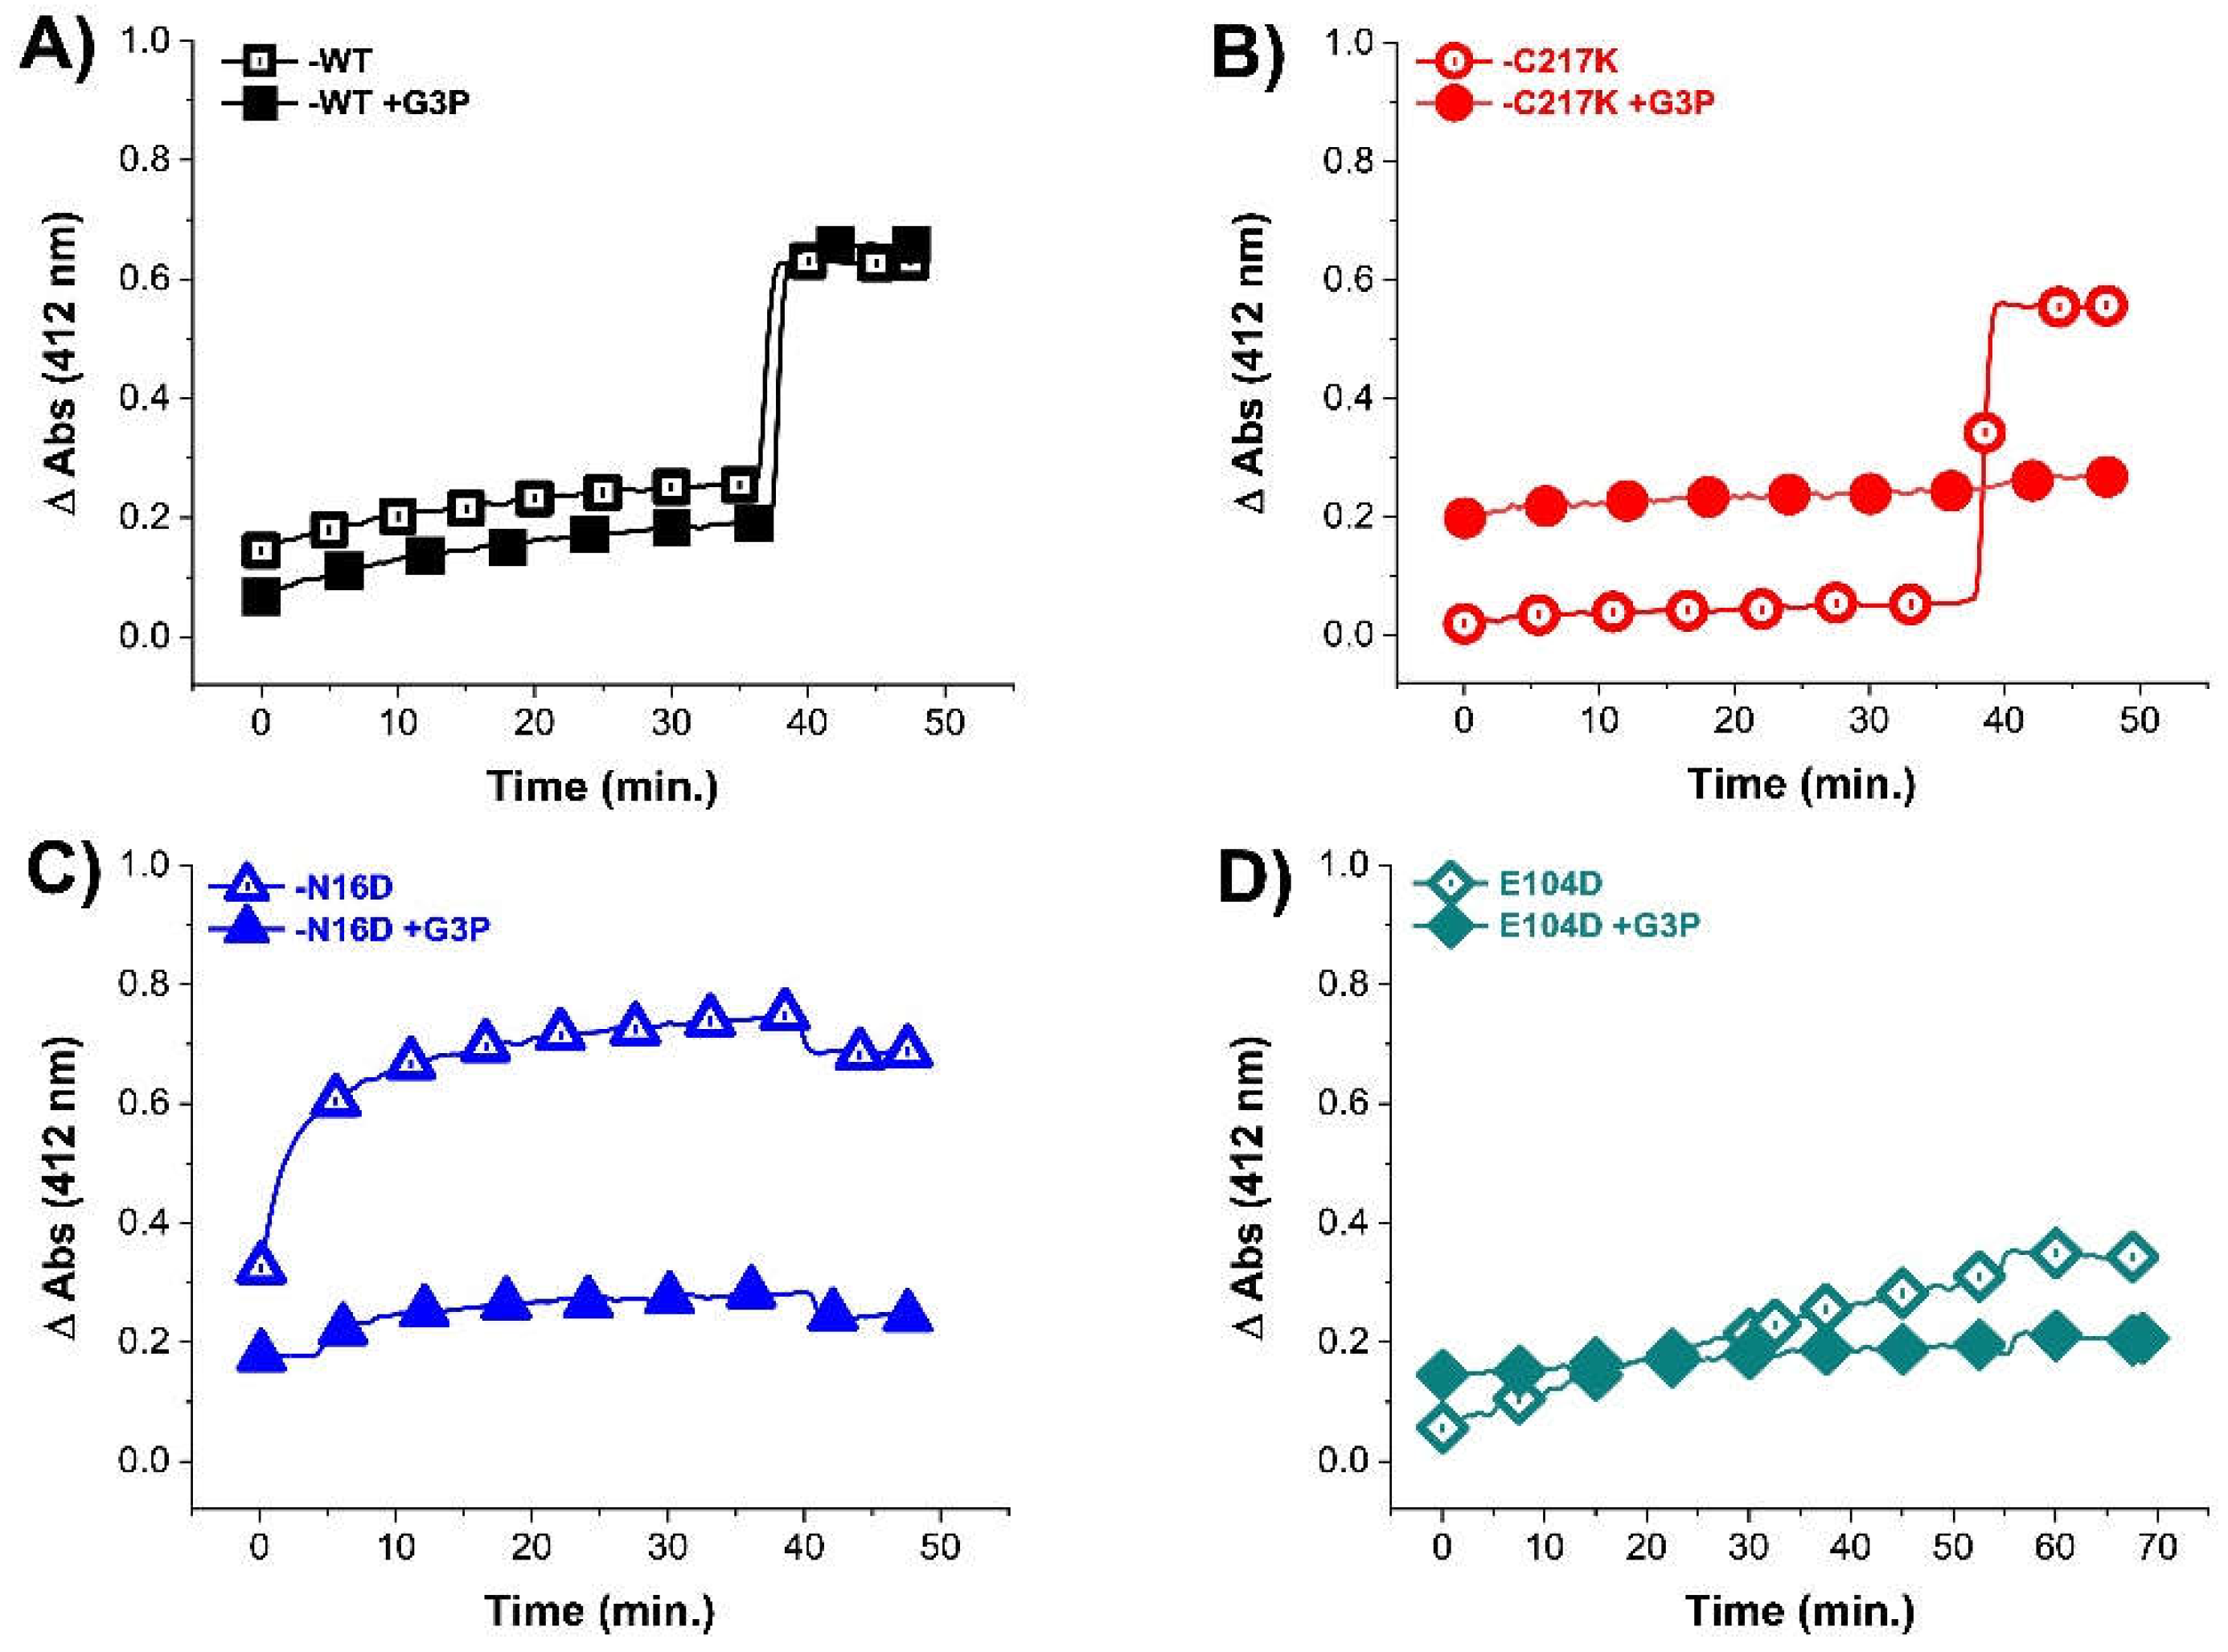
Figure 4.
Evaluation of secondary structure and global stability of HsTPI-WT and mutants. Circular dichroism (CD) in UV-Far of HsTPI-WT and mutants in absence (A) and presence of G3P. The filled figures are enzymes incubated plus-G3P. (B). Molar ellipticity spectra of enzymes (HsTPI-WT, C217K, N16D, and E104D mutants) without substrate, and presence of substrate incubated with G3P 1 mM during 24 h at 37 °C were performed. Blanks without protein were subtracted from the experimental ones; each spectrum was the average of three replicated scans. (C) Thermal stability was obtained by measuring the change in CD signal at 222 nm in response an increase of temperature from 25 to 90 °C in the absence (D) and the presence of G3P 1 mM. The fraction of unfolded protein and mean denaturation temperature (Tm) values are shown for each plot. These experiments are representative of three independent experiments, SE (±) < 5 %.
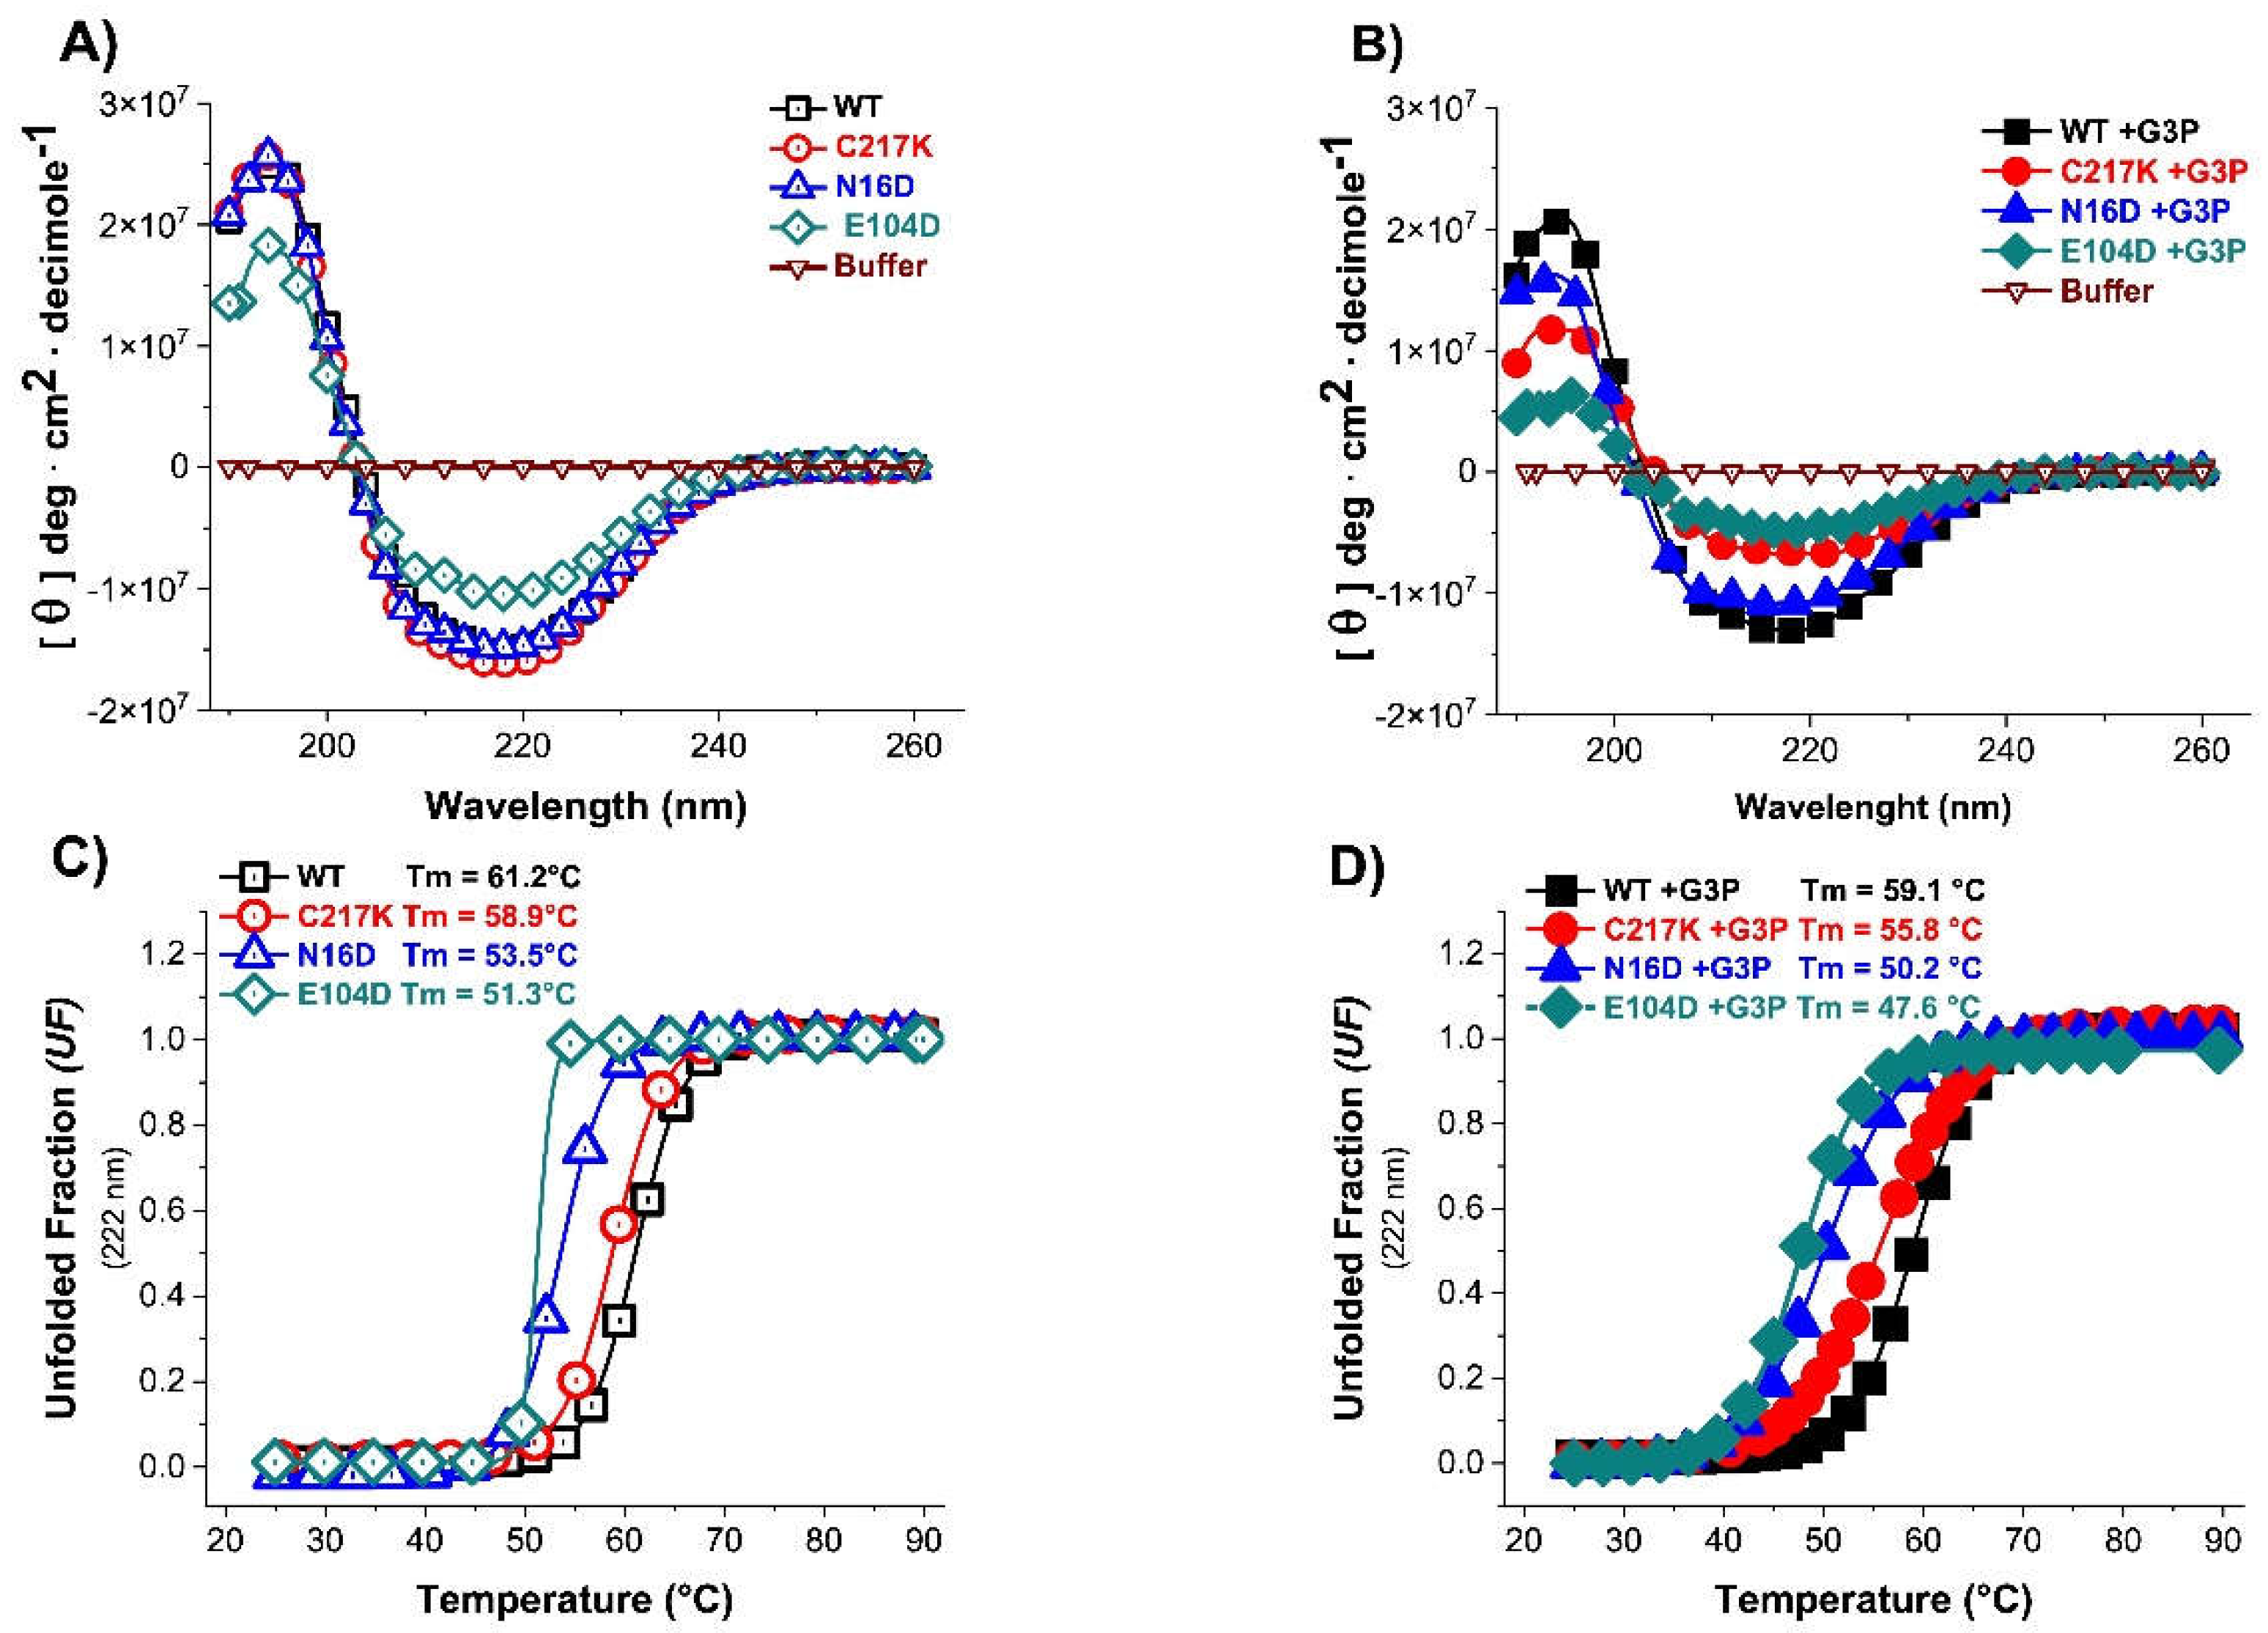
Figure 5.
Fluorescence emission spectra of the enzymes. (A) Intrinsic fluorescence, the emission spectra of scanning from 310 to 500 nm protein sample of WT, C217K, N16D and E104D were recorded after exc. at λ 280 - 295 nm. (B) Extrinsic fluorescence spectra without and with 150 μM ANSA were scanned from 400 to 600 nm after exc. at λ 395 nm. Blanks without protein were subtracted from the experimental ones; each spectrum was the average of three replicated scans.
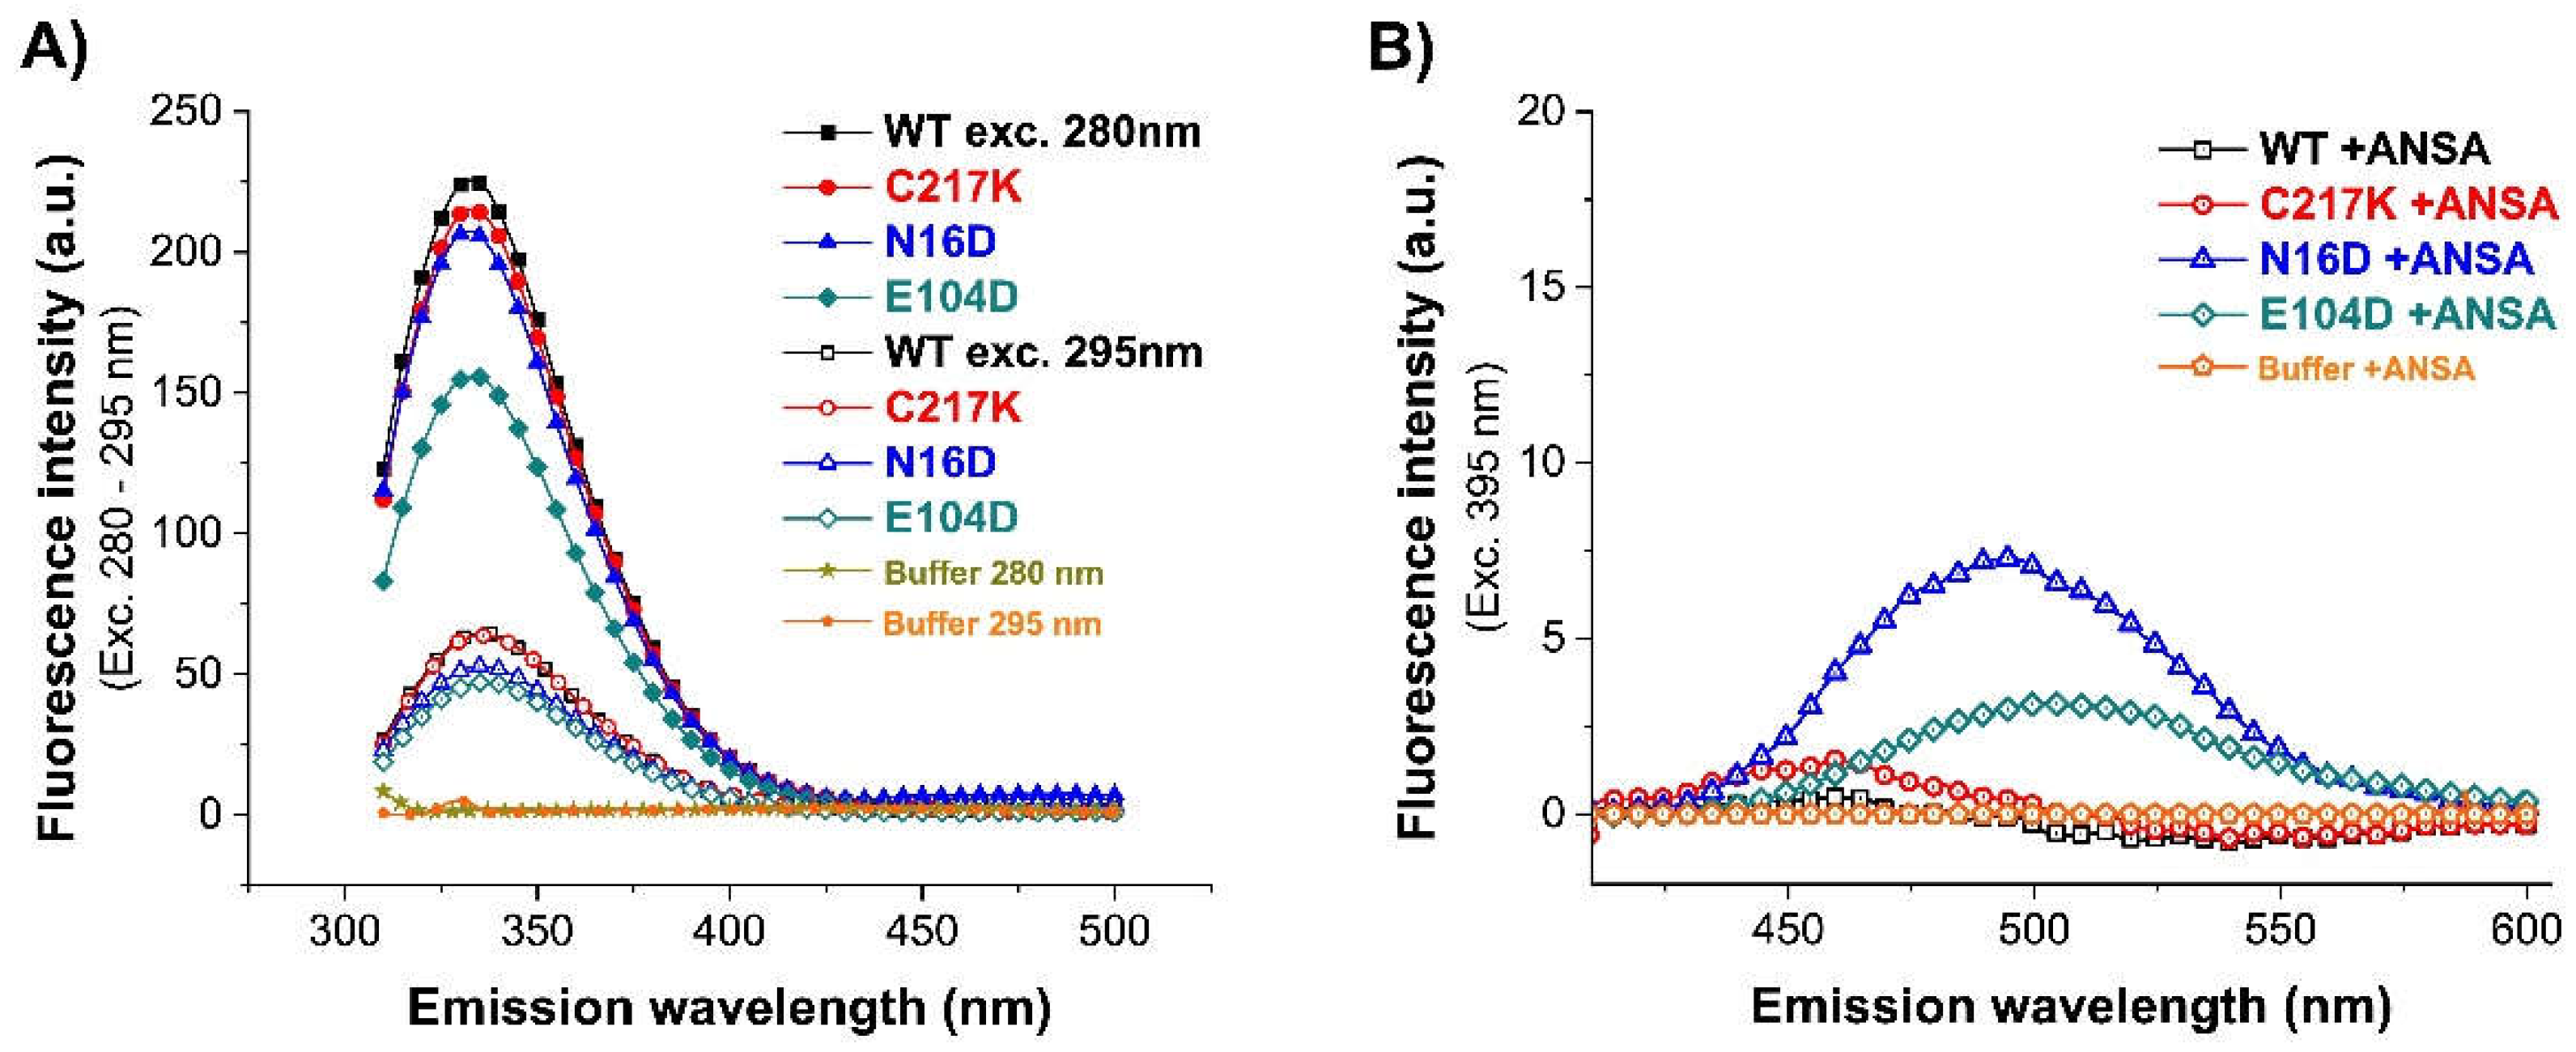
Figure 6.
Analysis of structural effects exerted by G3P on TPI’s. Enzymes exposed to G3P readings from 2, 28, 48, 72, and 96 h at 37 °C. (A) Protein samples HsTPI-WT C217K, N16D and E104D mutants were incubated with G3P 2 mM (2, 28, 48, 72 and 96 h) and then analyzed by λ exc. at 325 nm to obtain λ em. scans at 340-600 nm., with plot of fluorescence intensity signal at 395 nm. (B) The ANSA assay was performed under the same conditions. The samples were recorded at λ em. 400 to 600 nm with λ exc. 395 nm., and plot signal at 485 nm. All assays were carried out in triplicate.
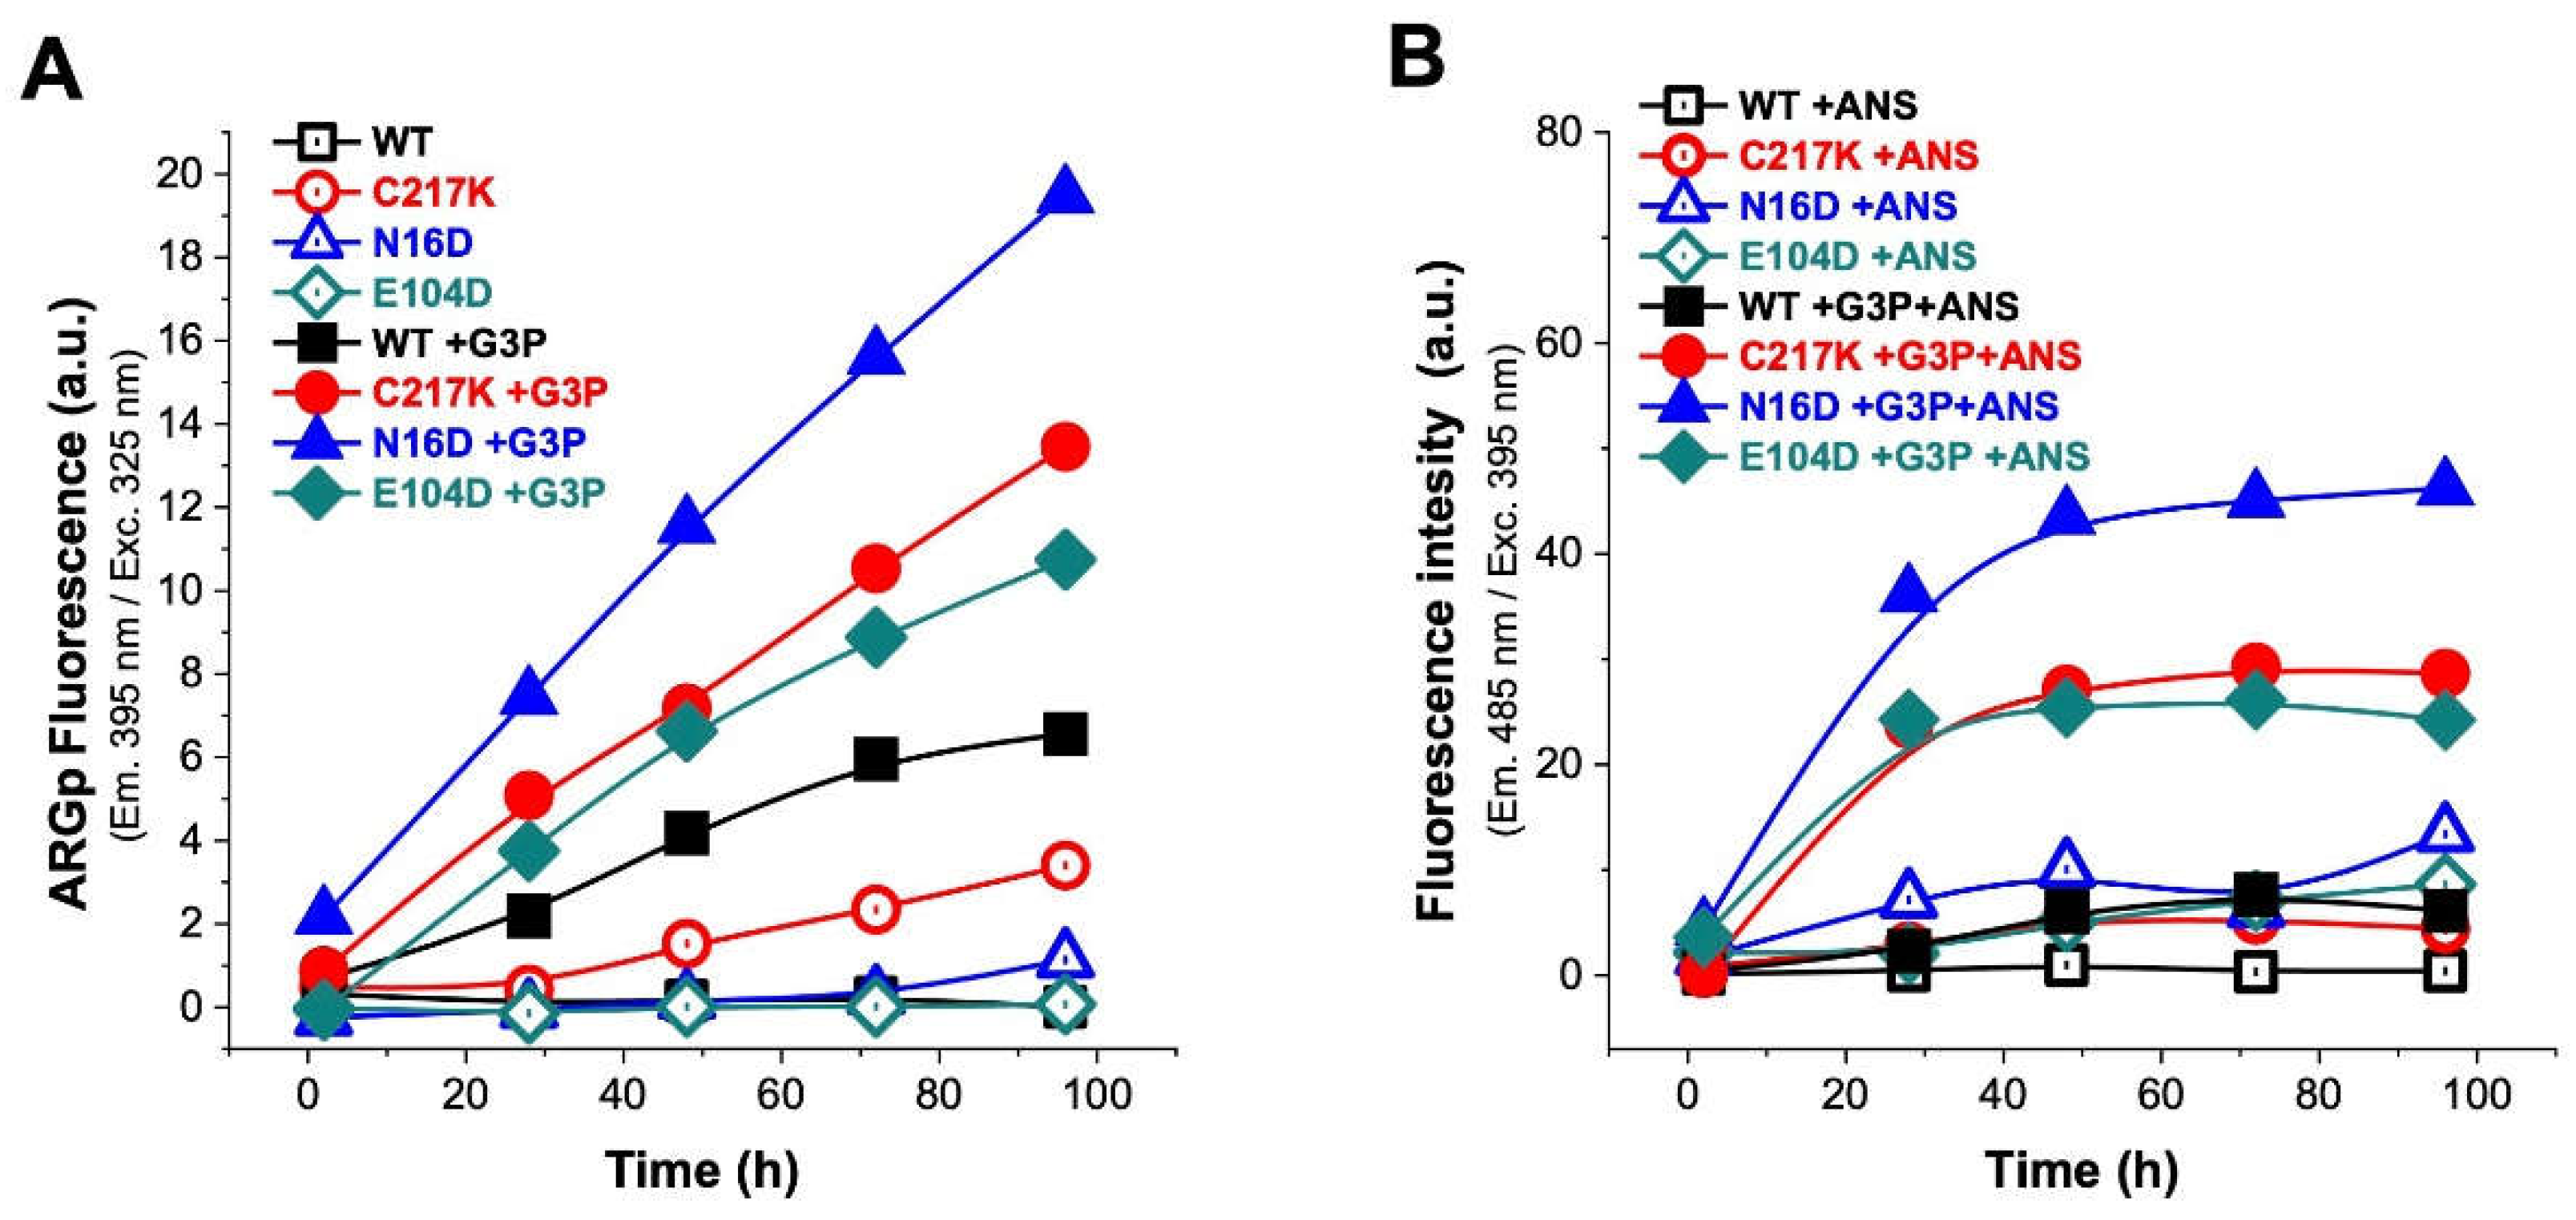
Figure 7.
Analysis of structural effect exerted by MGO on TPIs. (A) Shows the increased signal from the ARGp adduct with respect to incubation time in enzymes exposed to MGO 1 mM readings from 2, 28, 48, 72, and 96 h at 37 °C. (B) The addition of 150 μM ANSA showed the increase of hydrophobic patches on the exposed surface of the protein with respect to time exposure. Representation of enzymes: (WT, black squares); mutants, (C217K, red circles) (N16D, blue triangles) and (E104D, green diamonds); empty squares for (B) shows treatments without ANSA (incubation controls), filled squares represent enzymes plus-MGO.
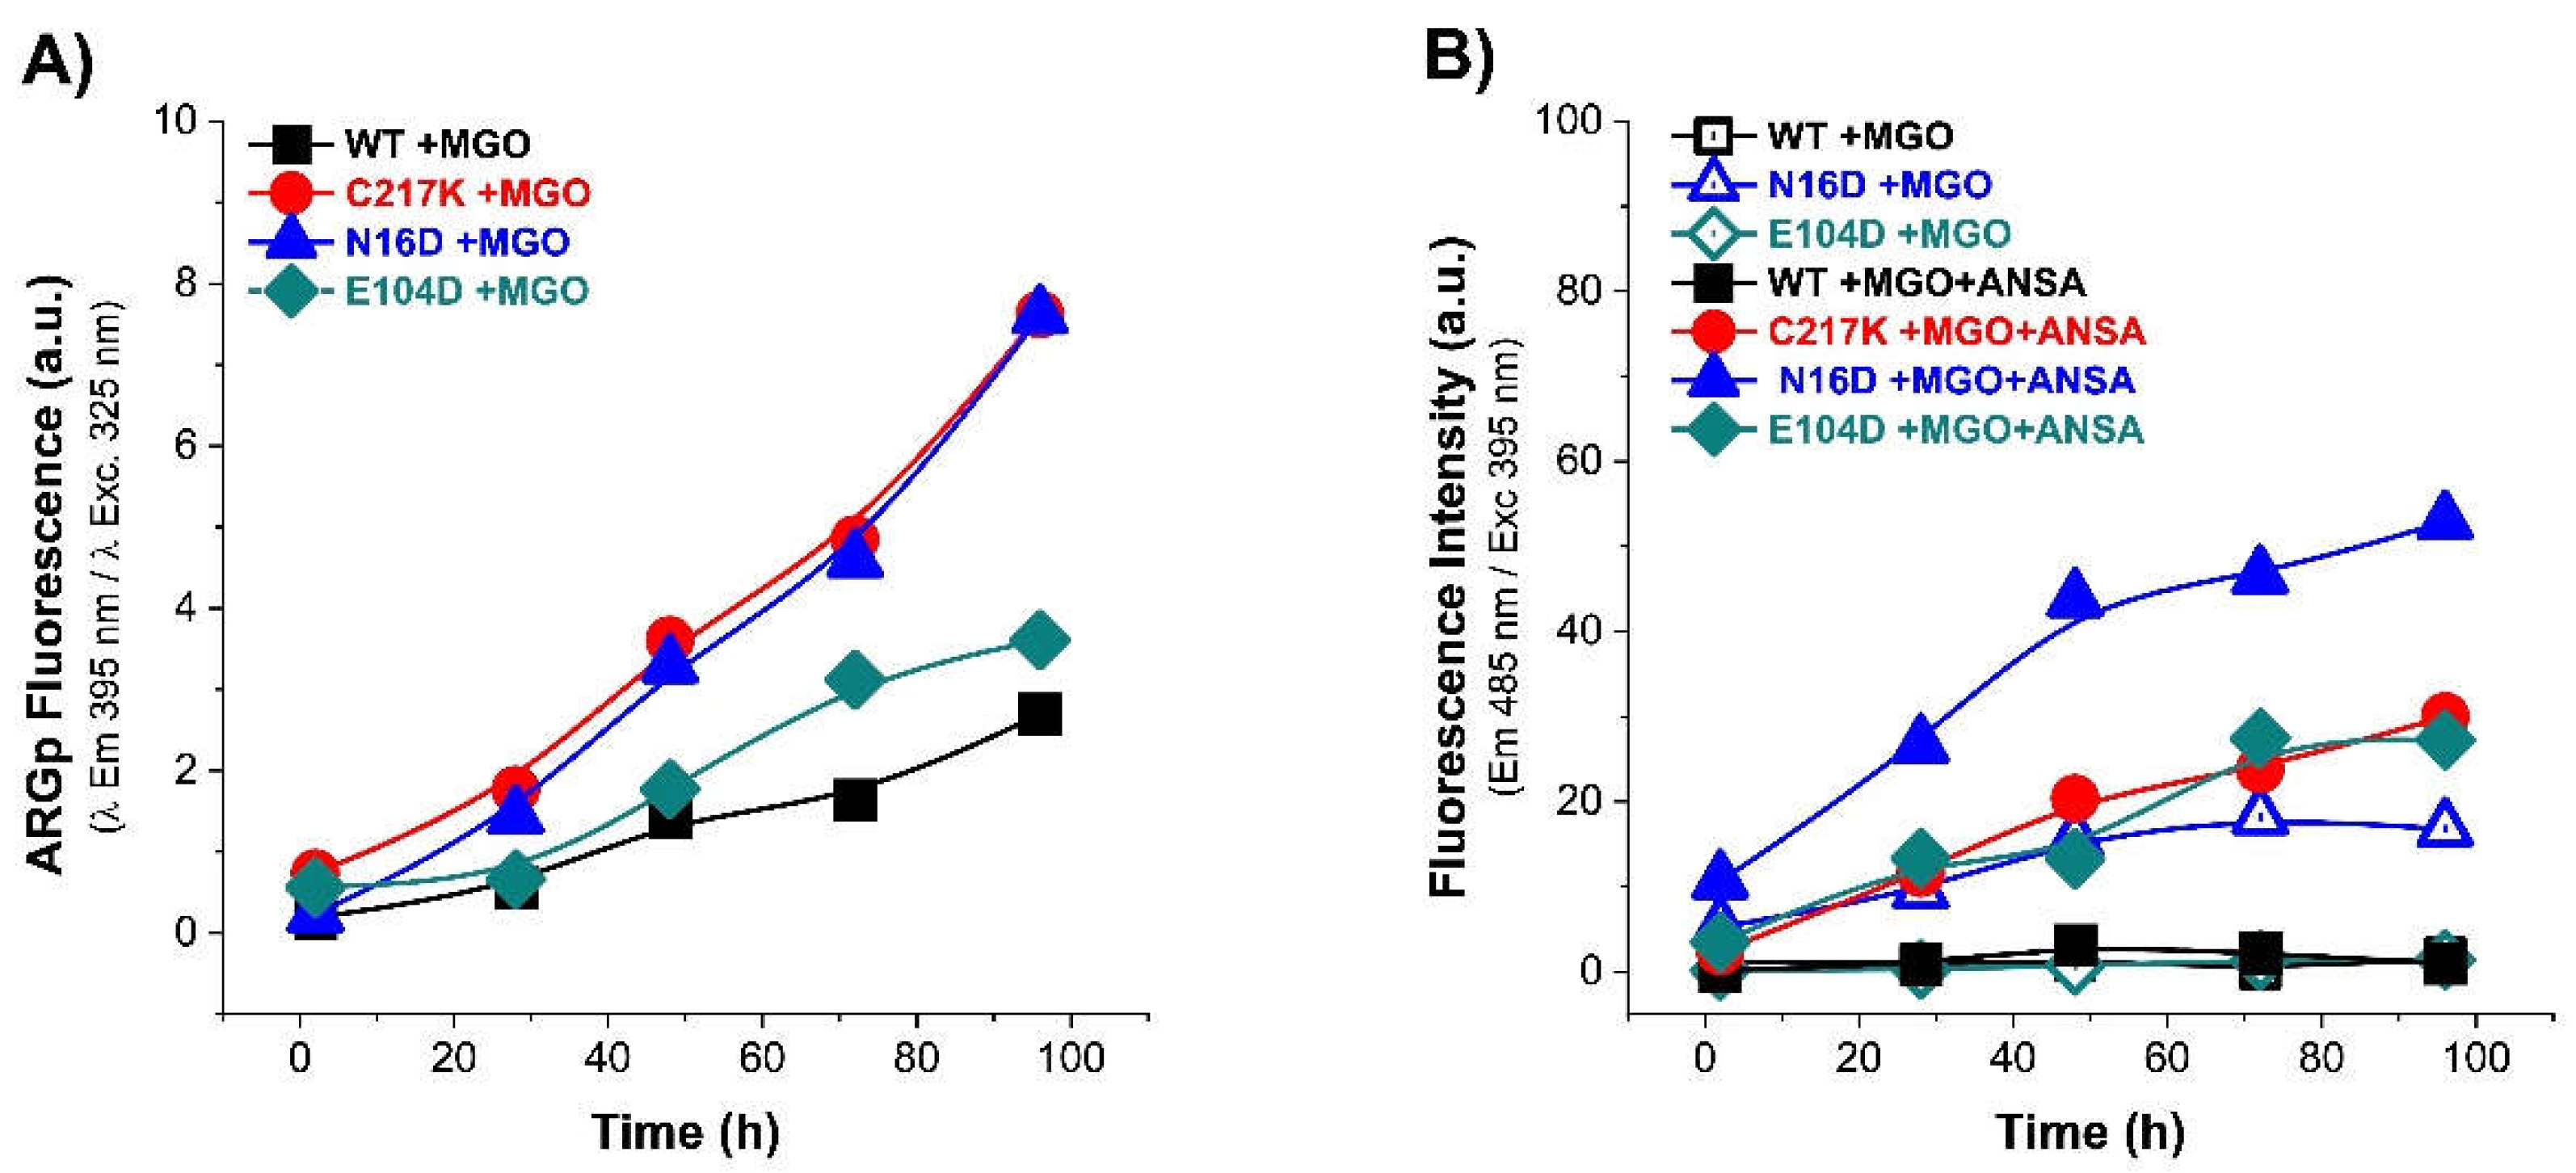
Figure 8.
Differential kinetic and structural effect in HsTPI-WT, C217K and E104D induced by G3P or MGO. The enzyme incubations were performed twice, 24 or 48 h, with increasing G3P or MGO concentrations (0, 10-2000 or 0, 10-1000 μM, respectively). The upper left panel (A) shows the residual activity plots for the three proteins incubated plus-G3P at both times. WT 24 h (black squares) and 48 h (open black squares), for C217K at 24 h (red circles) and 48 h (open red circles), and E104D at 24 h (green triangles) and 48 h (open green triangles) respectively. The upper right panel (B) shows the comparative residual activity of proteins plus MGO. The middle panel shows bar graphs of the protector effect of plus-arginine at the highest concentratión of G3P (C) or MGO (D) at 24 or 48 h. The differential effect of Arg equimolar addition as an MGO scavenger in TPI-G3P reactions (2000 μM), or TPI-MGO 1000 μM for the WT, C217K and E104D enzymes, respectively, is shown in the last lane of N-PAGE considering the rescue of residual activity plus-Arg 2000 or plus-1000 μM, respectively (squared bars) for each enzyme at 24 or 48 h vs the protein without Arg at the same time (plain colour bars). The lower panel shows the effects of protein destabilisation observed in N-PAGE induced by G3P (E) or MGO (F) within the incubation time. Each experiment was performed in duplicate.
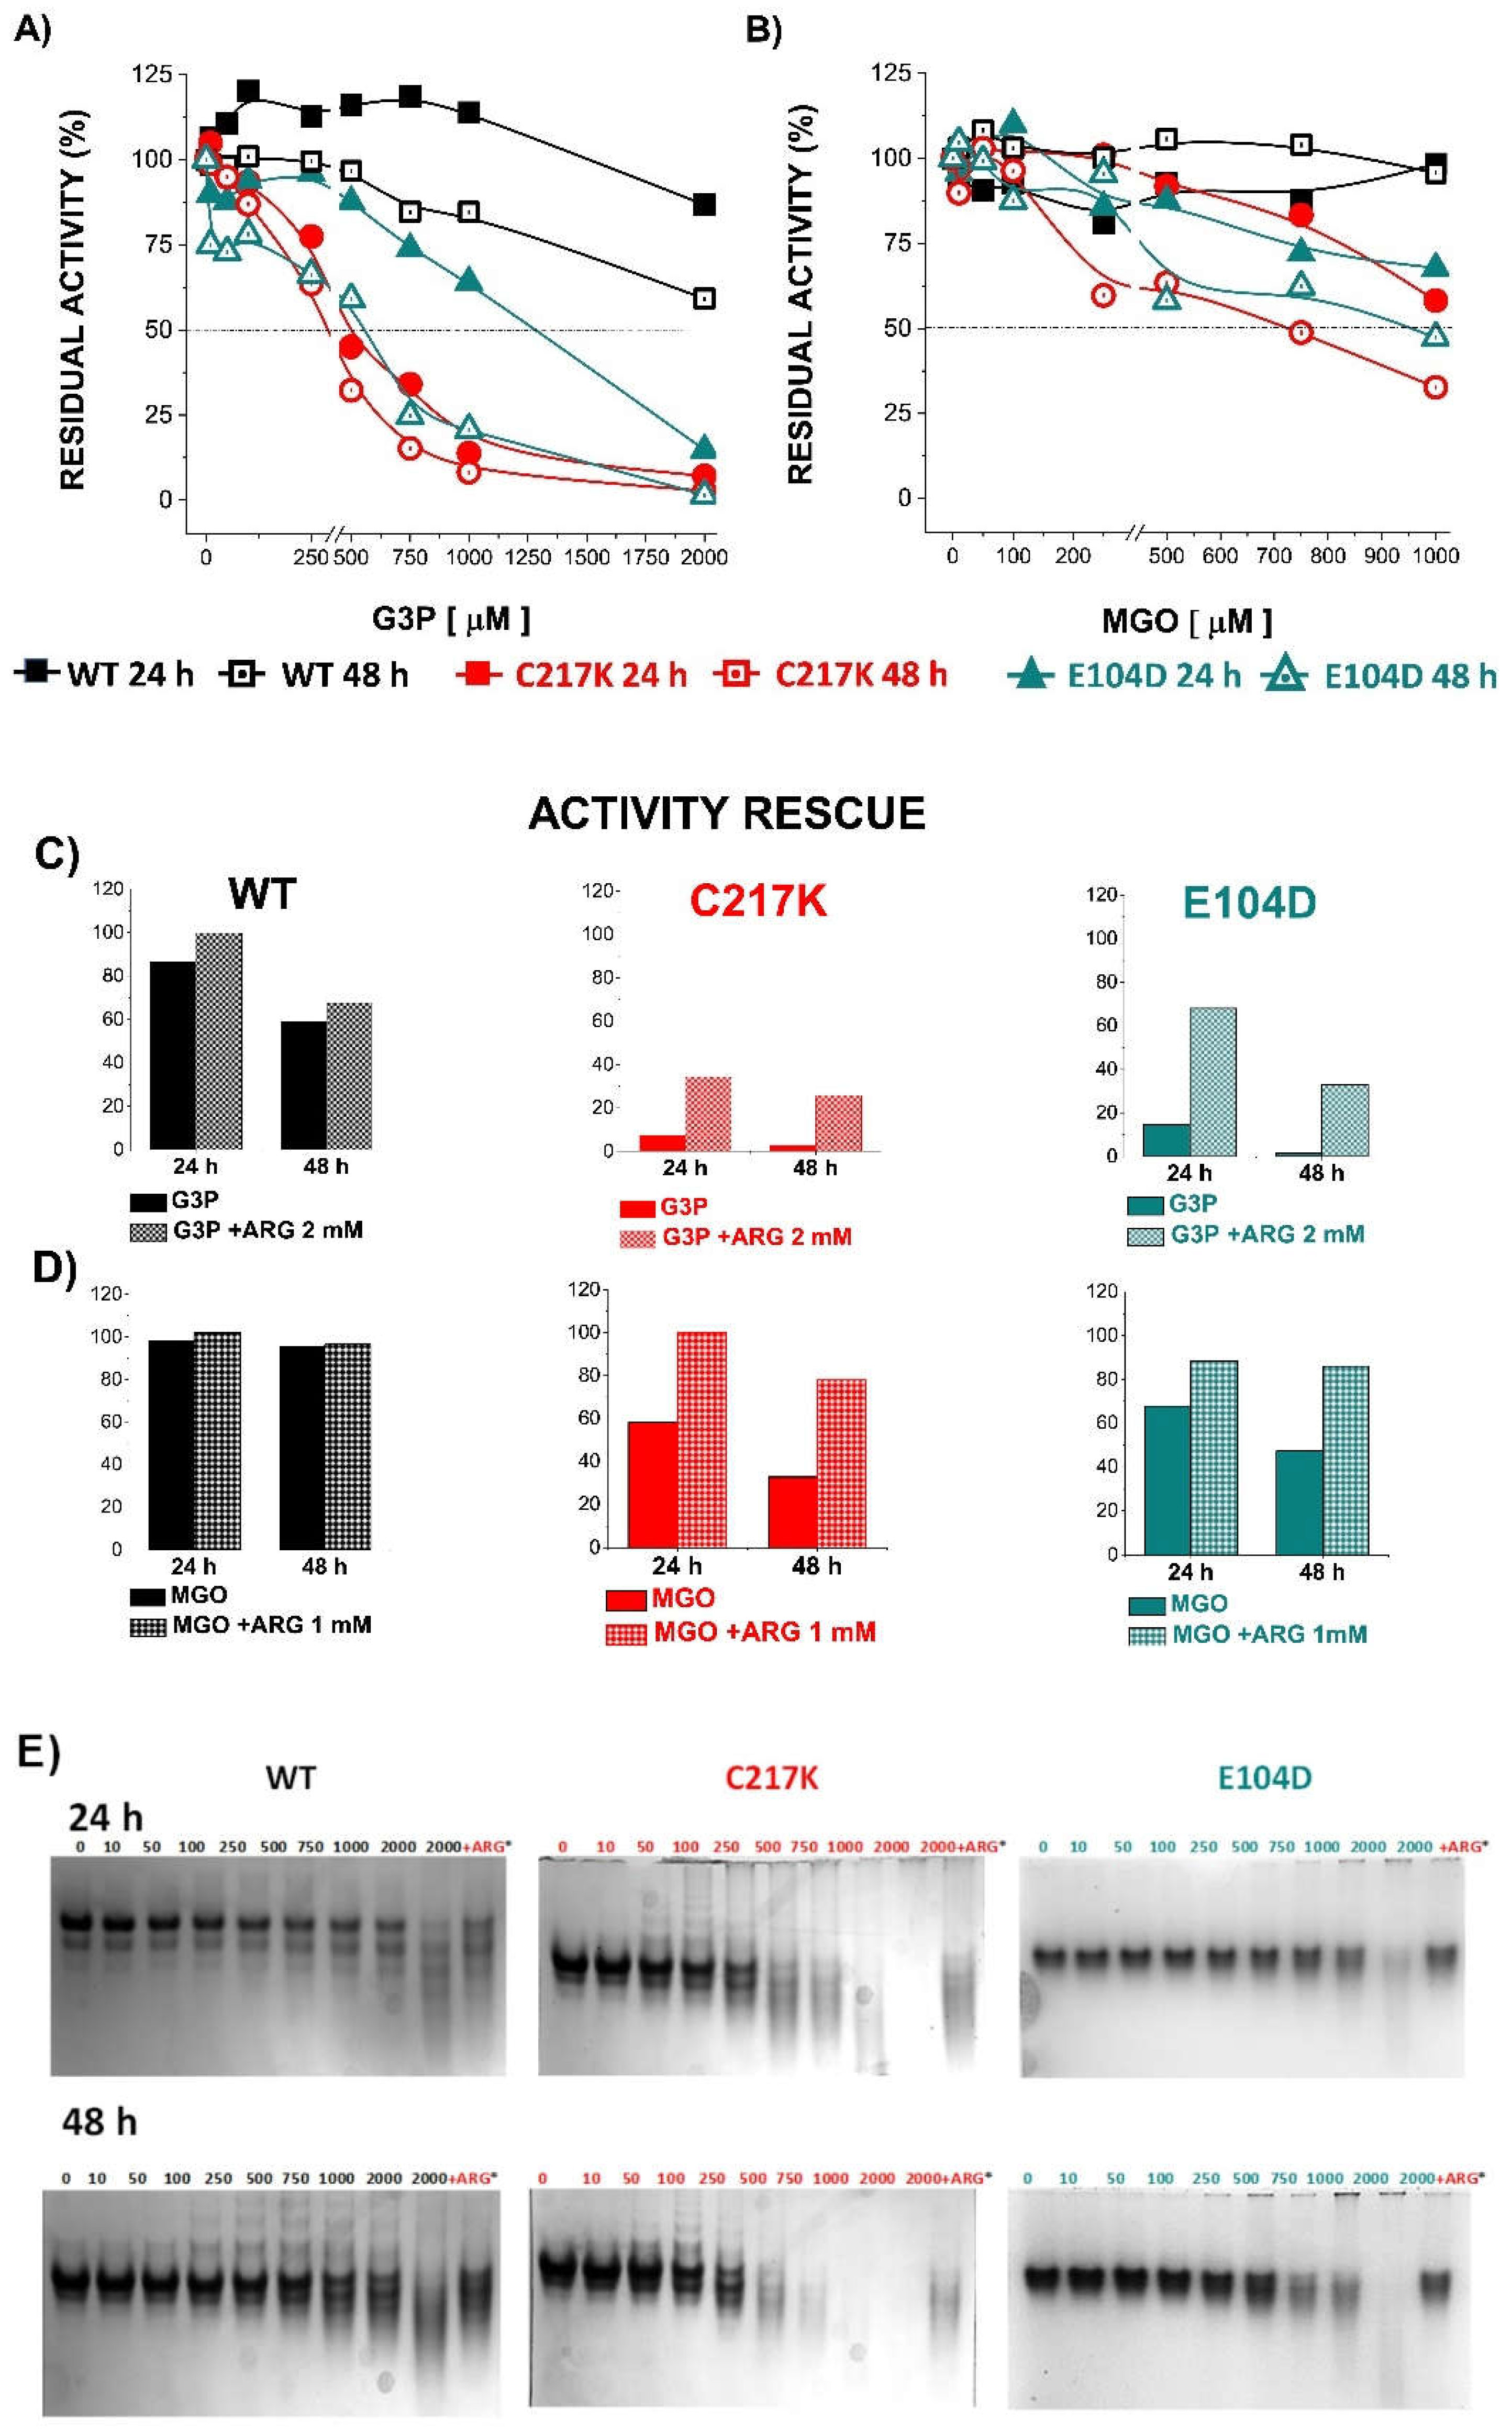
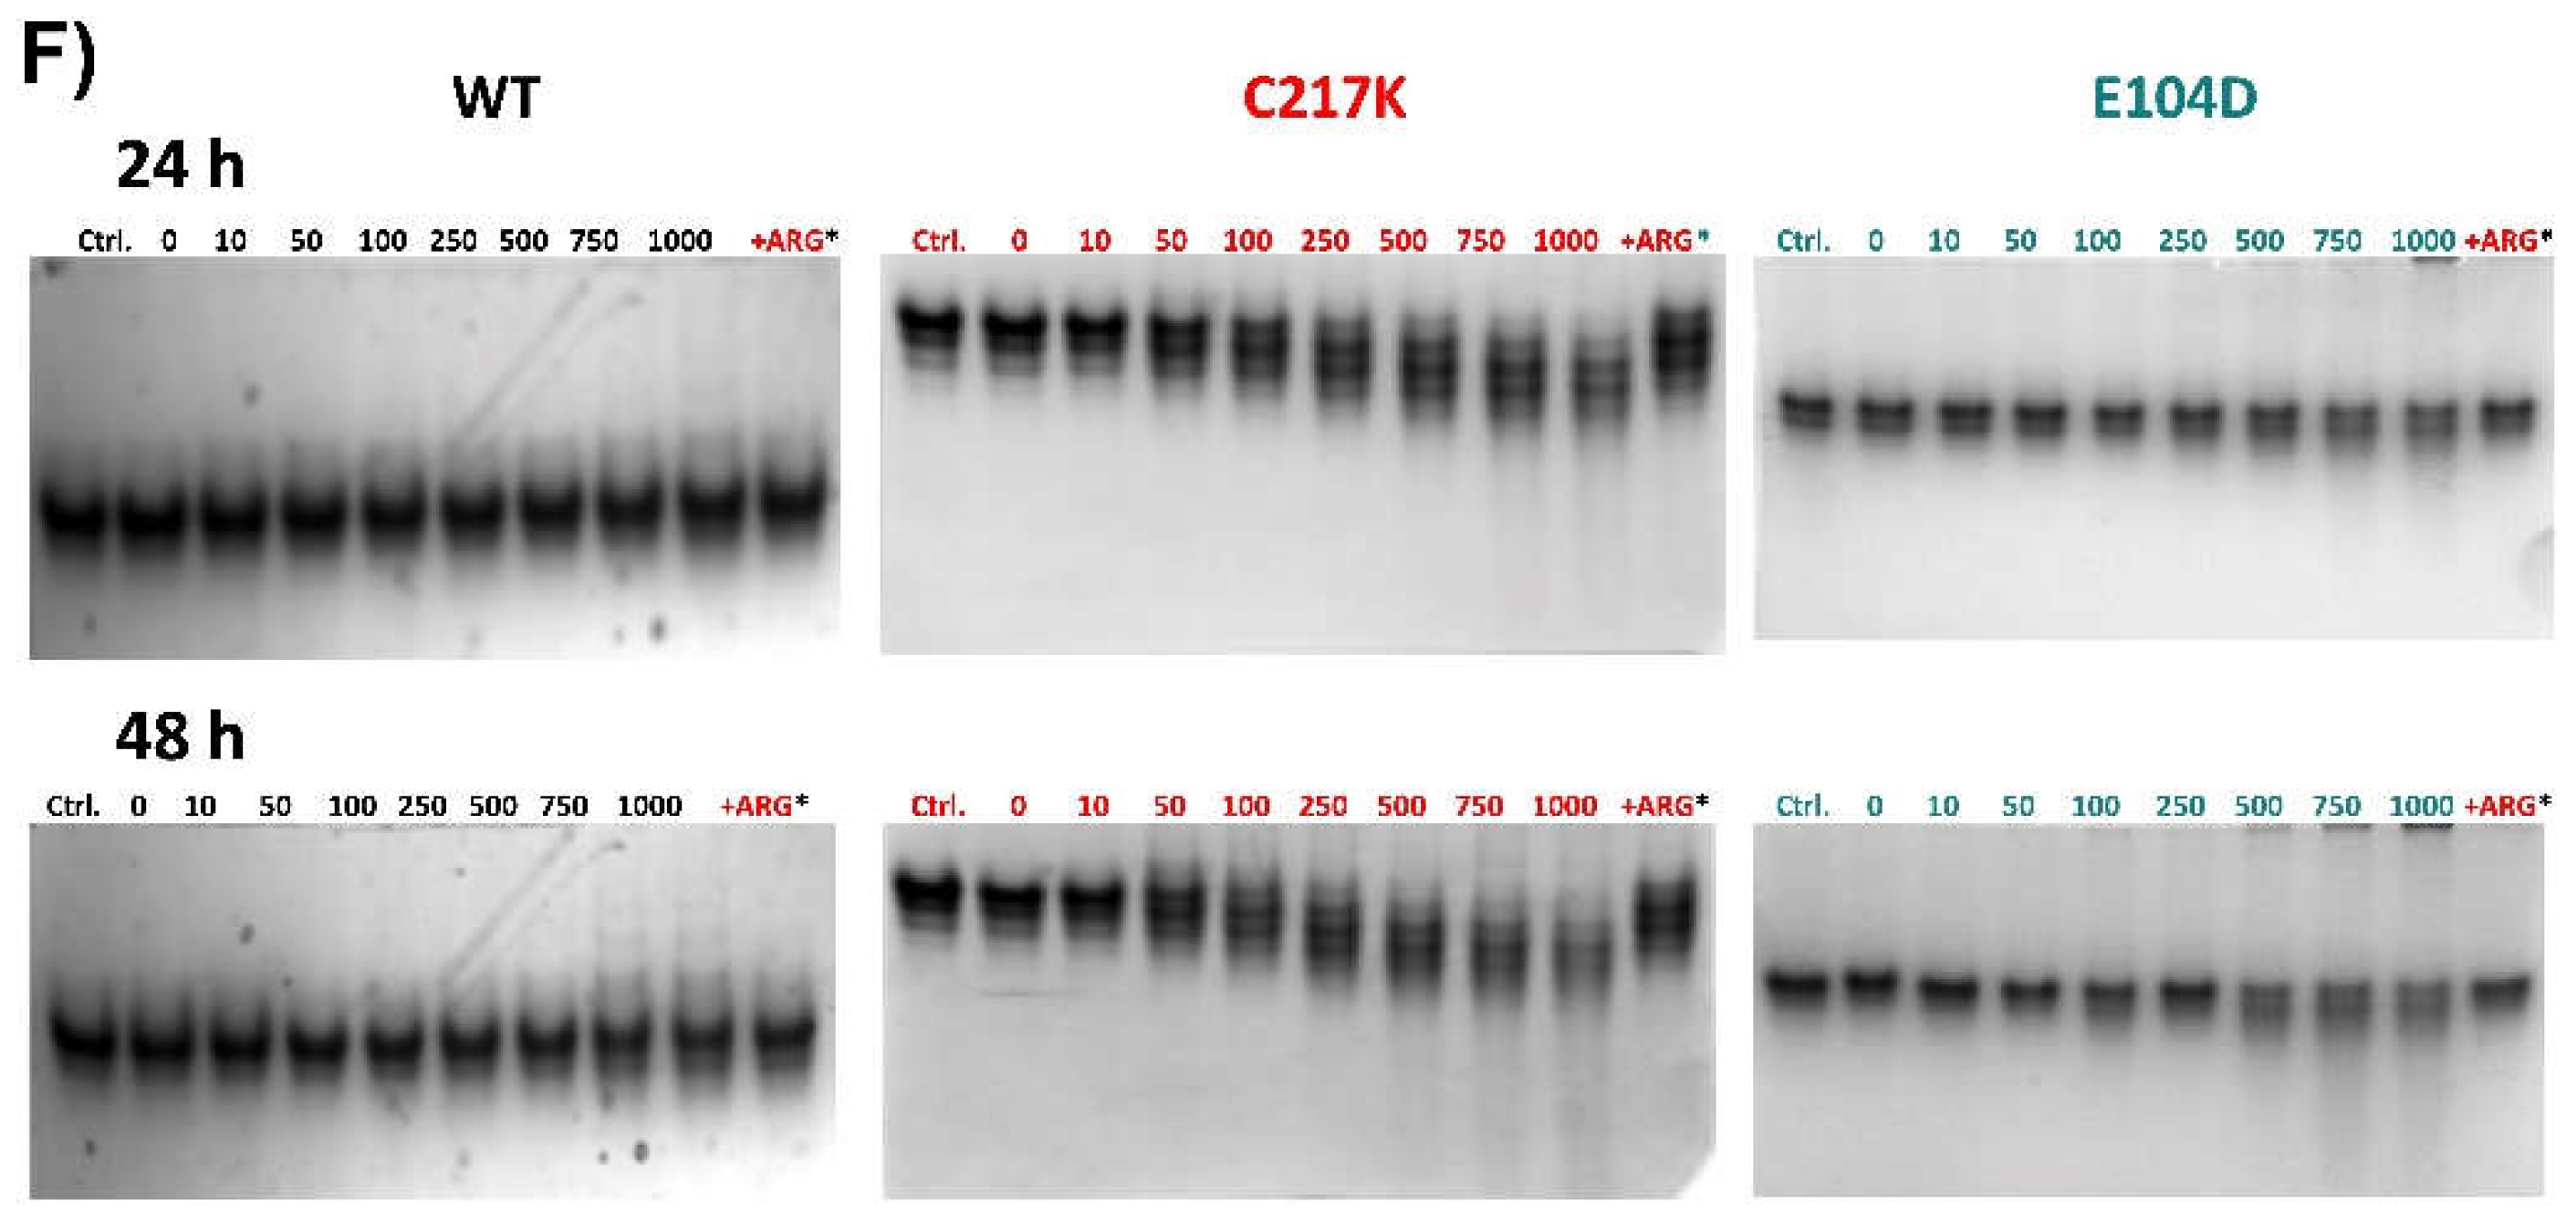
Figure 9.
- Effect of glycation by G3P or MGO on HsTPI-C217K. (A) N-PAGE, plus-G3P or plus-MGO enzymes incubated for 500 h at 37 °C. Samples were loaded with 5 µg/lane. Controls correspond to protein incubated without G3P or MGO. (B) SDS-PAGE 12%. Lane 1. Prestained relative mass standards (MWM). 5 μg of HsTPI-C217K treated with G3P or MGO was loaded per lane. (C) The composite figure of Western blots of C217K plus-MGO vs 1, Ab α-HsTPI (anti-HsTPI) and 2, Ab α-MGO (anti-MGO) was revealed. Red arrows (1-5) indicate MM of soluble aggregate after time exposure to G3P or MGO.
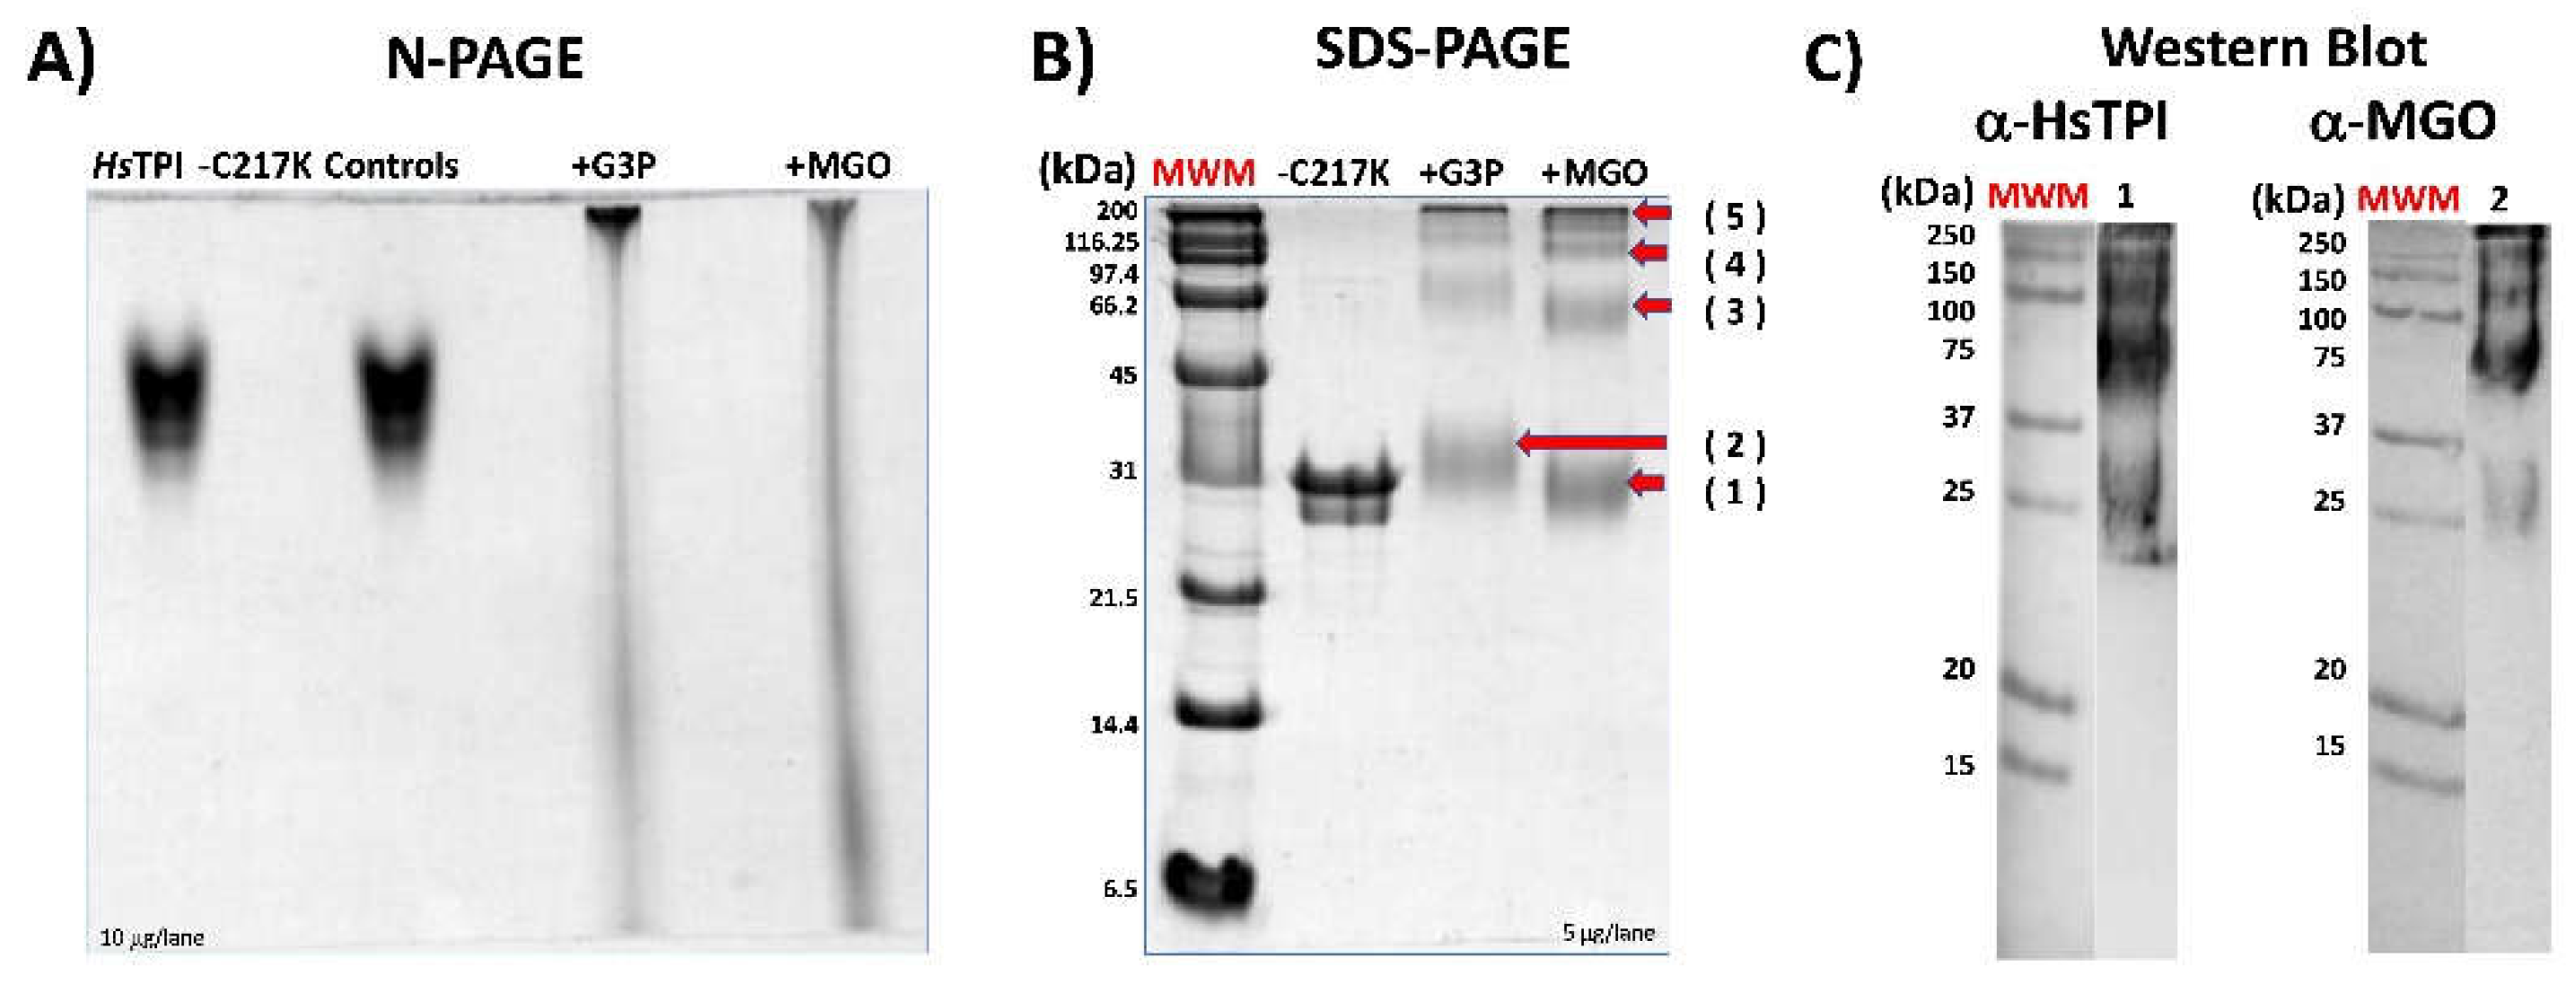

Table 1.
Kinetic parameters in WT-HsTPI, C217K, N16D, and E104D mutants.
| Enzyme |
Vmax ( mol · min-1 · mg-1 ) |
Km G3P ( mM ) |
kcat ( 105 M · min-1 ) |
kcat/Km ( 108 M-1 · s-1 ) |
|
|---|---|---|---|---|---|
| HsTPI-WT (*1) | 4091 ± 88.068 | 0.46 ± 0.03 | 2.2 | 2.8 | |
| C217K | 13432.4 ± 1046.4 | 1.76 ± 0.287 | 7.13 | 2.43 | |
| N16D (*2) | 4229.05 ± 210 | ND | ND | 0.25 | |
| E104D | 5905 ± 1.22E-12 | 0.88 ± 1.3E-26 | 3.13 | 2.13 |
Disclaimer/Publisher’s Note: The statements, opinions and data contained in all publications are solely those of the individual author(s) and contributor(s) and not of MDPI and/or the editor(s). MDPI and/or the editor(s) disclaim responsibility for any injury to people or property resulting from any ideas, methods, instructions or products referred to in the content. |
© 2024 by the authors. Licensee MDPI, Basel, Switzerland. This article is an open access article distributed under the terms and conditions of the Creative Commons Attribution (CC BY) license (http://creativecommons.org/licenses/by/4.0/).
Copyright: This open access article is published under a Creative Commons CC BY 4.0 license, which permit the free download, distribution, and reuse, provided that the author and preprint are cited in any reuse.


