
Submitted:
30 June 2024
Posted:
01 July 2024
You are already at the latest version
Abstract
Amid increasing deforestation, surface fires reaching the forest understory are one of the primary threats to Amazonian ecosystems. Despite extensive research on post-fire mortality in woody species, literature on palm resilience to fire is scant. This study investigates post-fire mortality in four understory palms—Bactris maraja Mart., Chamaedorea pauciflora Mart., Geonoma deversa (Poit.) Kunth, Hyospathe elegans Mart., and juvenile individuals of Euterpe precatoria Mart. Objectives included: a) comparing post-fire responses; b) developing mortality models based on severity variables; and c) evaluating if diameter protects bud stems from heat flux. Conducted at the edge of an Ombrophylous Forest in Alto Juruá Acre, Brazil (7°45'S, 72°22'W), the experiment subjected 85 individuals to controlled burning in a 1 m² area near the stipe, with temperature sampling using K thermocouples. Results showed varying mortality rates among species, with larger stipe diameter correlating to reduced mortality. Canopy burning patterns significantly influenced mortality, especially for Euterpe precatoria. Species exhibited diverse regrowth capacities, with B. maraja showing the highest number and tallest basal resprouts. This study underscores post-fire plant mortality as a critical indicator of fire severity, essential for understanding its ecological impacts.
Keywords:
Amazon Rainforest
; surface fires
; Acre
; Brazil
; post-fire fate.
1. Introduction
Surface fires are the most common type of fire in natural ecosystems globally [1]. In the Amazon, surface fires affected more than 85,500 km2 of forest between 1999 and 2010, comprising 2.8% of the entire forest area, a rate higher than deforestation during the same period [2,3,4]. During the 2015 drought, the frequency and extent of forest fires in the Amazon increased by 36% compared to the previous 12 years [5]. These high rates of surface fire occurrence are linked to changes in land use and anthropogenic ignition sources [6,17]. Surface fires typically exhibit low to moderate heat flux intensity and can exert selective evolutionary pressures [7,8,9,10]. While wildfires in tropical forests generally do not visibly damage canopy vegetation, the understory layer often experiences greater severity [11,12,13,14,15,16].
Anthropogenic ignition is recognized as the primary contemporary source of ignition [6]. Forest edges and their understory are most threatened by surface fires, which can spread tens of kilometers into the forest interior [18,19]. Altered physical and environmental conditions at forest edges, such as reduced relative humidity and increased temperatures, amplify fire severity [20,21]. Recurrent fires at edges heighten susceptibility to subsequent fires, potentially of increased intensity and severity [21,22,23,24].
In fire ecology, severity and intensity are independent concepts [8,25,26]. Fire intensity measures fire behavior in terms of thermal energy production rate, heat release, and temperature, depending on complex interactions among fuel structure, weather conditions, and the physical environment [27,28,29,30]. Severity encompasses the physical impacts of fire related to combustion and heat transfer, interacting with species morphology, physiology, and system characteristics [31].
Surface fire severity is driven by the fire's insidious nature, allowing it to slowly advance into the understory, where it can persist near plants, releasing high heat rates and burning the base of trunks, lower canopy leaves, seedlings, and young individuals [32,33,34,35]. The first surface fire in the understory tends to have low intensity due to preserved temperature and moisture conditions. Flames typically range from 10 to 30 cm in height, with a propagation speed of around 0.25 m min⁻¹ [18,23]. Temperatures at the base of intercepted plants along the fire's path can reach up to 760°C, with intensities reaching 50 kW m⁻¹ in such cases [36,37,38,39].
Post-fire severity determines mortality, with studies primarily focused on tree species; little research has been conducted on the survival of herbaceous, shrub, or understory species [40,41,42,43,44,45]. Controlled experimental studies on plant mortality related to fire are rare in Brazil and globally. Typically, studies assess mortality retrospectively, collecting information some time after a fire event [46]. Conversely, in North America and Europe, abundant research exists, especially on prescribed fires for large forest fire control [47,48]. In Brazil, post-fire studies are mainly conducted in Cerrado and Amazon regions [13,14,35,38,49,50,51,52,53,54,55].
The fate of plants after forest fire impact depends on heat-induced injuries, with outcomes being either survival or death [56]. Fate correlates directly with morphology (plant architecture), physiology, and fire behavior [55,57]. Predicting post-fire mortality is challenging due to the complex interactions involved [37,58,59]. Key factors include canopy burning, stem burning, and root heating [60]. Lethal burning occurs when heat flux raises temperatures above 60°C for one minute [56,61]. There is a direct relationship between bark consumption, flame height, fire intensity, crown and stem burn ratio/height, and plant mortality [37,62].
Canopy burning results from convective smoke heat energy and radiation heat energy, causing necrosis of branches, leaves, and buds, measurable in height and proportion [37,63]. Stem burning, caused by radiation and heat conduction, leads to charring or scorching, observed shortly after the fire event and also measured in proportion and height [64]. Severity is typically assessed through variables such as crown burn and stem burn, reflecting the amount of heat energy released by the fire (intensity or fire behavior), which are essential for mortality models [59].
Palms are recognized for their fire resistance in various ecosystems worldwide [65,66,67,68]. It is suggested that at least 30% of the species in this family exhibit fire resistance [65]. However, literature addressing this topic is sparse [66,68]. Based on these concepts and assumptions about palm fire resistance, this study aimed to experimentally investigate the post-fire fate of four understory palm species: Bactris maraja Mart., Chamaedorea pauciflora Mart., Geonoma deversa (Poit.) Kunth, Hyospathe elegans (Mart.), and the juvenile phase of Euterpe precatoria Mart.
Therefore, the study aimed to: a) compare post-fire responses among each species; b) develop mortality models based on severity variables, distance from the forest edge, and microclimatic factors; and c) assess whether height or stem diameter primarily protects buds from heat flux. Hypotheses were formulated as follows: i) severity significantly influences stem mortality and correlates with one morphological variable (height or diameter); ii) higher stem height mitigates mortality by reducing high temperatures in apical buds; iii) larger stem diameter reduces mortality rates; and iv) higher relative moisture and/or greater distance from the edge positively enhance individual survival.
A noteworthy advancement was made in this study by thoroughly investigating post-fire mortality processes in selected native palm species in the Amazon, employing an innovative methodology that simulates fire on individual plants, targeting specific plants rather than large forest areas.
2. Materials and Methods
The surface fire simulation experiment was conducted on an agro-extractive settlement property in the municipality of Cruzeiro do Sul, in the Alto Juruá Region of Acre State, Brazil (Figure 1). Acre is situated in the extreme southwest of the Brazilian Amazon, between latitudes 07o07' and 11o08' S and longitudes 66o30' and 74oW. The region experiences a hot and humid equatorial climate (Am type in the Köppen classification), with a dry season lasting approximately four months. The mean annual rainfall is 2,160 mm (ranging from 1,600 to 2,900 mm per year), the mean annual temperature is 26oC, and the relative humidity is 84%. The soil in the area is a typical dystrophic yellow Argissolo, with primary vegetation cover comprising a combination of open forest with palm trees and dense forest [69,70]. The climatological profile for 2013 indicates typical dry months in July and August, with an atypically rainy September (Figure 2).
The Open Ombrophylous Forest with Palm Trees in the area is characterized by a discontinuous canopy and a significant presence of Arecaceae family representatives, more in species abundance than richness [71]. This physiognomy, predominant in Acre, can be found both in terra firme areas and alluvial terrains, often forming associations with patches of dense forest or sharing territory with open forest with bamboo. In the study area, the canopy is predominantly composed of Iriartea deltoidea Ruiz & Pav. and Oenocarpus bataua Mart., and Euterpe precatoria Mart.
The Arecaceae family has a thermocosmopolitan distribution (between 44ºN and 44ºS) and comprises approximately 2,500 species in 184 genera, making it one of the oldest plant groups on the planet [72,73]. In the Amazonian flora, there are between 200 and 250 species, with numerous endemics [74,75,76]. In Acre, 24 genera and 82 species have been recorded, highlighting the region as a hotspot of diversity for this family [71,77]. Euterpe precatoria is distinguished by its presence in open forests, reaching up to 30 meters and forming part of the canopy. The juvenile phase of E. precatoria was included in the simulation experiment due to its morphological resemblance to other stiped palms in the study, which inhabit exclusively the understory of the humid forest: Bactris maraja, Chamaedorea pauciflora, Geonoma deversa and Hyospathe elegans. Generally, these species do not exceed 10 meters in height, exhibit a palm-like growth during their juvenile and adult stages, and often show clonal ramet behavior, forming clusters. In the present study, only E. precatoria and Geonoma deversa do not exhibit this characteristic.
2.2. Phases of the Surface Fire Experiment Simulation
- Phase I (Selection of Individuals): A total of N = 85 individuals from the five species were subjected to the surface fire simulation experiment (Table 1 for description of morphological parameters sampled at this Phase). These individuals were randomly selected along three 600 m parallel transects perpendicular to the forest edge, each separated by 100 m. The following criteria were applied for selection: a) a minimum distance of ten meters between individuals; b) location on flat topography; and c) a maximum height of 2.5 m. Each individual was assigned an identification plate and designated as a sampling unit. Of the five species included in the experiment, for Euterpe precatoria only the juvenile phase was considered, thus it was analyzed separately from the set of four understory species.
- Phase II (Surface Fire Simulation Experiment): The simulation experimentally reproduces the heat flux generated by an understory fire on a reduced and individualized scale (Table 1 for variables description). The parameters used for the simulation outline a surface fire with a maximum height of 30 cm, an intensity of 50 kW m-1, and a maximum temperature of 760°C, with a propagation speed ranging from 0.1 to 0.35 m min-1 [23,36,37,38,39,78]. Three type K thermocouple sensors (chromel-alumel; maximum sensitivity 1,300 oC) were used to record the time-temperature history (Table 2), connected to a datalogger (Omega® HH140, four channels) - Figure 3a.

Table 1.
Description of the variables sampled in the three phases of the surface fire simulation experiment in the understory of an Amazonian forest in western Acre, Brazil. Phase I: pre-fire morphological variables. Phase II: time-temperature history variables and immediate impact. Phase III: post-fire variables measured at each post-fire survey (see text).
| Phases | Parameters | Unit | Acronym | Description |
|---|---|---|---|---|
| Phase I | Total height | m | HT | From the ground to uppermost leaf |
| Leaf length | cm | LENG | From the petiole base to the apex | |
| Stipe diameter at ground level | cm | DS | At the base of the palm stipe | |
| Stipe height | cm | SH | Soil to base of leaf sheaths | |
| Number of leaves | Number | NL | Count of healthy leaves | |
| Distance from the edge | m | DIST | Orthogonal to the forest edge | |
| Phase II | Ambient temperature | oC | TAMB | Continuous record |
| Simulation Average temperature | oC | TMED | 360 s interval | |
| Simulation Minimum temperature | oC | TMIN | 360 s interval | |
| Simulation Maximum temperature | oC | TMAX | 360 s interval | |
| Simulation ∑ of temperatures | oC | SUMT | Sum of values in 360 s interval | |
| Simulation Average 150 s | oC | MED150 | 150 s interval average (flare phase) | |
| Simulation ∑ of temperatures 150 s | oC | SUM150 | Sum of values in 150 s (flare phase) | |
| Bud Average temperature | oC | TMEDG | Average inside the bud in 360 s | |
| Bud Maximum temperature | oC | TMAXG | Maximum temperature inside the bud/360 s | |
| Bud ∑ of temperatures | oC | SUMTG | Inside bud temperatures at 360 s | |
| Bud Maximum increment | oC | INCMAX | TMAXG - TAMB | |
| Bud Average increment | oC | INCMED | TMEDG - TAMB | |
| Bud time of maximum temperature | s | IGMAX | Between ignition and maximum temperature inside the bud | |
| Burned leaves on that day | % | PCF | Burned leaves/ NL x 100 | |
| Phase III | Complete burned leaves | Number | FC | Leaf coloration other than green |
| Partial scorched leaves | Number | FP | Leaf lamina with partial discoloration | |
| Scorched leaves | % | PQF | FC + ½ FP/ NL x 100 | |
| Complete canopy scorched | % | CNSCAR | PCF + PQF | |
| Stipe scorched height | cm | STSCARH | Base to the uppermost carbonized portion | |
| Stipe scorched proportiona | % | STSCAR | STSCARH / SH x 100 | |
| Resproutb | Number | REB | Number of basal resprouts | |
| Regrowth | cm | RECR | Height of apical regrowth | |
| Resprout height | cm | HREB | Height of highest basal resprout | |
| Failed resprout | - | RFAL | Failed basal resprout or regrowth | |
| Final fatec | - | FATE | Stipe: ( 1 ) dead; ( 0 ) alive |
(a) Always checked at the first inspection, i.e., up to one week post-fire. b)Basal resprout starts at the base of the plant - new ramet, while regrowth is apical. However, there may be both cases in the same individual, so we consider basal + apical regrowth as separate variable. c)Mortality is understood in this work as "topkill", in other words, mortality of the stipe (palm stems).
Table 2.
Description and location of the K thermocouple sensors (chromel-alumel; maximum sensitivity 1,300oC) used in the Phase II of the surface fire simulation experiment in the understory of an Amazonian forest in western Acre, Brazil.
Table 2.
Description and location of the K thermocouple sensors (chromel-alumel; maximum sensitivity 1,300oC) used in the Phase II of the surface fire simulation experiment in the understory of an Amazonian forest in western Acre, Brazil.
| Thermocouple number | Description |
|---|---|
| TK1 | For continuous sampling of the ambient temperature, positioned 3 m away from the experiment. |
| TK2 | For temperature sampling in the central meristematic apex of the plants, inside the bud, with the sensor tip positioned at a depth not exceeding 5 cm. |
| TK3 | For recording the temperature at the base of the plant, partially buried, with its tip 10 cm above the ground and one centimeter from the surface of the plant stipe. |
Before the burning, partial thinning of the vicinity was conducted for safety reasons. A 1 x 1 meter area of burlap was placed near the base of the plant, bordered by a 1-meter wide circular safety firebreak boundary, and combustion was initiated using standardized kerosene ignition (20 ml per individual) (Figure 3b).
The interval between temperature recordings was set at 1 second, with a maximum recording period of 360 seconds to cover ignition, flame, smolder, and extinction phases. If the fire was not fully extinguished within this period, it was manually extinguished. All sensors featured mineral insulation and a three-meter long K extension cable (ANSI MC 96.1 standard). The experiment adhered to safety protocols for controlled burning, included the use of Personal Protective Equipment (PPE), water, and manual fire beaters. The burns were conducted during the Amazon dry season, between August and September 2013, from 11:00 am to 5:00 pm.
The environmental parameters of the microclimate in the study area were obtained during Phase II using 36 HOBO® sensors distributed randomly across the area. Each sensor recorded data on air temperature, maximum air temperature, relative humidity, maximum relative humidity, and soil temperature (sensor buried in the soil at a depth of 3 cm). Wind speed was measured three times a day, and the leaf litter depth was measured once for each individual prior to burning (Table 3). These variables serve as parameters for comparison with drier year conditions.
- Phase III (Collection of post-fire impact and severity data): The condition of palm individuals was assessed on at least three occasions following the fire, with the first survey conducted within two weeks of the experiment (Table 1 for parameters description). The interval between subsequent surveys varied (1st survey: 2 ± 4 days, n = 28; 2nd survey: 8 ± 9 days, n = 28 + 20 new individuals; 3rd survey: 36 ± 17 days, n = 48 + 37 new individuals; 4th survey: 85 ± 17 days, n = 85; 5th survey: 145 ± 17 days, n = 85).
2.3. Statistical Analysis
The time-temperature history was assessed for variance in relation to the sample units using normality tests (Kolmogorov-Smirnov) and homoscedasticity tests (Bartlett), followed by analysis of variance (one-way ANOVA). Possible relationships between: (a) the independent time-temperature history variables (TMED, TMAX, SUMT, MED150, SUM150); (b) the fire severity variables (PCF, STSCARH, STSCAR, PQF, CNSCAR); and (c) the dependent temperature variables measured at the center of the apical bud (TMEDG, TMAXG, SUMTG, INCMAX, INCMED), were explored using simple linear regressions.
The individual probability of post-fire mortality for the four understory species and Euterpe precatoria was modeled using binary logistic regression (1 for death or regrowth; 0 for survival) [79]. The logistic function was used to convert the linear combination of dependent variables into probabilities. All fire severity variables (CNSCAR, STSCAR) and morphological variables (DS, SH) were included as independent variables. Initially, the models were generated with the independent variables modeled individually, followed by interactions relevant to biological explanations. Through generalized linear model analysis (binomial GLM), independent variables were included in each regression model when statistically significant (p < 0.05), using the 'stepwise selection' method. Correlations between variables were examined a priori, and when Spearman's test values for the correlated pair exceeded 0.5, only one of the variables was chosen for the model. To explore the influence of the edge microclimate on mortality, models were also generated consisting of the orthogonal distance from the edge to the individual and the minimum relative moisture values obtained on the day of each experiment (Figure 4).
The different significant models were compared using the Bayesian theoretical approximation technique: Akaike's Information Criterion (AIC). The ΔAIC, similar to the -2 log likelihood, is also adopted for comparison. The lowest AIC value was used to select the most parsimonious final model among the generated models [80]. To test the fit of the data and the performance of the model as a predictor of individual mortality, three test criteria were adopted: (a) likelihood ratio statistics, comparing the generated model to the null (with only the intercept) using the χ2 test; (b) Nagelkerke's pseudo R2 value, considered equivalent to the R2 coefficient of determination for linear models; and (c) the area under the ROC (Receiver Operating Characteristic) curve: Operator Sensitivity Curve [79,81]. The ROC curve is a non-parametric technique that tests the performance of a binary model independently of the isolated effects of the variables. The area under the curve ranges from 0.5 (no predictive ability) to 1 (perfect predictive ability). Models with values between 0.7-0.9 are considered good, with values greater than 0.9 indicating high accuracy for probability prediction. Statistical analysis was conducted in R 3.0.3 (R Development Core Team) using the packages stats 3.0.3 and rockchalk 1.8.0.
3. Results
Post-fire mortality varies among species, and for all species, the larger the diameter of the base of the stipe, the lower the mortality. Additionally, the mortality of Euterpe precatoria and the other four species in the experiment is strongly influenced by the pattern of canopy burning. The probability of mortality increases in proportion to the extent of leaf burning. Temperature at the apical bud is variable; however, it does not explain the mortality of the stipes. Stipe height and total height of the individual do not influence mortality. In explaining post-fire mortality, the variation in morphology among species (Table 4) appears to be more important than the amount of heat flux applied to each individual involved in the experiment, as no significant difference was observed in the time-temperature history measured.
3.1. The heat flux at each individual base was applied equally
The heat flux distribution of the time-temperature history measured by the thermocouples (n = 85) did not differ among individuals (Figure 5a, Table 5). The maximum temperature applied to the base of the plants was 727oC, and the maximum value of summation of temperatures in 360s was 70,776oC, and the minimum value of this summation was 12,991oC. The stipe scorched height (STSCARH) was obtained as early as the first week post-fire, and considered the maximum height of stipe carbonization by fire. STSCARH was 122 cm for Euterpe precatoria and 100 cm for the other species (Figure 5b). In some individuals the stipe was entirely charred after fire, and in these cases, the stipe scorched proportion (STSCAR) was 100%.
The estimator total leaf loss, complete canopy scorched (CNSCAR) is the final result of the sum of leaf consumption on the day of the experiment with the proportion of burned leaves in the five subsequent visits, adding leaves with totally burned limb and partially burned limb. In some cases, when leaves fell horizontally to the ground, they were quickly consumed by the fire upon contact, resulting in complete combustion. Canopy was complete scorched for 81% of the individuals after ~144 days of the experiment. Those with total leaf loss of less than 70% that did not resprout were classified as fire survivors.
3.2. Temperatures measured at the apical bud vary, but does not explain mortality
As the proportion of burnt stipe increases, more heat energy reaches the bud, by both internal and external conductive influence. Increasing the percentage of the stipe scorched proportion (STSCAR) positively influences the external (conduction of heat through the plume), and internal (conduction of heat through the stipe) heat flow in the bud temperature variation. Maximum temperature increase in the center of the apical bud (INCMAX), for all four species except Euterpe precatoria (n = 60), has a linear relationship with increasing proportion of stipe flaring plus increasing sum of temperatures at the base of the stipe (SUMT) (R2 = 0.53; l.g. = 2.50; F = 30.55; p < 0.001.) - Figure 6.
Also the sum of inside bud temperatures (SUMTG) as well as the mean bud temperature (TMEDG) has positive linear relationship with STSCAR + SUMT (R2 = 0.48 for both variables). Among the inside bud temperature variables, the maximum temperature increment is the best fit with respect to the increase in the proportion of stipe firing. However, neither INCMAX, nor the measurements of maximum temperature at the bud (TMAXG), mean temperature at the bud in 360 s (TMEDG), and summation of temperatures at the bud (SUMTG) has a relationship with total leaf burn (CNSCAR) or mortality of individuals, as will be described further.
3.3. Mortality and resprout vary among species, with diameter having a greater influence on mortality than height
The distribution of post-fire mortality varies among understory species (Kruskal-Wallis, H = 8.11; g.l.: 3; p = 0.044; n = 60). Hyospathe elegans (65%) and Chamaedorea pauciflora (55%) are the species with the highest number of stipes lost post-fire. Although Bactris maraja has a higher number of regrowing individuals (71.5%) compared to the other species, the difference between the amount of regrowing individuals is not significant (Kruskal-Wallis, H = 6.79; g.l.: 3; p = 0.079; n = 60). The same is true for survival (Kruskal-Wallis, H = 2.81; g.l.: 3; p = 0.421; n = 60) - Figure 7a.
With the death of the aerial part, the underground part of all sampled species, except E. precatoria, responded positively. After four months of the fire experiment, B. maraja had the highest number of basal shoots per individual (total shoots = 20; 1.43 ±1.5 shoots ind-1) and highest height of shoots (34.6 ±27.5 cm ind-1). Both the number of shoots per individual and the average height of shoots varied among species (Kruskal-Wallis, number of shoots: H = 8.1; l.g.: 3; p = 0.043; n = 60; height of shoots: H = 12.1; l.g.: 3; p = 0.007; n = 60) - Figure 7b.
For all species including E. precatoria, the characteristic exerting the greatest influence on stipe mortality is diameter at ground level (DS), not stipe height (Table 6). The total proportion of scorched canopy (CNSCAR) participates together with DS in explaining the mortality of the stipes of Bactris maraja, Chamaedorea pauciflora, Geonoma deversa and Hyospathe elegans (n = 60). Also for Euterpe precatoria (n = 25), CNSCAR plus DS explain the mortality of the stipes (Table 7). For all species, higher DS correlated with lower mortality, whereas stipe height and total height of individuals did not appear as significant variables in any of the tested models. And even though there is a positive influence of the stipe scorched proportion (STSCAR) on the increase in temperature in the apical bud, this temperature in the bud has no relationship with the mortality of the stipes. The non-significant models containing the variables of height and bud temperatures were excluded based on Generalized Linear Model (GLM) analysis.
The variables stipe scorched proportion (STSCAR), canopy scorched proportion (CNSCAR), in addition to the orthogonal distance from the sampled individual to the forest edge (DIST), and the minimum relative moisture, representing the microclimate at the time of the experiment (RHMIN), are significant. In the logistic regression using the significant variables from the GLM analysis, for the group of four species minus E. precatoria, five models appear as significant in explaining the mortality of the stipes (Table 6). The final model was number 2 and has the lowest AIC (Akaike's criterion): 32.08 and contains the variables canopy scorched proportion (CNSCAR), and diameter at ground height (DS).
An increase in the probability of mortality is conditioned by an increase in the proportion of leaf burn in smaller diameter plants (Figure 8a). The final model is significant when compared to the null model (intercept only) χ2 (2, n = 60) = 15.75; p < 0.001, and the predictive power of this regression is 88%. Analysis of the area under the ROC curve (area of 0.92; Table 6; Figure 8b) reinforces the determination of model 2 as the best fit to the data, with greater power to predict and explain the mortality of individuals of the four species.
The regression equation considering the significant variables in the final model is:
In calculating the probabilities derived from the equation, it is possible to estimate that for an individual of stipe with 5 cm diameter at the base, the probability of mortality is low (approximately 38%) even with 100% of the leaves affected by fire. For individuals with stipes ≈3 cm in diameter the probability of mortality is already 76% with 100% of the crown burned. For this same diameter but with half of the crown burned, the probability of death drops to 21%. In stipes close to 1 cm in diameter, the probability of mortality is always greater than 50%, regardless of the canopy burning conditions - Figure 9.
3.4. Euterpe precatoria mortality is defined by canopy scorch impact
Also for E. precatoria, canopy scorched proportion plus diameter of the base of the stipe are determinants of mortality of individuals. Other variables do not appear significant in the model construction and the final model is significant against the null (only the intercept) when χ2(2, n = 25) = 16.75, p < 0.001. This final model has 88% of the power to predict mortality and an AIC (Akaike's criterion) of 21.9 (Table 8). For mortality estimation of E. precatoria the logistic regression equation (Table 9) is:
This means that for an increase from 2 to 6 cm in diameter at the base of the stipe, considering an individual with 100% of burned leaves, the chance of mortality falls from 97% to only 15% respective to the diameter. On the other hand, with the canopy with only half of the leaves burned, this same ratio of 2 to 6 cm in diameter of the stipe, increases from 83% to 1%, respectively, of probability of death (Figure 10).
The final model that considers the proportion of scorched canopy (CNSCAR) is superior in quality of fit than the one that considers the proportion of stipe scorched height (STSCAR) as predictor. Although both are significant, model 2, with the CNSCAR variable has higher area under the ROC curve (Table 9): 0.90, higher than the 0.70 that means a good model fit for predicting Euterpe precatoria mortality.
Graphical analysis shows that at smaller diameters, diameter contributes minimally to the probability of mortality (Figure 11a). As the total proportion of scorched canopy is low, these same smaller diameters will have the highest probability of mortality, which will increase conditioned by the proportion of the canopy scorched, until a cut point near 4 cm diameter. At this point, even with high rates of leaf burning, the probability of death can be reduced by half. Those individuals that have the largest diameter at ground level (above 4 cm) and that still have part of the canopy unburned will survive.
Stipe height has some influence on the proportion of leaf burn. The higher the lower part of the leaf canopy (as measured by the height of the stipe or height of the base of the leaf lamina), the lower the proportion of burned leaves (R2 = 0.29; F1,23 = 11.24; n =25; p = 0.002) - Figure 11b. Although significant in protecting leaves from heat flux, neither stipe height nor total plant height are significant variables in the overall model and regression models that explain the mortality of the species.
E. precatoria does not regrow from the base like the other understory species sampled in this work. However, apical regrowth was verified, that is, the regrowth of the apical apex, which was accounted for when there were no more than 30% of green leaves in the canopy. In any case, the apical regrowth for this species started even when there were more than 30% of leaves in the canopy. Seven individuals responded to fire and leaf loss with apical regrowth (28%, n = 25), but only four of the 25 individuals sampled maintained apical regrowth up to four months post-fire (16% of individuals). No variable was found to significantly explain apical bud regrowth in E. precatoria.
4. Discussion
4.1. Fire and stipe survival
Post-fire plant survival is a recognized indicator of fire intensity, demonstrated by direct correlations between fire severity and mortality [26,36,45,58]. The present study addressed the limitations of this descriptor [26] by conducting an immediate post-fire assessment within one week of the event. Understanding survival as a measure of severity in a broader context, modeling survival and mortality is crucial for predicting future ecosystem changes [37,58,82]. Predictive models based on logistic regression serve as powerful tools for modeling post-fire mortality events [83]. These models are also employed in predicting mortality from other disturbances, such as wind [84] and natural mortality [85].
In this study, the models developed—both the general model for understory palms and the specific model for Euterpe precatoria—effectively predicted the mortality of these small-diameter palms when tested interchangeably and independently for each species. While it was anticipated that mortality would correlate with the extent of stipe burning, findings suggest that height plays a more significant role in mortality [49,86,87], contrary to expectations. Diameter emerged as the most critical morphological trait influencing post-fire plant mortality [37,82,88,89], with its relationship to crown burn helping to explain how understory palms succumb to fire.
Two primary hypotheses explain post-fire plant mortality, focusing on the immediate effects of burning (1st order processes). One hypothesis emphasizes heat flux, the duration of heat exposure, and critical temperatures [90], causing necrosis of cambium cells [34 for a review]. The other hypothesis highlights the impact on conductive tissues, rather than cambium, disrupting phloem conductivity due to heat flux from surface fires, affecting solute viscosity and functional tissue area [91].
Results indicate vertical heat transfer from the base to the apex of the plant, with some individuals experiencing a maximum temperature increase (maximum bud center temperature minus ambient temperature) of up to 30°C. In certain cases, bud center temperatures approached 50°C, potentially lethal for buds; however, some individuals showed bud regrowth despite temperature fluctuations (up to 30°C), indicating continued metabolic activity and survival. None of the bud temperature variables were significant in explaining mortality.
The relative importance of severity variables such as stem burn or canopy burn varies widely in the literature [37,92], with much research focused on temperate forest species. While canopy burning is often associated with bud death in studies assuming individuals are populations of meristems [37,93], this study did not confirm this. Even with over 70% of the canopy burned, sampled palms showed regrowth of meristematic apices, indicating minimal damage from heat flux at the base. Modeling canopy burn as indicative of bud death may not apply uniformly to monocotyledonous trees compared to dicotyledons.
The concept that greater diameter offers greater protection against fire holds true for small-diameter palms as well. Until now, no research has addressed experimental mortality of individuals < 10 cm in diameter in the Amazon. While it is understood that diameter is crucial for protection in dicotyledons, no studies have focused on palms. However, drawing a physiological parallel between palms and dicotyledons regarding diameter-influenced mortality requires addressing the anatomical structures of these two large groups. In woody dicotyledons, heat transfer is impeded or reduced by various histological barriers from the outside to the inside of the plant: phellem, phellogen, phelloderm, parenchyma, phloem, until reaching the cambium—these tissues collectively form the simplified concept of 'bark', which acts as an efficient anti-thermal shield of variable thickness [93].
In palms, the anatomical organization of tissues differs significantly. Bark, as found in dicotyledons, is absent, and the vascular system is organized into vascular bundles without ring tissues. These bundles are surrounded by tissue cells with thickened walls, often associated with abundant sclerenchymatous fibers of high specific hardness [94,95]. This anatomical arrangement provides palms with an advantage in protecting internal tissues compared to dicotyledons [93,94].
When palms and dicotyledons are exposed to the same heat flux, the anatomical structure of palms may provide them with a morphological advantage. In this study, individuals with a base diameter near 10 cm survived fire impacts, whereas other studies indicate nearly total mortality for dicotyledons with diameters ~20 cm subjected to fire [14,35,96]. To understand the advantage of palm stipe response compared to stems of similar diameter, the physiological processes leading to post-disturbance mortality must be considered.
The death of aerial plant parts under physiological stress is linked to reduced movement of water and nutrients from the soil [58,91,97,98]. Vascular system obstructions reduce water and nutrient movement [34], a phenomenon observed in palms as well [98]. Plant hydraulic failure occurs when transpiration water loss exceeds water uptake by roots [34]. In systems where soil moisture remains at field capacity, vascular system embolism can cause aerial part mortality due to leaf dehydration [34,36,97]. As carbohydrate utilization is closely tied to water transport, plant death results from combined carbohydrate support failure and physiological drought, with the time to death dependent on the balance between these processes [91,97,99].
The results indicate that mortality of small-diameter palm stipes results from two main processes: 1) leaf heating in the canopy contributing to dehydration; and 2) vascular system disruption due to temperature-induced cell coalescence [34,99]. Dehydration-induced leaf loss may exacerbate vascular system malfunction, or vice versa, resulting in water stress that impedes leaf recovery and normal physiological function.
Many understory palm species seem capable of regenerating leaves at adequate rates [100]. This suggests that post-fire mortality of the aerial parts in understory palms is primarily due to hydraulic system failure caused by the heat flux from surface fires reaching the stipe bases. To deepen understanding, physiological studies in palms should explore tissue water potential, utilization rates, access to carbohydrate reserves, and their potential links to osmoregulatory failure. Anatomical studies should consider tissue wall adaptations and deformations caused by temperature flux.
By employing a non-avoidance technique in fire ecology, this study advances the controlled use of fire for scientific purposes. By targeting fire specifically to research subjects—here, understory palms—the impact on neighboring plants is minimized, and better control over fire conditions is achieved. Metrics such as flame residence time, temperature peaks, and cumulative temperatures provide more suitable information for studying post-fire mortality than fire intensity alone. Translating fire intensity into fire severity is crucial for understanding fire impacts on ecosystems [26,88].
4.2. Fire and species resilience
This study demonstrated that understory palms can regrow after fire, though the rate and extent of regrowth vary among species. It was initially anticipated that Euterpe precatoria would not regrow due to its lack of clonability, unlike another species within the same genus, E. oleraceae. Nonetheless, unexpected regrowth at the apex occurred, suggesting that the sampled bud temperature was insufficient to suppress its activity and indicating a diameter threshold (more than 4 cm for this species) beyond which continued bud growth is possible.
Regrowth is considered a response to fire rather than an indicator of severity [26], analyzed as a species-specific characteristic linked to resilience within the ecosystem. In another study conducted in the Amazon, no significant differences were found between burned and unburned areas sampled three years post-fire for palms with a DBH between 10 and 20 cm [101]. Rapid regrowth of individuals can obscure assessments of post-fire mortality, as observed in the present study. Although there was substantial loss of aerial parts, regrowth was robust for Bactris maraja and Chamaedorea pauciflora, while Hyospathe elegans showed low regrowth and high mortality, with practically no survival.
Despite focusing on a diameter range smaller than most studies (< 10 cm) and assessing only four months post-fire, this study provides insights into the regeneration process through stipe regrowth. Understanding species resilience post-disturbance is crucial given current and projected global climate changes and increased pressure from forest logging [102,103,104]. Knowledge of species' abilities to recover post-disturbance provides an advantage in predicting their resilience under altered fire frequencies and regimes in the Amazon.
Understory palm species, particularly Bactris maraja and Chamaedorea pauciflora, may lose their aerial parts due to fire impact, but as indicated by the data, they exhibit significant individual recovery, highlighting species resilience in their environment. Changes in species distribution coupled with post-fire effects have been documented across various ecosystems [62], potentially facilitating the invasion of non-native species [105]. Low resilience observed in Hyospathe elegans and particularly in Euterpe precatoria suggests an increased risk of population decline for these species in forest edges susceptible to surface fires. The absence of basal regrowth in E. precatoria individuals after fire indicates that if the stem dies, the entire plant dies.
The findings are applicable for predicting species mortality under specific topographical and microclimatic conditions. While the study did not establish a direct relationship between mortality and low moisture or proximity to edges, microclimatic changes resulting from recurrent fires at edges or from global climate change [106] may heighten mortality risks and predictions for these species. The study serves as a comparative baseline for potential environmental changes and increased disturbances in ecosystems where these species reside. Further research is needed on tropical forest plant species to better understand species-specific risks and resilience to fire.
5. Conclusions
In conclusion, variable responses to low-intensity surface fires were observed in understory palm species. High stipe mortality was found to be expected, alongside observed regrowth rates, though survival outcomes varied. The proportion of scorched canopy emerged as a critical indicator for predicting stipe mortality across the species sampled in our study. Stipe mortality is primarily influenced by heat at the stipe base, where a larger diameter plays a more crucial role in preventing mortality than stipe height.
The findings underscore the resilience of certain understory palm species, such as Bactris maraja and Chamaedorea pauciflora, which exhibit robust regrowth following fire events. In contrast, species like Hyospathe elegans and particularly Euterpe precatoria are faced with significant challenges, with low regrowth rates and higher mortality post-fire. These insights are crucial for understanding the dynamics of fire impacts on tropical forest ecosystems, especially under changing environmental conditions. Further research is needed to refine our understanding of species-specific responses to fire and to inform conservation strategies aimed at preserving the biodiversity and resilience of these ecosystems.
Supplementary Materials
The following supporting information can be downloaded at: Preprints.org, Figure S1. Surface fire simulation images; Figure S2. Basal and apical resprouts (red arrows) of various palm species, four months after being subjected to the impact of experimental surface fire.
Funding
This research was funded by a post-graduate scholarship from Coordenação de Aperfeiçoamento de Pessoal de Nível Superior (CAPES), and financial support from Fundação de Amparo à Pesquisa do Acre (FAPAC - Edital FDCT/FUNTAC No2/2011).
Institutional Review Board Statement
The experiment followed the safety protocol for controlled burning and authorization was obtained through the Environmental Clearance Certificate no. 22/ 2012 from IMAC (Instituto de Meio Ambiente do Acre), ACRE.
Data Availability Statement
The original contributions presented in the study are included in the article, further inquiries can be directed to the corresponding author.
Acknowledgments
The author expresses gratitude to Mr. Darci Mendes for permitting the use of his land for this research. Special thanks to Ires Miranda, Gil Vieira, Juli Pausas, Bruno Moreira, Maria Cristina Souza, and Paulo Oliveira for their contributions throughout all phases of the study, and to Euler Nogueira for valuable comments that improved the manuscript. The author also acknowledges logistical support from Universidade Federal do Acre (Ufac), a post-graduate scholarship from Coordenação de Aperfeiçoamento de Pessoal de Nível Superior (CAPES), financial support from Fundação de Amparo à Pesquisa do Acre (FAPAC) for the study, and the indispensable assistance of fieldworkers during the research.
Conflicts of Interest
The author declare no conflicts of interest.
References
- Pausas, J.G.; Ribeiro, E. The global fire-productivity relationship. Glob Ecol Biogeogr 2013, 22, 728–736. [Google Scholar] [CrossRef]
- Alencar, A. A. C.; Solorzano, L. A.; Nepstad, D. C. Modeling forest understory fires in an eastern amazonias landscape. Ecolol Appl 2004, 14, 139–149. [Google Scholar] [CrossRef]
- Morton, D. C.; Le Page, Y.; DeFries, R.; Collatz, G. J.; Hurtt, G. C. Understorey fire frequency and the fate of burned forests in southern Amazonia. Philos Trans R Soc Lond B Biol Sci 2012, 368, 20120163. [Google Scholar] [CrossRef] [PubMed]
- Numata, I.; Silva, S. S.; Cochrane, M. A.; d'Oliveira, M. V. Fire and edge effects in a fragmented tropical forest landscape in the southwestern Amazon. For Ecol Manage, 2017, 401, 135–146. [Google Scholar] [CrossRef]
- Pivello, V. R.; Vieira, I.; Christianini, A. V.; Ribeiro, D. B.; da Silva Menezes, L.; Berlinck, C. N.; Melo, F.P.; Marengo, J.A.; Tornquist, C.G.; Tomas, W.M.; Overbeck, G. E. Understanding Brazil’s catastrophic fires: Causes, consequences and policy needed to prevent future tragedies. Perspect Ecol Conserv 2021, 19, 233–255. [Google Scholar] [CrossRef]
- Cano-Crespo, A.; Traxl, D.; Prat-Ortega, G.; Rolinski, S.; Thonicke, K. Characterization of land cover-specific fire regimes in the Brazilian Amazon. Reg Environ Change, 2023, 23, 19. [Google Scholar] [CrossRef]
- Cochrane, M.A.; Ryan, K.C. Fire and fire ecology: Concepts and principles. In: Tropical Fire Ecology. Springer Praxis Books. Springer, Berlin, Heidelberg, 2009. [CrossRef]
- Pausas, J. G.; Keeley, J. E. A Burning Story: The Role of Fire in the History of Life. BioScience 2009, 59, 593–601. [Google Scholar] [CrossRef]
- Keeley, J. E.; Pausas, J. G.; Rundel, P. W.; Bond, W. J.; Bradstock, R. A. Fire as an evolutionary pressure shaping plant traits. Trends Plan Sci 2011, 16, 1–6. [Google Scholar] [CrossRef] [PubMed]
- Bond, W. J.; Midgley, J. J. Fire and the Angiosperm Revolutions. Int J Plant Sci 2012, 173, 569–583. [Google Scholar] [CrossRef]
- Barlow, J.; Peres, C. A. Fire-mediated dieback and compositional cascade in an Amazonian forest. Philos Trans R Soc Lond B Biol Sci 2008, 363, 1787–1794. [Google Scholar] [CrossRef]
- Balch, J. K.; Nepstad, D. C.; Curran, L. M.; Brando, P. M.; Portela, O.; Guilherme, P.; Reuning-Scherer, J. D.; De Carvalho Jr., O. Size, species, and fire behavior predict tree and liana mortality from experimental burns in the Brazilian Amazon. For Ecol Manage 2011, 261, 68–77. [Google Scholar] [CrossRef]
- Brando, P. M.; Nepstad, D. C.; Balch, J. K.; Bolker, B.; Christman, M. C.; Coe, M.; Putz, F. E. Fire-induced tree mortality in a neotropical forest: the roles of bark traits, tree size, wood density and fire behavior. Glob Change Biol 2012, 18, 630–641. [Google Scholar] [CrossRef]
- Mandle, L.; Ticktin, T.; Zuidema, P. A. Resilience of palm populations to disturbance is determined by interactive effects of fire, herbivory and harvest. Journal of Ecology 2015, 103, 1032–1043. [Google Scholar] [CrossRef]
- Pontes-Lopes, A.; Silva, C. V.; Barlow, J.; Rincón, L. M.; Campanharo, W. A.; Nunes, C. A.; Almeida, C.T.; Silva Jr., C. H.L.; Cassol, H.L.G.; Dlagnol, R.; Stark, S.C.; Graça, P.M.L.A; Aragão, L. E. Drought-driven wildfire impacts on structure and dynamics in a wet Central Amazonian forest. Proc. R. Soc. B 2021, 288, 20210094. [Google Scholar] [CrossRef] [PubMed]
- East, A.; Hansen, A.; Armenteras, D.; Jantz, P.; Roberts, D. W. Measuring understory fire effects from space: Canopy change in response to tropical understory fire and what this means for applications of GEDI to tropical forest fire. Remote Sens, 2023, 15, 696. [Google Scholar] [CrossRef]
- Bowman, D.M.J.S.; Balch, J.; Artaxo, P.; Bond, W.J.; Cochrane, M.A.; Antonio, C.M.D.; Defries, R.; Johnston, F.H.; Keeley, J.E.; Krawchuk, M.A.; Kull, C.A.; Mack, M.; Moritz, M.A.; Pyne, S.; Roos, C.I.; Scott, A.C.; Sodhi, N.S.; Swetnam, T.W. The human dimension of fire regimes on Earth. J Biogeogr, 2011, 38, 2223–2236. [Google Scholar] [CrossRef] [PubMed]
- Lapola, D.M.; Pinho, P.; Barlow, J.; Aragão, L.E.O.C.; Berenguer, E.; Carmenta, R.; Liddy, H.M.; Seixas, H.; Silva, C.V.J.; Silva-Junior, C.H.L.; Alencar, A.A.C.; Anderson, L.O.; Armenteras P., D.; Brovkin, V.; Calders, K.; Chambers, J.; Chini, L.; Costa, M.H.; Faria, B.L.; Fearnside, P.M.; Ferreira, J.; Gatti, L.; Gutierrez-Velez, V.H.; Han, Z.; Hibbard, K.; Koven, C.; Lawrence, P.; Pongratz, J.; Portela, B.T.T.; Rounsevell, M.; Ruane, A.C.; Schaldach, R.; da Silva, S.S.; von Randow, C.; Walker, W.S. The drivers and impacts of Amazon forest degradation. Science, 2023, 379, eabp8622. [Google Scholar] [CrossRef]
- Prestes, N. C. C. D. S.; Massi, K. G.; Silva, E. A.; Nogueira, D. S.; de Oliveira, E. A.; Freitag, R. ,... & Feldpausch, T. R. Fire effects on understory forest regeneration in southern Amazonia. Front For Glob Change 2020, 3, 10. [Google Scholar]
- Uhl, C.; Kauffman, J.B.; Cummings, D.L. Fire in the Venezuelan Amazon 2: Environmental conditions Fire in the Venezuelan necessary for forest fires in the evergreen rainforest of Venezuela. Oikos 1988, 53, 176–184. [Google Scholar] [CrossRef]
- Driscoll, D.A.; Armenteras, D.; Bennett, A.F.; Brotons, L.; Clarke, M.F.; Doherty, T.S.; Haslem, A.; Kelly, L.T.; Sato, C.F.; Sitters, H.; Aquilué, N.; Bell, K.; Chadid, M.; Duane, A.; Meza-Elizalde, M.C.; Giljohann, K.M.; González, T.M.; Jambhekar, R.; Lazzari, J.; Morán-Ordóñez, A.; Wevill, T. How fire interacts with habitat loss and fragmentation. Biol. Rev., 2021, 96, 976–998. [Google Scholar] [CrossRef]
- Cochrane, M.; Alencar, A.; Schulze, M.; Souza, C.; Nepstad, D.; Lefebvre, P.; Davidson, E. Positive feedbacks in the fire dynamic of closed canopy tropical forests. Science 1999, 284, 1832–1835. [Google Scholar] [CrossRef] [PubMed]
- Fearnside, P. M. Brazil’s evolving proposal to control deforestation: Amazon still at risk. Environ Conserv https://www.jstor.org/stable/44520042. 2009, 36, 177. [Google Scholar] [CrossRef]
- Brando, P.M.; Balch, J.K.; Nepstad, D.C.; Morton, D.C.; Putz, F.E.; Coe, M.T.; Silvério, D.; Davidson, E.A.; Nóbrega, C.C.; Alencar, A.; Soares-Filho, B. S. Abrupt increases in Amazonian tree mortality due to drought–fire interactions. PNAS, 2014, 111, 6347–6352. [Google Scholar] [CrossRef] [PubMed]
- McLauchlan, K.K.; Higuera, P.E.; Miesel, J.; Rogers, B.M.; Schweitzer, J.; Shuman, J.K.; Tepley, A.J.; Varner, J.M.; Veblen, T.T.; Adalsteinsson, S.A.; Balch, J.K.; Baker, P.; Batllori, E.; Brando, P.; Crandall, R.; Harvey, B.J.; Kobziar, L.N.; Maezumi, S.Y.; Mearns, L.; Moritz, M.; Myers, J.A.; Pausas, J.G.; Pellegrini, A.F.A.; Platt, W.J.; Roozeboom, J.; Safford, H.; Santos, F.; Scheller, R.M.; Sherriff, R.L.; Smith, K.G.; Smith, M.D.; Watts, A.C. Fire as a fundamental ecological process: Research advances and frontiers. J Ecol, 2020, 108, 2047–2069. [Google Scholar] [CrossRef]
- Nimmo, D. G.; Andersen, A. N.; Archibald, S.; Boer, M. M.; Brotons, L.; Parr, C. L.; Tingley, M. W. Fire ecology for the 21st century. Divers Distrib, 2022, 28, 350–356. [Google Scholar] [CrossRef]
- Jaureguiberry, P.; Cuchietti, A.; Gorné, L. D.; Bertone, G. A.; Díaz, S. Post-fire resprouting capacity of seasonally dry forest species–Two quantitative indices. For Ecol Manage 2020, 473, 118267. [Google Scholar] [CrossRef]
- Keeley, J. E. Fire intensity, fire severity and burn severity: a brief review and suggested usage. Int J Wildland Fire, 2009, 18, 116–126. [Google Scholar] [CrossRef]
- Han, D.; Di, X.; Yang, G.; Sun, L.; Weng, Y. Quantifying fire severity: a brief review and recommendations for improvement. EHS, 2021, 7, 1973346. [Google Scholar] [CrossRef]
- Giorgis, M. A.; Zeballos, S. R.; Carbone, L.; Zimmermann, H.; von Wehrden, H.; Aguilar, R.; Ferreras, A.E.; Tecco, P.A.; Kowaljow, E.; Barri, F.; Gurvich, D.E.; Villagra, P.; Jaureguiberry, P. A review of fire effects across South American ecosystems: the role of climate and time since fire. Fire Ecol, 2021, 17, 1–20. [Google Scholar] [CrossRef]
- Simard, S. Fire Severity, Changing Scales, and How Things Hang Together. Int J Wildland Fire 1991, 1, 23. [Google Scholar] [CrossRef]
- Peres, C. A. Ground fires as agents of mortality in a Central Amazonian forest. J Trop Ecol 1999, 15, 535–541. [Google Scholar] [CrossRef]
- Mostacedo, B.; Fredericksen, T. S.; Gould, K. Responses of Community Structure and Composition to Wildfire in Dry and Subhumid Tropical Forests in Bolivia. JTFS 2001, 13, 488–502. [Google Scholar]
- Michaletz, S. T.; Johnson, E.A.; Tyree, M. T. Moving beyond the cambium necrosis hypothesis of post-fire tree mortality: cavitation and deformation of xylem in forest fires. New Phytol 2012, 194, 254–263. [Google Scholar] [CrossRef] [PubMed]
- Balch, J.K.; Massad, T.J.; Brando, P.M.; Nepstad, D.C.; Curran, L.M. Effects of high-frequency understorey fires on woody plant regeneration in southeastern Amazonian forests. Philos Trans R Soc Lond B Biol Sci 2013, 368, 20120157–20120157. [Google Scholar] [CrossRef] [PubMed]
- Uhl, C.; Kauffman, J.B. Deforestation, Fire Susceptibility, and Potential Tree Responses to Fire in the Eastern Amazon. Ecology 1990, 71, 437–449. [Google Scholar] [CrossRef]
- Michaletz, S.; Johnson, E. How forest fires kill trees: A review of the fundamental biophysical processes. Scand J For Res 2007, 22, 500–515. [Google Scholar] [CrossRef]
- Carvalho Jr, J.; Veras, C.A.G.; Alvarado, E.; Sandberg, D.; Leite, S.; Gielow, R.; Rabelo, E.; Santos, J. Understorey fire propagation and tree mortality on adjacent areas to an Amazonian deforestation fire. Int J Wildland Fire 2010, 19, 795–799. [Google Scholar] [CrossRef]
- Krieger Fo, C. G.; Bufacchi, P.; Veras, C.A.G. Physical model for surface forest fire predictions in Amazonia. In 7th Mediterranean Combustion Symposium, Sardinia, Italy (11 - 15 September 2011). https://www.combustion-institute.it/proceedings/MCS-7/papers/FE/FE-09.pdf.
- Lloret, F.; López-Soria, L. Resprouting of Erica multiflora after experimental fire treatments. J Veg Sci 1993, 4, 367–374. [Google Scholar] [CrossRef]
- Vanmantgem, P.; Schwartz, M. Bark heat resistance of small trees in Californian mixed conifer forests: testing some model assumptions. For Ecol Manage 2003, 178, 341–352. [Google Scholar] [CrossRef]
- Wright, B. R.; Clarke, P. J. Resprouting responses of Acacia shrubs in the Western Desert of Australia–fire severity, interval and season influence survival. Int J Wildland Fire 2007, 16, 317–323. [Google Scholar] [CrossRef]
- Stephan, K. , Miller, M. e Dickinson, M. B. First-order fire effects on herbs and shrubs: present knowledge and modeling needs. Fire Ecol 2010, 6, 95–114. [Google Scholar] [CrossRef]
- Fachin, P. A.; Thomaz, E. L. Fire severity in slash-and-burn agriculture in southern Brazil: an overview. Sci Agric, 2023, 80, e20220042. [Google Scholar] [CrossRef]
- Flores, B. M.; Holmgren, M. Why forest fails to recover after repeated wildfires in Amazonian floodplains? Experimental evidence on tree recruitment limitation. Journal of Ecology 2021, 109, 3473–3486. [Google Scholar] [CrossRef]
- Woolley, T.; Shaw, D.C.; Ganio, L.M.; Fitzgerald, S. A review of logistic regression models used to predict post-fire tree mortality of western North American conifers. Int J Wildland Fire 2012, 21, 1–35. [Google Scholar] [CrossRef]
- Stephens, S. L.; Finney, M. A. Prescribed fire mortality of Sierra Nevada mixed conifer tree species: effects of crown damage and forest floor combustion. For Ecol Manage 2002, 162, 261–271. [Google Scholar] [CrossRef]
- Stevens-Rumann, C.S.; Morgan, P. Tree regeneration following wildfires in the western US: a review. Fire Ecol, 2019, 15, 1–17. [Google Scholar] [CrossRef]
- Hoffmann, W.; Solbrig, O.T. The role of topkill in the differential response of savanna woody species to fire. For Ecol Manage, 2003, 180, 273–286. [Google Scholar] [CrossRef]
- Silva-Matos, D. M.; Fonseca, G. D.; Silva-Lima, L. Differences on post-fire regeneration of the pioneer trees Cecropia glazioui and Trema micrantha in a lowland Brazilian Atlantic Forest. Rev Biol Trop 2005, 53, 01–04. [Google Scholar]
- Cirne, P.; Miranda, H.S. Effects of prescribed fires on the survival and release of seeds of Kielmeyera coriacea (Spr.) Mart. (Clusiaceae) in savannas of Central Brazil. Braz J Plant Physiol 2008, 20, 197–204. [Google Scholar] [CrossRef]
- Otterstrom, S. M.; Schwartz, M. W.; Velázquez-Rocha, I. Responses to Fire in Selected Tropical Dry Forest Trees. Biotropica 2006, 38, 592–598. [Google Scholar] [CrossRef]
- Oliveira, M.V.N.; Alvarado, E.C.C.; Santos, J.C.; Carvalho Jr., J. A. Forest natural regeneration and biomass production after slash and burn in a seasonally dry forest in the Southern Brazilian Amazon. For Ecol Manage 2011, 261, 1490–1498. [Google Scholar] [CrossRef]
- Fontenele, H. G.; Miranda, H. S. Fire has contrasting effects on the survival, growth, and reproduction of Cerrado grasses with differing regenerative strategies. Applied Vegetation Science, 2024, 27, e12775. [Google Scholar] [CrossRef]
- Gawryszewski, F. M.; Sato, M. N.; & Miranda, H. S.; Miranda, H.S. Frequent fires alter tree architecture and impair reproduction of a common fire-tolerant savanna tree. Plant Biology 2020, 22, 106–112. [Google Scholar] [CrossRef] [PubMed]
- Bär, A.; Michaletz, S. T.; Mayr, S. Fire effects on tree physiology. New Phytol, 2019, 223, 1728–1741. [Google Scholar] [CrossRef] [PubMed]
- Pinard, M. A.; Huffman, J. Fire resistance and bark properties of trees in a seasonally dry forest in eastern Bolivia. Journal of Tropical Ecology 1997, 13, 727–740. [Google Scholar] [CrossRef]
- Dickman, L.T.; Jonko, A.K.; Linn, R.R.; Altintas, I.; Atchley, A.L.; Bär, A.; Collins, A.D.; Dupuy, J.-L.; Gallagher, M.R.; Hiers, J.K.; Hoffman, C.M.; Hood, S.M.; Hurteau, M.D.; Jolly, W.M.; Josephson, A.; Loudermilk, E.L.; Ma, W.; Michaletz, S.T.; Nolan, R.H.; O’Brien, J.J.; Pimont, F.; Díos, V.R.; Restaino, J.; Robbins, Z.J.; Sartor, K.A.; Shultz-Fellenz, E.; Serbin, S.P.; Sevanto, S.; Shuman, J.K.; Sieg, C.H.; Skowronski, N.S.; Weise, D.R.; Wright, M.; Xu, C.; Yebra, M.; Younes, N. Integrating plant physiology into simulation of fire behavior and effects. New Phytologist, 2023, 238, 952–970. [Google Scholar] [CrossRef]
- Han, D. X.; Wei, R.; Wang, X. H.; Cong, R. Z.; Di, X.Y.; Yang, G.; Cai, H.; Zhang, J.L. Progress on the mechanisms and influencing factors of tree mortality caused by forest fire: a review. Scientia Silvae Sinicae, 2020, 151–162. [Google Scholar] [CrossRef]
- Kobziar, L. N.; Hiers, J. K.; Belcher, C. M.; Bond, W. J.; Enquist, C. A.; Loudermilk, E. L.; Miesel, J. R.; O’Brien, J. J.; Pausas, J. G.; Hood, S.; Keane, R.; Morgan, P.; Pingree, M. R. A.; Riley, K.; Safford, H.; Seijo, F.; Varner, J. M.; Wall, T.; Watts, A. Principles of fire ecology. Fire Ecol, 2024, 20, 39. [Google Scholar] [CrossRef]
- Clarke, P. J.; Lawes, M. J.; Midgley, J. J.; Lamont, B. B.; Ojeda, F.; Burrows, G. E.; Enright, N.J.; Knox, K. J. E. Resprouting as a key functional trait: how buds, protection and resources drive persistence after fire. New Phytol, 2013, 197, 19–35. [Google Scholar] [CrossRef] [PubMed]
- Keeley, J. E.; Pausas, J.G. Evolutionary ecology of fire. Annu Rev Ecol Evol Syst, 2022, 53, 203–25. [Google Scholar] [CrossRef]
- Butler, B. W.; Dickinson, M. B. Tree Injury and Mortality in Fires: Developing Process-Based Models. Fire Ecol 2010, 6, 55–79. [Google Scholar] [CrossRef]
- Smith, K.T.; Sutherland, E.K. Terminology and biology of fire scars in selected central hardwoods. Tree-Ring Research 2001, 57, 141–147. [Google Scholar]
- Wuschke, M. Fire Resistance in a Queensland Livistona. Palms (Principes) 1999, 43, 140–144. [Google Scholar]
- Bicalho, E. M.; Rosa, B. L.; Souza, A. E. D.; Rios, C. O. , & Pereira, E. G. Do the structures of macaw palm fruit protect seeds in a fire-prone environment? Acta Bot Bras, 2016, 30, 540–548. [Google Scholar] [CrossRef]
- Liesenfeld, M.V.A.; Vieira, G. Brote posfuego de la palma en el bosque amazónico:¿ son los tallos subterráneos una ventaja? Perspectivas Rurales: Nueva Época 2018, 16, 11–23. [Google Scholar] [CrossRef]
- Noblick, L.; Wintergerst, S.; Noblick, D.; Lima, J.T. . Syagrus coronata (Arecaceae) phenology and the impact of fire on survival and reproduction of the licuri palm. SITIENTIBUS C Biol 2020, 20. [Google Scholar] [CrossRef]
- Mesquita, C.C. O clima do estado do Acre. SECTMA, Rio Branco, Acre, Brazil, 1996; 57p.
- Governo do Estado do Acre. Zoneamento Ecológico Econômico do Acre. Fase III, Volumes, 1(2). Governo do Estado do Acre, Rio Branco, Acre, 2011; 160pp.
- Daly, D. C.; Silveira, M. Flora do Acre, Brasil. EDUFAC, Rio Branco, Acre, Brazil, 2008; 555p.
- Fiaschi, P.; Pirani, J. R. Review of plant biogeographic studies in Brazil. JSE 2009, 47, 477–496. [Google Scholar] [CrossRef]
- Baker, W.J.; Couvreur, T. L. P. Global biogeography and diversification of palms sheds light on the evolution of tropical lineages. II. Diversification history and origin of regional assemblages. J Biogeogr, 2013, 40, 286–298. [Google Scholar] [CrossRef]
- Balick, M. J.; Anderson, A. B.; Silva, M.F. Palm taxonomy in brasilian Amazônia: the state of systematic collections in regional herbaria. Brittonia, 1982, 34, 463. [Google Scholar] [CrossRef]
- Dransfield, J.; Uhl, N. W.; Asmussen, C. B.; Baker, W. J.; Harley, M. M.; Lewis, C. E. A new phylogenetic classification of the palm family, Arecaceae. Kew Bulletin http://www.jstor.org/stable/25070242. 2005, 60, 559–569. [Google Scholar]
- Pintaud, J.; Galeano, G.; Balslev, H.; Bernal, R.; Borchsenius, F.; Ferreira, E.; Granville, J. De; Mejía, K.; Millán, B.; Moraes, M.; Noblick, L.; Stauffer, F.W.; Kahn, F. Las palmeras de América del Sur: diversidad, distribución e historia evolutiva. Rev Peru Biol, https://www.redalyc.org/articulo.oa?id=195020250003. 2008, 15, 007–029. [Google Scholar] [CrossRef]
- Medeiros, H.; Obermuller, F.A.; Daly, D.; Silveira, M.; Castro, W.; Forzza, R.C. Botanical advances in Southwestern Amazonia: The flora of Acre (Brazil) five years after the first Catalogue. Phytotaxa, 2014, 177, 101–117. [Google Scholar] [CrossRef]
- Bufacchi, P.; Santos, J. C.; de Carvalho, J. A.; Krieger Filho, G. C. Estimation of the surface area-to-volume ratios of litter components of the Brazilian rainforest and their impact on litter fire rate of spread and flammability. J Braz. Soc. Mech. Sci. Eng. 2020, 42, 266. [Google Scholar] [CrossRef]
- Hosmer, D.W.; Lemeshow, S. Hosmer, D.W.; Lemeshow, S. Applied logistic regression. John Wiley & Sons, New York, 2013; 511pp.
- Symonds, M. R.; Moussalli, A. A brief guide to model selection, multimodel inference and model averaging in behavioural ecology using Akaike’s information criterion. Behav Ecol Sociobiol, 2011, 65, 13–21. [Google Scholar] [CrossRef]
- Pearce, J.; Ferrier, S. Evaluating the predictive performance of habitat models developed using logistic regression. Ecol Modell 2000, 133, 225–245. [Google Scholar] [CrossRef]
- Plumanns-Pouton, E.; Swan, M.; Penman, T.; Kelly, L. T. Using plant functional types to predict the influence of fire on species relative abundance. Biol Conserv, 2024, 292, 110555. [Google Scholar] [CrossRef]
- Hwang, K.; Kang, W.; Jung, Y. Application of the class-balancing strategies with bootstrapping for fitting logistic regression models for post-fire tree mortality in South Korea. Environmental and Ecological Statistics, 2023, 30, 575–598. [Google Scholar] [CrossRef]
- Jalkanen, A.; Mattila, U. Logistic regression models for wind and snow damage in northern Finland based on the National Forest Inventory data. For Ecol Manage 2000, 135, 315–330. [Google Scholar] [CrossRef]
- Chao, K. J.; Phillips, O. L.; Gloor, E.; Monteagudo, A.; Torres-Lezama, A.; Martínez, R.V. Growth and wood density predict tree mortality in Amazon forests. J Ecol 2008, 96, 281–292. [Google Scholar] [CrossRef]
- Higgins, S.I.; Bond, W.J.; Trollope, W.S.W. Fire, resprouting and variability: a recipe for grass-tree coexistence in savanna. J Ecol 2000, 88, 213–229. [Google Scholar] [CrossRef]
- Scalon, M.C.; Domingos, F.M.C.B.; Cruz, W.J.A.; Marimon Júnior, B. H.; Marimon, B.S.; Oliveras, I. Diversity of functional trade-offs enhances survival after fire in Neotropical savanna species. Journal of Vegetation Science, 2020, 31, 139–150. [Google Scholar] [CrossRef]
- Hood, S. M.; Varner, J. M.; Van Mantgem, P.; Cansler, C. A. Fire and tree death: understanding and improving modeling of fire-induced tree mortality. Environ Res Lett 2018, 13, 113004. [Google Scholar] [CrossRef]
- Carrillo-García, C.; Hernando, C.; Díez, C.; Guijarro, M. , Madrigal, J. Severity, Logging and Microsite Influence Post-Fire Regeneration of Maritime Pine. Fire, 2024, 7, 125. [Google Scholar] [CrossRef]
- Marchin, R. M.; Backes, D.; Ossola, A.; Leishman, M. R.; Tjoelker, M. G.; Ellsworth, D. S. Extreme heat increases stomatal conductance and drought-induced mortality risk in vulnerable plant species. Glob Change Biol, 2022, 28, 1133–1146. [Google Scholar] [CrossRef] [PubMed]
- Partelli-Feltrin, R.; Smith, A. M.; Adams, H. D.; Thompson, R. A.; Kolden, C. A.; Yedinak, K. M.; Johnson, D. M. Death from hunger or thirst? Phloem death, rather than xylem hydraulic failure, as a driver of fire-induced conifer mortality. New Phytol, 2023, 237, 1154–1163. [Google Scholar] [CrossRef] [PubMed]
- Nolan, R. H.; Blackman, C. J.; de Dios, V. R.; Choat, B.; Medlyn, B. E.; Li, X.; Bradstock, R.A.; Boer, M.M. Linking forest flammability and plant vulnerability to drought. Forests, 2020, 11, 779. [Google Scholar] [CrossRef]
- Gill, A. M. Stems and fires. In: Plant stems: physiology and functional morphology. Gartner, B. L. (Eds). Academic Press, New York, 1995; 323–342.
- Tomlinson, P. B. The uniqueness of palms. Bot J Linn 2006, 64, 599–14. [Google Scholar] [CrossRef]
- Thomas, R.; De Franceschi, D. Palm stem anatomy and computer-aided identification: The Coryphoideae (Arecaceae). Am J Bot 2013, 100, 289–313. [Google Scholar] [CrossRef] [PubMed]
- Ivanauskas, N. M.; Monteiro, R.; Rodrigues, R.R. Alterations following a fire in a forest community of Alto Rio Xingu. For Ecol Manage 2003, 184, 239–250. [Google Scholar] [CrossRef]
- Bova, A.S.; Dickinson, M.B. Linking surface-fire behavior, stem heating, and tissue necrosis. Can J For Res, 2005, 35, 814–822. [Google Scholar] [CrossRef]
- Carlquist, S. Monocot xylem revisited: new information, new paradigms. Bot Rev 2012, 78, 87–153. [Google Scholar] [CrossRef]
- Hoffmann, W.A.; Sherry, C.D.K; Donnelly, T.M. Stem heating results in hydraulic dysfunction in Symplocos tinctoria: implications for post-fire tree death, Tree Physiology. 2024, 44. Issue 3, March 2024, tpae023. [Google Scholar] [CrossRef]
- Anten, N. P.; Martínez-Ramos, M.; Ackerly, D. D. Defoliation and growth in an understory palm: quantifying the contributions of compensatory responses. Ecology, 2003, 84, 2905–2918. [Google Scholar] [CrossRef]
- Barlow, J.; Silveira, J.M.; Mestre, L.A.M.; Andrade, R.B.; Andrea, G.C.D.; Cochrane, M.A.; Louzada, J.; Vaz-de-mello, F. Z.; Numata, I. Wildfires in Bamboo-Dominated Amazonian Forest: Impacts on Above-Ground Biomass and Biodiversity. PLoS One 2012, 7, e33373. [Google Scholar] [CrossRef] [PubMed]
- Ibáñez, I.; Acharya, K.; Juno, E.; Karounos, C.; Lee, B. R.; McCollum, C.; Schaffer-Morrison, S.; Tourville, J. Forest resilience under global environmental change: Do we have the information we need? A systematic review. PLoS One, 2019, 14, e0222207. [Google Scholar] [CrossRef] [PubMed]
- Strickland, M. K.; Jenkins, M. A.; Ma, Z.; Murray, B. D. How has the concept of resilience been applied in research across forest regions? Front Ecol Environ, 2024, 22, e2703. [Google Scholar] [CrossRef]
- Andrade, D.F.C.; Ruschel, A.R.; Schwartz, G. , de Carvalho, J.O.P.; Humphries, S.; Gama, J.R.V. Forest resilience to fire in eastern Amazon depends on the intensity of pre-fire disturbance. For Ecol Manage, 2020, 472, 118258. [Google Scholar] [CrossRef]
- Faria, B. L.; Staal, A.; Silva, C. A.; Martin, P. A.; Panday, P. K.; Dantas, V. L. Climate change and deforestation increase the vulnerability of Amazonian forests to post-fire grass invasion. Glob Ecol Biogeogr, 2021, 30, 2368–2381. [Google Scholar] [CrossRef]
- Abbass, K.; Qasim, M. Z.; Song, H.; Murshed, M.; Mahmood, H.; Younis, I. A review of the global climate change impacts, adaptation, and sustainable mitigation measures. ESPR, 2022, 29, 42539–42559. [Google Scholar] [CrossRef] [PubMed]
Figure 1.
Location map showing the state of Acre in Brazil (right map), and the approximate location of the study area in the western part of the state (black lozenge with a red border) - (7o45’ S e 72o22’ W).
Figure 1.
Location map showing the state of Acre in Brazil (right map), and the approximate location of the study area in the western part of the state (black lozenge with a red border) - (7o45’ S e 72o22’ W).
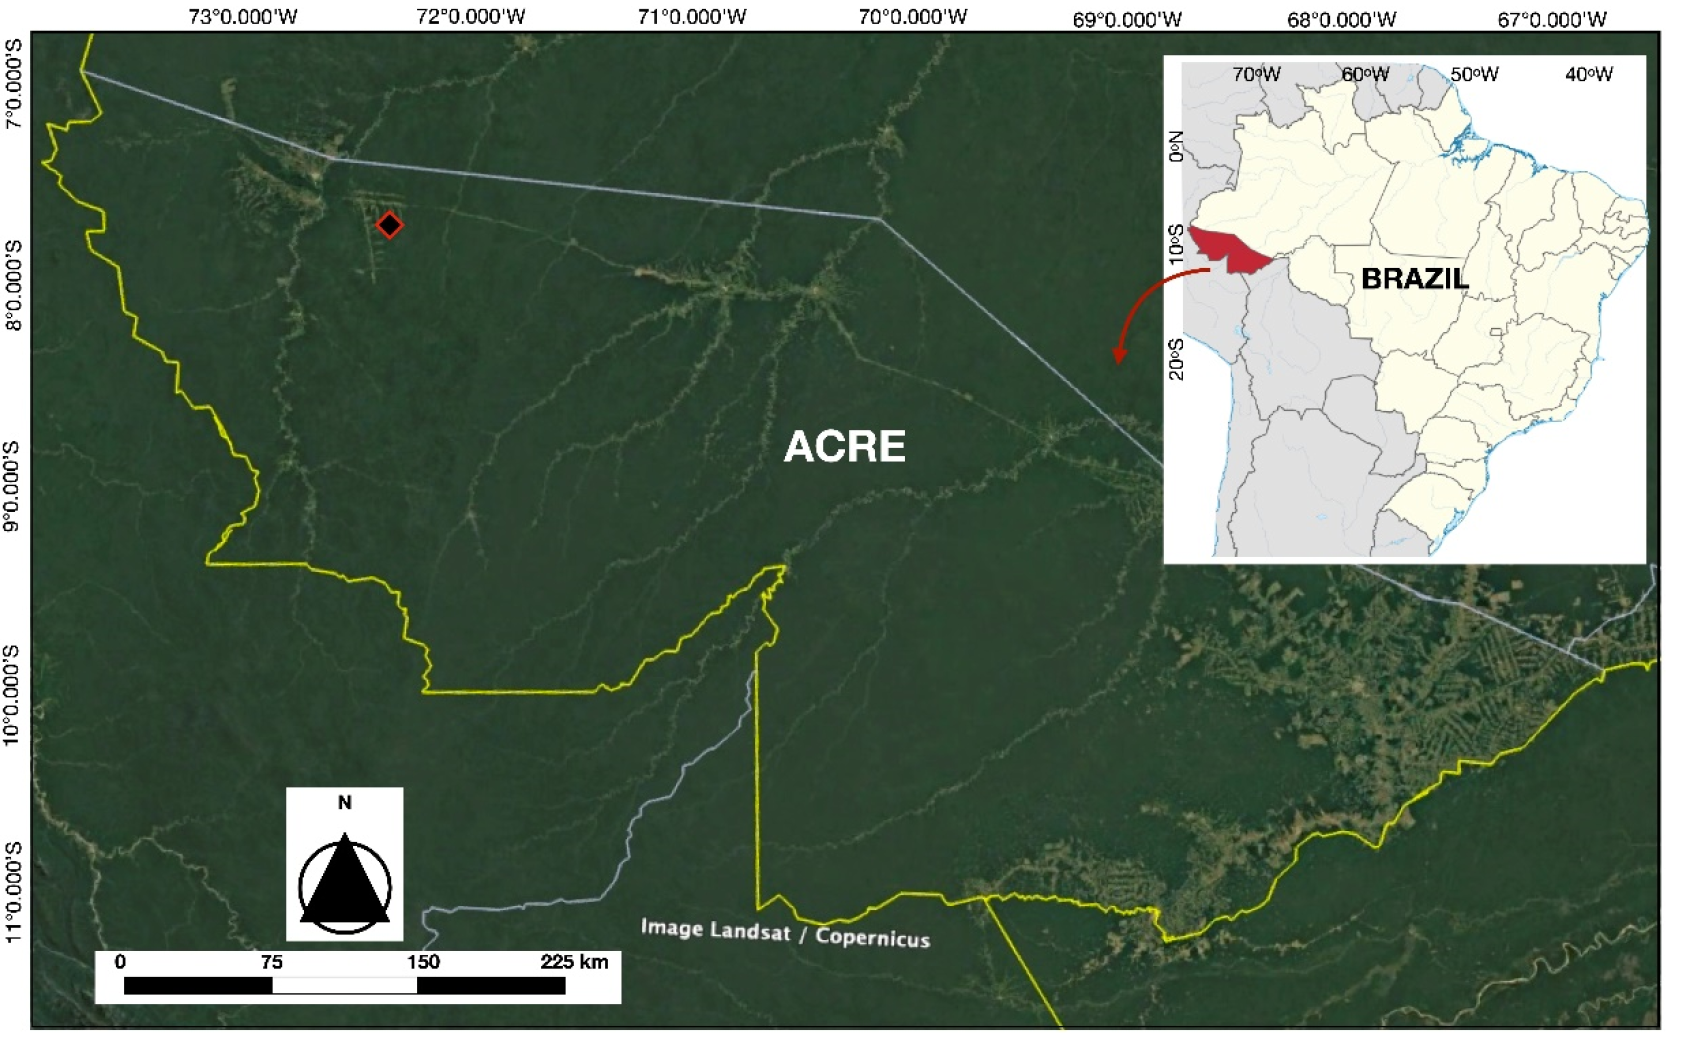
Figure 2.
Climatological profile for Acre state, for the period between January and December 2013, with the averages of temperature, moisture, and accumulated monthly precipitation. Source: National Institute of Meteorology database (OMM: 82704).
Figure 2.
Climatological profile for Acre state, for the period between January and December 2013, with the averages of temperature, moisture, and accumulated monthly precipitation. Source: National Institute of Meteorology database (OMM: 82704).
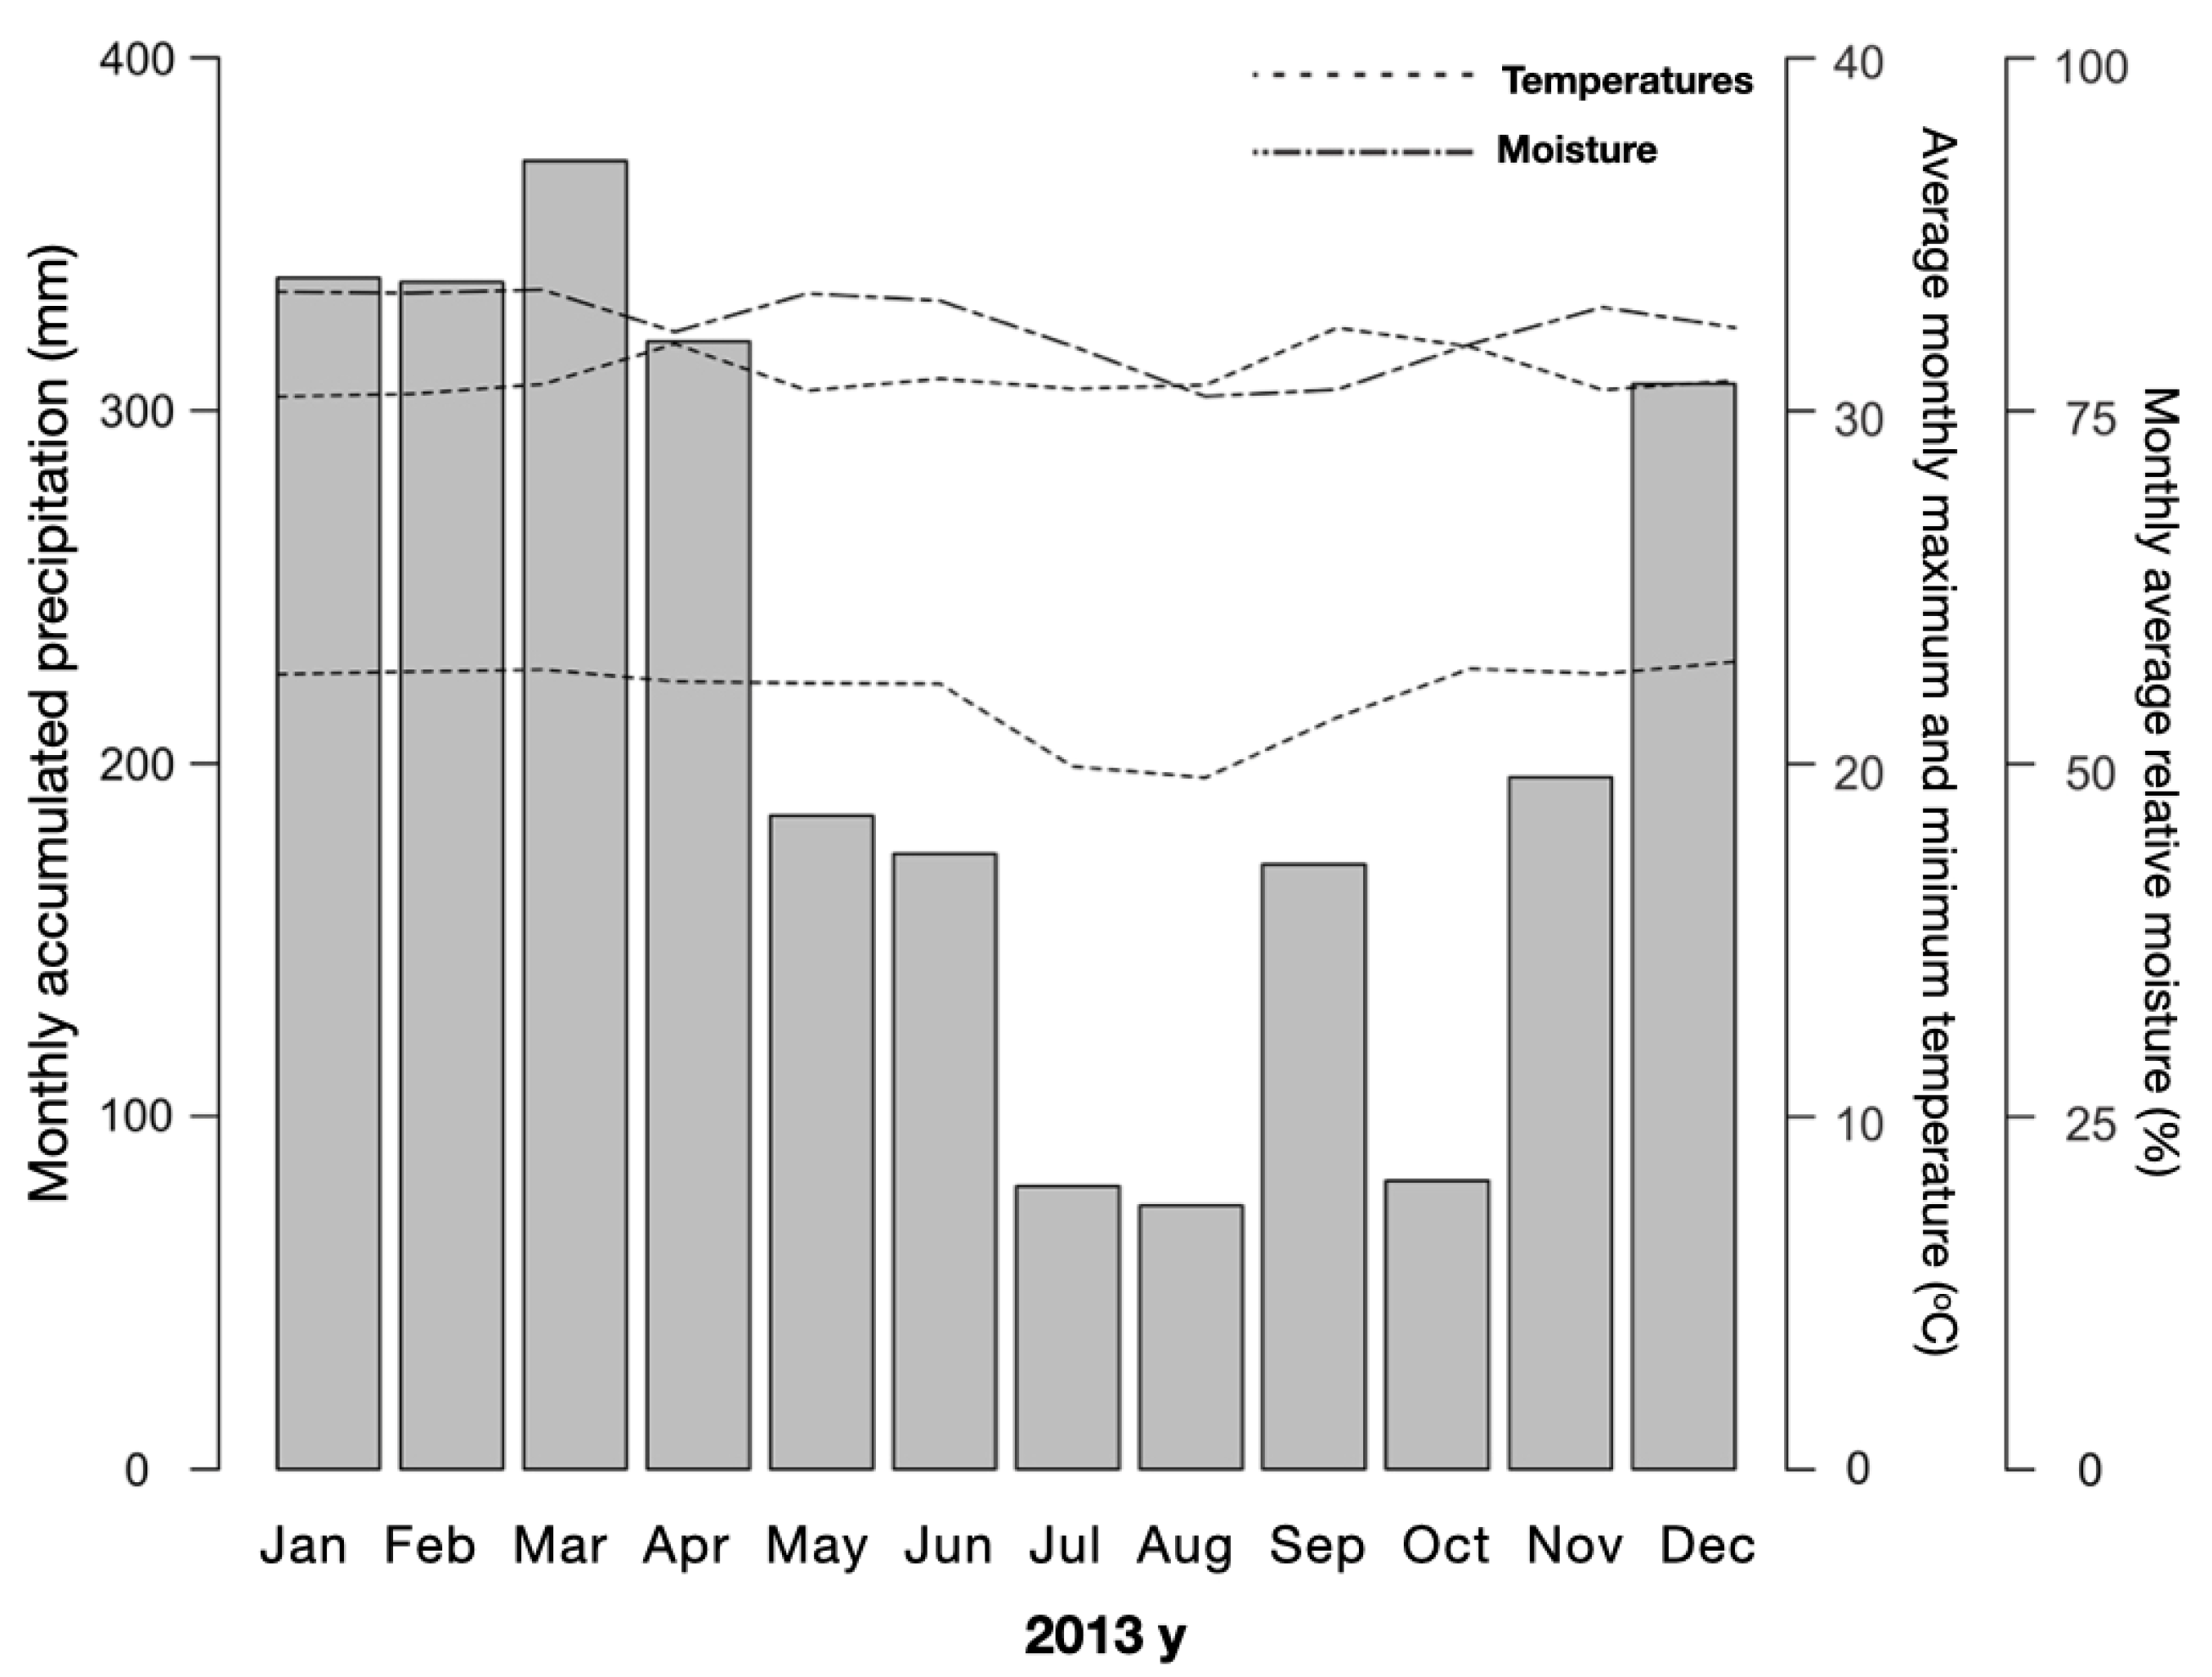
Figure 3.
Schematic of the surface fire simulation experiment in the understory of an Amazonian forest in western Acre, Brazil.surface fire simulation experiment in the understory of an Amazonian forest in western Acre, Brazil. (a) Temperatures recording method: 1) four-channel datalogger; 2) sensor TK1 ambient temperature; 3) sensor TK2 of the plant apex (inside the bud); 4) sensor TK3 of the plant base: 10 cm above ground and 5 cm from the stipe surface; (b) Top view with the 1m2 burning area; the 1m circular limit of the safety firebreak boundary and the pattern for ignition of the fire.
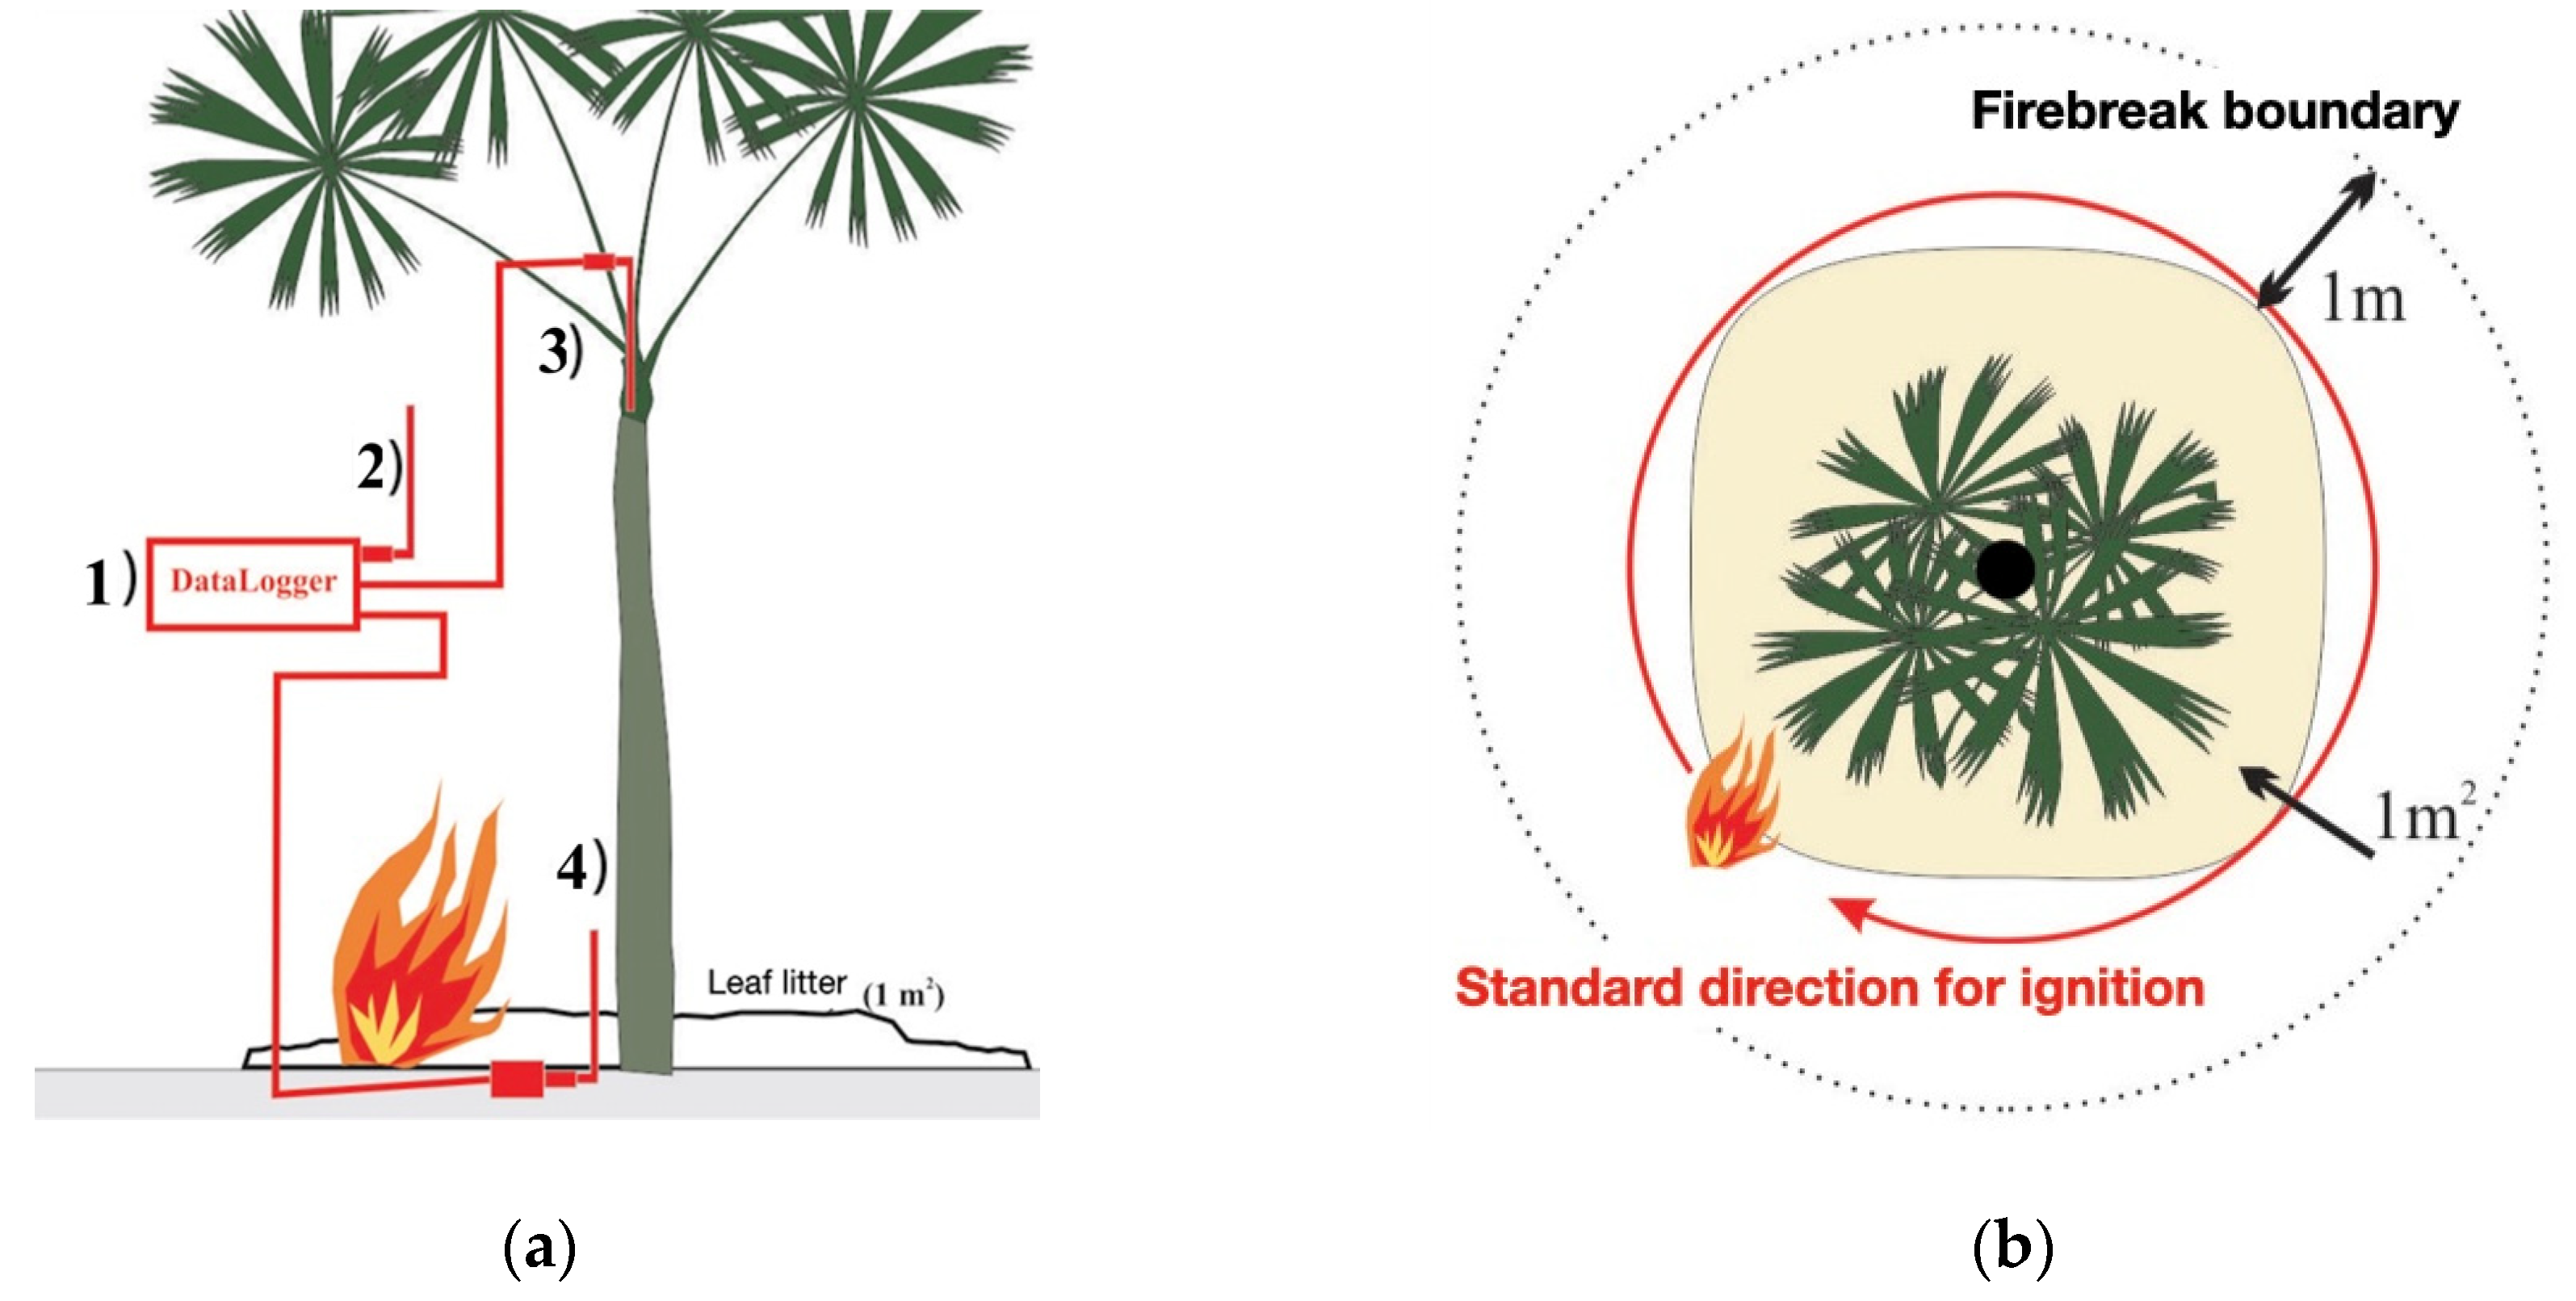
Figure 4.
Microclimatic data measured near the sampling units on the days of the surface fire simulation experiment in the understory of an Amazonian forest in western Acre, Brazil, in August, September and October 2013. Values refer to the midday period: between 11:00 am and 5:00 pm.
Figure 4.
Microclimatic data measured near the sampling units on the days of the surface fire simulation experiment in the understory of an Amazonian forest in western Acre, Brazil, in August, September and October 2013. Values refer to the midday period: between 11:00 am and 5:00 pm.
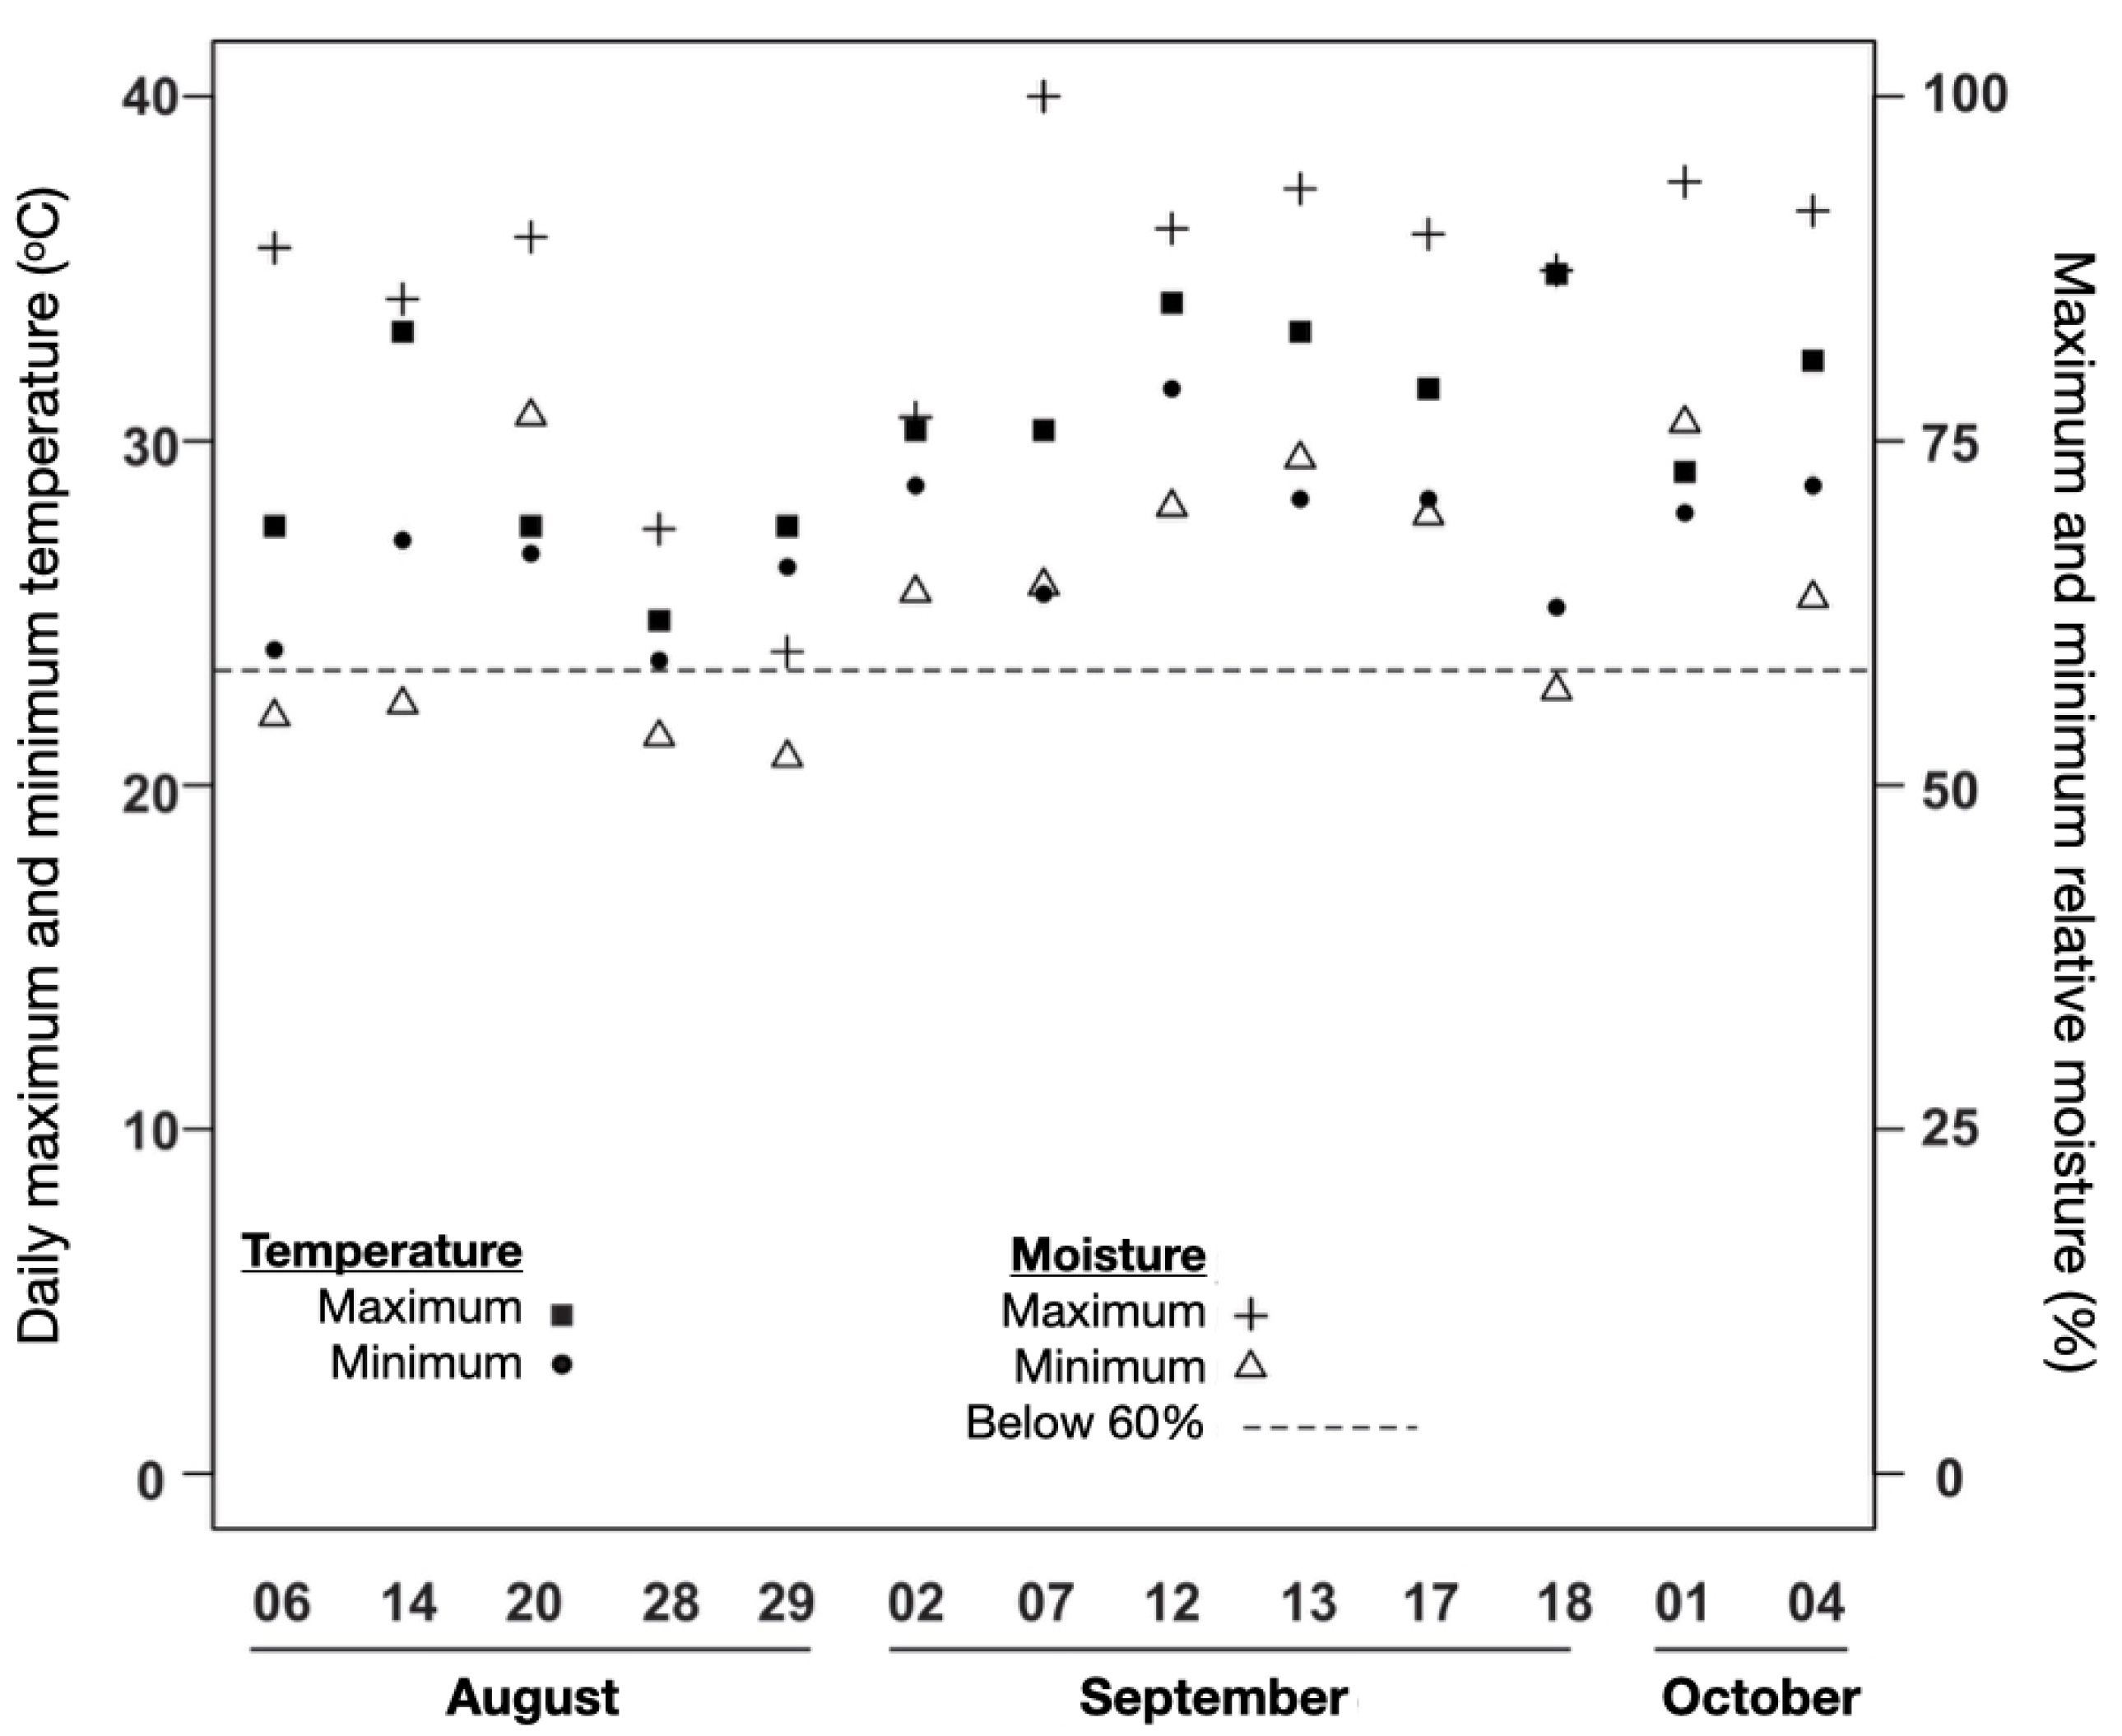
Figure 5.
(a) Time-temperature history measured with the TK3 sensor for all sampled individuals, showing average (TMED) and temperature range, and 150 s interval (flame extinction stage); (b) Distribution of stipe heights (SH) and maximum stipe scorched heights (STSCARH), per sampled individual of the five species (n = 85) from the surface fire simulation experiment in the understory of an Amazonian forest in western Acre, Brazil.
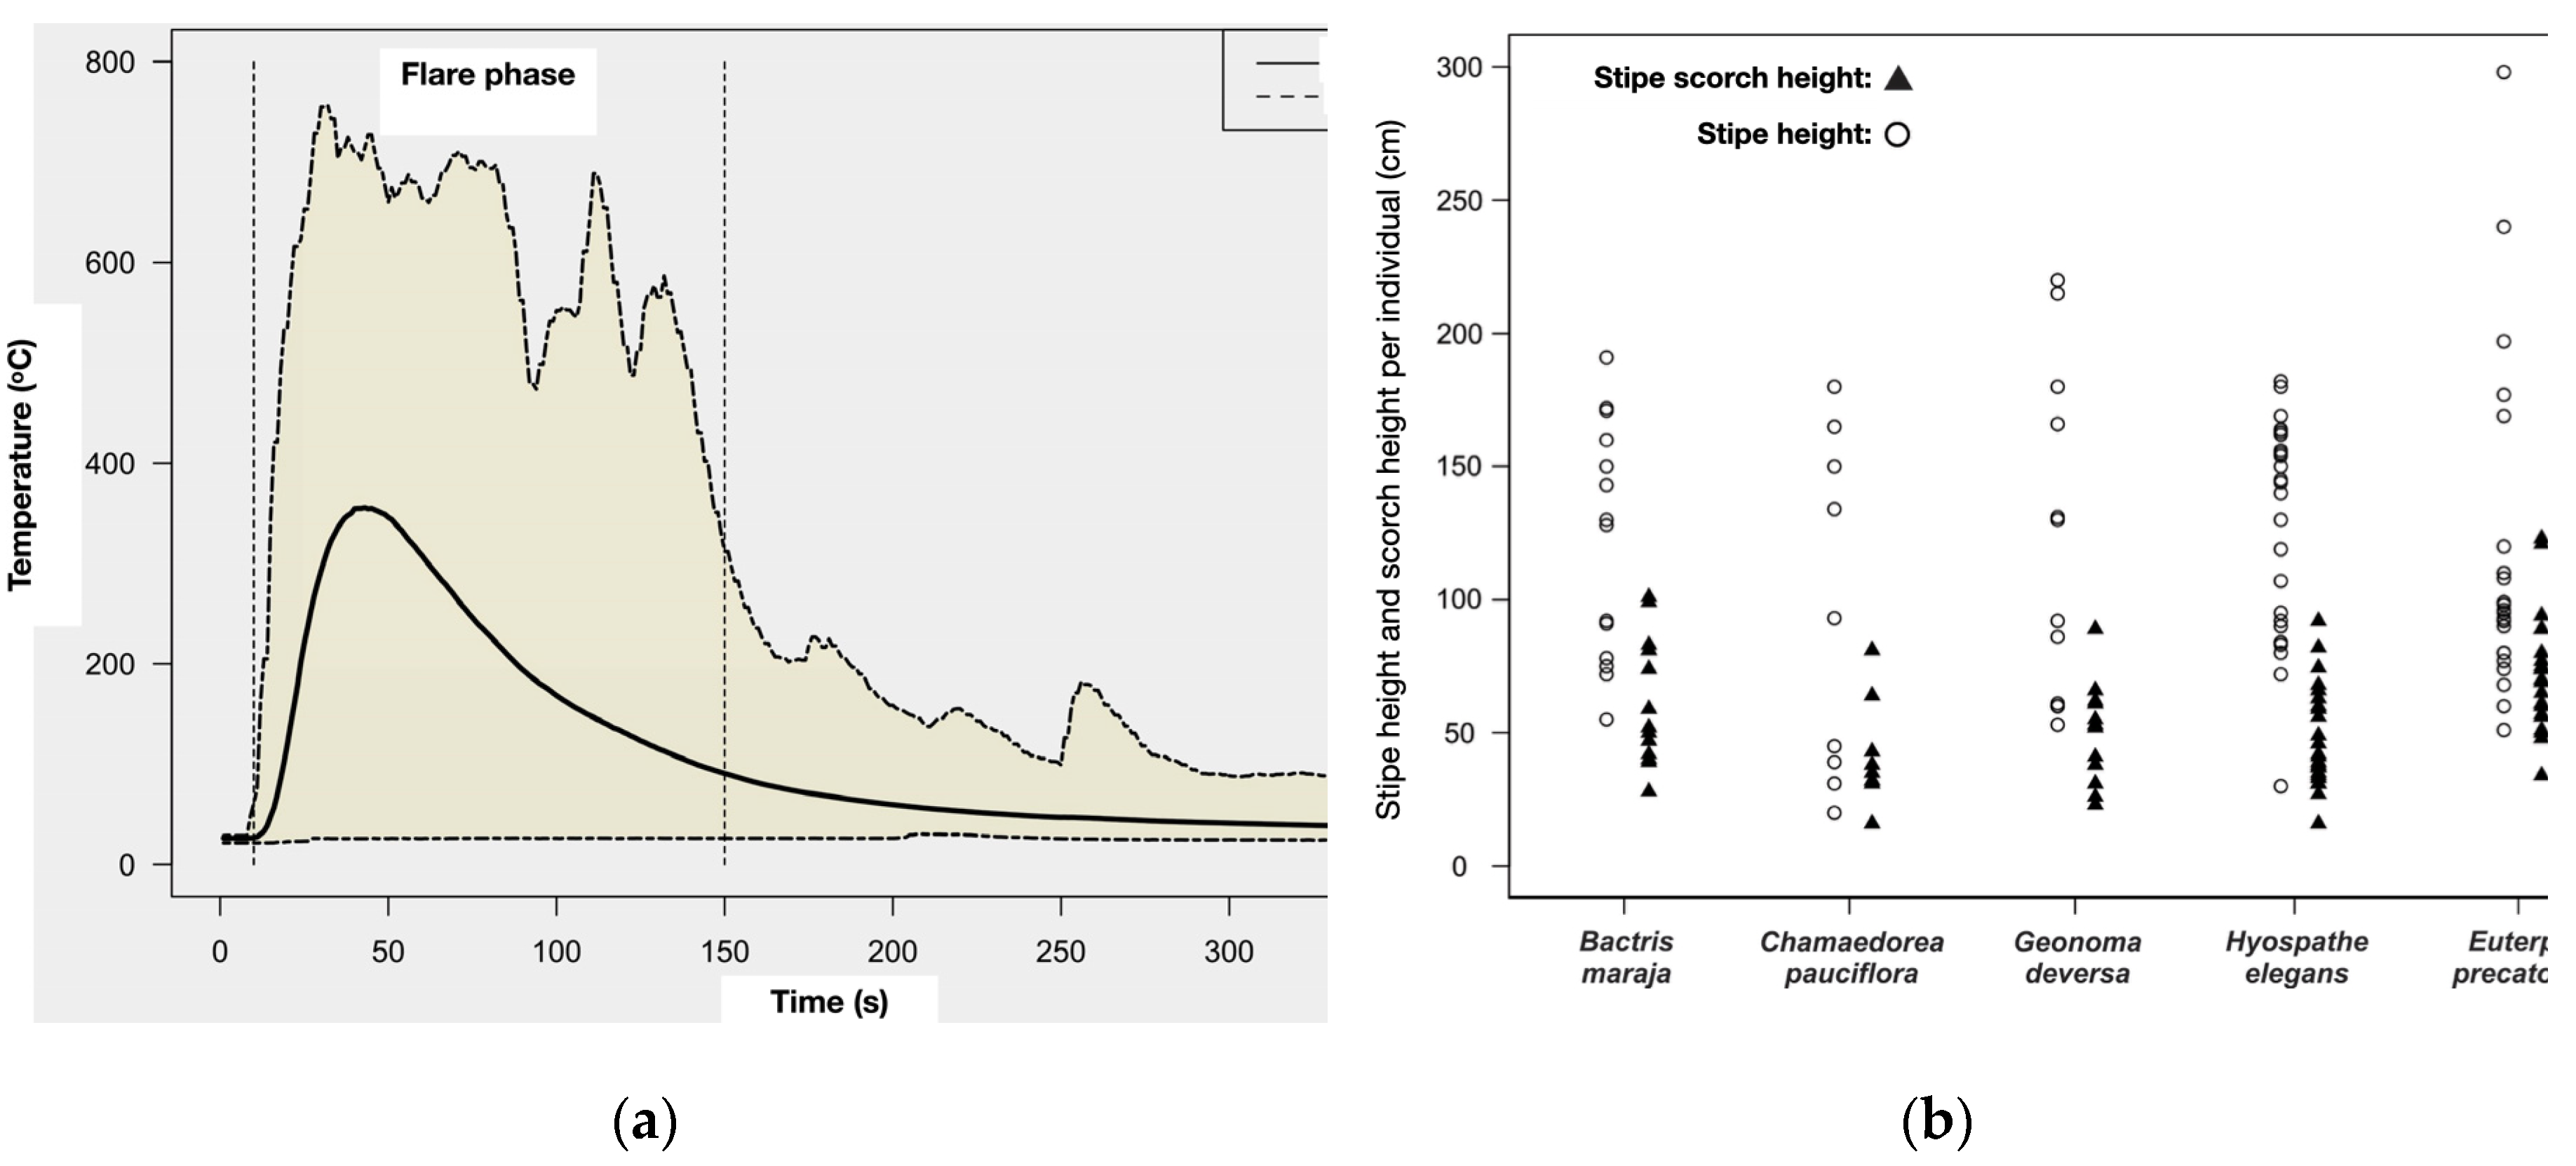
Figure 6.
Regression surface of the maximum bud center temperature increment (bud center temperature minus ambient temperature: INCMAX) as a function of stipe scorch proportion and the sum of temperatures at the base of the stipe (SUMT), for Bactris maraja, Chamaedorea pauciflora, Geonoma deversa, and Hyospathe elegans (n = 60). R2 = 0.53; g.l. = 2.50; F = 30.55; p < 0.001; during the surface fire experiment in the understory of an Amazonian forest in western Acre, Brazil.
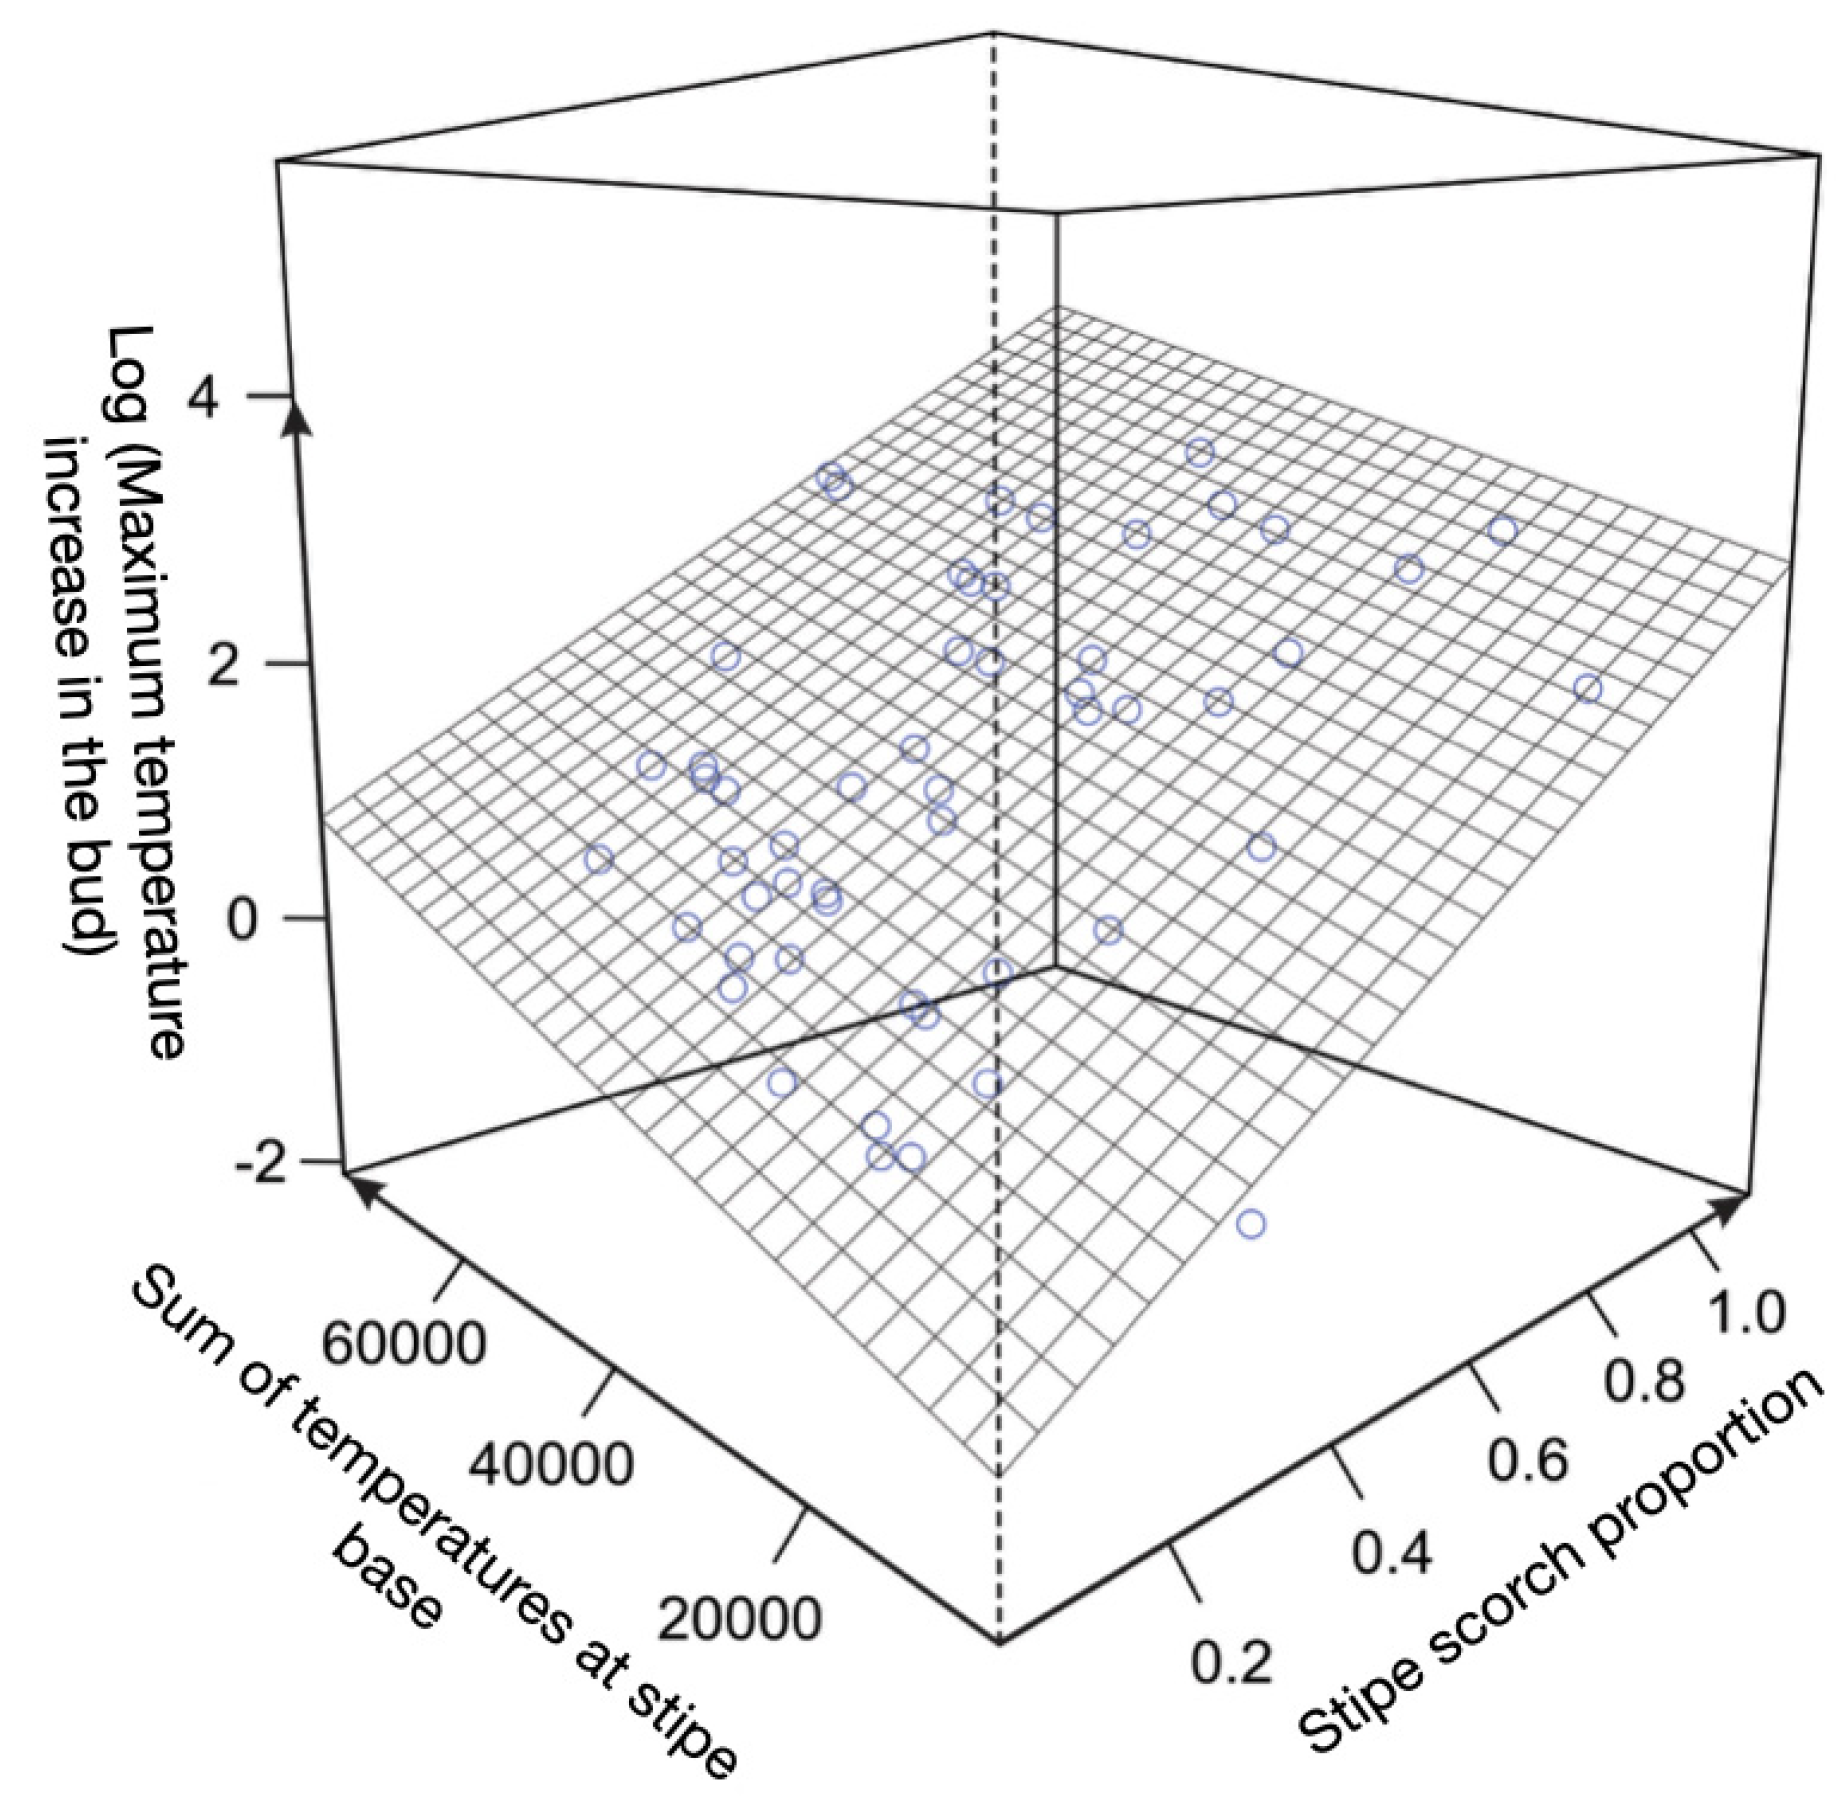
Figure 7.
(a) Distribution of individuals of Bactris maraja, Chamaedorea pauciflora, Geonoma deversa and Hyospathe elegans (n = 60) by total post-fire fate. Mortality (total): mortality without resprout + failed resprout mortality. Resprout (total): basal resprout + apical regrowth. Survival (total): remained alive without resprout. * significant difference in distribution p < 0.05, by Kruskal-Wallis test; n.s.: not significant; (b) Distribution of the number of resprouts and maximum height of post-fire resprouts per individual for the same species (n = 60) (Letters above the bars indicate significant difference p < 0.05), from the surface fire simulation experiment in the understory of an Amazonian forest in western Acre, Brazil.
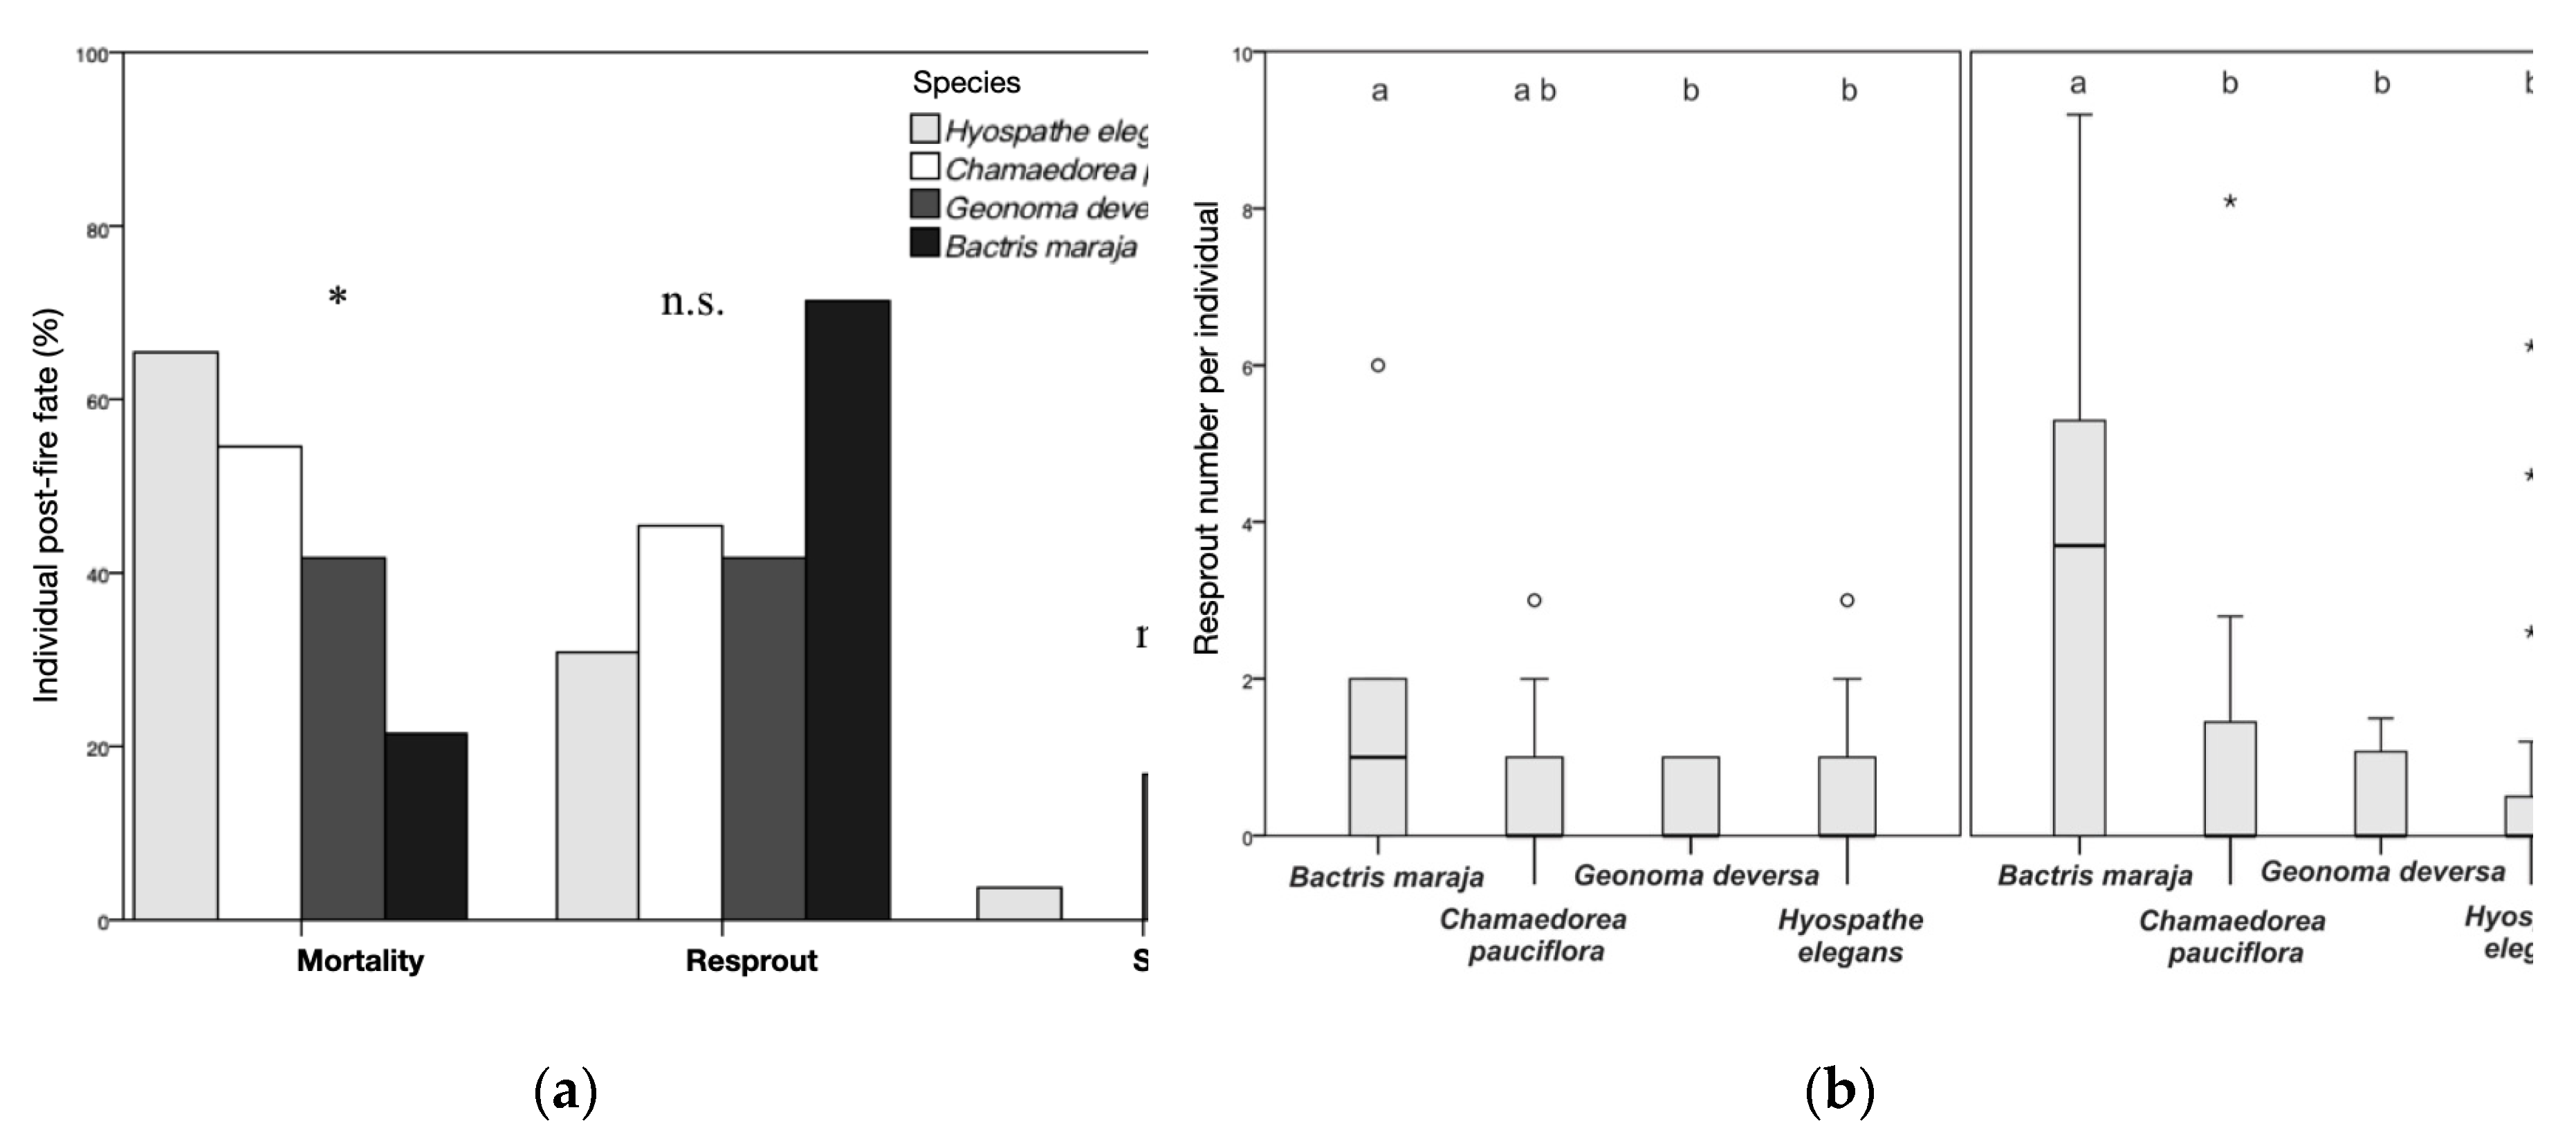
Figure 8.
(a) Post-fire mortality as a function of base of stipe diameter (DS) and canopy scorch proportion (CNSCAR), for the species Bactris maraja, Chamaedorea pauciflora, Geonoma deversa and Hyospathe elegans (n = 60)(p < 0.05). (b) ROC curves (Operator Sensitivity Curves) generated for the five models of highest significance in modeling post-fire mortality of individuals of the same species in the surface fire simulation experiment in the understory of an Amazonian forest in western Acre, Brazil.
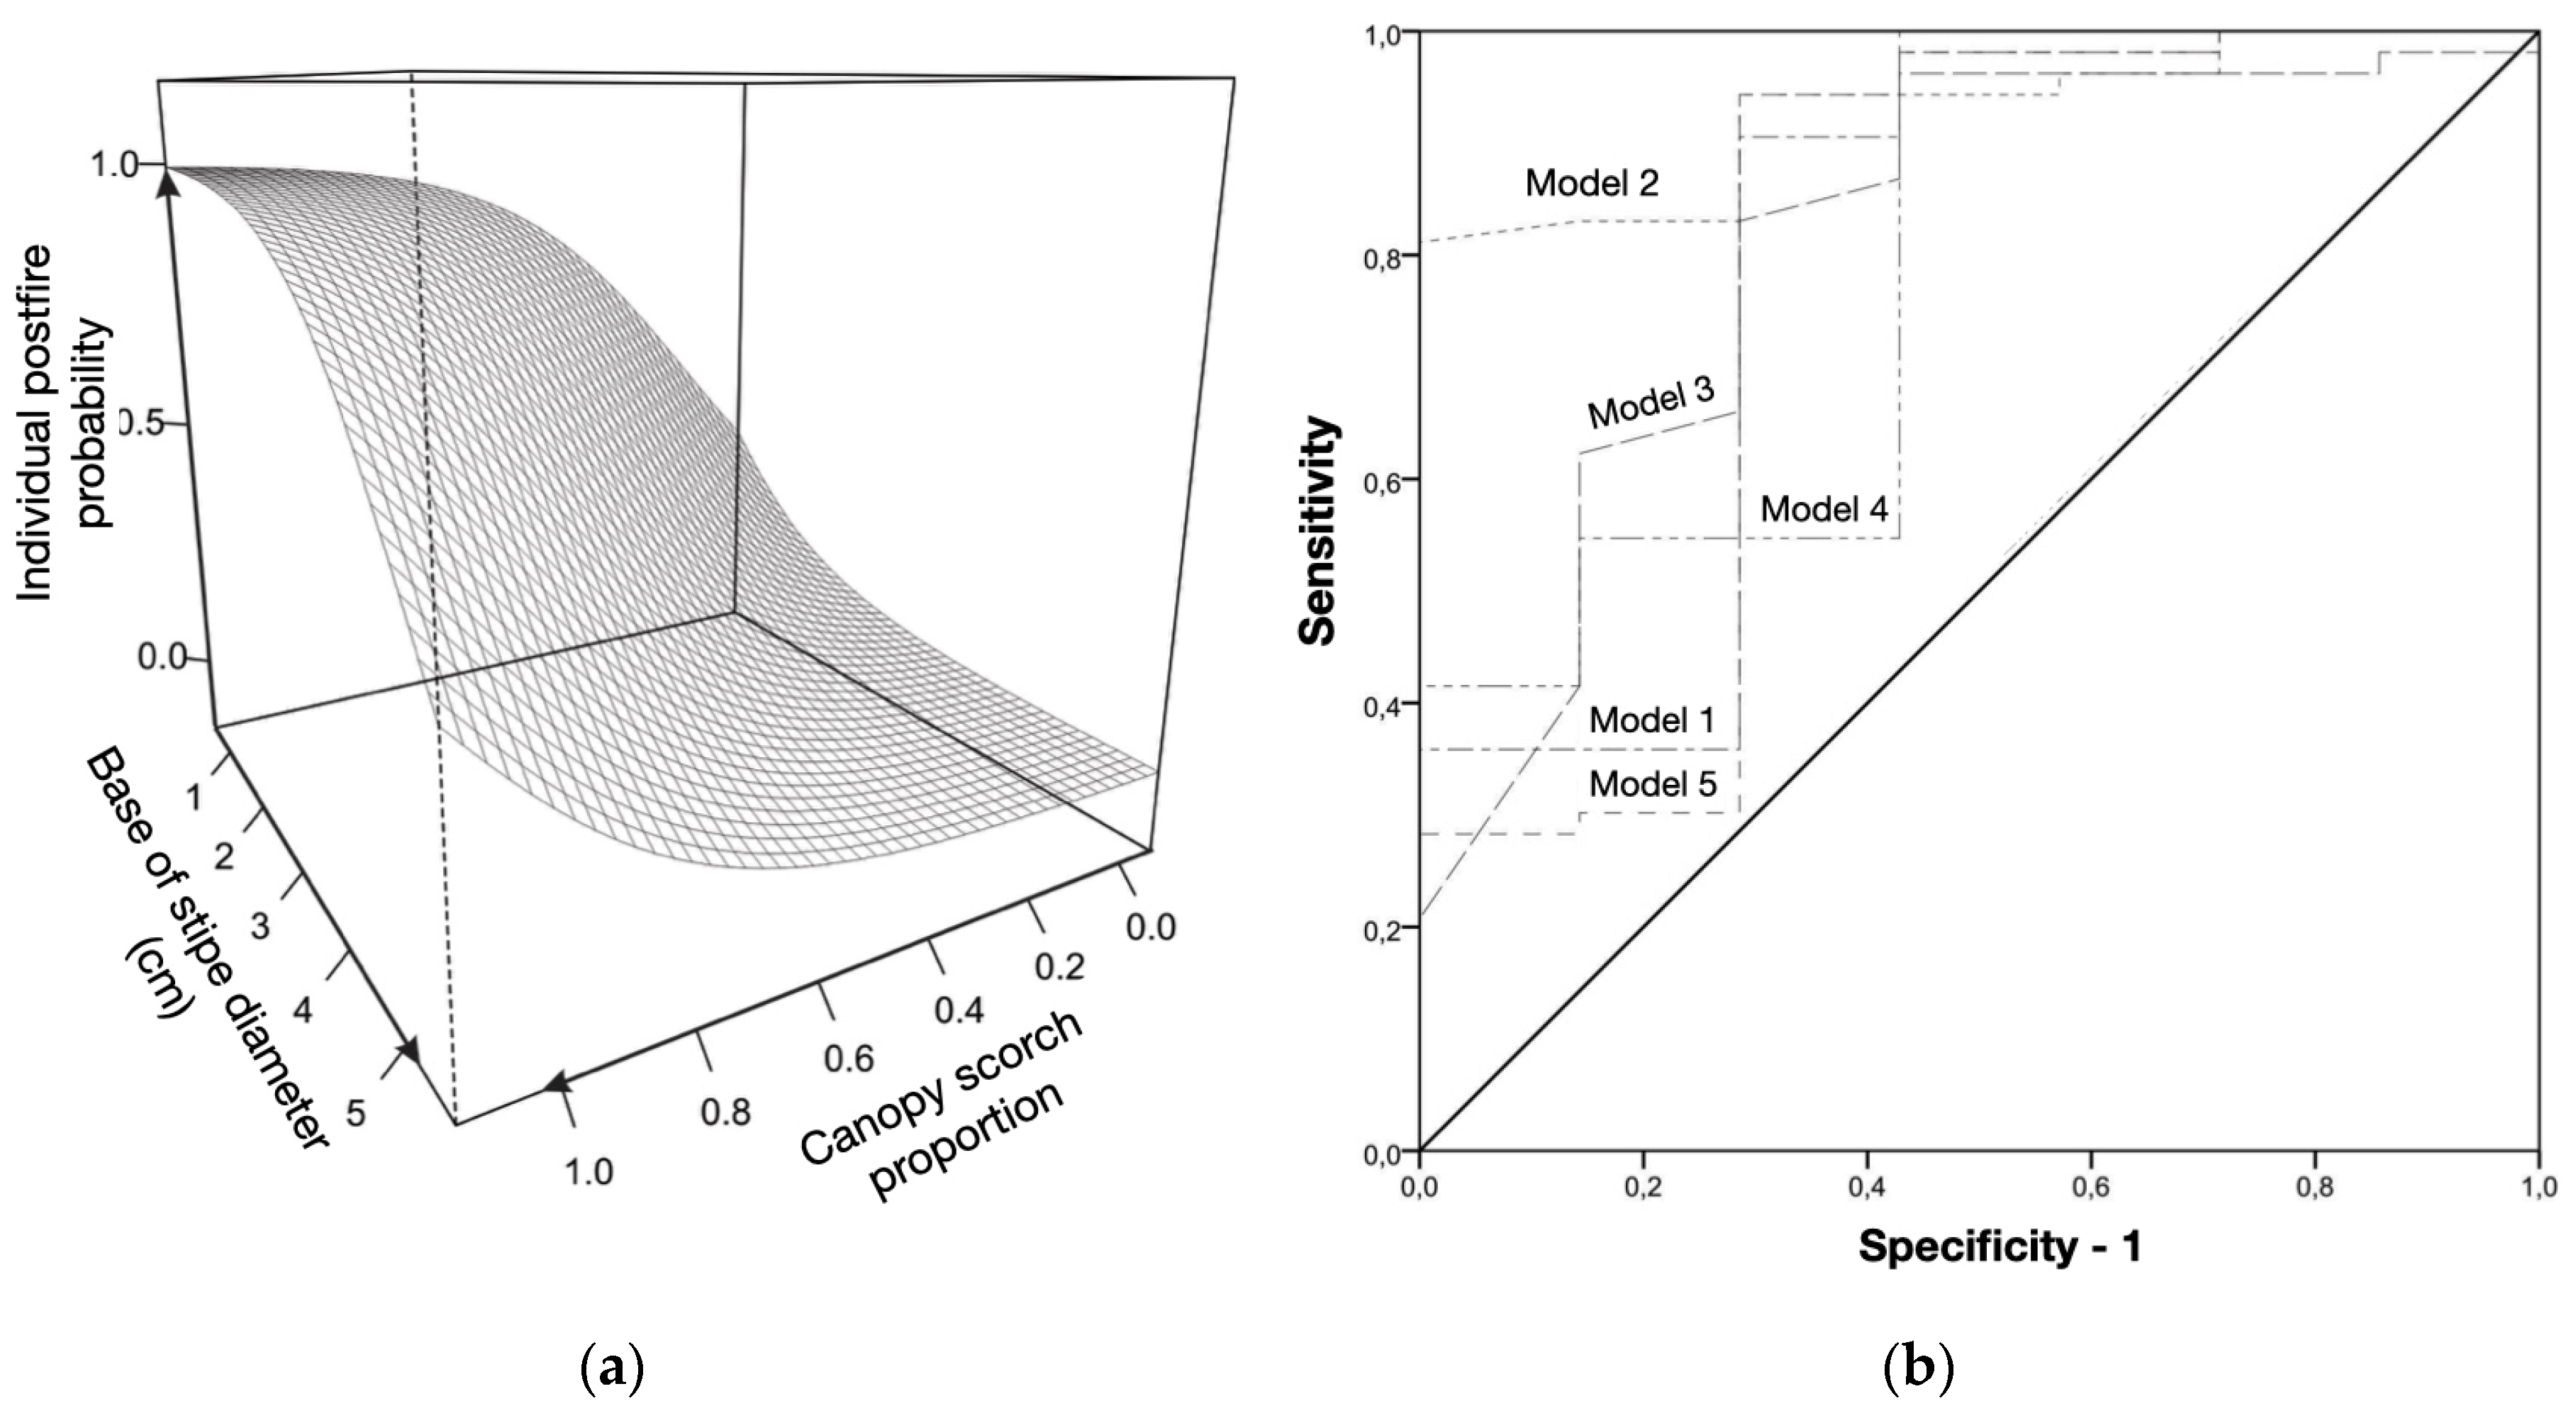
Figure 9.
Adjusted curves of the individual probability of mortality as a function of the canopy scorch proportion (CNSCAR) and of four levels of diameter at ground height (DS), of the species Bactris maraja, Chamaedorea pauciflora, Geonoma deversa and Hyospathe elegans (n = 60), in the surface fire simulation experiment in the understory of an Amazonian forest in western Acre, Brazil (p < 0.05).
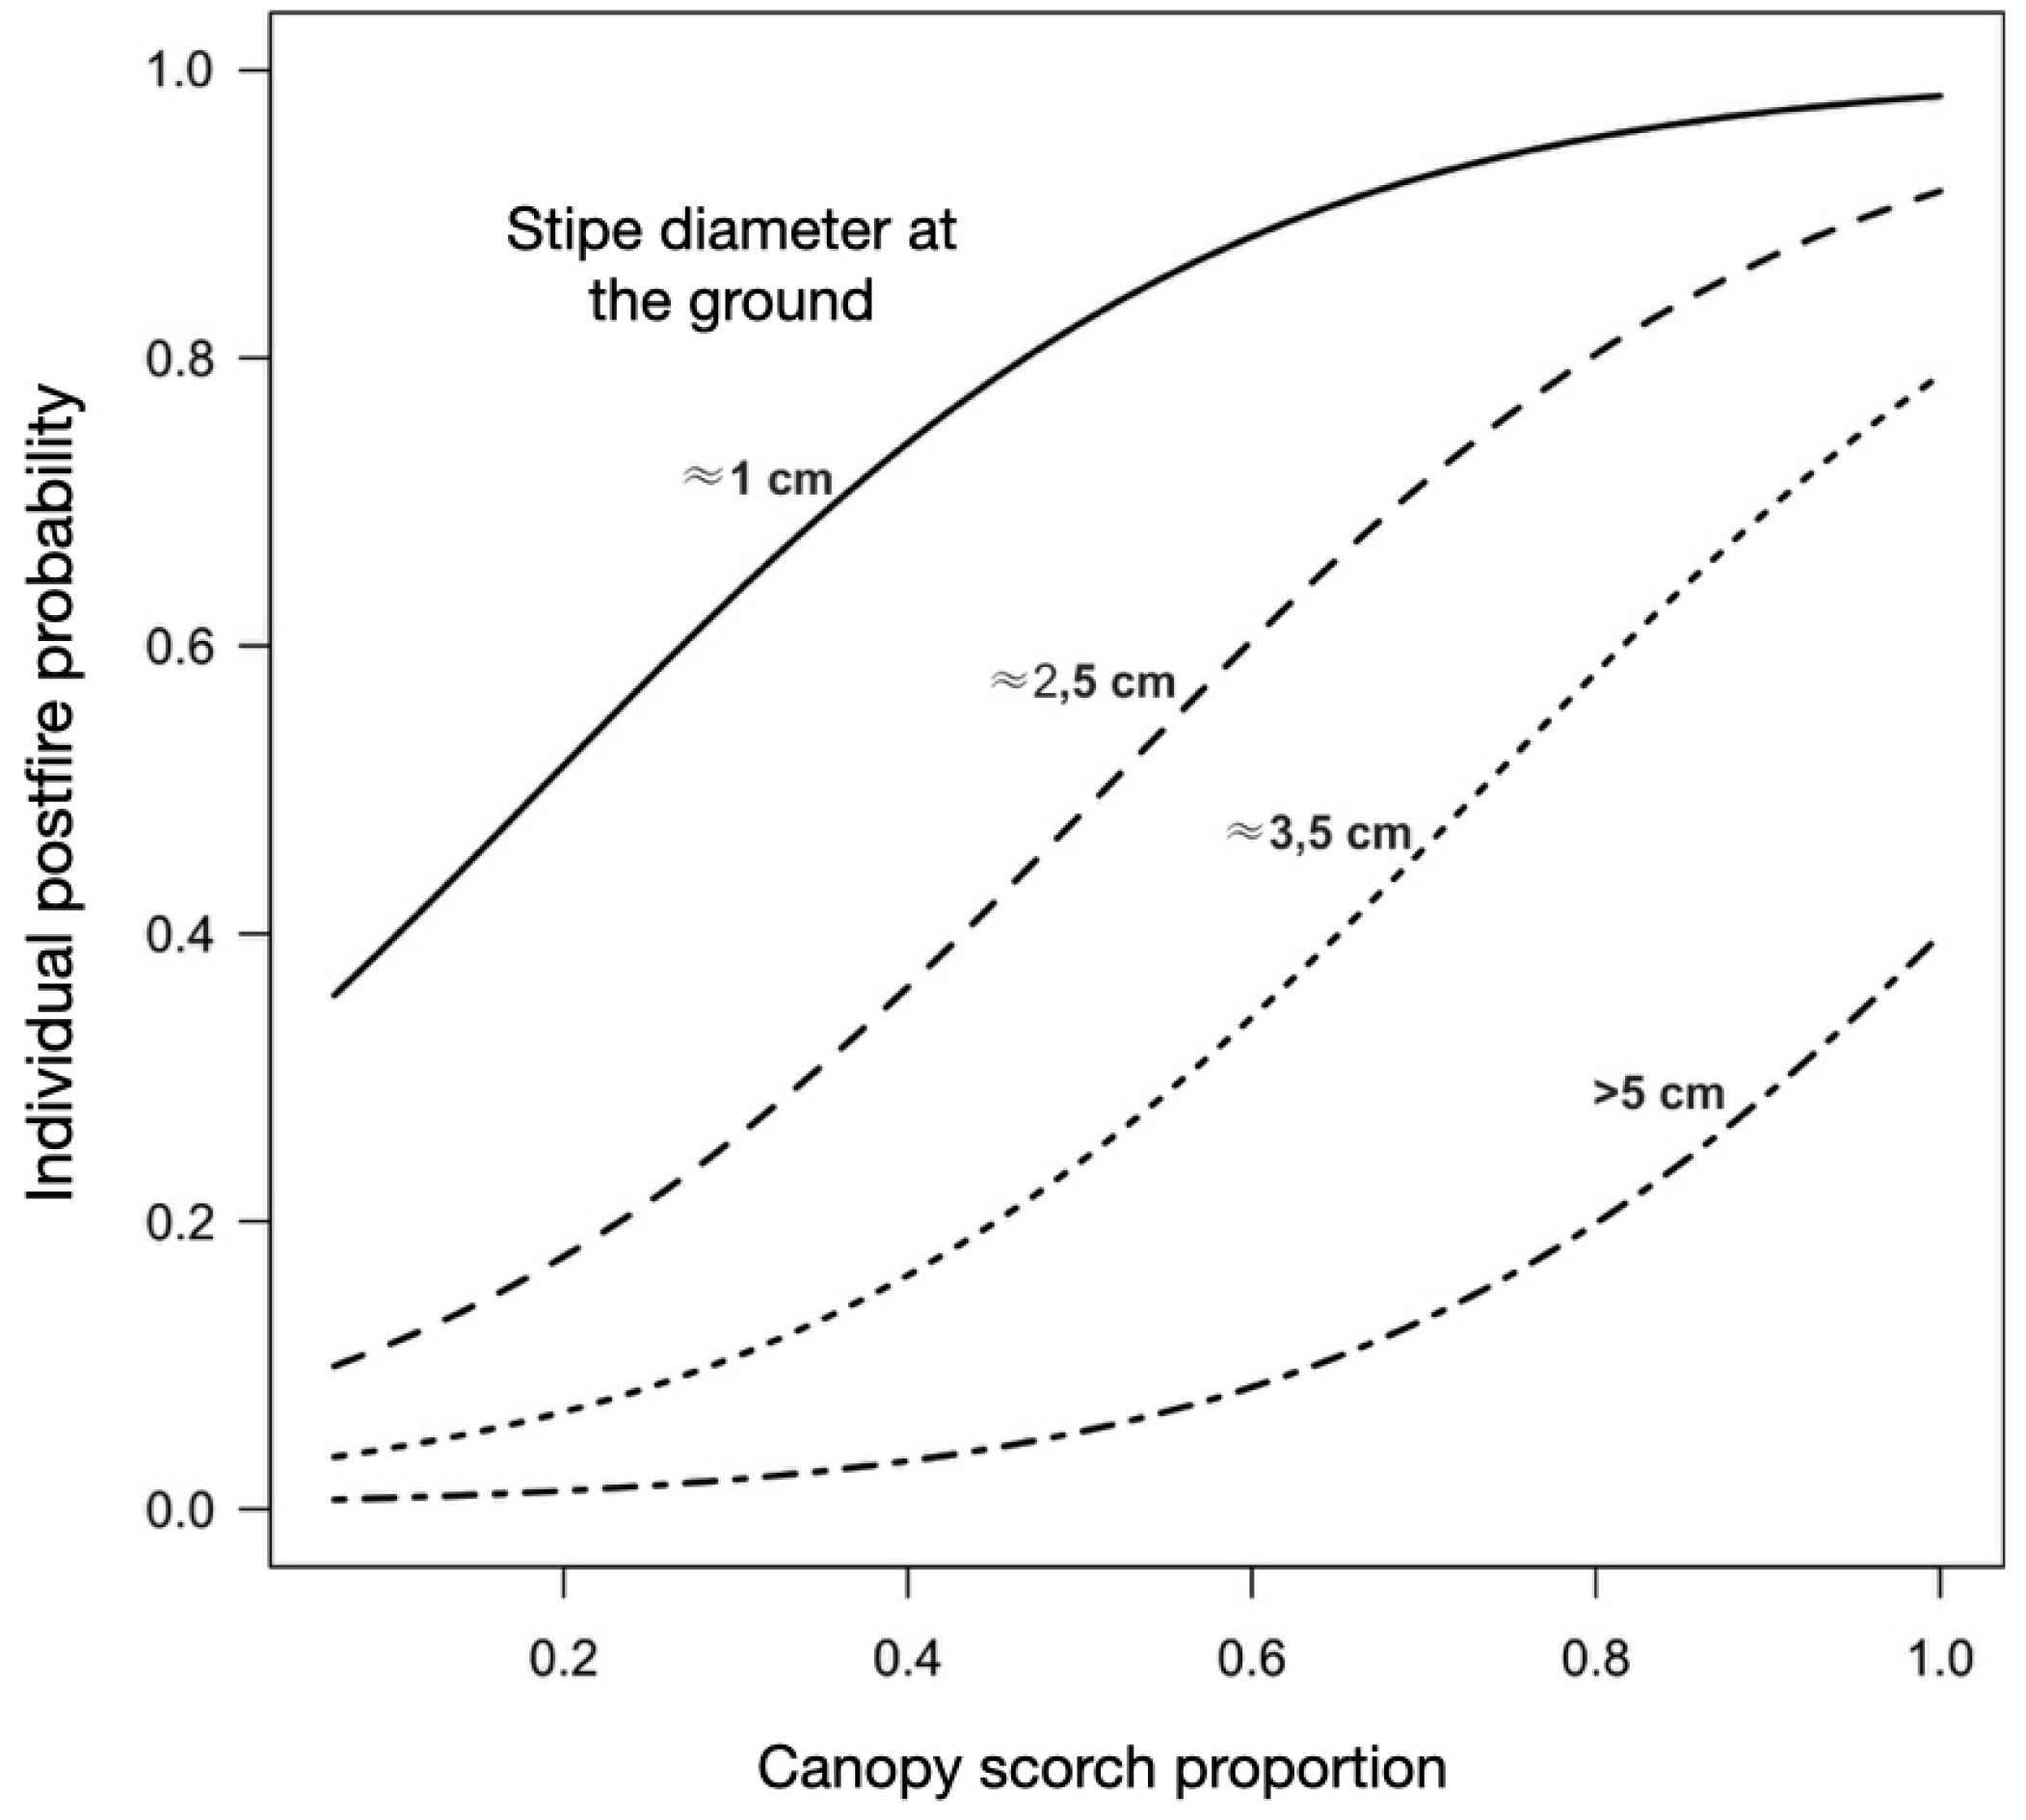
Figure 10.
Partial probabilities of mortality as a function of canopy scorch proportion (CNSCAR), and diameter at the ground level (DS), for the species Euterpe precatoria (n = 25), four months after the surface fire simulation experiment in the understory of an Amazonian forest in western Acre, Brazil (p < 0.05). Dark area refers to confidence intervals. .
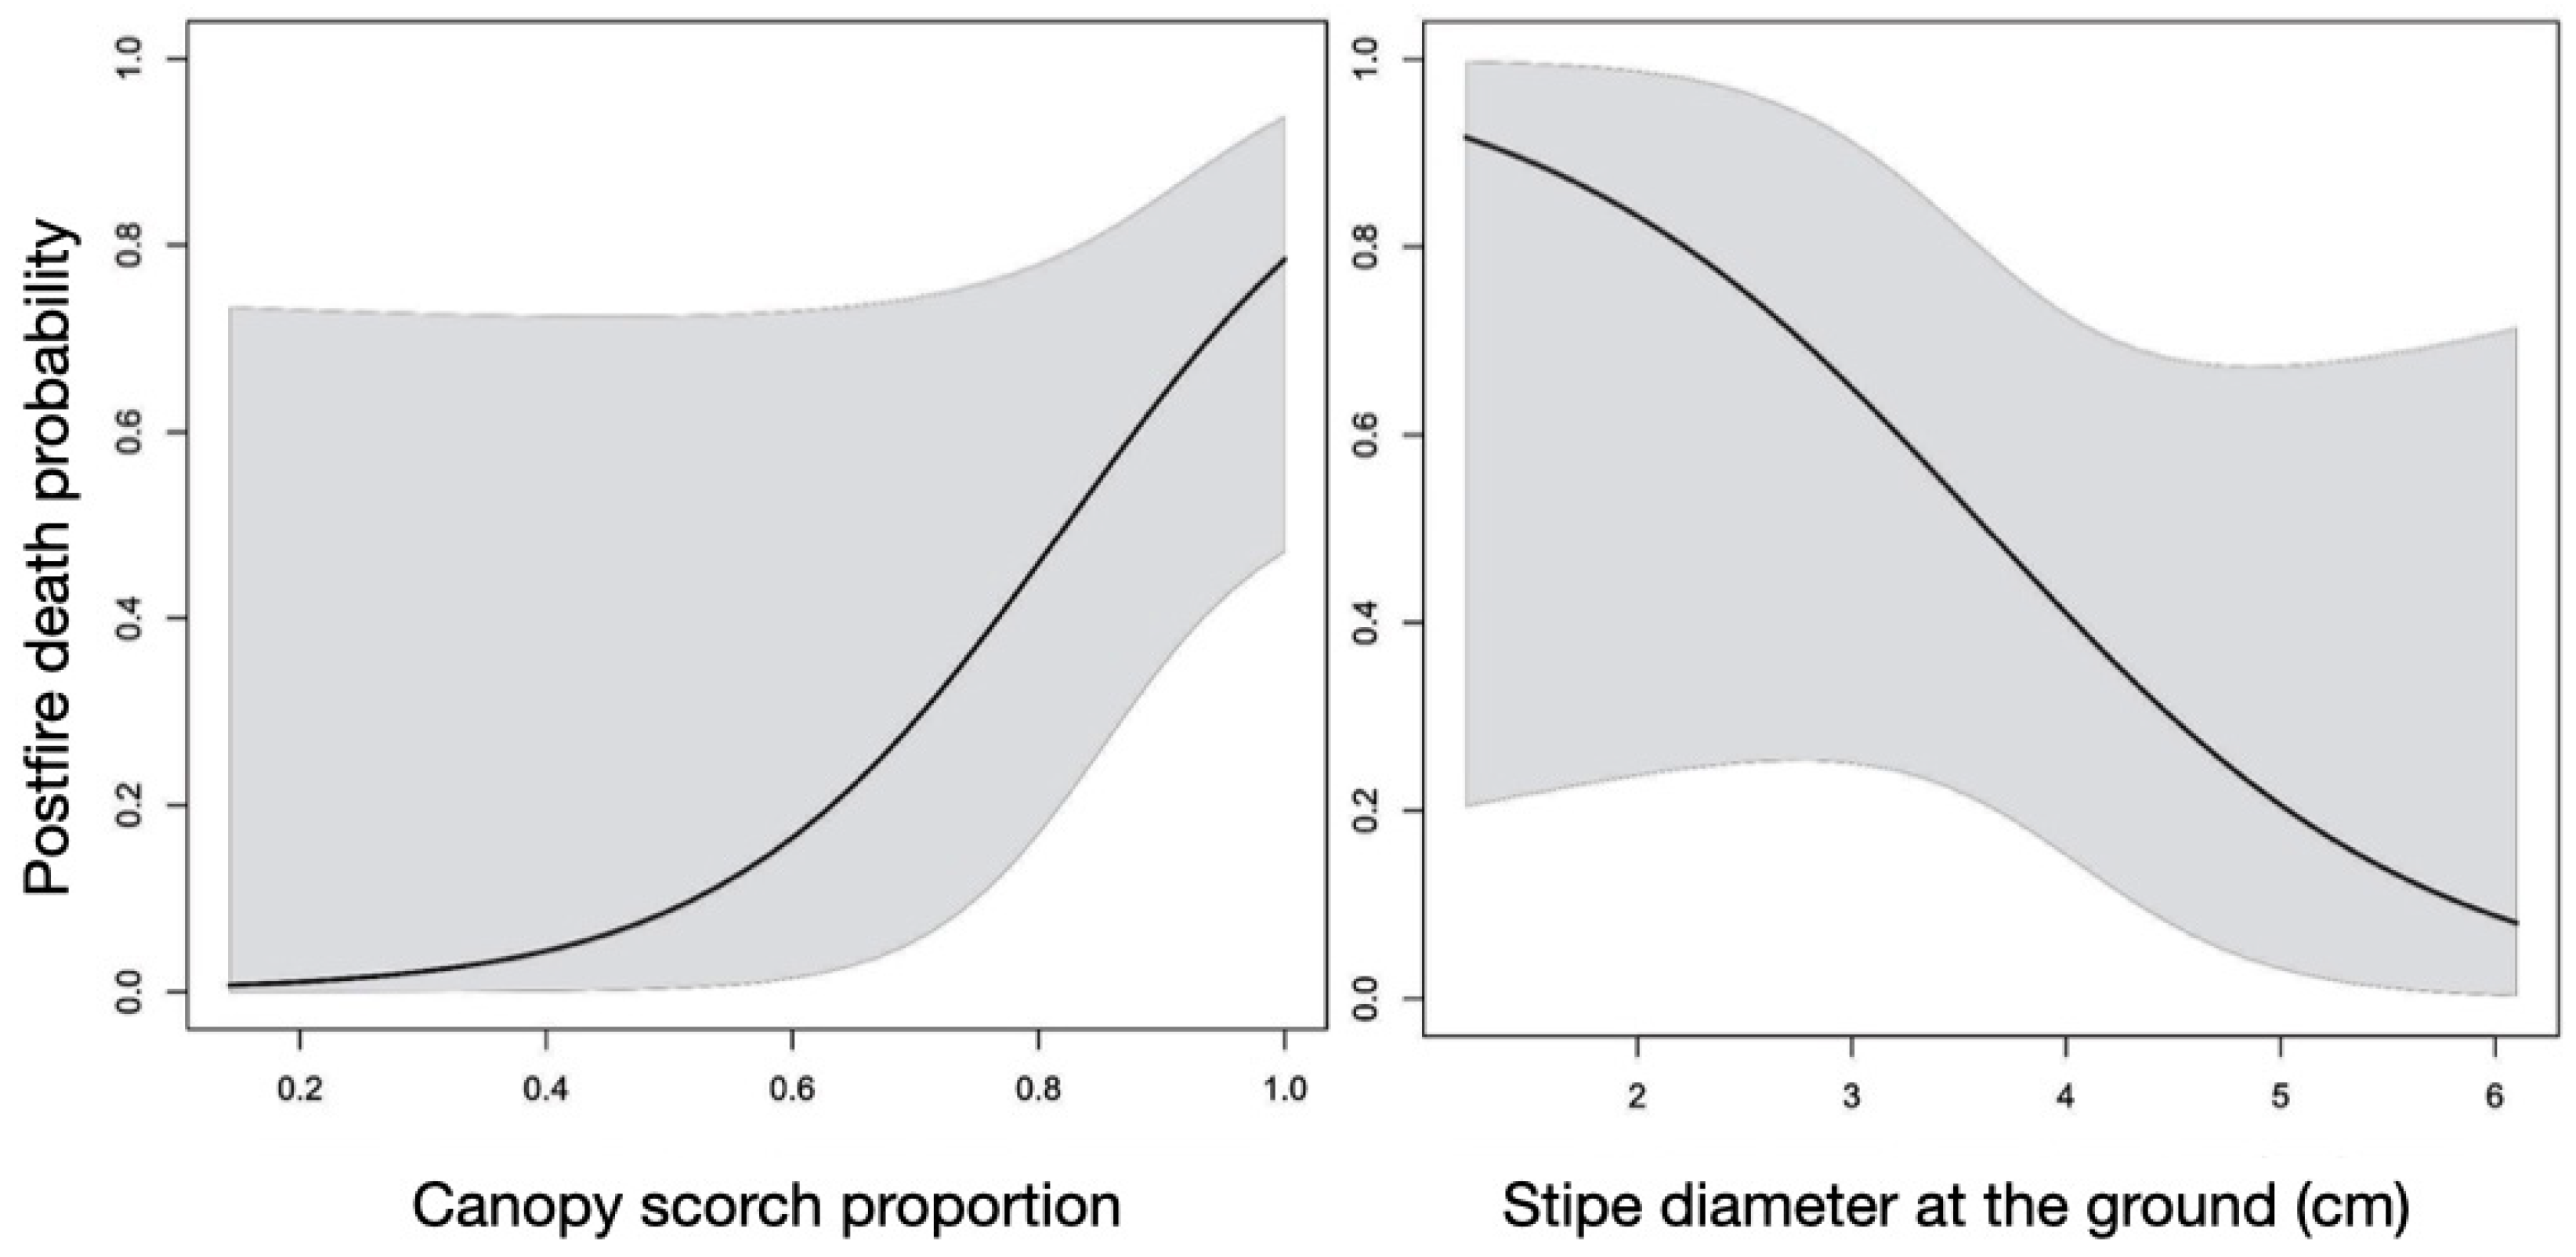
Figure 11.
(a) Adjusted curves of individual mortality probability as a function of the proportion of canopy scorched (CNSCAR), and of five intervals of diameter at ground level (DS): ≥ 1 < 1.9 cm, > 2 < 3.9 cm, > 4 < 5.9 cm and > 6 cm, for Euterpe precatoria species (n = 25) (p < 0.05); (b) Linear regression between the total proportion of canopy scorched (CNSCAR), and the height of the Euterpe precatoria stipe (n = 25), four months after the surface fire simulation experiment in the understory of an Amazonian forest in western Acre, Brazil (p < 0.05).
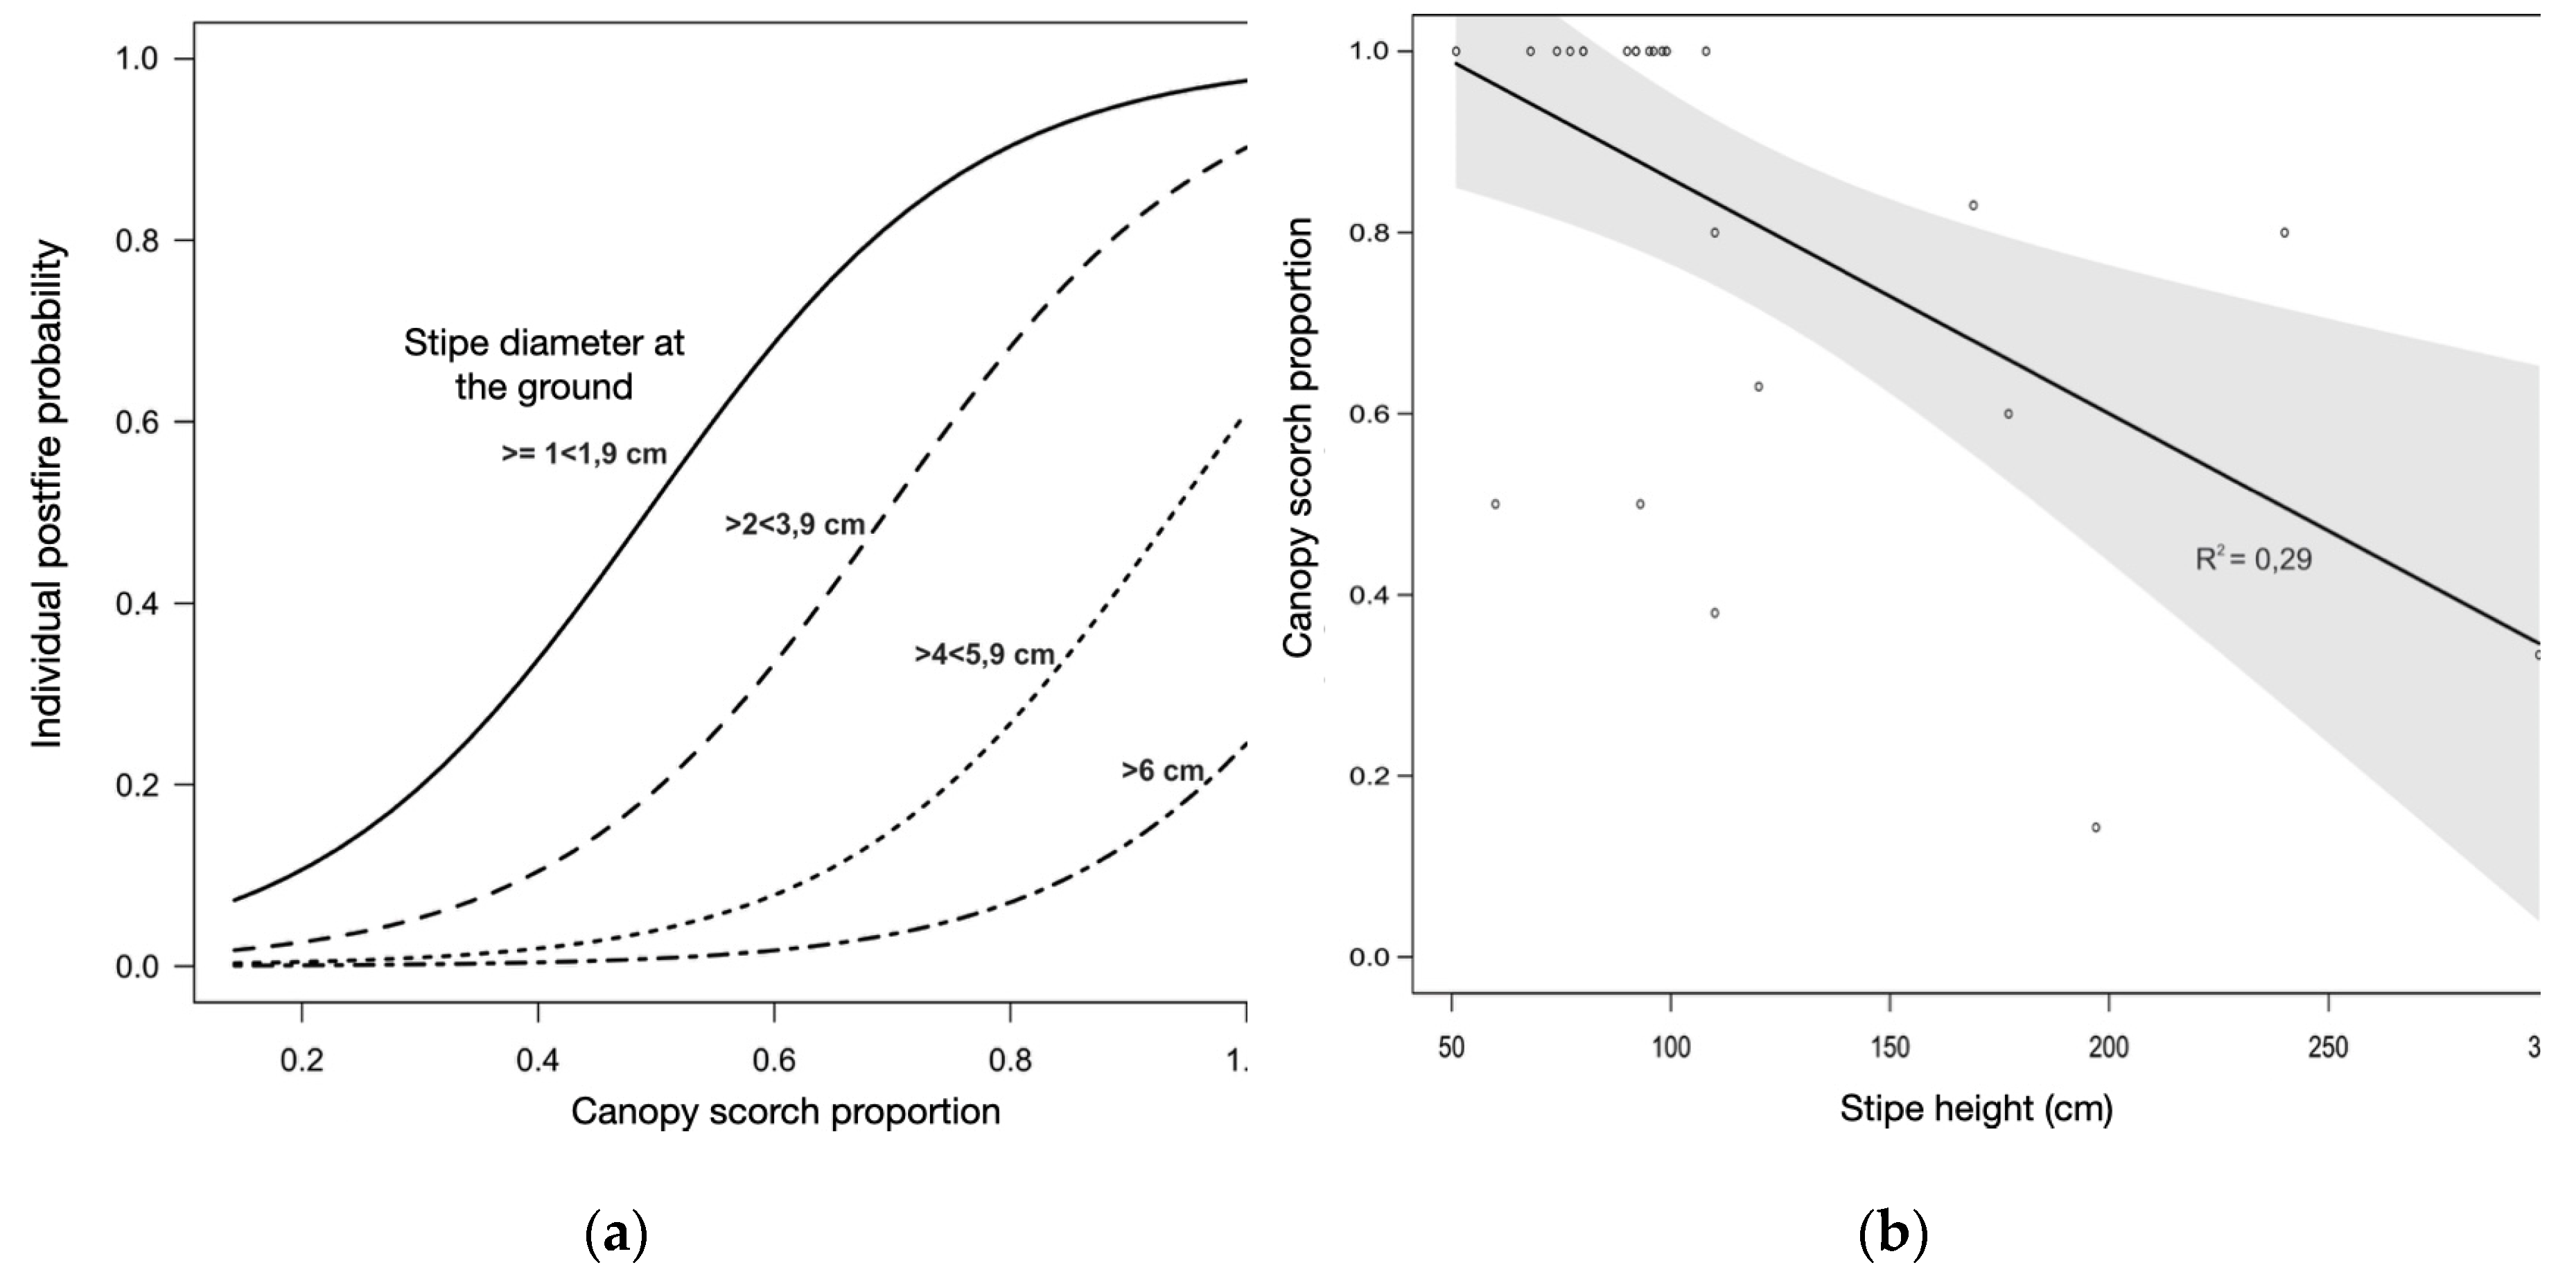
Table 3.
Mean values of environmental parameters obtained for the period (Midday 12:00 am to 5:00 pm) of the surface fire simulation experiment in the understory of an Amazonian forest in western Acre, Brazil.
Table 3.
Mean values of environmental parameters obtained for the period (Midday 12:00 am to 5:00 pm) of the surface fire simulation experiment in the understory of an Amazonian forest in western Acre, Brazil.
| Parameters | Average | Unit |
|---|---|---|
| Air temperature | 27,1 ± 2,1 | oC |
| Maximum air temperature | 29,2 ± 3,2 | oC |
| Moisture | 73 ± 11 | % |
| Maximum moisture | 81 ± 13 | % |
| Wind speed | 0,0 to 0,3 | m s-1 |
| Soil temperature | 24,1 ± 9,2 | oC |
| Leaf litter depth | 6 ± 2 | cm |
Table 4.
Palm species characterization (ARECACEAE, subfamily ARECOIDEAE) sampled in the surface fire simulation experiment in the understory of an Amazonian forest in western Acre, Brazil (total individuals: N = 85). n: number of individuals per species. Morphological characteristics listed in Table 1. DS: stipe diameter at ground level; NL: number of leaves; LENG: leaf length. Averages ± standard deviation.
| Species | n | DS (cm-1) |
Total height (cm-1) |
Stipe height (cm-1) |
NL | LENG (cm-1) |
|---|---|---|---|---|---|---|
| Bactris maraja Mart. | 14 | 1,8 ±0,3 | 221 ±76,4 | 122 ±44,2 | 6 ±2 | 144 ±46,2 |
| Chamaedorea pauciflora Mart. | 9 | 1,9 ±0,7 | 145 ±50,0 | 84 ±75,7 | 7 ±2 | 79 ±17,7 |
| Geonoma deversa (Poit.) Kunth | 12 | 2,4 ±1,3 | 205 ±131,8 | 106 ±81,0 | 11 ±4 | 85 ±30,1 |
| Hyospathe elegans Mart. | 25 | 1,9 ±0,4 | 201 ±81,2 | 124 ±43 | 8 ±2 | 85 ±13,3 |
| Euterpe precatoria Mart.a | 25 | 3,6 ±1,4 | 268 ±64,7 | 115 ±58,2 | 4 ±1 | 182 ±40,5 |
(a) Only individuals in the juvenile stage were sampled, up to 2,5 m in stipe height.
Table 5.
Analysis of variance of the time-temperature history obtained with TK3 sensor, during the surface fire simulation experiment in the understory of an Amazonian forest in western Acre, Brazil, for n = 85 individuals. Recording interval is 360 s, immediately after ignition; leaf litter fuel in 1 m2 area. p < 0.05.
| Time -Temperature History | Average (±Std. Dev) | D.f. | F | p |
|---|---|---|---|---|
| Maximum (oC) | 437 ±175 | 4,80 | 0,370 | 0,829 |
| Average (oC) | 112 ±35 | 4,80 | 0,110 | 0,979 |
| Sum (oC) | 40.655 ±12.822 | 4,80 | 0,110 | 0,979 |
| Average 150 s (oC) | 180 ±65 | 4,80 | 0,192 | 0,942 |
| Sum 150 s (oC) | 32.370 ±11.590 | 4,89 | 0,192 | 0,942 |
Table 6.
Logistic regression models for post-fire mortality of Bactris maraja, Chamaedorea pauciflora, Geonoma deversa, and Hyospathe elegans individuals (n = 60) from the surface fire simulation experiment in the understory of an Amazonian forest in western Acre, Brazil. Models ordered by the lowest value of Δ of AIC. Only significant models are shown, p < 0.05.
| Model | Variables | -2 Log Likelihood | AICa | ΔAICb | Nagelkerke R2 |
ROC areac |
|---|---|---|---|---|---|---|
| 2 | Intercept+DSd+CNSCARe | 26,082 | 32,08 | 0 | 0,45 | 0,92 |
| 4 | Intercept+DS+STSCARf:DISTg | 28,618 | 34,61 | 2,53 | 0,42 | 0,78 |
| 3 | Intercept+DS | 33,863 | 35,86 | 3,78 | 0,22 | 0,81 |
| 1 | Intercept+DS+STSCAR | 31,309 | 37,30 | 5,22 | 0,35 | 0,79 |
| 5 | Intercept+DS+STSCAR:RHMINh | 31,801 | 37,80 | 5,72 | 0,33 | 0,78 |
a) Akaike's information criterion; b) Difference between the AIC of the model and the smallest AIC value among the models; c) Area under the Operator Sensitivity Curve (ROC); d) Diameter of the base of the stipe; e) Total proportion of scorched canopy; f) Proportion of the stipe scorched height; g) Orthogonal distance of the individual from the forest edge; h)Minimum relative moisture at the time of individual burning.
Table 7.
Coefficients of model 2 of the logistic regression of post-fire mortality of individuals of the species Bactris maraja, Chamaedorea pauciflora, Geonoma deversa, and Hyospathe elegans (n = 60), in the surface fire simulation experiment in the understory of an Amazonian forest in western Acre, Brazil. B: regression coefficient of the model; Wald: Wald statistic values; D.f.: degrees of freedom of each variable in the model; Sig: p values for each model's probability coefficient.
| Variables | B | Standard Error |
Wald | D.f. | Sig | Confidence Interval 95% Exp(B) | |
|---|---|---|---|---|---|---|---|
| lower | higher | ||||||
| Intercept | 0,161 | 2,023 | 0,006 | 1 | 0,937 | ||
| Stipe diameter at the ground level (DS) | -1,076 | 0,497 | 4,699 | 1 | 0,030 | 0,129 | 0,902 |
| Canopy scorched proportion (CNSCAR) | 4,919 | 1,978 | 6,183 | 1 | 0,013 | 2,83 | 6610 |
Table 8.
Logistic regression models for mortality of Euterpe precatoria individuals (n = 25), in the surface fire simulation experiment in the understory of an Amazonian forest in western Acre, Brazil. Models ordered by the smallest value of Δ of AIC. Only significant models are shown, p < 0.05.
Table 8.
Logistic regression models for mortality of Euterpe precatoria individuals (n = 25), in the surface fire simulation experiment in the understory of an Amazonian forest in western Acre, Brazil. Models ordered by the smallest value of Δ of AIC. Only significant models are shown, p < 0.05.
| Model | Variables | -2 Log Likelihood | AICa | Δ AICb | Nagelkerke R2 |
ROC areac |
|---|---|---|---|---|---|---|
| 2 | Intercept +DSd+CNSCAR | 17,90 | 21,9 | 0 | 0,65 | 0,90 |
| 1 | Intercept+CNSCARe | 22,84 | 24,9 | 3 | 0,69 | 0,81 |
| 3 | Intercept +DS+STSCARf | 25,61 | 29,6 | 7.7 | 0,40 | 0,88 |
a)Akaike's information criterion; b)Difference between the AIC of the model and the smallest AIC value among the models; c)Area under the Operator Sensitivity Curve (ROC); d) Diameter of the base of the stipe at ground; e)Proportion of scorched canopy; f) Stipe scorched proportion.
Table 9.
Coefficients of model 2 of the logistic regression of post-fire mortality of Euterpe precatoria individuals (n = 25), in the surface fire simulation experiment in the understory of an Amazonian forest in western Acre, Brazil. B: regression coefficient of the model; Wald: Wald statistic values; D.f.: degrees of freedom of each variable in the model; Sig: p values for each model's probability coefficient.
| Variables | B | Standard Error | Wald | D.f. | Sig | Confidence interval 95% Exp(B) | |
|---|---|---|---|---|---|---|---|
| Lower Higher | |||||||
| Stipe diameter at the ground level (DS) | -1,241 | 0,511 | 5,889 | 1 | 0,015 | 0,106 | 0,788 |
| Canopy scorched proportion (CNSCAR) | 5,712 | 2,215 | 6,649 | 1 | 0,010 | 3,936 | 23257 |
Disclaimer/Publisher’s Note: The statements, opinions and data contained in all publications are solely those of the individual author(s) and contributor(s) and not of MDPI and/or the editor(s). MDPI and/or the editor(s) disclaim responsibility for any injury to people or property resulting from any ideas, methods, instructions or products referred to in the content. |
© 2024 by the authors. Licensee MDPI, Basel, Switzerland. This article is an open access article distributed under the terms and conditions of the Creative Commons Attribution (CC BY) license (http://creativecommons.org/licenses/by/4.0/).
Copyright: This open access article is published under a Creative Commons CC BY 4.0 license, which permit the free download, distribution, and reuse, provided that the author and preprint are cited in any reuse.


