
Submitted:
28 June 2024
Posted:
29 June 2024
You are already at the latest version
Abstract
This study analyzed the anaerobic co-digestion of Inoculum (I), Rubber Plant Effluent (RPE) and Gliricidia leaves (GLS) at different mixing ratios for the simultaneous production of methane and organic fertilizer. The results were analyzed for volatile fatty acids, pH, C/N ratio, and methane production. The organic quality of the substrate mixture before and after anaerobic digestion was analyzed for organic carbon, Kjeldahl nitrogen, potassium, and phosphorus content. The study concluded that the inoculum, Rubber Plant Effluent (RPE), and Gliricidia leaves (GLS) mixed in the ratio of 10:2:2 showed higher methane production than other experiments conducted at different mixing ratios. The nitrogen, Potassium and phosphorus content of the substrates are increased after anaerobic digestion. However, the organic carbon content in the substrate decreased in all experiments. This research recommends the planting of rubber trees and Gliricidia maculata to promote economic development in Mauritania.
Keywords: Biogas production; Gliricidia leaves; Methane; Rubber Plant Effluent; Organic Manure
Keywords:
Gliricidia leaves
; Methane
; Rubber Plant Effluent
; Organic Manure
1. Introduction
The energy requirements of Mauritania, a country located in West Africa has been rising steadily alongside the bulked-up population and urbanization levels. On the one hand, there is a limited supply of energy resources produced locally, meaning that it needs to opt for alternative methods to deal with both economic concerns and the state of the environment [1]. For enhancing financial independence, the plantation crops enable to increase in financial security and socio-economic development of the country. The Brazilian rubber tree (Hevea brasiliensis) is a plantation crop suitable for cultivation in Mauritania. The latex from rubber has lots of benefits as a raw material for a variety of products. Rubber plant is one of the major economic crops in African counties and the fact that it creates forest cover by maintaining the ecological chain. Natural rubber is an amorphous hydrocarbon, poly-isoprene, which is distinguished by a fact that it is capable to undergo high extensibility. The manufacture of natural rubber produces polluted Rubber Plant Effluent (RPE), on an average of 20,500L per tonne of rubber production [2,3]. The latex collected from the trees is mixed with formic acid under controlled conditions for industrially produced rubber. Then, the latex is poured into dishes for coagulation. After the latex is vulcanised, the rubber sheet is squeezed by rollers. The extruded rubber sheets are then dried in the open sun or in biomass-burning drying chambers called smoke sheds [4]. The rubber plant effluent consists of wash water, small amounts of uncoagulated latex, and serum with small quantities of proteins, carbohydrates, lipids, carotenoids, salts, and other chemicals added for the processing [5,6]. To reduce carbon emissions, the goal is to increase rubber production to achieve a zero-carbon footprint factor [7]. However, pollution of the water, soil, and air is also caused by the released RPE (rubber processing effluent) [8,9]. It is estimated that 3 to 8. 5 million hectares of trees alone should be planted by 2024 to satisfy the growing industry demand [10]. This is a clear sign that the threat of environmental issues like those caused by RPE is not a matter of tomorrow, but rather, an issue of today. Organic matter released into the environment is a problem to be addressed [11].
The use of chemicals like ammonia and diammonium phosphate in the mixture can result in human exposure and water eutrophication, respectively [12]. The contamination of the H2S in RPE can be a danger for drinking water hundreds of miles downstream from the recycled water site [13]. These chemicals can be the cause of the remarkable depletion of the dissolved oxygen in open water bodies [14] which then affects the related ecosystem, agricultural activities and human health. Large processing plants have treatment facilities for the untreated sludge they discharge, but many medium and small rubber latex processing plants discharge the wastewater into open spaces or water bodies without proper treatment. In open treatments, the genetic condition of volatile fatty acids results in the production of greenhouse gases. However, the use of bio methanation is among the alternative approaches that allow the production of energy [15].
The facts from above studies highlights the obligation to prepare and construct a sustainable and ecologically friendly system for the treatment of waste from rubber processing plants. In this case, RPE can be treated anaerobically by producing biogas. The biogas produced can be used to dry rubber sheets, thus replacing the burning of biomass in unsatisfactory smoke chambers [16]. The polluted effluent discharge can be converted into organic manure, which can be used as manure for agricultural purposes [17]. Gliricidia Maculata is a tree and its leaves commonly used for the organic manure production [18]. Production of Gliricidia leaves is carried out by planting stem cuttings on wasteland and roadsides. A mature Gliricidia tree can yield an average of 91 kg of green leaves per year. The leaves can be used as a supplement for livestock. By co-digesting RPE with Gliricidia leaves, the quality of the fertilizer can be improved, thereby removing the toxicity of RPE. The picture of Gliricidia Maculata and rubber processing procedure are shown in Figure 1(a) and 1(b), respectively. The methane production and fertilization rate of manure can be improved by anaerobic digestion of inoculum, RPE and GLS. The toxic content of RPE can be reduced by co-digestion with Gliricidia leaves, resulting in methane-rich biogas. Fertilizer production using the slurry output is a suitable approach to reduce the rubber plant effluent pollution.
The aim of this study was to investigate the possibility of anaerobic treatment of inoculum, rubber processing effluent and Gliricidia leaves for biogas production and use the digested slurry as an organic fertilizer. The specific objectives of the study include: (1) Conduct four laboratory-scale experiments with different inoculum RPE and GLS mixing ratios (each experiment was repeated three times). (2) Measure the methane production, C/N ratio, pH, volatile fatty acids, volatile solids, and volatile solids reduction for each experiment. (3) Determine the fertilizer quality of the substrate before and after anaerobic digestion by analyzing the content of organic carbon, nitrogen, potassium and phosphorus.
2. Materials and Methods
2.1. Experimental Test Set Up
In order to understand the methane production and fertilizer production possibilities from anaerobic digestion of Gliricidia leaves, RPE and inoculum, a batch anaerobic digestion study with 4 treatments replicated thrice was conducted (Figure. 2). The four treatments in the experiment are as follows:
T1 – Inoculum (I) -(1000ml).
T2 – Inoculum (I): Rubber processing effluent (RPE): Gliricidia leaves slurry (GLS) - (1000ml:50 ml:50ml)
T3 – Inoculum (I): Rubber Processing Effluent (RPE): Gliricidia leaves slurry (GLS)- (1000ml:200 ml:200ml)
T4 – Inoculum (I): Rubber processing effluent (RPE): Gliricidia leaves slurry (GLS) - (1000ml:250 ml:250ml).
The iinoculum required for the experiment is collected in a sterilized container from a conventional biogas plant. Gliricidia leaves are collected directly from the tree. The leaves were grinded in a blender and made into a slurry by mixing with an equal amount of distilled water. RPE was collected from local rubber processing plant. Based on the measurements considered for test, three samples were taken for each content, all placed in pre-sterilized bottles. The samples were examined for their physicochemical parameters before and after anaerobic digestion with standardized procedures [19]. The substrate preparation is shown in Figure 2 (b). Four sets of reactors were used for experimental studies and the test set up of reactor is shown in Figure 2(c). These reactors were connected to the water displacement method for measuring gas volumes. The ends of all delivery tubes were well sealed to ensure there was no leakage. The prepared substrates were fed into the reactors and left to undergo anaerobic digestion for four weeks (28 days) of retention time frame, the gas yields were measured on weekly basis. The temperature was gauged, and the volume of gas was noted down of 32 celsius degree and normal atmospheric pressure.
2.2. Contents in the Substrates and Its Measurement
The contents of inoculum, RPE, and GLS were measured according to APHA standard methods [19]. The initial and final slurry samples in each treatment were analysed for TS, VS, pH and total volatile fatty acids (VFA) by standard methods [19].
2.2.1. Moisture Content
Moisture content generally increases biogas production. When the moisture content increases biogas production also increases. If the moisture content decreases, acetic acid will accumulate and it reasons to form a scum on the reactor surface, thereby inhibiting the production of methane [20]. If more water is added, the biogas production decreases when the retention time increases. Optimal moisture content is necessary to control the biogas production at an optimal level.
To measure the moisture content of inoculum and GLS, three samples of 50 g of substrate were collected and placed in beakers. These samples are then heated in an electric oven for 1 day (24 hr) at 105 0C. The weight of each beaker containing the test sample is then measured. Moisture content and total solids is then calculated using the following formula
Where,, are weight of the beaker 1, beaker 2 and beaker 3, respectively.
2.2.2. Total Solids
Total solids refer to the weight of the solids when the quantity of raw material digested per unit volume of slurry. Generally, solids content is divided into three series: possible concentrations of solids in anaerobic digestion systems are Low solids (LS) < 10% TS, Medium solids (MS) ≤ 15-20% and High solids (HS) ≥ 22-40% The system becomes unstable when total solids is very low and when the total solids are higher the system causes overloading. The number of acidogenic and methanogenic bacteria that are beneficial to anaerobic digestion decreases with increasing solid concentration after reaching an optimal value [21]. Total solids can be calculated using the same procedure of measuring moisture content, but using the flowing equation (2).
2.2.3. Volatile Solids
Volatile solids are the total weight loss of a substrate (excluding moisture) when the substrate is heated under controlled conditions without exposure to air. To measure the volatile solids, 2.26 gm of oven dried substrate is collected in a crucible and covered with lid. Then put these crucibles into the electric furnace at 900°C for 7 minutes. Then switch off the furnace and remove the crucibles when the temperature decreased to 250°C. Cool the crucible, then weigh it. Then calculate volatile solids and their percentage using equations (3) and (4) respectively.
2.2.4. Carbon Content
To measure the carbon content of the substrates, 10 grams of substrates are collected and dried in an electric oven at 105°C for 6 hours in a pre-weighed crucible and ignites the material in a Muffle furnace, a 650-700°C for 6-8 hrs. Then, these substrates are cooled to room temperature and store in a desiccator for 12 hours. Then the remaining contents are weighed.
2.2.5. Nitrogen Content
One gram of substrate is concentrated in Kjeldahl flask of total volume of 800 ml. This was further dissolved in distilled water, and then copper sulfate (0.7 g) K2SO4 (15 g) and concentrated H2SO4 (50 ml) was added. The flask was then heated at an angle until foam formation ceased. Then place the flask under the heat until the solution becomes clear, after which continue digestion for half an hour or 30 minutes. The solution is then left to cool. After that, add 200ml of H2O and swirl the mixture in order to dissolve the contents of the Burette. Transfer this solution to a 500 ml volumetric flask, stirring occasionally and keeping cool. Pour 25 ml into a flask and add 300 ml water and little amount of zinc powder. Collect 20 ml of acid standard solution and place in a conical flask. Finally, add a few drops which are more or less 4-5 drops of methyl red indicator and then submerge tit into the bottom of the condenser so that the last tip of the condenser is submerged into the acid solution. Then gradually, pour 30 ml of 45% NaOH to the flask to avoid mixing of contents. As soon as the distillation flask has been charged, it should be connected to the distillation apparatus and the contents should be swirled to make the mixture. The distillation process is carried out until all the ammonia gas is collected in the gas burette or at least 150 ml of distillate has been collected in the round bottom flask. If the smell of ammonia persists, test with red litmus paper to ensure that it is still releasing ammonia. To collect the titration sample, remove the collection bottle. Rinse the through the outlet tube with about 50 grams of distilled water into the receiving flask. Add a reagent of equal mass to the standard acid into the receiving bottle and calculate the blank value.
2.2.6. pH
The growth of microorganisms during anaerobic digestion process is significantly influenced by pH. The pH of the samples is measured using a digital pH meter MK- VI with pH range of 0-14 pH and a resolution of 0.01.
2.2.7. Volatile Fatty Acids
During anaerobic digestion, complex organic matter is hydrolyzed and fermented into short-chain volatile fatty acids (VFAs) (i.e., acetate, isobutyrate, propionate, butyrate, etc.), H, CO2, and alcohols, which are subsequently reduced to CH4 and CO2 [22]. The multitude of decomposition process during the process involved biological reactions occurring in the reactor are categorized in a sequence of four steps: phases corresponding to hydrolysis, acidogenesis, acetogenesis, and methanogenesis. VFAs are principally by bacteria in the acidogenesis step and are used as foods in the acetogenesis where the acetic acid is produced as a main product. For measuring VFA contents, the 18 ml medium is added in a 60 ml bottle, feed substrates were included in the following final concentrations 50 mM sodium acetate, 24 mM butyrate, 2 g/l glucose, 24 mM formate, 25 mM sodium propionate and 101 kPa H2/CO2 (80%: 20%) overpressure. In the control series the substrates were taken out from the culture media. The bottles were then filled with 2 mL of biodigester slurry and the experiments were conducted in an incubator at 35°C in covered stirred water.
2.2.8. Methane Yield
The main components of biogas are methane (CH4) and carbon dioxide (CO2), as well as a small number of other gases. Gas chromatographer is used to measure the methane yield of each experiments.
3. Results and Discussions
The following sections present and discuss the results of anaerobic co-digestion of rubber processing wastewater (RPE), Gliricidia leaves (GLS), and inoculum at different ratios based on methane production and manure quality. The results of the analyses done for various Physio-chemical characteristics of RLPE, Inoculum and GLS samples are given in Table 1.
3.1. pH
Average pH values measured at different intervals of time from the reactors set up at different mixing ratios of substrates are given in the Figure 3. When the ratio of GLS and RPE to inoculum increased, the pH value decreased. The experimental test, T3, in which inoculum, RPE, and GLS were mixed in the ratio of (10:2:2), gave the highest methane production of 9.21 L. In this experiment (T3), the pH value is lower, compared to other experiments (T1 and T2). pH value in this experiment ranges between 6.8 to 8 from 7th day to the 28th day. Literature also reported that higher methane yields were obtained at neutral pH between 6-7 [23]. The growth of microbes, which produce methane greatly influenced by the pH. Other studies also [24,25] also reported the methanogenic phase can be completed successfully at pH levels of 6.5-8.2. During digestion, hydrolysis and acidogenesis processes happens at acidic pH ranges of 5.5 – 6.5 while methanogenic stage happens at pH of 6.5 to 8.2 [25]. The amount of CO2 and VFA generated throughout anaerobic digestion affects the pH of the bio digester [26]. Sidihabib et al. (2024) [27] using Taguchi experimental design, it was found that when food waste and cow dung are anaerobically digested, the optimal condition for producing biogas is when pH is controlled to a value of 7.
3.2. Volatile Fatty Acids
The percentage of VFA produced at different time intervals from different experiments is shown in the Figure 3. It is shown that the anaerobic digestion of inoculum alone showed a constant and lower VFA production over the digestion period. Anaerobic digestion of inoculum alone (T1) showed an average VFA production of 632 Mg/L as given in Table 3. The methane production was also low in this experiment (T1) which is only 0.98 liters. During the digestion of inoculum, RPE and GLS in a mixing ratio of 10:0.5:0.5, (T2), the VFA production was higher in the first two weeks than experiment T1. The average VFA production in experiment T2 was 732 mg/L. In experiment T3 where inoculum, RPE and GLS mixed in a ratio of 10:2:2, VFA production was in an average of 3400 Mg/L. In this experiment, the methane production is maximum (9.21 litres) than other three experiments. In experiment T4, the average VFA increased to 7015.2 mg/L. But the average methane production reduced to 4.32 liters. Siegert et al. (2005) [28] in their studies reported an inhibition in the biogas production especially the volume of CH4 and CO2 when the initial mixture contained not more than 6 g/liter of volatile fatty acids. Experiment T4 reported a VFA of 7.015 g/L, which resulted in a decrease in methane production. Different conditions influence the formation of methane, and changes in bacterial function due to substrate or product accumulation may be expected when these parameters are taken to the limit. For instance, high levels of volatile fatty acids (VFA) in a system led to the process of methanogenesis being suppressed [29,30]. When the system is overloaded more or less or in the presence of inhibitors, the rate at which hydrogen and volatile fatty acids are produced surpasses the rate at which they are degraded by the methanogenic microorganisms. The end product is built up of different acids while the buffering capacity and pH level are lowered to a certain point, which also hinders the hydrolysis/acidogenesis phase. It has also been identified that even if the process pH is within the set range, the concentration of VFAs may result in a slower rate of hydrolysis o or inhibition at high concentration (>10 g/liter). Inhibitory observations have shown that when VFAs use glucose as the main substrate, it inhibits the number of fermenting bacteria [31].
3.3. C/N Ratio
Carbon and nitrogen content of the subtrates are measured as per the procedure given in Section 2.2.4 and Section 2.2.5. C/N ratio is the ratio of amount of carbon (C) and nitrogen (N) present in substrates. The average C/N ratio of the substrate samples before and after anaerobic digestion is shown in Figure 5. The substrate samples before anaerobic digestion showed higher C/N ratio than the substrates after anaerobic digestion. The C/N ratios of all substrate samples before digestion (including inoculum and inoculum mixed with RPE and GLS at different mixing ratios) were in the range of 15–16. After digestion, it is gradually reduced to 9-11. Anaerobic digestion was much depending on the C/N ratio, if the C/N ratio is low it reasons to reduce the pH to 8. 5. This inhibits ammonia, which is toxic to the methanogenic bacteria. On the contrary, the methanogens use the nitrogen in a very short time and therefore the flow of the gases is reduced [23]. Feeding different mixes of substrates can increase the content of phosphorus and other nutrients while maintaining a balanced C/N ratio. According to the findings, the nitrogen content is utilized very quickly, especially when the C/N ratio increases before the carbon digestion. [32]. Whenever the C/N ratio declines, it hinders the development of microbial mass and results in the enhancement of accumulation of ammonium. Higher C/N ratio suggests the absence of the required nitrogen for its growth and functioning of the microbials on the other hand low C/N states that the nitrogen present in the ammonia form, thus a high pH [33]. This response means that, the higher the C/N ratio, the lower the buffering capacity of the reactor. As C/N ratio depends on the substrate as well as on the inoculum; then the economical C/N ratio would be in regard to the substrate or a co-substrate along with other operational parameters of the system [34]. Here experiment T3, in which the C/N ratio was changed from 15 to 8 during anaerobic digestion, showed the highest methane production.
3.4. Methane Procuction
Methane production from the reactors at different intervals where substrates are fed at different mixing ratios are shown in Figure 6. From the results, it can be inferred that the methane yield of the substrate mixed with RPE and GLS mixed with the inoculum was higher than that of the substrate of inoculum alone. The substrate samples from experiment T3, where the Inoculum, RPE and GLS mixed in a ratio of 1000ml:200ml:200ml showed the highest methane production of 9.21 liters. In experiment T2, methane production was higher in the first week. But when the retention time increases, the methane production decreases. This response may be due to the lower content of GLS compared to T3 and T4. The average methane production in all weeks was higher in experiment T3 compared to the other experiments. In experiment T4, methane production was suppressed after the first week. This response is due to overloading of the digestor. The results showed that the substrate mixing ratio for achieving maximum biogas production was inoculum, GLS, and RPE of 10:2:2. The methane production rate of experiments where the substrates are mixed at different mixing ratios compared to methane production from inoculum alone is shown in Figure 7.
3.3. Volatile Solid Reduction
The reduction in volatile solids and their dry basis percentage is determined as detailed in Section 2.2.3. As shown in Table 2, when the contents of Gliricidia and RPE are increased, the reduction of volatile solids showed a decreasing trend. The reduction in volatile solids doubled when the RPE and GLS ratio decreased. Overloading the digester resulted in a decrease in the percentage of volatile solids reduction. The study by nallathambi Gunaseelan (1988) [18] also reported the same changes in bulk fermentation of Gliricidia leaves.The amount of volatile solids in a percentage dry basis before and after anaerobic digestion are shown in Figure 8 and Figure 9, respectively.
4. Organic Manure Content
4.1. Total Organic Carbon
After anaerobic digestion, the percentage of total organic carbon in the substrate samples have reduced to an amount of 21.4%,23.3%,28% and 10% of T1, T2, T3 and T4 respectively. This reduction of carbon content is the use of carbon for the methane production. The substrate samples after anaerobic digestion in experiment T3 showed the highest percentage of total organic carbon. The substrate samples of T3 (inoculum: RPE: GLS (10:2.5:2.5)), the carbon content is increased by 18.5% over the substrate sample of inoculum alone. Organic carbon is higher than other elements (N, P and K) in the substrates. The organic carbon in the manure have been found to assist in the enhancement of the physical properties of the soil as well as in the capacity of the soil to conserve water. Incidentally, the carbon back to the soil through the use of carbon enriched manure help decrease the amount of carbon in the atmosphere.
4.2. Kjeldahl Nitrogen
After anaerobic digestion, the percentage of Kjeldahl Nitrogen in the substrate samples have increased to an amount of 7.14%,30.55 %,34.18% and 17.5 % of T1, T2, T3 and T4 respectively. The substrate sample after anaerobic digestion in experiment T3 (inoculum: RPE: GLS (10:2:2)) showed the highest percentage of Kjeldahl nitrogen. The Kjeldahl nitrogen content increased by 46.1% compared with the substrate sample from experiment T1. Nitrogen is an important macronutrient, in plants, the availability of this macronutrient is a requirement for higher yields. The primary sources of nitrogen that plants can directly uptake include nitrate and ammonium; but these two ions are scarce in agricultural and natural ecosystems. In order to meet the required production of crops, and the nutritional needs of the growing world population, greater than 110 Tg of N fertilizer is used throughout the world in crops annually and thus, the demand for agricultural nitrogen fertilizer is on the rise [35]. However, improper fertilization methods and excessive nitrogen fertilizer application lead to low nitrogen use efficiency, where around 50-70% of N is leached to the environment thereby causing environmental issues like soil acidification and water eutrophication [36].
4.3. Phosphorous
After anaerobic digestion, the percentage of Phosphorous in the substrate samples from experiment T1 have reduced by an amount of 5.89%. But in samples from substrates of experiments of T2, T3 and T4 have increased to an amount of 4 %,10.6% and 1.3 % respectively. Substrate samples from experiment, T1 showed the highest percentage of phosphorous content followed by T2, T3 and T4. When the amount of GLS and RPE increases, the phosphorus content reduces. But after anaerobic digestion the quantity of phosphorous in the initial substrate samples is increased. Phosphorus is an important input in the transformation of the sun’s energy into plant food, textile fiber and edible oil. Phosphorus is involved in the synthesis of carbohydrates and proteins, energy production, cell replication and growth. The phosphorus helps in root development, assists in early shoot development, has rapid growth of ground layer coverage to prevent soil erosion, and improves the quality of fruiting vegetables and grains as well as seed formation. Phosphorus enhances the uptake of water, enhances utilization of other nutrients such as nitrogen, assisted on disease control in some plants, enhance plant ability to withstand coldness and water deficit, reduces time of maturation and protects the environment through better plant production. Phosphorus in soil is insoluble and to be absorbed by plant roots, it has to be in soluble form, that is in the solution in soil water. There is no phosphorus in a solution in the soil water due to low solubility and hence phosphorus must be replenished in the solution from mineral and organic sources to replenish the amount being taken up by the plants. Phosphorus that exists in the additional forms entrapped in the soil organic matter cannot be absorbed and assimilated by the plants directly; the process requires degradation and simplification of the organic compounds through the action of microbes in the soil. Plant roots are assumed to take up phosphorus in soluble inorganic, particularly in the form of orthophosphate ions. Soil factors influence phosphorus availability for plant growth and include the type and quantity of clay minerals, phosphorus content, aeration compaction, supply of other essential nutrients, soil moisture regime, temperature affecting root growth and development, and the root vigor of the plant species. Furthermore, soil acidity of alkaline or acidic nature has a significant impact in determining the availability of phosphorus in the surrounding plants.
4.4. Potassium
After anaerobic digestion, the percentage of potassium in the substrate samples from experiment T1, T2, T3 and T4 have increased to an amount of 50%,29.31 %,26.8% and 10.4 %, respectively. Substrate samples from experiment, T4 showed the highest percentage of potassium content followed by T3, T2 and T1. When the amount of GLS and RPE increases, potassium levels also increase. However, after anaerobic digestion, the potassium content in the substrate samples increased. Potassium (K) is the maximum number of inorganic cations in the nutrient solution for optimal plant growth. The potassium ion K is involved in the activation of dozens of vital enzymes like proteins Synthesis, sugar transport mechanism, metabolic function, and photosynthesis. It has been found to have the potential of playing an active role in yield and quality improvement formation. K is also very essential for cell division purpose is tough to be very crucial in the functioning and growth of the plant.
Conclusions
This study analyzed the anaerobic co-digestion of inoculum, rubber plant effluent and Gliricidia leaves for the simultaneous production of methane and organic fertilizer. The results were analyzed for volatile fatty acids, pH, C/N ratio, volatile solid reduction and methane production. The substrate samples before anaerobic digestion showed higher C/N ratio than the substrates after anaerobic digestion. The study showed that when the volatile fatty acids increased after an optimal value the methane production has reduced. The substrate mixing ratio for achieving maximum biogas production was inoculum, GLS, and RPE of 10:2:2. The organic quality of the substrate mixture before and after anaerobic digestion was analyzed for nitrogen, potassium and phosphorus content by standard methods. After digestion, the organic carbon content in the slurry decreased, while other contents (potassium, phosphorus, and nitrogen) has increased. When the inoculum was mixed with gliricida leaves and rubber plant effluent, the methane production and quality of the fertilizer were improved. This study introduces a detailed procedure for the effective treatment and utilization of rubber waste water.This research also recommends the planting of rubber trees and Gliricidia maculata to promote economic development in Mauritania.
Author Contributions
The formal analysis, investigation, resources, data curation, writing—original draft preparation: writing—review and editing, and visualization were conducted by S.S.H. and S. K.M. Editing and visualization done by A.J. The supervision, project administration, and funding acquisition were carried out by S.T. All authors have read and agreed to the published version of the manuscript.
Funding
The authors are very thankful for providing funding for this project under the grant ni 0145-5247 by Kumamoto University, Japan.
Data Availability Statement
The research data can be provided on request.
Acknowledgments
The authors are thankful for the staff of the Department of Mechanical Engineering, Kumamoto University, Japan, for their technical support.
Conflicts of Interest
The authors declare no conflicts of interest.
References
- Habib, S.S.; Torii, S. Biogas as Alternative to Liquefied Petroleum Gas in Mauritania: An Integrated Future Approach for Energy Sustainability and Socio-Economic Development, Clean Technologies. 2024, 6, 453–470.
- Leong, S.T.; Muttamara, S.; Laortanakul, P. Reutilization of wastewater in a rubber-based processing factory: A case study in southern thailand. Resources, Conservation and Recycling 2003, 37, 159–172. [Google Scholar] [CrossRef]
- Rungruang, N.; Babel, S. Treatment of natural rubber processing wastewater by combination of ozonation and activated sludge process. In: International Conference on Environmental Research and Technology (ICERT 2008), Parkroyal Penang, Malaysia. 2008,259- 26.
- Nhu Hien, N.; Van Tuan, D.; Nhat, P.T.; Thi Thanh Van, T.; Van Tam, N.; Xuan Que, V.O.N.; Phuoc Dan, N. Application of oxygen limited autotrophic nitritation/denitrification (Oland) for anaerobic latex processing wastewater treatment. Int. Biodeterior. Biodegrad. 2017, 124, 45–55. [Google Scholar] [CrossRef]
- Asia, I.O.; Akporhonor, E.E. Characterization and Physicochemical treatment of Wastewater from Rubber processing factory. Int. J. Phys. Sci. 2007, 2, 61–67. [Google Scholar]
- Chua, E.T.; Garces, L.R. Waste Management in the Coastal Areas of the ASEAN Region: roles of governments, banking institutions, donor agencies, private sector and communities. World Fish Center. 1992,117-126.
- Hutagalung, R.L. Use of carbohydrate residues in Malaysia. 2003, Department of Animal Sciences, University Pertanian Malaysia, Serdang, Selangor, Malaysia.
- Tekasakul, P.; Tekasakul, S. Environmental problems related to natural rubber production in Thailand. Aerosol. Res. 2006, 21, 21,122–129. [Google Scholar]
- Tanikawa, D.; Kataoka, T.; Sonaka, H.; Hirakata, Y.; Hatamoto, M.; Yamaguchi, T. Evaluation of key factors for residual rubber coagulation in natural rubber processing wastewater. J. Water Process Eng. 2020, 33, 101041. [Google Scholar] [CrossRef]
- Watari, T.; Thao, P.T.; Hirakata, Y.; Hatamoto, M.; Tanikawa, D.; Syutsubo, K.; Huong, N.L.; Tan, N.M.; Fukuda, M.; Yamaguchi, T. Process performance and microbial community structure of an anaerobic baffled reactor for natural rubber processing wastewater treatment. Lecture Notes in Civil Engineering 2017, 245–252.
- Brooks, A.; Iyakndue, M.; Unimke, A.; Agbo, B. Rubber effluent bio-analyses and its impacts on the microbial community structure of the soil in Calabar, Nigeria. Asian J. Environ. & Ecol. 2017, 4, 1–9. [Google Scholar]
- Warren-Thomas, E.; Dolman, P.M.; Edwards, D.P. Increasing demand for natural rubber necessitates a robust sustainability initiative to mitigate impacts on tropical biodiversity. Conserv. Lett. 2015, 8, 230–241. [Google Scholar] [CrossRef]
- Arimoro, F.O. Impact of rubber effluent discharges on the water quality and macroinvertebrate community assemblages in a forest stream in the Niger Delta. Chemosphere 2009, 77, 440–449. [Google Scholar] [CrossRef]
- Jawjit, S.; Liengcharernsit, W. Anaerobic treatment of concentrated latex processing wastewater in two-stage upflow anaerobic sludge Blanketa paper submitted to the Journal of Environmental Engineering and Science. Can. J. Civ. Eng. 2010, 37, 805–813. [Google Scholar] [CrossRef]
- Martinez-Hernandez, E.; Hernandez, J.E. Conceptualization, modeling and environmental impact assessment of a natural rubber techno-ecological system with nutrient, water and energy integration. J. Clean. Prod. 2018, 185, 707–722. [Google Scholar] [CrossRef]
- Atagana, H.I.; Ejechi, B.O.; Ogodu, M.I. Environmental Monitoring and Assessment 1999, 59, 145–154.
- Tran, P.T.; Watari, T.; Hirakata, Y.; Nguyen, T.T.; Hatamoto, M.; Tanikawa, D.; Syutsubo, K.; Nguyen, M.T.; Fukuda, M.; Nguyen, L.H.; Yamaguchi, T. Anaerobic baffled reactor in treatment of natural rubber processing wastewater: Reactor performance and analysis of Microbial Community. J. Water Environ. Technol. 2017, 15, 241–251. [Google Scholar] [CrossRef]
- Nallathambi Gunaseelan, V. Anaerobic digestion of Gliricidia leaves for biogas and organic manure. Biomass 1988, 17, 1–11. [Google Scholar] [CrossRef]
- American Public Health Association (APHA),Standard Method for Examination of Water and Wastewater/American Water Works Association/Water Environmental Federation,1999, Washington DC.
- Hernández-Berriel, Ma. C.; Márquez-Benavides, L.; González-Pérez, D.J.; Buenrostro-Delgado, O. The effect of moisture regimes on the anaerobic degradation of municipal solid waste from Metepec (México). Waste Management 2008, 28.
- Liu, C.; Li, H.; Zhang, Y.; Si, D.; Chen, Q. Evolution of microbial community along with increasing solid concentration during high-solids anaerobic digestion of sewage sludge. Bioresour. Technol. 2016, 216, 87–94. [Google Scholar] [CrossRef]
- Ahring, B.K.; Ibrahim, A.A.; Mladenovska, Z. Effect of temperature increase from 55 to 65°C on performance and microbial population dynamics of an anaerobic reactor treating cattle manure. Water Res. 2001, 35, 2446–2452. [Google Scholar] [CrossRef]
- Mata-Alvarez, J.; Macé, S.; Llabrés, P. Anaerobic Digestion of Organic Solid Wastes. an Overview of Research Achievements and Perspectives. Bioresour. Technol. 2000, 74, 3–16. [Google Scholar] [CrossRef]
- Khalid, A.; Arshad, M.; Anjum, M.; Mahmood, T.; Dawson, L. The Anaerobic Digestion of Solid Organic Waste. Waste Manag. 2011, 31, 1737–1744. [Google Scholar] [CrossRef]
- Ward, A.J.; Hobbs, P.J.; Holliman, P.J.; Jones, D.L. Optimisation of the Anaerobic Digestion of Agricultural Resources. Bioresour. Technol. 2008, 99, 7928–7940. [Google Scholar] [CrossRef]
- Yuan, Y.; Bian, A.; Zhang, L.; Chen, T.; Pan, M.; He, L.; Wang, A.; Ding, C. A combined process for efficient biomethane production from corn straw and cattle manure: Optimizing C/N ratio of mixed hydrolysates. BioResources 2019, 14, 1347–1363. [Google Scholar] [CrossRef]
- Sidi Habib, S.; Torii, S.; S, K.; C. A., A. Optimization of the factors affecting biogas production using Taguchi design of Experiment Method 2024.
- Siegert, I.; Banks, C. The effect of volatile fatty acid additions on the anaerobic digestion of cellulose and glucose in batch reactors. Process Biochem. 2005, 40, 3412–3418. [Google Scholar] [CrossRef]
- Ahring, B.K.; Westermann, P. Product inhibition of butyrate metabolism by acetate and hydrogen in a thermophilic Coculture. Appl. Environ. Microbiol. 1988, 54, 2393–2397. [Google Scholar] [CrossRef]
- Fukuzaki, S.; Nishio, N.; Shobayashi, M.; Nagai, S. Inhibition of the fermentation of propionate to methane by hydrogen, acetate, and propionate. Appl. Environ. Microbiol. 1990, 56, 719–723. [Google Scholar] [CrossRef] [PubMed]
- van den Heuvel, J.C.; Verschuren, P.G.; Beeftink, H.H.; de Beer, D. Determination of the critical concentration of inhibitory products in a repeated fed-batch culture. Biotechnol. Tech. 1992, 6, 33–38. [Google Scholar] [CrossRef]
- Hills, D.J. Effects of Carbon: Nitrogen Ratio on Anaerobic Digestion of Dairy Manure. Agric. Wastes 1979, 1, 267–278. [Google Scholar] [CrossRef]
- MATHERI, A.N.; NTULI, F.; BELAID, M.; SEODIGENG, T.; NGILA, J.C. Modified gompertz model of biogas production from co-digestion of sewage sludge and food waste. IAENG Transactions on Engineering Sciences 2017.
- Zhang, C.; Su, H.; Baeyens, J.; Tan, T. Reviewing the anaerobic digestion of food waste for biogas production. Renew. Sustain. Energy Rev. 2014, 38, 383–392. [Google Scholar] [CrossRef]
- Schroeder, J.I.; Delhaize, E.; Frommer, W.B.; Guerinot, M.L.; Harrison, M.J.; Herrera-Estrella, L.; Horie, T.; Kochian, L.V.; Munns, R.; Nishizawa, N.K.; Tsay, Y.-F.; Sanders, D. Using membrane transporters to improve crops for sustainable food production. Nature 2013, 497, 60–66. [Google Scholar] [CrossRef]
- Guo, S.; Kaldenhoff, R.; Uehlein, N.; Sattelmacher, B.; Brueck, H. Relationship between water and nitrogen uptake in nitrate- and ammonium-supplied phaseolus vulgaris L. plants. J. Plant Nutr. Soil Sci. 2007, 170, 73–80. [Google Scholar] [CrossRef]
Figure 1.
(a) Gliricidia Maculata tree (b) Natural rubber production process.
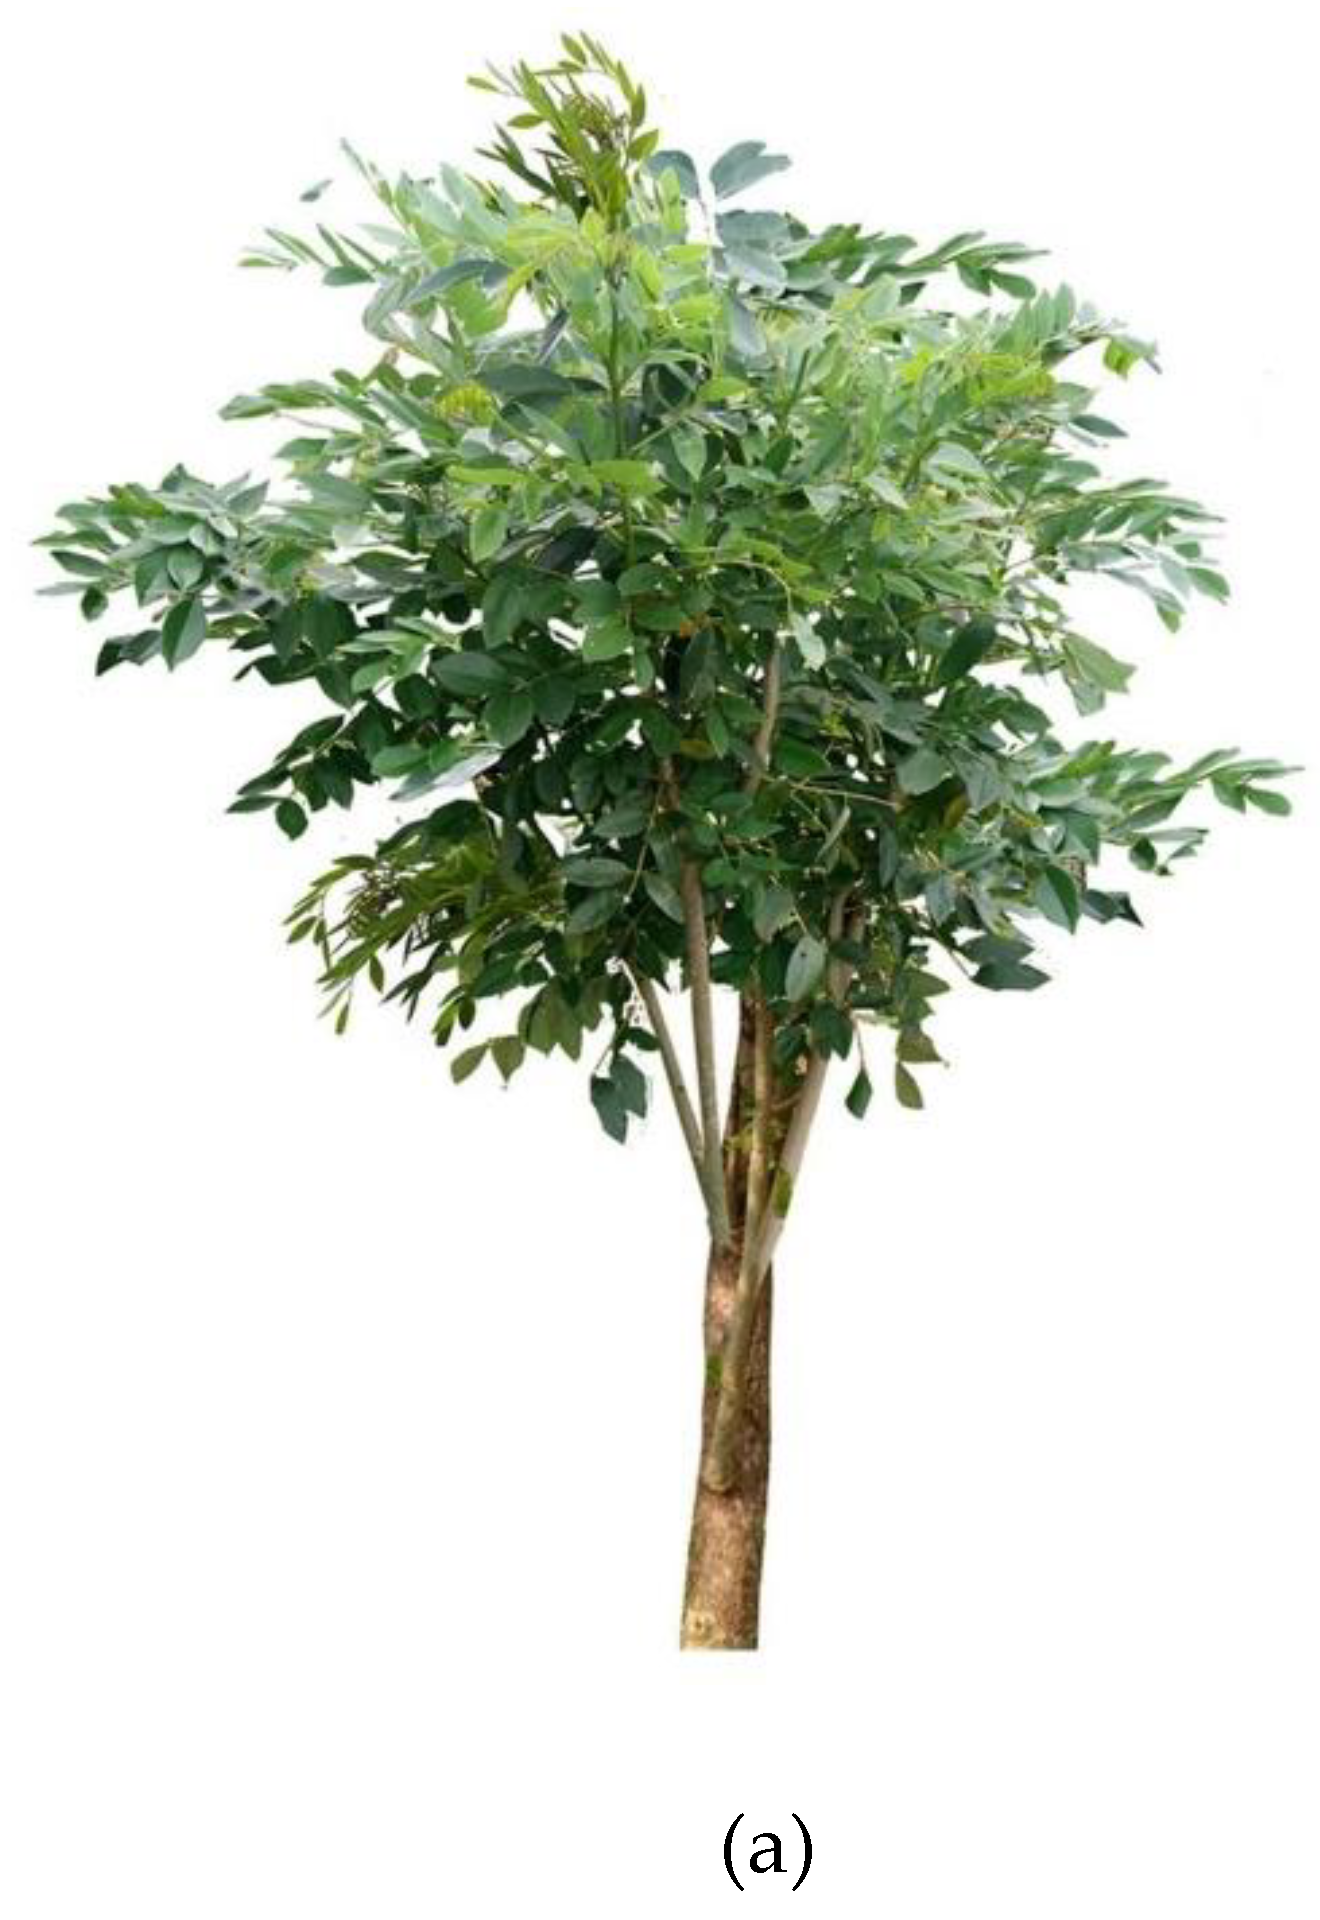
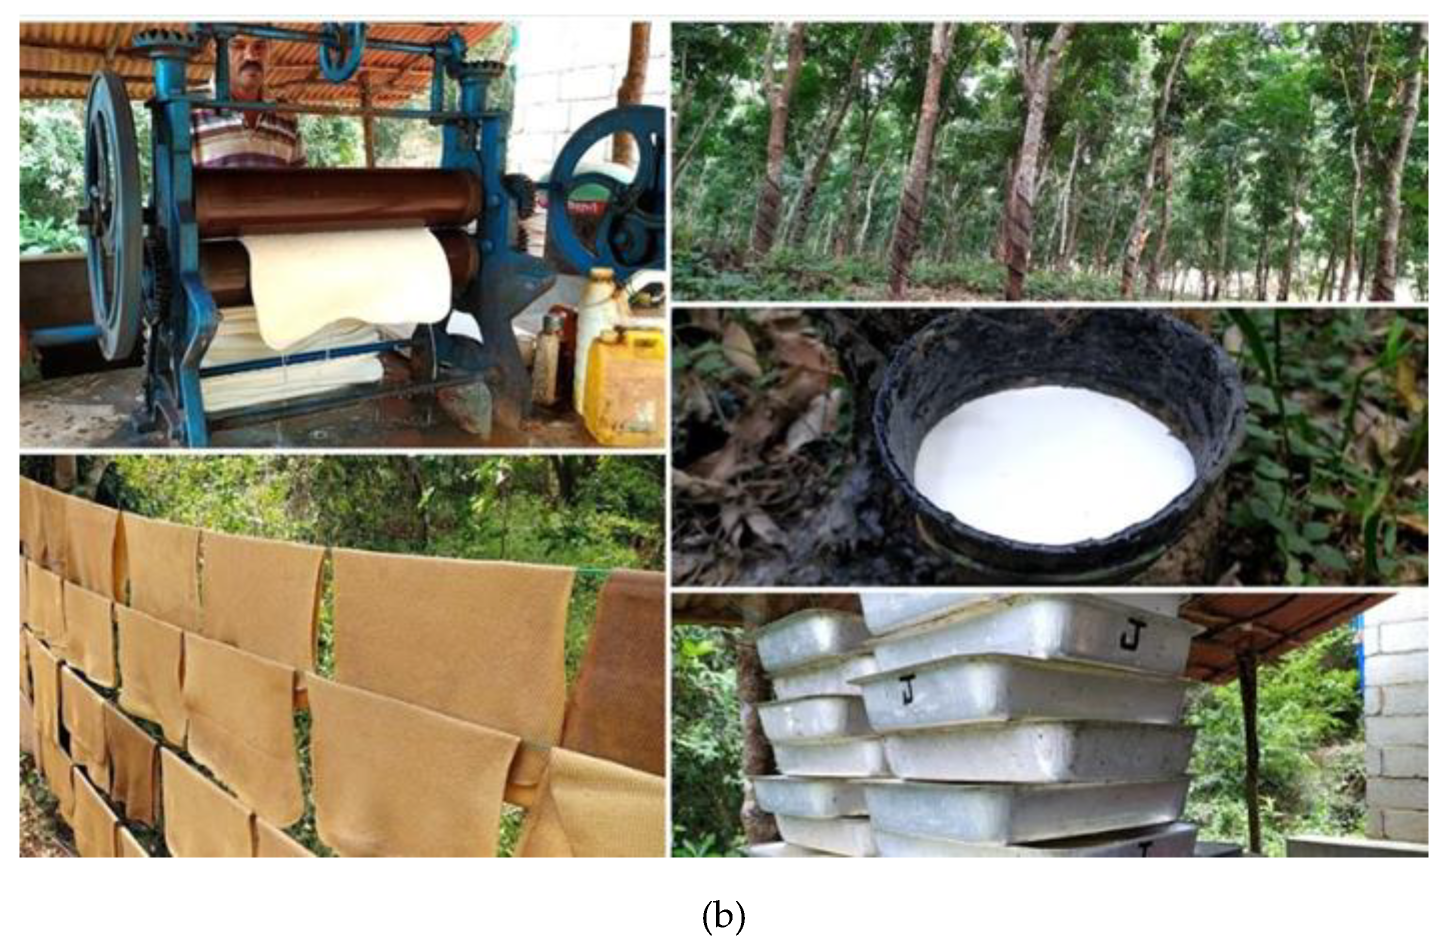
Figure 2.
(a) Collected Gliricidia leaves (b) Collected inoculum, RPE and GLS for experimental test (c) reactor for anaerobic digestion (d) Slurry collection for testing.
Figure 2.
(a) Collected Gliricidia leaves (b) Collected inoculum, RPE and GLS for experimental test (c) reactor for anaerobic digestion (d) Slurry collection for testing.
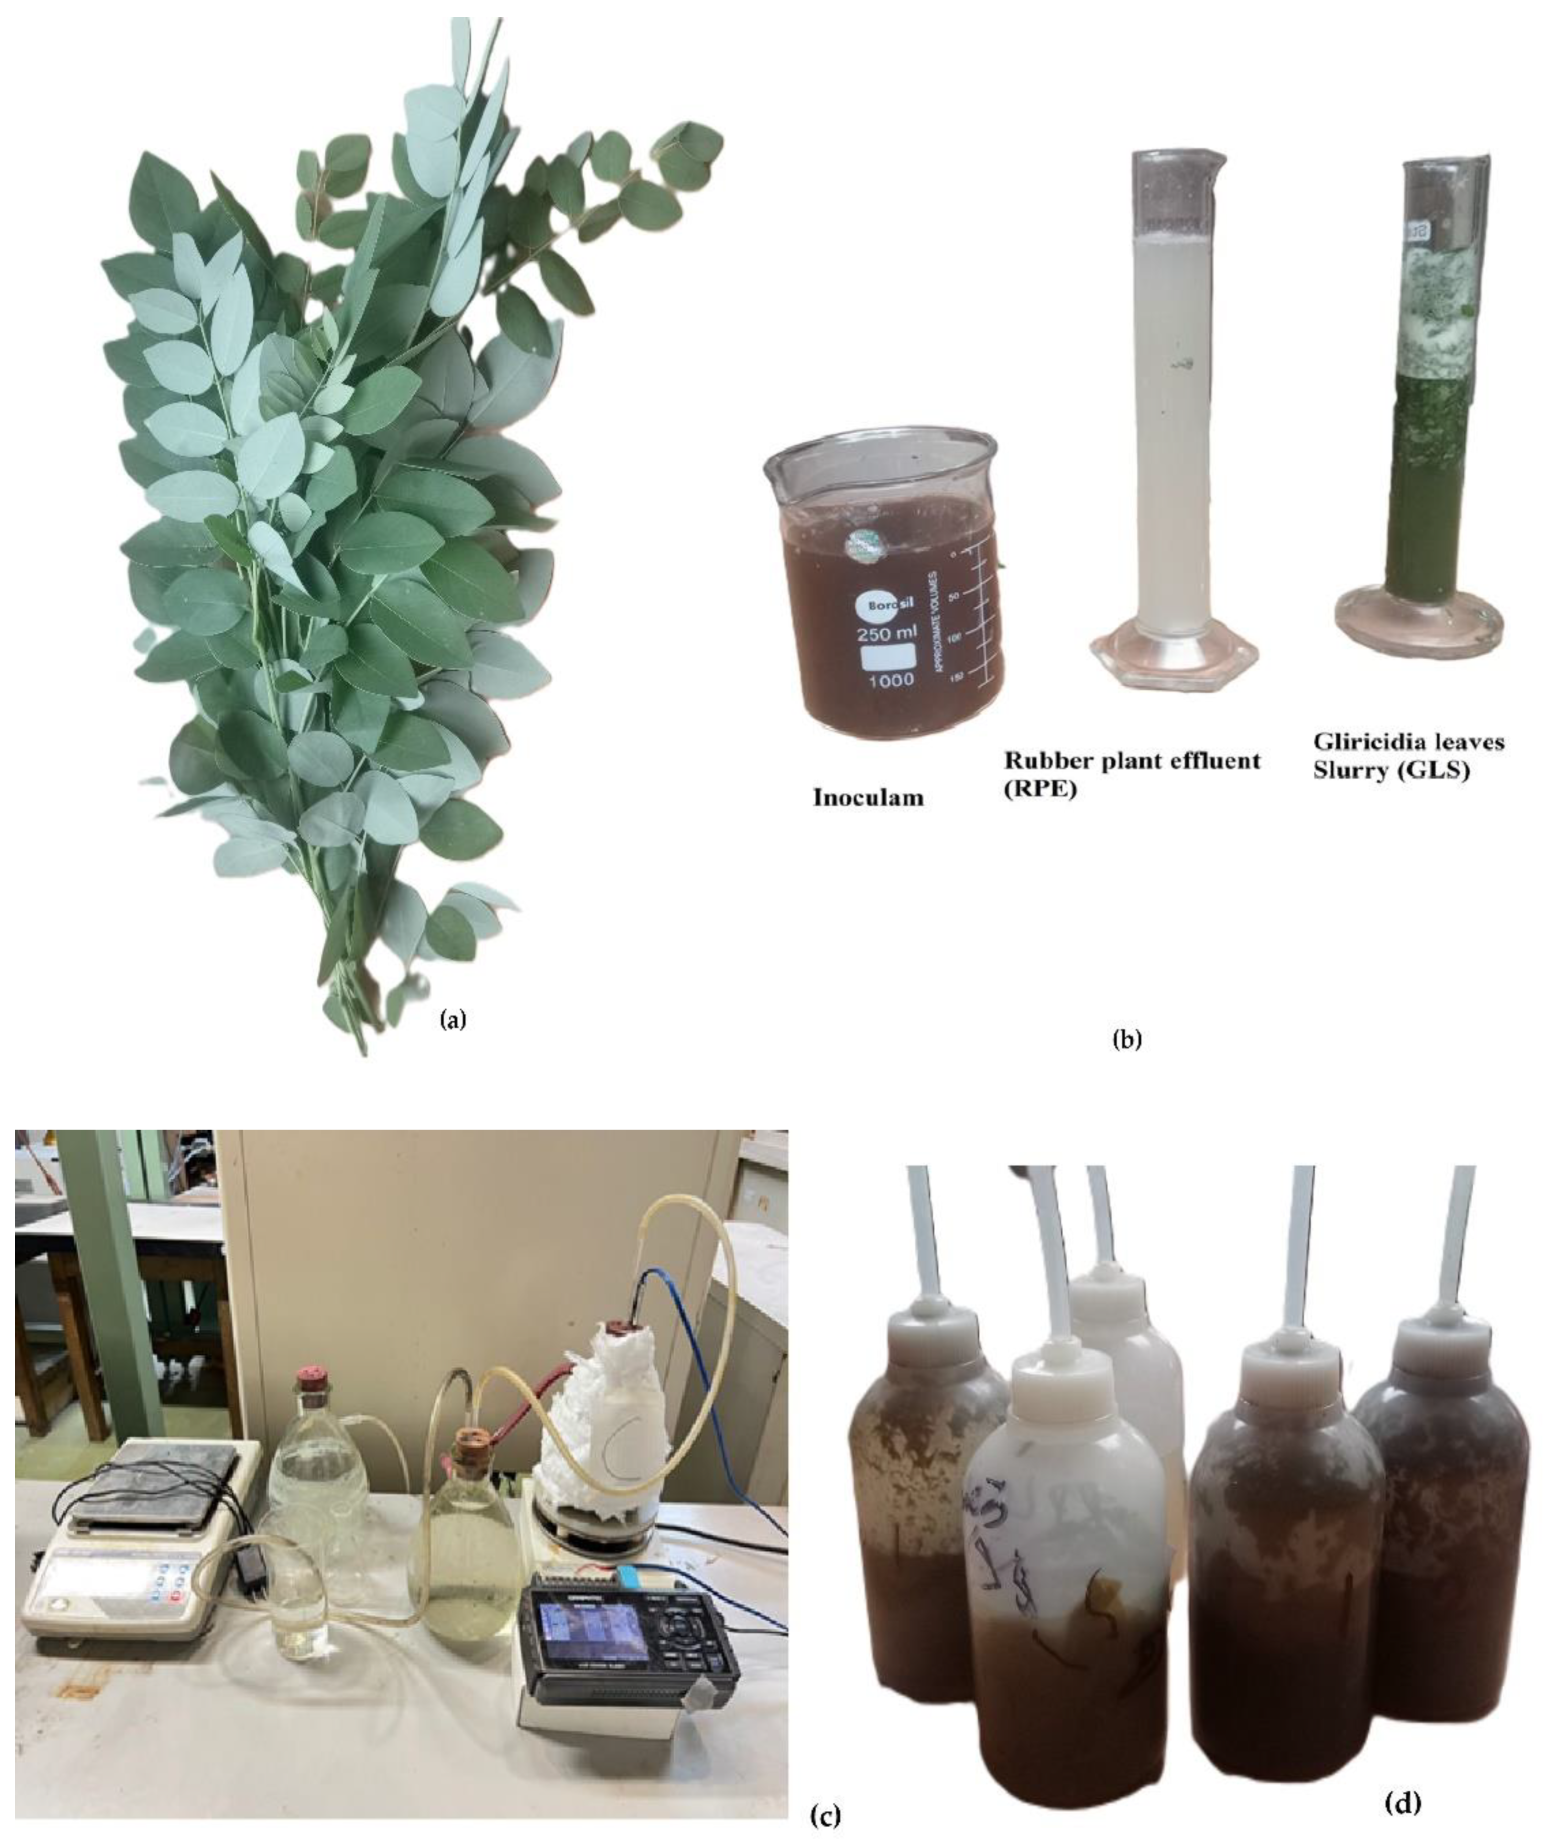
Figure 3.
Average pH of experiments at different time intervals.
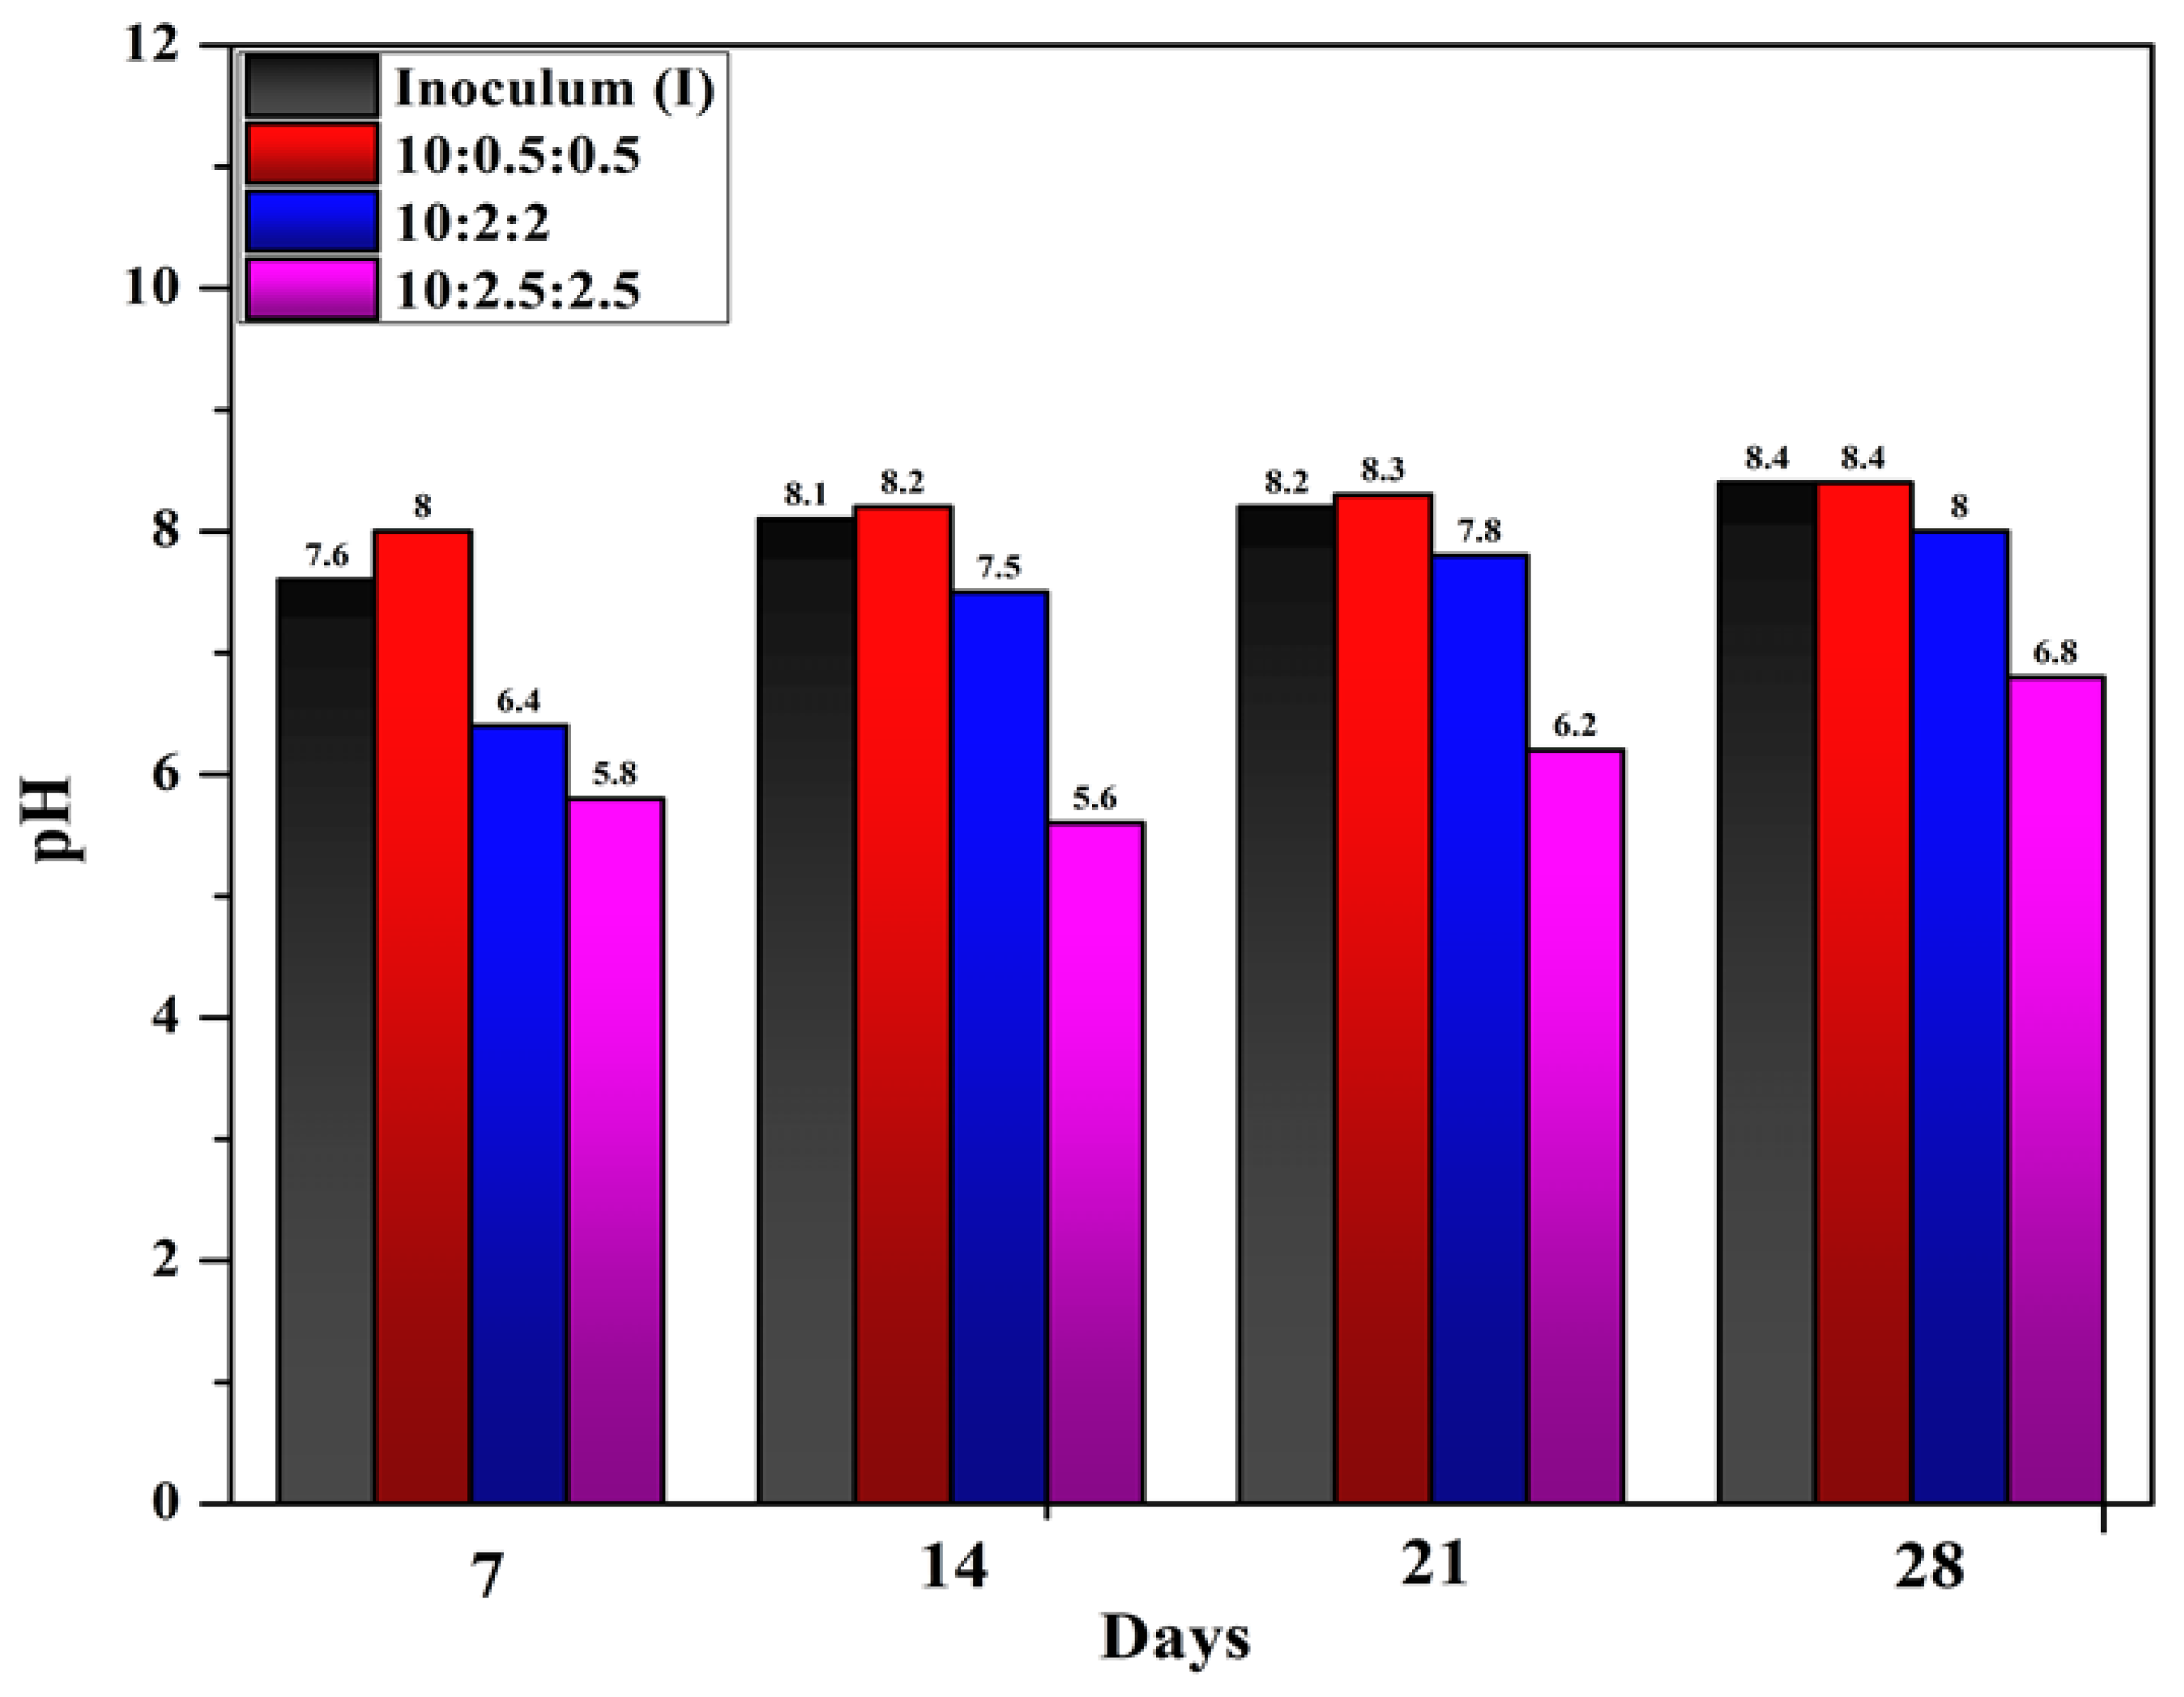
Figure 4.
Percentage of volatile fatty acids produced at different time intervals.
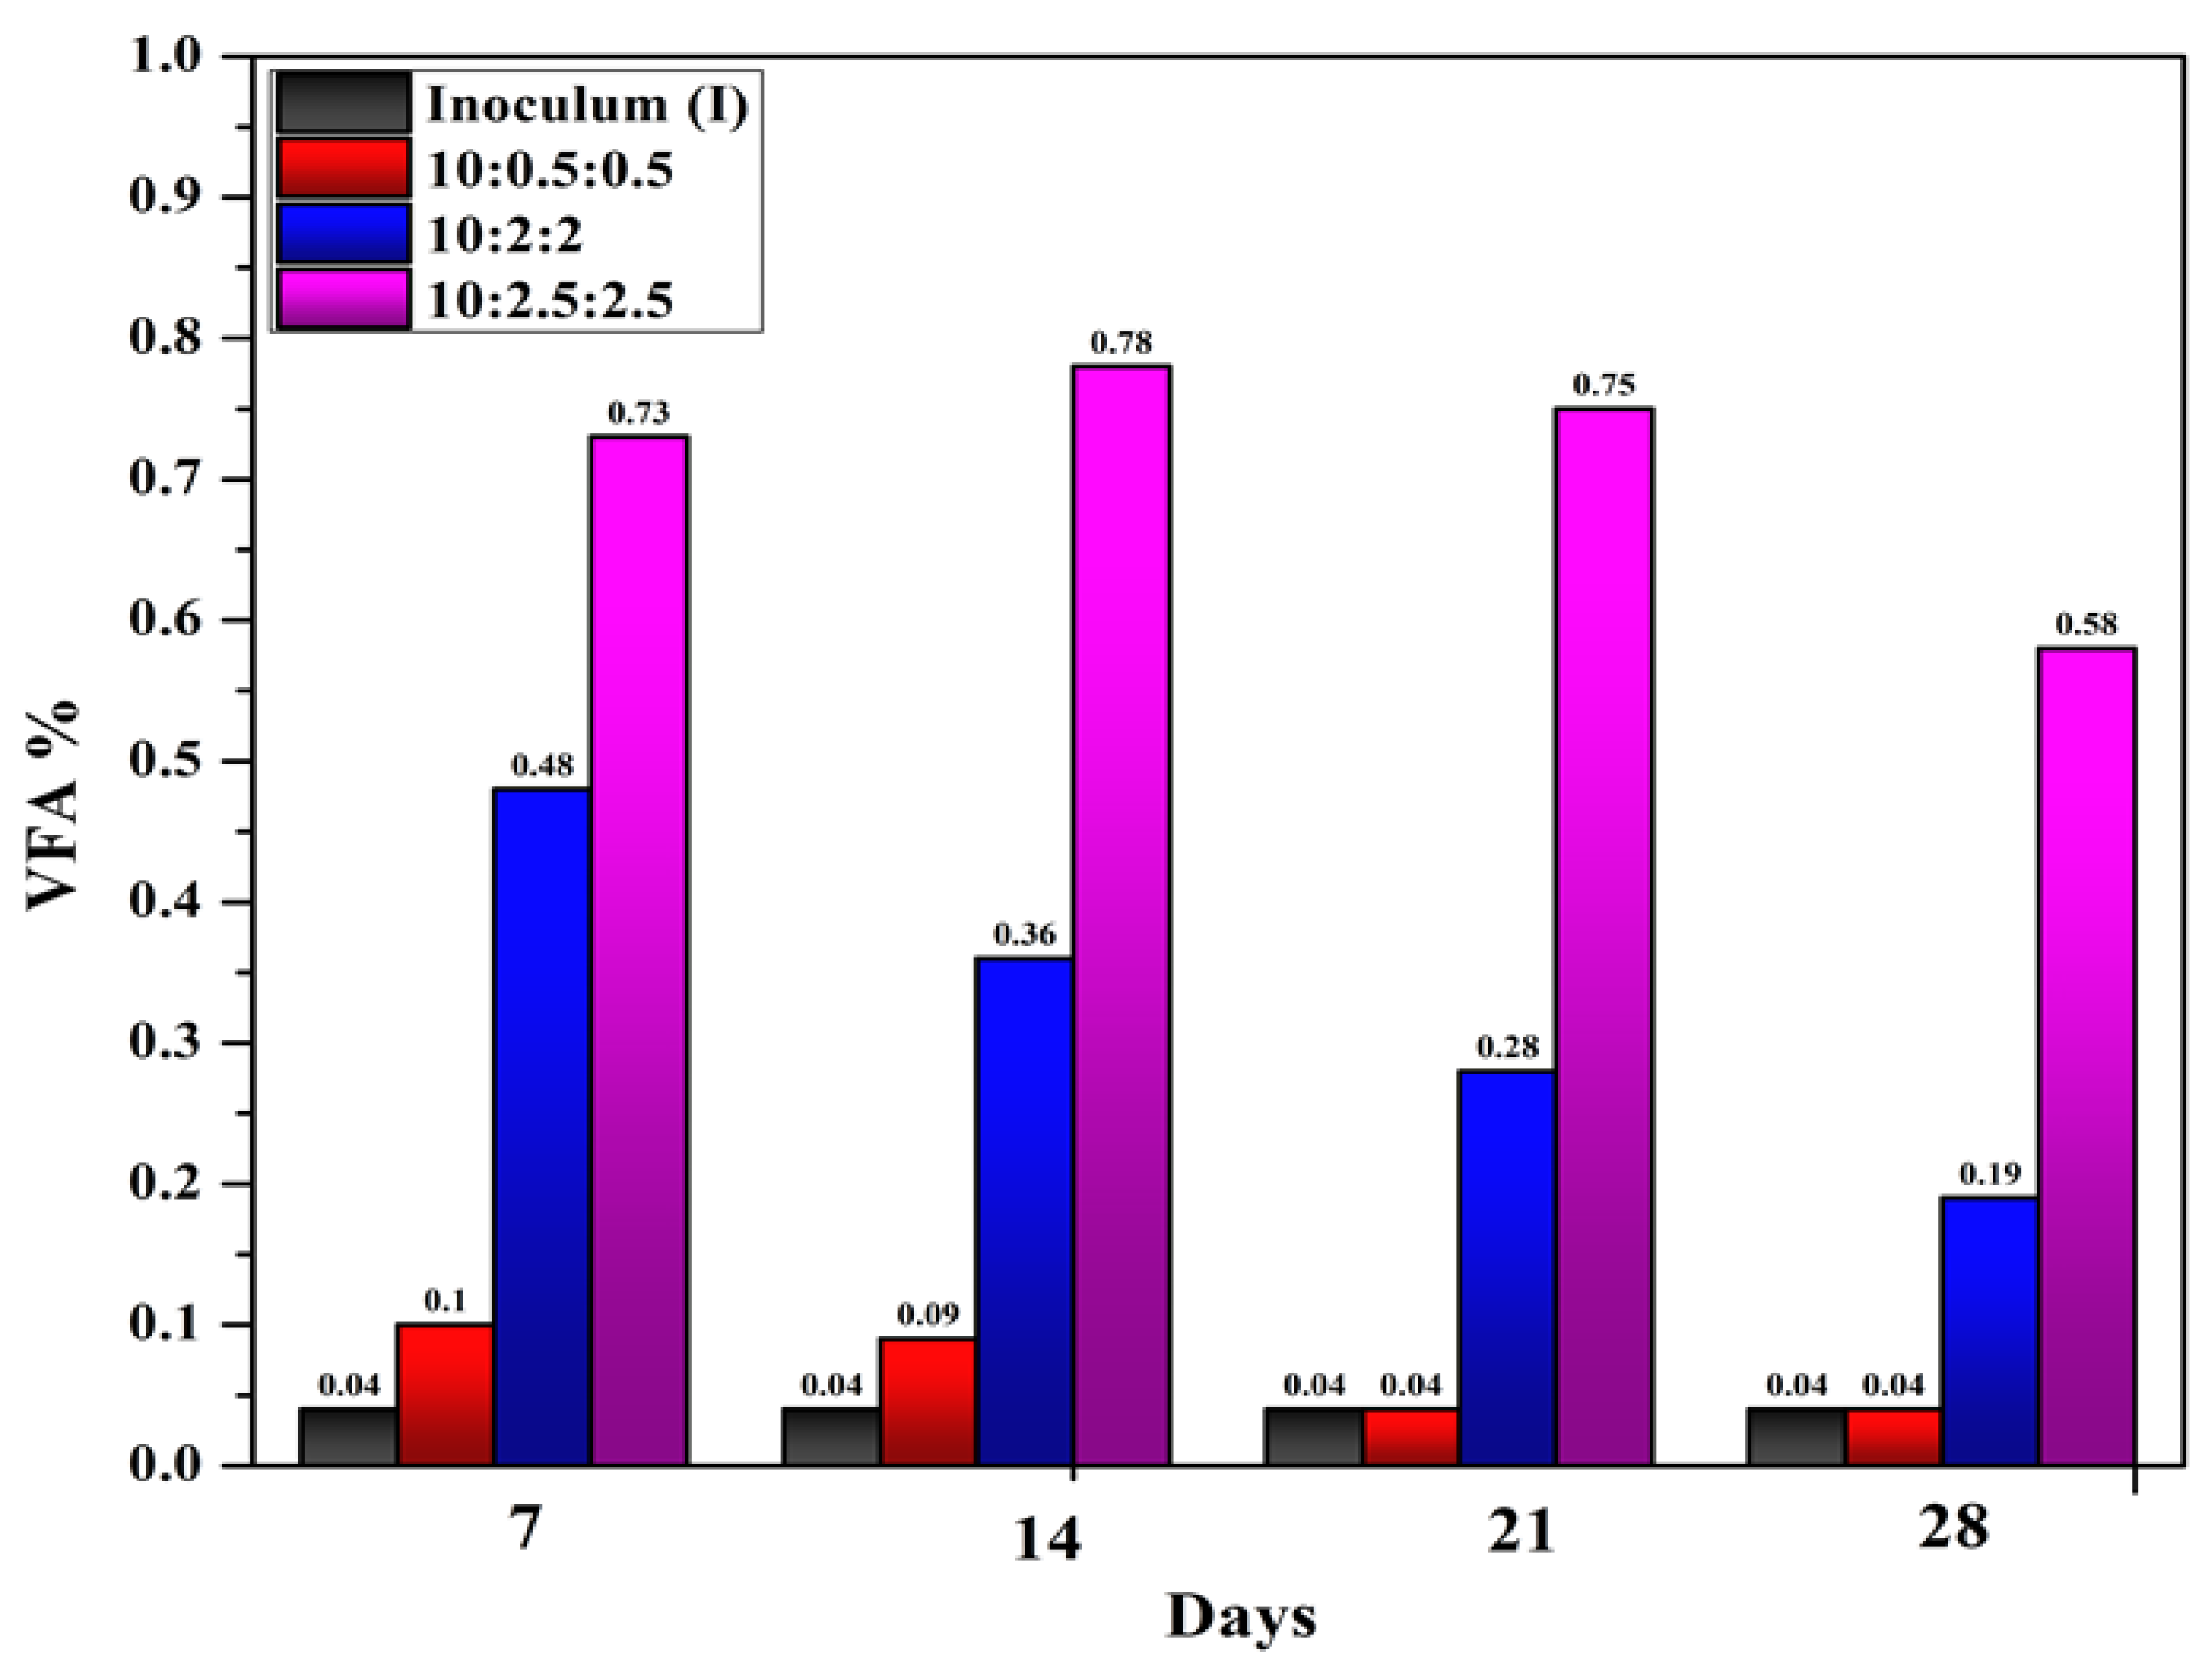
Figure 5.
C/N ratio of substrates before and after anaerobic digestion.
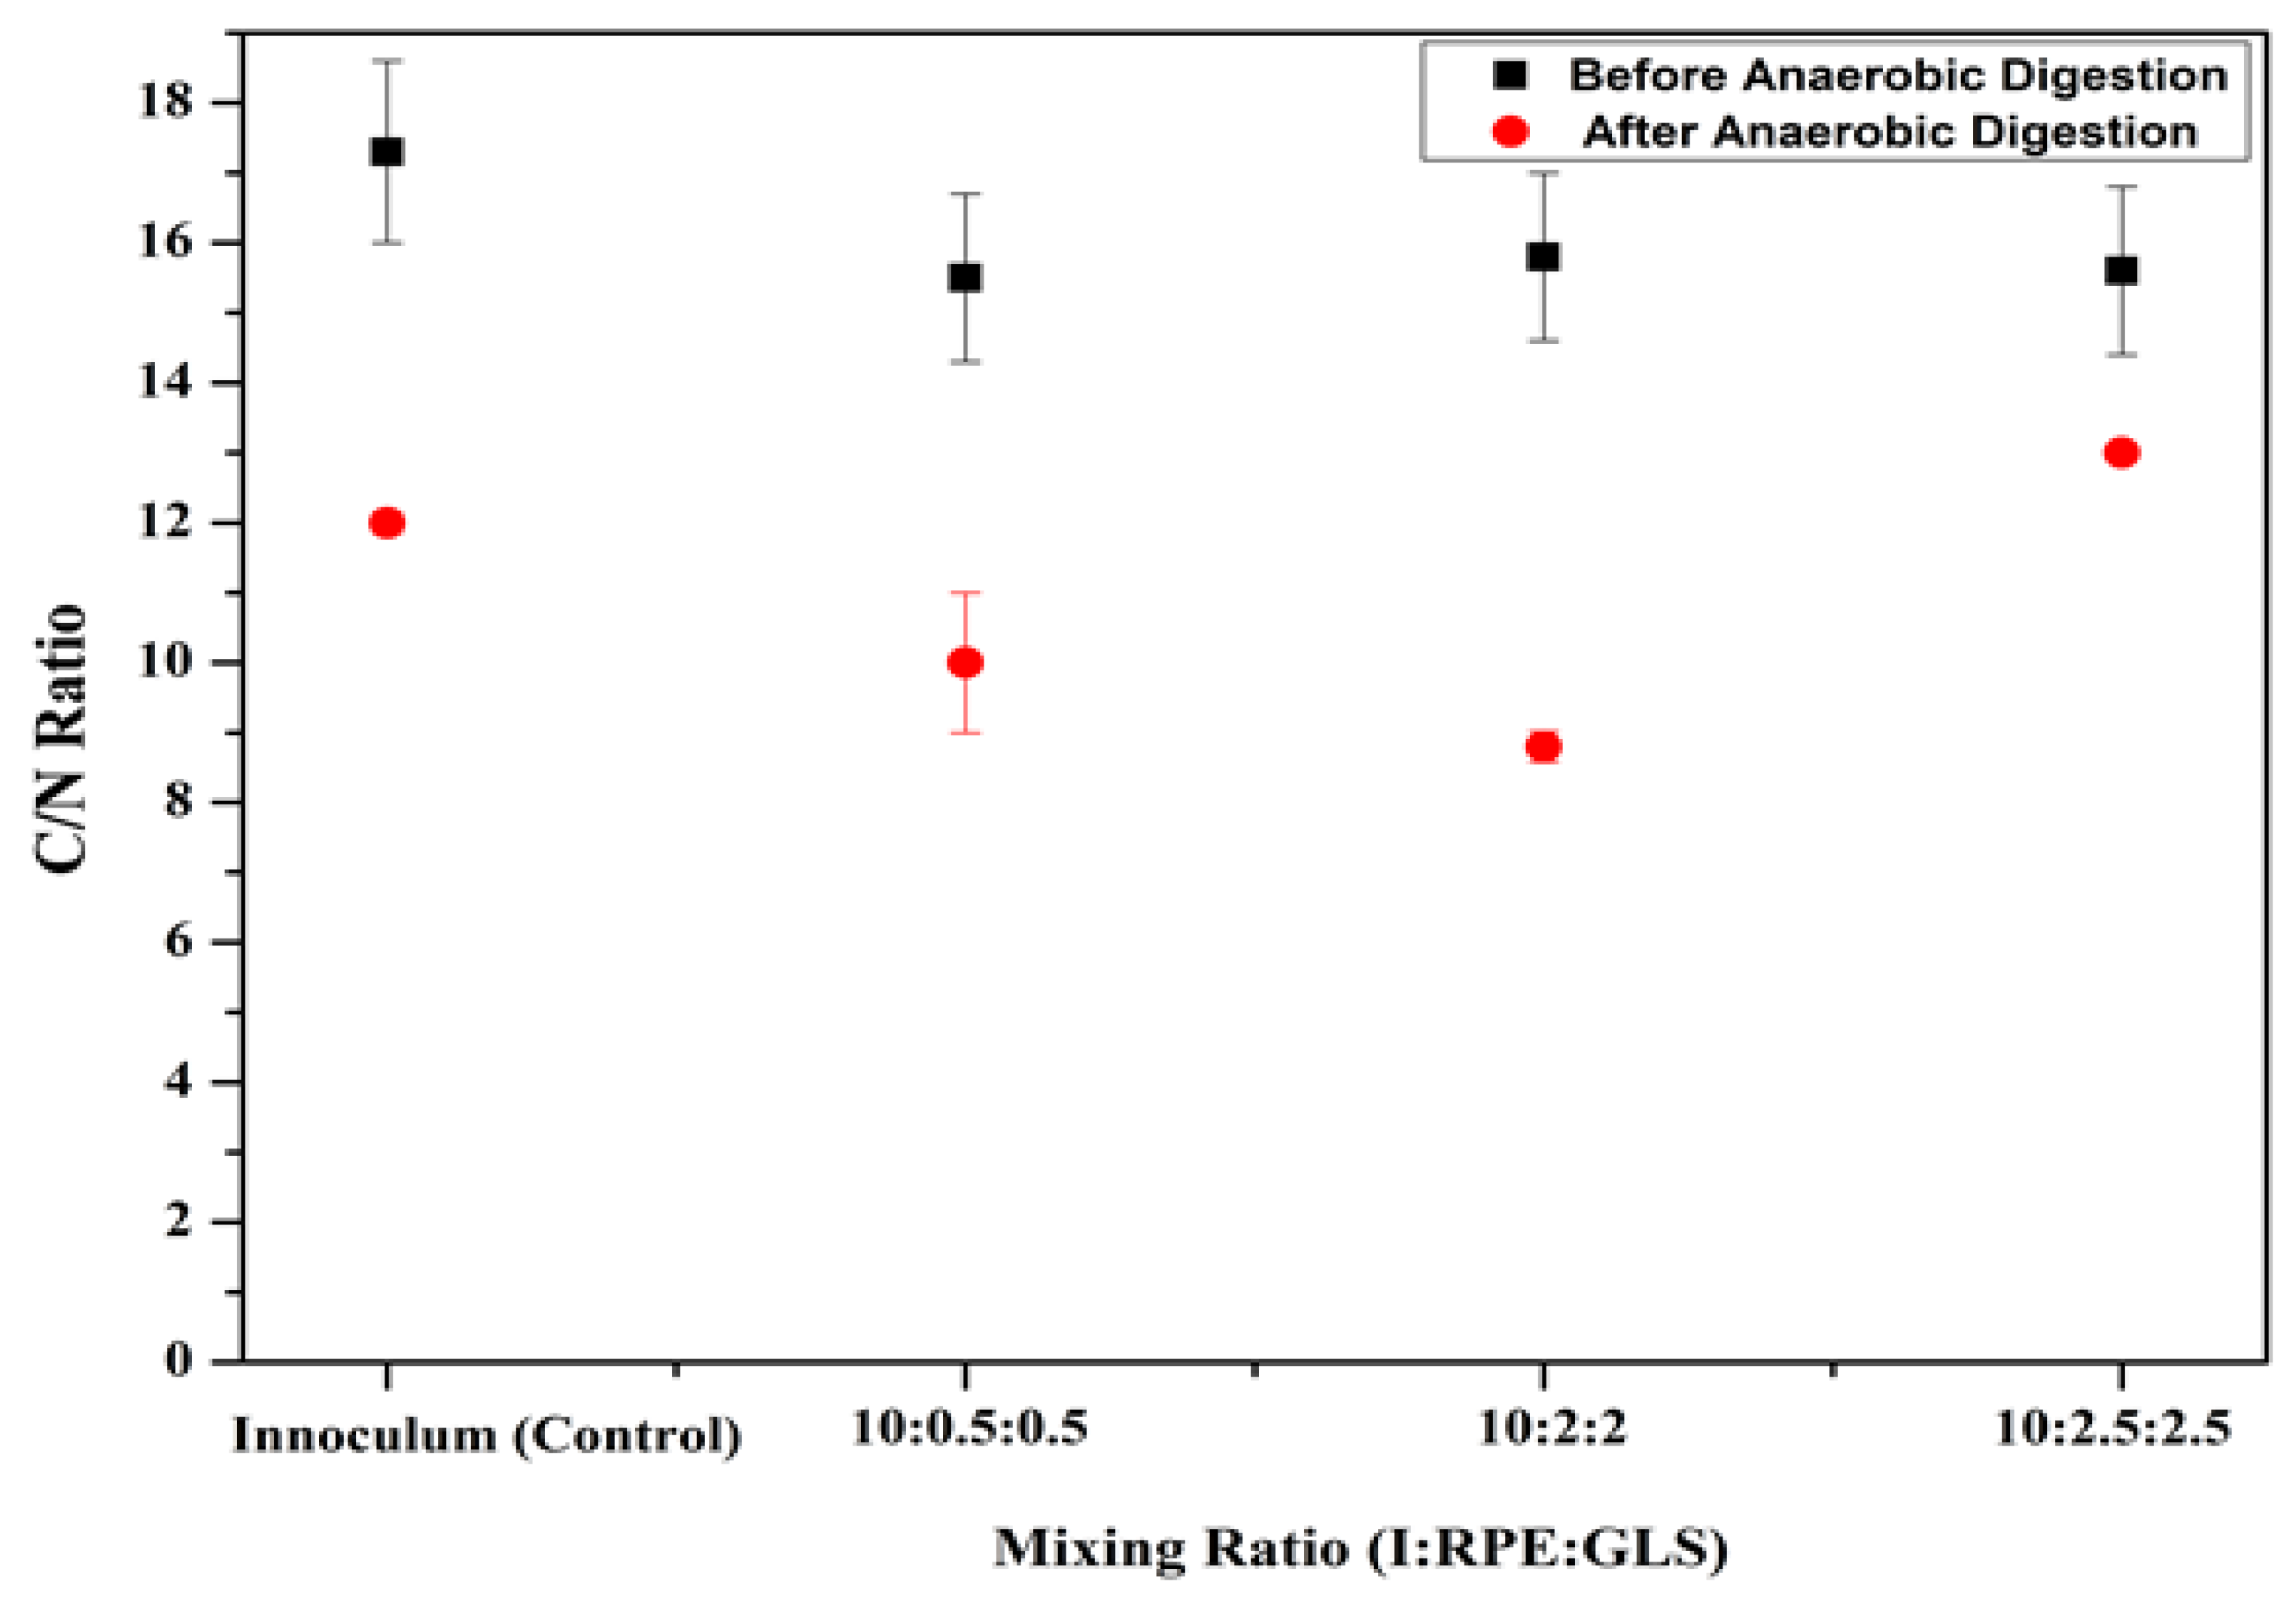
Figure 6.
methane production at different time intervals.
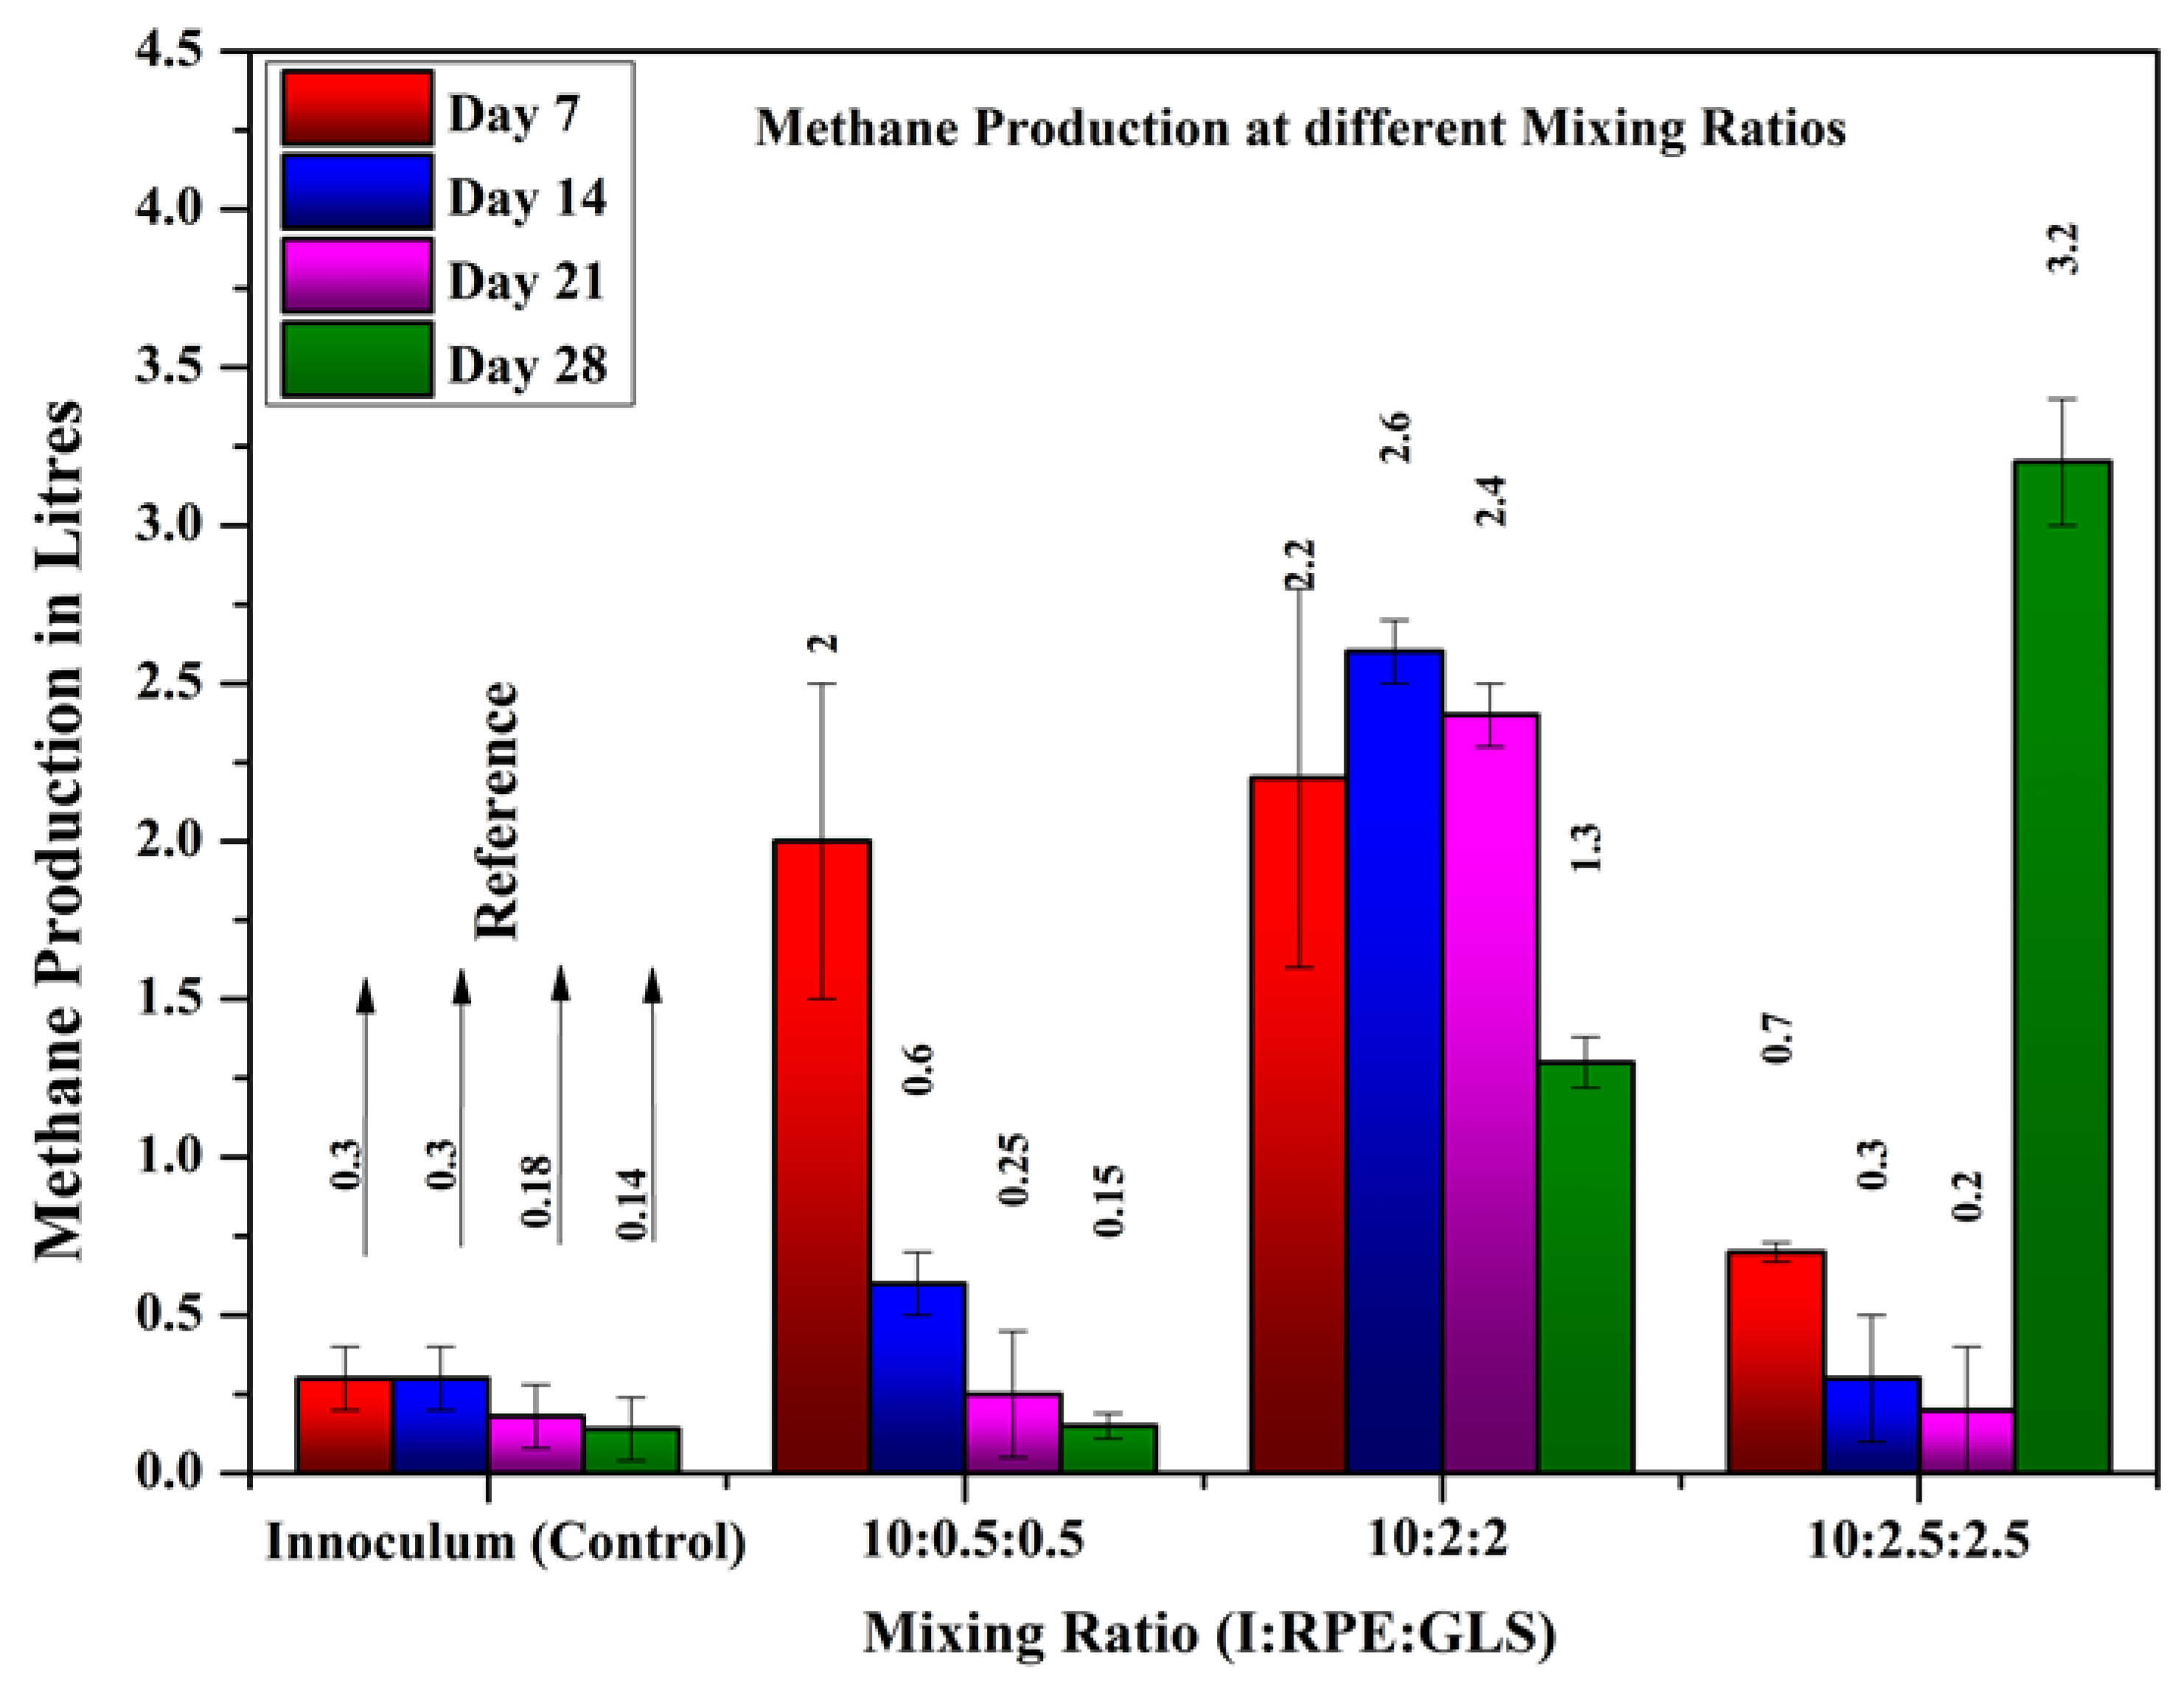
Figure 7.
Comparison of methane production of different mixing ratios.
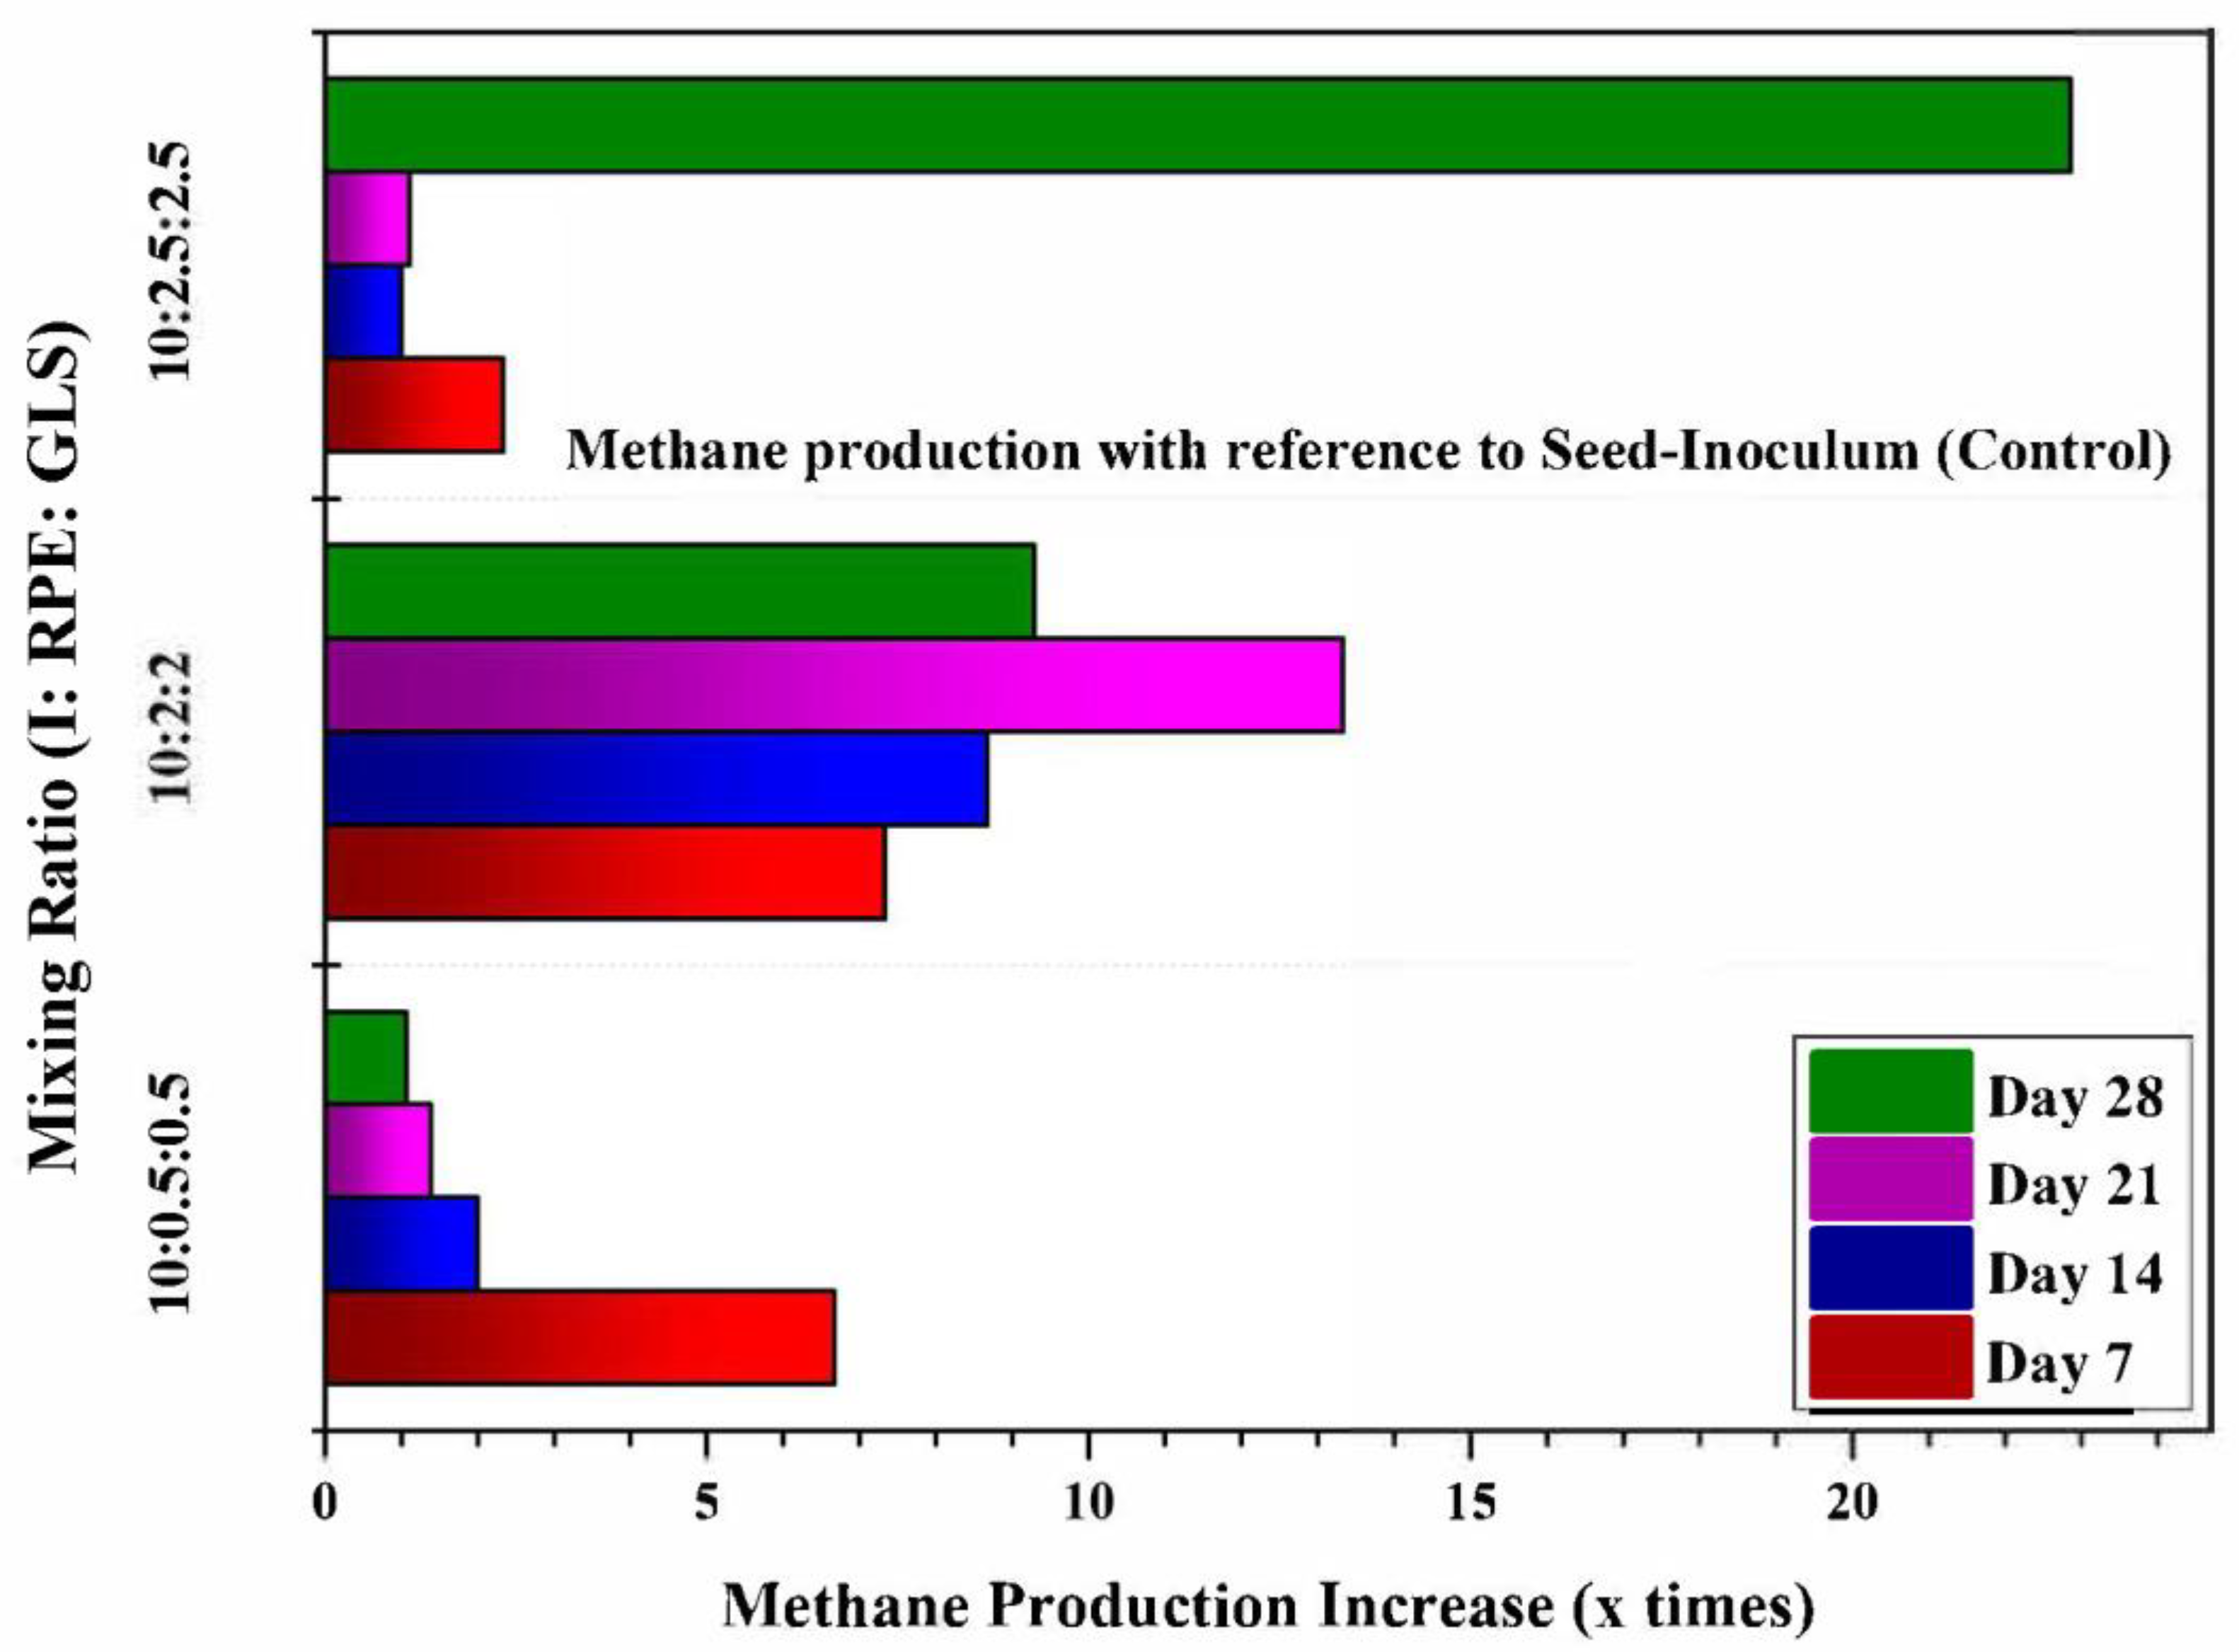
Figure 8.
Contents of the substrates fed into the reactors before digestion.
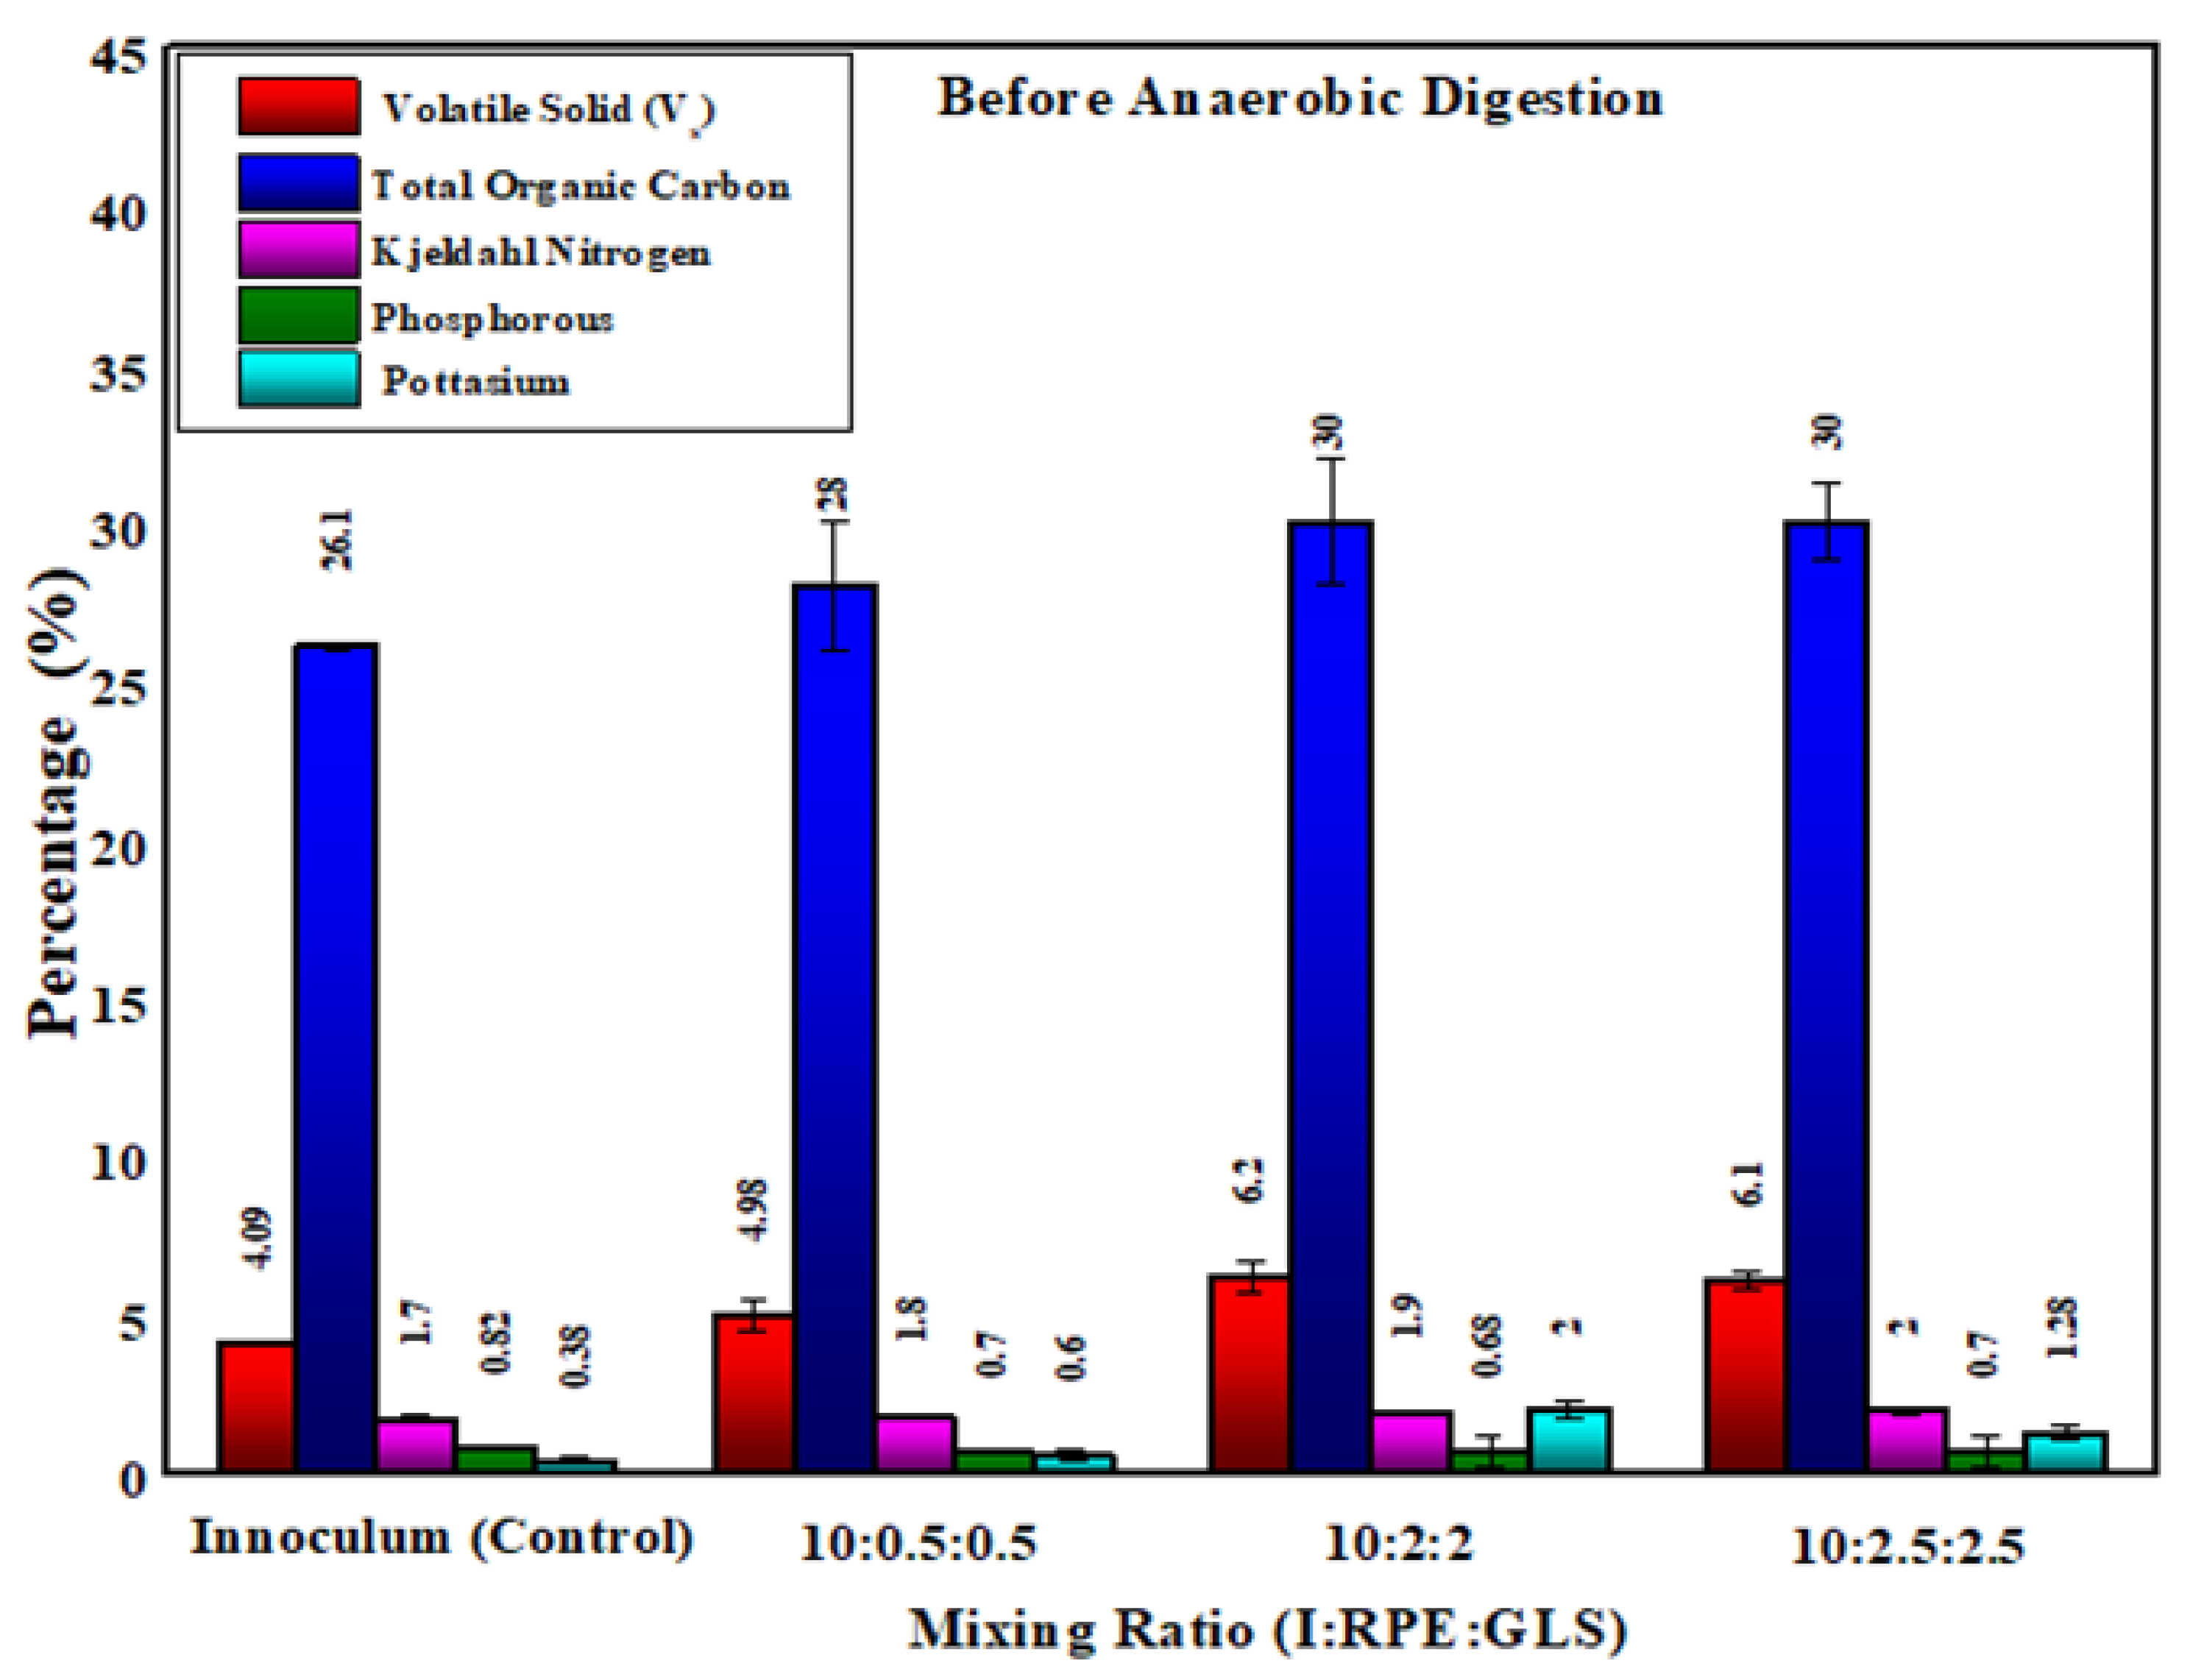
Figure 8.
Contents of the substrates fed into the reactors before digestion.
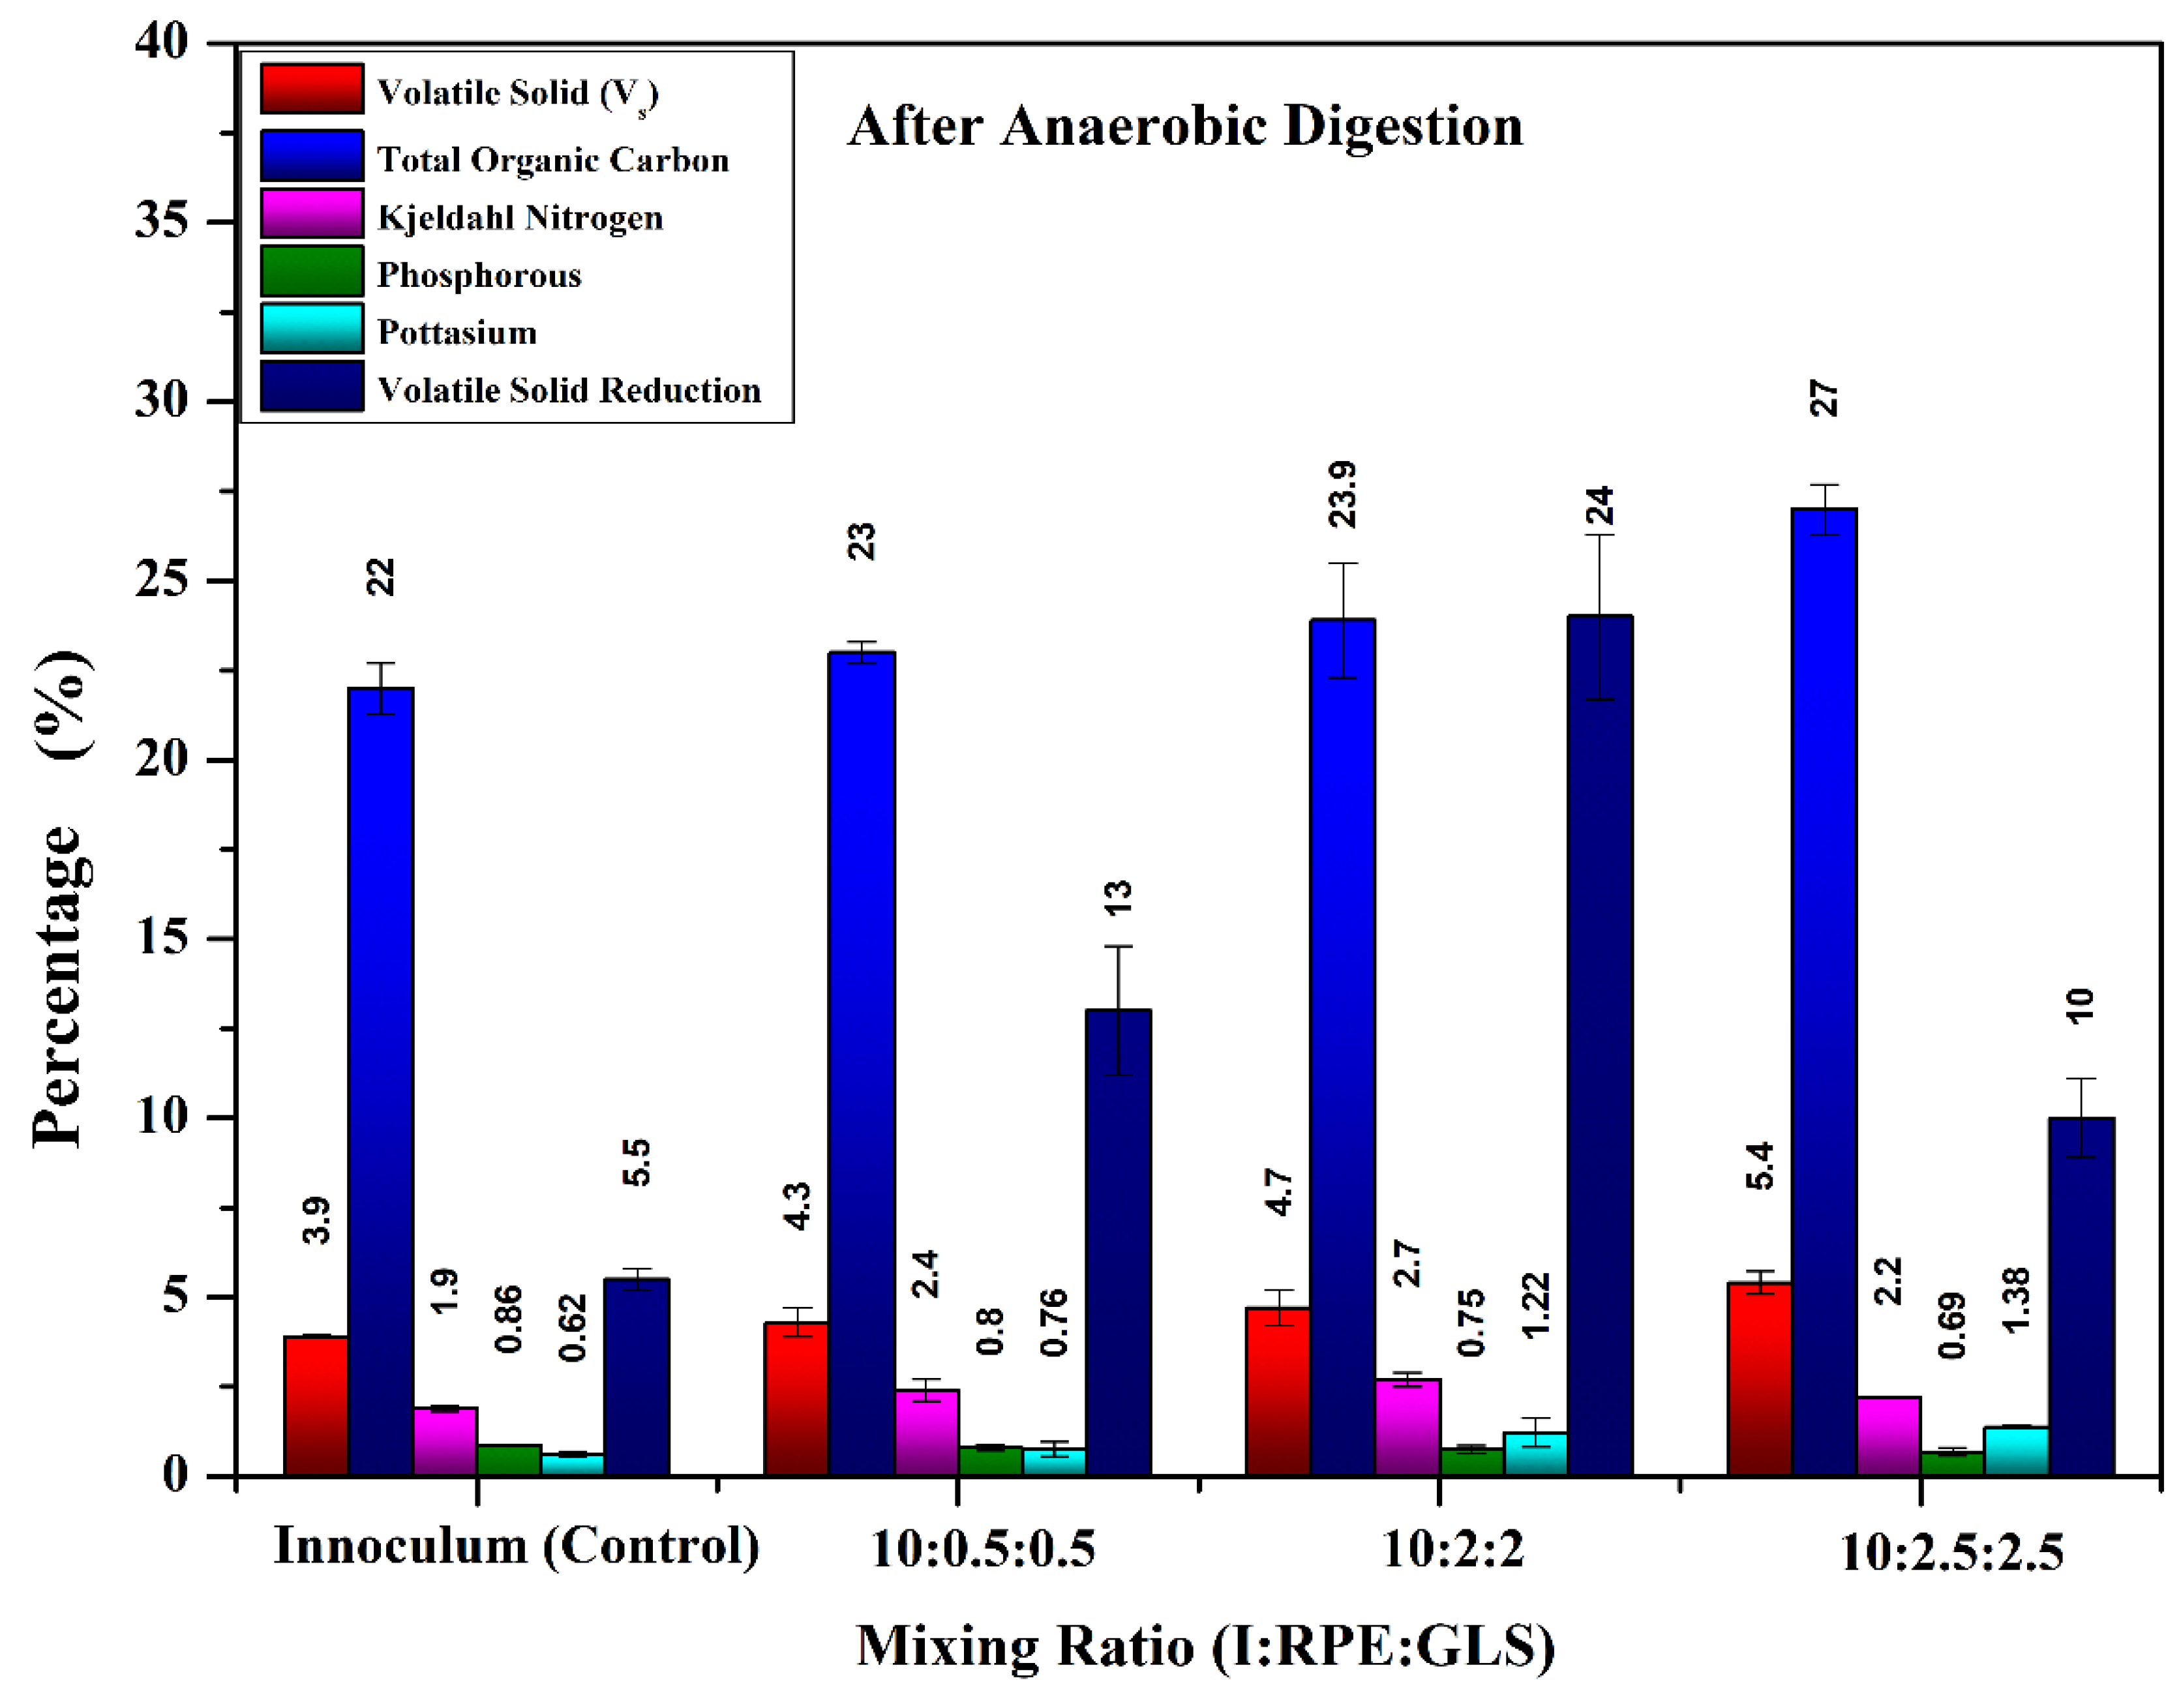

Table 1.
Physio-chemical characteristics of input substrates.
| Parameters | Inoculum | RPE | Gliricidia leaves |
| Total solids (%) | 6.65±0.05 | 1.1 ± 0.02 | 28±2.3 |
| Volatile solids (%) | 4±0.5 | 0.2356±0.02 | 25±0.4 |
| pH | 8.1±1.4 | 6.6±1.2 | 6.3±1.2 |
| Moisture content (%) | 94±0.4 | - | 74±0.3 |
| Total organic carbon (%) | 28±0.22 | 0.73±0.004 | 32.15±1.4 |
| Potassium | 0.43±0.02 | 0.016±0.001 | 1.35±0.14 |
| Phosphorous | 0.91±0.01 | 0.021±0.002 | 0.52±0.13 |
| Kjeldahl Nitrogen | 1.69±0.13 | 0.01±0.001 | 2.25±0.12 |
| C/ N ratio | 16±1.4 | 17±1.32 | 14±1.22 |
Table 2.
Results of the anaerobic digestion of different experiments.
| Experiment | Average methane yield (Liters) |
Average pH | Average volatile solid reduction (%) | Average Volatile Fatty acids (mg/L) |
| T1 | 0.98 | 8 | 14.2 | 632 |
| T2 | 3.2 | 8.2 | 25.4 | 875 |
| T3 | 9.21 | 7.4 | 12.1 | 3400 |
| T4 | 4.32 | 6.1 | 6.2 | 7012.5 |
Disclaimer/Publisher’s Note: The statements, opinions and data contained in all publications are solely those of the individual author(s) and contributor(s) and not of MDPI and/or the editor(s). MDPI and/or the editor(s) disclaim responsibility for any injury to people or property resulting from any ideas, methods, instructions or products referred to in the content. |
© 2024 by the authors. Licensee MDPI, Basel, Switzerland. This article is an open access article distributed under the terms and conditions of the Creative Commons Attribution (CC BY) license (http://creativecommons.org/licenses/by/4.0/).
Copyright: This open access article is published under a Creative Commons CC BY 4.0 license, which permit the free download, distribution, and reuse, provided that the author and preprint are cited in any reuse.


