
Submitted:
24 June 2024
Posted:
26 June 2024
You are already at the latest version
Abstract
Daylighting design is not only a stage of dimensioning glazed surfaces to provide sufficient natural light to an occupied space, but also a method of analysing how this matter can be achieved without unwanted effects, such as: gains and losses of heat, glare, and variations of the daylighting intensity, at various indoor distances and levels. According to the international regulations in force, glazed surfaces must be designed with a careful balance between the admission of natural light and thermal performance, such as heat loss in winter and heat gain in summer. In a novel project, it is essential to determine the optimal ratio of window-to-wall surface area. This necessity arises because the materials constituting the glazed surfaces of windows typically exhibit lower insulation properties compared to those of the building's walls. This methodology could be applied to building renovations when envelope modifications are possible and suitable. The case study presented in the paper highlights the energy consumed due to a group of windows with a large glazed area in an existing building, located in a temperate continental climate area. The energy consumption results from supplementary artificial lighting required to maintain adequate illumination for indoor activities and that to counterbalance heat loss during colder periods are evaluated. The analysis performed by modifying the glazed surface led to the identification of an optimum value of windows dimensions for an energy consumed minimum.
Keywords:
daylighting
; natural lighting
; energy performance
; thermal balance
; window surface optimization
1. Introduction
Scientific research on human behaviour have concluded that, on average, people spend more than 90% of their lives indoors, and consequently the art and science of designing mode buildings are moving towards a new concept, namely wellness architecture, [1,2,3,4]. The fundamental principle underlying the design of buildings in this manner revolves around the influence buildings exert on the occupants who reside or work within them, aiming to create environments that enhance occupants' well-being and comfort within the constructed space. Increasing the quality of life requires ensuring an optimal living and working environment, as well as the economic use of existing energies, the use of new forms of energy, as well as environmental protection [5,6]. Achieving comfort within a building requires understanding a range of factors, including daylighting and interior temperature dynamics.
The technical regulations identify a series of key parameters whose quality influences the human perception of a building. Large glazing areas are architectural options through which building owners seek to maximize the benefits of daylighting. At first glance, in addition to the clear advantage of reducing artificial light with positive consequences in energy consumption, large glass windows offer the benefit of unobstructed views for the inhabitants to fully enjoy the building's surroundings. Meeting the need for contact with the outside living environment is an important psychological aspect linked to daylighting, [7]. Windows serve as links to the external environment, offering orientation cues, facilitating first-hand experience of weather fluctuations, and enabling observation of the progression of time throughout the day. Besides the aesthetic, energy efficiency and economic advantages, a large window becomes a necessity for the physical and mental well-being of the building's users. Daylight is recognized as having the highest levels of light needed for the biological functions, [8,9,10], compared with typical electric light sources.
Providing natural light alone is not enough to meet the needs of users. In a building, adequate lighting plays an essential role in people's health, productivity and behaviour, therefore additional artificial lighting is required to ensure compliance with standards such as EN 12464, [11]. The EN 12464 standard establishes a minimum illumination of 50 lx, with optimal values between 500 and 1000 lx, depending on the specific activities. For particular activities, illumination levels of 1500-2000 lx are recommended for tasks that require precision and detail. When the natural luminous flow is unsatisfactory, the supply of artificial light is necessary.
Furthermore, concerning the energy efficiency of buildings and the lighting energy demands, the standard EN 15193 [12] proposes consistent methodologies for assessing the energy consumption attributed to interior lighting using a numerical indicator known as the Lighting Energy Numeric Indicator (LENI). The LENI index can be computed either through direct measurements or by employing either a simplified or a comprehensive calculation method.
If the building is properly located in relation to the compass points, the next aspect is to develop an optimum glazed surface-to-wall ratio. The window area must present a balance between natural light admission and thermal issues such as winter heat loss and summer heat gain. In standard 90.1-2022, [13], developed by the American Society of Heating, Refrigeration and Air Conditioning Engineers (ASHRAE), recommendations are outlined regarding the proportion of glazed surface area relative to wall area, which vary according to specific climate zones. These guidelines emphasize minimal values aimed predominantly at optimizing thermal performance within buildings. Notably, the prescribed ratios prioritize thermal insulation and energy efficiency considerations while generally overlooking the beneficial aspects of natural daylighting in the initial stages of analytical assessment. This approach underscores a focus on mitigating heat loss or gain through glazed surfaces without fully incorporating the potential for daylight harvesting to reduce energy consumption associated with artificial lighting.
Natural light has a special recognition of its importance in various regulations, [14,15,16,17,18,19]. The natural lighting system is detailed, according to [14] by parameters regarding: the openings that allow the penetration of natural light (windows, skylights, light guides, etc.), the components that control the natural light (glazing, light redirection devices, shading devices), as well as through their actuation means. However, natural light is approached, in general, through the requirements of visual, aesthetic and psychological comfort, without any reference to energy criteria.
In [15], a design guide dedicated to natural lighting extensively examines geographical and climatic factors. The guide emphasizes the correlation between window dimensions and various climate zones, aiming to optimize natural light utilization in architectural design. The discussion concerning the benefits of natural light on occupant health encompasses several significant aspects, [16]. These include its impact on mitigating depression, with morning light demonstrating twice the efficacy compared to evening light. Additionally, natural light has been observed to influence the duration of hospital stays, reduce stress levels, and alleviate pain among occupants. These findings underscore the multifaceted health benefits associated with exposure to natural daylight within built environments.
Daylighting design involves more than simply determining the appropriate size of glazed surfaces to ensure adequate natural light in occupied spaces. It also encompasses strategies to mitigate potential drawbacks, such as heat gain and loss. While windows typically contribute to heat loss, they also absorb varying amounts of heat depending on their characteristics and orientation. Achieving an optimal balance involves careful consideration of these factors to enhance indoor environmental quality without compromising energy efficiency.
Windows are responsible for about 30-50% of the heat loss through typical building envelopes, depending on the size and distribution in each building, [20,21]. This number fluctuates, especially with differing window types and the number of windows in the building. Even though today’s windows are considerable efficient, the heat loss per area through windows is still much greater than through building walls and roofs.
Glass, due to its low insulation capability, typically results in significant heat loss from buildings during colder external temperatures compared to internal conditions. Conversely, in warmer weather, glass allows heat from outside to transfer into the interior environment. In both situations, the heat transmitted inside to outside and vice versa, must be compensated by heating/cooling processes of the indoor air, which lead to additional energy consumption. Thus, windows play a crucial role in regulating thermal exchange between indoor and outdoor environments, influencing the energy efficiency of buildings. Preventing heat loss or gain through windows is important to maintain an energy-efficient building and enhance indoor comfort.
In the paper [22], the window-to-wall ratio was analysed, and its optimization demonstrated that this could be an important way to achieve near-zero energy consumption. The concept is developed with the Passive House Planning Package (PHPP), which is one of the most powerful design tools available for designing low-energy buildings. PHPP provides an approximation of this net energy balance for the heating season (winter), but also to assess the risk of overheating (summer). The analysis performed with PHPP provides a more nuanced picture of the building's performance. This software is a tool that allows to test the design against the performance criteria.
Numerous publications [22,23,24,25,26,27,28], have extensively examined the optimal design of glazed surfaces, primarily focusing on methodologies for assessing energy consumption relative to standardized lighting levels. These studies typically vary variables such as window materials and lighting installations to determine their influence on building energy efficiency [29,30]. A separate investigation detailed in [31] explores the effects of integrating skylights and light wells on the energy consumption and carbon dioxide emissions of a four-story building. This study represents a departure from conventional approaches by specifically examining the broader impacts of natural lighting strategies on building operational sustainability and environmental performance. Unfortunately, most research refers to applications for identifying energy consumption in relation to standard lighting levels, having as variables different windows materials, or different lighting installations. More approaches for enhancing building design strategies that prioritize energy efficiency while leveraging natural lighting solutions effectively are needed.
Evaluation of the energy economy for deep spaces, when a system for artificial lighting is used to compensate for daylighting, is presented in other studies, [32]. The software Dialux EVO 12 was used for research analysis. This software is considered state of the art in terms of electric lighting. Currently daylighting is also a main concern for the software developers, the calculation is no longer limited to a geographical point and a date/time of the year, and it covers an entire year, with evaluated intervals of one hour. However, the study referenced as [32] does not address the issue of global energy consumption for the entire building.
A very recent work is [33], where artificial lighting that complements natural light is studied. However, the research has some major limitations: the study does not extend over the whole year, but only over one day and one hour (the summer solstice, considered the most unfavourable day for the southern hemisphere). Moreover, the indoor space is not equipped with sensors and automatic control system, and the lighting is connected by on/off switches. The Dialux EVO 5.8 version was used for evaluations in [33].
Other research leverages Dialux EVO 11 to enhance the efficiency of simulations [34]. Here, the problem of electric lighting in addition to daylighting is also addressed, in which the context of energy consumption for cooling a room is also found. The study extends beyond daylighting considerations to encompass the issue of electric lighting and its interaction with cooling energy consumption within room environments. The potential of Dialux EVO 11 is used more efficiently. The electric lighting is simulated in the dynamic hypothesis, and the lighting sensors are implemented. Specifically, dynamic scenarios are simulated for electric lighting, integrating lighting sensors to optimize energy use. However, a challenge arises when addressing the operation of louvers, which are approached statically (e.g., 100%, 70%, 60%, 50% openness). This static approach diverges from realistic operational conditions where louvers may adjust continuously throughout the day, even if manually controlled. In this way, the analysis departs from a realistic way of working, in which louvers opening is variable during a day, even if they are manually operated. This departure from realistic operational dynamics highlights the need for more nuanced simulation methodologies that accurately capture the variability and impact of user-controlled elements on energy performance in building environments.
The focus of the research presented in this article pertains to the challenge of minimizing energy consumption attributed to windows in buildings, while acknowledging their vital roles for occupants. Windows serve critical functions such as ventilation, illumination, and emergency issues, with natural lighting being particularly significant among these roles. Balancing the energy efficiency imperatives with the essential functionalities of windows constitutes a central concern in sustainable building design and operation. The study aims to explore methodologies and strategies that optimize the energy performance of windows without compromising their fundamental contributions to indoor environmental quality and occupant well-being. This research underscores the nuanced approach required to achieve both energy savings and enhanced liveability in architectural practice and building management.
A first solution, to reduce heat transfer, should be to make the glazed surface and window frames from materials with superior insulation performance. But as effective as these materials are, there are still no products whose insulation efficiency can match the degree of insulation of opaque walls. A second solution is to reduce the glazed area, but it is the windows that provide natural lighting with all the benefits it brings. The larger the glazed surface, the greater the lighting will be. An alternative approach involves addressing extreme outdoor temperatures by implementing measures to cover glazed surfaces. This can be achieved through the deployment of external blinds or shutters, which effectively lessen heat transfer caused by windows during exceptionally hot summer days or very cold winter periods. Therefore, in the design of a new building, the requirement to reduce additional energy consumption can be satisfied by determining an optimal glazing area, corresponding to the sum of the minimum energy consumptions for artificial lighting and for the heating or cooling processes.
The methodology employed to assess the optimal glazed surface area was implemented within the framework of the specific case study detailed in the paper. The research utilized two accredited software applications: one designed to quantify the energy required to offset heat transfer losses or gains through windows, and another aimed at evaluating energy consumption necessary to achieve adequate illumination levels for various activities within an existing building. A key variable introduced in the analysis was the height of the windows under investigation. This parameter was systematically varied to investigate its impact on both thermal performance and lighting requirements, thereby informing decisions related to window design and energy-efficient building management strategies. The integration of these software tools enabled a comprehensive examination of how window dimensions influence building energy dynamics and indoor environmental quality considerations across different operational scenarios.
2. Materials and Methods
2.1. Description of the Case Study
The building, analysed in the case study, is located in Iasi, Romania, and was built in 2008. As can be seen in Figure 1, in the living room there is a group of two large windows, with dimensions (width x height) of 280 x 230 cm (F1) and 225 x 230 cm (F2), which are north-west and south-west-facing respectively. The existing group of windows has a parapet height of 40 cm, and the following characteristics: g = 0.30 and Ug = 1W/m²K.
The case study explores the cumulative energy consumption caused by windows, for heat losses/gains, as well as from the artificial lighting required to supplement natural lighting. The analyses carried out for living room considered the characteristics of the windows’ materials used at the time of construction, followed by proposed changes for the glazed surfaces of the two large windows. Reducing the size of the windows by increasing the height of the parapet, (Hp), by 40 cm is the main variable in the research carried out in the study. That is why the stages in the analyses carried out were for window heights, (Hf), of: 230 cm, 190 cm, 150 cm, 110 cm, 70 cm and 30 cm. These changes are proposed because Romania faces a cold temperate climate with low winter temperatures, emphasizing the significance of the energy balance for heating in this climate zone. This climatic context accentuates the critical importance of achieving a balanced energy strategy, particularly concerning heating requirements within the region. Also, for the energy consumption due to artificial lighting, the analyses were also done on various lighting levels imposed by the requirements for carrying out various types of activities.
2.2. Energy Consumption Due to Imposed Illumination
The purpose of this task is to analyse the energy consumed for the simulated light levels of a building. The area on the ground floor, with a system of two large windows in the northwest and south-west façade, was investigated and a model was implemented in Dialux EVO 12, [35]. The model was calibrated using in situ measurements where natural light illumination was monitored by illuminance meters. After validating the model, the energy consumed was simulated with different variables: the height of the windows and the illumination levels imposed by different types of activities deployed inside. This approach enabled a comprehensive analysis of how window design and lighting requirements impact overall energy use within the studied building context.
Figure 2 shows the graphical representations for the quantitative analysis including the cardinal orientation for each case of parapet height Hp and windows height Hf.
Figure 3 shows the graphs obtained in Dialux EVO 12, where the one-hour step is provided for calculating the energy consumption, but in which the option of operating the constant lighting level is provided, by using an automatic dimming control system with a lighting sensor placed in the centre of the room. The graphs are obtained according to the variable height of the windows' parapet. In the graphs, in the superior region, the luminous exposure (lx·h/day) is available (orange) and energy demand [kWh/day] for a year period (blue), and in the downward region the daylight illumination [lx] (orange) and electrical illumination [lx] (blue) for a 24-hour period, on the 1st of July 2022. The dimming is visible and the daylight available during the year is also visible.
2.3. Energy Consumption Due to The Losses/Gains in the Heat Transfer Through the Windows
To analyze the energy losses through the glazed surface of the residential building described in the previous paragraph, a model was created in DesignPH 2.0, [37], and export the model input in PHPP (Passive House Planning Package), [38]. Both programs are developed by the Passive House Institute from Darmstadt, Germany.
The study commences with the creation of a detailed 3D model of the proposed building using SketchUp. This model is subsequently imported into DesignPH 2.0, where a comprehensive array of parameters—including insulation levels, window specifications, and shading configurations—is meticulously defined. DesignPH 2.0 facilitates the calculation of the building's annual heating and cooling demands, enabling iterative adjustments aimed at optimizing energy efficiency. The software also supports visualization and analysis of the building's energy performance, providing essential insights for identifying potential inefficiencies and making necessary refinements to meet rigorous energy efficiency standards. Finally, the refined model is exported to PHPP (Passive House Planning Package) to obtain conclusive results and validate the design's compliance with energy performance targets. This integrated approach ensures a thorough evaluation and refinement process throughout the building design phase, ensuring that energy considerations are effectively integrated from conceptualization to final assessment.
The methodology comprises the following steps:
- Step 1
In this initial step, the energy performance of the existing residential building is thoroughly evaluated. This baseline analysis provides a reference point for evaluating the effectiveness of proposed modifications. In PHPP, we analysed the energy balance of the entire residence, revealing a heating energy demand of 138.7 kWh/m² per year and the thermal load is 54W/m². As part of the analysis, a net energy balance was also conducted, considering solar gains and losses over the heating period. Negative values indicate heating season losses, measured in kWh per year. The current windows, F1 & F2, with a Hp=40 cm, are analysed for their impact on heat loss, solar gain, and overall energy efficiency. The losses for F1 are 710 kWh per year and for F2 are 526 kWh per year. Because of the negative balance for those two windows, further steps are required to improve the heating balance.
- Step 2
In the second step, the Hp is increased to 80 cm, resulting in a reduced Hf of 190 cm. This modification aims to reduce heat loss through the glazed surfaces while maintaining sufficient natural light. The energy performance is re-evaluated to determine the impact of these changes on the overall efficiency of the building. The energy losses for F1 are 611 kWh per year and for F2 are 455 kWh per year. The heating energy demand is 138 kWh/m² per year and the thermal load is 53.7W/m².
- Step 3
The third step involves increasing the Hp to 120 cm, further reducing the Hf to 150 cm. This significant reduction in window size is expected to enhance the thermal performance of the building envelope. The energy losses through F1 amount to 512 kWh annually, and through F2, 383 kWh annually. The heating energy requirement totals 137.38 kWh/m² per year, with a thermal load of 53.3 W/m².
- Step 4
In the fourth step, the Hp is raised to 160 cm, resulting in a Hf of 110 cm. The energy losses for F1 are 412 kWh per year and for F2 are 311 kWh per year. The annual heating energy demand totals 136.6 kWh/m², with a thermal load of 53 W/m².
- Step 5
The fifth step involves increasing the Hp to 200 cm, which reduces the Hf to 70 cm. This substantial change aims to minimize heat loss significantly while maintaining minimal necessary natural light. The energy losses for F1 are 314 kWh per year and for F2 are 240 kWh per year. The annual heating energy demand totals 135.9 kWh/m², with a thermal load of 52.7 W/m².
- Step 6
In the final step, the Hp is increased to 240 cm, reducing the Hf to 30 cm. This drastic reduction aims to optimize the building's thermal performance to the highest possible level. The energy losses for F1 are 214 kWh per year and for F2 are 169 kWh per year. The annual heating energy demand totals 135.2 kWh/m², with a thermal load of 52.3 W/m².
Figure 4 shows the energy balance heating (monthly method) by each component.
3. Results
3.1. Results for Energy Consumption Due to Imposed Illumination
The energy consumption results from supplementary artificial lighting required to maintain adequate light intensity for indoor activities are presented in Table 1 & Table 2. Table 1 shows the results for daylight illumination values obtained with evaluation performed using Dialux EVO 12 software, where the variable was the windows height (Hf).
The results of the daylight illumination evaluation using Dialux EVO 12 software, presented in Table 1, illustrate the impact of varying window heights (Hf) on the distribution of natural light within a space. As the window height decreases from 230 cm to 30 cm, there is a notable reduction in the average illumination (Emed), ranging from 10,654 lx at the highest window position to 649 lx at the lowest. Similarly, the minimum illumination (Emin) values decrease from 1,413 lx to 476 lx, while the maximum illumination (Emax) values decrease significantly from 37,006 lx to 720 lx.
The energy consumptions with artificial lighting necessary for each step, in two situations - with and without automated control – are presented in Table 2.
Data from Table 2 are evaluated considering that the average illumination limit required for activities is 500 lx. It is observed that for windows with a height of 230 cm, the energy consumption without control was 2,453 kWh/year (89.8 kWh/m²year), while with automated control, it reduced to 1,494 kWh/year (54.7 kWh/m²year), resulting in savings of 959 kWh/year (35.1 kWh/m²year). Similarly, for a window height of 190 cm, the energy consumption without control remained constant at 2,453 kWh/year (89.8 kWh/m²year), but with automated control, it was slightly higher at 1,508 kWh/year (55.2 kWh/m²year), yielding savings of 944 kWh/year (34.6 kWh/m²year).
As the window height decreased further to 150 cm, the energy consumption without control was still 2,453 kWh/year (89.8 kWh/m²year), and with automated control, it increased to 1,552 kWh/year (56.8 kWh/m²year), resulting in savings of 900 kWh/year (33.0 kWh/m²year). At a window height of 110 cm, the consumption without control remained at 2,453 kWh/year (89.8 kWh/m²year), while automated control consumption rose to 1,676 kWh/year (61.4 kWh/m²year), resulting in savings of 777 kWh/year (28.4 kWh/m²year).
For a window height of 70 cm, the energy consumption without control was 2,453 kWh/year (89.8 kWh/m²year), but with automated control, it increased significantly to 1,949 kWh/year (71.4 kWh/m²year), leading to savings of 504 kWh/year (18.4 kWh/m²year). At the lowest window height of 30 cm, the consumption without control remained constant at 2,453 kWh/year (89.8 kWh/m²year), whereas with automated control, it dramatically increased to 2,403 kWh/year (88 kWh/m²year), resulting in minimal savings of 49.7 kWh/year (1.82 kWh/m²year).
3.2. Results for Energy Consumption due to the Losses/Gains in the Heat Transfer Through the Windows
The energy consumption results from losses in the heat transfer through the windows, evaluated with PHPP software are presented in Table 3.
For a window height of 230 cm, energy losses for Window F1 and Window F2 were 710 kWh/year and 526 kWh/year, respectively. The annual heating energy demand was 138.7 kWh/m², with no recorded savings, and the thermal load was 54 W/m². When the window height decreased to 190 cm, energy losses for Window F1 and Window F2 were reduced to 611 kWh/year and 455 kWh/year, respectively. The annual heating energy demand slightly decreased to 138 kWh/m², with savings of 0.70 kWh/m², and the thermal load marginally decreased to 53.7 W/m².
At a window height of 150 cm, the energy losses for Window F1 were 512 kWh/year, and for Window F2, 383 kWh/year. The annual heating energy demand further decreased to 137.38 kWh/m², yielding savings of 1.32 kWh/m², with the thermal load at 53.3 W/m². When the window height was reduced to 110 cm, energy losses for Window F1 were 412 kWh/year and 311 kWh/year for Window F2. The annual heating energy demand dropped to 136.6 kWh/m², with savings of 2.10 kWh/m², and the thermal load stood at 53 W/m².
With a window height of 70 cm, energy losses continued to decline, with Window F1 at 314 kWh/year and Window F2 at 240 kWh/year. The annual heating energy demand decreased to 135.9 kWh/m², resulting in savings of 2.80 kWh/m², and the thermal load was 52.7 W/m². At the lowest window height of 30 cm, energy losses for Window F1 were 214 kWh/year and 169 kWh/year for Window F2. The annual heating energy demand reached its lowest at 135.2 kWh/m², with savings of 3.50 kWh/m², and the thermal load decreased to 52.3 W/m².
3.3. Cumulative Results for Energy Consumptions
The energy consumptions corresponding to the thermal loads of the windows and those of the electricity consumption for lighting are centralized in Table 4, where the data were estimated for an average illumination level of 500 lx.
The results from Table 4 show that for a window height of 230 cm, the energy losses for Window F1 and Window F2 were 710 kWh/year and 526 kWh/year, respectively, totalling 1236 kWh/year. With automated control, the energy consumption for lighting was 1494 kWh/year, leading to a total energy consumption of 2730 kWh/year. At a window height of 190 cm, the combined energy losses for Windows F1 and F2 decreased to 1066 kWh/year, and the energy consumption for lighting with automated control was 1508 kWh/year, resulting in a total of 2574 kWh/year.
When the window height was 150 cm, the energy losses for Window F1 and F2 were further reduced to 895 kWh/year, while the lighting energy consumption was 1552 kWh/year, culminating in a total energy consumption of 2447 kWh/year. At 110 cm window height, the combined energy losses for Windows F1 and F2 dropped to 723 kWh/year, with lighting consumption at 1676 kWh/year, resulting in a total of 2399 kWh/year.
For a window height of 70 cm, the energy losses for Windows F1 and F2 were 554 kWh/year, with automated control lighting consumption reaching 1949 kWh/year, summing up to a total energy consumption of 2503 kWh/year. At the lowest window height of 30 cm, the energy losses were 383 kWh/year for both windows combined, while the lighting energy consumption surged to 2403 kWh/year, resulting in the highest total energy consumption of 2786 kWh/year.
Figure 5 is a graphical representation of the data in Table 4. Figure 6 shows the results in the situation required by an average illumination level of 250 lx. Figure 7 and Figure 8 suggest the evolution of energy consumption for an average illumination level of 100 lx and 1000 lx, respectively.
The graph in Figure 5 highlights the fact that, for an imposed illuminance level of 500 lx, the total energy consumption is minimal when the height of the windows, (Hf), from the analysed case study, is 110 cm. For values lower or higher than this optimal value, consumption increases due to the energy used for artificial lighting or heat losses.
Figure 6 emphasize the fact that, for an imposed illuminance level of 250 lx, the total energy consumption is minimal when the height of the windows, (Hf), from the analysed case study, is 70 cm. For values higher than this optimal value, consumption increases due to the energy used for artificial lighting or heat losses.
For an imposed illuminance level of 100 lx, the graph from Figure 7 reveals that total energy consumption is minimal when the height of the windows, (Hf), from the analysed case study, is 30 cm. This value shows that the illuminance level for inside activities do not require artificial lighting. For values higher than this optimal value, consumption increases due to the energy used for heat losses.
The data presented in Figure 8, for an imposed illumination level of 1000 lx, highlights the fact that the total energy consumption is minimal when the height of the windows, (Hf), from the analysed case study, is 150 cm. This value shows that in the case of a high lighting levels for indoor activities, additional energy consumption is required for a consistent artificial lighting. Therefore, for values lower than this optimal height, Hf = 150 cm, the artificial lighting is the cause of an excessive total energy consumption. For larger window heights (190 cm and 230 cm) the total consumption increases due to the energy used to compensate the heating losses.
4. Discussion
The analysis of optimal window sizes considering the total energy consumption for lighting and heating losses provides some results that need to be discussed. In Figure 5 is available the energy consumption for an illumination level of 500 lx and the duration of continuous operation (obviously not the case of a house). It results in an optimal size, namely Hf = 110 cm. If the average illuminance level decreases or the duration of use of electric lighting decreases, the optimum moves to the left, which means it is advantageous to reduce the size of the window to not have thermal losses/intakes. Figure 7 is a trivial result, where the optimum would be a window of minimum size (Hf = 30 cm), that is, almost cancelling the window. Obviously, this performance criterion cannot be always accepted, for the reasons already mentioned: psychological, aesthetic, health.
For proofing, the situation of high visual loads was computed, namely the average illuminance of 1000 lx. As expected, the optimal size of the window increased, reaching the size of 150 cm.
The analysed criterion, namely the total energy consumption related to the window, can be used, but the final decision for determining the size of the window must be taken on other considerations. In the context of the analyzed case study, the presence of the panoramic view of the city of Iasi, which served as the primary attraction for the site selection and the strategic placement of the large windows, has been validated as an appropriate decision. This design choice underscores the prioritization of aesthetic and experiential considerations in the architectural planning process. Consequently, while energy efficiency remains a significant criterion, it should not be rigidly enforced to the detriment of other design imperatives. The interplay between visual appeal and energy conservation must be carefully balanced, ensuring that the latter, although crucial, does not improperly compromise the former. This nuanced approach highlights the importance of a holistic perspective in architectural design, where multiple factors are weighed and integrated to achieve an optimal outcome.
Architects should design spaces that are practical, comfortable, and efficient. This involves careful planning of the layout, considering aspects such as natural light, ventilation, and the relationship between different spaces [39,40]. The visual aspect of a building can significantly impact the well-being of its occupants and the surrounding community. Even in residential architecture, the design should reflect the personality and preferences of the clients while contributing positively to the neighbourhood’s visual landscape. Designing a building with small or no north-facing windows should take in consideration also the functions of the interior spaces, the exterior aesthetic and the energy efficiency. Architects should also reconsider redesigning the interior spaces to have enough natural light for the living spaces without compromising the energy efficiency.
The positioning of windows relative to the compass directions significantly influences their energy efficiency performance [41,42]. The orientation of windows dictates the extent of solar gain, daylight penetration, and thermal performance over the course of the year. A comprehensive understanding of how each cardinal direction affects these factors is essential for designing buildings that optimize natural light and thermal comfort while minimizing energy consumption. In temperate climates, north-facing windows receive minimal direct sunlight throughout the year and are prone to increased heat loss during winter. Consequently, passive strategies aimed at optimizing heating energy consumption typically involve incorporating large south-facing windows to maximize solar gain and either minimizing or eliminating north-facing windows to reduce heat loss. This approach ensures an effective balance between natural illumination and thermal efficiency, contributing to the overall sustainability of the building design.
5. Conclusions
The research carried out and presented in this paper highlighted the following aspects:
- The ratio of minimum to average illumination (Emin/Emed) and minimum to maximum illumination (Emin/Emax), (Table 1) indicate a progressive improvement in uniformity as the window height decreases. Specifically, the Emin/Emed ratio increases from 0.13 to 0.73, and the Emin/Emax ratio increases from 0.038 to 0.66, suggesting that lower window heights contribute to more evenly distributed daylight within the evaluated space.
- The results indicate that automated control systems substantially reduce energy consumption for artificial lighting, particularly at higher window heights, although the extent of savings diminishes as window height decreases, (Table 2). The energy savings underscore the effectiveness of automated lighting control in enhancing energy efficiency within buildings.
- The lower window heights significantly reduce energy losses through windows and improve the annual heating energy demand and thermal load, (Table 3). The gradual savings in annual heating energy demand as window height decreases highlights the importance of window sizing in energy-efficient building design.
- Data presented underscore the relationship between window height, thermal energy losses, and artificial lighting energy consumption. While lower window heights reduce thermal energy losses, the corresponding increase in lighting energy consumption due to reduced natural light necessitates a careful balance to optimize total energy consumption.
A prevailing perspective holds that reducing the size of windows can lead to energy savings by reducing the demand for heating and cooling. This view suggests that smaller windows result in less heat gain or loss, thereby lowering the energy required to maintain indoor comfort levels. Many voices now claim that reducing window sizes leads to energy savings because smaller sizes reduce energy consumption through heating/cooling. However, the studies carried out in the presented research show that, in certain situations, when the imposed lighting levels are high (over 500 lx), there is, without a doubt, a corresponding and consistent increase in energy consumption for artificial lighting. This phenomenon highlights a complex interaction between architectural choices, lighting requirements, and overall energy efficiency strategies. The implications of these findings challenge the simplistic notion that smaller windows uniformly contribute to energy savings. Instead, they underscore the importance of considering multiple factors in building design and operation. Factors such as daylighting strategies, lighting technologies, and occupant behaviors all play critical roles in shaping energy consumption patterns. By recognizing these complexities, architects, engineers, and policymakers can make more informed decisions that optimize both energy efficiency and indoor environmental quality in buildings.
When determining the size of building windows, it is essential to conduct a meticulous and balanced analysis that considers all the functions served by glazed spaces. This approach is crucial for achieving genuine optimization of total energy consumption. It entails evaluating not only the thermal performance implications of window size but also the broader functional aspects such as daylighting provision, indoor environmental quality, and the potential impacts on artificial lighting requirements. A careful and balancing analysis of all the functions performed by the glazed spaces must be applied for a real optimization of the total energy consumption.
By adopting this holistic perspective, architects and designers can effectively integrate energy-efficient strategies into building designs. This includes leveraging natural daylight to reduce reliance on artificial lighting during daylight hours, which can significantly contribute to energy savings. Furthermore, optimizing window sizes based on specific environmental conditions and building orientations can further enhance energy performance by minimizing heat gain or loss as needed.
In essence, a comprehensive evaluation of the multifaceted roles of windows in buildings facilitates informed decision-making that aligns energy efficiency goals with occupant comfort and operational functionality. This approach not only supports sustainable building practices but also enhances overall building performance over the long term.
Author Contributions
Conceptualization, D.N.I., C.D.G. and Al.U.; methodology, D.N.I..; software, C.D.G. and Al.U.; validation, D.N.I., C.D.G. and Al.U.; formal analysis, S.G.M. and I.R.B.; investigation, D.N.I., C.D.G., Al.U. and A.N.; resources, D.N.I. and L.M..; data curation, C.D.G, Al.U. and A.N.; writing—original draft preparation, D.N.I., C.D.G., Al.U. and A.N.; writing—review and editing, D.N.I.; visualization, S.G.M., I.R.B. and L.M.; supervision, D.N.I; project administration, D.N.I. and L.M.; funding acquisition, D.N.I. and L.M. All authors have read and agreed to the published version of the manuscript.
Funding
This work was supported by a grant of the Ministry of Research, Innovation and Digit-ization, CCCDI-UEFISCDI, project number PN-III-P2-2.1-PED-2021-4137, within PNCDI III-CT 714PED / 2022.
Conflicts of Interest
The authors declare no conflicts of interest
References
- McAuliffe, S. , Is wellness architecture the future of the industry? 2022. https://www.cantifix.co.uk/blog/is-wellness-architecture-the-future/, (accessed 17.06.2024).
- Quesada-García, S.; Valero-Flores, P.; Lozano-Gómez, M. Towards a Healthy Architecture: A New Paradigm in the Design and Construction of Buildings. Buildings 2023, 13, 2001. [Google Scholar] [CrossRef]
- Boubekri, M. Daylighting, Architecture and Health: Building Design Strategies. Architectural Press, Elsevier Ltd; Chapter 4 Natural light and health, 2008.
- Gifford, R.; McCunn, L.J. Appraising and Designing Built Environments that Promote Well-Being and Healthy Behaviour. In Environmental Psychology, 2nd ed.; Steg, L., Groot, J.L.M., Eds.; Wiley: Hoboken, NJ, USA, 2018; pp. 104–112. [Google Scholar]
- Muniz, R.N.; da Costa Júnior, C.T.; Buratto, W.G.; Nied, A.; González, G.V. The Sustainability Concept: A Review Focusing on Energy. Sustainability 2023, 15, 14049. [Google Scholar] [CrossRef]
- Hafez, F.S.; Sa'di, B.; Safa-Gamal, M; Taufiq-Yap, Y.H.; Alrifaey, M,; Seyedmahmoudian, M.; Stojcevski, A.; Horan, B.; Mekhilef, S. Energy Efficiency in Sustainable Buildings: A Systematic Review with Taxonomy, Challenges, Motivations, Methodological Aspects, Recommendations, and Pathways for Future Research, Energy Strategy Reviews, Vol. 45, 2023, 101013, ISSN 2211-467X.
- Robbins, S.P. , Organizational Behavior. Concepts, Controversies and Applications. 3rd ed., Englewood Cliffs, Prentice-Hall, 1986, 554 pp., ISBN 0-13-641549-0-01.
- Hathaway, W.E. , Hargreaves J.A., Thompson G.W., Novitsky D., A Study Into the Effects of Light on Children of Elementary School Age - A Case of Daylight Robbew, Reports – Descriptive, Alberta Dept. of Education, Edmonton. Planning and Infor-mation Services, Canada, 1992, 68 pp, ISBN-0-7732-0724-4.
- Greenup, P.; Bell, J.M.; Moore, I. The importance of interior daylight distribution in buildings on overall energy performance.
- Renewable Energy, Vol. 22, Issues 1–3, 2001, pp. 45-52, ISSN 0960-1481. [CrossRef]
- Vandewalle, G.; Maquet, P.; Dijk, D.J. “Light as a modulator of cognitive brain function,” Trends in Cognitive Sciences, vol. 13, pp. 429–438, 2009.
- EN 12464-1:2019, Light and lighting - Lighting of work places - Part 1: Indoor work places.
- EN 15193-1 :2017+A1:2021, Energy performance of buildings - Energy requirements for lighting - Part 1: Specifications, Module M9.
- Standard 90.1-2022 (SI Edition) -- Energy Standard for Sites and Buildings Except Low-Rise Residential Buildings (ANSI Ap-proved; IES Co-sponsored).
- CIE 213 – Technical Report – Guide to protocols for Describing Lighting, 2014.
- ANSI/IES LP-3-20 Lighting Practice: Designing and Specifying Daylighting for Buildings – An American national Standard, 2020.
- ANSI/IES LP-10-20, Lighting Practice: Sustainable lighting – An introduction to the environmental impacts of lighting – An American National Standard, 2020.
- ISO/CIE 20086 – 2019, Light and Lighting, Energy performance of lighting in Buildings, 2019.
- ISO 10916-2014 Calculation of the impact of daylight utilization on the net and final energy demand for lighting, 2014.
- CIE-ISO TR 3092 Technical Report Light and Lighting - Energy performance of Lighting in Buildings – Explanation and jus-tification of ISO/CIE 20086, 2023.
- Final Report Summary - THINFRAME (High thermal insulating window frames for energy efficient buildings). https://cordis.europa.eu/project/id/603392/reporting/de, (accessed 18.06.2024).
- Li, Z.; Si, Y.; Zhao, Q.; Feng, X. A New Method of Building Envelope Thermal Performance Evaluation Considering Window–Wall Correlation. Energies 2023, 16, 6927. [Google Scholar] [CrossRef]
- Hee, W.J.; Alghoul, M.A.; Bakhtyar, B.; Elayeb, O.; Shameri, M.A.; Alrubaih, M.S.; Sopian, K. The role of window glazing on daylighting and energy saving in buildings. Renew. Sustain. Energy Rev. 2015, 42, 323–343. [Google Scholar] [CrossRef]
- De Luca, F.; Simson, R.; Kurnitski, J.; Voll, H. (2018). Daylighting and energy performance design for single floor commercial hall buildings. 29. 722-736. 10.1108/MEQ-10-2017-0110.
- Alhagla, K.; Mansour, A.; Elbassuoni, R. Optimizing windows for enhancing daylighting performance and energy saving.
- Alexandria Engineering Journal, Vol. 58, Issue 1, 2019, pp. 283-290, ISSN 1110-0168. [CrossRef]
- Lee, Y.-J.; Kim, S.-H.; Ryu, J.-H.; Lee, K.-H. Optimizing Window Glass Design for Energy Efficiency in South Korean Office Buildings: A Hierarchical Analysis Using Energy Simulation. Buildings 2023, 13, 2850. [Google Scholar] [CrossRef]
- Alghoul, S. , & Alrijabo, H.G. (2016). The Effect of Alternative Double Glazed Windows on Buildings Energy Consumption.
- Shaik, S.; Gorantla, K.; Ghosh, A.; Arumugam, C.; Maduru, V.R. Energy Savings and Carbon Emission Mitigation Prospective of Building’s Glazing Variety, Window-to-Wall Ratio and Wall Thickness. Energies 2021, 14, 8020. [Google Scholar] [CrossRef]
- Buratti C., Palladino D., Franceschini C., Natural and artificial lighting in glazed buildings: Energy balance, Proceedings of the 16th CIRIAF National Congress, Assisi, Italy. April 7-9, 2016.
- Hilliaho K., Nordquist B., Wallentèn P., Hamid A.A., Lahdensivu J., Energy saving and indoor climate effects of an added glazed facade to a brick wall building: Case study, Journal of Building Engineering, Volume 7, September 2016, Pages 246-262.
- Bashir, F.M. , Dodo Y.A., Mohamed M.A.S., Md Norwawi N., Shannan N.M., Afghan A.A., Effects of natural light on improv-ing the lighting and energy efficiency of buildings: Toward low energy consumption and CO2 emission, International Journal of Low-Carbon Technologies, Volume 19, 2024, Pages 296–305.
- Hemmerling, M. , Seegers M., Witzel D., Calculation of energy saving potential for lighting with DIALux evo, Energy and Buildings, Vol. 278, 2023, 112475. [CrossRef]
- Thomé M.D., Barreto D., Flores-Colen I., An Evaluation of the Luminous Performance of a School Environment Integrating Artificial Lighting and Daylight , Sustainability 2024, 16(4), 1426; [CrossRef]
- Kieu N.-M., Ullah I., Park J., Bae H., Cho M., Lee K., Shin S., The Energy Saving Potential in an Office Building Using Lou-vers in Mid-Latitude Climate Conditions, Buildings, 2024, 14, 512. [CrossRef]
- Fenga G., Chia D., Xua X., Doua B., Suna Y., Fu Y., Study on the Influence of Window-wall Ratio on the Energy. Consump-tion of Nearly Zero Energy Buildings, Proceedia Engineering, The 10th International Symposium on Heating, Ventilation and Air Conditioning, ISHVAC2017, 19-22 October 2017, Jinan, China.
- Dialux EVO 12. https://www.dialux.com/en-GB/download, (accessed 17.06.2024).
- DesignPH 2.0. https://aecb.net/product/designph2-0/, (accessed 17.06.2024).
- PHPP (Passive House Planning Package), https://passivehouse.com/04_phpp/04_phpp.htm, (accessed 17.06.2024).
- Latha, H. , Patil, S. & Kini, P.G. Influence of architectural space layout and building perimeter on the energy performance of buildings: A systematic literature review. Int J Energy Environ Eng 14, 431–474 (2023). [CrossRef]
- Kaheneko, O. (2021). Research on Application of Natural Light in Modern Architecture Design. The International Journal of Science & Technoledge. 9. 10.24940/theijst/2021/v9/i2/ST2102-013.
- Abdollahi Rizi, R.; Sangin, H.; Haghighatnejad Chobari, K.; Eltaweel, A.; Phipps, R. Optimising Daylight and Ventilation Performance: A Building Envelope Design Methodology. Buildings 2023, 13, 2840. [Google Scholar] [CrossRef]
- Kim, S.; Zadeh, P.; Staub-French, S.; Froese, T.; Terim Cavka, Be. (2016). Assessment of the Impact of Window Size, Position and Orientation on Building Energy Load Using BIM. Procedia Engineering. 145. 1424-1431. 10.1016/j.proeng.2016.04.179.
Figure 1.
Case study – residential building and the two large windows.
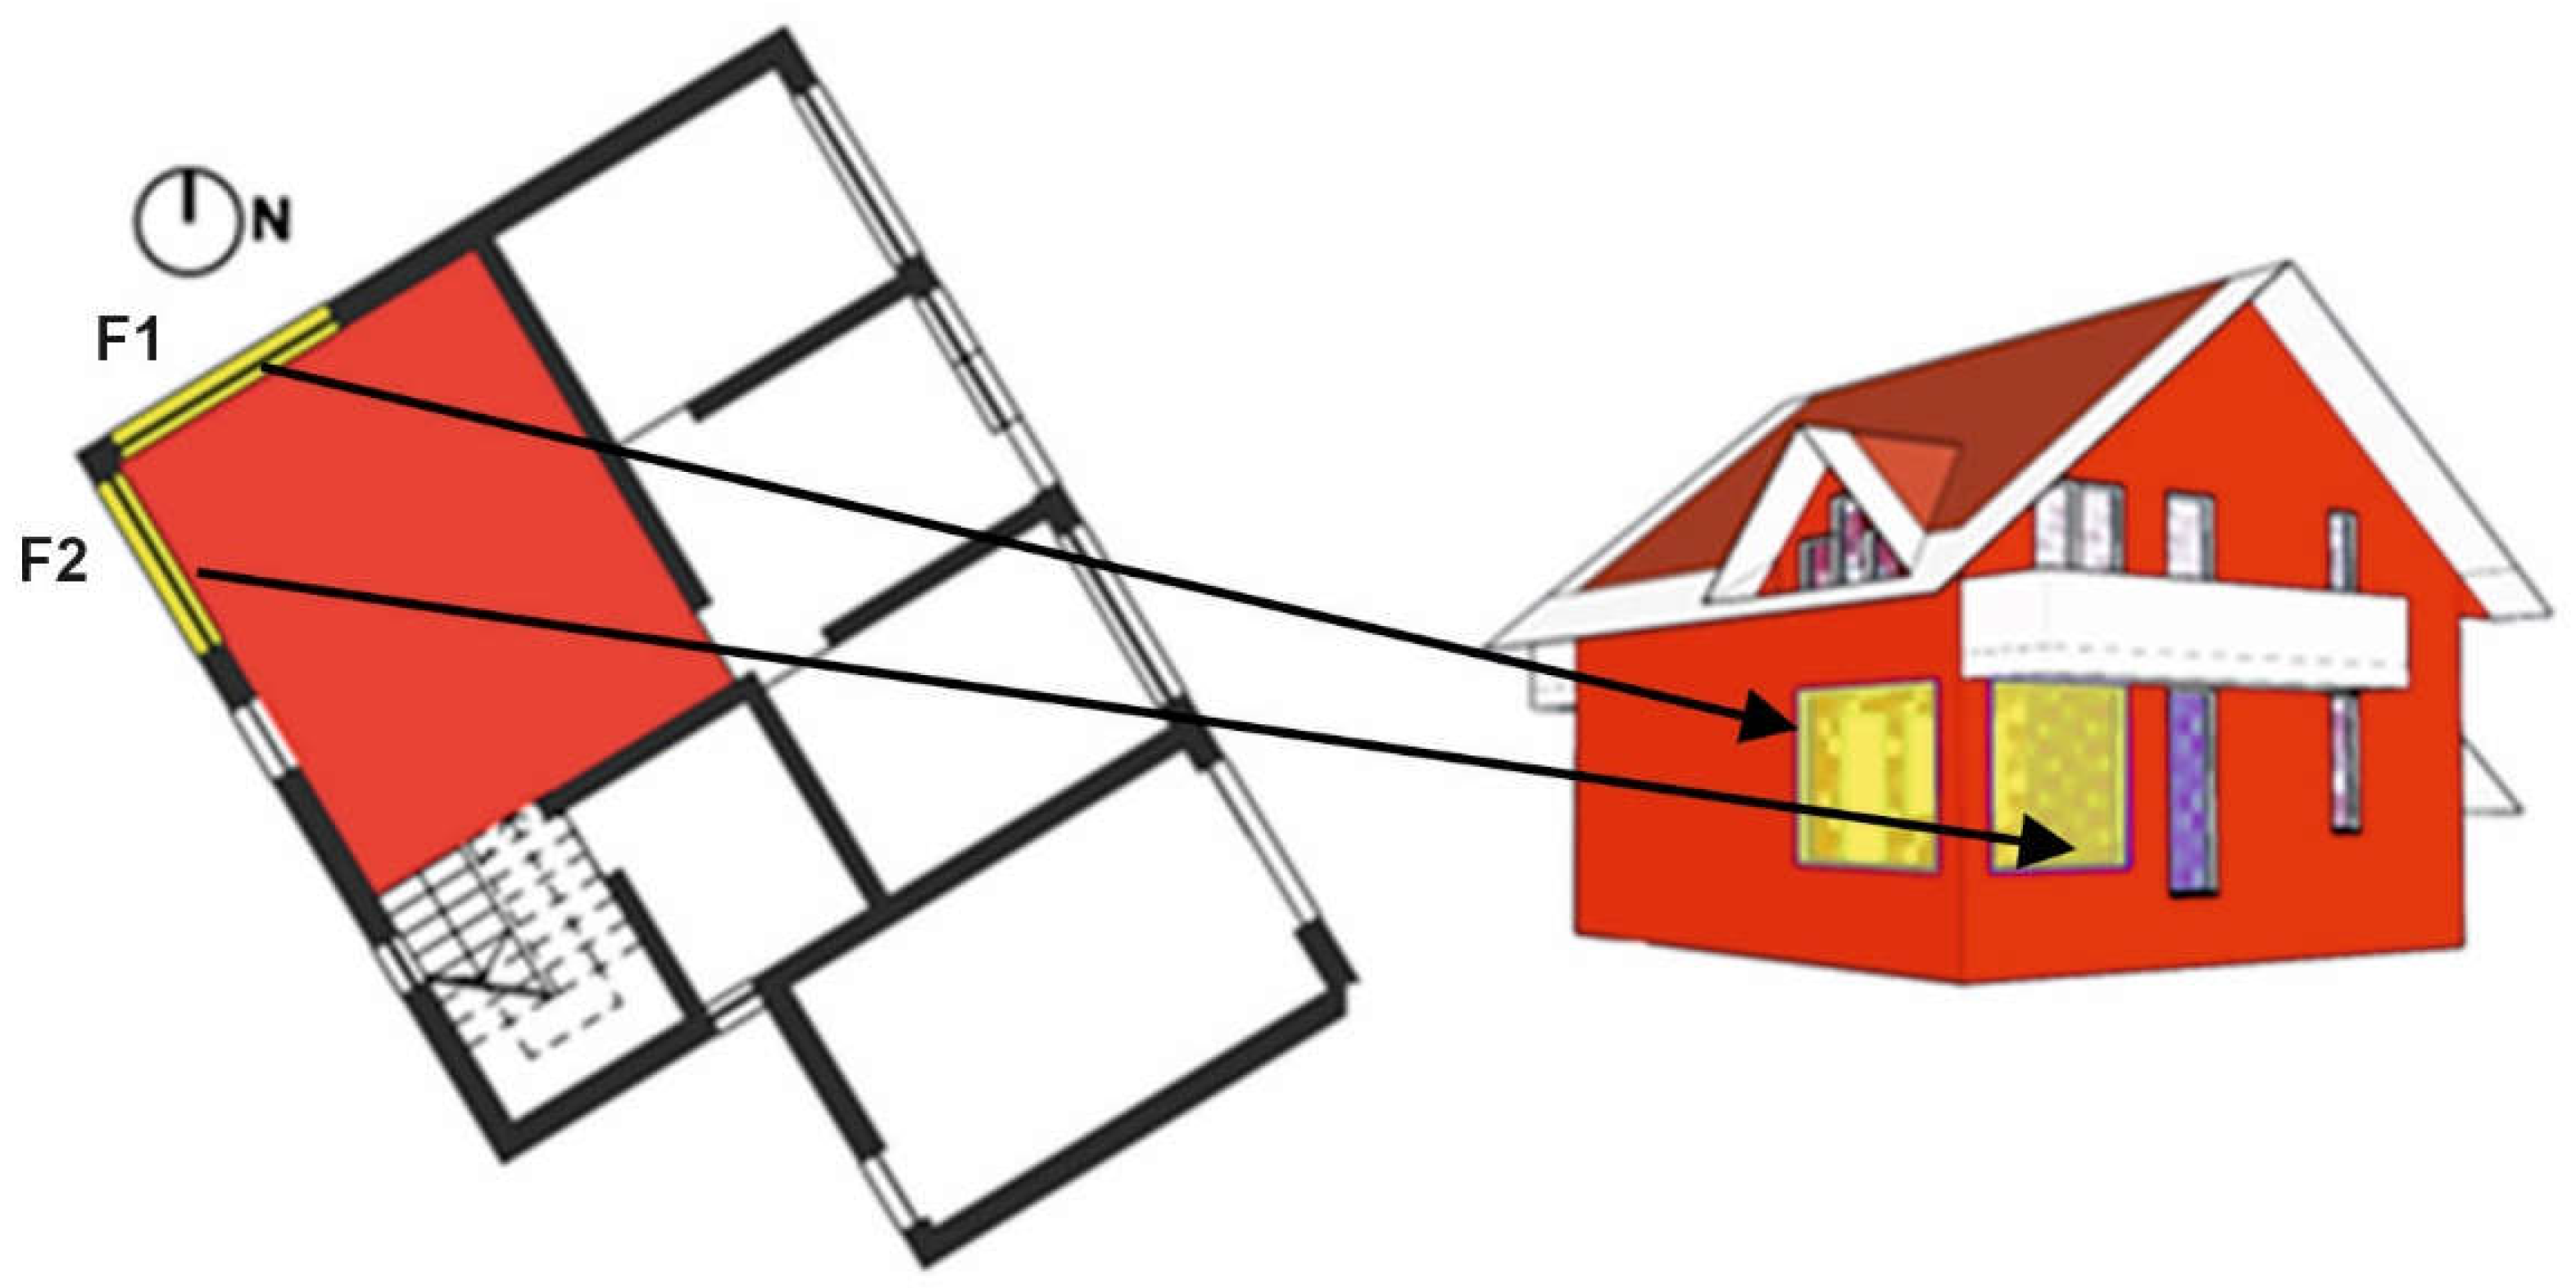
Figure 2.
Graphical representations for the quantitative analysis including the compass orientation of windows: (a) Hp=40 cm, Hf=230 cm; (b) Hp=80 cm, Hf=190 cm; (c) Hp=120 cm, Hf=150 cm; (d) Hp=160 cm, Hf=110 cm; (e) Hp=200 cm, Hf=70 cm; (f) Hp=240 cm, Hf=30 cm.
Figure 2.
Graphical representations for the quantitative analysis including the compass orientation of windows: (a) Hp=40 cm, Hf=230 cm; (b) Hp=80 cm, Hf=190 cm; (c) Hp=120 cm, Hf=150 cm; (d) Hp=160 cm, Hf=110 cm; (e) Hp=200 cm, Hf=70 cm; (f) Hp=240 cm, Hf=30 cm.
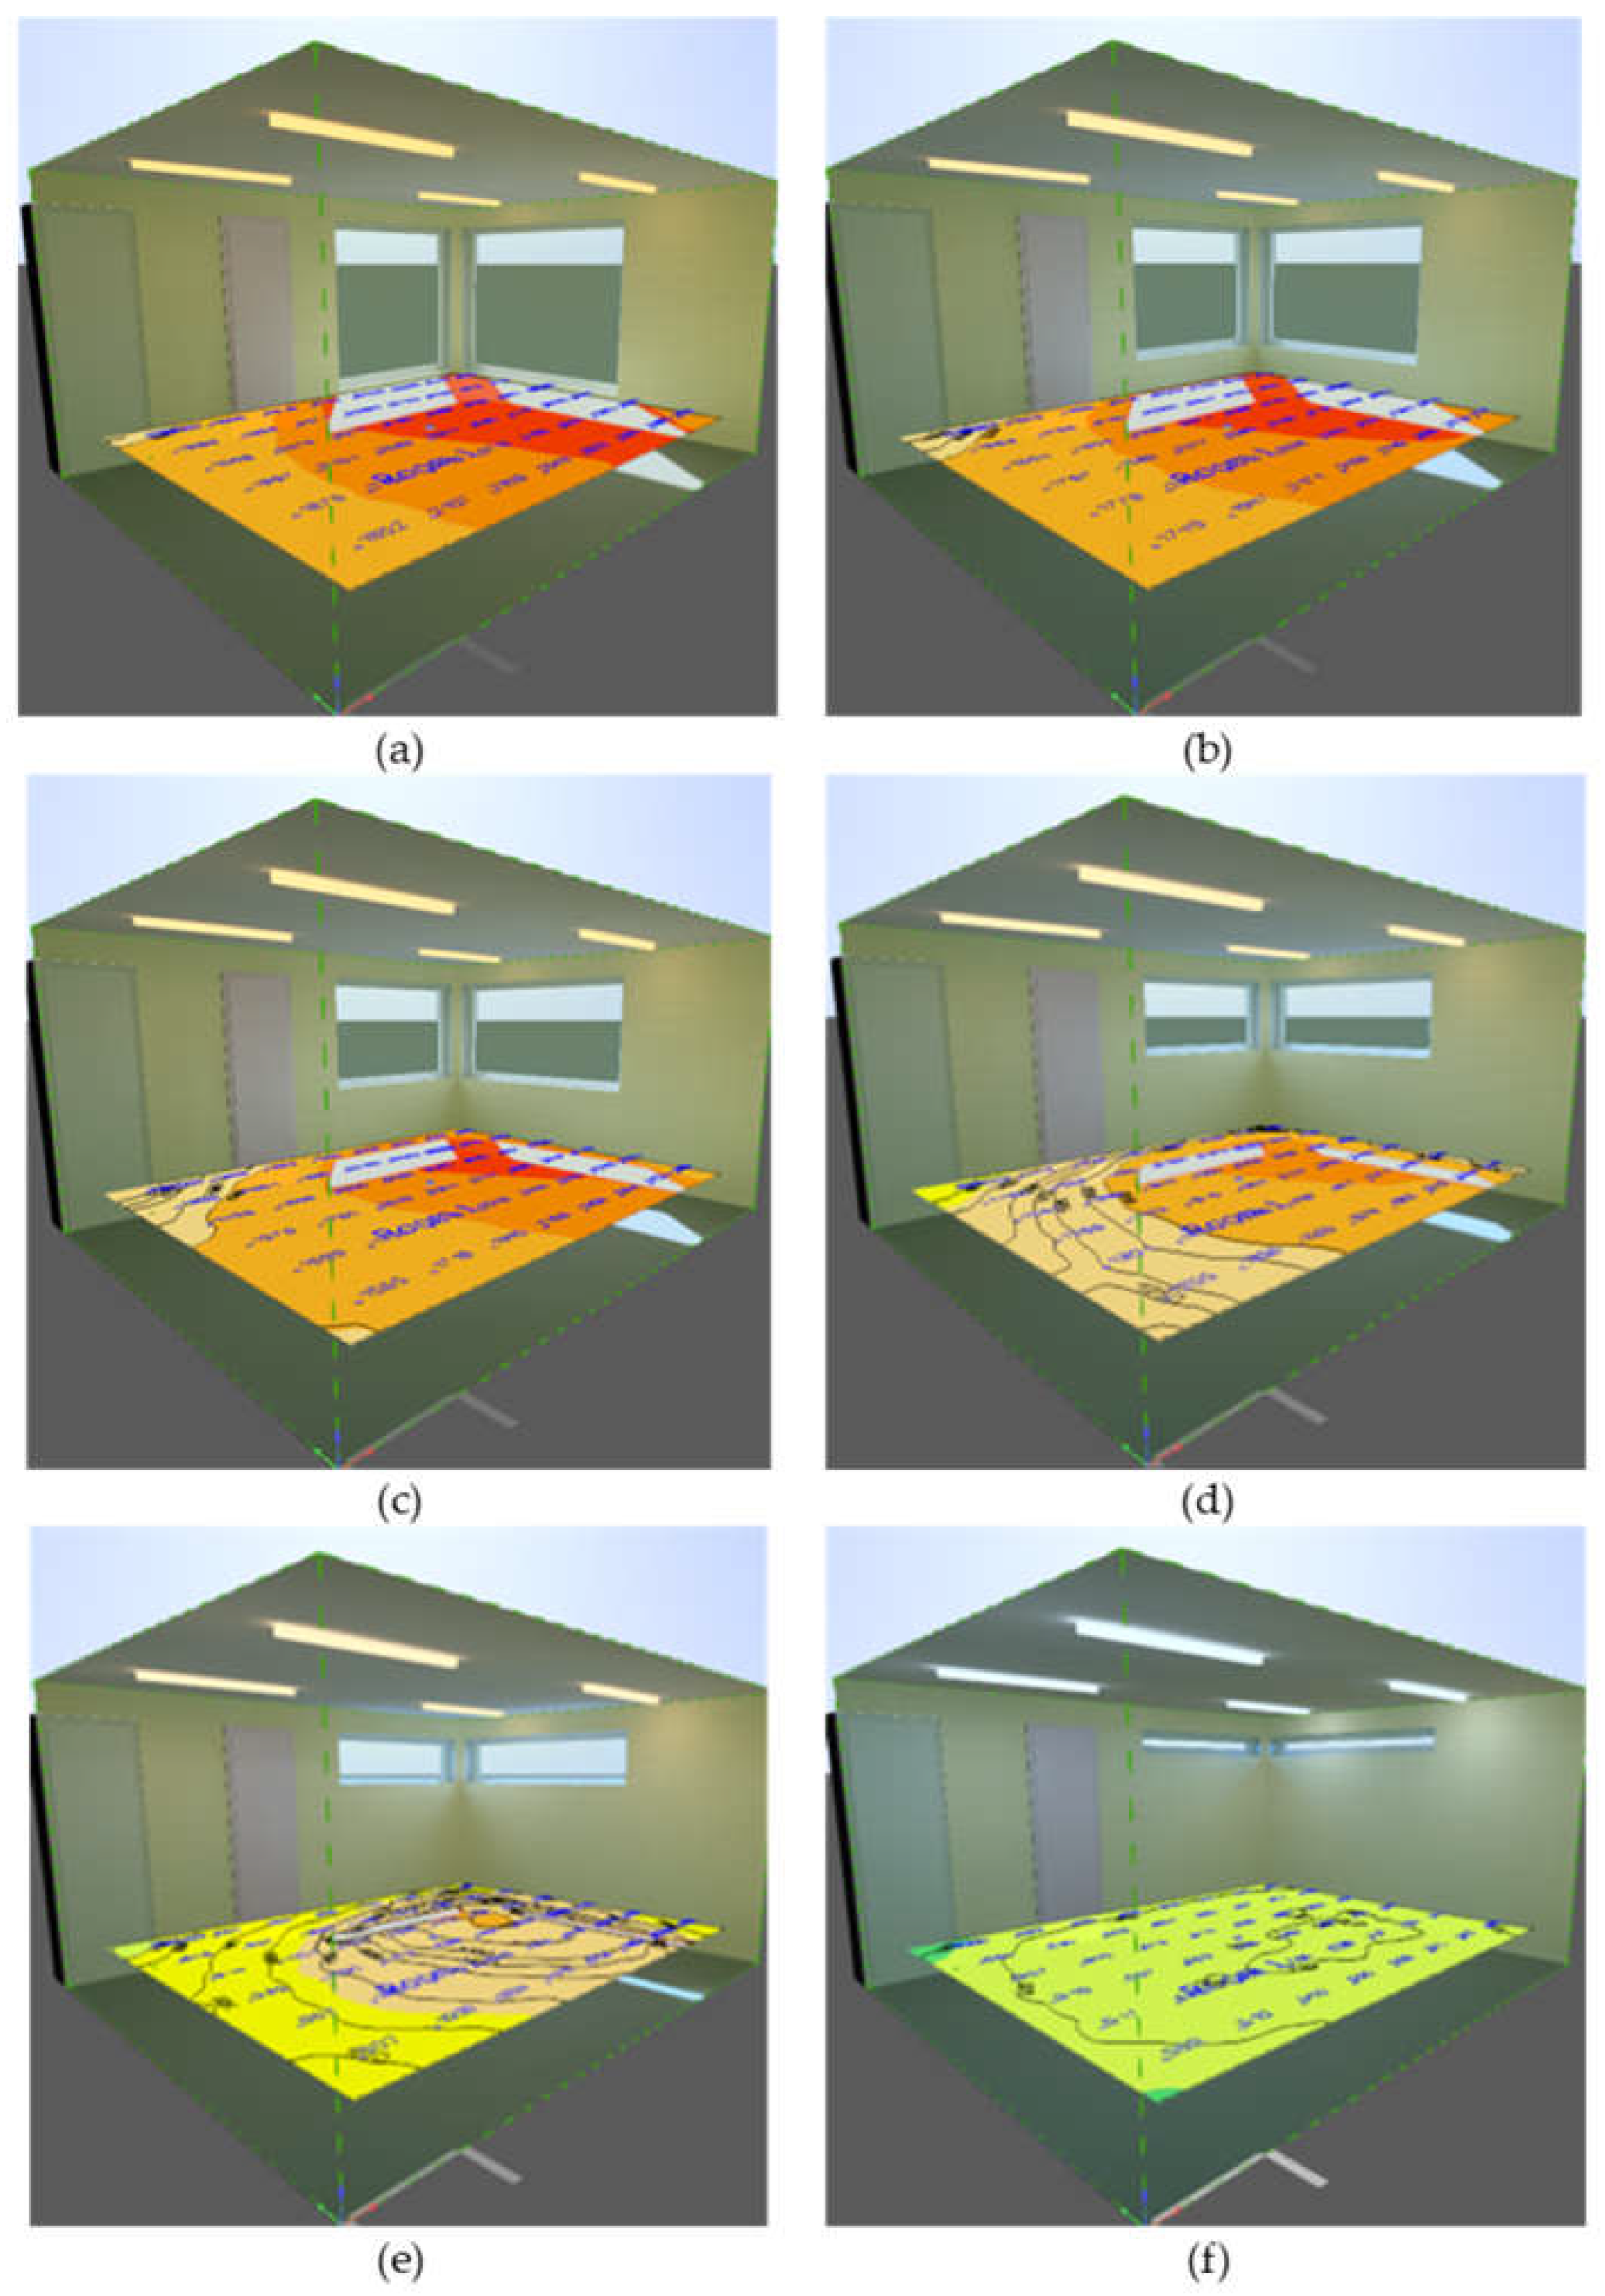
Figure 3.
Graphical representations for the quantitative analysis including the cardinal orientation of windows: (a) Hp=40 cm, Hf=230 cm; (b) Hp=80 cm, Hf=190 cm; (c) Hp=120 cm, Hf=150 cm; (d) Hp=160 cm, Hf=110 cm; (e) Hp=200 cm, Hf=70 cm; (f) Hp=240 cm, Hf=30 cm.
Figure 3.
Graphical representations for the quantitative analysis including the cardinal orientation of windows: (a) Hp=40 cm, Hf=230 cm; (b) Hp=80 cm, Hf=190 cm; (c) Hp=120 cm, Hf=150 cm; (d) Hp=160 cm, Hf=110 cm; (e) Hp=200 cm, Hf=70 cm; (f) Hp=240 cm, Hf=30 cm.
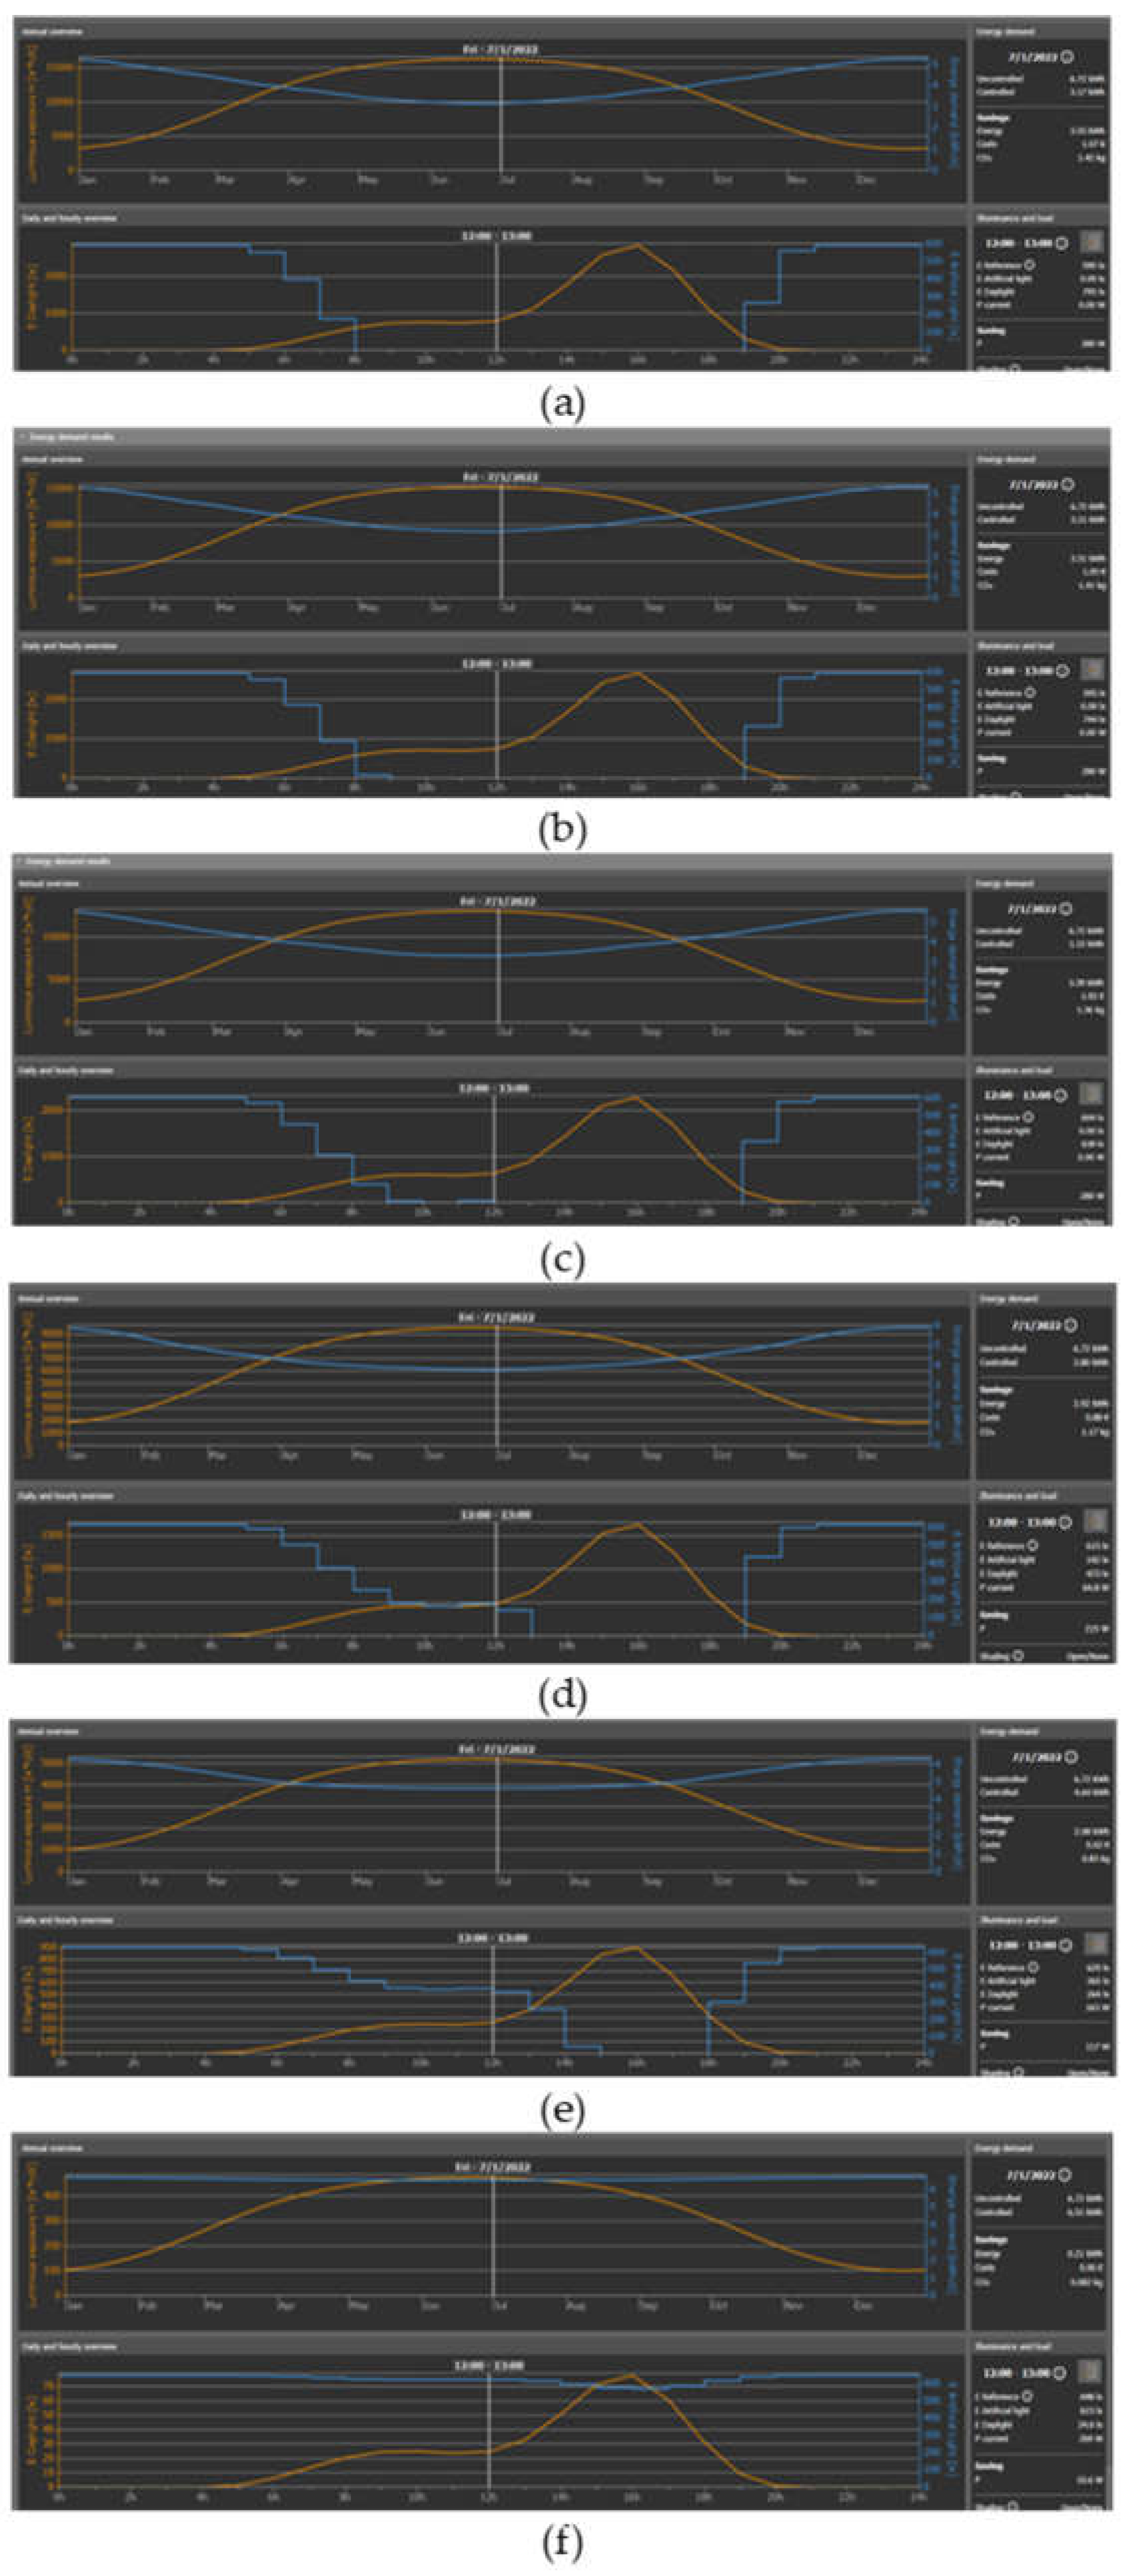
Figure 4.
Graphical representations energy balance heating: (a) Hp=40 cm, Hf=230 cm; (b) Hp=80 cm, Hf=190 cm; (c) Hp=120 cm, Hf=150 cm; (d) Hp=160 cm, Hf=110 cm; (e) Hp=200 cm, Hf=70 cm; (f) Hp=240 cm, Hf=30 cm.
Figure 4.
Graphical representations energy balance heating: (a) Hp=40 cm, Hf=230 cm; (b) Hp=80 cm, Hf=190 cm; (c) Hp=120 cm, Hf=150 cm; (d) Hp=160 cm, Hf=110 cm; (e) Hp=200 cm, Hf=70 cm; (f) Hp=240 cm, Hf=30 cm.
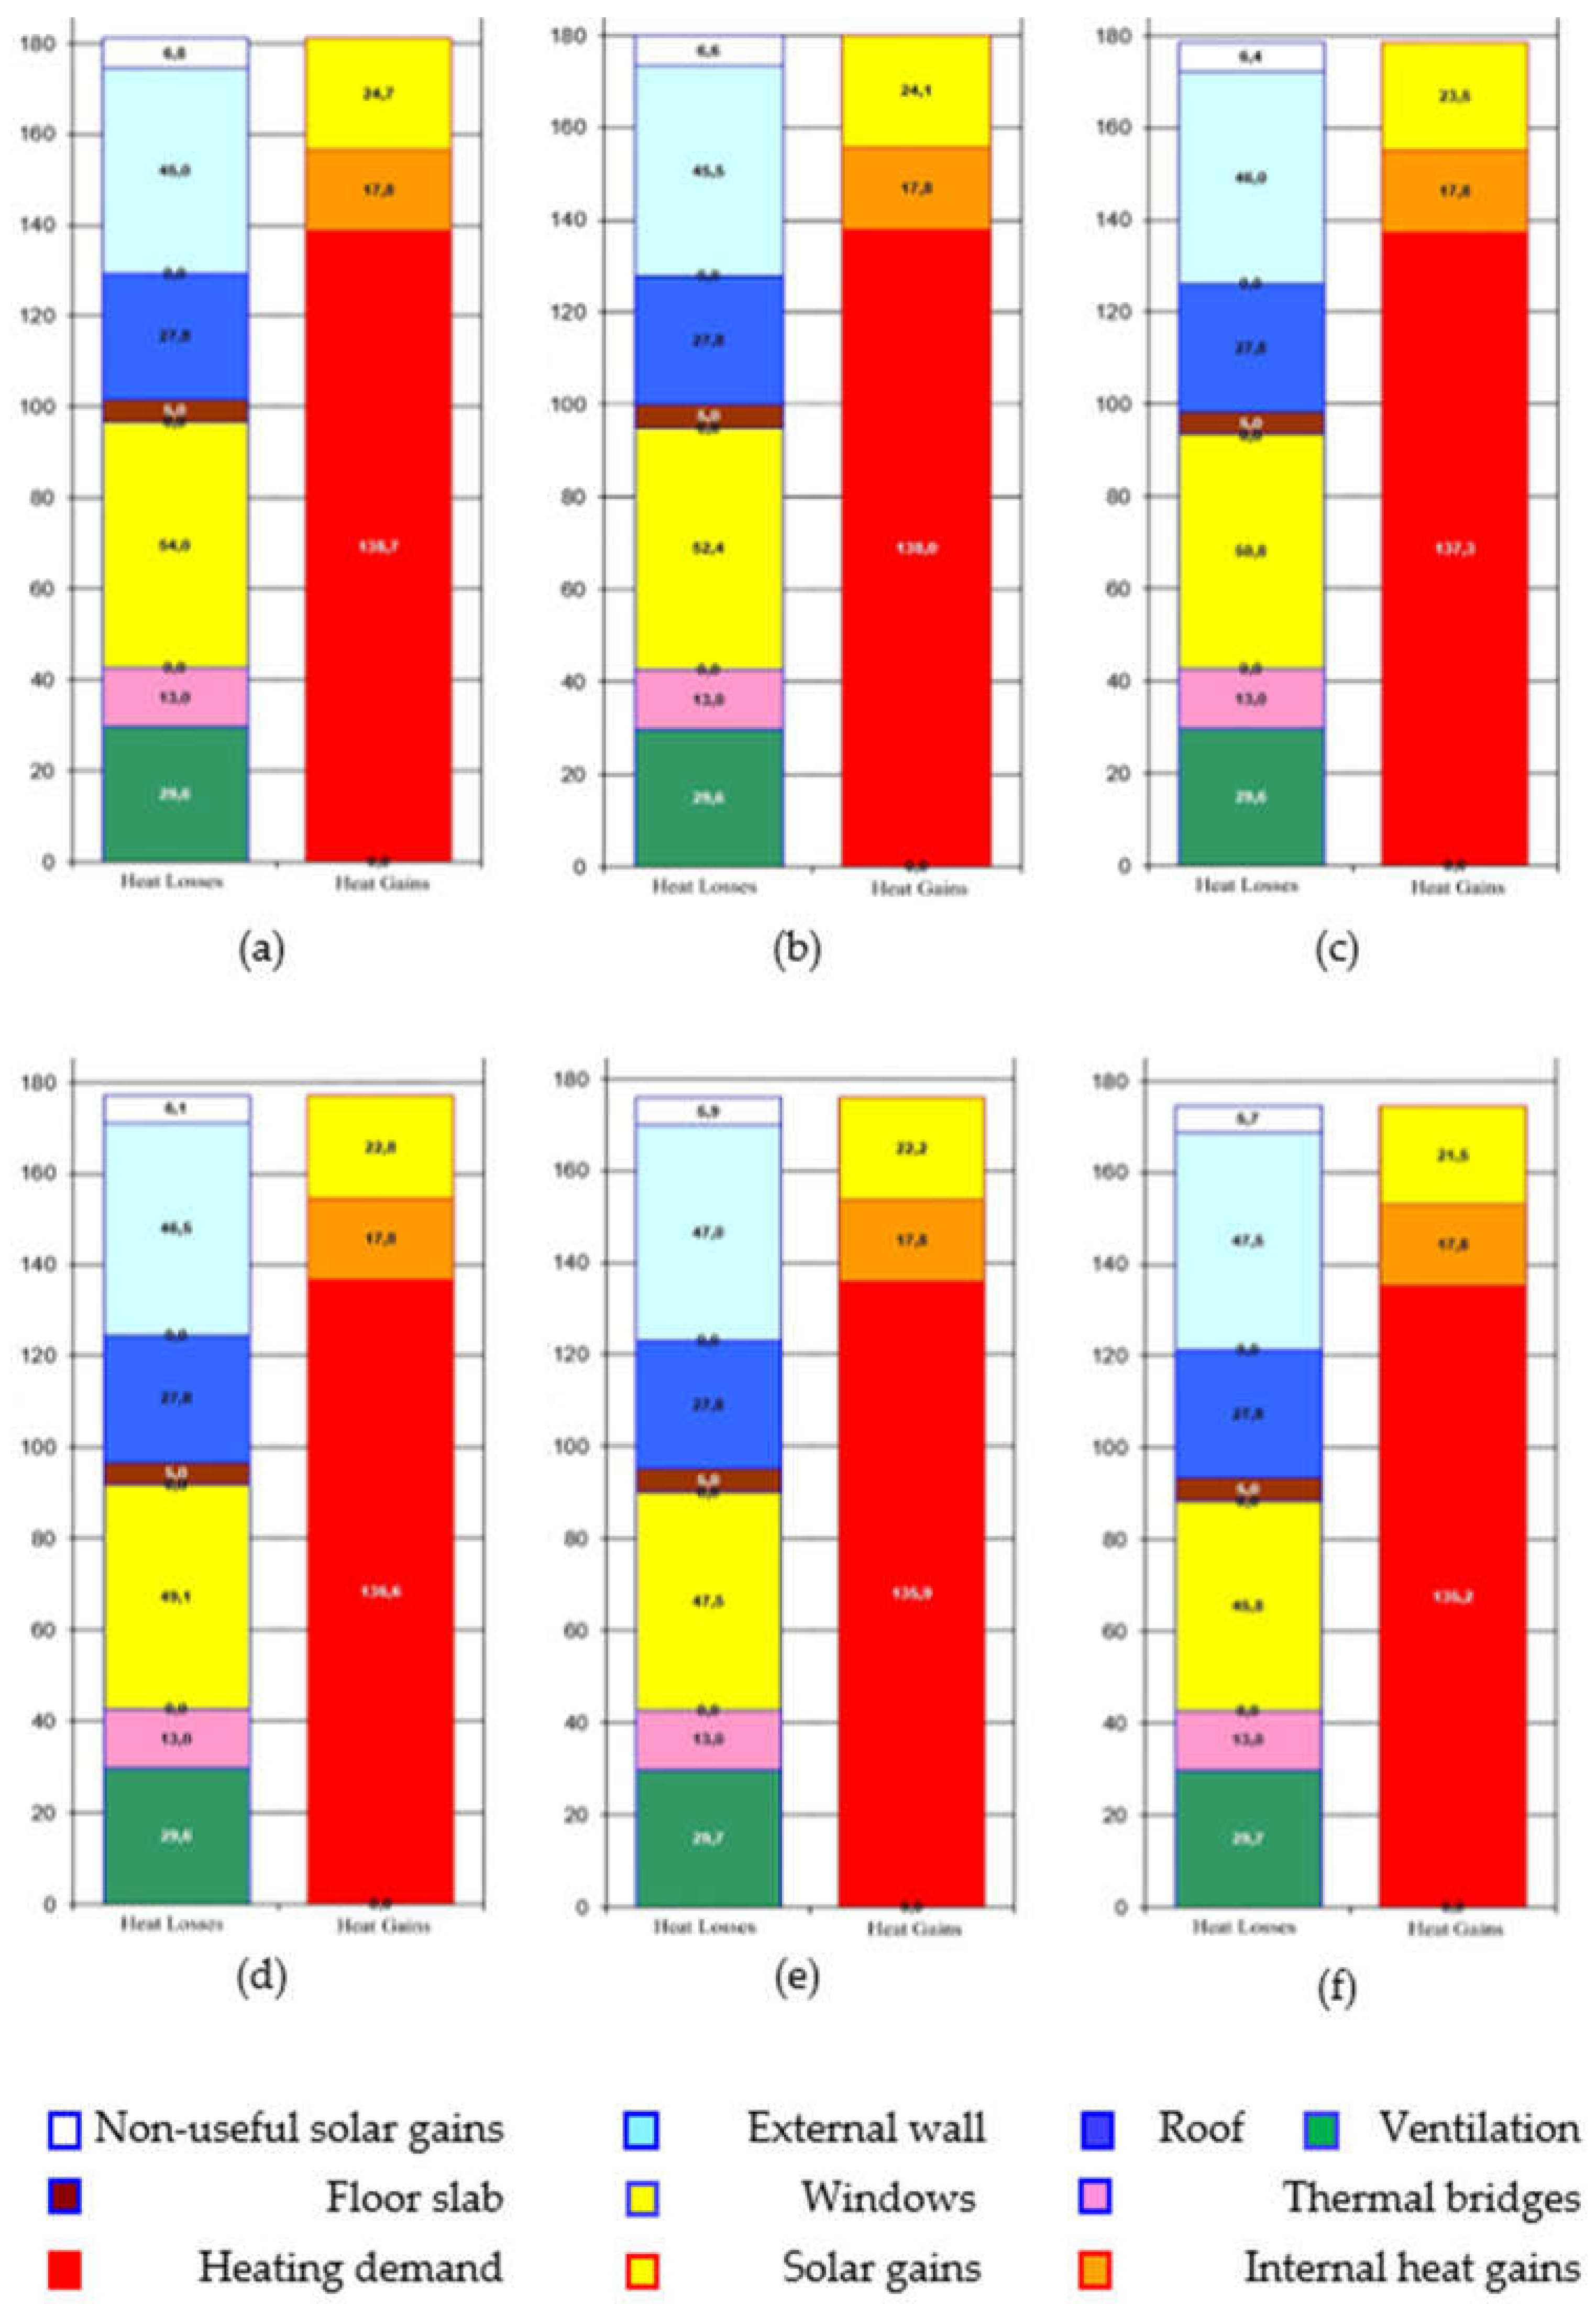
Figure 5.
Total energy consumption for average illuminance of 500 lx.
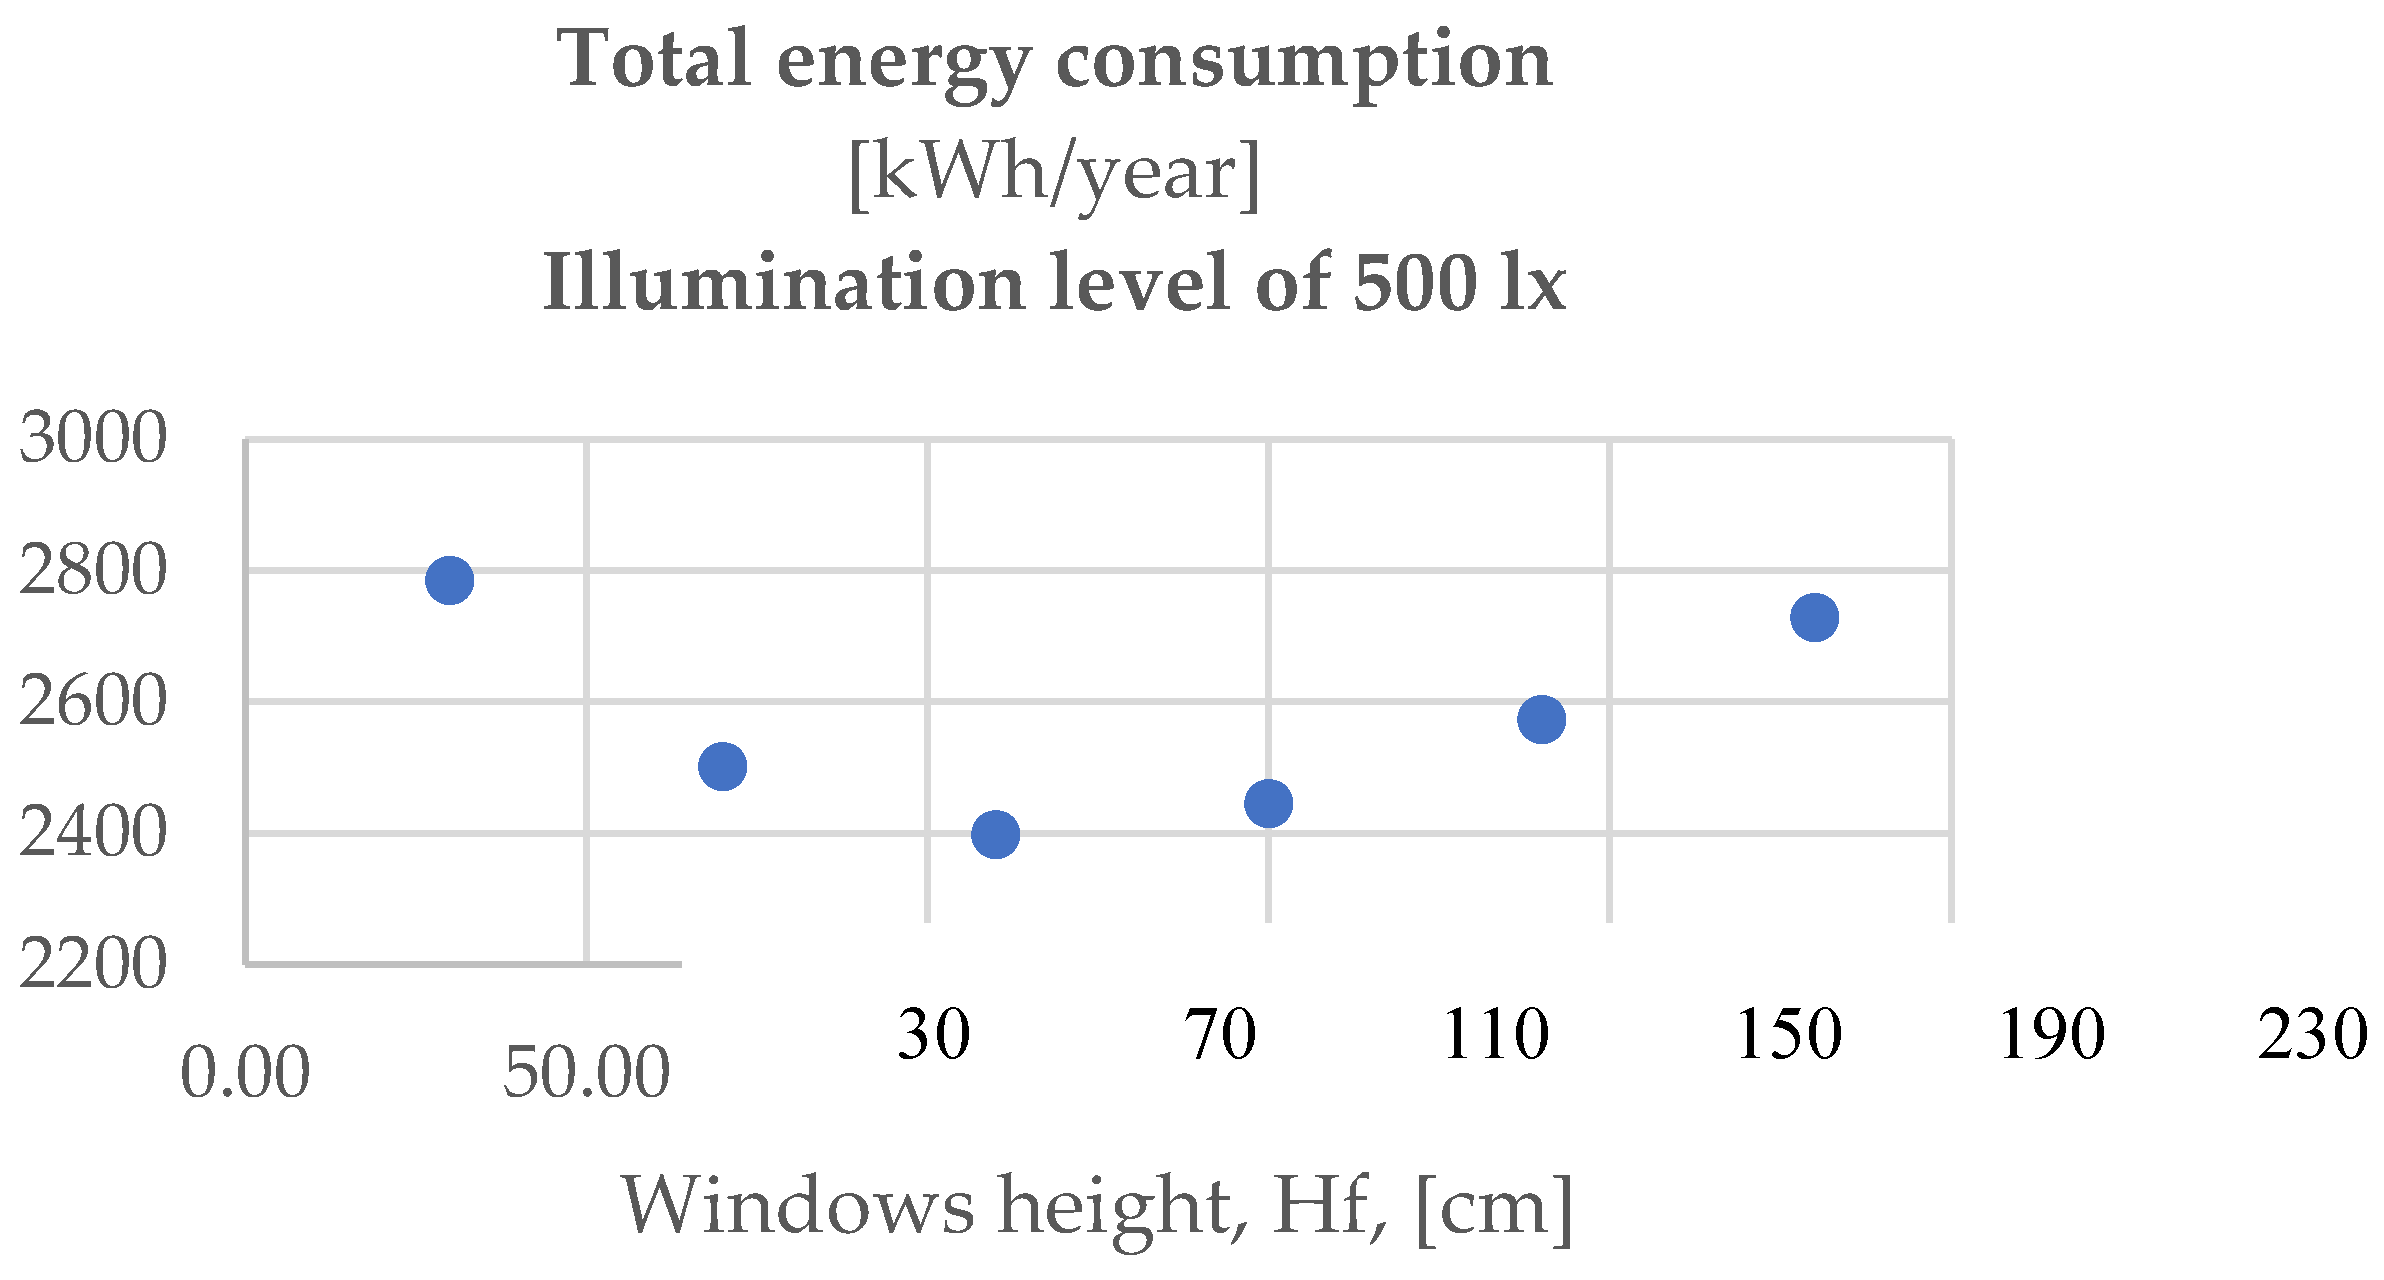
Figure 6.
Total energy consumption for average illuminance of 250 lx.
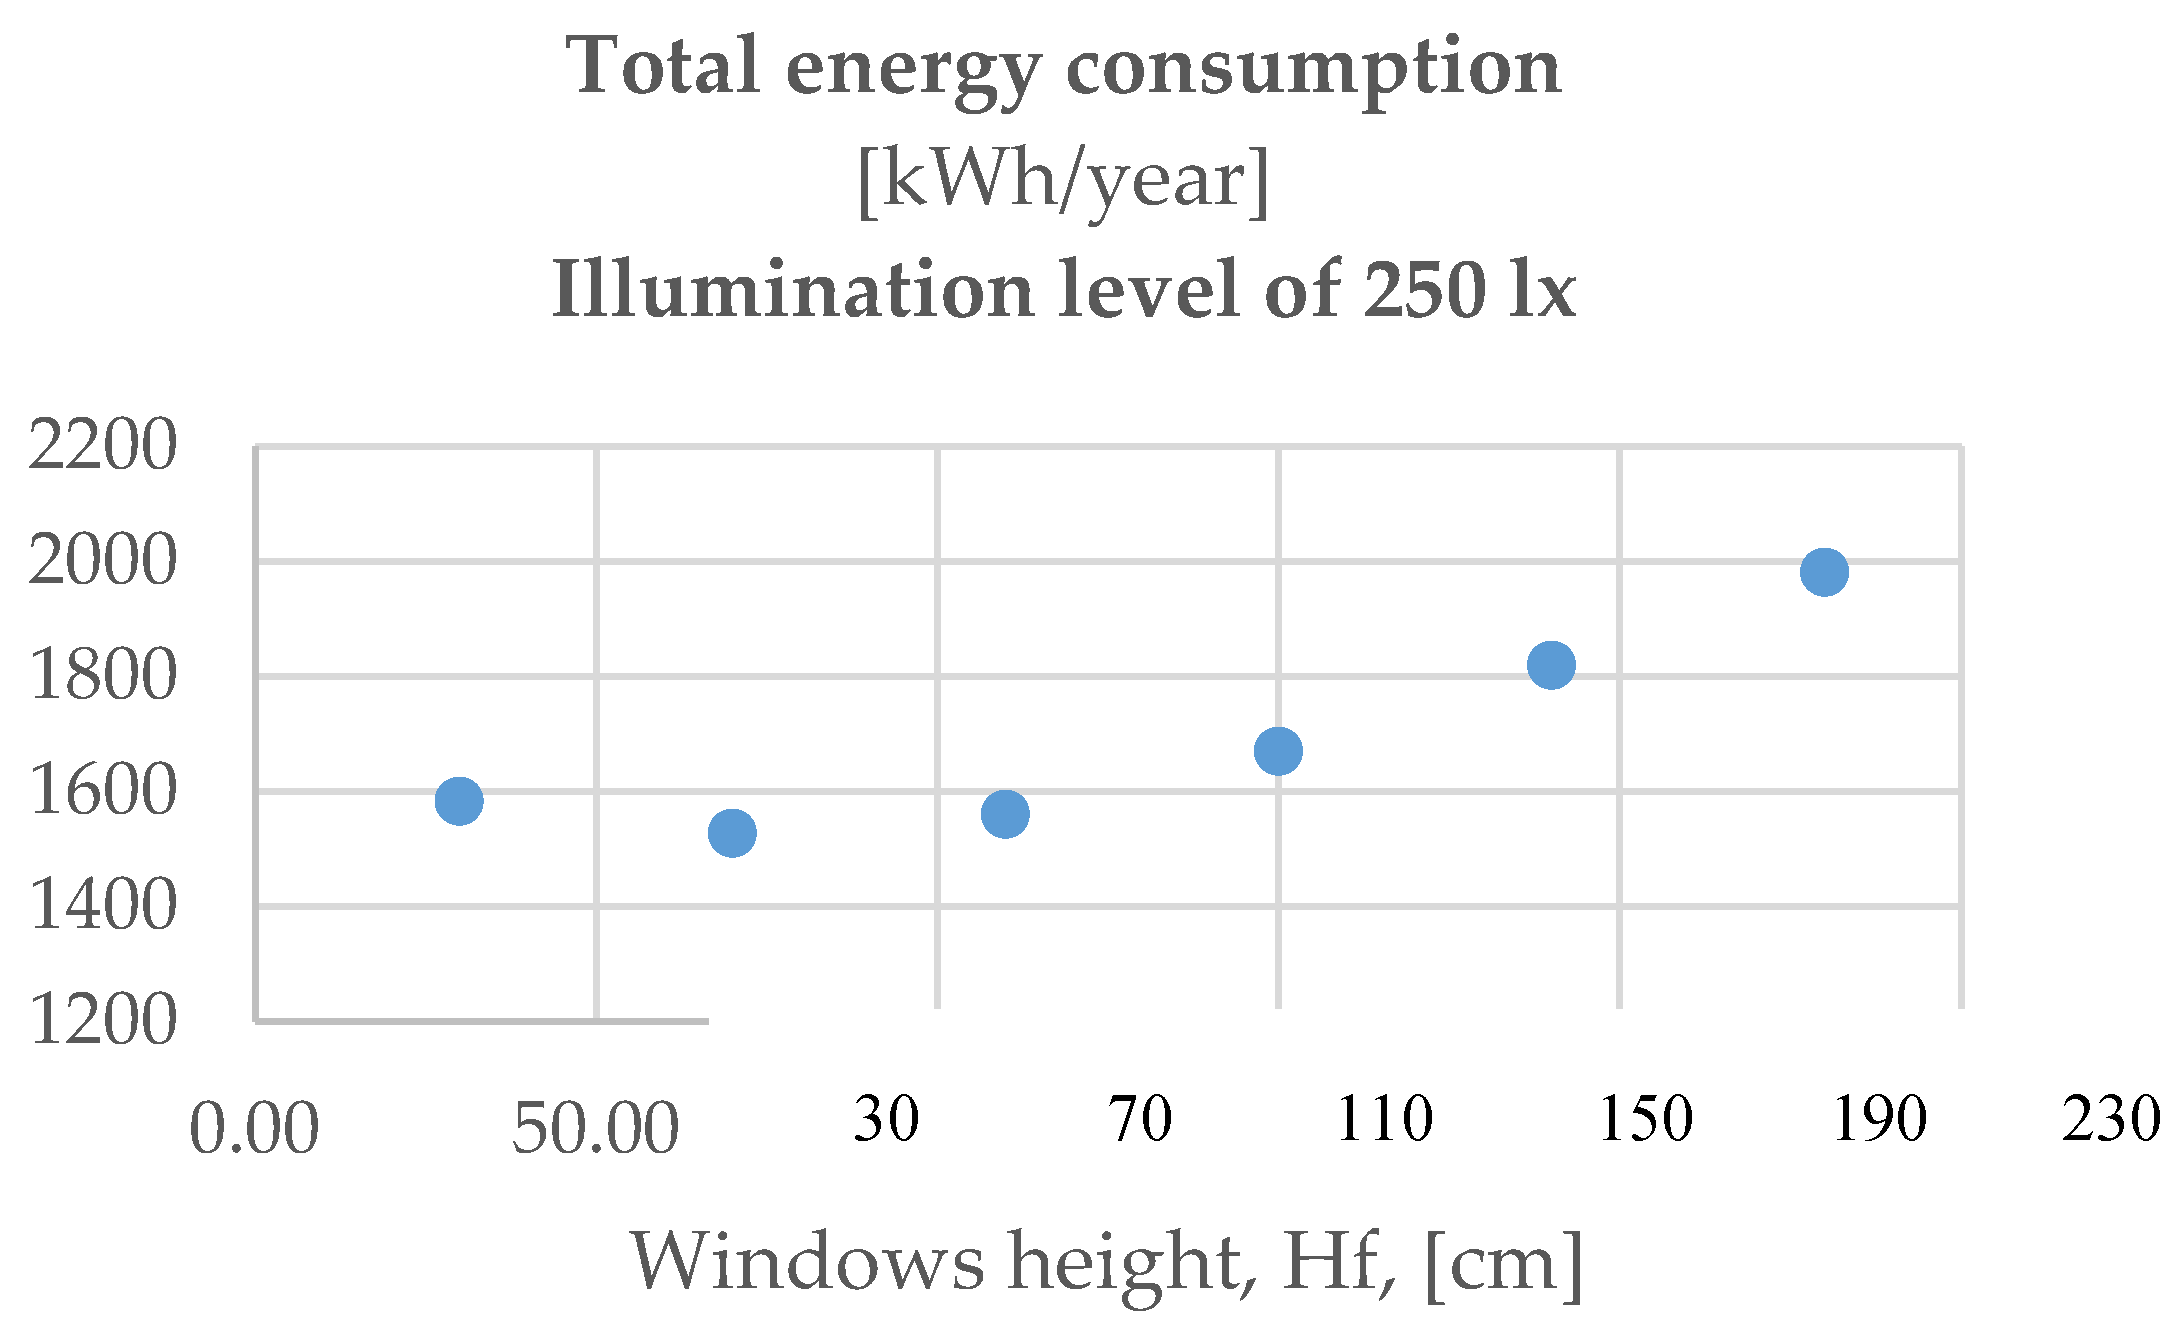
Figure 7.
Total energy consumption for average illuminance of 100 lx.
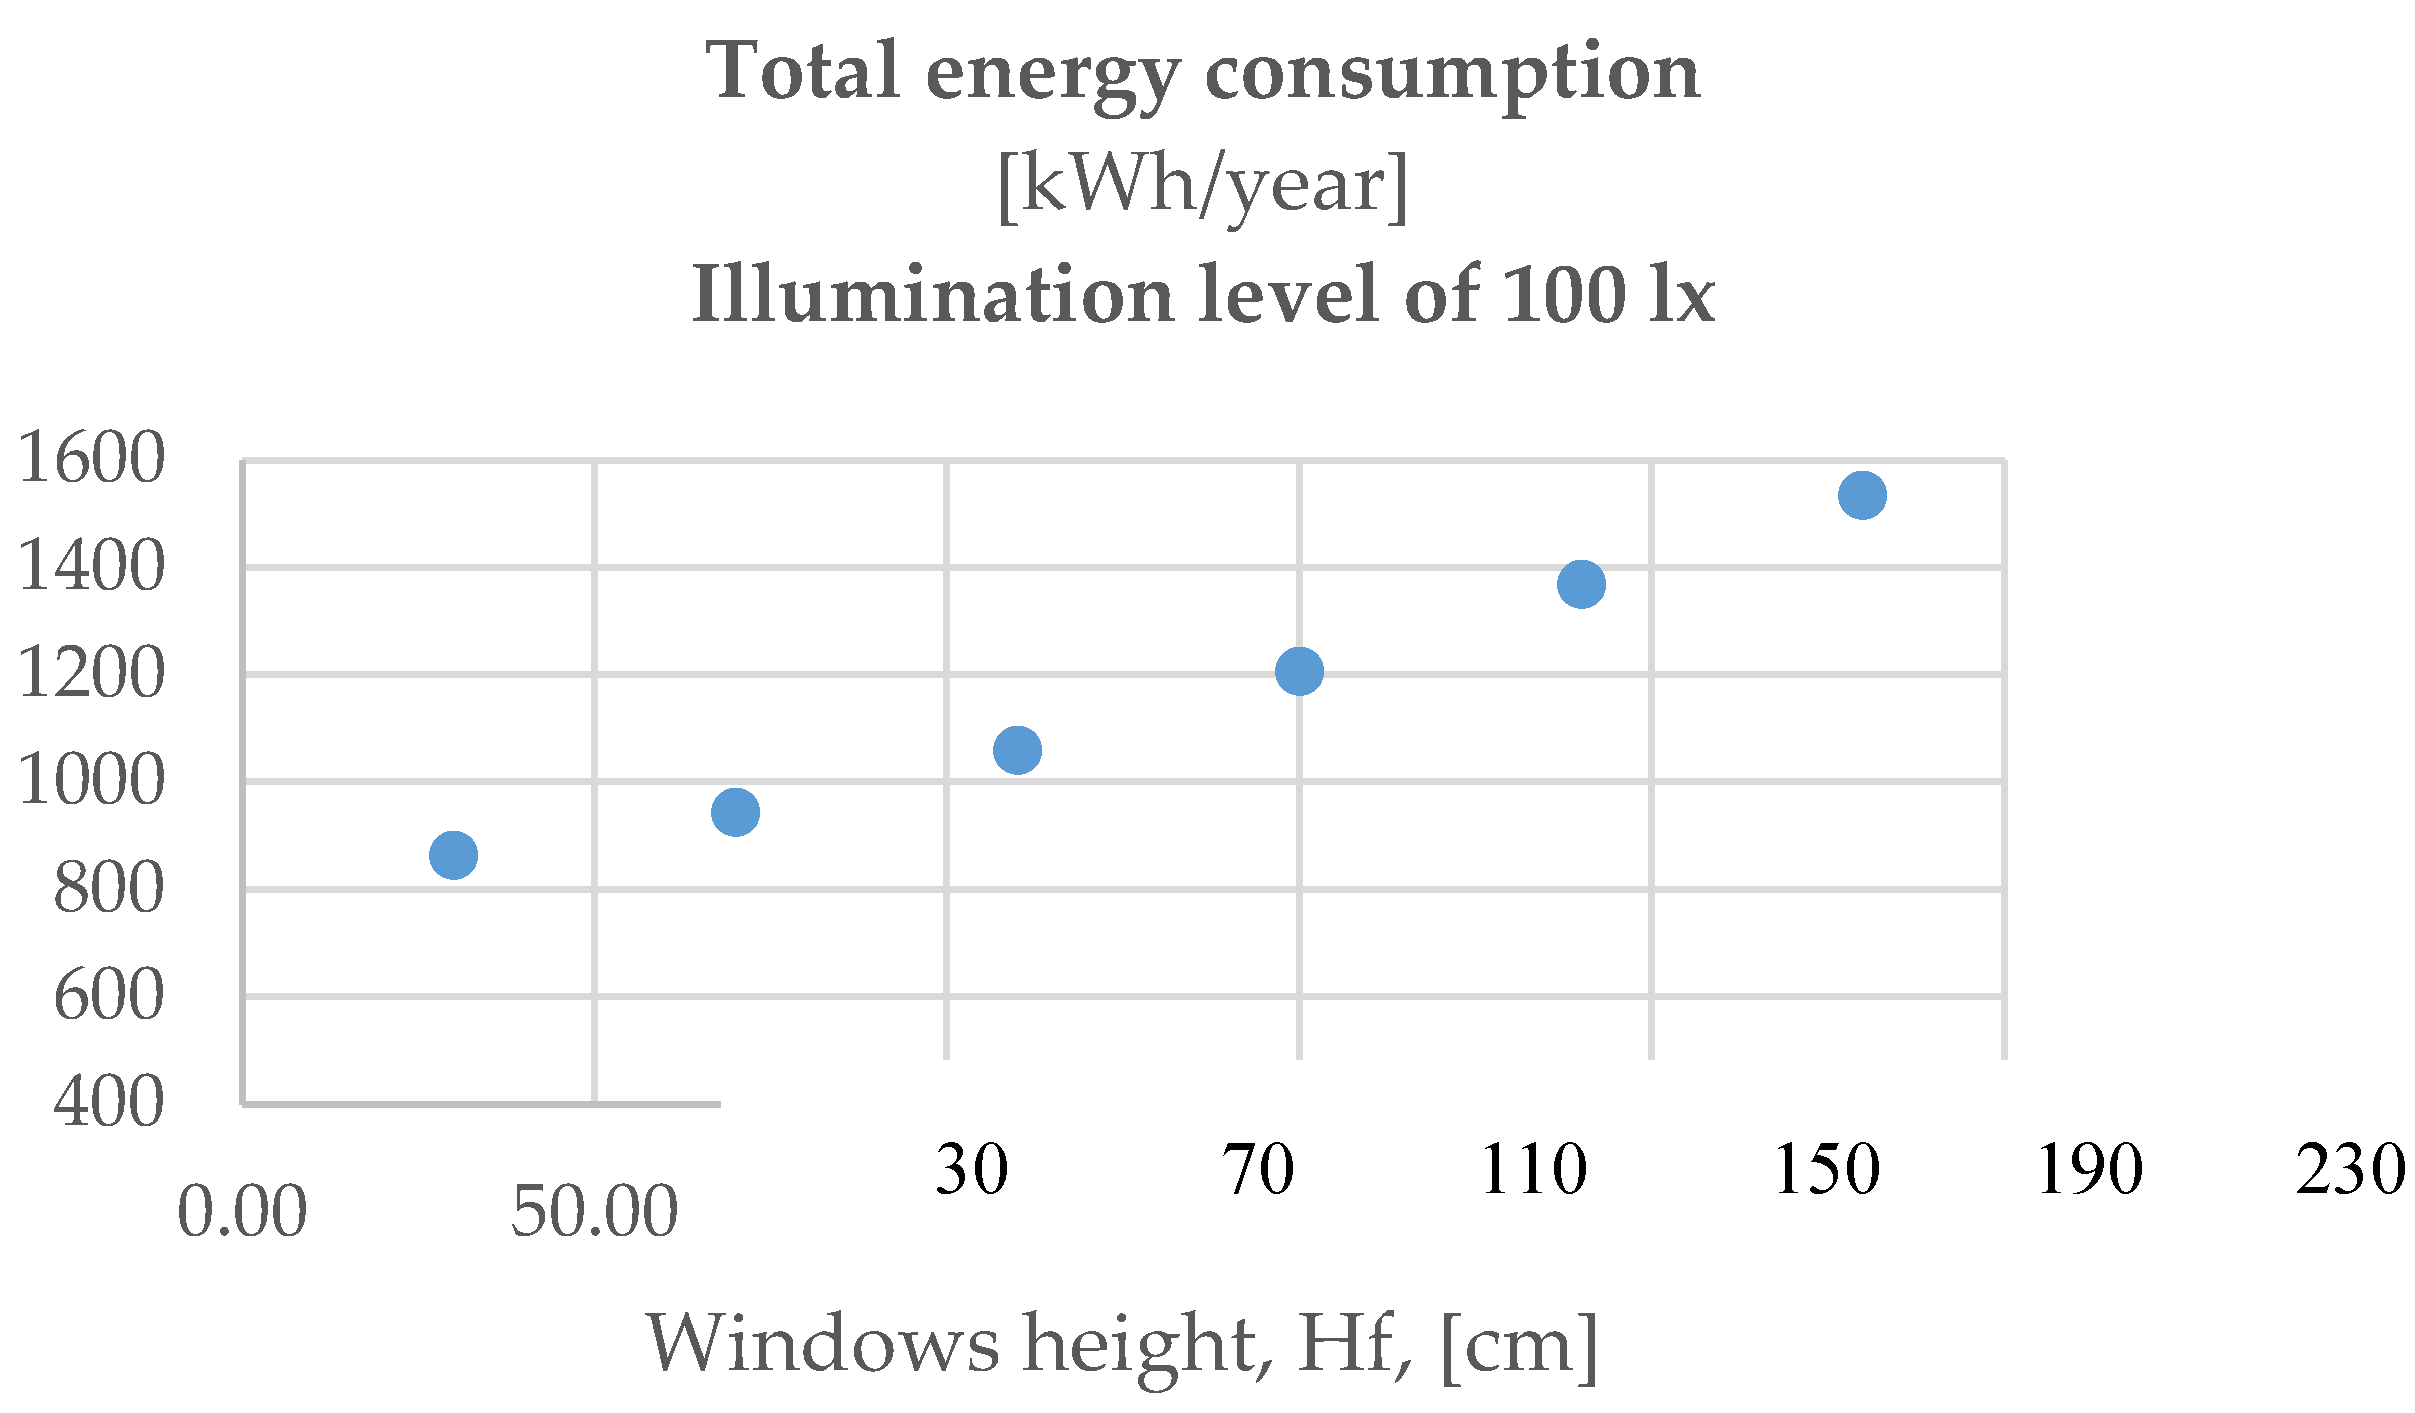
Figure 8.
Total energy consumption or average illuminance of 1000 lx.
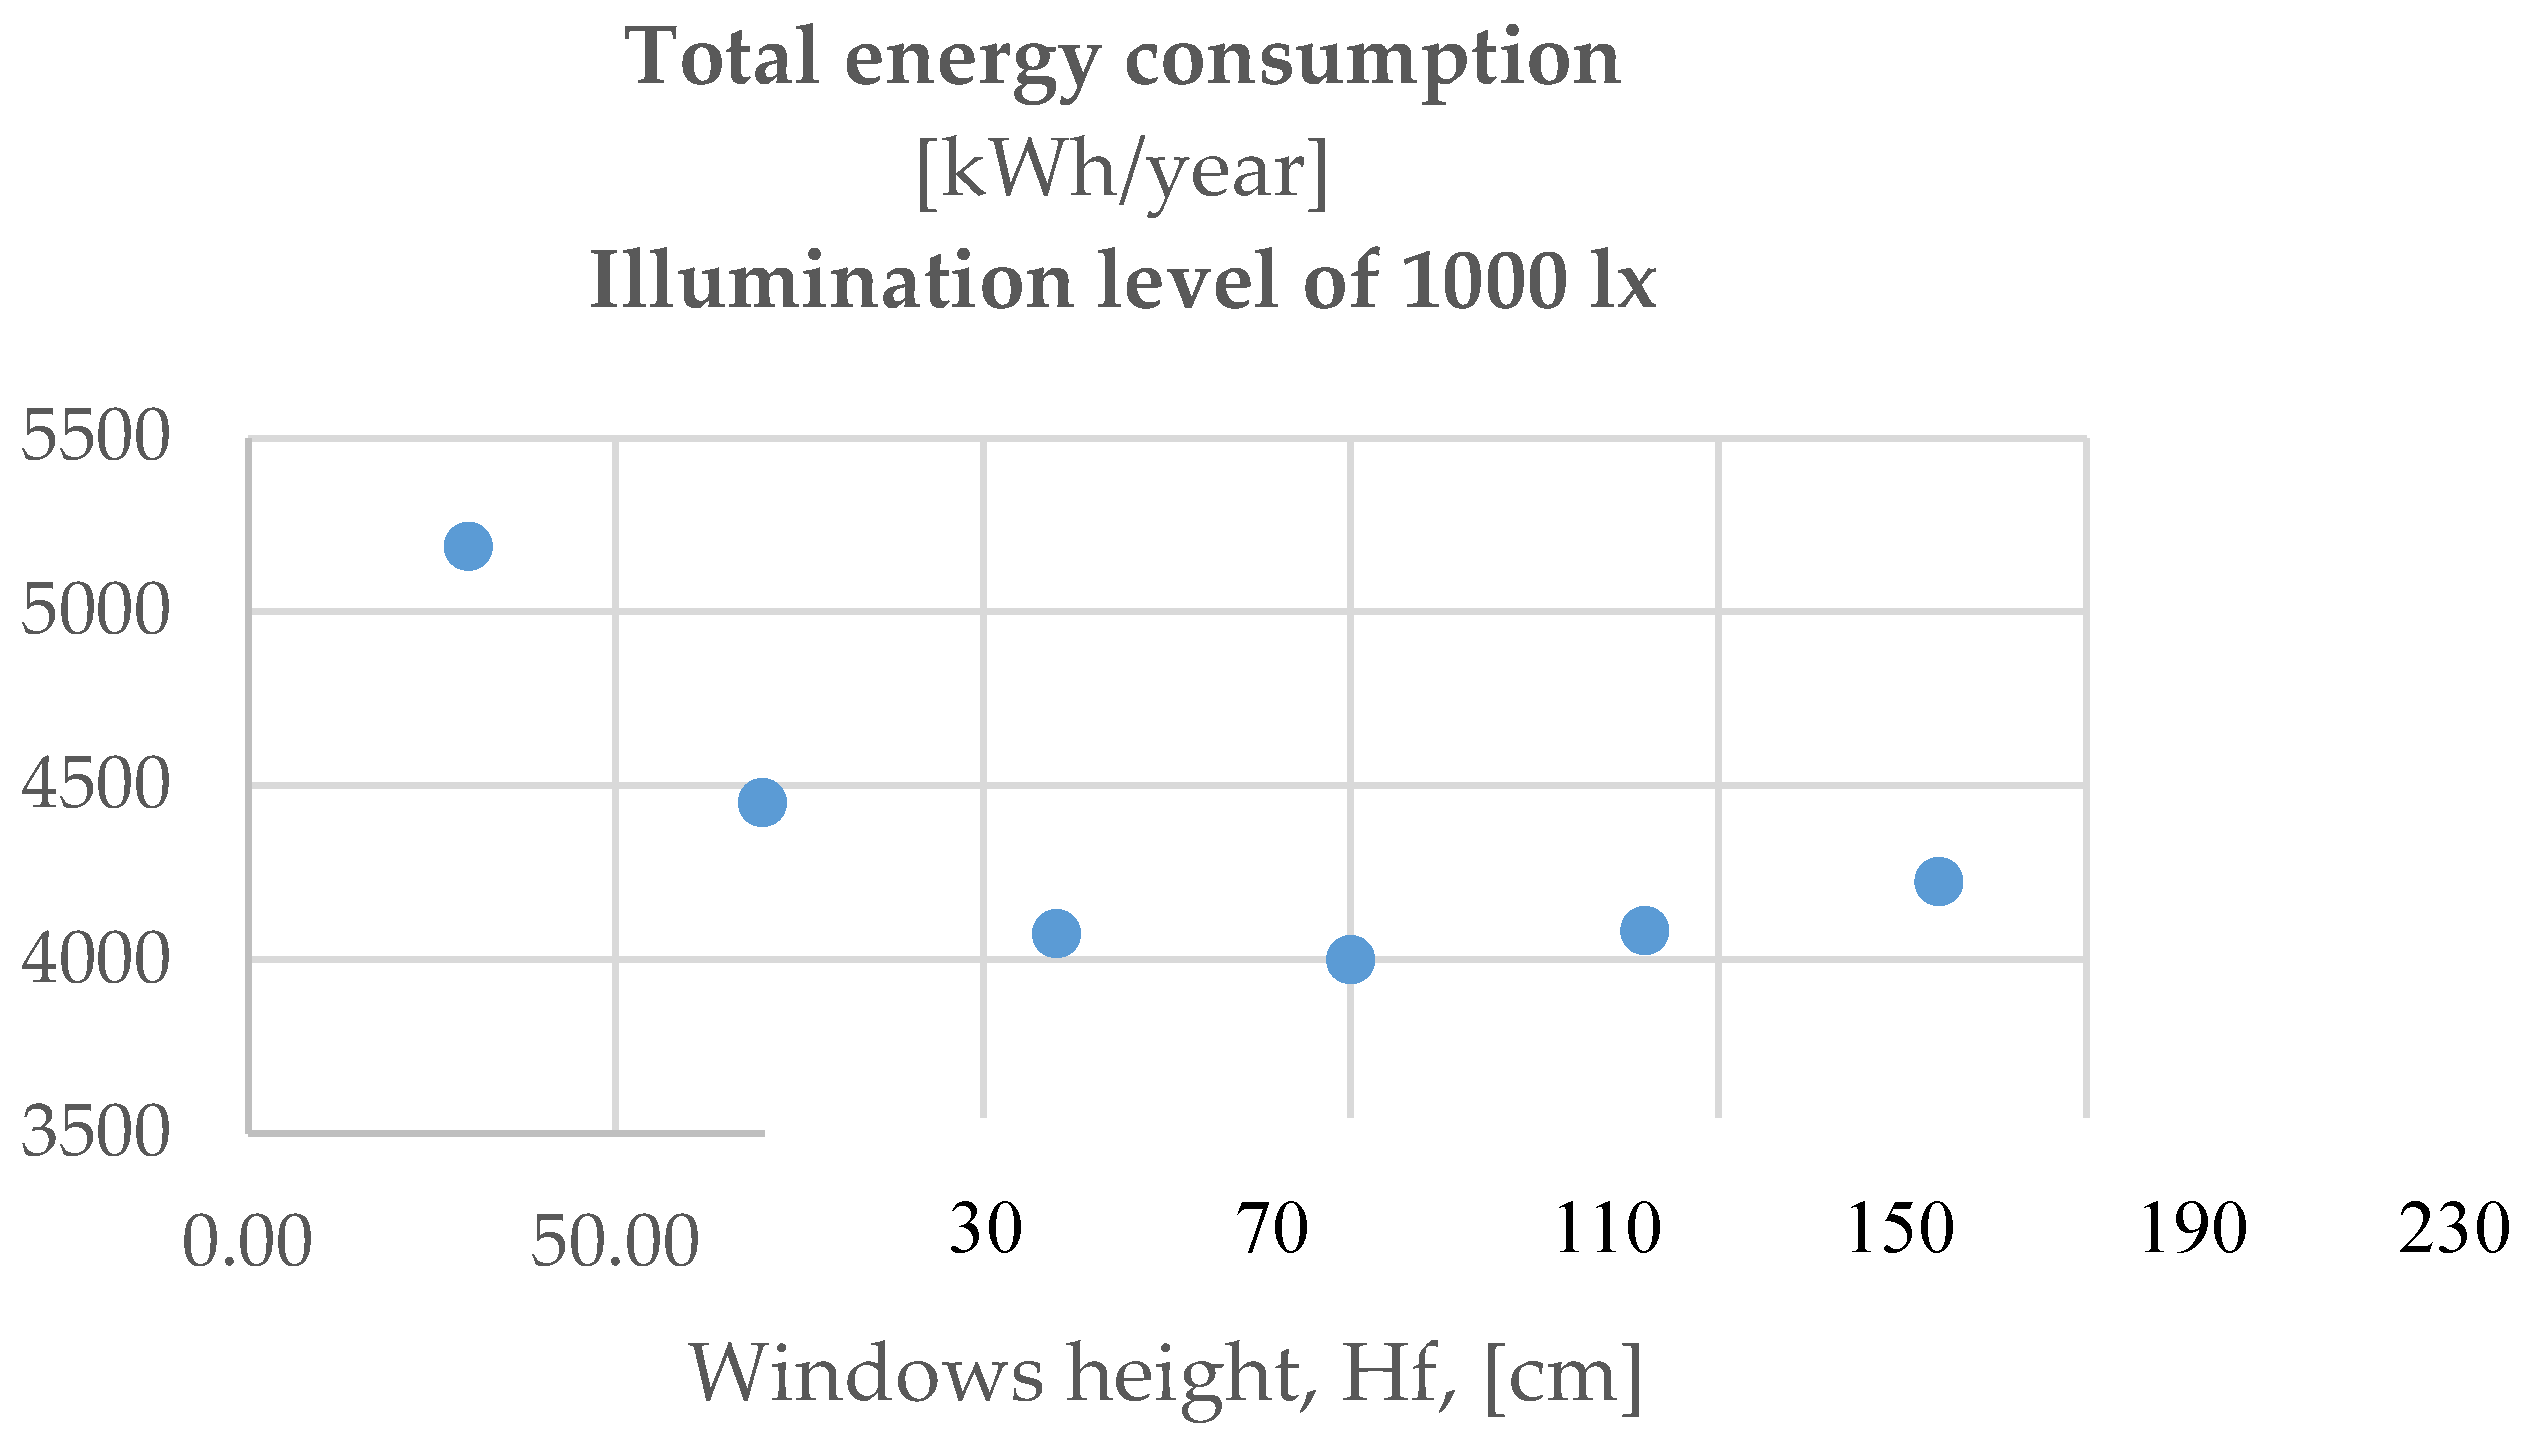

Table 1.
Daylighting illumination values evaluation using Dialux EVO 12.
| Step No. | Windows heightHf, [cm] | Emed [lx] | Emin [lx] | Emax [lx] | Emin/Emed | Emin/Emax |
|---|---|---|---|---|---|---|
| 1 | 230 | 10654 | 1413 | 37006 | 0.13 | 0.038 |
| 2 | 190 | 9993 | 1300 | 34849 | 0.13 | 0.037 |
| 3 | 150 | 7436 | 1120 | 33564 | 0.15 | 0.033 |
| 4 | 110 | 4751 | 941 | 32164 | 0.20 | 0.029 |
| 5 | 70 | 2194 | 707 | 31130 | 0.32 | 0.023 |
| 6 | 30 | 649 | 476 | 720 | 0.73 | 0.66 |
Table 2.
Energy consumptions values for artificial lighting.
| Step No. | Window height Hf, [cm] | Energy consumption without control [kWh/year]/[kWh/(m2year] | Energy consumption with automated control [kWh/year]/[kWh/(m2year] | Savings [kWh/year]/[kWh/(m2year] | |
|---|---|---|---|---|---|
| 1 | 230 | Energy | 2453 | 1494 | 959 |
| LENI* | 89,8 | 54,7 | 35,1 | ||
| 2 | 190 | Energy | 2453 | 1508 | 944 |
| LENI* | 89,8 | 55,2 | 34,6 | ||
| 3 | 150 | Energy | 2453 | 1552 | 900 |
| LENI* | 89,8 | 56,8 | 33,0 | ||
| 4 | 110 | Energy | 2453 | 1676 | 777 |
| LENI* | 89,8 | 61,4 | 28,4 | ||
| 5 | 70 | Energy | 2453 | 1949 | 504 |
| LENI* | 89,8 | 71,4 | 18,4 | ||
| 6 | 30 | Energy | 2453 | 2403 | 49,7 |
| LENI* | 89,8 | 88 | 1,82 |
* LENI (Lighting Energy Numerical Indicator) method provides an alternative way of calculating the lighting energy performance of a building.
Table 3.
Energy consumption values for losses in the heat transfer through the windows using PHPP.
| Step No. | Window height Hf [cm] | Energy Losses for Window F1[kWh/year] | Energy Losses for Window F2[kWh/year] | Annual heating energy demand [kWh/m²] | Annual heating energy demand saving [kWh/m²] | Thermal load [W/m²] |
|---|---|---|---|---|---|---|
| 1 | 230 | 710 | 526 | 138.7 | - | 54 |
| 2 | 190 | 611 | 455 | 138 | 0.70 | 53.7 |
| 3 | 150 | 512 | 383 | 137.38 | 1.32 | 53.3 |
| 4 | 110 | 412 | 311 | 136.6 | 2.10 | 53 |
| 5 | 70 | 314 | 240 | 135.9 | 2.80 | 52.7 |
| 6 | 30 | 214 | 169 | 135.2 | 3.50 | 52.3 |
Table 4.
Centralized energy consumption for an average illumination level of 500 lx.
| Step No. | Windows height Hf, [cm] | Energy Losses for Window F1 [kWh/year] | Energy Losses for Window F2[kWh/year] | Energy Losses for Windows F1+F2 [kWh/year] | Energy consumption with automated control [kWh/year] | Total Energy consumption with automated control [kWh/year] |
|---|---|---|---|---|---|---|
| 1 | 230 | 710 | 526 | 1236 | 1494 | 2730 |
| 2 | 190 | 611 | 455 | 1066 | 1508 | 2574 |
| 3 | 150 | 512 | 383 | 895 | 1552 | 2447 |
| 4 | 110 | 412 | 311 | 723 | 1676 | 2399 |
| 5 | 70 | 314 | 240 | 554 | 1949 | 2503 |
| 6 | 30 | 214 | 169 | 383 | 2403 | 2786 |
Disclaimer/Publisher’s Note: The statements, opinions and data contained in all publications are solely those of the individual author(s) and contributor(s) and not of MDPI and/or the editor(s). MDPI and/or the editor(s) disclaim responsibility for any injury to people or property resulting from any ideas, methods, instructions or products referred to in the content. |
© 2024 by the authors. Licensee MDPI, Basel, Switzerland. This article is an open access article distributed under the terms and conditions of the Creative Commons Attribution (CC BY) license (http://creativecommons.org/licenses/by/4.0/).
Copyright: This open access article is published under a Creative Commons CC BY 4.0 license, which permit the free download, distribution, and reuse, provided that the author and preprint are cited in any reuse.


