Submitted:
22 June 2024
Posted:
24 June 2024
You are already at the latest version
Abstract
In this paper, a low-grade copper oxide ore with highly alkaline was treated. The thermodynamic model of CuO-(NH4)2SO4-NH3-H2O was established in the leaching system of tenorite (CuO) under the condition of double conservation of mass and charge. The fitting function of MATLAB and the diff and solve functions were used to calculate the optimal ammonia concentration and total copper ion concentration of tenorite under different ammonium sulfate concentrations. The effects of different ammonia-ammonium salt (ammonium sulphate, ammonium carbonate, ammonium chloride) solution on copper leaching rate were investigated. Results show that under the conditions of ammonia concentration of 1.2 mol/L, ammonia-ammonium ratio of 2:1 and liquid-solid ratio of 3:1, the copper leaching rate from the ammonium sulphate and ammonium chloride solution reaches 70%, slightly higher than that of ammonium carbonate. Therefore, ammonia ammonium sulfate system is selected to leach low-grade copper oxide due to its lower corrosion to the equipment than the chlorination system.
Keywords:
Ammonia leaching
; Ammonium sulfate
; Low-grade copper oxide
; Tenorite
; Leaching thermodynamic.
1. Introduction
Copper is an important strategic metal resource. Copper is widely used in electronic and electrical, mechanical manufacturing and other fields because of its advantages in mechanical properties, conductivity and heat conduction [1,2]. For years, copper is the second type of non-ferrous metal after aluminum. Due to its huge demand and China’s severe shortage of copper resources, China needs to import a large amount of copper concentrate and refined products from abroad every year [3,4]. With the continuous consumption of high-grade copper sulfide around the world, it is imperative to utilize refractory low-grade copper oxide [5,6].
Among them, high-alkaline gangue type low-grade copper oxide deposits are typical low-grade copper oxide deposits with relatively abundant reserves, mainly distributed in Congo Gold and Zambia [7]. In China, it is mainly distributed in Xinjiang, Yunnan, Sichuan and Inner Mongolia, etc., such as Dongchuan oxidized copper deposit in Yunnan,
Leshan oxidized copper deposit in Sichuan and sandstone oxidized copper deposit in Xinjiang [8]. This kind of mineral is characterized by “three high and one low” with high alkaline gangue content, high oxidation rate, high mud content and low grade, and belongs to a typical refractory low-grade oxidized copper mine[9,10]: (1) Impurities such as calcium, magnesium and aluminum in the ore, among which the alkaline gangue formed by calcium and magnesium accounts for about 20% ~ 40% of the total minerals in the ore, which is the main reason for the high alkalinity of this kind of ore; (2) The minerals in the ore are mainly oxide, and the oxidation rate and binding rate of the ore are high; (3) The content of SiO2 in ore is high, about 20%; (4) The copper grade in the ore is low, and the Cu grade is less than 1%.
For high-alkaline gangue type low-grade copper oxide, if the most common sulfuric acid leaching process of other copper oxide ores is adopted [8], the acid consumption is large and the economic benefits are small, and a large amount of calcium sulfate generated in the leaching process is adsorbed on the ore heap and the bonding phenomenon occurs, which seriously worsens the subsequent solution penetration effect. If ammonia leaching process is used to treat such minerals, it can avoid the immersion of high alkaline substances such as calcium and magnesium into the solution, and ensure the purity of copper in cuprammonium solution [11,12]. At present, most of these minerals are immersed in ammonia [13,15], but the concentration of ammonia in these studies is high, reaching more than 2 mol/L. Due to the high concentration of ammonia in production, it is easy to volatilize and corrode equipment, and deteriorate the operating environment, so it is difficult to popularize it on a large scale in industry. Therefore, it is of great significance to study the mechanism and process of ammonia leaching for the industrial application of low-grade copper oxide with high alkaline gangue. In this paper, the refractory high alkaline gangue low-grade copper oxide is taken as the research object, aiming at the important copper bearing tenorite [CuO], the thermodynamic model of CuO-(NH4)2SO4-NH3-H2O was established in the leaching system based on both mass balance and charge balance equations, and the thermodynamic calculation is carried out. On this basis, different ammonia -ammonium leaching systems were verified by experiments.
2. Materials and Methods
2.1. Experimental Material
The ore sample was taken from a high alkaline gangue oxide copper mine in Congo Gold, and the main metallic minerals in the sample include tenorite (CuO) and malachite (Cu2(CO3)(OH)2) etc. Gangue ore mainly consists of quartz and calcite, and the X-ray fluorescence (XRF) results of the ore samples are listed in Table 1. As shown in Table 1, the grade of copper in the raw ore is low, and the gangue is mainly composed of silicon, calcium, magnesium and aluminum, which is a typical low-grade copper oxide with high alkaline gangue. By ICP quantitative analysis, the Cu content of ore samples is only 0.89%. Particle size analysis was carried out on the ore sample, and the results were shown in Figure 1.
As shown in Figure 1, the ore sample size of -7.29 μm accounts for 33.85%, of which 7.29-74.12 μm accounts for 60.52%.
2.2. Experimental Method
Because the ore sample contains a lot of calcium salt and magnesium salt, the leaching channel is blocked. If acid leaching is used, it will prolong the leaching cycle, reduce the leaching efficiency and increase the production cost. If acid leaching (dilute sulfuric acid) is used directly, micro-soluble calcium sulfate and magnesium sulfate will be produced in the leaching process to block the leaching channel. Therefore, ammonia leaching was used in the experiment. The procedure is as follows:
Weigh 20 g mineral powder into a 250 mL conical flask, add a certain concentration of ammonia-ammonium sulfate solution, and heat it in a water bath with a heat collecting magnetic stirrer. After the temperature rises to the set temperature, keep it constant, and start stirring and timing. After the reaction, the leaching solution was pumped and filtered to 50 mL. The mass concentration of copper was analyzed by copper reagent spectrophotometer and the copper leaching rate was calculated.
3. Results
3.1. Influence of Ammonia Concentration on Copper Leaching Rate
Reaction conditions: ammonia concentration 1.2 mol/L, stirring intensity 250 r/min, liquid-solid mass ratio 2:1, temperature 25℃, leaching time 4h, copper leaching rate with different ammonium salt concentration of the relationship is shown in Figure 2.
As shown in Figure 2, the copper leaching rate increases rapidly with the concentration of ammonium carbonate and ammonium chloride and then gradually becomes stable. When the concentration of ammonium carbonate is 0.8 mol/L, the copper leaching rate can reach 63.5%. When the concentration of ammonium chloride is 0.8 mol/L, the copper leaching rate can reach 70.0%. Under other conditions, when the concentration of ammonium sulfate is 0.8 mol/L, the copper leaching rate can reach 68.9%. The effect of ammonium chloride and ammonium sulfate on the leaching process is close to that of ammonium carbonate, and both are better than that of ammonium carbonate. Therefore, ammonium chloride is highly corrosive to the equipment, so the ammonia-ammonium sulfate system is chosen.
3.2. Structure Characterization of Leaching Residue
The raw copper oxide ore was leach for 4 h under the conditions of ammonia concentration of 1.2 mol/L, ammonium sulfate concentration of 0.6 mol/L, liquid-solid mass ratio of 2:1, stirring intensity of 250 r/min, and temperature of 25℃. SEM-EDS analysis was conducted on the leaching residue after the end of leaching, and the surface morphology of raw ore before leaching was compared. The result is shown in Figure 3.
As shown in the surface topography of the ore sample in Figure 3, the ore sample was eroded by leaching agents and its surface was rough and uneven, but the size and shape of the ore sample particles basically did not change. In Figure 6(d), the content of Si, O, Ca and Al elements is high, and according to ICP quantitative analysis, the mass fraction of Cu in the leaching slag measured is only 0.27%, indicating that most of the Cu element is leached in the ammonia-ammonium sulfate system, and a small amount of Cu element remains in the leaching slag.
4. Discussion
4.1. Leaching Principle
Ammonia leaching method is the most effective leaching method for high alkaline gangue and low-grade copper oxide. The copper in the ore is immersed in the solution by forming stable complex ions with ammonia, while impurities such as calcium and magnesium do not participate in the reaction, so that the target metal and impurities such as calcium and magnesium metal are separated. The advantages of ammonia leaching method are that the amount of leaching agent is small, the selectivity is high, and the solution purity is high.
The main copper oxide ores are malachite and black copper, and the ammonia leaching equations are shown as follows.
4.2. Thermodynamic Analysis
In the low-grade copper oxide ore with highly alkaline gangue, the main copper phase is black copper. The thermodynamic model of CuO-(NH4)2SO4-NH3-H2O was established in the leaching system of [(NH4)2SO4]-NH3-H2O based on both mass balance and charge balance equations [16,17]. Since it is difficult to obtain the activity coefficient of each ion in the solution, molar concentration is used to replace the activity in the calculation in this paper. The stability constants of related complex ions in the system are shown in Table 2[18].
4.1.1. Establishment of Thermodynamic Model
The equilibrium between copper-containing species and simple ions in the solution can be expressed by Eq. (4).
In the formula, i, j, k and p are respectively the number of Cu2+, NH3, OH- and SO42- in the coordinated ions, and their values are: i=1,2; j=0,1,2,3,4,5; k=0,1,2,3,4; p=0,1.
The stability constant expression of the complex is shown in Eq. (5) [19].
The relationship between the available coordinated ions and their constituent simple ions is shown in Eq. (6).
Three solid phases (CuO, Cu(OH)2 and Cu(OH)1.5(SO4)0.25 )may exist in the CuO-NH3-(NH4)2SO4 system, because CuO and Cu(OH)2 have the same solubility product form. The existence of two stable solid phases can be determined by comparing the solubility product (Ksp) of CuO and Cu(OH)2. When CuO is assumed as the stable solid phase, the dissolution reaction is shown in Eq. (7). When Cu(OH)2 is assumed as the stable solid phase, the solution equation is shown in Eq. (8).
By comparing equations (7) and (8), it can be seen that the Ksp of CuO is smaller than that of Cu(OH)2, indicating that CuO is more stable than Cu(OH)2. Even if solid Cu(OH)2 is formed during the dissolution process, it will be converted to CuO until the Cu(OH)2 disappears. This shows that there is no Cu(OH)2 solid phase in CuO-NH3-(NH4)2SO4 system with CuO.
According to Eq. (7), Eq. (9) is obtained.
By substituting Eq. (9) into Eq. (6), Eq. (10) can be obtained.
where A=ln(βi,j,k,p10-19.51i)-(k-2i)ln10pKw; B=j; C=(k-2i)ln10; D=p.
When the stable solid is Cu(OH)1.5(SO4)0.25, the dissolution reaction is shown in Eq. (11).
According to Eq. (11), Eq. (12) is obtained.
Substitute Eq. (12) into Eq. (6) to obtain Eq. (13).
where A=ln(βi,j,k,p10-16.86i)-(k-1.5i)ln10pKw; B=j; C=(k-1.5i)ln10; D=p-0.25i.
The equilibrium equations of total copper, total ammonia and charge in solution can be expressed as equations (14), (15) and (16) respectively.
where c(Cu2+)T and c(NH3)T respectively represent the total concentration of copper and ammonia in the solution. The total concentration of ammonia in the solution is the sum of the concentration of ammonia added to the solution c(NH3) and twice the concentration of ammonium sulfate c[(NH4)2SO4]. ‘m’ and ‘[X]’ respectively represent the charge number and concentration of each ion in the solution.
When the stable solid phase is CuO, the mass balance equation of total sulfate root can be expressed as Eq. (17) respectively.
where c(SO42-)T equal to the concentration of total ammonium sulfate added to the solution.
When the stable solid phase is Cu(OH)1.5(SO4)0.25, the total sulfuric acid concentration in the solution comes from two parts: Per mole of ammonium sulfate added to the solution and per mole of Cu(OH)1.5(SO4)0.25 dissolved in the solution contribute 1 mol and 0.25 mol of sulfate ions respectively, so the mass balance equation of total sulfuric acid concentration can be expressed as Eq. (18).
The expression [X]=exp(A+Bln[NH3]+CpH+Dln[SO42-]) respectively into equations (14), (15), (16) and (17) or (14), (15), (16), (18). It can be seen that there are six unknowns in the system of equations: c(Cu2+)T, c(NH3), c[(NH4)2SO4)], [NH3], pH and [SO42-]. During the experiment, the concentration of ammonia and ammonium sulfate is taken as the control condition to change between 0 mol/L and 5 mol/L. Only four variables [NH3], pH, [SO42-] and c(Cu2+) remain in the system of unknowns. It can be solved by calling the function “fsolve” in the Matlab software to obtain the stereogram of the changes of [NH3], pH, [SO42-] and c(Cu2+) with c(NH3) and c[(NH4)2SO4)].
Surface diagram of relation between variables c(NH3) and c[(NH4)2SO4]
The solution results of the thermodynamic model of CuO-NH3-(NH4)2SO4-H2O system regarding [NH3], pH, [SO42-] and [c(Cu2+)] are shown in Figure 4.
As shown in (a), (b) and (c) in Figure 4, [NH3] is jointly controlled by c(NH3) and c[(NH4)2SO4], but it is mainly provided by c(NH3), and c[(NH4)2SO4] plays a very small role. c(NH3) can promote the increase of pH, and c[(NH4)2SO4] can inhibit the increase of pH. When c(NH3) is between 0 and 1 mol/L, pH and c(NH3) have a linear relationship. Free sulfate ions are provided by c[(NH4)2SO4] and increase with the increase of c[(NH4)2SO4]. The surface relation between c(Cu2+)T, c[NH3] and c[(NH4)2SO42-] is shown by in Figure 4(d). The variation relation between c(Cu2+)T and c[NH3] and c[(NH4)2SO42-] can be obtained, but it cannot accurately reflect the magnitude of the numerical variation.
(1)Effects of c(NH3) and c[(NH4)2SO4] on the concentration of Cu2+
The surface relation between c(Cu2+)T and c[NH3] and between c(Cu2+)T and c[(NH4)2SO42-] are projected onto the c(NH3)–c(Cu2+)T plane and c[(NH4)2SO4]–c(Cu2+)T plane, respectively, as shown in Figure 5.
As shown in Figure 5(a), the concentration of ammonium sulfate has a great influence on c(Cu2+)T. Increasing the concentration of ammonium sulfate is conducive to the improvement of c(Cu2+)T. When c[(NH4)2SO4] ≥ 3 mol/L, c(Cu2+)T increases linearly with the increase of c(NH3). According to Figure 5(b), when the solution is pure ammonium sulfate solution, the solubility of copper oxide (CuO) is very small, that is, pure ammonium sulfate can hardly leach copper oxide (CuO), and c[(NH4)2SO4] only has a great influence on c(Cu2+)T when it changes between 0 and 3 mol/L. After 3 mol/L, the further increase of c[(NH4)2SO4] decreases the increase of c(Cu2+)T gradually.
(2) Stable region map
In this system, there may be a case where the equilibrium solid phase is Cu(OH)1.5(SO4)0.25. As shown in Figure 6, it is easy to compare the size of Jsp and Ksp for Cu(OH)1.5(SO4)0.25.
As shown in Figure 6, when ammonium sulfate concentration is large and ammonia concentration is small, the Jsp of Cu(OH)1.5(SO4)0.25 is larger than that of Ksp, that is to say, CuO is transformed into Cu(OH)1.5(SO4)0.25, and this region is the stable region of Cu(OH)1.5(SO4)0.25. Other regions are stable regions of CuO.
5. Conclusions
Thermodynamic calculation results of copper oxide in ammonium-ammonium sulfate system show that [NH3] is jointly controlled by c(NH3) and c[(NH4)2SO4] in the ammonia leaching process of black copper mine, but it is mainly provided by c(NH3). c(NH3) can promote the increase of pH, and c[(NH4)2SO4] can inhibit the increase of pH. When c(NH3) is between 0 and 1 mol/L, pH is linear with c(NH3). Free sulfate ions are provided by c[(NH4)2SO4] and increase with the increase of c[(NH4)2SO4]. Ammonium sulfate plays a role in regulating the ammonia concentration and pH in the solution in this system. By comparing the solubility product Ksp of CuO and Cu(OH)2, it is concluded that the stable solid phase is CuO. When the concentration of ammonium sulfate is large and the concentration of ammonia is small, there may be stable solid phase Cu(OH)1.5(SO4)0.25.
The leaching experiments of different ammoniac-ammoniacal salts (ammonium sulfate, ammonium carbonate and ammonium chloride) showed that the copper leaching rate increased rapidly with the concentration of ammonium carbonate and ammonium chloride and then gradually stabilized. When the concentration of ammonium carbonate was 0.8 mol/L, the copper leaching rate could reach 63.5%. When the concentration of ammonium chloride is 0.8 mol/L, the copper leaching rate can reach 70.0%. Under other conditions, when the concentration of ammonium sulfate is 0.8 mol/L, the copper leaching rate can reach 68.9%. The effect of ammonium chloride and ammonium sulfate on the leaching process is similar, both are better than ammonium carbonate, but ammonium chloride is strong corrosive to the equipment, so the ammonia-ammonium sulfate system is chosen.
Author Contributions
Conceptualization, Faxin. Xiao; methodology, Xinyu. Cao; formal analysis, Xuwei.Luo; investigation, Cuixia.Yang; data curation, Yu.Peng; writing—Faxin. Xiao, visualization, Shuchen.Sun; supervision, Ganfeng. Tu; project administration, Faxin.Xiao; funding acquisition, Faxin.Xiao. All authors have read and agreed to the published version of the manuscript.
Funding
This work was supported by Basic Research Foundation of Northeastern University(N2125033) and the National Key R&D Program of China (Grant Number 2020YFC1909003).
Data Availability Statement
The original contributions presented in the study are included in the article/supplementary material, further inquiries can be directed to the corresponding author/s.
Conflicts of Interest
The authors declare that they have no known competing financial interests or personal relationships that could have appeared to influence the work reported in this paper.
References
- Xie, T.; Xu, J.Y. Review of development status of copper-cobalt mining in Congo. Chinese Journal of Nonferrous Metals 2021, 31, 3422. [Google Scholar]
- Pan, C.C.; Gaur, A.P.S. Enhanced electrical conductivity in graphene-copper multilayer composite. Aip Adv 2022, 12, 6. [Google Scholar] [CrossRef]
- Liu, C.H.; Fan, F.Y. Copper resources supply and consumption patterns and trend in the Belt and Road Region. Conservation and Utilization of Mineral Resources 2018, 2, 44. [Google Scholar]
- Han, J.; Xia, P. An analysis of China’s copper resources supply situation in the Post-COVID-19Era. Acta Geoscientica Sinica 2021, 42, 223. [Google Scholar]
- Pietrzyk, S.; Tora, B. Trends in global copper mining – a review. IOP Conference Series: Materials Science and Engineering, Zawiercie, Poland, September 2018. [CrossRef]
- Chen, L.; He, H.P. Experimental study on benefication of one low-grade copper oxide in Xinjiang. Yunnan Metallurgy 2021, 50, 18. [Google Scholar]
- Jiang, S.Q. Distribution of copper resources in the word. World Nonferrous Metals 2018, 2, 1. [Google Scholar]
- Wang, C.Y. Situation and developing trend of copper hydrometallurgy in China. Xinjiang Geology 2001, 19, 281. [Google Scholar]
- Hao, M.; Wang, P. Spatial distribution of copper in-use stocks and flows in China: 1978–2016. J. Clean Prod. 2020, 261, 8. [Google Scholar] [CrossRef]
- Han, J.W.; Liu, W. Influence of NH4HF2 activation on leaching of low-grade complex copper ore in NH3-NH4Cl solution. Sep. Purif. Technol. 2017, 181, 29. [Google Scholar] [CrossRef]
- Li, Q.; Gao, W. Direct reduction leaching of a low-grade copper-cobalt oxide ore. Mining and Metallurgy 2019, 28, 60. [Google Scholar]
- Deng, J.S.; Wen, S.M. Extracting copper from copper oxide ore by a zwitterionic reagent and dissolution kinetics. INT J MIN MET MATER 2015, 22, 241. [Google Scholar] [CrossRef]
- Bingöl, D.; Canbazogˇlu, M. Dissolution kinetics of malachite in ammonia/ammonium carbonate leaching. HYDROMETALLURGY 2005, 76, 55. [Google Scholar] [CrossRef]
- Gargul, K. Ammonia leaching of slag from direct-to-blister copper smelting technology. AIMS Materials Science 2020, 7, 565. [Google Scholar] [CrossRef]
- Çalban, T.; Çolak, S. Optimization of leaching of copper from oxidized copper ore in NH3-(NH4)2SO4 medium. CHEM ENG COMMUN 2005, 192, 1515. [Google Scholar] [CrossRef]
- Cao, C.F.; Wang, X. Thermodynamic analysis of leaching malachite in CuO-CO2-NH3-H2O system. Nonferr.Met.Sci.Eng. 2014, 5, 82. [Google Scholar]
- Liu, W.; Tang, M.T.; Tang, C.B.; He, J.; Yang, S.H.; Yang, J.G. Thermodynamics of solubility of Cu2(OH)2CO3 in ammonia-ammonium chloride-ethylenediamine(En)-water system. T NONFERR METAL SOC. 2010, 20, 336. [Google Scholar] [CrossRef]
- Robert, M.S.; Arthur, E.M. Critical Stability Constants, 1th ed.; Plenum Press: New York and London, 1976; p. 31. [Google Scholar]
- Li, Y.; Kawashima, N. A review of the structure, and fundamental mechanisms and kinetics of the leaching of chalcopyrite. ADV COLLOID INTERFAC 2013, 197, 1. [Google Scholar] [CrossRef]
Figure 1.
Grain size analysis results of ore samples.
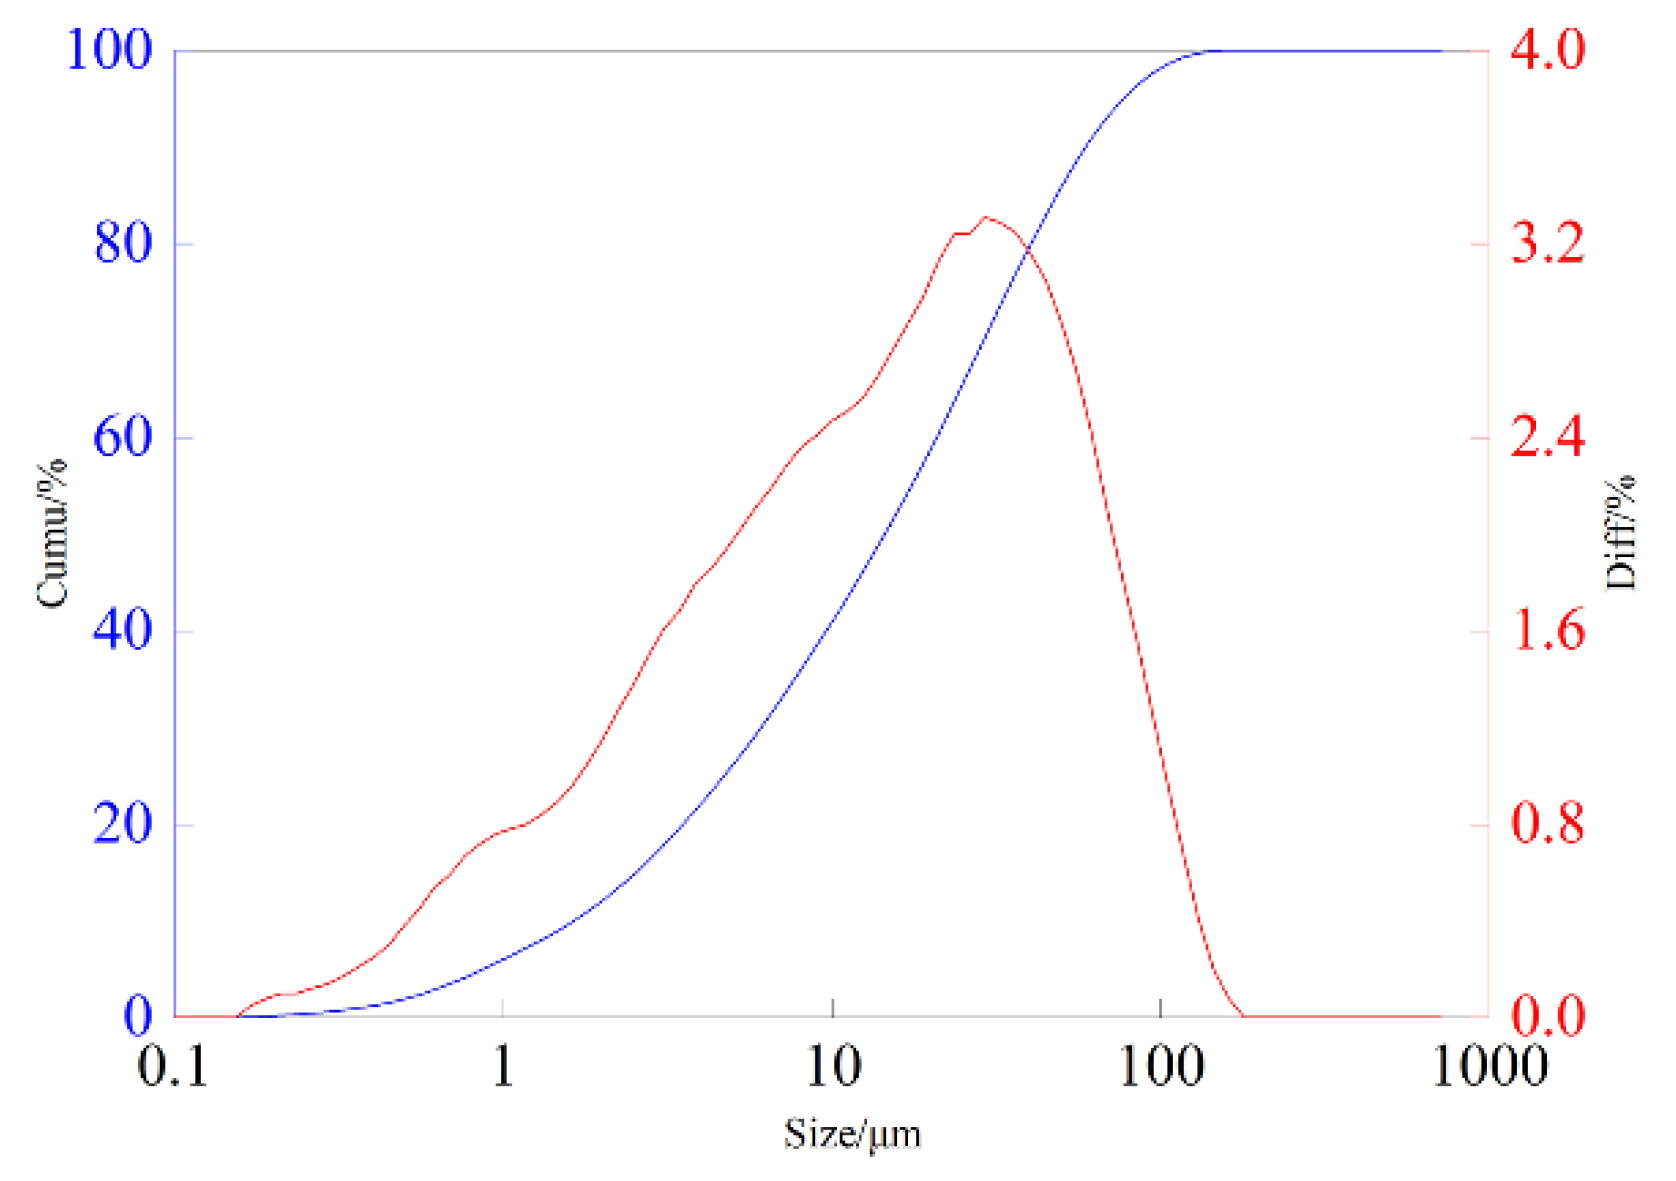
Figure 2.
Comparison of influence of different systems on copper leaching rate.
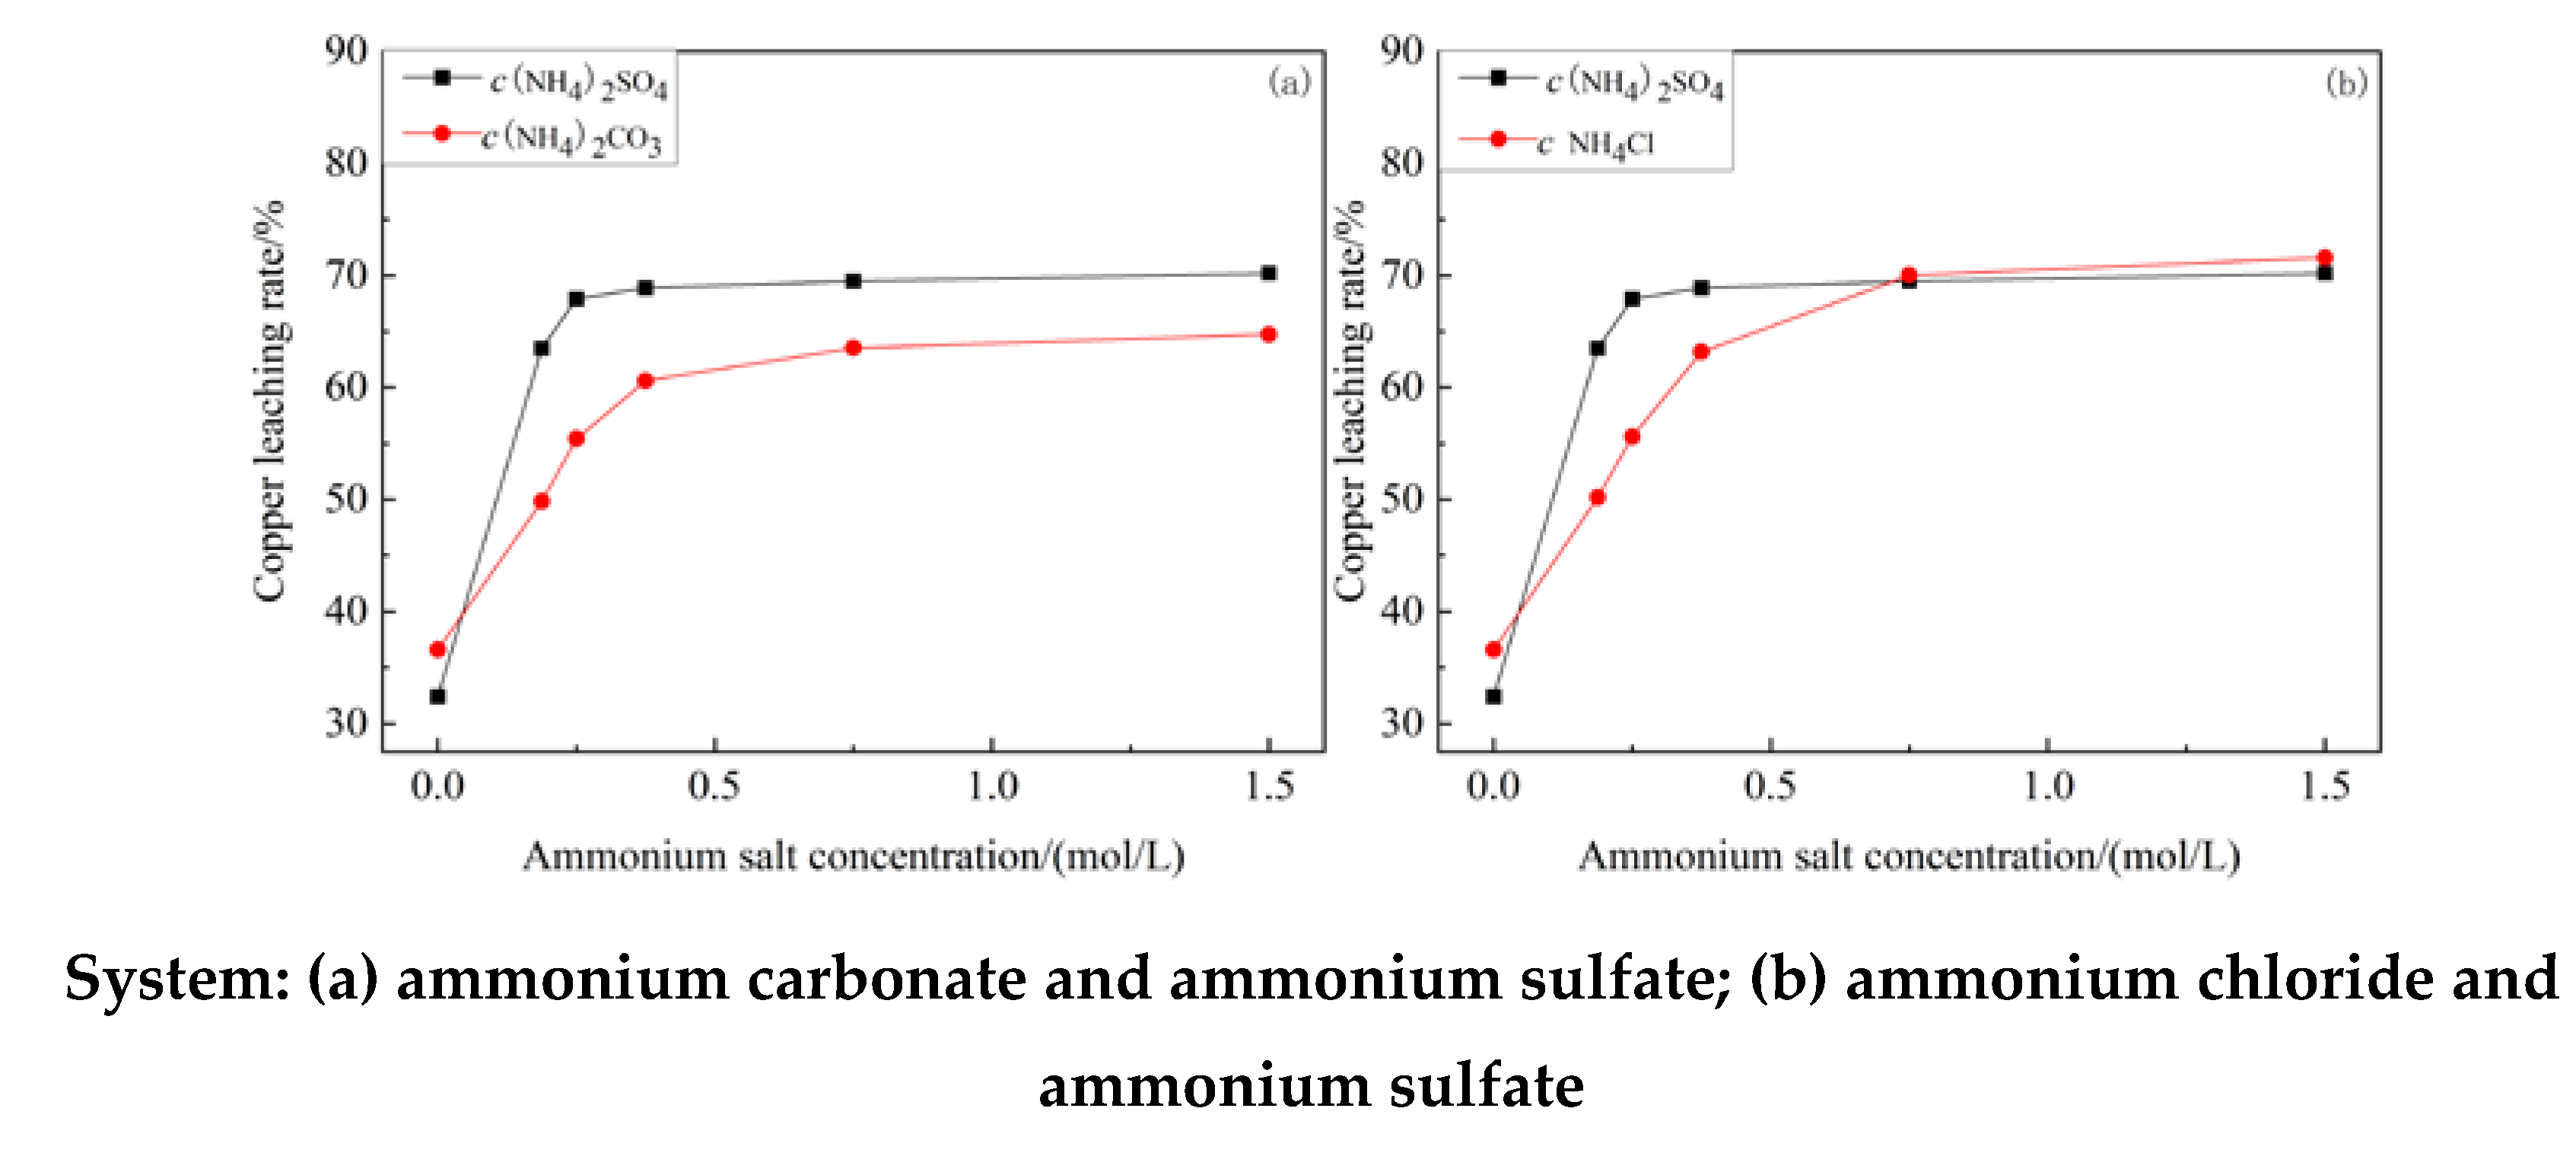
Figure 3.
Surface morphology (a) (b) (c) and energy spectrum (d) of the ore samples after leaching at different proportions.
Figure 3.
Surface morphology (a) (b) (c) and energy spectrum (d) of the ore samples after leaching at different proportions.
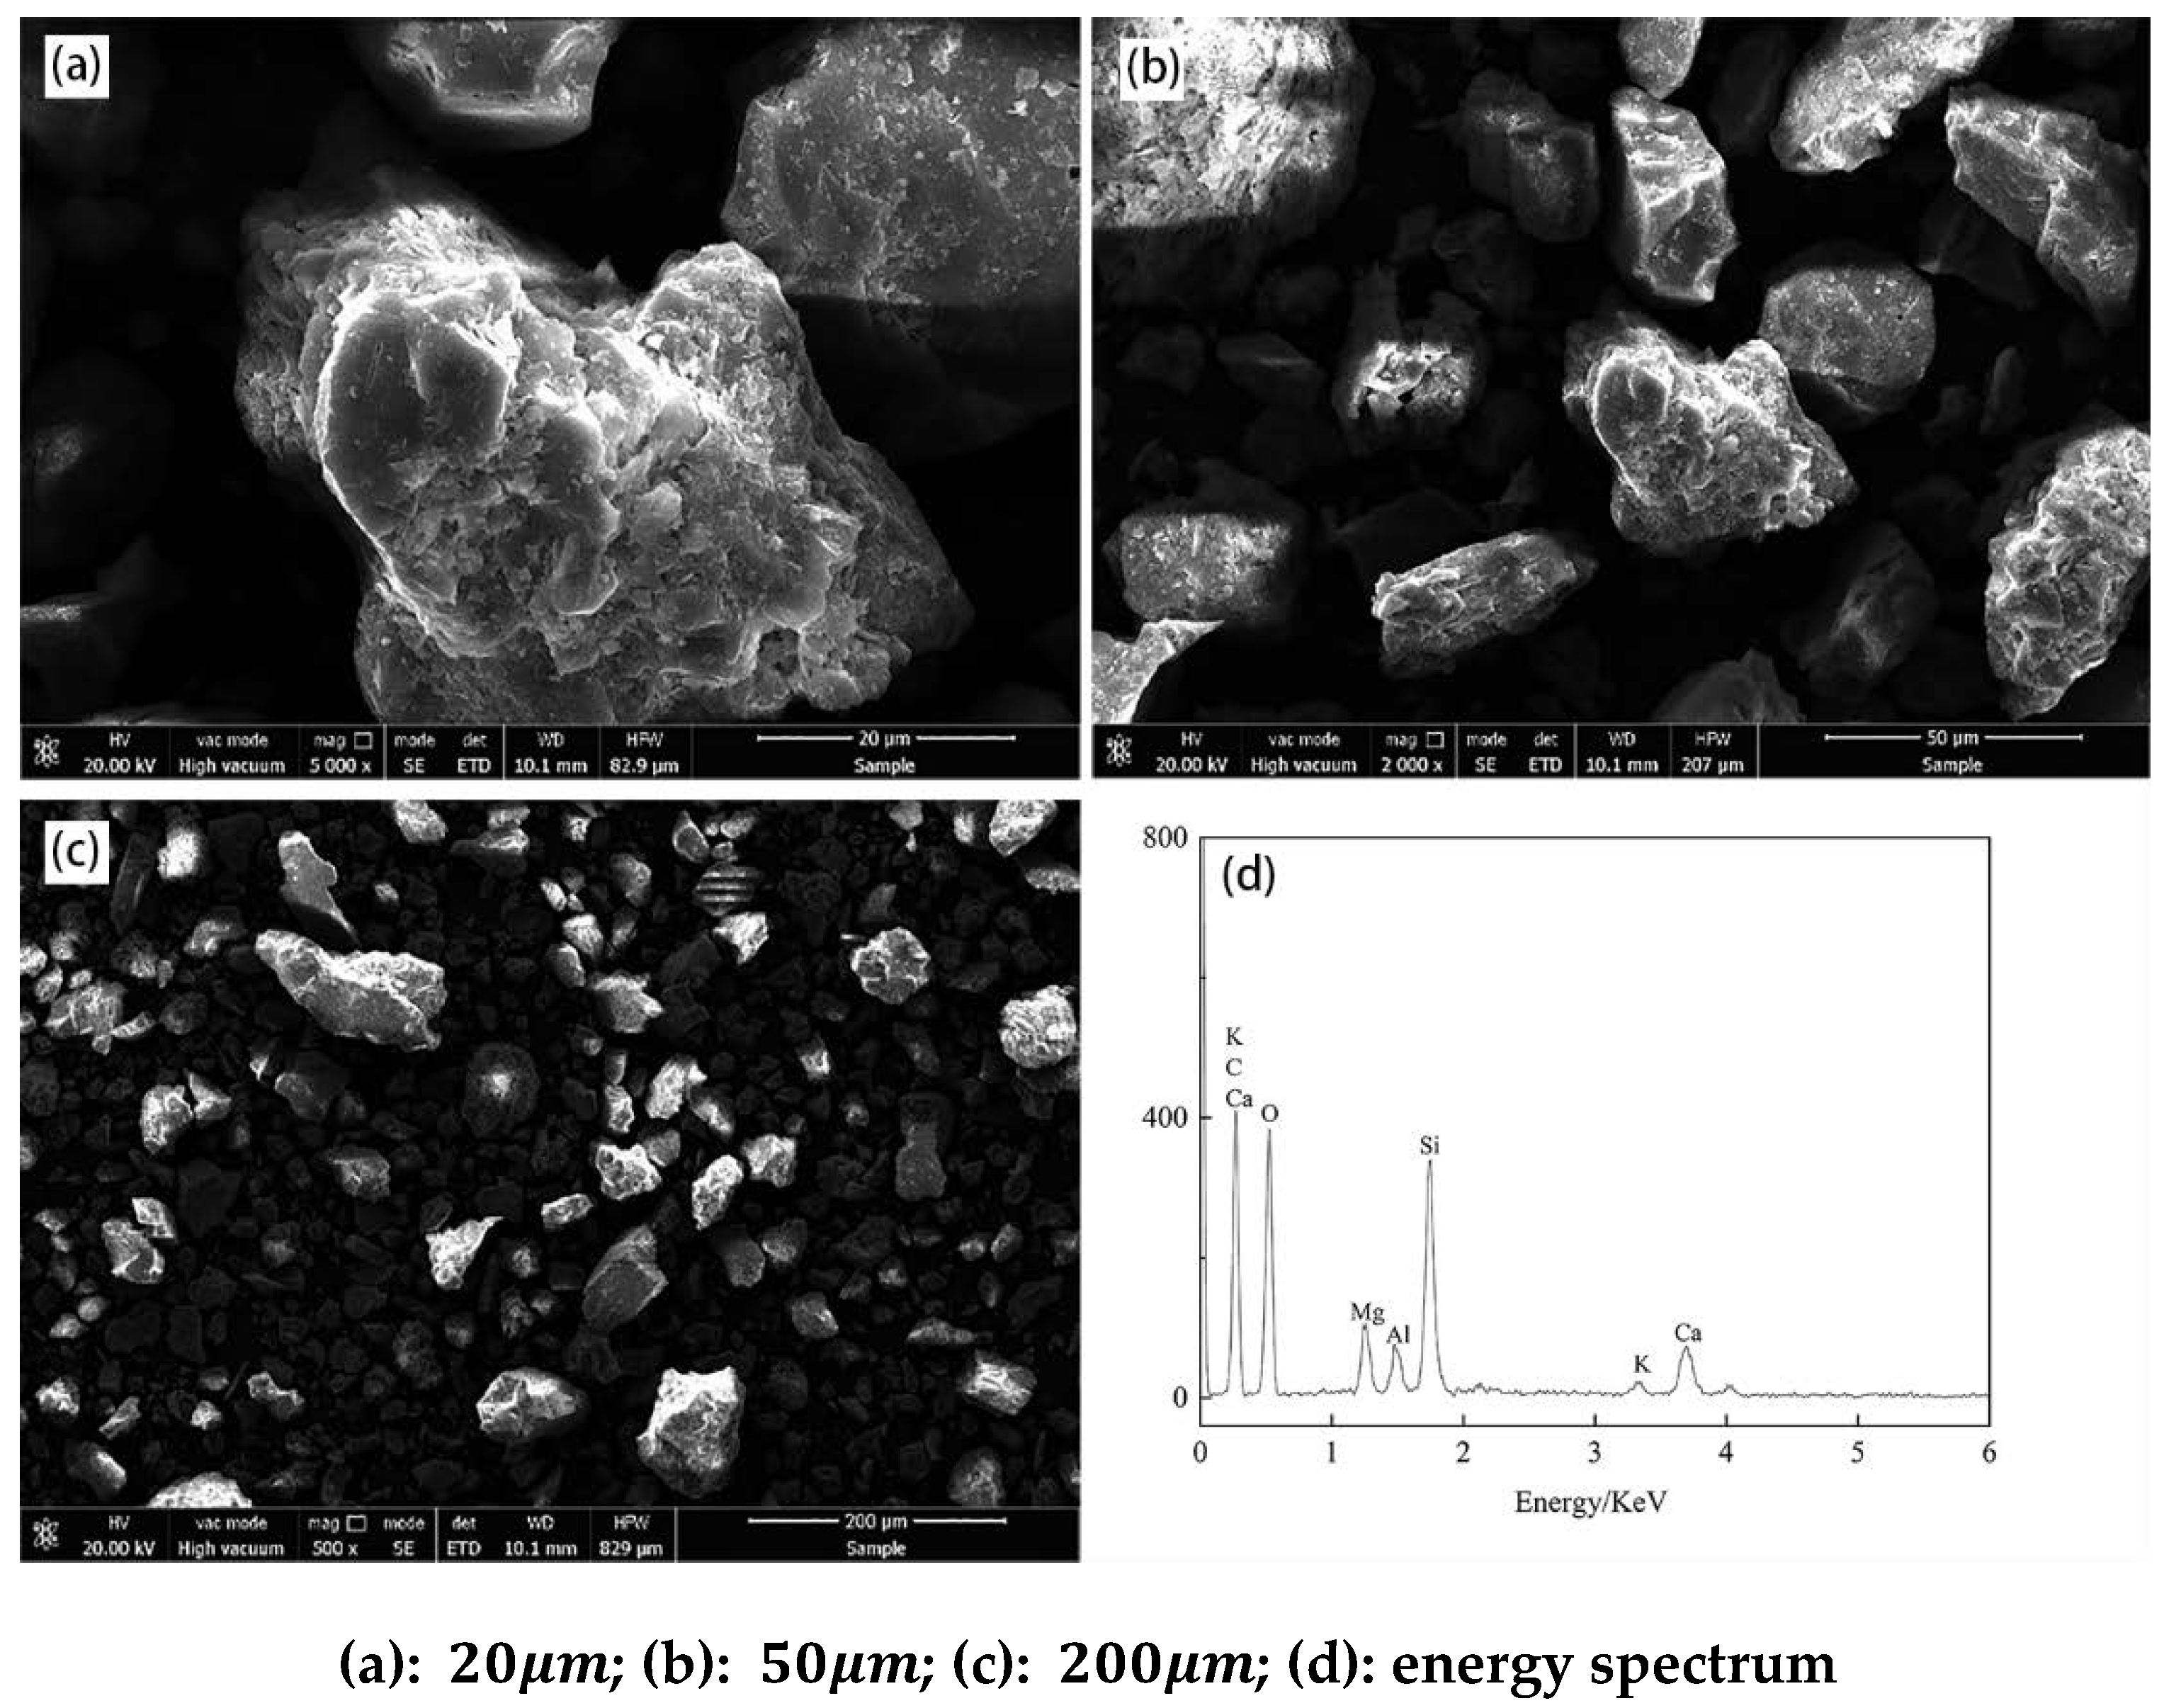
Figure 4.
Equilibrium surface of different variables.
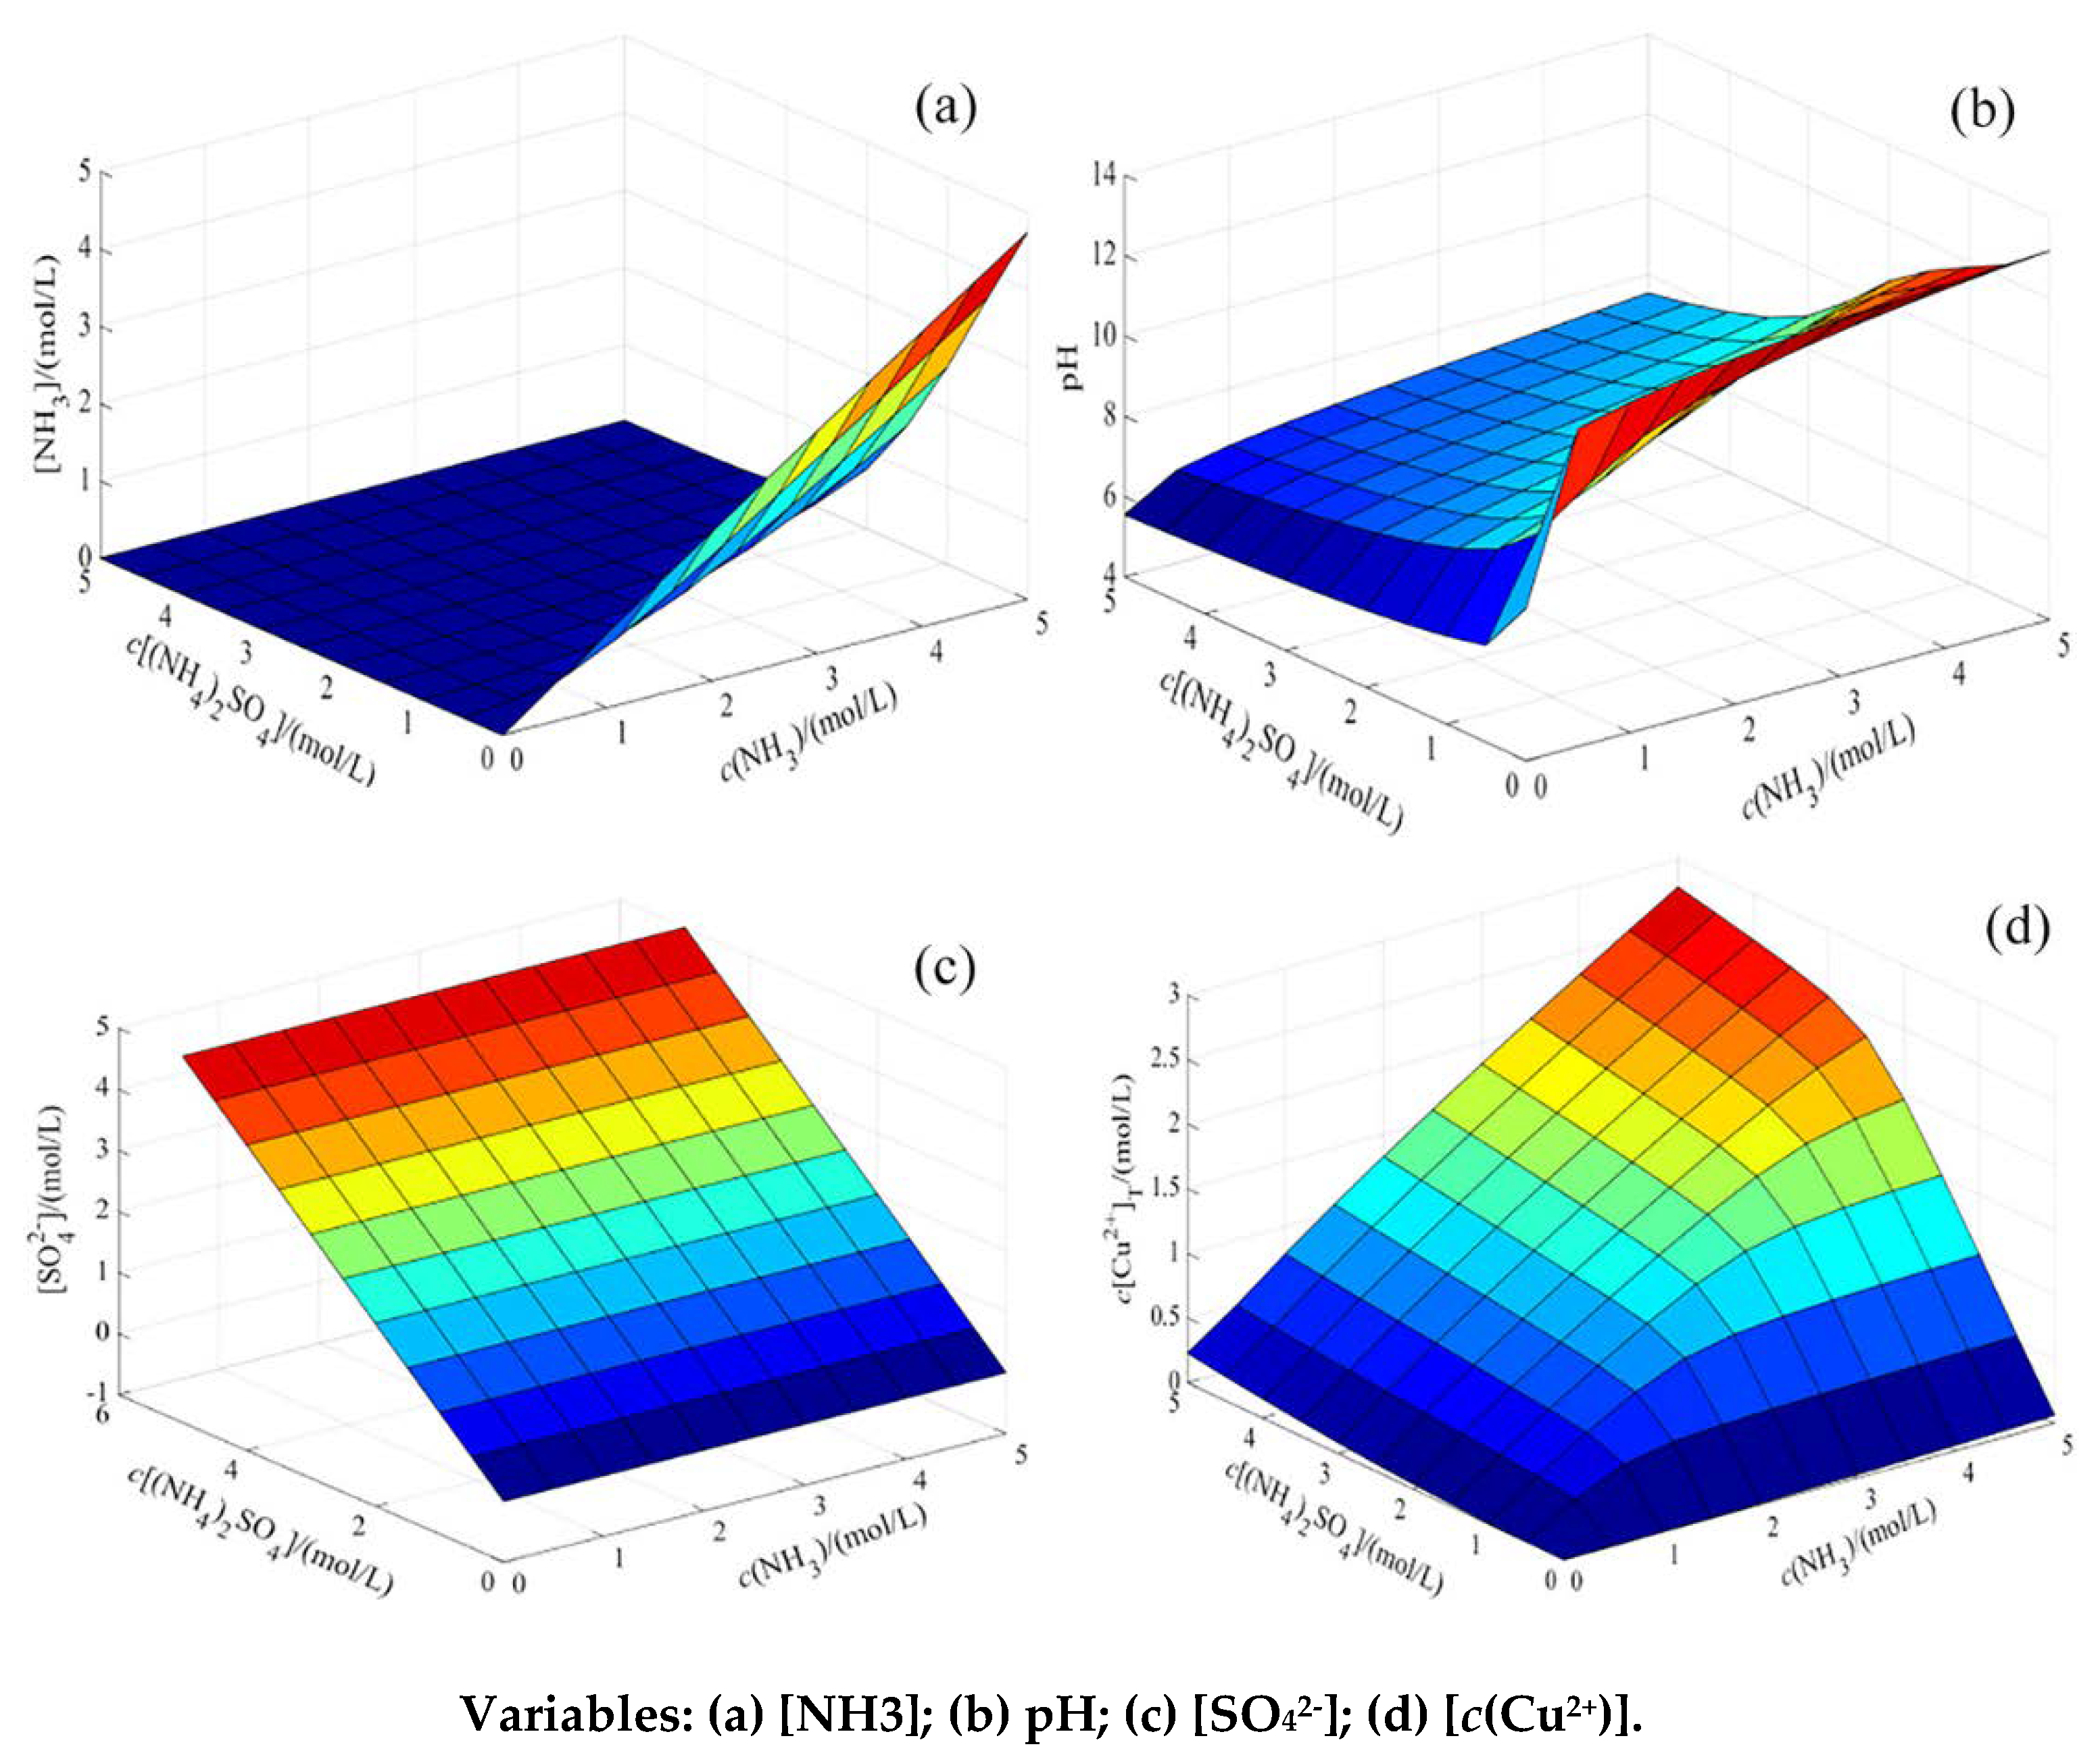
Figure 5.
Change curve of total copper concentration under different variables.
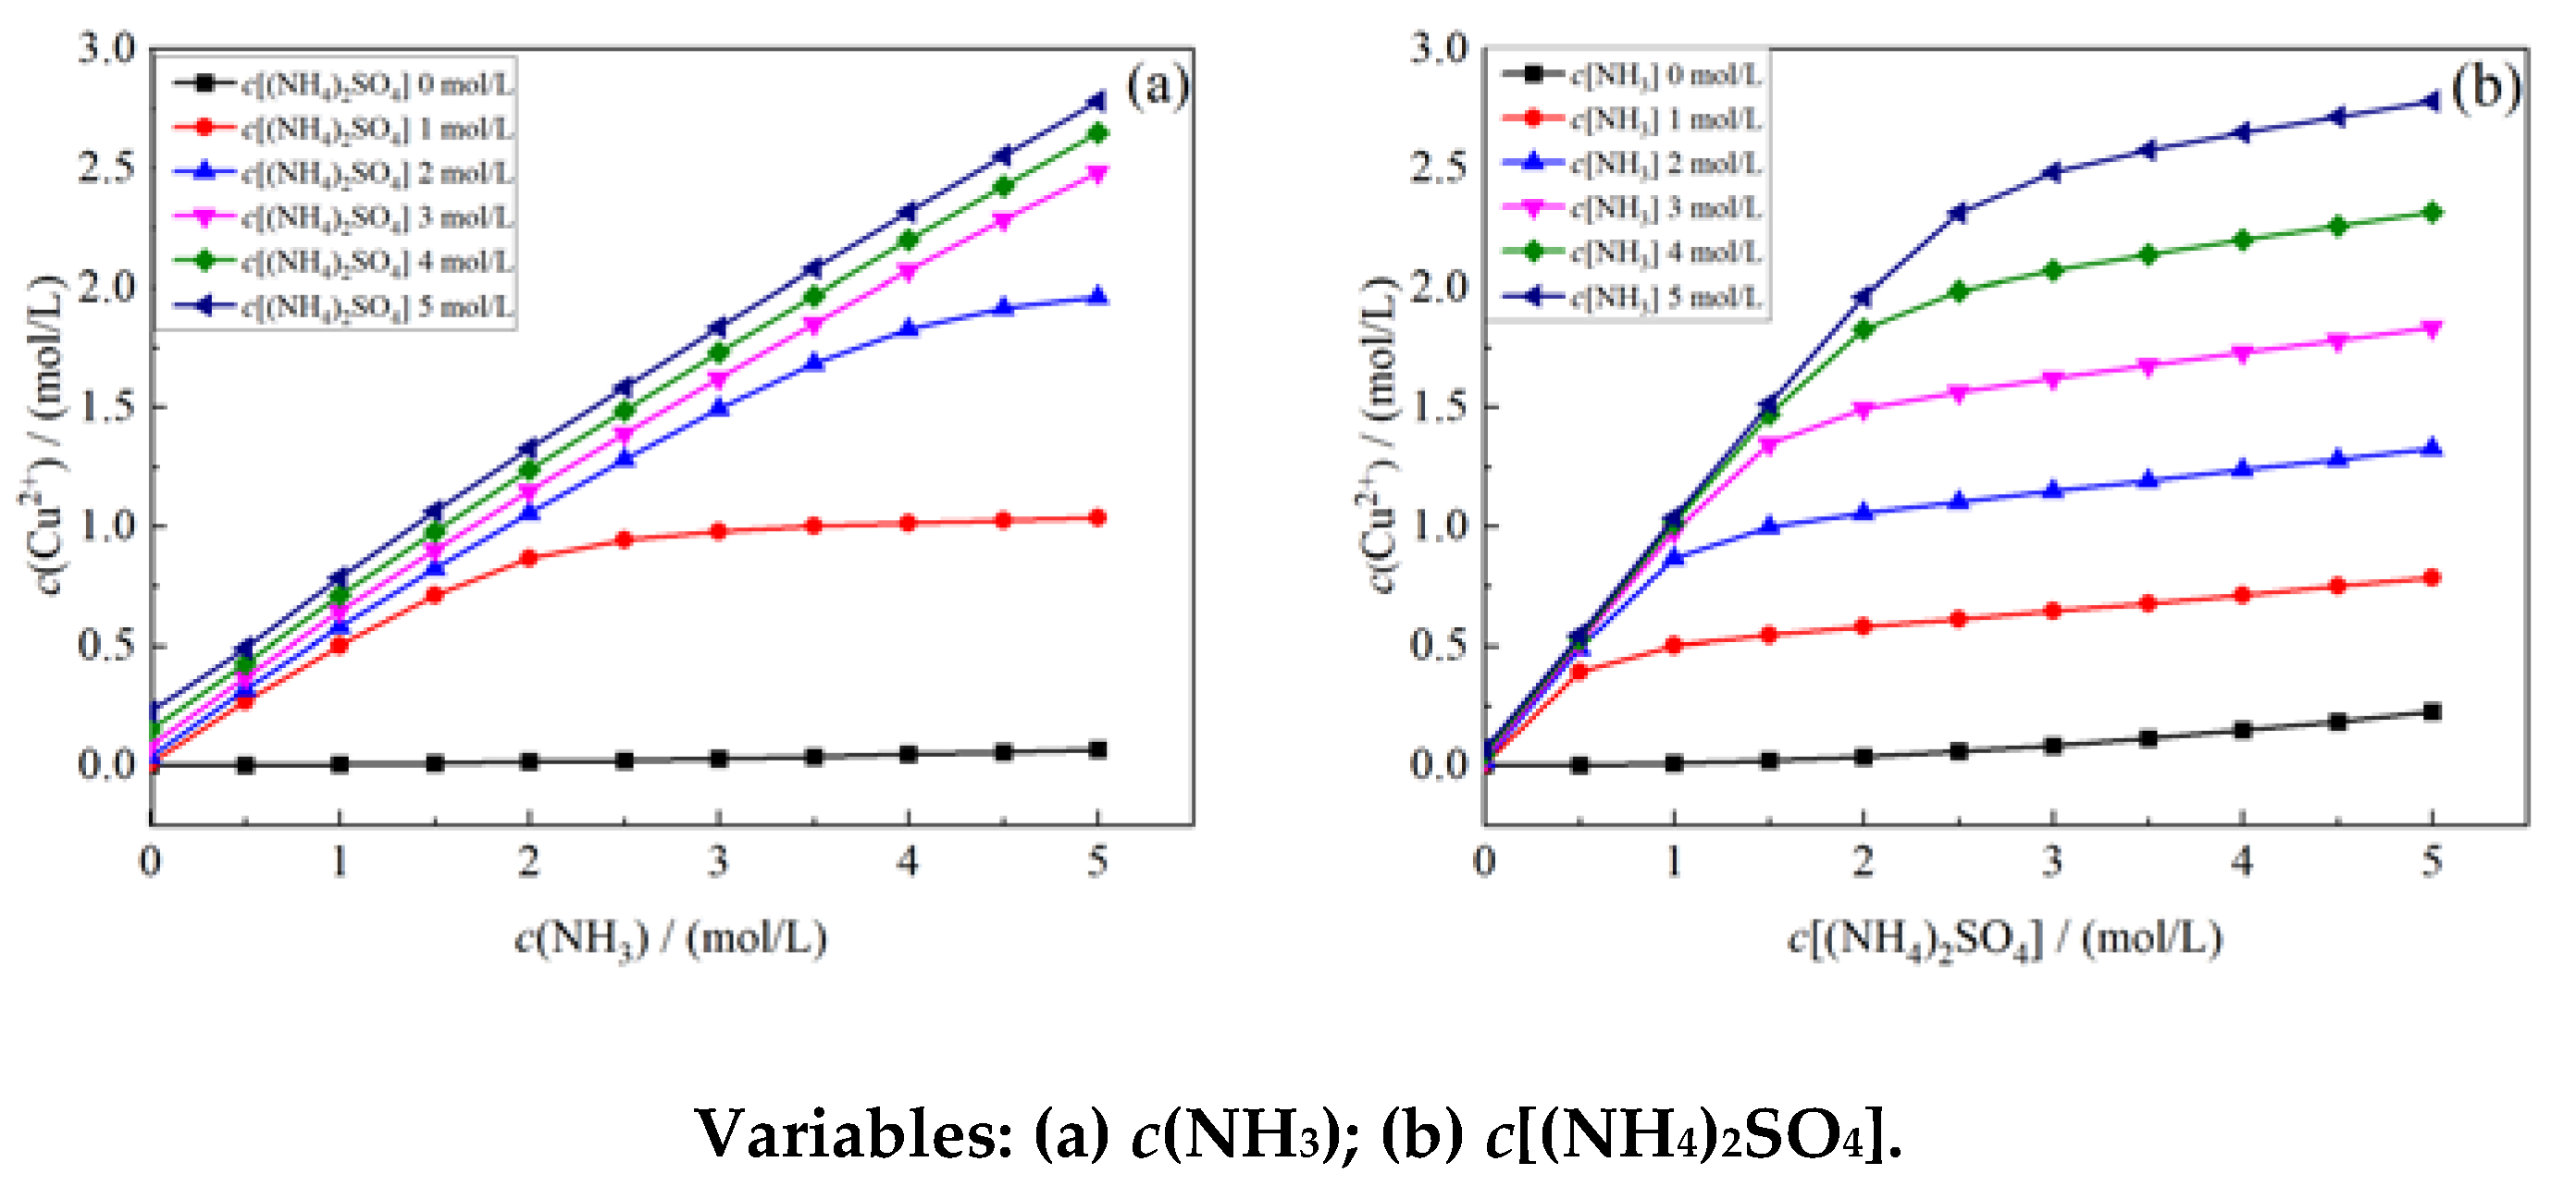
Figure 6.
Comparison of Jsp and KspofCu(OH)1.5(SO4)0.25.
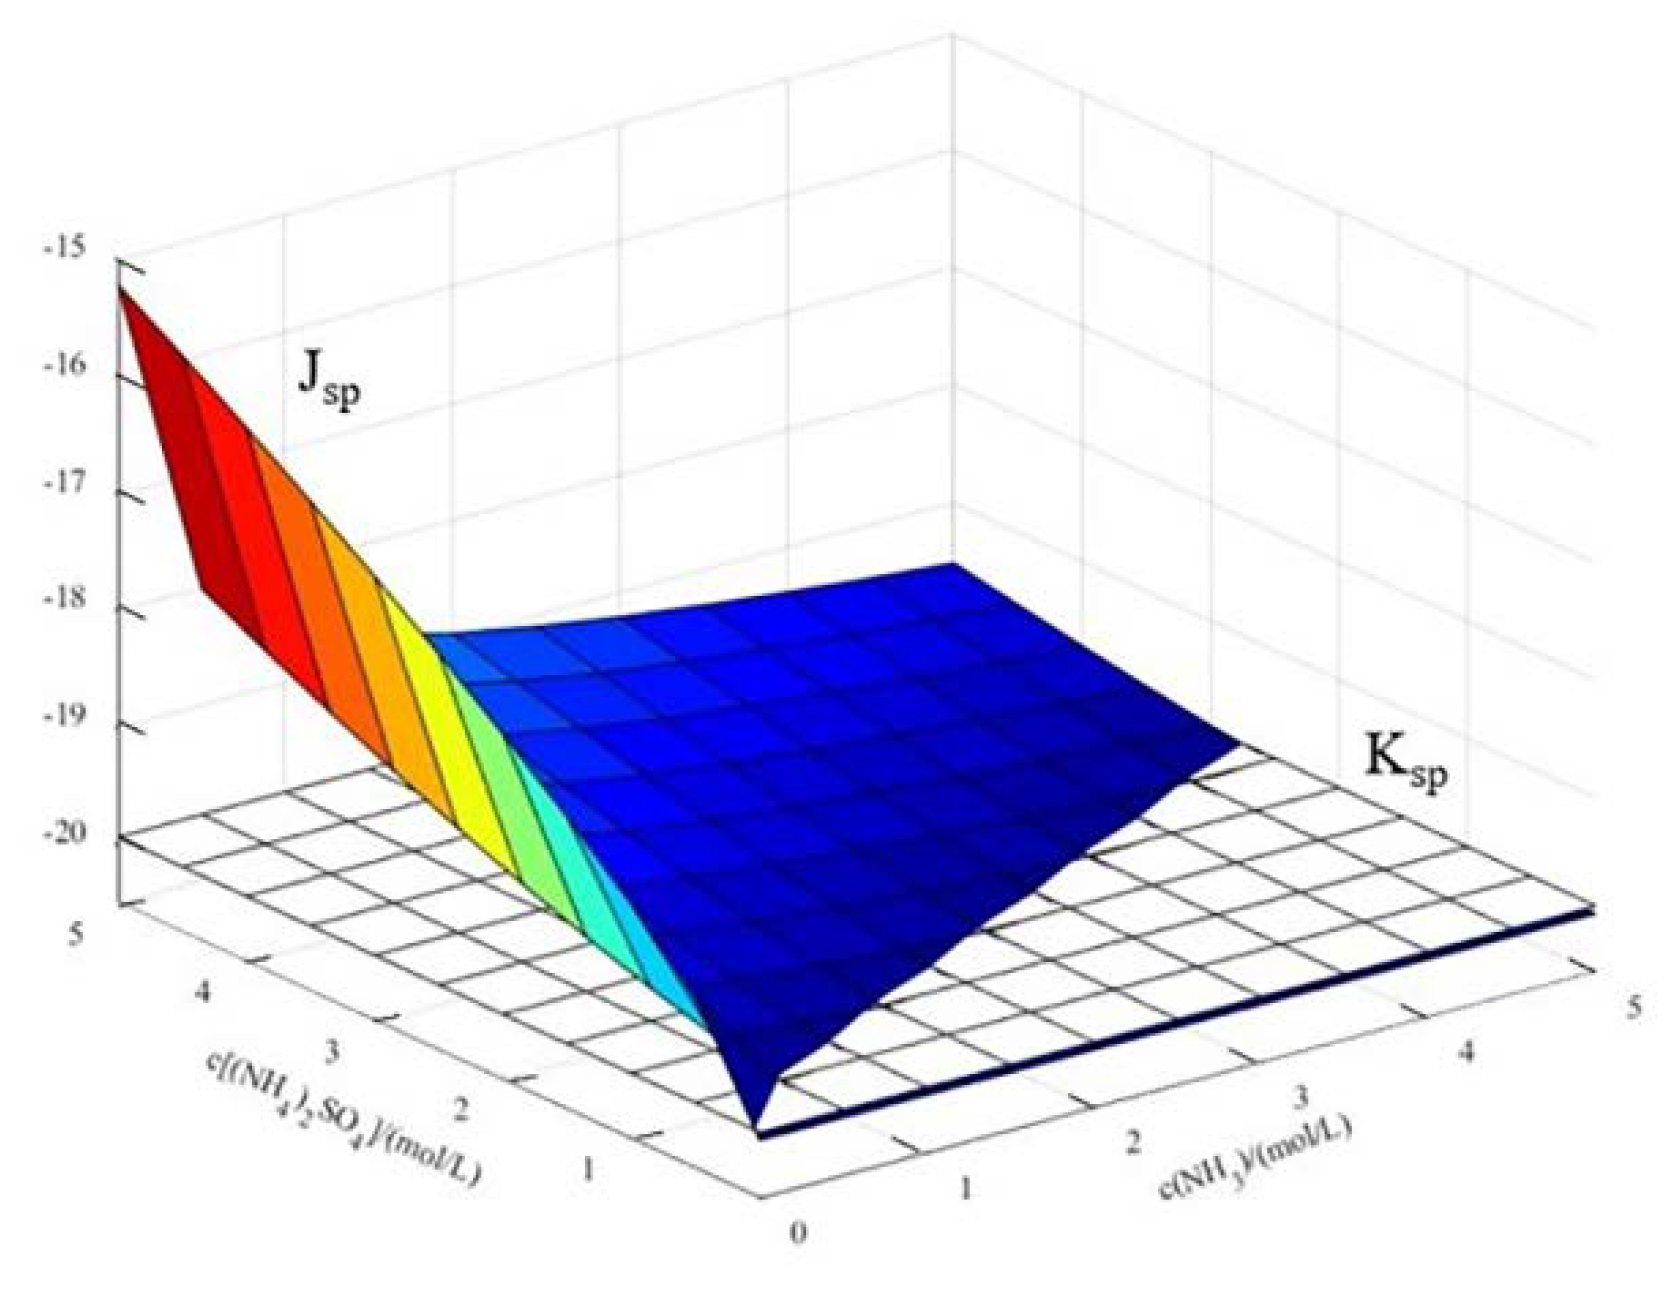

Table 1.
XRF Chemical compositions analysis of copper oxide ore (wt%).
| SiO2 | CaO | MgO | Al2O3 | K2O | Fe2O3 | CuO |
| 56.1202 | 18.3875 | 11.6775 | 8.5244 | 1.6679 | 1.3900 | 1.2818 |
| TiO2 | P2O5 | Co2O3 | MnO | SO3 | ZrO2 | Na2O |
| 0.5054 | 0.1725 | 0.1199 | 0.1054 | 0.0308 | 0.0141 | 0.0023 |
Table 2.
Stability constants of related complex ions (25℃).
| Type | Stability constant lgβ |
| Cu(NH3)2+ | 4.24 |
| Cu(NH3)22+ | 7.83 |
| Cu(NH3)32+ | 10.80 |
| Cu(NH3)42+ | 13.00 |
| Cu(NH3)52+ | 12.43 |
| Cu(OH)+ | 6.30 |
| Cu(OH)2(aq) | 12.80 |
| Cu(OH)3- | 14.50 |
| Cu(OH)42- | 15.60 |
| Cu2(OH)22+ | 17.28 |
| Cu(NH3)3(OH)+ | 14.90 |
| Cu(NH3)2(OH)2(aq) | 15.70 |
| Cu(NH3)(OH)3- | 16.30 |
| HCO3- | 9.56 |
| H2CO3 | 15.98 |
| NH4+ | 9.80 |
Disclaimer/Publisher’s Note: The statements, opinions and data contained in all publications are solely those of the individual author(s) and contributor(s) and not of MDPI and/or the editor(s). MDPI and/or the editor(s) disclaim responsibility for any injury to people or property resulting from any ideas, methods, instructions or products referred to in the content. |
© 2024 by the authors. Licensee MDPI, Basel, Switzerland. This article is an open access article distributed under the terms and conditions of the Creative Commons Attribution (CC BY) license (http://creativecommons.org/licenses/by/4.0/).
Copyright: This open access article is published under a Creative Commons CC BY 4.0 license, which permit the free download, distribution, and reuse, provided that the author and preprint are cited in any reuse.


