Submitted:
21 June 2024
Posted:
21 June 2024
You are already at the latest version
Abstract
Organic electrophoretic coatings have gained significant attention due to their ability to provide a uniform and controlled coating thickness, high coating adhesion, and excellent corrosion protection properties. In this work, to investigate the aging behaviors of an organic electrophoretic coating for magnesium alloys, water absorption kinetics curves of the coatings after immersion in 3.5 wt.% NaCl at 20℃ and 40℃ were measured, and parameters such as the saturated water absorption and saturation time of the free film coatings were fitted to determine the densification evolution of the organic coatings. A tensile test was used to test the tensile strength of the organic coating during service to determine the evolution of the strength and toughness of the organic coating. The evolution of wet adhesion of organic coatings with service time was tested by ASTM D4541-02. The impedance spectra of the organic coatings under the above conditions were detected by EIS, and finally, the failure behavior of the organic coatings under immersion was analyzed.
Keywords:
electrophoretic coating
; aging behavior
; water absorption
; magnesium alloy
1. Introduction
Magnesium alloys are known for their low weight and high strength-to-weight ratio, making them attractive materials for various industrial applications, such as automotive and aerospace applications [1,2,3]. However, one of the challenges associated with magnesium alloys is their susceptibility to corrosion, which can significantly affect their long-term performance and durability [4,5,6]. To address this issue, various surface treatment methods have been developed to protect magnesium alloys from corrosion and improve their overall performance [7,8,9,10]. One such method is the application of organic coatings, which serve as a barrier against corrosive environments and provide additional benefits such as improved adhesion and aesthetics.
Organic coatings for magnesium alloys typically consist of a binder polymer matrix loaded with corrosion inhibitors and other functional additives [11,12]. These coatings can be applied through a variety of methods, including spraying, dip coating, and electrophoretic deposition [13,14,15]. Among these methods, organic electrophoretic coating has gained significant attention due to its ability to provide a uniform and controlled coating thickness, high coating adhesion, and excellent corrosion protection properties [16,17,18,19]. The electrophoretic coating process involves applying an electric field to attract charged particles suspended in a liquid dispersion toward the magnesium alloy substrate, resulting in a tightly adhered and protective coating layer.
The aging behaviors of organic electrophoretic coatings for magnesium alloys have been the subject of extensive research in recent years, as understanding the long-term performance and durability of these coatings is crucial for ensuring the reliability and longevity of magnesium alloy-based components. Aging phenomena such as water absorption, corrosion resistance, adhesion strength, and mechanical properties can be influenced by factors such as exposure to environmental conditions and temperature fluctuations [20]. By investigating the effects of aging on coatings, strategies to improve the sustainability and performance of magnesium alloy systems in various applications can be developed [21,22,23,24]. N. Guermazi et al. [25] studied the sorption kinetics of coatings through the water absorption rate response at different temperatures. A decrease in the mechanical properties, including the elastic modulus and tensile strength, was clearly observed. It also shows that such degradation largely depends on both the aging temperature and immersion duration. A. Lopez-Ortega et al. [26] evaluated three coatings employed for offshore component protection according to certain standards by performing weathering aging tests in different climatic cabinets. However, the aging process of thin electrophoretic coatings on magnesium alloys has rarely been reported.
In this work, to investigate the aging behavior of an organic electrophoretic coating on magnesium alloys, water absorption kinetics curves of the coatings after immersion in 3.5 wt.% NaCl at 20℃ and 40℃ were measured, and parameters such as the saturated water absorption and saturation time of the free film coatings were fitted to determine the densification evolution of the organic coatings. A tensile test was used to test the tensile strength and fracture elongation of the organic coating during service to determine the evolution of the strength and toughness of the organic coating. The evolution of wet adhesion of organic coatings with service time was tested by ASTM D4541-02. The impedance spectra of the organic coatings under the above conditions were detected by EIS, and finally, the failure behavior of the organic electrophoretic coatings under immersion was analyzed.
2. Materials and Methods
2.1. Experimental Materials
The substrate is an as-cast VW63Z magnesium alloy provided by Shenyang Zhongjie Metals Co. Ltd., with a size of 40 mm×40 mm×5 mm. The chemical composition was 5.63 wt.% Gd, 2.73 wt.% Y, 0.37 wt.% Zr and Mg balance, which analyzed by an ICP-OES (inductively coupled plasma—optical emission spectrometer). The pre-treatments included polishing, degreasing (10.0 g/L NaOH, 5.0 g/L Na2CO3, and 8.0 g/L Na2O·nSiO2), water washing, rust removal (10 g/L HCl and 18 g/L HF) and phosphating.
The electrophoresis coating was prepared using a Nippon E-coating paint containing a soluble metal compound, amine-modified resin and curing agent. The process parameters were as follows: 100 V voltage for 10 min, a bath temperature of 25 ~ 30 ℃, and a curing temperature of 200 ℃ for 10 h. The produced samples with defects such as holes and bubbles were screened out by visual inspection of the coating surface (Figure 1). The free film was obtained by dissolving the base metal. Finally, a PosiTector 6000 Coating Thickness Gauge manufactured by Delelsko Corporation (USA) was utilized to measure the thickness of the coating at various points in different areas of the coating to ensure that all coating/metal specimens used in the experiments had a coating thickness of 30 ± 2 μm.
2.2. Experimental Methods
2.2.1. Tensile Tests
The tensile tests of the electrophoretic coatings were evaluated by a universal tensile testing machine (AK20KN of Shimadzu) with a strain rate of 2 mm/min, according to ISO 37-2005.
2.2.2. Gravimetric Test
Gravimetric data were obtained by measuring the mass of the electrophoretic coatings at stipulated time intervals at different temperatures. Before weighing, the surface was carefully cleaned with filter paper, and a Sartorius BS124S microbalance (1 μg resolution) was used as the weighing device. The experiment was performed three times to ensure reproducible results. The water absorption (Qt) was then calculated according to the following equation:
where mt represents the mass of electrophoretic coatings at time t, m0 is the initial mass before immersion and Qt is the water absorption (mass%) at time t.
2.2.3. Adhesion Tests
The adhesion tests were carried out according to ASTM D4541-09. This test was performed with a PosiTest manual hydraulic pull-off adhesion tester from DeFelsko, USA. At least 5 parallel samples were taken, and the average value was taken as the final result.
2.2.4. EIS Tests
EIS tests of the intact and scratched coatings were performed in 3.5 wt.% NaCl solution using an electrochemical workstation (PARSTAT 4000 A). For the electrophoretic coatings, a traditional three-electrode system was used, in which a platinum sheet, a saturated calomel electrode, and a coated Mg alloy with an exposed area of 4 cm2 were used as auxiliary, reference, and working electrodes, respectively. The working electrode was held at its open circuit potential (OCP) for 1200 s prior to the measurement to ensure that the OCP reached a steady state. EIS tests were performed over a frequency range of 0.01 Hz to 105 Hz with alternating current signal amplitudes of 20~50 mV, and all EIS data were fitted by ZSimpWin software.
3. Results
3.1. Gravimetric Results for Electrophoretic Coatings
By means of weight testing, the mass of absorbed water in the free film can be calculated to study in detail the water absorption behavior of the coating. As shown in Figure 2, the corresponding water absorption kinetic curves at both temperatures indicate that the water transport in the electrophoretic layer can be divided into three stages: the absorption stage, saturation stage, and decline stage. In Figure 2a, a quick growing trend of water absorption was observed in the initial period of the curve at 20 °C. It suggested that water diffused rapidly through the microscopic channels in the coating. Then, the value of immersion at 20 °C gradually reached saturation at approximately 1080 h. In the saturation stage, the water absorption rate of the coating tends to stabilize with a certain fluctuation phenomenon. The absorption stage and saturation stage of the curve follow Fick’s law of diffusion. The saturation water absorption rate was determined to be approximately 0.94% at 20 °C. Subsequently, there is a certain decrease in water absorption, which may be caused by the dissolution of substances due to the degradation of the coating.
On the other hand, the curve of immersion at 40 °C also involved these three stages (Figure 2b). The curve reaches saturation after approximately 228 h. The saturation water absorption rate was determined to be approximately 1.42% at 40 °C. From the results above, it can be seen that the saturated water absorption at 40 °C is greater than that at 20 °C, and the time to reach saturation is more rapid. It indicates that an increase in temperature not only accelerates water transport but also increases the saturated water absorption rate of the coating. The water uptake in the coating is significantly promoted by the rise of temperature.
3.2. Adhesion Test Results for Electrophoretic Coatings
Figure 3a shows the variation in the adhesion of the coatings with the immersion period. Before immersion, the dry adhesion value was approximately 16.40 MPa. As we know, the dry adhesion will change to be wet adhesion after immersion in the water. With prolonged immersion, the values of the coatings at both temperatures decreased, indicating that the coating adhesion gradually decreased. In the initial period of immersion (before 100 h), the declines in coating adhesion were limited for both temperature, which suggest that the coatings still retain a certain degree of protection capability. The coatings were pulled off to compare the adhesion profiles with each other (Figure 3b,d). It can be seen that the fracture pattern was cohesive fracture after pull-off tests. The morphology of fracture surfaces of the samples indicates that the coating adhesion is still good. After 336 h of immersion, the wet adhesion of the coatings immersed at 20 °C and 40 °C decreased to 6.44 ± 0.41 MPa and 5.41 ± 1.59 MPa, respectively. At the same time, the exposed areas of the substrate increase after pull-off tests (Figure 3c,e), suggesting a significant decrease in coating adhesion. However, the wet adhesion of the coating immersed at 40 °C dropped more greatly than that immersed at 20 °C. The results above demonstrate that an increase in temperature accelerates the loss of coating adhesion.
3.3. Tensile Test Results for Electrophoretic Coatings
Mechanical property degradation severely affects the service life of the coating and induces failure of the protective performance, which is indispensable in research on coating failure behavior. For this purpose, tensile tests were performed on the electrophoretic free film to assess their mechanical properties, such as strength and toughness. Figure 4 shows some typical time-dependent load‒displacement curves of the electrophoretic free films at 20 °C and 40 °C. During tensile deformation, the coating first undergoes the elastic deformation stage, with linear effects on the load and displacement. At this point, polymer deformation dominates the changes in the bond distance and bond angle of the polymer chain. As the stress of the coating reaches the maximum yield strength, the stress is reduced until the coating fractures. For the coating, strain softening does not occur before fracture, which means that the overall mechanical properties of the coating are hard and brittle in this stage. In addition, the maximum load of the coating decreases at the expense of immersion at both temperatures. This phenomenon can be attributed to the hydrolysis between water molecules and the coating, which enables changes in the molecular bonds within the coating and further decreases the strength.
Figure 5 intuitively shows the time-dependent variation in the tensile strength (σ) of the coating. The tensile strength of the free films at 20 °C and 40 °C decreased gradually. However, the downward trends have been accompanied by violent fluctuations, reflecting the large differences among the sample individuals. In spite of this, the σ values decrease more slowly at 20 °C than at 40 °C on the whole. It is clear that the mechanical properties of the coating deteriorate fast as the temperature increases.
3.4. EIS Results
Electrochemical impedance spectroscopy (EIS) can reflect the information of coating deterioration and metal corrosion, and the variation in coating failure can be determined through in situ monitoring of coating/metal electrodes. The resulting data can provide a benchmark for the life prediction threshold. Figure 6 shows the Nyquist and Bode plots of the sample served at 20℃ for different immersion time. The Nyquist plot exhibits a single capacitance resistance arc at the beginning, and the low-frequency impedance modulus (|Z|0.01 Hz) is 1010 Ω cm2. At this point, the corrosive media have not yet infiltrated into the surface of the metal substrate. While it is found that the impedance modulus of the coating dropped significantly after 1 day, dropping to the order of 109 Ω ·cm2, indicating that the corrosive medium began to enter the coating through the defect, resulting in a decline in the impedance modulus, as shown in Figure 6a. At the same time, a second arc of capacitive reactance appears in the Nyquist diagram of the coating, that is, the aging behavior has entered the middle stage of immersion. When water is transferred to the coating/metal interface, electrochemical reactions begin to occur due to the establishment of corrosion cell. At this time, EIS features of two-time constants began to appear on the coating (Figure 6b). After 14 d of immersion, the |Z|0.01 Hz value of the coating has dropped to the order of 105 Ω ·cm2, indicating a bad corrosion protection of the coating. As for the phenomenon of temporary rising trend of the impedance modulus after 14 days, it can be inferred that the impedance modulus of the coating/metal corrosion interface increased with the accumulation of corrosion products.
In Figure 7, it can be seen that the whole failure behavior of the coating immersed at 40 ℃ has no much difference from that at 20 ℃. The value |Z|0.01Hz of coating sharply decreased to 108 Ω ·cm2. After serving 14 d, the impedance modulus was 105 Ω ·cm2, which means that the coating has lost its barrier function against electrolyte permeation. According to the results, the aging process of the coating has been accelerated by the increase of temperature, resulting in a decline in the impedance modulus.
4. Discussion
4.1. Water Transport Behavior
To describe the moisture absorption behavior of the coating, a theoretical diffusion model of the coating was established for one-dimensional moisture transport. Based on Fick’s diffusion law, the theoretical diffusion mathematical model of coating under normal pressure aqueous solution is shown as follows:
where c(x,t) is the solution concentration; x is the distance from the coating surface; t is immersion time; D is the diffusion coefficient. The model holds that water obeys Fick’s second diffusion law in the initial stage of coating transport, and its typical absorption diffusion equation is as follows:
where Qt and Q∞ represent the adsorbed water weight of the penetrant at time t and after saturation, respectively; d is the thickness of the test sample.
This equation is an ideal case of penetrant transport in polymers, which corresponds to the free diffusion of penetrant without the interference of polymer chain rearrangement or external influence. For relatively small values of t, equation (3) can be simplified to equation (4):
Assuming that the coating is saturated at time t, then Qt/Q∞ = 1. Substituting the parameters of the saturation absorption time (t) and the thickness of the coating (d) into equation (4), the diffusion coefficient D20 is 1.817×10⁻¹⁶/m2 s-1 at 20 °C, and D40 is 8.610×10⁻¹⁶/m2 s-1 at 40 °C.
According to equation (4), when the coating diffusion coefficient D and the saturated water absorption Q∞ are given (see Table 1), the time t required to reach the amount of water absorption is:
The resulting model equation for the water transport behavior of the electrophoretic coatings at both temperatures is:
In summary, the results testify that high temperature obviously accelerates the water diffusion through the coating. It is observed that although the change of temperature has a great influence on the diffusion coefficient, the diffusion behavior of the coating does not change essentially.
4.2. Coating Adhesion Modeling
The bonding force of organic coatings with magnesium alloys is highly dependent on the service environment. As mentioned above, the wet-state adhesion of coatings with immersion time exhibits a nonlinear change under different temperatures. If the adhesion fails, the other protection process will become useless. However, the complex influencing factors make the study of wet adhesion difficult, and there is an urgent need to employ mathematical models or predictive equations to explore the underlying mechanisms.
According to our previous research, gray system theory (GST) is a superior method for studying wet adhesion models [27]. Among the numerous available information processing and mathematical model analysis methods, gray system theory is famous for its intrinsic characteristics, namely, that it has few data requirements and can explore potential mechanisms with little information. Gray system theory was proposed by Deng Julong and can reveal the evolutionary pattern of things in the context of a small number of excavations and little information [28]. The core of the gray system theoretical model is the gray dynamic model, or the GM model for short. The most typical model is the GM (1,1) gray model.
In this study, the adhesion between the organic coating and the substrate was affected by many factors, which, in addition to the service environment of the coating, was related to the preparation and curing process and material structure. Given that the connotation of the change in coating adhesion is unclear but the extension is clear, it is necessary to choose appropriate mathematical methods for modeling. Based on the concept of the gray generation function, with differential fitting as the core, the essence of gray system theory is that all random quantities are gray quantities and gray processes that change within a certain range and within a certain period of time. The purpose of gray quantity processing is not to determine the statistical pattern and probability distribution but rather to turn the original data series into regular time series data through certain methods; that is, the pattern of finding the number by the number is established. The GM (α, β) model is the core of gray prediction, where α is the order of the differential equation and β is the number of variables. Among them, the GM(1,1) model, which consists of a first-order differential equation and one variable, is considered to be the most widely used gray prediction model due to the small amount of raw information, the simplicity of the calculation method, and the high accuracy of the model. As a result, the variation rule of wet adhesion of the organic coating was established through the gray GM (1,1) model, and the specific process was as follows.
The sequence X(0), which denotes the wet adhesion of a coating/metal substrate system at different immersion times, is defined as follows:
The corresponding time sequence is:
where X(0) represents the wet adhesion (nonnegative value), t is the immersion period, and n is the sample size of the data.
An accumulating generation operator (AGO), or inverse AGO, is the precondition of the establishment of the gray model, which can smooth randomness and strengthen the regularity of the sequence. Here, gray sequence generation is performed by AGO, and the monotonically increasing sequence X(1) is obtained as follows:
where
The mean sequence Z(1) of X(1) is defined as follows:
where
The least-square estimate sequence of the gray differential equation is as follows:
Then, the GM (1, 1) whitening differential equation of X (1)(k) is as follows:
where the parameters a and u can be determined by the least-square method:
where
The solution of X (1)(k) at time k is:
As above, p represents the predicted value. Then, to obtain the predicted value of the primitive data at time k, the Inverse Accumulating Generation Operator (IAGO) is used to establish the following GM (1, 1):
For
By replacing the parameter k with t, the following equation can be obtained:
In the above equation, t1 is the initial time of the time sequence, and N is the time interval of the arithmetic series. Equation. (22) is the gray GM (1,1) model of the coating based on GST for the wet adhesion of coatings. The measured adhesion data are calculated according to the above steps, and the resulting coefficients ∂ and u are summarized in Table 2 using the associated adhesion model.
The calculated parameters ∂ and u are substituted into the equation. 22, the equations for coating adhesion versus time at different temperatures can be obtained:
In order to analyze the accuracy of the GM (1,1) model, the average relative error of the model is analyzed. The average relative error ARE are calculated using the following formula:
The average relative error of GM(1,1) model at 20℃ and 40℃ is 9.3% and 9.6%, respectively. It can be seen that the overall accuracy of the established GM (1,1) model is good. The coating adhesion has great influence on the aging behavior of coating.
4.3. Coating Strength Evolution
For the tensile strength of the coating, the immersion time is taken as the independent variable and the strength value as the variable. After taking the natural logarithm of the longitudinal tensile strength, the soaking time is plotted, as shown in the figure below. After linear fitting, the fitting parameters were obtained, as shown in Table 3. Table 3 is the coefficient obtained after fitting the coating strength equation. It can be seen that the relationship between coating strength and soaking time is as follows:
As shown in Figure 8, the experimental curve matches the fitted curve well, and the fitting coefficients are summarized in Table 3.
Figure 9.
Variation in the strength of the electrophoretic coatings and the data fitting curve.
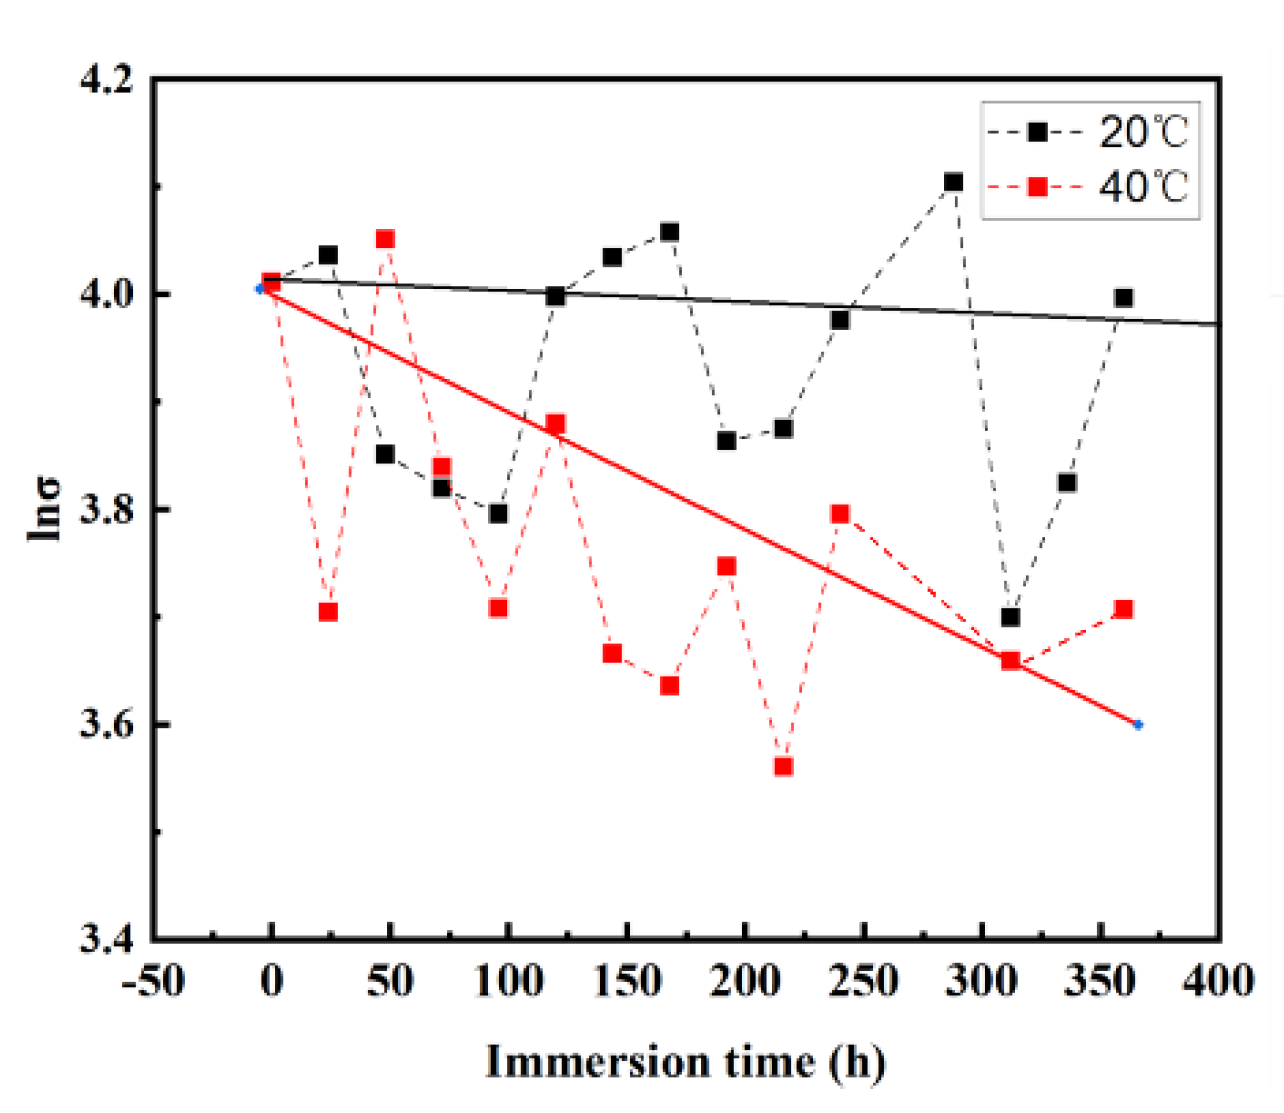
Then, the formula for the variation in the coating strength with time can be derived as follows:
From the analysis above, the tensile strength of the coating decreases at different temperatures, but its contribution to the aging behavior of the coating is limited. Especially when the temperature is low, the coating strength fluctuates greatly, but there is no obvious loss compared with other performance parameters in a short service time.
5. Conclusions
In this study, a Nippon organic electrophoretic coating was selected as the coating material. The water absorption kinetics, coating adhesion, and tensile strength of the coating were studied after immersion in 3.5 wt.% NaCl at 20 °C and 40 °C to investigate the aging behavior of the coating on magnesium alloys. Furthermore, comparisons were made with the materials served at different temperatures. The main conclusions are as follows:
(1) The overall water absorption of the electrophoretic paint tended to increase and stabilize with increasing immersion time. The diffusion coefficient of the coating soaked at 40 ℃ is greater than that of the coating soaked at 20 ℃. The water absorption of electrophoretic paint improved with increasing temperature.
(2) The gray GM (1,1) model can be used to fit the trend of wet adhesion of the coating under immersion. The average relative errors of the GM (1,1) model at 20 °C and 40 °C are 9.3% and 9.6%, respectively. The overall accuracy of the established GM (1,1) model is good.
(3) The tensile strength of the coating does not change significantly with soaking time, and the contribution to the aging of the coating is less than that of coating adhesion and water diffusion.
Author Contributions
Conceptualization, X.W. and G.W.; methodology, J.S. and Y.Y.; software, Y.J.; validation, R.W. and X.L.; formal analysis, K.G.; investigation, K.Z.; resources, F.M.; data curation, X.W.; writing—original draft preparation, X.W.; writing—review and editing, J.S.; visualization, G.W.; supervision, Y.Y.; project administration, Y.Y.; funding acquisition, Y.Y. All authors have read and agreed to the published version of the manuscript.
Funding
This research was funded by the Fundamental Research Funds for the Central Universities, grant number N2402012.
Institutional Review Board Statement
Not applicable.
Informed Consent Statement
Not applicable.
Data Availability Statement
Data are contained within this article.
Conflicts of Interest
Xiaoxue Wang, Xiuchun Liu and Kai Gao were employed by the Beijing Institute of Space Long March Vehicle. The remaining authors declare that the research was conducted in the absence of any commercial or financial relationships that could be construed as potential conflicts of interest. The authors declare no conflicts of interest.
References
- Prasad, S. V. S.; Prasad, S. B.; Verma, K.; Mishra, R. K.; Kumar, V.; Singh, S. , The role and significance of Magnesium in modern day research-A review. Journal of Magnesium and Alloys 2022, 10, 1–61. [Google Scholar] [CrossRef]
- Trang, T. T. T.; Zhang, J. H.; Kim, J. H.; Zargaran, A.; Hwang, J. H.; Suh, B. C.; Kim, N. J. , Designing a magnesium alloy with high strength and high formability. Nat Commun 2018, 9, 2522. [Google Scholar] [CrossRef]
- Joost, W. J.; Krajewski, P. E. , Towards magnesium alloys for high-volume automotive applications. Scripta Materialia 2017, 128, 107–112. [Google Scholar] [CrossRef]
- Xu, T. C.; Yang, Y.; Peng, X. D.; Song, J. F.; Pan, F. S. , Overview of advancement and development trend on magnesium alloy. Journal of Magnesium and Alloys 2019, 7, 536–544. [Google Scholar] [CrossRef]
- Esmaily, M.; Svensson, J. E.; Fajardo, S.; Birbilis, N.; Frankel, G. S.; Virtanen, S.; Arrabal, R.; Thomas, S.; Johansson, L. G. , Fundamentals and advances in magnesium alloy corrosion. Progress in Materials Science 2017, 89, 92–193. [Google Scholar] [CrossRef]
- Agarwal, S.; Curtin, J.; Duffy, B.; Jaiswal, S. , Biodegradable magnesium alloys for orthopaedic applications: A review on corrosion, biocompatibility and surface modifications. Mater Sci Eng C Mater Biol Appl 2016, 68, 948–963. [Google Scholar] [CrossRef]
- Li, H. T.; Si, S. H.; Yang, K.; Mao, Z. A.; Sun, Y. H.; Cao, X. R.; Yu, H. T.; Zhang, J. W.; Ding, C.; Liang, H. X.; Wu, L. , Hexafluoroisopropanol based silk fibroin coatings on AZ31 biometals with enhanced adhesion, corrosion resistance and biocompatibility. Progress in Organic Coatings 2023, 184. [Google Scholar] [CrossRef]
- Singh, N.; Batra, U.; Kumar, K.; Ahuja, N.; Mahapatro, A. , Progress in bioactive surface coatings on biodegradable Mg alloys: A critical review towards clinical translation. Bioact Mater 2023, 19, 717–757. [Google Scholar] [CrossRef]
- Kaseem, M.; Fatimah, S.; Nashrah, N.; Ko, Y. G. , Recent progress in surface modification of metals coated by plasma electrolytic oxidation: Principle, structure, and performance. Progress in Materials Science 2021, 117. [Google Scholar] [CrossRef]
- Darband, G. B.; Aliofkhazraei, M.; Hamghalam, P.; Valizade, N. , Plasma electrolytic oxidation of magnesium and its alloys: Mechanism, properties and applications. Journal of Magnesium and Alloys 2017, 5, 74–132. [Google Scholar] [CrossRef]
- Telmenbayar, L.; Ramu, A. G.; Yang, D.; Choi, D. , Development of mechanically robust and anticorrosion slippery PEO coating with metal-organic framework (MOF) of magnesium alloy. Chem. Eng. J. 2023, 458. [Google Scholar] [CrossRef]
- Gnedenkov, A. S.; Sinebryukhov, S. L.; Filonina, V. S.; Ustinov, A. Y.; Sukhoverkhov, S. V.; Gnedenkov, S. V., New Polycaprolactone-Containing Self-Healing Coating Design for Enhance Corrosion Resistance of the Magnesium and Its Alloys. Polymers (Basel) 2022, 15, (1).
- Bai, Y.; Yu, F. L.; Du, J.; Wang, W. X.; Cui, Z. Q.; Han, Z. H.; Yang, J. F. In A Brief Review about Surface Treatment of Magnesium Alloys, 13th International Symposium on Eco-Materials Processing and Design (ISEPD 2012), Guilin, PEOPLES R CHINA, 2012. Jan 07-10, 2012; Guilin, PEOPLES R CHINA, 2012; pp 307-+.
- Chen, X. M.; Li, G. Y.; Lian, J. S.; Jiang, Q. , An organic chromium-free conversion coating on AZ91D magnesium alloy. Appl. Surf. Sci. 2008, 255, 2322–2328. [Google Scholar] [CrossRef]
- Galio, A. F.; Lamaka, S. V.; Zheludkevich, M. L.; Dick, L. F.; Mueller, I. L.; Ferreira, M. G. S. In Evaluation of Corrosion Protection of Sol-Gel Coatings on AZ31B Magnesium Alloy, 13th Conference of the Sociedade-Portuguesa-de-Materiais/4th International Materials Symposium, Oporto, PORTUGAL, 2008. Apr 01-04, 2007; Oporto, PORTUGAL, 2008; pp 390-+.
- Zhang, D. X.; Xiang, Q.; Li, X. M. , Electrophoretic fabrication of zeolitic imidazolate framework-67 (ZIF-67) and its derivative coating. Materials Letters 2019, 257. [Google Scholar] [CrossRef]
- Estupinan Lopez, F. H.; Gaona Tiburcio, C.; Baltazar-Zamora, M. A.; Sepulveda, S.; Zambrano Robledo, P.; Cabral Miramontes, J. A.; Almeraya Calderon, F. In Effect of the addition of nanoparticles in the mechanical and electrochemical behavior of electrophoretic coatings, 32nd National Congress of the Mexican-Electrochemical-Society (MES) / 10th Meeting of the Mexican-Section of the Electrochemical-Society (ECS), Guanajuato, MEXICO, 2018. Jun 05-08, 2017; Guanajuato, MEXICO, 2018; pp 279-290.
- Yao, W. M.; Wang, Z. P.; Wu, X.; Li, B. B.; Zhong, X. M.; Lin, J.; Chen, J. Y.; Lai, Y. H. , Preparation of coatings from a series of silicone/fluorine-functionalized polyacrylates via electrophoretic deposition. Polymers for Advanced Technologies 2015, (9), 1148–1154. [Google Scholar] [CrossRef]
- Stoch, A.; Brozek, A.; Kmita, G.; Stoch, J.; Jastrzebski, W.; Rakowska, A. , Electrophoretic coating of hydroxyapatite on titanium implants. Journal of Molecular Structure 2001, 596, 191–200. [Google Scholar] [CrossRef]
- Hu, D.; Lv, Z.; Liu, H.; Jing, F.; Zhao, Y.; Zhang, S.; Du, H.; Wang, R. , Characterization and mechanical modeling of interfacial damage in EB-PVD thermal barrier coatings considering multiple failure factors. Journal of Materials Science & Technology 2024, 190, 42–55. [Google Scholar]
- da Silva Lopes, T.; Lopes, T.; Martins, D.; Carneiro, C.; Machado, J.; Mendes, A. , Accelerated aging of anticorrosive coatings: Two-stage approach to the AC/DC/AC electrochemical method. Progress in Organic Coatings 2020, 138. [Google Scholar] [CrossRef]
- Kamisho, T.; Takeshita, Y.; Sakata, S.; Sawada, T. , Water absorption of water-based anticorrosive coatings and its effect on mechanical property and adhesive performance. Journal of Coatings Technology and Research 2014, 11, 199–205. [Google Scholar] [CrossRef]
- Zhang, C.; Bao, X.; Li, W.; Chen, L.; Du, M. In Effect of temperature on Brillouin gain spectrum and aging behavior in carbon/polyimide coated fiber, 19th International Conference on Optical Fibre Sensors, Perth, AUSTRALIA, 2008. Apr 15-18, 2008; Perth, AUSTRALIA, 2008.
- Fang, B. Y.; Han, E. H.; Wang, J. Q.; Zhu, Z. Y.; Ke, W.; Hu, J. P.; Xu, Z. A. , Effect of aging temperature and time on the performance of epoxy coating. Acta Metallurgica Sinica 2003, 39, 533–540. [Google Scholar]
- Guermazi, N.; Elleuch, K.; Ayedi, H. F. , The effect of time and aging temperature on structural and mechanical properties of pipeline coating. Materials & Design 2009, 30, 2006–2010. [Google Scholar]
- Lopez-Ortega, A.; Bayon, R.; Arana, J. L. , Evaluation of Protective Coatings for High-Corrosivity Category Atmospheres in Offshore Applications. Materials (Basel) 2019, 12((8)). [Google Scholar] [CrossRef]
- Meng, F. D.; Liu, Y.; Liu, L.; Li, Y.; Wang, F. H. , Studies on Mathematical Models of Wet Adhesion and Lifetime Prediction of Organic Coating/Steel by Grey System Theory. Materials 2017, 10, 715. [Google Scholar] [CrossRef] [PubMed]
- Deng, J. L. , Control problems of grey systems. Syst. Control Lett 1982, 1, 288–294. [Google Scholar]
Figure 1.
Typical SEM micromorphology of the surface of the electrophoretic coating.
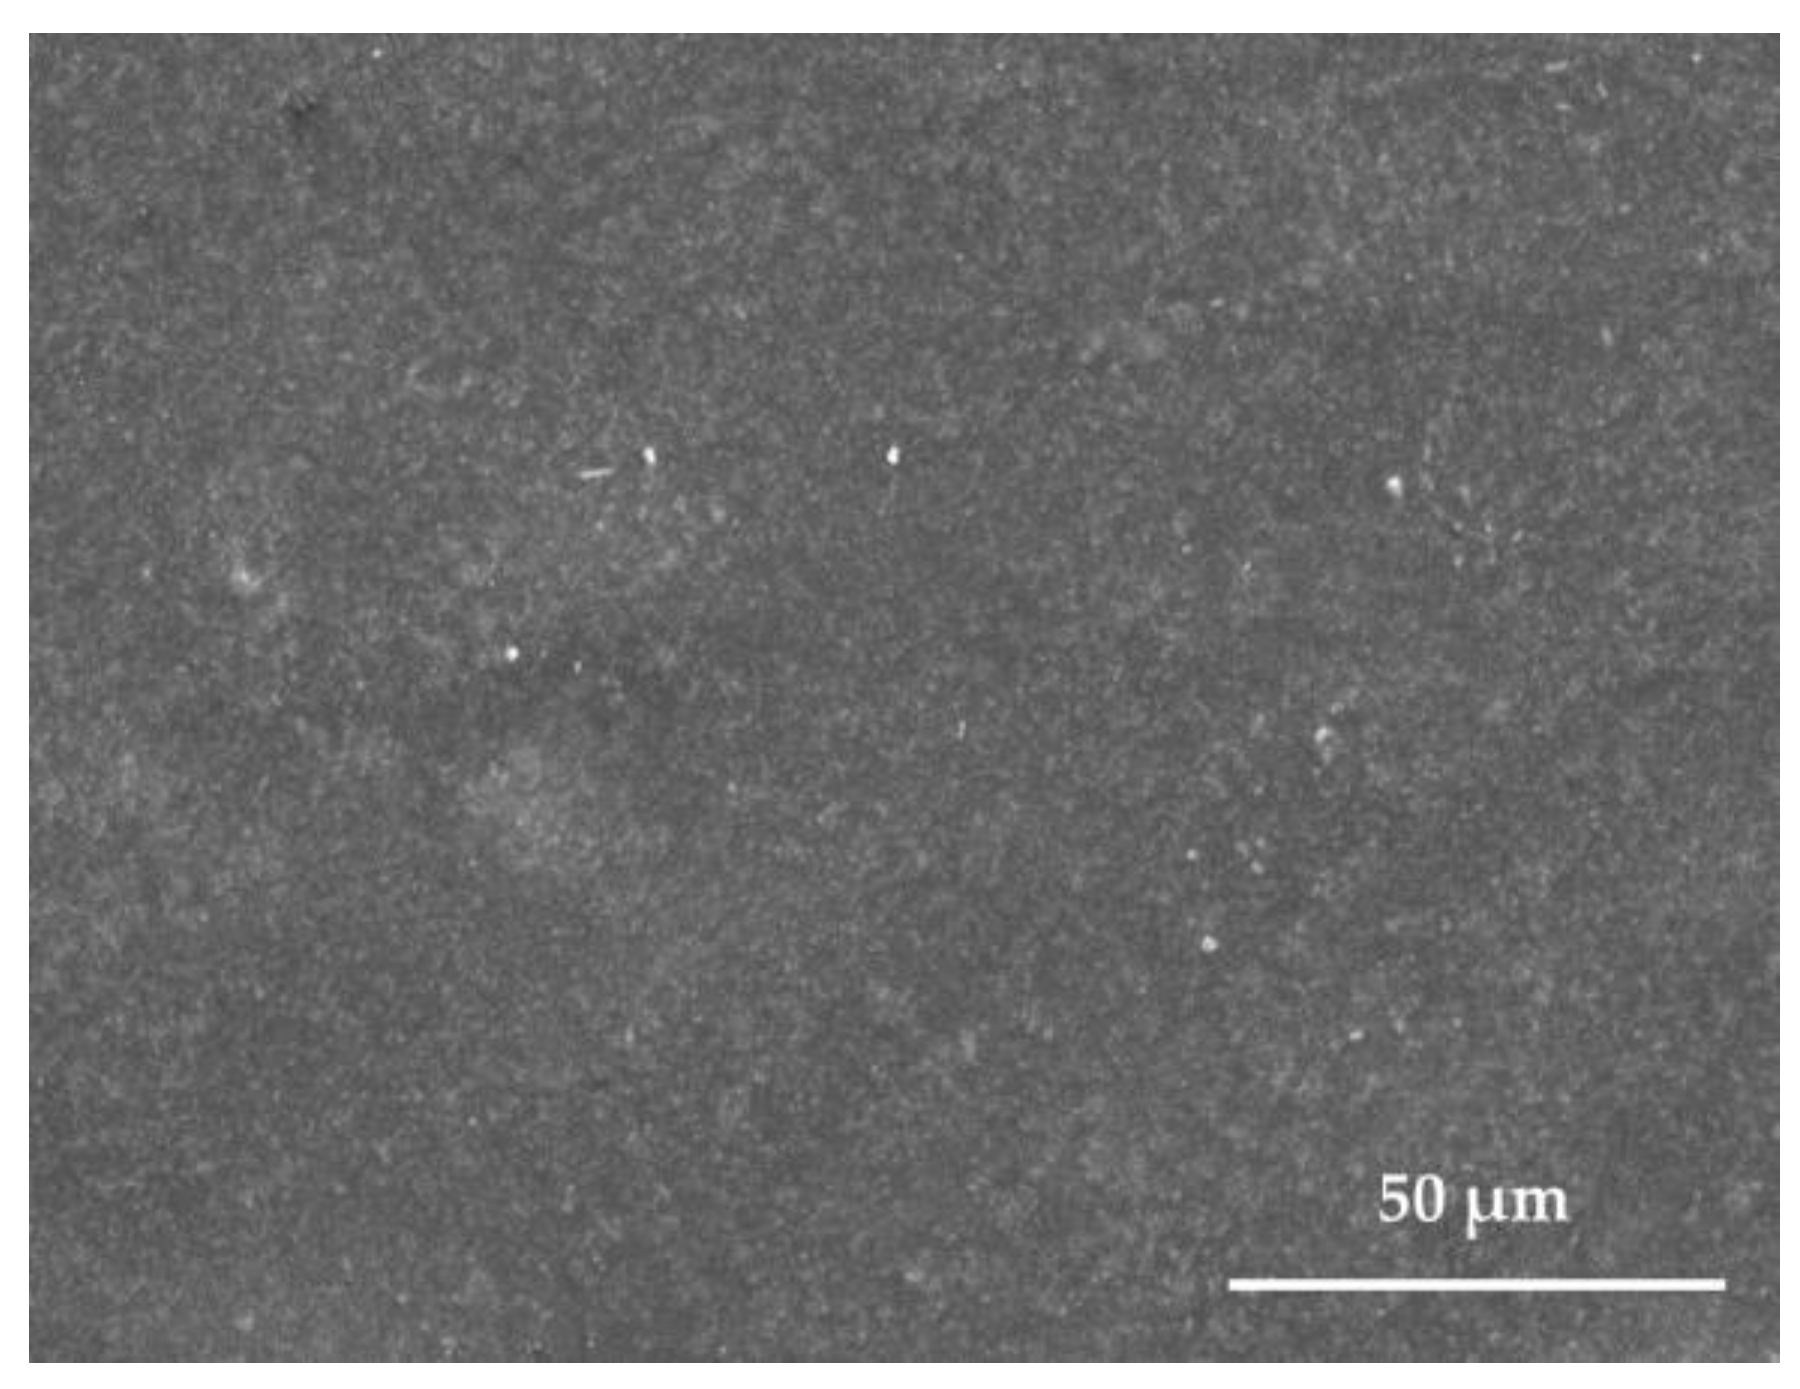
Figure 2.
Water absorption curves for the coatings at (a) 20 °C and (b) 40 °C.
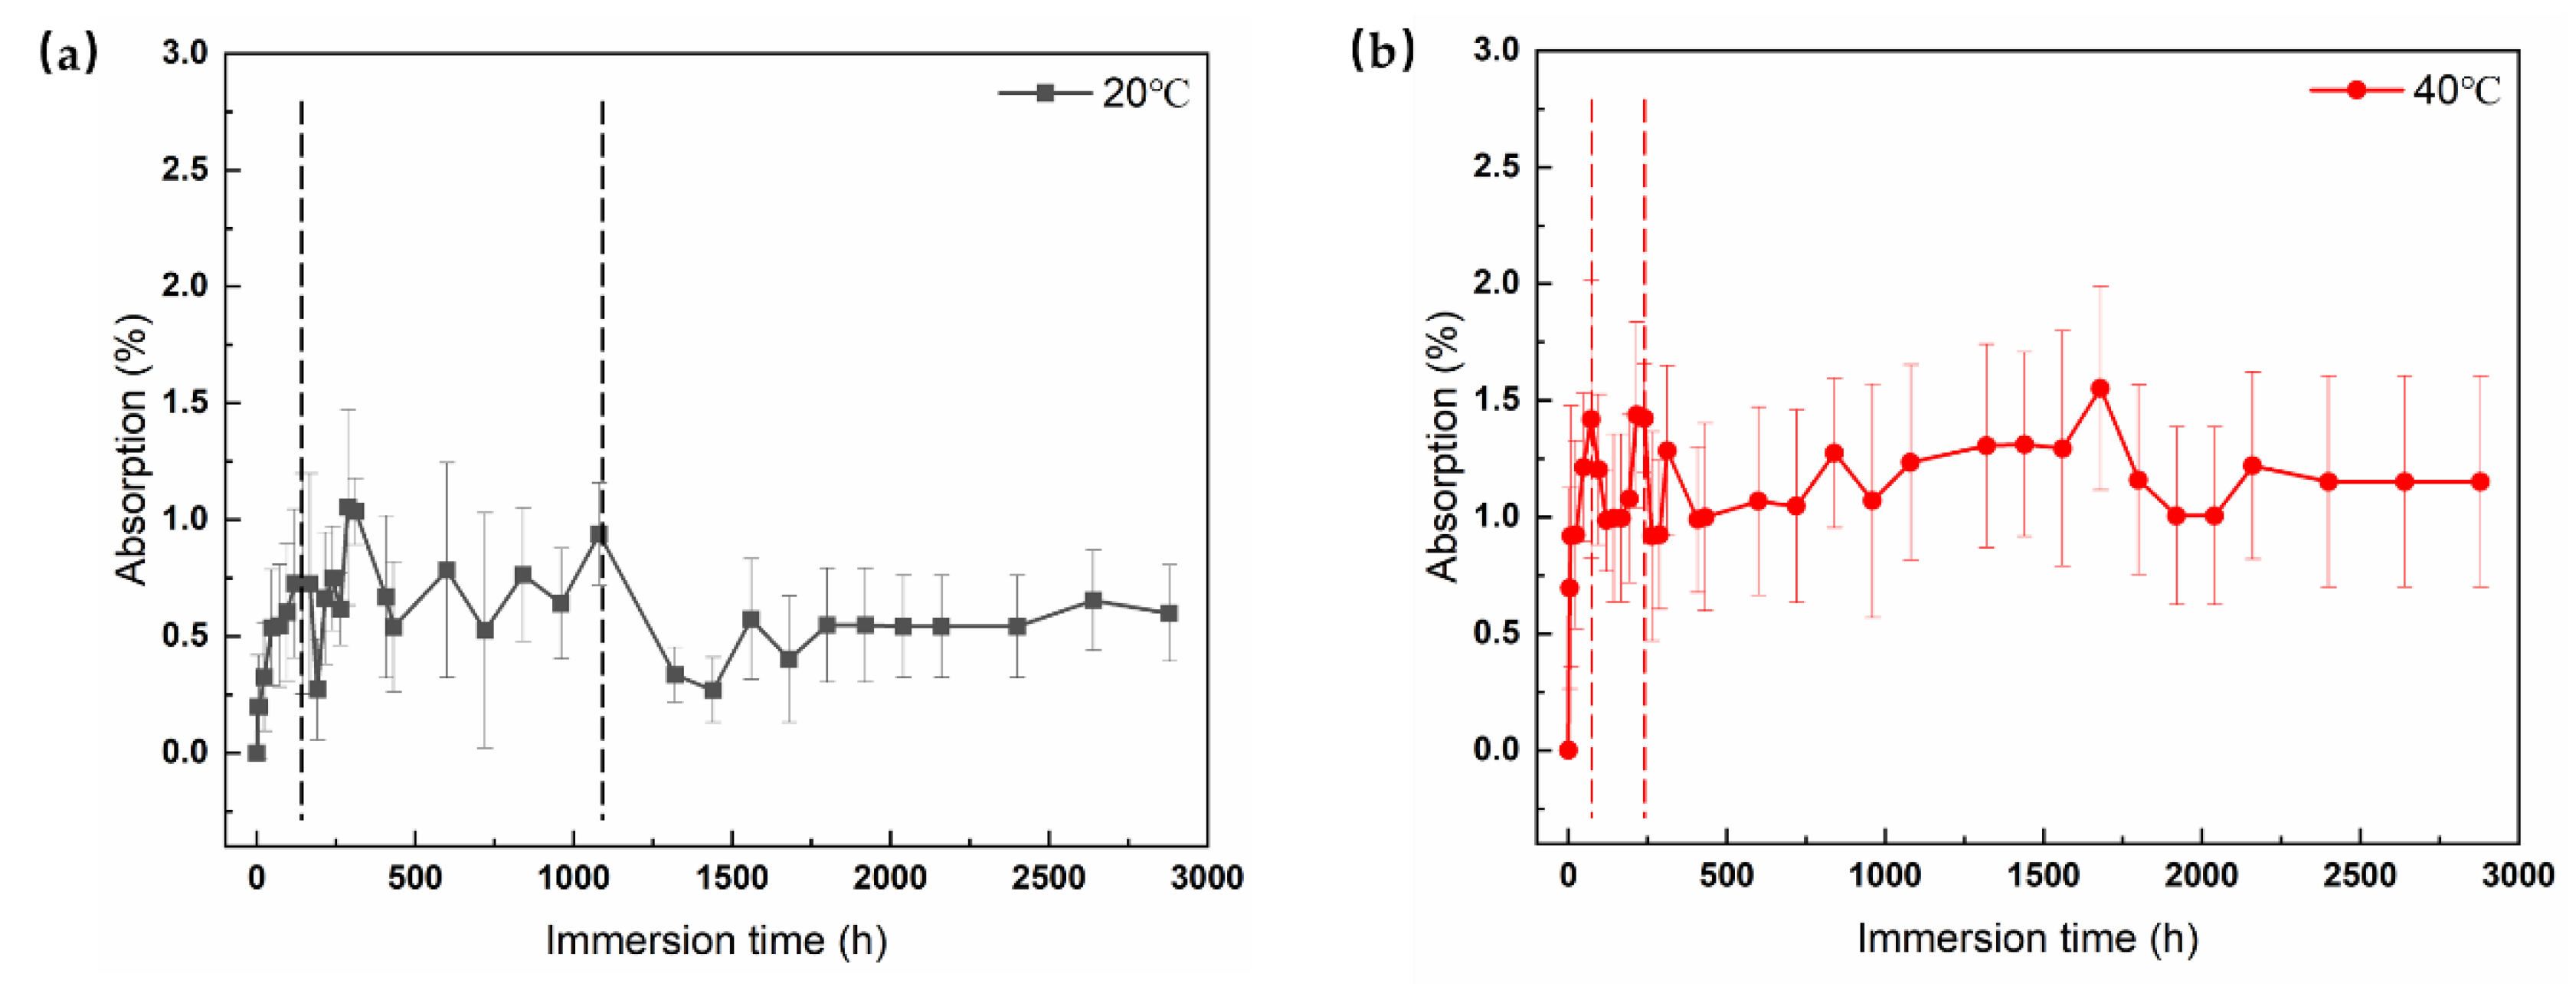
Figure 3.
(a) Adhesion test results of electrophoretic coatings measured by the pull-off method at 20 °C and 40 °C, and the macroscopic morphology of fracture surfaces of the samples after pull-off tests: (b) immersed at 20 °C after 96 h, (c) immersed at 20 °C after 336 h, (d) immersed at 40 °C after 96 h, and (e) immersed at 40 °C after 336 h.
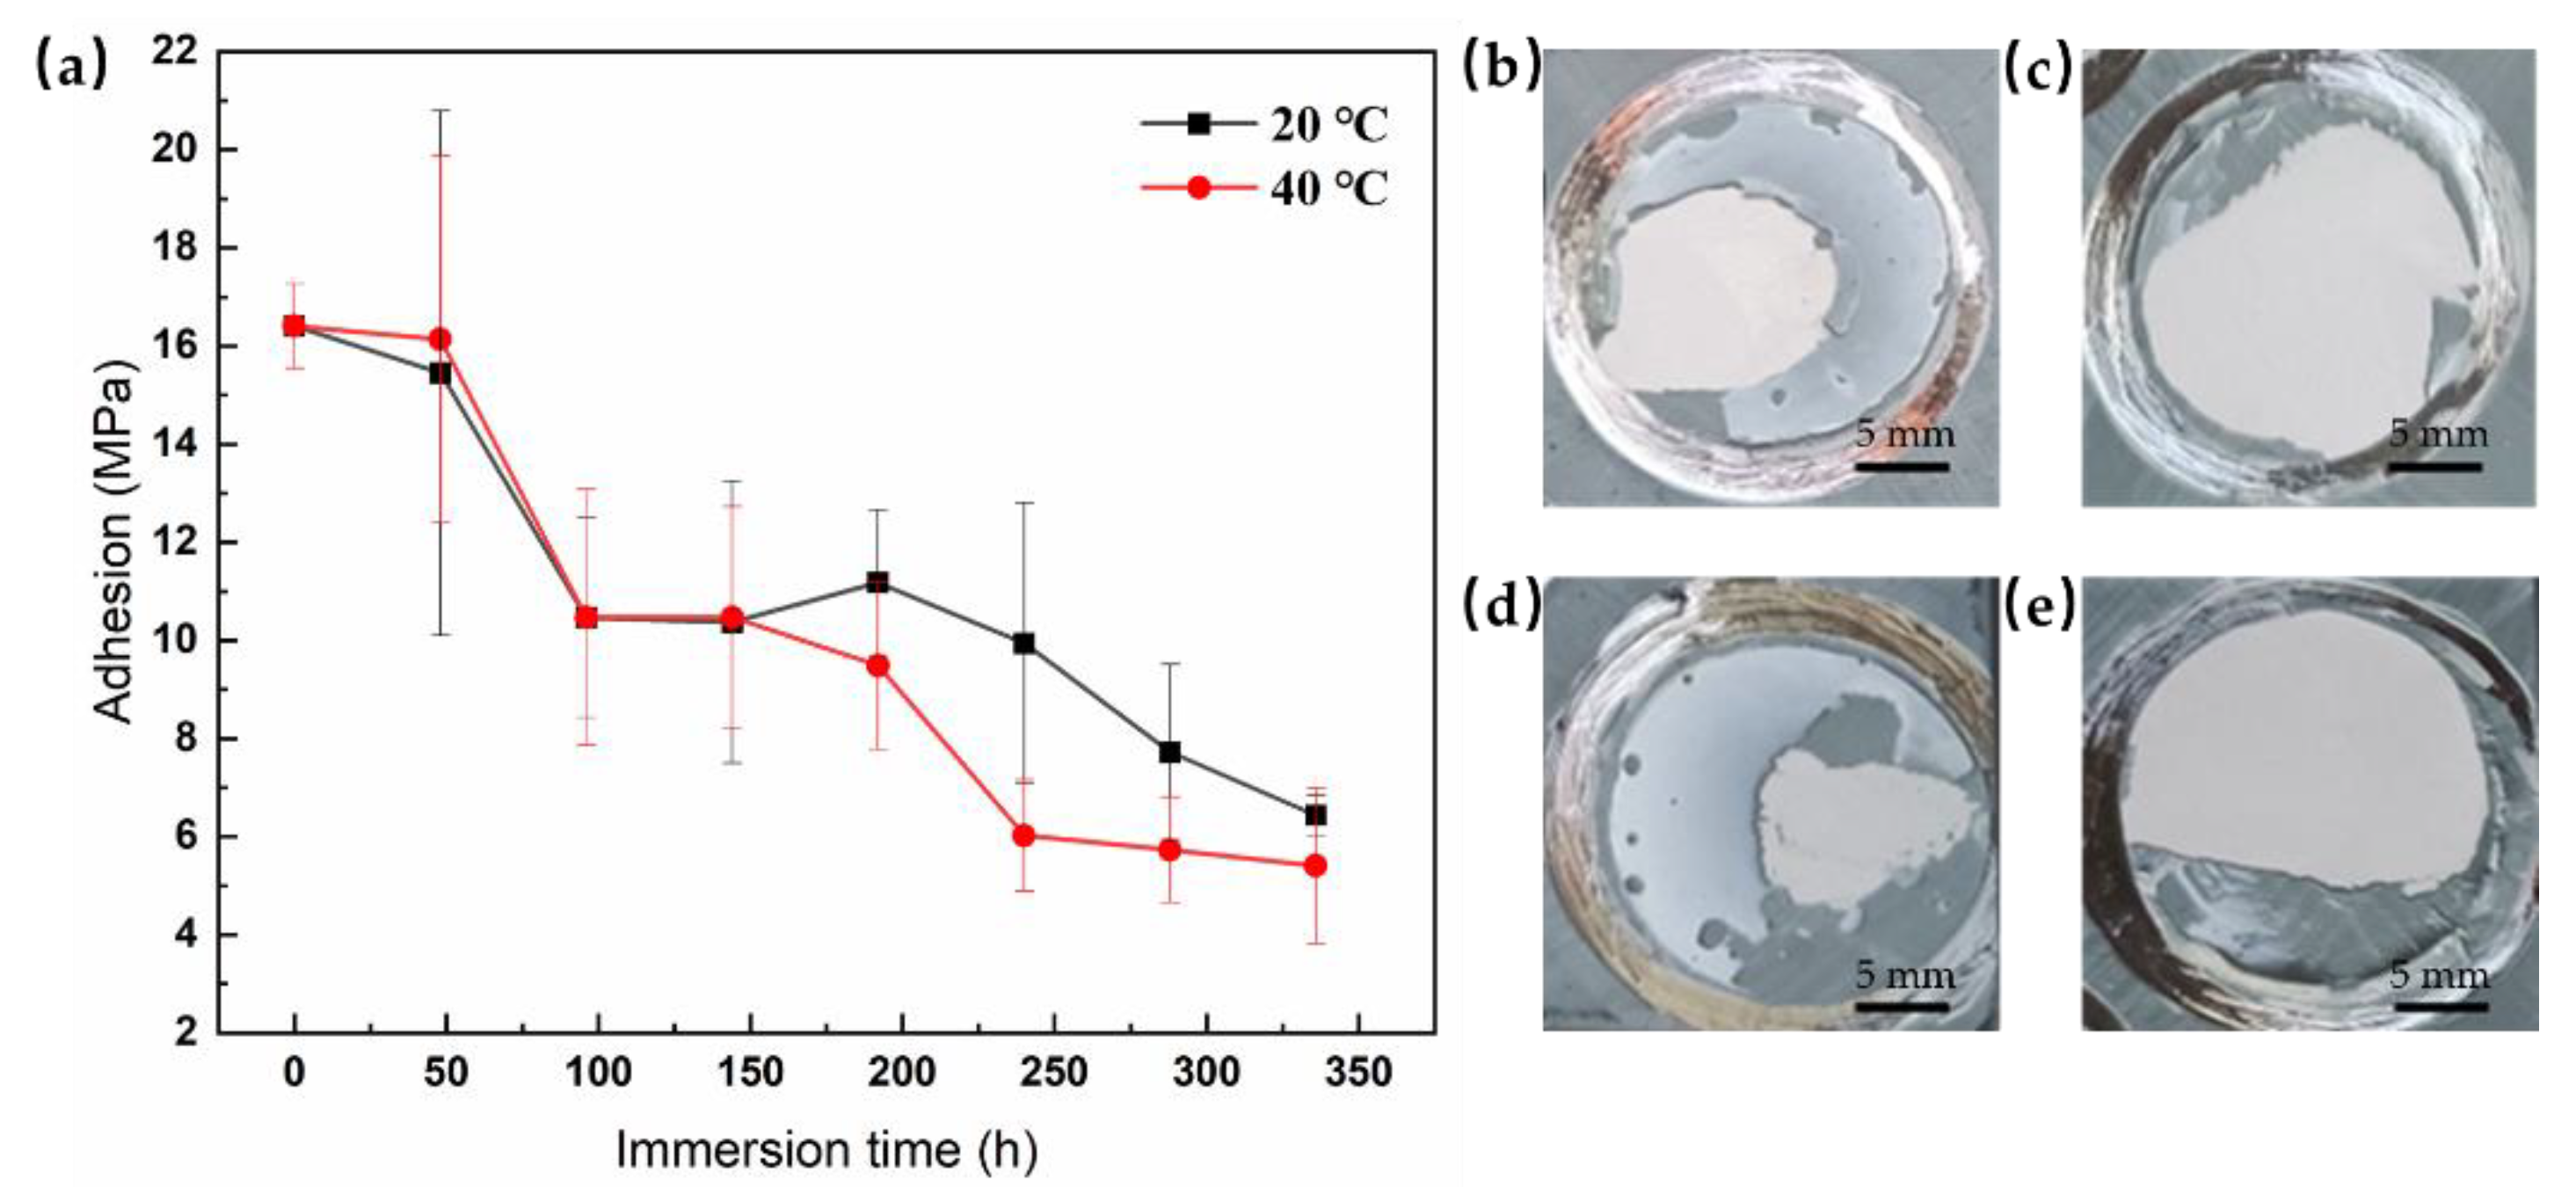
Figure 4.
(a) Typical tensile curves of electrophoretic coatings at 20 °C; (b) Typical tensile curves of electrophoretic coatings at 40 °C.
Figure 4.
(a) Typical tensile curves of electrophoretic coatings at 20 °C; (b) Typical tensile curves of electrophoretic coatings at 40 °C.
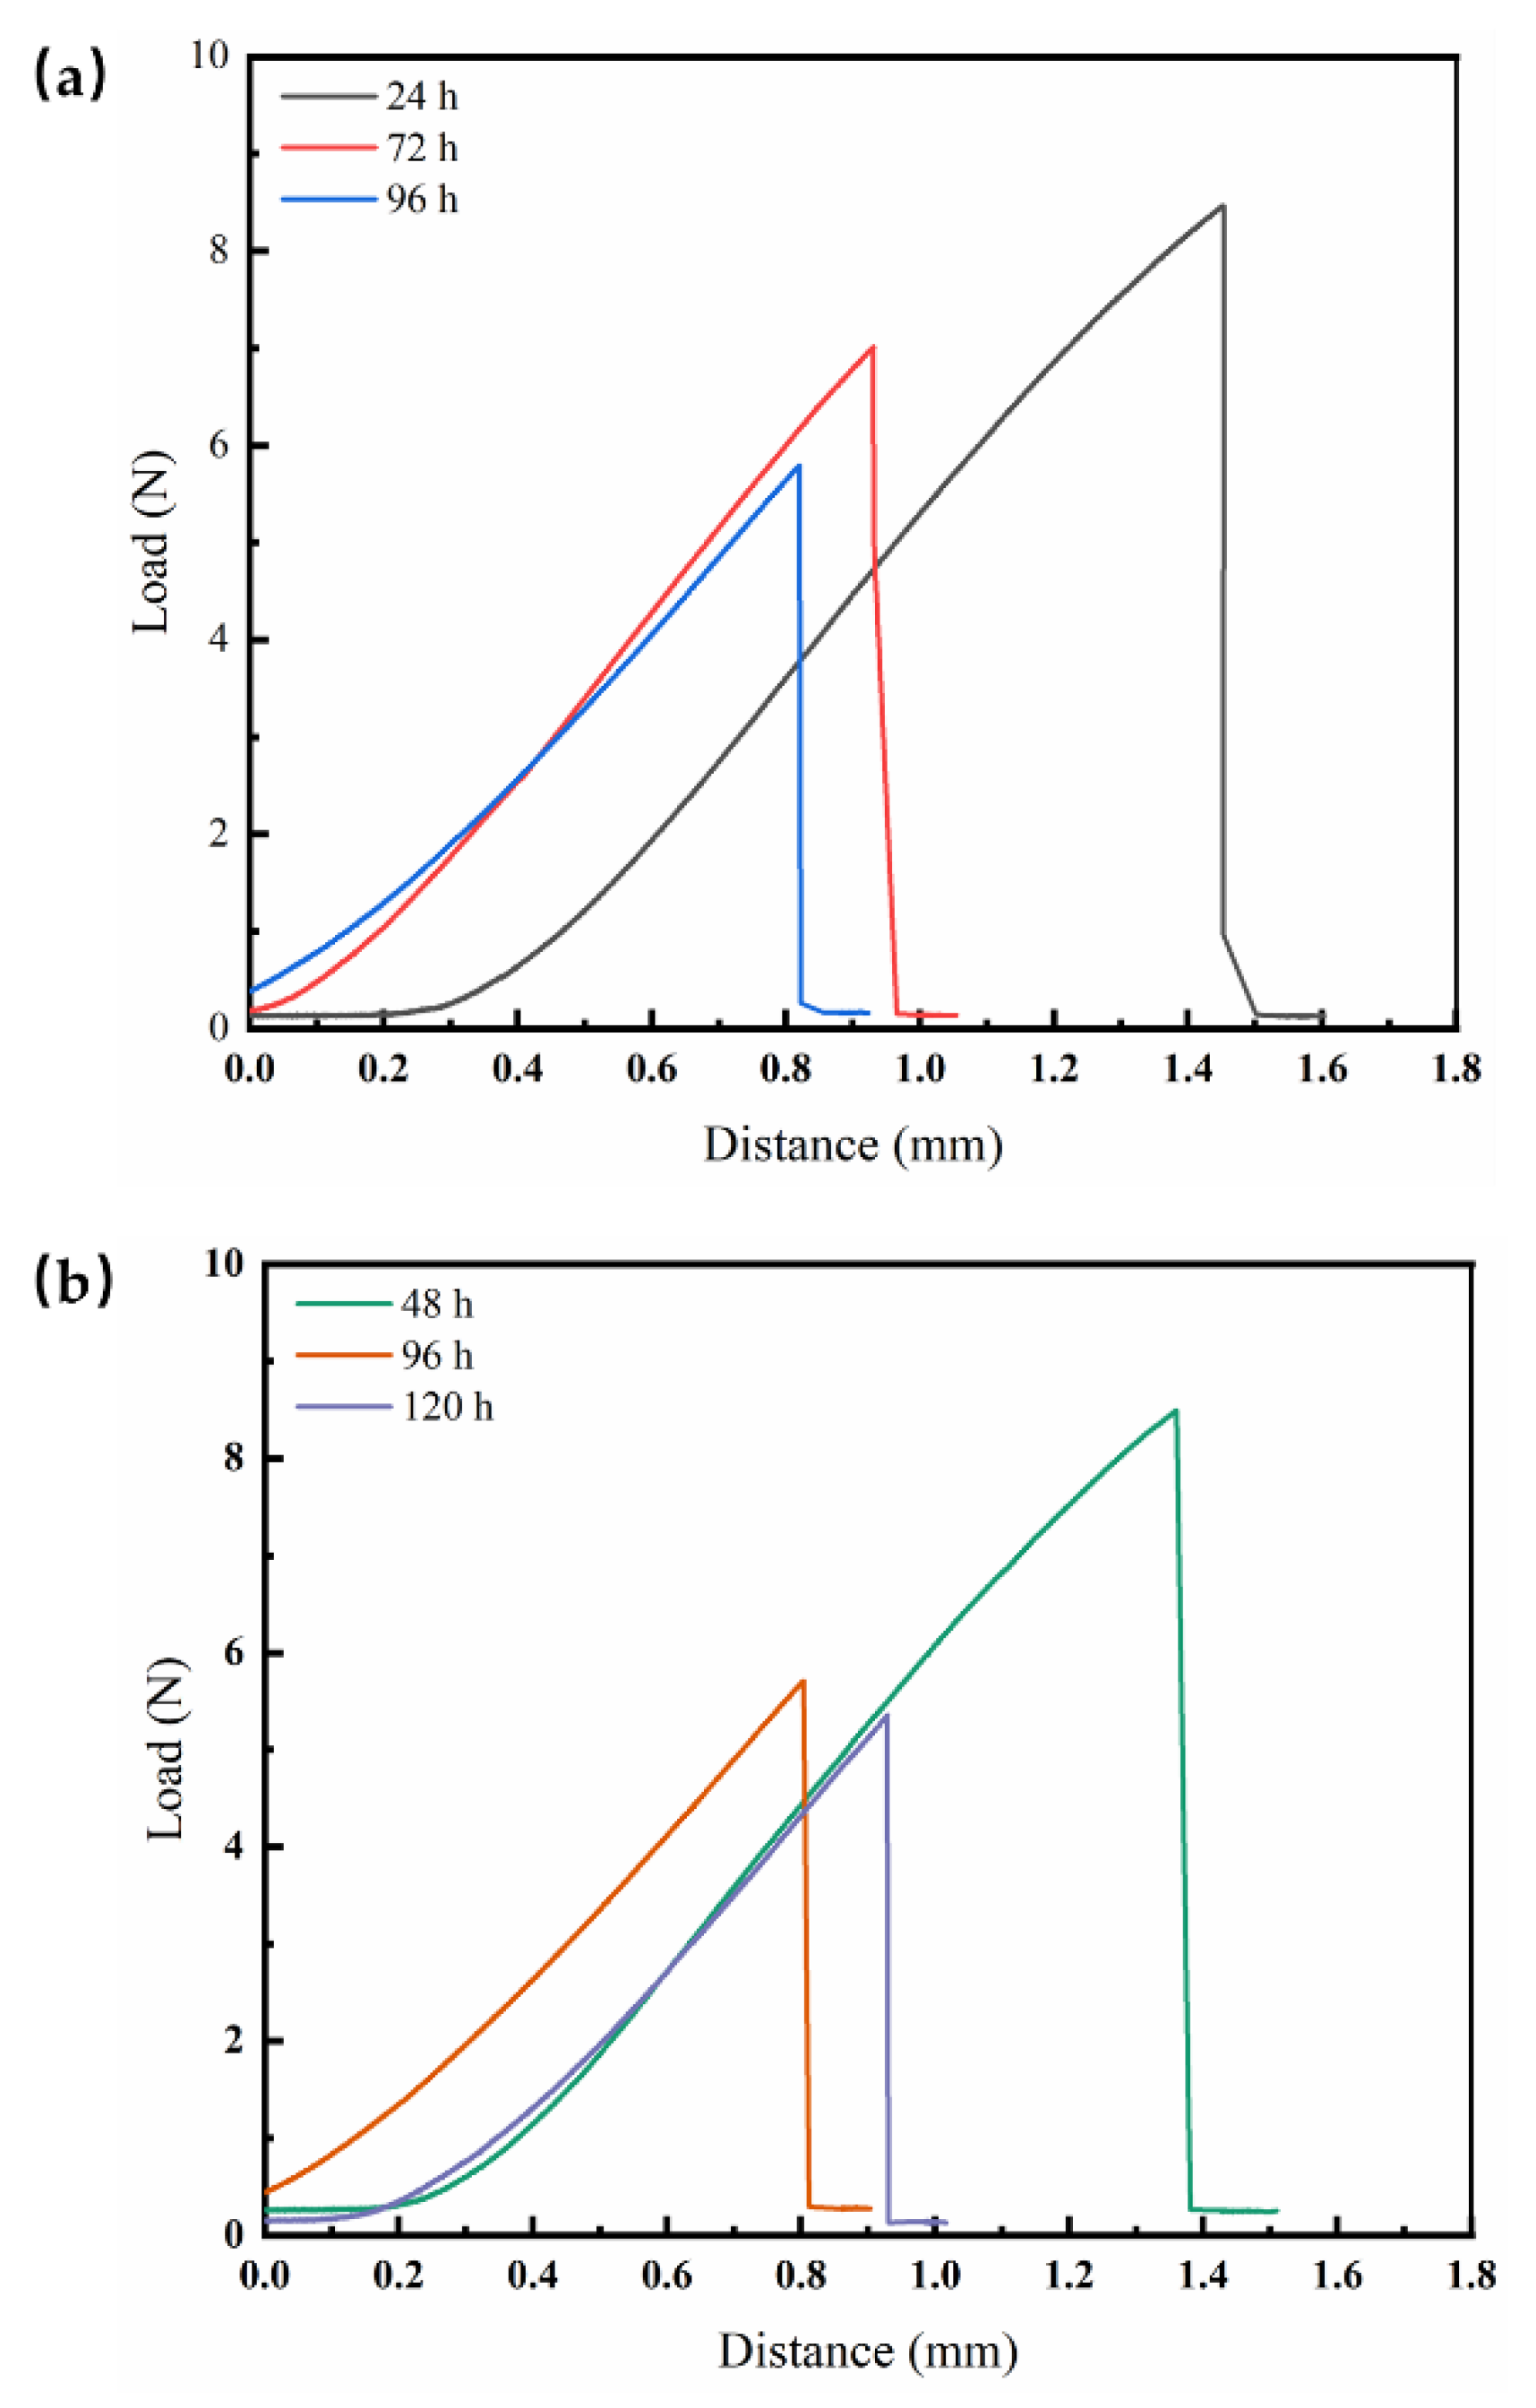
Figure 5.
The statistical curves of the tensile strength for the electrophoretic free films at two temperatures.
Figure 5.
The statistical curves of the tensile strength for the electrophoretic free films at two temperatures.
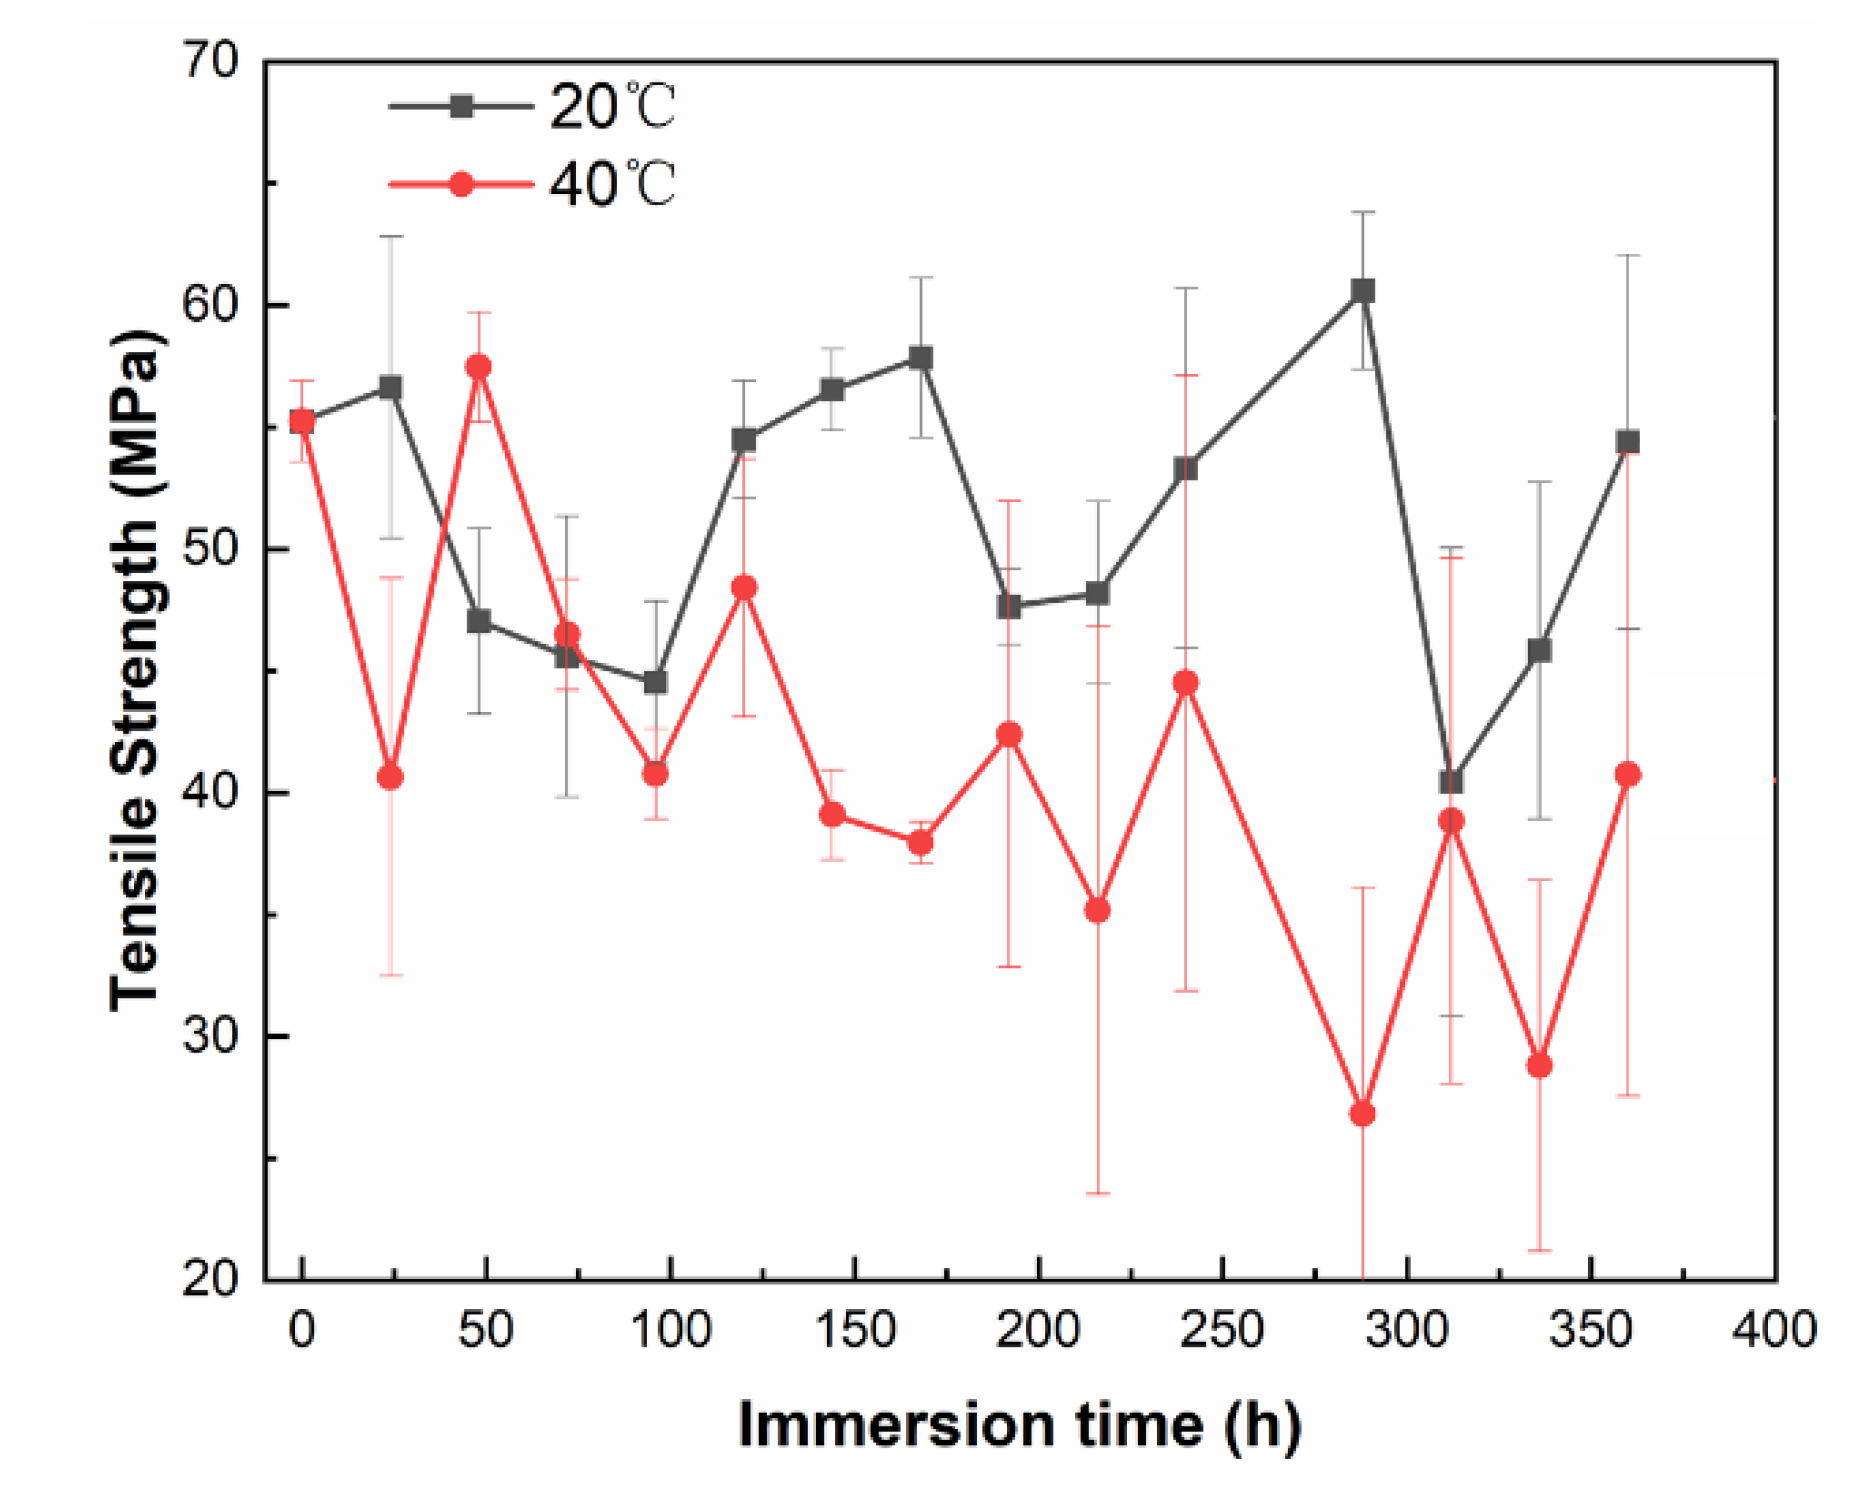
Figure 6.
(a) Time-dependent Nyquist and (b) Bode plots of the coating immersed at 20 ℃.
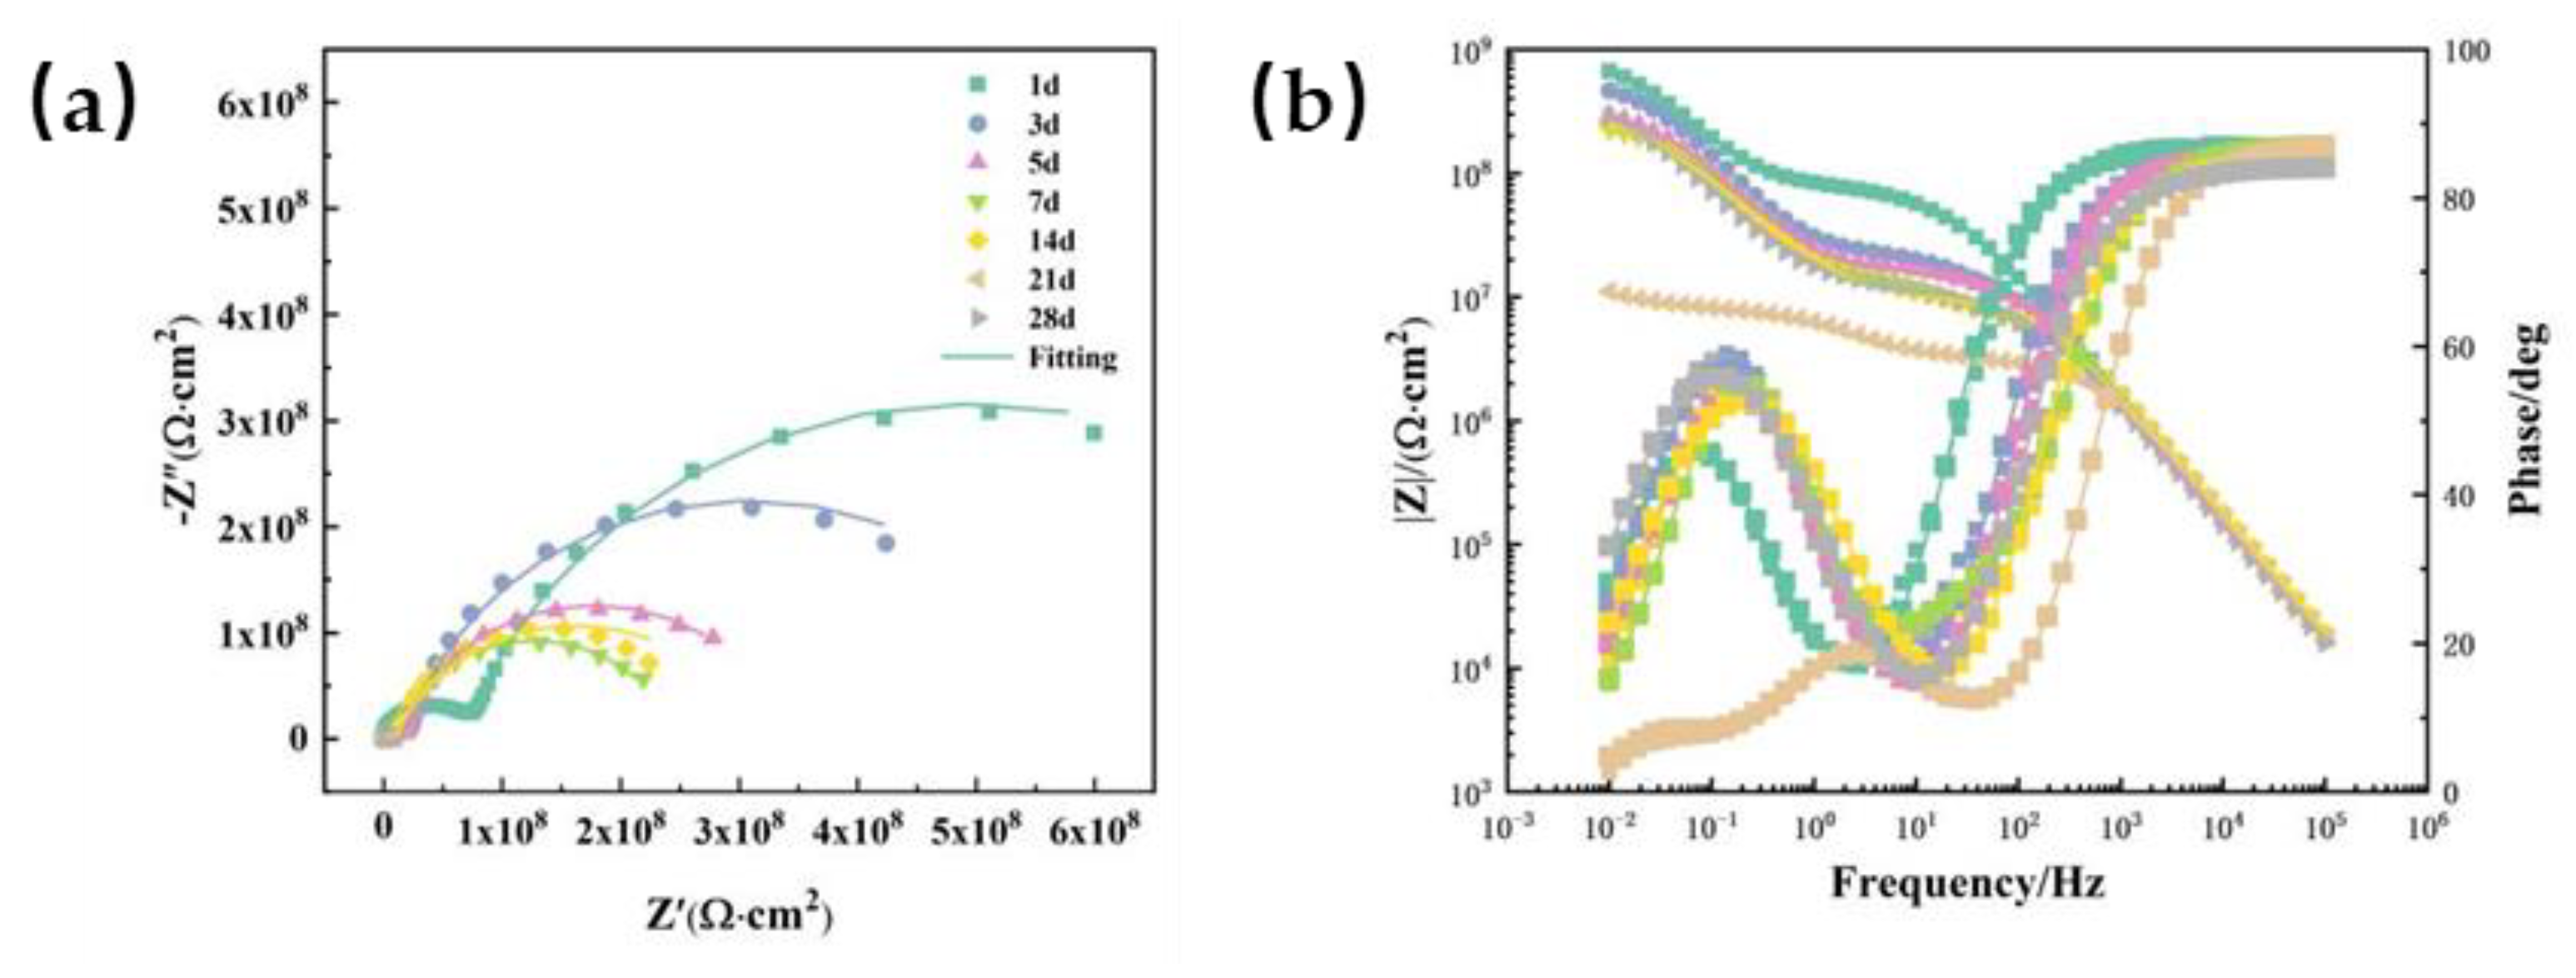
Figure 7.
(a) Time-dependent Nyquist and (b) Bode plots of the coating immersed at 40 ℃.
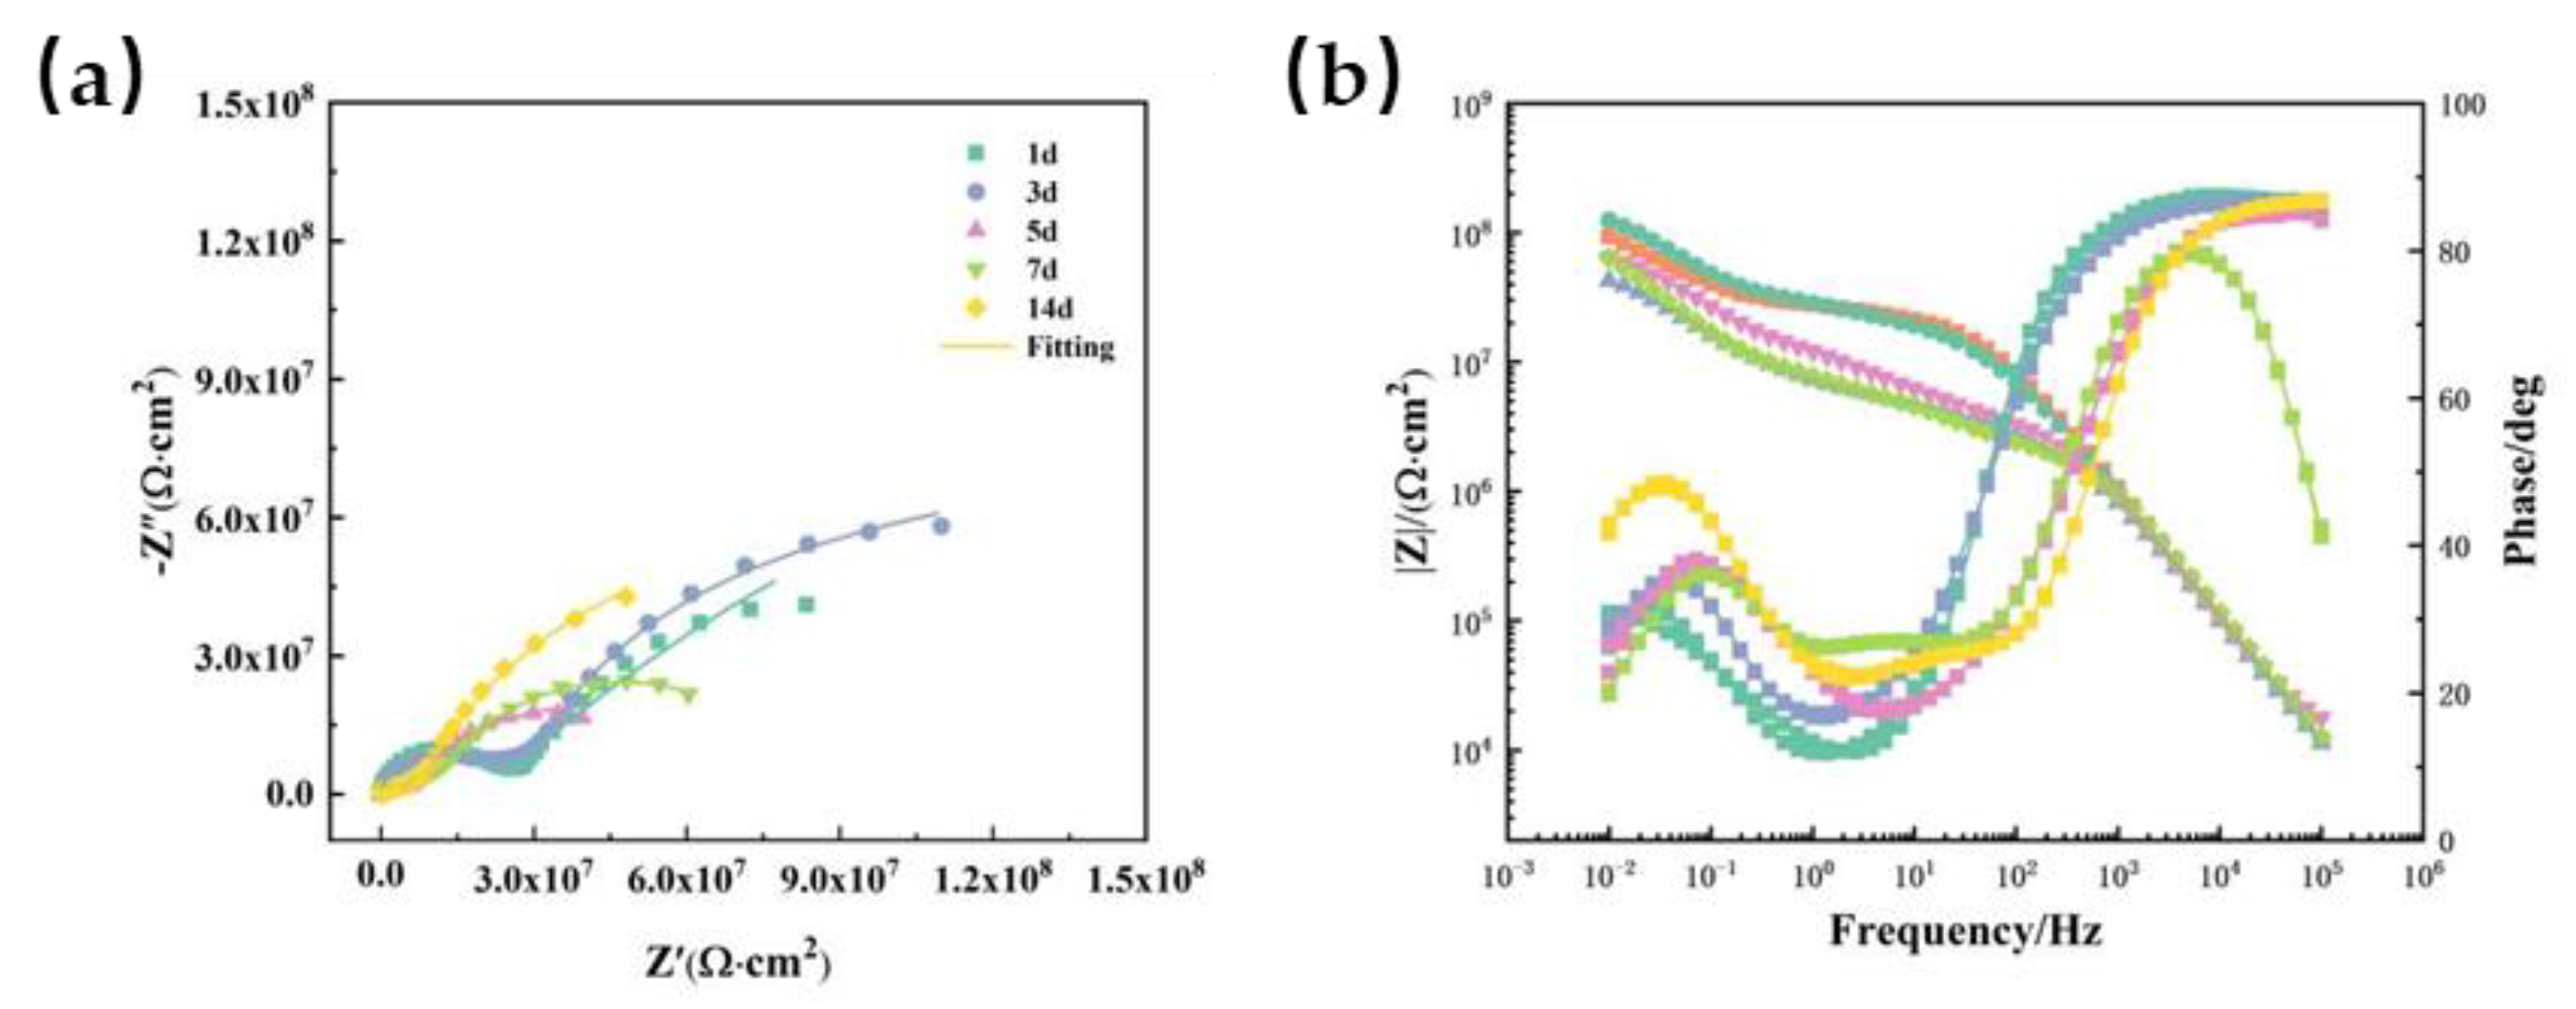

Table 1.
The data are related to the diffusion of the coating at 20 °C and 40 °C.
| Conditions | d/mm | t/h | Q∞/g | D/m2 s-1 |
|---|---|---|---|---|
| 20 °C | 0.03 | 1080 | 0.05816 | 1.817×10⁻¹⁶ |
| 40 °C | 0.03 | 228 | 0.06853 | 8.610×10⁻¹⁶ |
Table 2.
Parameters obtained from the calculations of the wet adhesion of coatings using GM(1,1) model.
Table 2.
Parameters obtained from the calculations of the wet adhesion of coatings using GM(1,1) model.
| Temp. | ∂ | u |
|---|---|---|
| 20 °C | 0.1142 | 16.8425 |
| 40 °C | 0.1916 | 19.6115 |
Table 3.
Coefficients obtained after fitting the coating strength equation.
| Conditions | S | b |
|---|---|---|
| 20 °C | 55.147 | 1.02×10⁻⁴ |
| 40 °C | 54.598 | 8.77×10⁻⁴ |
Disclaimer/Publisher’s Note: The statements, opinions and data contained in all publications are solely those of the individual author(s) and contributor(s) and not of MDPI and/or the editor(s). MDPI and/or the editor(s) disclaim responsibility for any injury to people or property resulting from any ideas, methods, instructions or products referred to in the content. |
© 2024 by the authors. Licensee MDPI, Basel, Switzerland. This article is an open access article distributed under the terms and conditions of the Creative Commons Attribution (CC BY) license (http://creativecommons.org/licenses/by/4.0/).
Copyright: This open access article is published under a Creative Commons CC BY 4.0 license, which permit the free download, distribution, and reuse, provided that the author and preprint are cited in any reuse.


