Submitted:
18 June 2024
Posted:
21 June 2024
You are already at the latest version
Abstract
Background: This study focuses on different manual handling methods and their effect on psychomotor skills concerning physical measurements (height, weight, age) and pinch strength.
Objective: To assess the effects of three manual handling techniques on psychomotor skills and to establish the prediction of pinch strength by physical measurements.
Methods: Three manual handling methods were tested: handling with a 90-degree elbow angle, handling with one hand, and handling with both hands. Psychomotor skills were quantified through handgrip strength, dexterity tests, and perceived exertion scales. Linear and random forest regression models were used to predict pinch strength from physical measurements.
Results: Handling with a 90-degree elbow angle significantly increased perceived exertion and error rates while decreasing post-task handgrip strength. The one-hand method showed the least negative effect on psychomotor abilities. Weight emerged as the most influential predictor of pinch strength, followed by height and age. The random forest regression model outperformed the linear regression model, indicating its suitability for capturing complex non-linear relationships among variables. The Random Forest Regression model excelled in predicting weight with a high R² score of 0.78, showing strong predictive power. It was moderately effective for height with an R² score of 0.42. However, it performed poorly for age prediction, with an R² score of 0.01, indicating ineffective features for predicting age.
Conclusion: The results emphasize the importance of ergonomic interventions and training programs to optimize manual handling practices, aiming to reduce physical strain and enhance worker productivity and safety. Maintaining muscle strength is crucial in older age groups due to the decline in pinch strength with age. These findings can inform intervention studies and the modification of occupational health and safety practices. Future research should aim to validate these results across diverse populations and explore additional factors influencing handgrip strength.
Keywords:
Manual handling
; Psychomotor
; RPE
; Handgrip
; O'Connor
; machine learning
; Regression
1. Introduction
Nowadays, manual handling by workers is frequently observed in many occupations and industries. Nonetheless, the manual handling by inappropriate and unprincipled methods leads to damage to different parts of the human body (e.g., arms, legs, neck, and back, disruption in psychomotor abilities, and inflammation, swelling, and even tingling) in many cases [1]. Manual handling refers to the process of manually moving, lifting, carrying or transporting objects or people. It is a common activity in many workplaces, including factories, construction sites, healthcare facilities, and warehouses. Manual handling tasks can involve a range of physical demands, including bending, twisting, reaching, pulling, pushing, and lifting heavy loads. These tasks can increase the risk of musculoskeletal injuries such as strains, sprains, and fractures, especially if they are performed repetitively, awkwardly, or in poor postures. Walsh et al. [2] evaluated the impact of carrying steady and unstable loads on muscle activity and movements during walking in people over the average age of 65 years. Their results revealed that carrying loads can change the movements and gait of older people, especially unstable load-carrying reduces dynamic stability while increasing the risk of falls.
Psychomotor skills refer to the ability to perform physical actions that require coordination between the mind and body. Walsh et al. [2] evaluated the impact of carrying steady and unstable loads on muscle activity and movements during walking in people over the average age of 65 years. Their results revealed that carrying loads can change the movements and gait of older people, especially unstable load-carrying reduces dynamic stability while increasing the risk of falls. These skills involve the integration of cognitive processes, such as perception, attention, memory, and problem-solving, with motor abilities, such as movement control, dexterity, and coordination. Psychomotor skills are essential in a wide range of activities, including sports, dance, music, art, surgery, driving, and many others.
Manual handling can have a significant impact on psychomotor skills, which are the abilities related to movement and coordination. Repeated manual handling tasks can cause fatigue and muscle strain, leading to decreased dexterity and coordination. This can affect psychomotor skills such as hand-eye coordination, timing, and balance, which are essential for performing many daily activities.
RPE, or rating of perceived exertion, is a subjective measure of the intensity of physical activity. It is typically assessed using a numerical scale, with values ranging from 0 to 10 or 6 to 20, that allows individuals to rate how hard they feel they are working during exercise or physical activity. A person's RPE can also affect their psychomotor abilities because psychomotor abilities represent a relationship between cognitive functions and physical movements. Proper psychomotor ability usually means coordination between small muscles, and hand movements typically refer to hand-finger coordination with the eye. It is noteworthy that performing complex hand skills can coordinate nerves and muscles and help develop alertness [3]. By determining the best method of manual load handling, it is possible to formulate or revise handling regulations to reduce physical harm to people and prevent them from lowering psychomotor abilities. It can also help in teaching proper handling. Individuals are forced to engage in mental work after physical activity in occupations such as truck or van driving and construction work. Accordingly, to reduce the adverse effects of manual handling on psychomotor abilities in such occupations, it is preferable to examine and prove the relationship between physical work and psychomotor skills to suggest corrective measures in this regard. Drivers' psychological issues should be considered because some mental disorders affect driving behaviors and accidents [4]. Kahol et al. [5] studied the effect of fatigue on psychomotor skills in 37 surgeons to investigate the impact of fatigue on psychomotor and cognitive abilities and found a significant decrease in addition to increasing errors (P<0.01). They concluded that attention and coordination occur in memory skill variables. Other studies have shown an association between manual skills and psychomotor abilities. For example, the results of a review of fatigue's cognitive and physical effects represented that muscle fatigue reduced muscle activity. It was further revealed that fatigue could affect cognitive functions, and there was a relationship between the intensity and position of activity and cognitive functions [6]. Similarly, Mohammed Alamoudi et al. [7] evaluated the effect of different methods of carrying loads on motor stability and spinal pressures in 20 men with an average age of 27 and 10 women with an average of 24 years. They moved in a straight line with the selected speed while simultaneously carrying 10- and 30-pound loads in different ways. The results showed that walking with a load puts more strain on the spine, and frontal and lateral methods are the most unstable conditions compared to other transportation methods. Tsao et al. [8] found that wrist fatigue significantly reduces finger and fingertip dexterity while not affecting arm-hand steadiness. It was suggested that manual assembling operations should be classified according to different work needs in psychomotor skills. Moreover, Danion [9] examined the effect of fatigue on finger coordination. More precisely, they investigated the fatigue induced by the production of the maximum isometric force for 60 seconds with four fingers and its effect on coordination. The total workforce performing 4-finger activities during fatigue decreased by 43% in the active part and 23% in the other part.
Construction psychological issues should receive particular attention because low performance may lead to some accidents and injuries. Based on previous evidence, high physical fatigue can play a role in causing mental fatigue even if the work does not involve a heavy cognitive demand. Therefore, fatigue due to physical functions can be one of the factors that impair cognitive functions and other mental functions [10]. Another study also reported an 18% decrease in efficiency while a 19% increase in reaction time in people who do heavy workloads [11]. Fattorini et al. [3] examined muscle coordination and hand fatigue using a test to assess long-term muscle activity while the person was working and vibrating. The vibration of 33 Hz and the resulting fatigue could change the movement pattern of the hand [3].
Manual handling in frontal and lateral positions may result in the most unstable status [7]. Considering that physical activities can affect psychomotor skills; this research can help find the best manual handling with minor adverse effects on psychomotor skills. To the best of our knowledge, no research has so far focused on the impact of manual load handling with different methods on psychomotor abilities. Thus, the study aims to investigate the impact of manual load handling with different methods on psychomotor abilities to find the best manual handling method with the most negligible reduction in psychomotor skills.
2. Material and Methods
2.1. Participants
This study was conducted from October 1, 2020, to November 1, 2020, and the study samples included male right-handed students (average body mass index = 26.19) who were in the age range of 19-35 years. Finally, the sample size was 34 people considering the calculation of a 0.05 error percentage, a 95% confidence level, 80% power, and a 0.5 effect size. Male students were chosen as our samples because most truck drivers and construction workers are males in Iran, and lifting heavy weights is demanding for most women. Participants were fully informed of the purpose of the experiment and agreed to participate in the study before signing the informed consent form. The criteria for entering the survey included not having musculoskeletal disorders, being a man, being a student, and being right-handed to reduce the effect of hand dominance on the task implementation.
2.2. Tools
- (a)
- O'Conner dexterity test
This test is used to check the speed of the hand to manipulate small objects and measure the degree of dexterity and eye-hand coordination. In this way, the person should insert small nails into the hole with tweezers in the shortest possible time [12,13]. It is a Fine-motor coordination test that uses tweezers and screwdrivers. Dexterity tests measure the accuracy of hand and finger movements and eye-hand coordination under controlled conditions. the time taken to complete the task, as well as the number of pins placed correctly, are recorded and used to calculate a score that reflects the individual's level of manual dexterity They help physical therapists to develop rehabilitation plans for patients and to measure the effectiveness of their programs. They can help identify and evaluate certain forms of brain damage, and identify neurologically based learning disabilities, and musculoskeletal disabilities. A study on the development of the variable dexterity test also included the O'Connor Dexterity Test and found reliability and validity estimates from 24 healthy participants [14]. (Figure 1)
- (b)
- Borg Questionnaire
The Borg Rating of Perceived Exertion (RPE) Scale is a tool used to measure an individual's level of exertion during physical activity. The scale ranges from 6 to 20, with 6 indicating no exertion at all and 20 indicating maximal exertion. The Borg Questionnaire for RPE is a set of questions designed to help individuals accurately rate their perceived exertion based on the Borg RPE scale. The questions typically ask about how hard the individual feels they are working, how heavy their breathing is, how much their muscles are fatigued, and other similar factors. The validity of the questionnaire has been tested in various studies using different methods and populations. Some studies have found a high correlation between the RPE ratings and physiological variables such as heart rate, oxygen uptake, and blood lactate [15].
- (c)
- Pinch gauge
Pinch gauge measures how much force a person can exert with their thumb and fingers. This force, known as pinch strength, is essential for many daily activities and tasks that involve fine motor skills. A pinch gauge can help assess how well a person’s hand works, identify any hand problems or injuries, track the progress and outcomes of recovery and rehabilitation, and recommend suitable treatment. We used the SAEHAN brand in Korea, which is used for measuring the power of fingers (Figure 2).
2.3. Procedure
In this study, every individual was examined by the sampling method and manually carried the load in three different statuses at random and in no order. The Ethics Committee approved this study protocol of Hamadan University of Medical Sciences (IR.UMSHA.REC.1398.832). Each person had to carry a load by hand with an angle of 90 degrees once, and the load was 15% of his body weight. They should carry a load by hand with an angle of 180 degrees and 15% of their body weight. They had to carry a load with one hand and the load amount of 7.5% of his body weight. The load was carried on the treadmill normally with a slope of 0 degrees, and each of the angles and the amount of permissible load for carrying was selected based on the MAC manual load handling test. Each test was performed for five minutes [16], and then the next day (to reduce the effects of fatigue caused by carrying the previous load), the person performed the test with a different model from the previous day. Next, the O'Connor test was performed to measure hand dexterity. The number of errors before and after each manual handling were measured. so that the person must insert the nails into the hole and each time the nails fall or are misplaced, it is a mistake. pinch gauge was used to measure the grip strength of the fingers before and after the manual handling method. Individuals pushed the pinch gauge and repeated it after each manual load handling. Then, they were also asked about the RPE and difficulty in carrying the load through the Borg scale (numerically between 6 and 20) after each manual load handling on the treadmill. The MAC method was applied to create this test [16,17]. It is considered the critical element of NIOSH since it is a simple and easy application. The method also determines the permissible weight range for different times of load transportation. Further, it considers the appropriate standard for load transportation with a time range of five seconds to more than 30 minutes, and the selected time to perform this study was five minutes. According to the permissible load determined by the MAC method, the weight of the load can be between 0 and about 17 kg. Due to the normality of the sample population and the fact that people have different weights and power, the weight of the loads was selected while considering MAC limitations and 15 and 7.5% of body weight [17,18]. Then, the data were classified in EXCEL software, and SPSS software was utilized for statistical analysis.
3. Results
According to the results (Table 1), the average time of performing the O'Connor test in manual load handling with a 90-degree elbow angle (average = 4:48) was more than other methods. In contrast, it is less than one-handed manual handling (average = 4:21) than other methods. The statistical test showed a significant difference in the time of the O'Connor test between different modes of manual handling (p≤0.05).
Based on the obtained data (Table 1), the maximum number of errors was related to handling with an elbow angle of 90 degrees (with an average of 3.56), and the minimum number of errors in manual handling with one hand (with an average of 0.68). The Repeated measure statistical test demonstrated a significant difference in the number of mistakes between different manual handling methods (p≤0.05).
The results (Table 2) further revealed that the minimum grip strength (with an average of 7.96) was observed in the handgrip strength test after carrying the load with a 90-degree elbow angle. In contrast, the maximum grip strength (average 9.23) was found after carrying the load with one hand. The statistical test showed a significant difference in grip strength in different manual handling methods (p≤0.05).
According to the findings (Table 3), the maximum and minimum RPE were observed in handling a load with a 90-degree elbow angle (with an average of 12.65) and carrying a load with one hand (with an average of 6.79), respectively. The statistical test (repeated measure) represented the significant difference in RPE among different manual handling methods (p≤0.05).
A paired T-test was used to compare different methods (two by two) of manual handling are listed in Table 4. The results demonstrated a significant difference between carrying a load with one hand, carrying a load with a 90-degree elbow angle, and carrying a load with a 180-degree elbow angle in all dependent variables. However, the time and Errors of carrying the load with one hand and at an angle of 180 degrees during the O'Connor test were not significant.
We used regression analysis to find the relationship between physical measurement and variables that show the performance.
Table 5 shows the relationship between the physical measurements and the number of errors.
The R-squared value is 0.047, 0.095, 0.123, and 0.159 indicating that only 4.7%, 9.5%, 12.3%, and 15.9% (respectively) of the variance in Errors can be explained by the physical measurements. Any of the physical measurements are not significant predictors of Errors as indicated by the high p-values.
The relationship shows between the physical measurements and the O’Connor test implementation time.
All p-values are higher than 0.05, therefore there is no relationship between the duration of doing the physical measurements and the O’Connor test.
Table 7 shows the relationship between pinch strength and physical measurements.
The R-squared values are 0.829,0.812,0.825 and 0.801 indicating that 82.9%, 81.2%, 82.5%, and 80.1 % (respectively) of the variances can be explained by the physical measurements. The consistent significance of weight as a predictor across all pinch strengths highlights its critical role. Height and age also significantly contribute to the models, suggesting that these physical attributes are important determinants of pinch strength. This analysis provides a solid basis for understanding the impact of physical characteristics on pinch strength and could inform further studies or practical applications in fields like ergonomics or rehabilitation.
Weight consistently shows a highly significant positive effect on all pinch strength measurements. This means that as weight increases, so does the strength in pinch measurements, indicating a strong correlation between body mass and the ability to exert force in these measurements.
Age consistently has a significant negative effect on all pinch strength measurements. As age increases, pinch strength decreases, suggesting that aging has a detrimental impact on the ability to generate force, possibly due to muscle degeneration or reduced physical capabilities over time.
Height shows a positive effect on pinch strength measurements, but the level of significance varies across different types of pinch measurements. This variability suggests that while height generally contributes to greater pinch strength, its impact may not be uniformly significant across all types of pinch strength tests.
As there are significant relationships between pinch strength and physical parameters, we did machine learning processes on the pinch strength data.
Steps in doing Machine learning analysis:
Figure 3.
Machine learning steps.
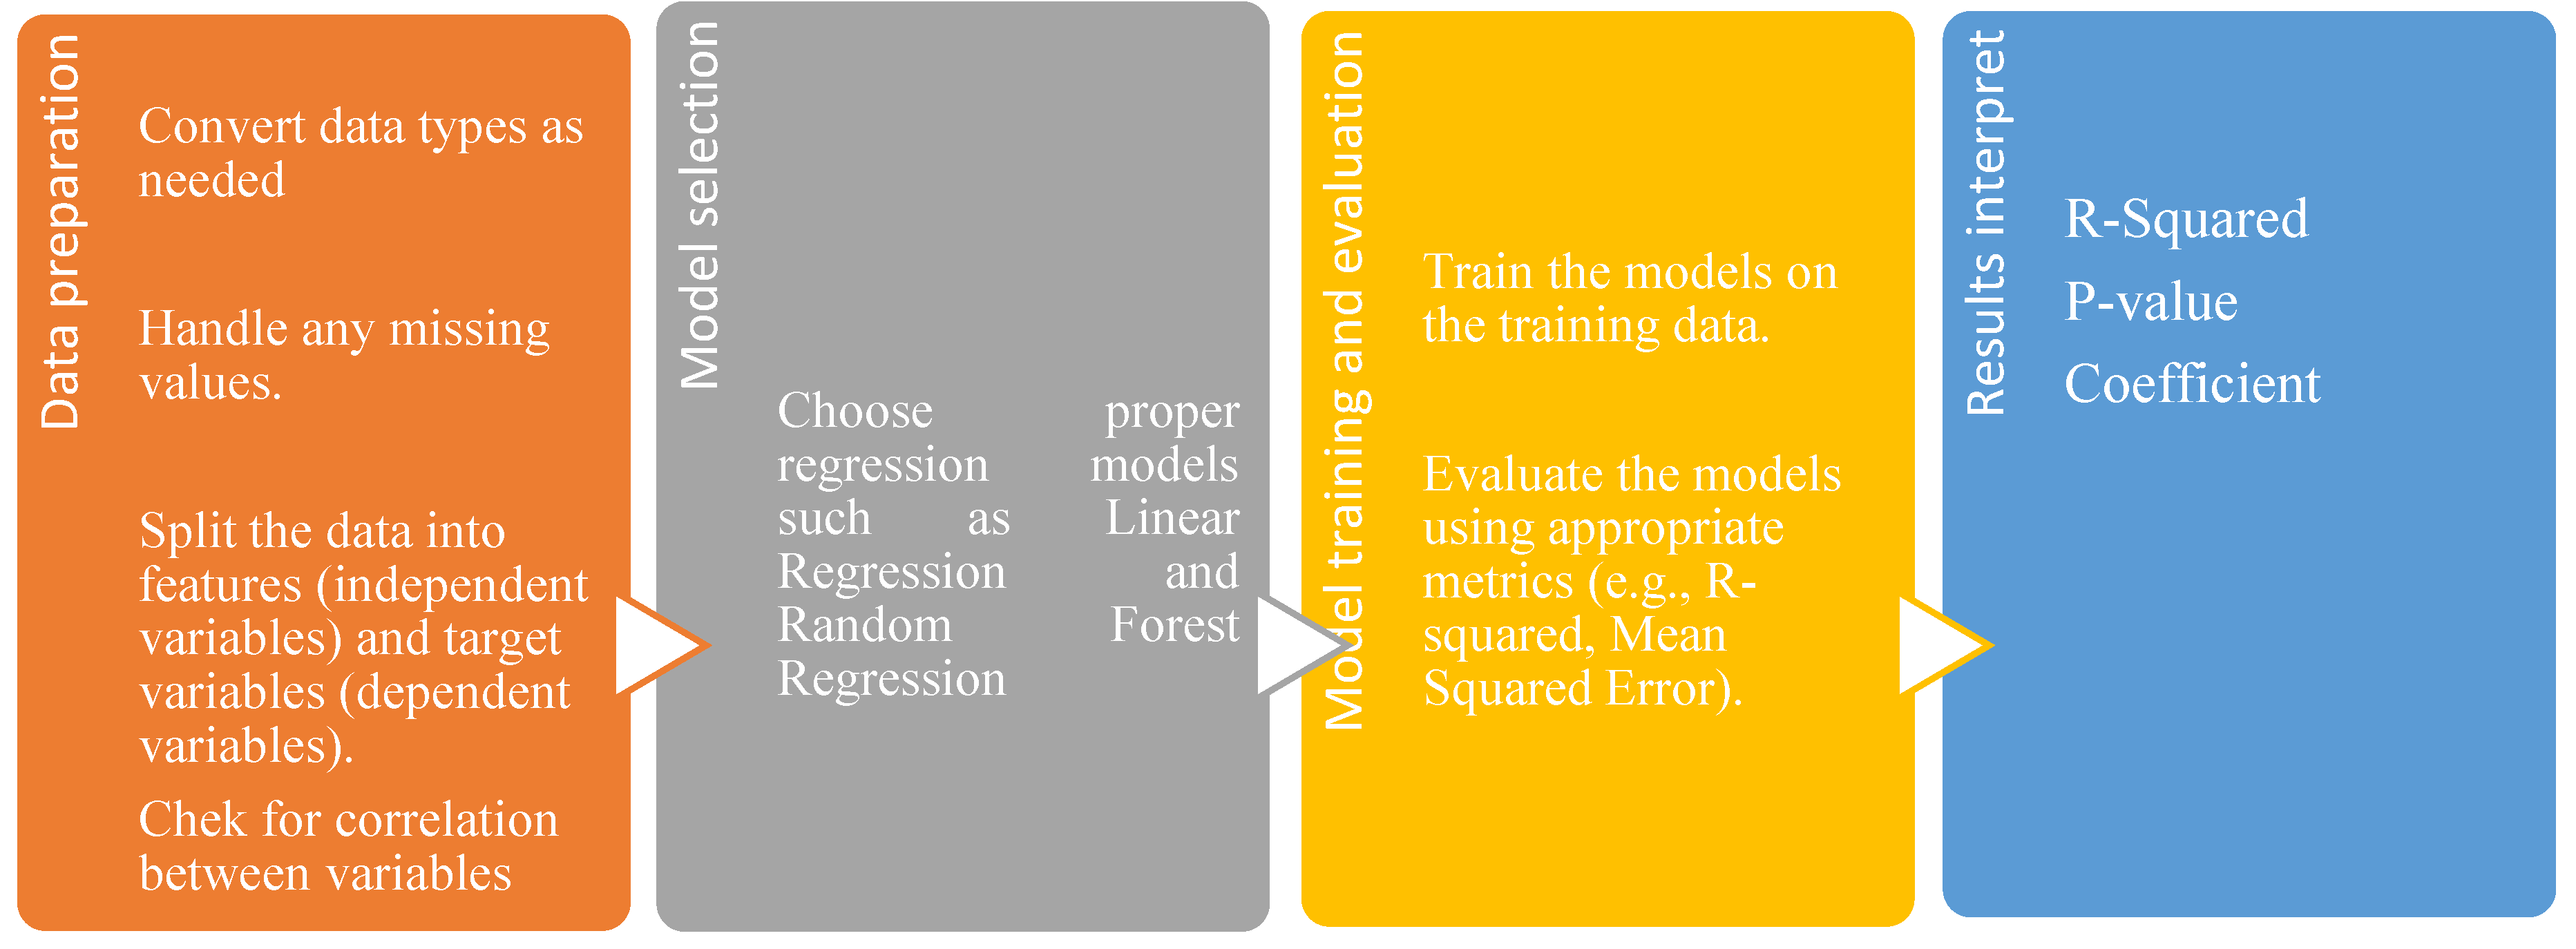
We chose two regression models for prediction tasks: Linear Regression and Random Forest regression. First, these two models need to be compared to understand which model can predict the variables more accurately.
Mean Absolute Error (MAE): measures the average magnitude of errors between predicted and actual values, ignoring their direction. It is useful when all errors are treated equally, offering a clear and interpretable metric.
Mean Squared Error (MSE): It calculates the average of the squares of the errors. Squaring the errors magnifies larger errors, making MSE sensitive to outliers. It is often used in optimization processes to penalize larger errors more severely.
Root Mean Squared Error (RMSE): It is the square root of MSE, bringing the error measurement back to the same units as the target variable. It provides an easily interpretable metric, balancing the units and the magnitude of errors.
R-squared (R²): It shows the proportion of variance in the dependent variable explained by the independent variables. It ranges from 0 to 1, with higher values indicating better model fit. It helps to understand how well the model captures the variation in the data.
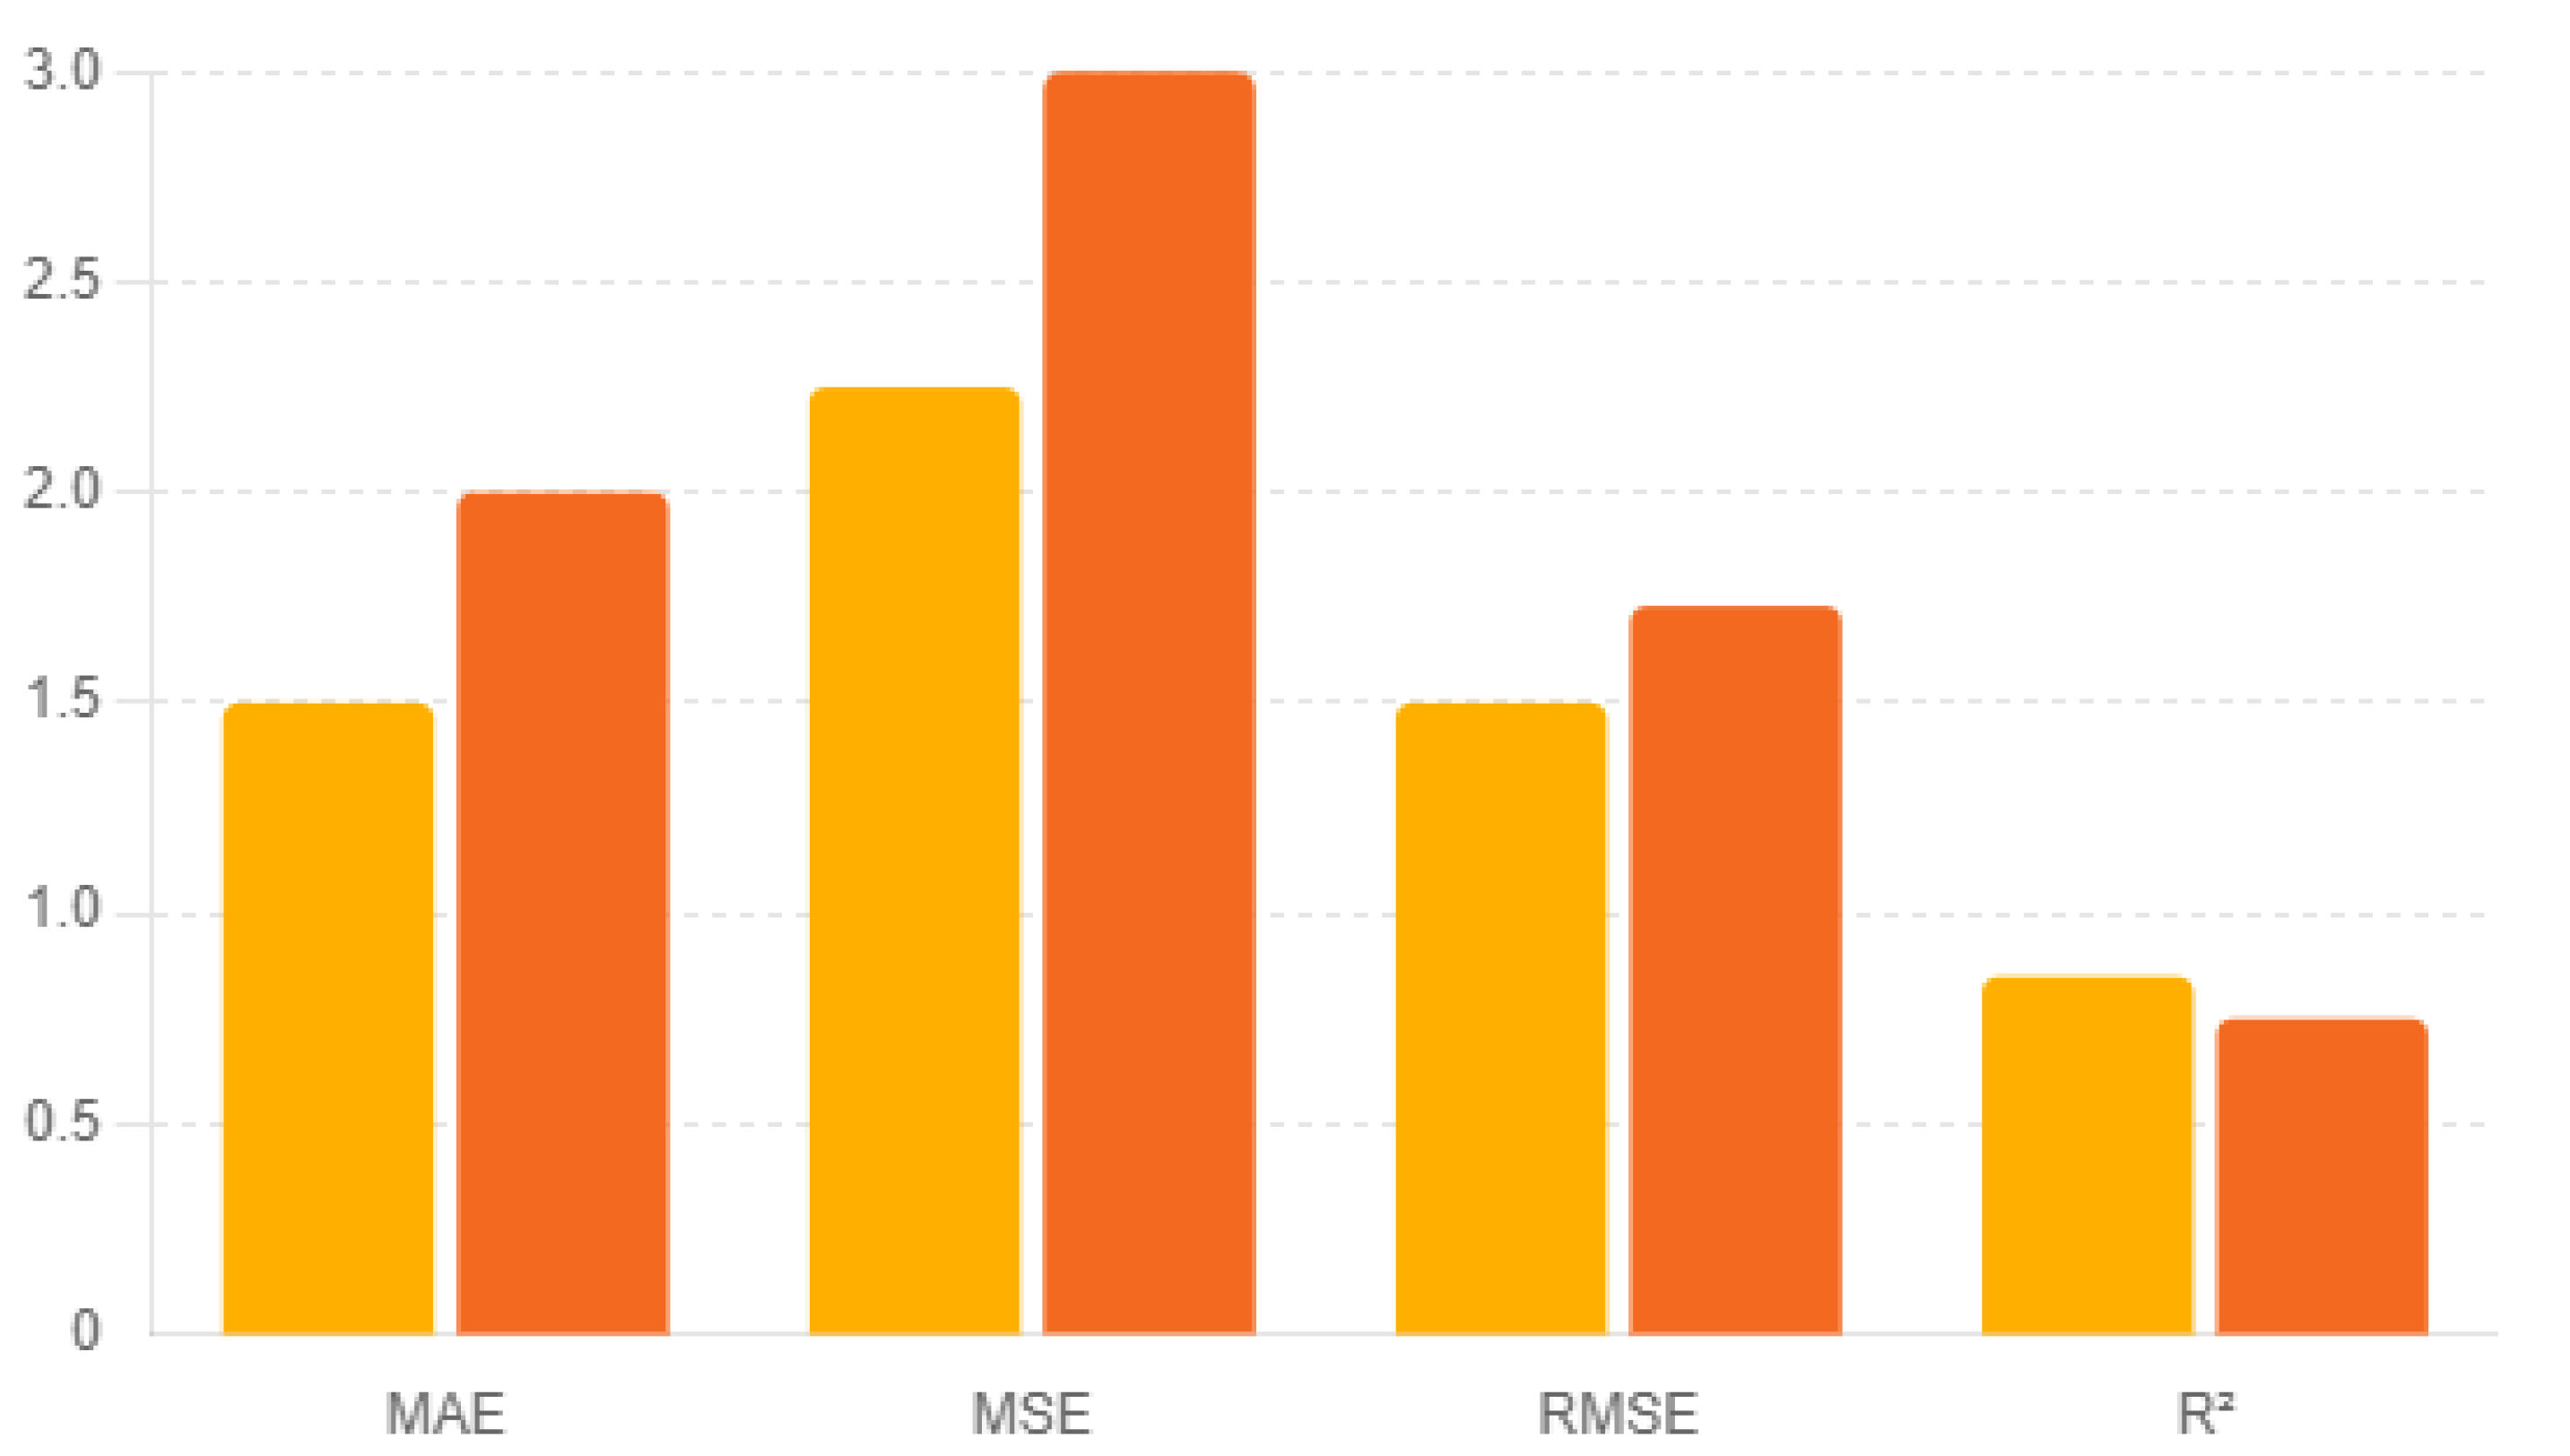
Table 8 shows the regression metrics comparison.
Figure 4.
Regression metrics comparison.
Interpretation:
Regarding MAE, the Random Forest model, with its lower MAE, indicates predictions that are closer to the actual values compared to the Linear Regression model. This suggests that Random Forest is more accurate and reliable. Regarding MSE, The Random Forest model has a lower MSE, indicating smaller average squared differences between predicted and actual values compared to the Linear Regression model. This suggests it better minimizes larger errors. Regarding RMSE, a lower RMSE for Random Forest indicates that its predictions are closer to actual values. Since RMSE is in the same units as the target variable, it confirms Random Forest's better predictive accuracy, and regarding R-squared, The R² value for Random Forest is higher, explaining 85% of the variance in the target variable, compared to 75% by the Linear Regression model. This indicates a better fit for Random Forest.
However, the results show Random Forest regression is a better predictor, we will use both Random Forest and linear regression to find the relationships as both are good predictors, but we will focus on Random Forest regression with more details and comprehensively.
General formula for multiple linear regression is:
is the value of the dependent variable
is the value of the independent variable
is regression coefficient
is error t.
Therefore, the Regression formula for prediction pinch strengths are shown:
Pinch 0°= -12.89 +0.0463×Height+0.173×Weight−0.0751×Age
Pinch 90°=Intercept+0.0428×Height+0.168×Weight−0.0725×Age
Pinch 180°=Intercept+0.0489×Height+0.179×Weight−0.0773×Age
Pinch One Hand=Intercept+0.0452×Height+0.170×Weight−0.0734×Age

Table 9.
Linear Regression.
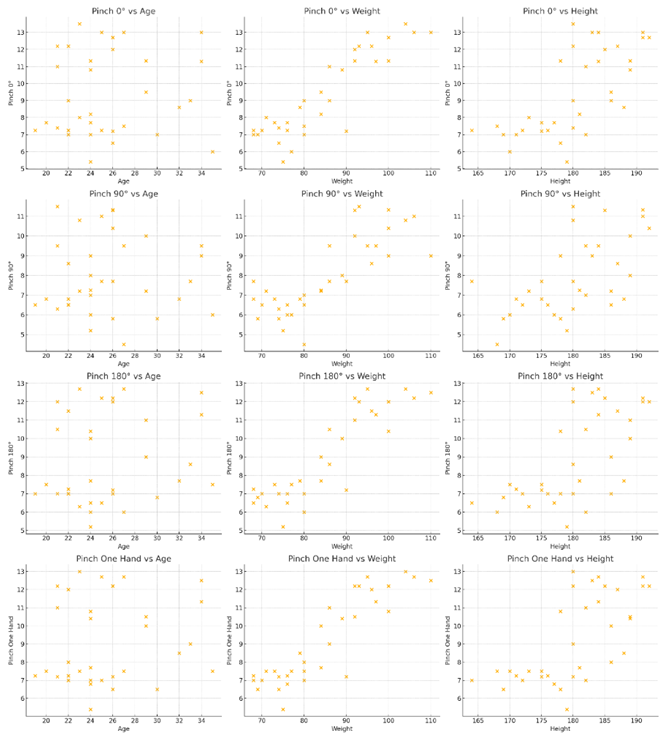
Table 10.
Random Forest Regression metrics.
| Height | Weight | Age | |
| Metric | |||
| MSE | 13.89 | 18.7 | 13.18 |
| R-squared | 0.41 | 0.77 | 0.012 |
The Random Forest Regression model excelled in predicting weight with a high R² score of 0.78, showing strong predictive power. It was moderately effective for height with an R² score of 0.42. However, it performed poorly for age prediction, with an R² score of 0.01, indicating ineffective features for predicting age.
Figure 5.
Predicted values.

Figure 6.
Feature importance.
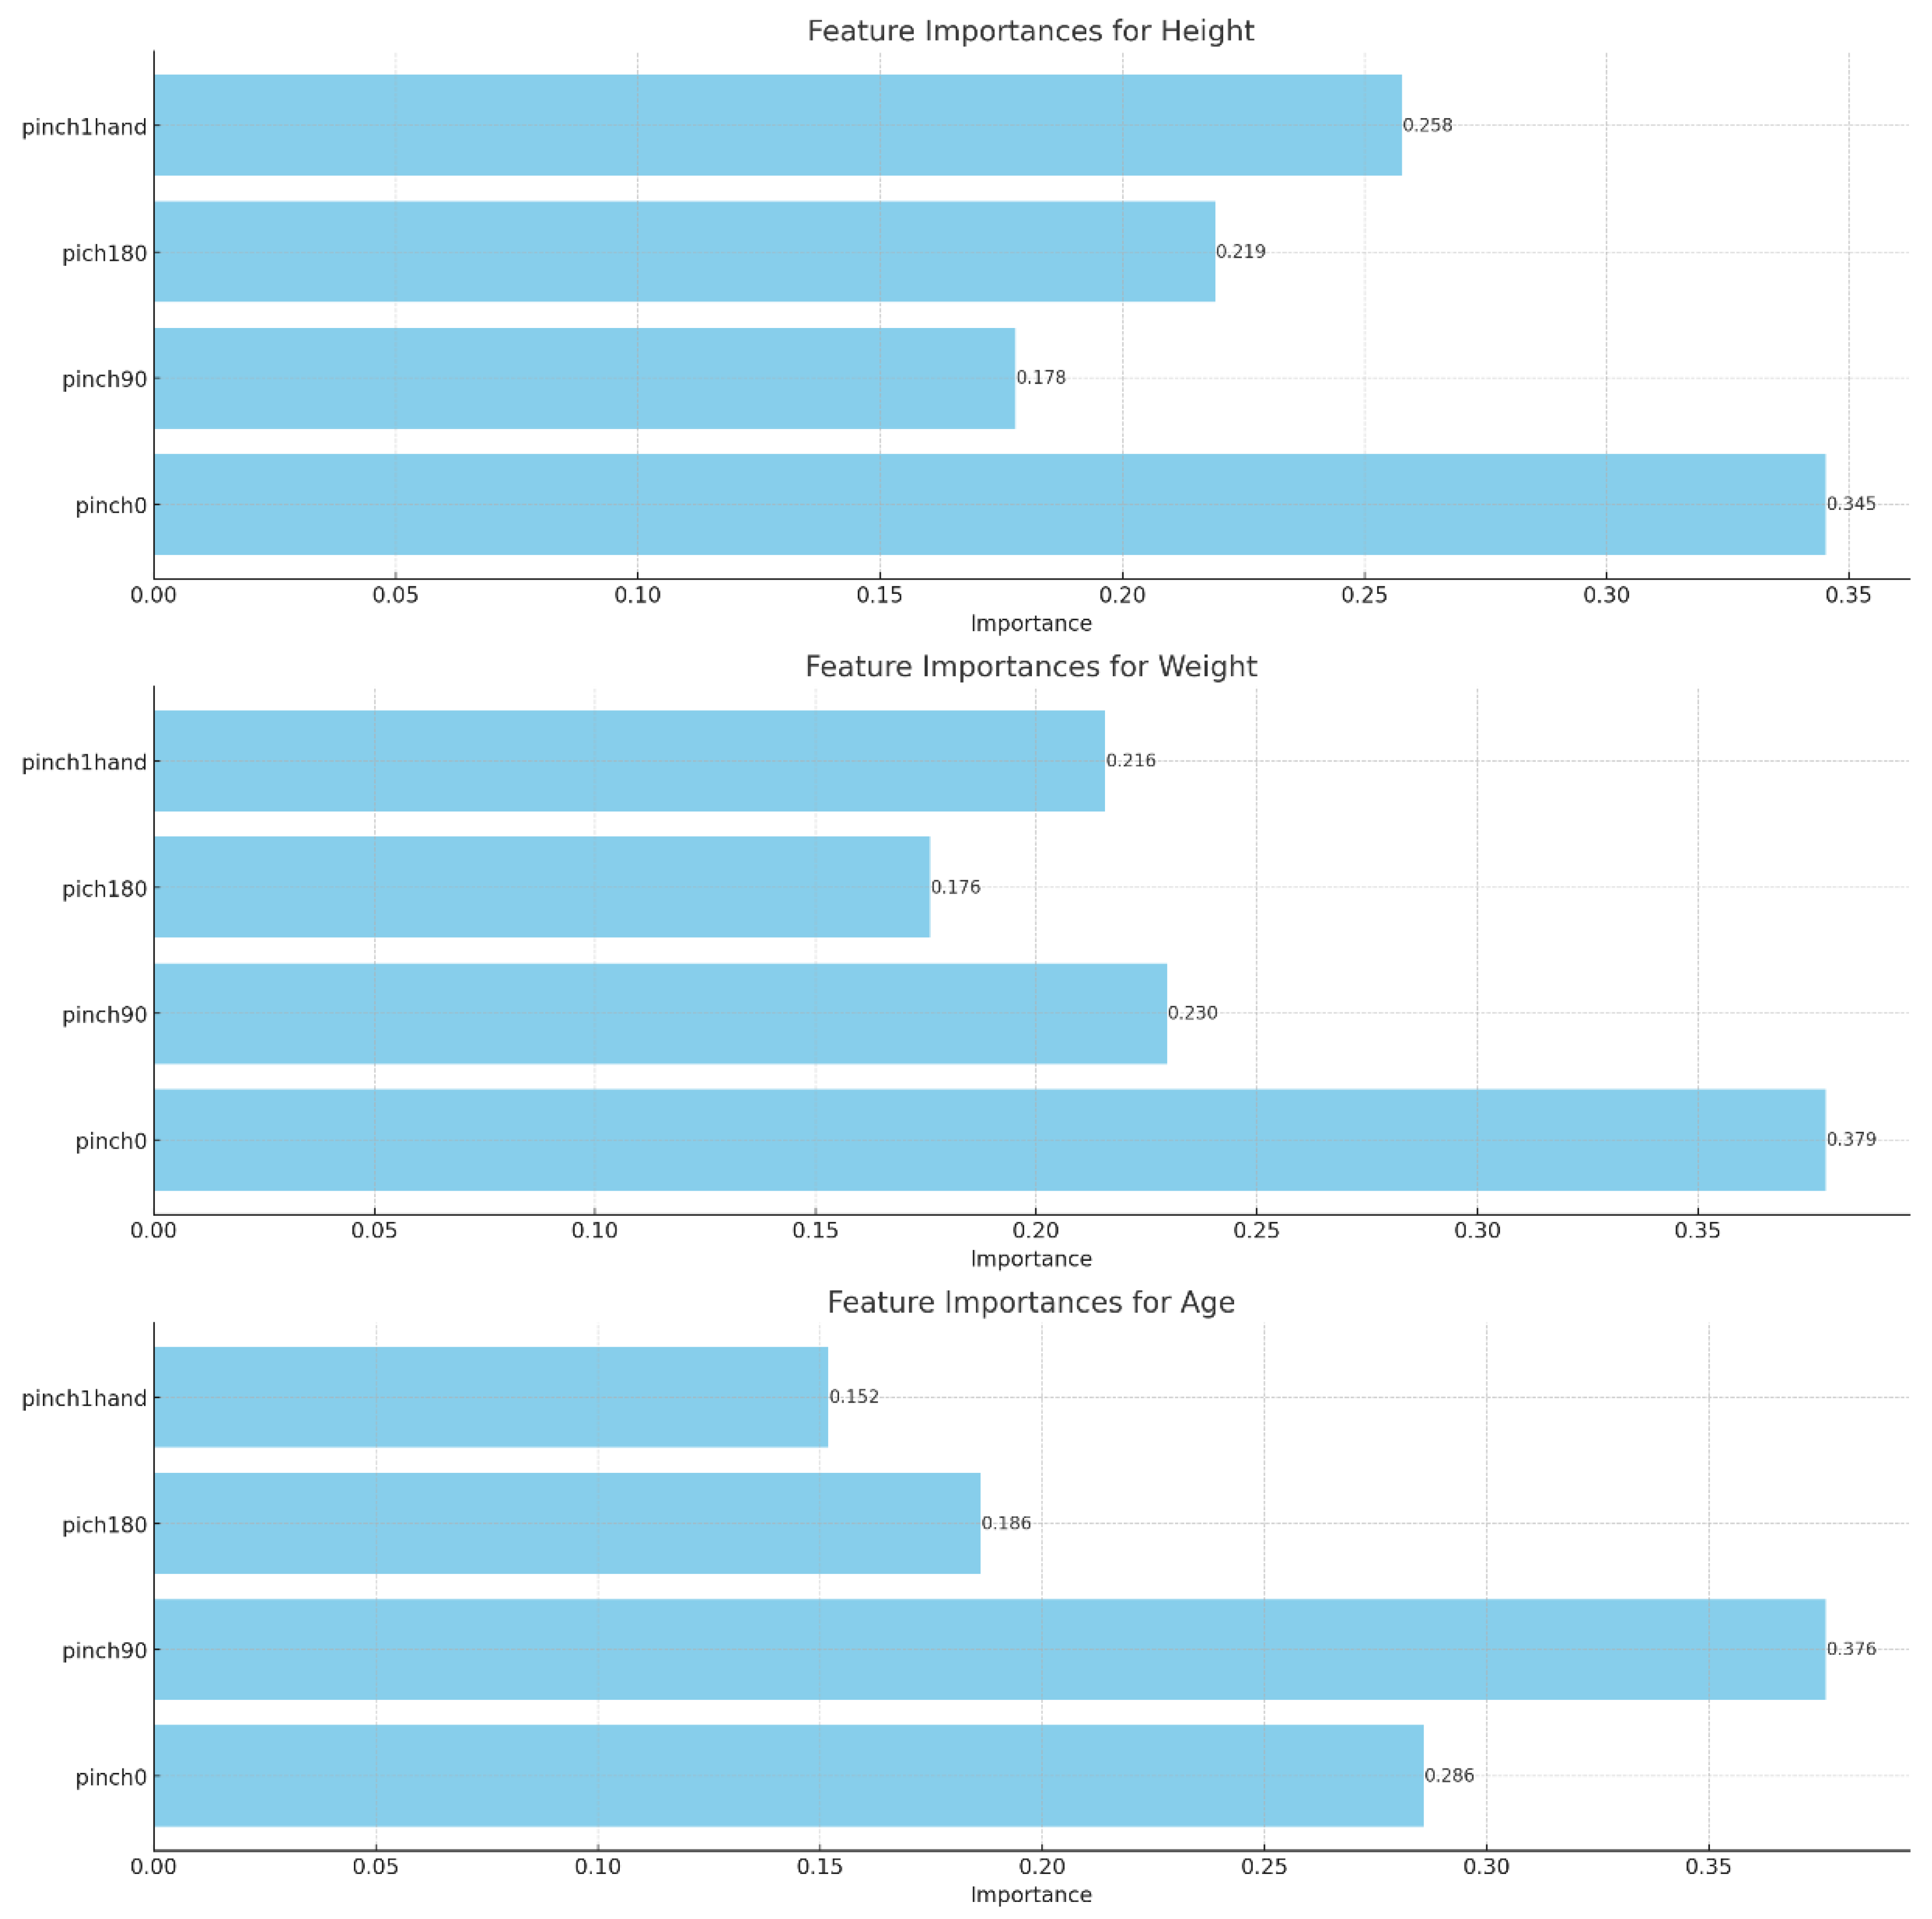
The more important predictor is feature pinch0 for all targets (Height: 0.345, Weight: 0.379, Age: 0.376). The next best is Height pinch1hand (0.258) and pich180 (0.219). For Weight, the important ones are pinch90 (0.230) and pinch1hand (0.216). For Age, the key one are pinch90 (0.286), pich180 (0.186), and pinch1hand. This is evidence that pinch0 has the most predictive power in general, whereas the importance of other features is target-specific, so they have different weights in different predictions.
Random Forest Regression uses an ensemble of decision trees, averaging their predictions rather than producing a single formula. Here's a simplified conceptual formula based on feature importance:
Height=0.345×pinch0+0.178×pinch90+0.219×pich180+0.258×pinch1hand
Weight=0.379×pinch0+0.230×pinch90+0.176×pich180+0.216×pinch1hand
Age=0.286×pinch0+0.376×pinch90+0.186×pich180+0.152×pinch1hand
4. Discussion
In this study, manual handling was performed by three methods according to the standards of the manual handling evaluation method. The O'Connor, grip strength, and RPE were taken with 90 and 180-degree elbow angles and one hand. Based on the performed experiments in this research, the worst method of manual handling among the three mentioned methods was manual handling with a 90-degree elbow angle (p≤0.05). The relationship between physical measurements and performance in manual handling tasks discloses critical remarks for ergonomic practices and occupational health. This work elaborates on how the various ways of manual handling affected psychomotor skills, grip strength, and perceived exertion. It mainly brings out the very adverse effects of handling loads at a 90-degree angle of the elbow compared to a 180-degree angle of the elbow or using one hand. Also, this study was aimed at establishing a relationship between physical measurements (height, weight, and age) and pinch strength to use linear regression and random forest regression models for the prediction of pinch strength from the mentioned physical parameters. The results are significant since it shows what might have influenced handgrip strength.
The analyses using the regression showed that there was a significantly positive impact on all measurements of pinch strength by the variable of weight. Thus, better pinch strength should be expected in subjects with a higher body mass. The strong relationship between weight and pinch strength is probably due to greater muscle mass directly related to the more significant body weight, leading to more force generation. This finding agrees with other studies showing a positive relationship between body mass and muscle strength
The grip strength of the hand decreased sharply after handling the load at a 90-degree angle (Table 2, with an average of 7.96), and the type of load handling and elbow angle was for the grip strength of the hand p≤0.05). This implies that carrying a load reduces a person's ability to perform physical tasks by hand and carrying a load at a 90-degree elbow angle has a more significant impact on a person's overall hand abilities. The results of this study are in line with the findings of Sherry et al. The results showed that elbow strain is associated with reductions in biceps activities with increases in triceps activities. The ulnar collateral ligament alone cannot withstand the pressure of the deflection of heavy loads. Therefore, the triceps, the wrist flexor joint, and the anconeus (the muscle behind the elbow joint) may act as dynamic stabilizers to help the parallel ulnar ligament prevent overload distortion. The whole hand will be affected accordingly [19]. In another study by Tsao et al [8], local arm muscle fatigue was found to affect sensory-motor skills. Although individuals can coordinate motor units to compensate for the effects of muscle fatigue, this ratio is limited, and the person becomes more tired after a while. The applied peak weight to the elbow joint along the axis of the arm is on average 45% of the body weight for the normal position of the hand, and this amount significantly reduces if the hands are higher than average [20].
The time of conducting the test after carrying the load with a 90-degree elbow angle was higher compared to other cases (according to Table 1, it was 4:38 on average), and a significant difference was observed between the time of conducting the test and the way of handling the load (P≤0.05). there was a significant difference between the manual carrying of the load with 90° and 180° elbow angles, as well as between carrying the load with 90° and one-hand elbow angle in terms of the time of the O'Connor test (P<0.05). However, no significant difference was found between carrying a load with a 180-degree elbow angle and carrying a load with one hand (P>0.05). Eddy et al. [21] also reported that reaction time increases after manual handling. As previously mentioned, the hand becomes tired, and the performance decreases after carrying the load, especially out of the normal state (90-degree elbow angle) [8,21] consistent with those of the present study.
The number of made errors (Table 1) significantly increased after performing the O'Connor test so this amount was more in manual load handling with a 90-degree elbow angle compared to other methods (with an average of 3.58). In handling the load with one hand, the number of errors (with an average of 0.68) was less than that of the other methods, and the amount of error was related to how the load was carried manually (P≤0.05). there was a significant difference in the number of errors between manual load handling with 90° and 180° elbow angles, as well as between manual load handling with a 90° elbow angle and by one hand, and finally, between manual load handling with an elbow angle of 180 degrees and by one hand.
There was a significant difference in the number of errors in performing the O'Connor test (P≤0.05). This test is a cognitive activity, and the results of the tests show the effect of physical activity on cognitive functions. For example, in their study on the physical and cognitive consequences of fatigue aimed at recognizing the cognitive and physical effects of fatigue, Hoda et al. [6] observed that muscle fatigue reduces muscle activity and fatigue also affects cognitive functions, and there is a relationship between the intensity and position of activity and cognitive functions [6]. The results of a study by Coutinho et al. [22] showed that players might run less distance at higher speeds when they are exhausted in comparison with the control group, and fatigue significantly influences performance. Thus, physical and cognitive activity have an interaction. As explained in the standards, the working height for heavy activities should be 20-40 cm below the elbow height [23] because there is more oxygen when the hand is in the lower part of the heart, increasing the function. Therefore, carrying a load at an angle of 90 degrees is more complicated than the other two methods. In a study which was done by Florian Van Halewyck and colleagues [24], results showed that both age and physical activity level impacted eye-hand coordination during discrete manual aiming.
The RPE after manual handling also represented a significant difference between the total cases (Table 3). RPE was extremely higher after manual handling with a 90-degree elbow angle than the two other cases (with an average of 12.65). RPE was also related to how the load was handled manually (P≤0.05). The results of pairwise comparisons revealed a significant difference between manual handling with 90° and 180° elbow angles, as well as between manual load handling with 90° elbow and one hand. Similarly, a significant difference was observed between manual load handling with a 180-degree elbow angle and one hand in terms of the RPE (P≤0.05). According to the results, it is necessary to use low RPE in jobs requiring high grip strength to bear more workload, reduce muscle fatigue and discomfort, and increase health [25]. Carrying a load manually with one hand is more straightforward than carrying a load with a 90-degree elbow because carrying a load with both hands reduces spinal compression [26] However, more load can be lifted accordingly.
This implies that we must be careful in choosing the method of manual load handling, especially for tasks that necessitate cognitive work after lifting to minimize the loss of performance in performing psychomotor abilities.
The analyses using the regression showed that there was a significantly positive impact on all measurements of pinch strength by the variable of weight. Thus, better pinch strength should be expected in subjects with a higher body mass. The strong relationship between weight and pinch strength is probably due to greater muscle mass directly related to the more significant body weight, leading to more force generation. This finding agrees with other studies showing a positive relationship between body mass and muscle strength.
Height also showed a positive effect on pinch strength measurements, though the level of significance varied across different types of pinch measurements. The variability suggests that while taller individuals generally have greater pinch strength, the impact of height is not uniformly significant across all types of pinch strength tests. This could be attributed to the mechanical advantages provided by longer limbs, allowing for more effective force application in certain tasks. These findings are in line with the research by Sparshadeep [27] et al , who found that height positively correlated with handgrip strength in a study of occupational health workers.
Age had a significant, consistently negative influence on all measures of pinch strength. As one ages, they lose strength in pinching, which may represent the physiological loss of muscle mass and subsequent power that occurs with aging. This is consistent with other literature on sarcopenia, i.e., progressive loss of muscle mass and muscle function due to complex physiological processes. The reduced pinch strength with aging is why many interventions are being made to keep muscle strength among the elderly populations, such as resistance training and physical therapy. Similarly, such findings were reported by Norman et al. [28], who found that aging is associated with a notable decrease in handgrip strength in different populations.
Thus, determining the most appropriate method of the manual handling of loads with the slightest reduction in psychomotor abilities and physical abilities can be used in developing regulations related to manual handling and teaching the appropriate method of manual handling and recovery. Hence, preventing the decline of psychomotor skills, especially in occupations where people are forced to perform mental activities together with manual activities after performing physical work (manual transport of goods such as the driver of vans and construction workers), determines the relationship between manual handling and psychomotor ability reductions and assisting employers in performing appropriate interventions is another application of this study and reduce errors during such occupations by designing jobs, traffic signs, and safety signs to facilitate actions which need a high eye-hand coordination demand. The research was limited because test completion was time-consuming, and people occasionally got tired while sampling.
This study has several limitations, although it was well-controlled. Many of the subjects got tired during the test and they left the trial. In addition, manual handling was more challenging for some weaker people because participants had different physical abilities
As a result, the worst manual handling method among regarded methods is a 90-degree elbow angle because of its significant adverse effects on psychomotor skills. The sample size was limited to only male students, the reason being that it would not be representative of the general population. For this purpose, future studies will consider more diversified samples to validate across age groups and in both genders, along with occupational diversifications. Even though the study included quite robust statistical models, there is a need for further research to explore other possible predictors of pinch strength, like hand size, levels of physical activity, and nutritional status.
More Investigation of the effect of different methods of manual load handling on reaction time in a driving simulator and their situation awareness is recommended. In addition, regulating Work plans for operators to reduce psychomotor activities and their efficiency assessment can be carried out in further research.
5. Conclusion
This study found that the technique used in manual handling plays a profound role in psychomotor skills; a 90 degrees angle at the elbow is associated with high levels of exertion and errors, and the one-handed technique illustrates minimal negativity, if any, which means it is high time to implement ergonomic interventions intended to minimize the physical exertion and enhance the safety of the workers to increase productivity.
The study found that weight was significantly more potent as a predictor of pinch strength than height and age. In addition, the random forest regression model outperformed the linear regression model, which could, therefore, show the value of advanced statistical methods in ergonomic research. These findings point to the importance of targeted interventions for maintaining handgrip strength, especially in older populations, and outline potential areas for future research with other factors affecting grip strength.
Author Contributions
[EO] has made a significant contribution to the conception and design of the study, data collection as well as drafting the manuscript. [RH] and [MB] approved the research proposal with some revisions, [MB] and [FG] contributed to the data analysis, and finalized the first draft of the manuscript in the role of Supervisor. [YM] critically reviewed the data analysis and interpretation. All the authors approved the final version of the manuscript.
Funding
Vice Chancellor for Research and Technology of Hamadan University of Medical Sciences financially supports this research (grant number: 9811018468).
Institutional Review Board Statement
This study protocol was approved by the Ethics Committee of Hamadan University of Medical Sciences (IR.UMSHA.REC.1398.832). Written informed consent was obtained from the participants before conducting the research. Ethical considerations (This study protocol was fulfilled before conducting the research): Obtaining informed consent from the studied samples. Obtain permission from the University Vice Chancellor for Research. Assuring the samples of non-disclosure of information and their identity.
Informed Consent Statement
All authors express their consent to the publication of this manuscript.
Data Availability Statement
The raw data produced in this study will not be shared publicly due to ethical issues and confidential data protection. If needed, data and information can be accessed by contacting the corresponding author.
Acknowledgments
The authors of this article would like to thank all the participants in this study.
References
- Punnett L, Wegman DH. Work-related musculoskeletal disorders: the epidemiologic evidence and the debate. Journal of electromyography and kinesiology. 2004;14(1):13–23. [CrossRef]
- Walsh GS, Low DC, Arkesteijn M. Effect of stable and unstable load carriage on walking gait variability, dynamic stability and muscle activity of older adults. Journal of biomechanics. 2018;73:18–23. [CrossRef]
- Fattorini L, Tirabasso A, Lunghi A, Di Giovanni R, Sacco F, Marchetti E. Muscular synchronization and hand-arm fatigue. International Journal of Industrial Ergonomics. 2017;62:13–6. [CrossRef]
- Alavi SS, Mohammadi MR, Souri H, Kalhori SM, Jannatifard F, Sepahbodi G. Personality, driving behavior and mental disorders factors as predictors of road traffic accidents based on logistic regression. Iranian journal of medical sciences. 2017;42(1):24.
- Kunisaki C, Takahashi M, Fukushima T, Nagahori Y, Akiyama H, Makino H, et al. The influence of stage migration on the comparison of surgical outcomes between D2 gastrectomy and D3 gastrectomy (para-aortic lymph node dissection): a multi-institutional retrospective study. The American journal of surgery. 2008;196(3):358–63. [CrossRef]
- Abd-Elfattah HM, Abdelazeim FH, Elshennawy S. Physical and cognitive consequences of fatigue: A review. Journal of advanced research. 2015;6(3):351–8. [CrossRef]
- Alamoudi M, Travascio F, Onar-Thomas A, Eltoukhy M, Asfour S. The effects of different carrying methods on locomotion stability, gait spatio-temporal parameters and spinal stresses. International Journal of Industrial Ergonomics. 2018;67:81–8. [CrossRef]
- Tsao L, Ma L, Wang L. Effect of local wrist muscle fatigue on multiple assembly-related psychomotor skills. Human Factors and Ergonomics in Manufacturing & Service Industries. 2017;27(4):210–7. [CrossRef]
- Danion F, Latash M, Li Z, Zatsiorsky V. The effect of fatigue on multifinger co-ordination in force production tasks in humans. The Journal of physiology. 2000;523(Pt 2):523. [CrossRef]
- Xing X, Zhong B, Luo H, Rose T, Li J, Antwi-Afari MF. Effects of physical fatigue on the induction of mental fatigue of construction workers: A pilot study based on a neurophysiological approach. Automation in Construction. 2020;120:103381. [CrossRef]
- Proctor SP, White RF, Robins TG, Echeverria D, Rocskay AZ. Effect of overtime work on cognitive function in automotive workers. Scandinavian journal of work, environment & health. 1996;124–32. [CrossRef]
- Faghih M, Motamedzade M, Mohammadi H, HABIBI MM, Bayat H, Arassi M, et al. Manual material handling assessment by snook tables in Hamadan casting workshops. 2013.
- Dilberoglu UM, Gharehpapagh B, Yaman U, Dolen M. The role of additive manufacturing in the era of industry 4.0. Procedia manufacturing. 2017;11:545–54. [CrossRef]
- Gonzalez V, Rowson J, Yoxall A. Development of the variable dexterity test: Construction, reliability and validity. International journal of therapy and rehabilitation. 2015;22(4):174–80. [CrossRef]
- Chen MJ, Fan X, Moe ST. Criterion-related validity of the Borg ratings of perceived exertion scale in healthy individuals: a meta-analysis. Journal of sports sciences. 2002;20(11):873–99. [CrossRef]
- Karagiannopoulos C, Watson J, Kahan S, Lawler D. The effect of muscle fatigue on wrist joint position sense in healthy adults. Journal of Hand Therapy. 2020 Jul 1;33(3):329–38. [CrossRef]
- S.C. M, C.J. Q, Pinder A, L.A. M. Development of Manual Handling Assessment Charts (MAC) for Health and Safety Inspectors. 2003.
- Li Y, Carabelli S, Fadda E, Manerba D, Tadei R, Terzo O. Machine learning and optimization for production rescheduling in Industry 4.0. The International Journal of Advanced Manufacturing Technology. 2020 Oct 1;110(9):2445–63. [CrossRef]
- Werner S, Fleisig G, Dillman C, Andrews J. Biomechanics of the elbow during baseball pitching. J Orthop Sports Phys Ther. 1993 Jun;17(6):274–8. [CrossRef]
- An KN, Chao EY, Morrey BF. Hand position affects elbow joint load during push-up exercise. Journal of biomechanics. 1993;26(6):625–32. [CrossRef]
- Eddy M, Hasselquist L, Giles G, Hayes J, Howe J, Rourke J, et al. The Effects of Load Carriage and Physical Fatigue on Cognitive Performance. PloS one. 2015 Jul 8;10:e0130817. [CrossRef]
- Coutinho D, Gonçalves B, Wong DP, Travassos B, Coutts AJ, Sampaio J. Exploring the effects of mental and muscular fatigue in soccer players’ performance. Human Movement Science. 2018 Apr 1;58:287–96. [CrossRef]
- Working in a Standing Position - Basic Information. Safety CCfOHa.; 2016.
- Van Halewyck F, Lavrysen A, Levin O, Boisgontier MP, Elliott D, Helsen WF. Both age and physical activity level impact on eye-hand coordination. Human Movement Science. 2014 Aug 1;36:80–96. [CrossRef]
- Vahedi Z, Kazemi Kheiri S, Hajifar S, Ragani Lamooki S, Sun H, Megahed FM, et al. The relationship between ratings of perceived exertion (RPE) and relative strength for a fatiguing dynamic upper extremity task: A consideration of multiple cycles and conditions. Journal of Occupational and Environmental Hygiene. 2023 Apr 3;20(3–4):136–42. [CrossRef]
- Weston E, Aurand A, Dufour J, Knapik G, Marras W. One versus two-handed lifting and lowering: lumbar spine loads and recommended one-handed limits protecting the lower back. Ergonomics. 2020 Feb 6;63:1–43. [CrossRef]
- Sparshadeep E, Joshi V, Venkatappa KG, Rai M. Evaluation of handgrip strength as an indicator of nutritional status in laborers. National Journal of Physiology, Pharmacy and Pharmacology. 2016;6(6):510. [CrossRef]
- Norman K, Stobäus N, Gonzalez MC, Schulzke JD, Pirlich M. Hand grip strength: outcome predictor and marker of nutritional status. Clinical nutrition. 2011;30(2):135–42. [CrossRef]
Figure 1.
O'Connor test and pinch gauge.

Figure 2.
(A) Manual handling with a 90-degree elbow angle, (B) Manual handling with a 180-degree elbow angle, and (C) Manual handling with one hand.
Figure 2.
(A) Manual handling with a 90-degree elbow angle, (B) Manual handling with a 180-degree elbow angle, and (C) Manual handling with one hand.
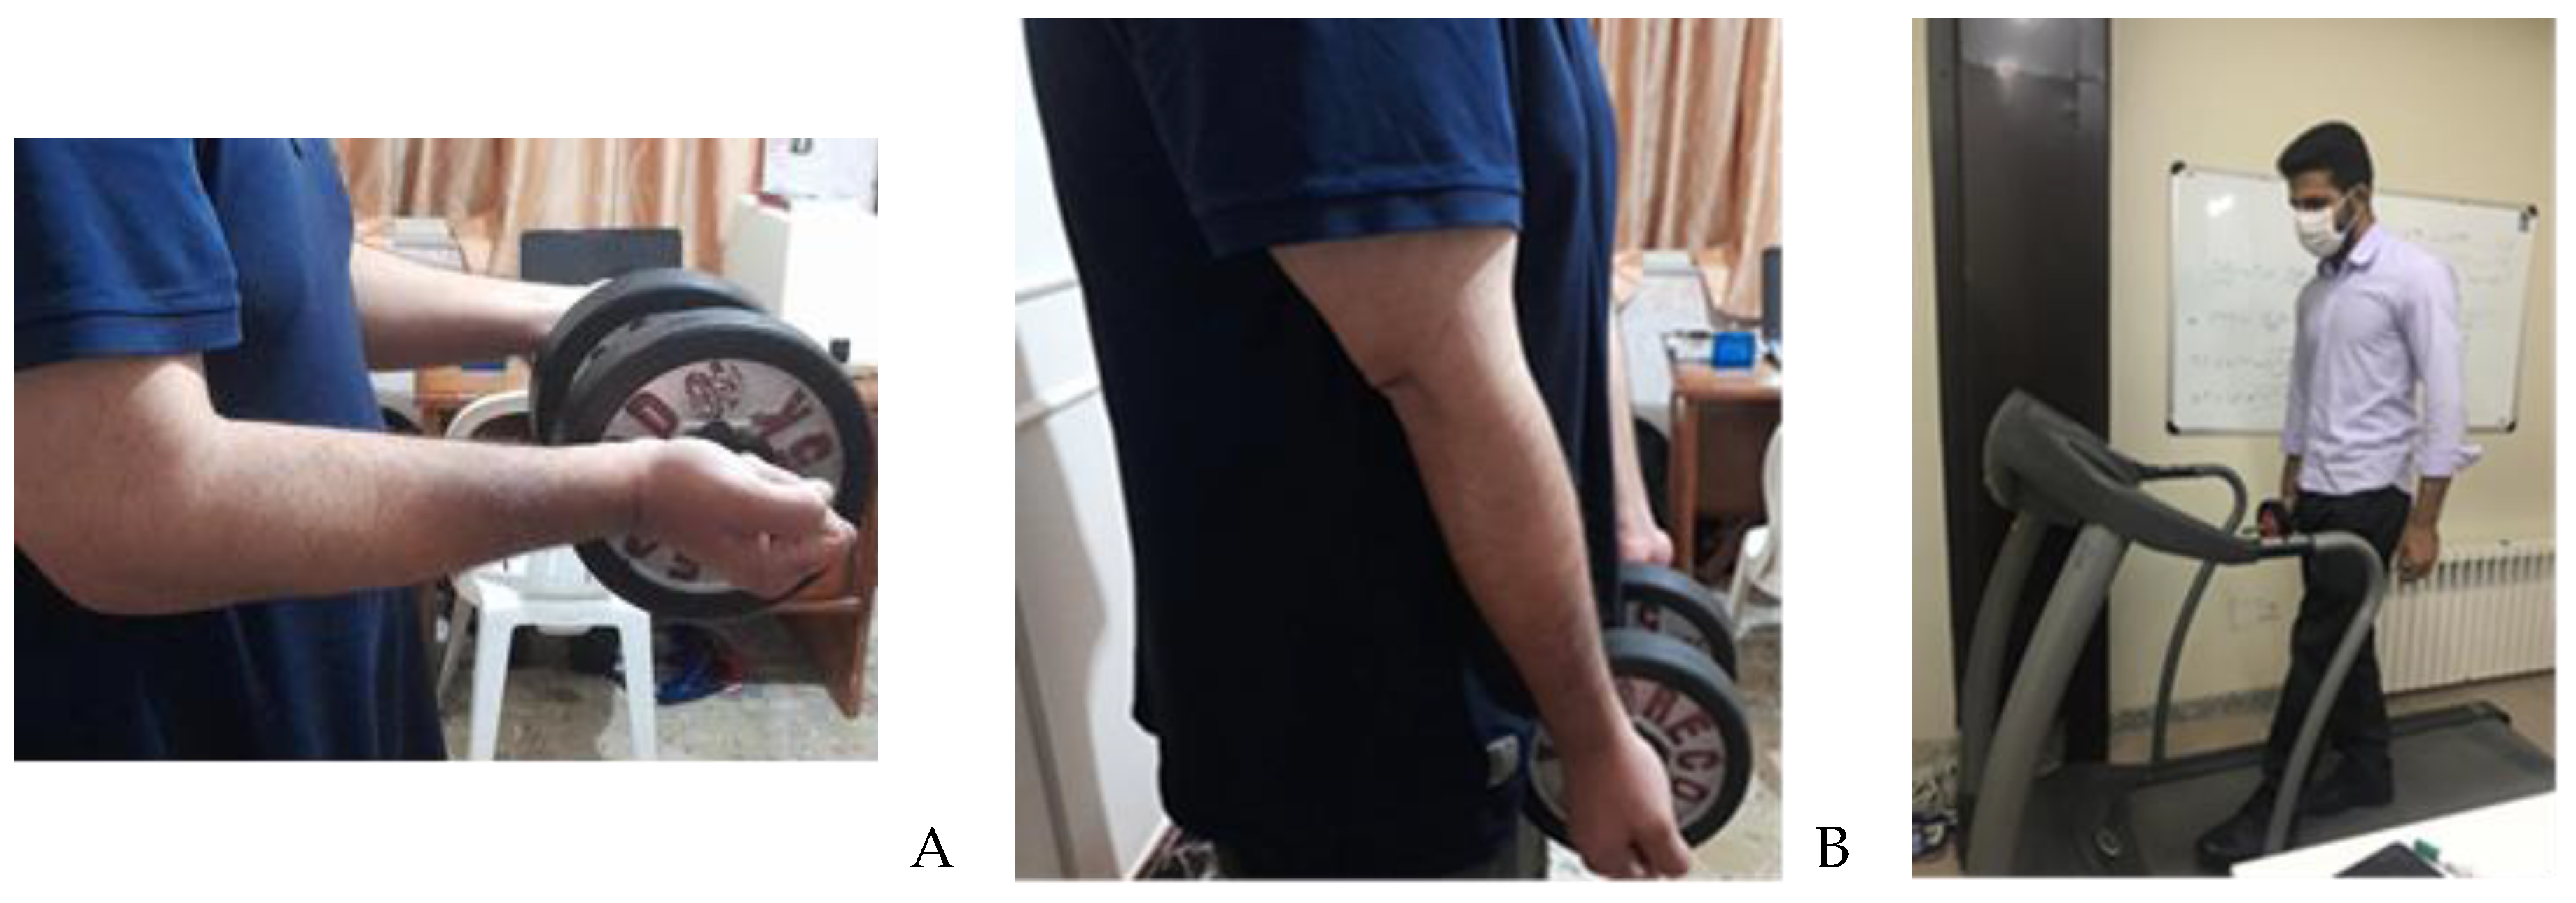
Table 1.
O'Connor test.
| Time (minute) | Errors | |||
|---|---|---|---|---|
| Mean (SD) | F (P) | Mean (SD) | F (P) | |
| After manual handling with a 90-degree angle | 4.38 (0.29) | 12.23 (0.001) * |
3.56 (1.61) | 38.04 (0.001) * |
| After manual handling with a 180_-degree angle | 4.27 (0.25) | 1.26 (1.18) | ||
| After manual handling with one hand | 4.21 (0.23) | 0.68 (0.91) | ||
Note. SD: Standard deviation. * P-value≤0.05.
Table 2.
Grip strength.
| Grip strength (kg) | ||
| Mean (SD) | F (P) | |
| After manual handling with a 90-degree angle | 7.96 (1.94) | 196.69 (0.001)* |
| After manual handling with a 180-degree angle | 8.93 (2.45) | |
| After manual handling with one hand | 9.23 (2.38) |
*p-value≤0.05.
Table 3.
RPE.
| RPE | ||
|---|---|---|
| Mean (SD) | F (P) | |
| After manual handling with a 90-degree angle | 12.65 (1/88) | 88.14 (0.023) |
| After manual handling with a 180-degree angle | 8.94 (2.78) | |
| After manual handling with one hand | 6.79 (1.067) |
Note. RPE: Rating of perceived exertion; SD: Standard deviation. *P-value≤0.05.
Table 4.
Comparison of two variables.
| Status of Performing Tests | O'Connor time (P) |
O'Connor error (P) |
Grip strength (P) |
RPE (P) |
|---|---|---|---|---|
| 90° - 180° | 0.011* | 0.001* | 0.015* | 0.001* |
| 90° - one hand | 0.001* | 0.001* | 0.001* | 0.026* |
| 180° - one hand | 0.23 | 0.28 | 0.001* | 0.017* |
Note. RPE: Rating of perceived exertion. *P-value≤0.05.
Table 5.
The relationship between the physical measurements and the number of errors.
| Metrics | R-squared | Height Coeff | Height p-value | Weight Coeff | Weight p-value |
Age Coeff | Age p-value |
|---|---|---|---|---|---|---|---|
| Error 0° | 0.047 | 0.0269 | 0.579 | -0.0058 | 0.845 | 0.0522 | 0.406 |
| Error 90° | 0.095 | -0.0148 | 0.692 | -0.0142 | 0.774 | 0.0605 | 0.321 |
| Error 180° | 0.123 | -0.0241 | 0.643 | -0.0053 | 0.910 | 0.0483 | 0.468 |
| Error one hand | 0.159 | -0.0189 | 0.589 | -0.0071 | 0.807 | 0.0652 | 0.248 |
Table 6.
The relationship between the physical measurements and the O’Connor test implementation time.
Table 6.
The relationship between the physical measurements and the O’Connor test implementation time.
| Metrics | R-squared | Height Coeff | Height p-value | Weight Coeff | Weight p-value |
Age Coeff | Age p-value |
|---|---|---|---|---|---|---|---|
| Time 0° | 0.082 | 0.0185 | 0.643 | 0.0143 | 0.910 | -0.0359 | 0.406 |
| Time 90° | 0.068 | 0.0293 | 0.692 | 0.0125 | 0.774 | -0.0417 | 0.321 |
| Time 180° | 0.082 | 0.0185 | 0.643 | 0.0143 | 0.910 | -0.0359 | 0.468 |
| Time one hand | 0.101 | 0.0252 | 0.589 | 0.0116 | 0.807 | -0.0398 | 0.248 |
Table 7.
The relationship between pinch strength and physical measurements.
| Metrics | R-squared | Height Coeff | Height p-value | Weight Coeff | Weight p-value |
Age Coeff | Age p-value | Intercept |
|---|---|---|---|---|---|---|---|---|
| Pinch 0° | 0.829 | 0.0463 | 0.051 | 0.173 | 0 | -0.0751 | 0.015 | -12.89 |
| Pinch 90° | 0.812 | 0.0428 | 0.063 | 0.168 | 0 | -0.0725 | 0.021 | -12.78 |
| Pinch 180° | 0.825 | 0.0489 | 0.040 | 0.179 | 0 | -0.0773 | 0.013 | -12.92 |
| Pinch one hand | 0.801 | 0.0452 | 0.047 | 0.170 | 0 | -0.0734 | 0.019 | -12.89 |
Table 8.
Regression metrics comparison.
| Metrics | Random forest regression | Linear regression |
|---|---|---|
| MAE | 1.5 | 2 |
| MSE | 2.25 | 3 |
| RMSE | 1.5 | 1.73 |
| R-squared | 0.85 | 0.75 |
Disclaimer/Publisher’s Note: The statements, opinions and data contained in all publications are solely those of the individual author(s) and contributor(s) and not of MDPI and/or the editor(s). MDPI and/or the editor(s) disclaim responsibility for any injury to people or property resulting from any ideas, methods, instructions or products referred to in the content. |
© 2024 by the authors. Licensee MDPI, Basel, Switzerland. This article is an open access article distributed under the terms and conditions of the Creative Commons Attribution (CC BY) license (http://creativecommons.org/licenses/by/4.0/).
Copyright: This open access article is published under a Creative Commons CC BY 4.0 license, which permit the free download, distribution, and reuse, provided that the author and preprint are cited in any reuse.


