

Submitted:
18 June 2024
Posted:
19 June 2024
You are already at the latest version
Abstract
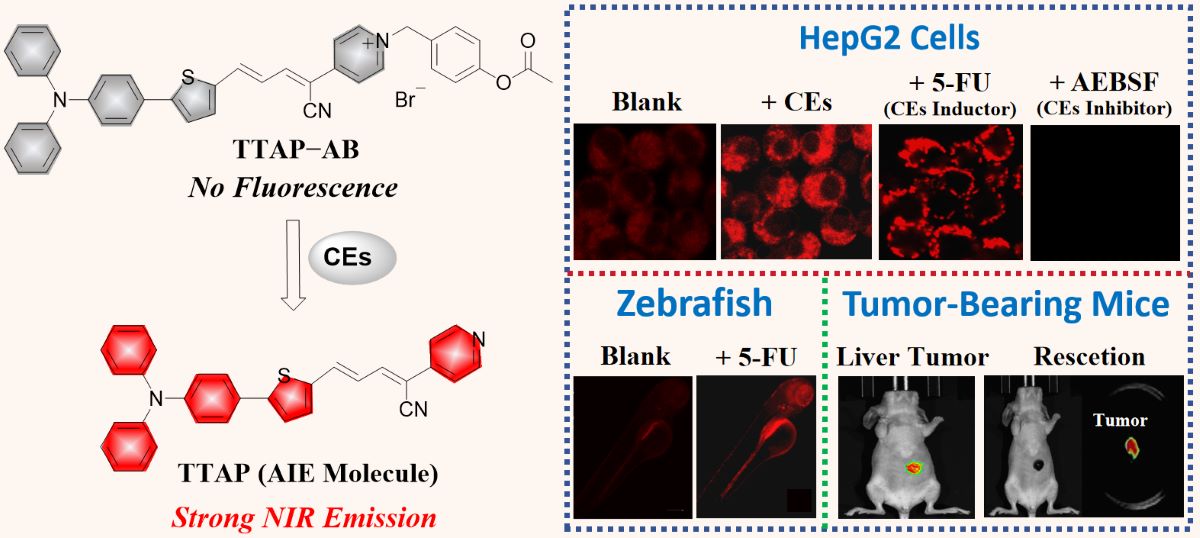
In human body, carboxylesterases (CEs) play the crucial roles in xenobiotic metabolism and lipid homeostasis. But the abnormal CEs expression is highly associated with some diseases, such as hyperlipidemia, diabetes and liver cancer. Therefore, it is of great significance to develop an efficient tool for the accurate detection of CEs in living organisms. Herein, an innovative near-infrared (NIR) fluorescent probe TTAP−AB has been designed for CEs detection based on aggregation-induced emission (AIE) mechanism. This probe exhibits rapid response (2 min), excellent sensitivity (limit of detection = 8.14×10⁻⁶ U/mL), and high selectivity towards CEs. Additionally, owing to the good biocompatibility, probe TTAP−AB enables to monitor the dynamic changes of CEs level under drug-induced modulation in living cells and zebrafish. More importantly, probe TTAP−AB is successfully employed to image the liver tumor and assist tumor resection by the real-time monitoring of CEs, indicating that TTAP−AB is promising to guide liver cancer surgery. Therefore, probe TTAP−AB can not only enrich the strategies for CEs detection in biological systems, but also has great potential for some clinical imaging applications, including medical diagnosis, preclinical research, and imaging-guided surgery.
Keywords:
Aggregation-induced emission
; NIR fluorescent probe
; Carboxylesterases
; Bioimaging.
1. Introduction
Carboxylesterases (CEs, with EC 3.1.1.1), as an essential member of serine hydrolases superfamily, are found in various tissues of human body, especially the liver and intestine [1]. CEs play the key roles in catalyzing the hydrolysis of endogenous esters, thioesters, carbonates, carbamates and amides. In addition, they are involved in metabolic elimination of various xenobiotics, including ester-prodrugs, pesticides, and environmental toxicants [2]. Apart from metabolizing various exogenous and endogenous substances, CEs also have played the vital physiological functions in lipid homeostasis that converts monoacylglycerides to free fatty acids [3]. However, the abnormal CEs expression is tightly correlated with many diseases, such as hyperlipidemia, diabetes, atherosclerosis, and even liver cancer [4,5]. Therefore, exploring an effective strategy to track the distribution of CEs and evaluate its activity variation in cells or tissues is of great significance for both clinical diagnosis and treatment of various diseases.
Till now, there have been already various methods for the detection of CEs, including mass spectrometry [6], chromatography [7], chemiluminescence [8], and fluorescent probe [9]. Among them, fluorescent probe attracted the great attentions owing to its advantages of simple operation, fast detection, high spatiotemporal resolution, and noninvasive imaging in living systems [9]. At present, a plenty of fluorescent probes have been reported based on various mechanisms, including photoinduced electron transfer (PET) [10,11,12], intramolecular charge transfer (ICT) [13,14,15,16,17,18], and other mechanisms [19,20,21,22]. However, these probes still suffered from various drawbacks in practical applications. At first, most of them required a long time (≥ 10 min) to accomplish the fluorescence response [10,11,12,13,14,15,17,18,19,20,21,22], thus they were unsuitable for the real-time monitoring of CEs in living organisms. In addition, some probes were severely hydrophobic, and they required to use a large volume fraction of toxic organic cosolvents [11,13,15,17], which was harmful for their applications in analysis of real biological sample. Even worse, many probes outputted the fluorescence signals in visible region (< 650 nm) [10,11,12,17,20,21,22], which might result in the low tissue penetration ability and serious tissue damage. By contrast, the near-infrared (NIR) fluorescent probe (650–900 nm) were more suitable for the biological testing in vivo, because they exhibited the low background interference, excellent tissue penetrability, and low tissue damage [23,24]. The characteristics of above fluorescent probes has been summarized in Table S1. Therefore, it is urgently needed to develop a water-soluble NIR fluorescent probe for the rapid, sensitive and selective detection of CEs in biological system.
Aggregation-induced emission (AIE), a unique optical phenomena that a class of luminogens were nearly non-emissive in dilute solution but highly emissive in the aggregated state, which was firstly coined by Tang et al. in 2001 [25]. In this regard, turn-on bioprobes could be easily constructed by taking advantage of AIE effect. It was believed that the nanoaggregates of the AIE-based probes would possess better photostability and higher signal reliability than the single-molecule of conventional probes. Furthermore, the negligible background noise of AIE-based probes rendered them especially attractive in continuous monitoring of biological processes without the repeated washing steps [26]. On account of above advantages, AIE-based probes have been widely used in bioimaging and biological testing [27]. But, as far as we known, the AIE-based fluorescent probes for CEs detection were rarely reported. Dai and co-workers have reported an AIE-based fluorescent probes for monitoring CEs in HepG2 cells, but the fluorescence signal was in visible region (λem = 589 nm) [22], thereby this probe was unsuitable for the fluorescence detection of CEs in vivo.
Herein, we have developed a novel NIR fluorescence probe TTAP−AB for detecting CEs with the AIE mechanism (Scheme 1). Probe TTAP−AB was designed based a typical D−π−A structure. In which, the conjugated C=C double bond bridged the triphenylamine-thiophene (TT) skeleton (electron donor, D) and the acrylonitrile-pyridinium (AP) moiety (electron acceptor, A). Owing to the cationic pyridinium moiety, probe TTAP−AB was well dissolved in PBS buffer. As the presence of CEs, the acetoxy-benzyl recognition group was hydrolyzed and broken by CEs, which triggered the self-elimination reaction and finally released the AIE-active fluorophores TTAP. Because TTAP was not dissolved in PBS buffer, thus its aggregation aroused an intense NIR emission (λem = 692 nm). In addition, probe TTAP−AB exhibited the high selectivity, fast response (within 2 min), and low limit of detection (LOD: 8.14×10⁻⁶ U/mL) to CEs. Owing to the good biocompatibility and excellent cell, tissue penetrability, TTAP−AB could monitor the dynamic change of CEs levels induced by 5-fluorouracil (anti-tumor drug) and CEs inhibitor in living cells and zebrafish. More importantly, TTAP−AB was successfully employed to image the liver tumor and assist tumor resection by the real-time monitoring of CEs, indicating that probe TTAP−AB was promising to guide liver cancer surgery.
2. Results and Discussion
2.1. Synthesis and Characterization of Probe TTAP−AB
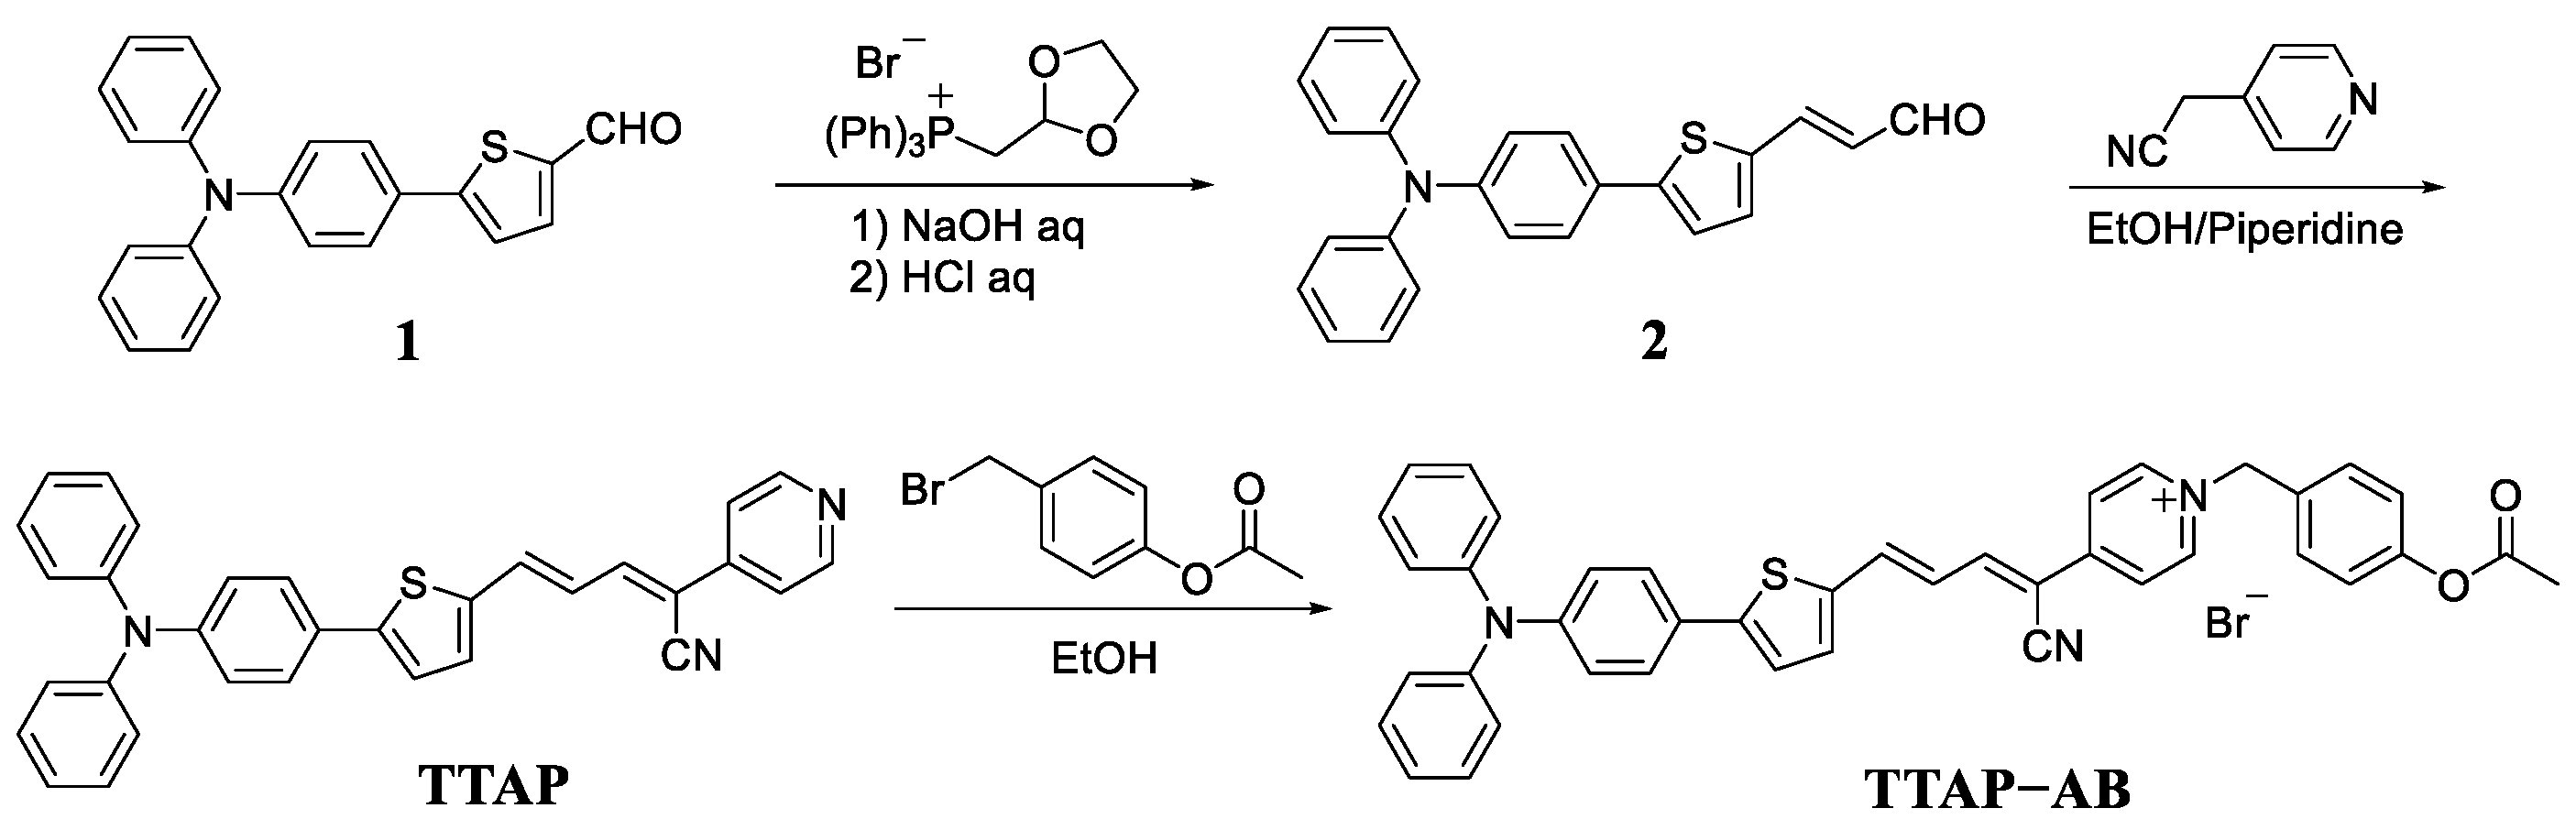
As shown in scheme 2, probe TTAP−AB was synthesized by a three-step reaction. At first, the wittig reaction of compound 1 and (1,3-dioxolan-2-ylmethyl)triphenylphosphonium bromide afforded the intermediate 2. Subsequently, a Knoevenagel condensation reaction was taken between compound 2 and 2-(pyridin-4-yl)acetonitrile to produce the fluorophore TTAP. Finally, the following quaternization reaction of TTAP with 4-(bromomethyl)phenyl acetate produced probe TTAP−AB with a 62% yield. The structures of above compounds were confirmed by 1H NMR, 13C NMR, and HRMS, which can be seen in the Supporting Information (Figures S6–S13).
Scheme 2.
The synthetic route of probe XTAP−Bn.
2.2. Spectroscopic Response of TTAP−AB Towards CEs
With the pure probe TTAP−AB in hand, its absorption and fluorescence spectra in the absence and presence of CEs were first investigated. As shown in Figure 1a, TTAP−AB (5 μM) showed an absorption peak at 548 nm and the negligible fluorescence in PBS buffer. Upon treating with CEs, a new absorption peak was observed at 480 nm accompany with a color change from purple to orange, which might be caused by the hydrolysis reaction of TTAP−AB with CEs. Meanwhile, the fluorescence intensity at 692 nm (F692) enhanced continuously upon the gradual increase of CEs concentrations (0.00–0.25 U/mL) (Figure 1b). Notably, the F692 values exhibited a good linear relationship (R2 = 0.9978) with the concentrations of CEs raging from 0.00 to 0.18 U/mL (Figure 1c). Based on 3σ/k formula, the limit of detection (LOD) was calculated to be 8.14×10⁻⁶ U/mL (Section S2), implying the much higher sensitivity than many other CEs probes [10,11,13,14,15,19,21,22]. Moreover, as known from the dynamic light scattering (DLS) data, the initial signal peak was not found, indicating that probe TTAP−AB was well dissolved and dispersed in PBS buffer. However, after treating with 0.25 U/mL of CEs, the average size of formed nanoparticles was around 240 nm (Figure 1d). Obviously, the present CEs caused the aqueous solution of TTAP−AB to form the nano-aggregates, consequently resulting in an bright NIR emission.
2.3. The Studies of Selectivity, Response Time and pH effect
To evaluate the selectivity toward CEs, probe TTAP−AB was incubated with various potential interferents, including 0.60 U/mL some common enzymes (acetyl cholinesterase (AchE), carbonic anhydrase I (CAI), xanthine oxidase (XO), peroxidase (POD), carboxypeptidase A (CPA), leucine aminopeptidase (LAP)), 100 μM some amino acids (glutamic acid (Glu), cysteine (Cys), glutathione (GSH), Homocysteine (Hcy)), and 100 μM some common ions (K+, Na+, Zn2+, Cu2+, Mg2+, Cl−, CO32−, SO32−, S2−, H2PO4−). To our delight, the fluorescence of TTAP−AB at 692 nm could be markedly triggered only by CEs, while the others caused the negligible fluorescence changes (Figure 2a). To further investigate the CEs-dependent selective response, an anti-interference test was then carried out. As shown in Figure 2b, even if coexisting different interferents, CEs could still cause the fluorescence intensity of TTAP−AB to have a significant enhancement. These results suggest that probe TTAP−AB possessed the relatively high selectivity for CEs compared to other interferential species, which afforded a solid foundation for CEs detection in subsequent biological experiments.
As known from previous reports, most fluorescent probes required a long response time (over 10 min) to CEs [10,11,12,13,14,15,17,18,19,20,21,22], thus they were unsuitable for the real-time analysis in living organism. In view of this, the time-dependent fluorescence intensity of probe TTAP−AB toward CEs was studied. When TTAP−AB (5 μM) was excited at 505 nm, its fluorescence intensity remained unchanged within 30 min, indicating that TTAP−AB possessed an excellent photostability. By contrast, while TTAP−AB was treated with CEs (0.20 U/mL), the fluorescence intensity at 692 nm increased rapidly and reached to a plateau within 2 min (Figure 2c). Obviously, TTAP−AB exhibited the much faster response to CEs than most reported probes (Table S1). For broader biological applications, the impacts of environmental pH on the fluorescence response of probe TTAP−AB towards CEs was investigated. As displayed in Figure 2d, the fluorescence intensity of TTAP−AB (5 μM) were basically not affected at different pH conditions, indicating that TTAP−AB displayed an excellent pH-stability. After treating with CEs (0.20 U/mL), the fluorescence intensity at 692 nm was significantly increased when the pH was 6.0–9.0. In strong acid medium (pH ≤ 5), the product TTAP from TTAP−AB with CEs would be dissolved in aqueous solution due to the protonation, thus TTAP was unable to exhibited the NIR emission. While in strong alkaline conditions (pH ≥ 10), the reaction activity of CEs toward TTAP−AB was reduced [15,18], which hampered the release of fluorophore TTAP and prevent the generation of NIR fluorescence. Even so, probe TTAP−AB was still able to monitor CEs in physiological environments.
2.4. Sensing Mechanism
To confirm the reaction mechanism, the reaction product of TTAP−AB with CEs was separated and purified (Section S3), and its structure was analyzed by HRMS and 1H NMR. As shown in Figure S1, the HRMS data displayed a major peak at m/z = 482.16848 [M+H]+, indicated that the probe TTAP−AB was hydrolyzed by CEs to release the fluorophore TTAP. Moreover, according to the 1H NMR spectra of TTAP−AB, TTAP and product from TTAP−AB+CEs (Figure 3), it was found that the signals of the protons on acetoxy-benzyl recognition group in TTAP−AB at 5.79 ppm (Hb) and 2.27 ppm (Hc) both disappeared after the reaction with CEs. Meanwhile, the signal of protons on pyridine ring (Ha) in TTAP−AB showed a distinct upfield shift from 9.14 ppm to 8.15 ppm after the reaction. More importantly, the 1H NMR spectra of the product from TTAP−AB+CEs was almost the same with that of TTAP. The above results fully demonstrated that the reaction of TTAP−AB with CEs produced the fluorophore TTAP.
For better understanding the fluorescence “turn-on” response of probe TTAP−AB towards CEs, the fluorescence spectra of TTAP−AB and TTAP were studied in DMSO–PBS mixture with different volume fractions of PBS buffer (fP), respectively. As shown in Figure 4, TTAP−AB was almost non-emissive in pure DMSO, and the continuous addition of PBS buffer caused the negligible impact on fluorescence intensity. When fP was up to 99%, TTAP−AB was formed nano-aggregates with the average size of 124 nm in the solution (Figure S2a), but the fluorescence intensity had hardly enhanced. Therefore, probe TTAP−AB was non-emissive in both dilute solution and aggregate state, which might be caused by the strong intramolecular charge transfer (ICT) effect from triphenylamine-thiophene skeleton (strong electron donor) to acrylonitrile-pyridinium moiety (strong electron donor), as well as the intense intermolecular dipole−dipole interaction [28,29]. While for compound TTAP, it exhibited a weak pink emission in pure DMSO. Upon the increase of fP, the fluorescence intensity was slightly decrease, because the present PBS buffer improved the solvent polarity, which compelled compound TTAP to form a twisted charge-separated conformation by intramolecular rotation, consequently weakening the fluorescence intensity [30]. While fP was up to 70%, the fluorescence intensity at 692 nm was dramatically improved. When fP = 99%, the fluorescence intensity reached to the maximum, and the DLS results revealed that this solution formed the nano-aggregates with the average size of 357 nm (Figure S2b). Therefore, compound TTAP possessed the AIE activities, and its aggregation was responsible for the NIR fluorescence response of probe TTAP−AB toward CEs..
2.5. Cell Imaging of CEs
Inspired by the excellent CEs-sensitivity of probe TTAP−AB in vitro, its application in living cells was then investigated. In which, HepG2 cells were chose as the model cells line due to the high CEs expression [12]. Prior to cell imaging, the cytotoxicity of TTAP−AB was evaluated by the standard MTT assays. As shown in Figure S3, even if the concentration of TTAP−AB co-cultured with cells reached to 25 μM, the cell survival rate was more than 90%, indicating that TTAP−AB displayed the low cytotoxicity to HepG2 cells, and it was well suitable for the subsequent imaging experiments. Afterward, the sensing behavior of probe TTAP−AB toward CEs in HepG2 cells was investigated. When the HepG2 cells were stained only with 5 μM TTAP−AB for 30 min, a weak intracellular NIR fluorescence was observed (Figure 5a). While the cells were further incubated with different concentration of CEs (0.10 U/mL, 0.15 U/mL, 0.20 U/mL) for another 1 h, respectively, the emission intensities in NIR channel presented a steady improvement with the increase of probe concentration (Figure 5b). Thus, probe TTAP−AB was able to image exogenous CEs in living cells.
According to previous reports, CEs have been participated in the metabolism of many clinical drugs, and their activity would also be regulated by these drugs [1]. Therefore, detecting CEs activity was extremely important for studying the relationship between CEs and drug metabolism, which will guide us to use drugs reasonably for related diseases therapy. 5-fluorouracil (5-FU), an anti-tumor drug, has been proven to up-regulate CEs activity in HepG2 cells [12,16]. In view of this, the feasibility of using probe TTAP−AB to monitor the activity of CEs regulated by the drug 5-FU has been investigated. As shown in Figure 6b, the untreated HepG2 cells have no background fluorescence, while an intracellular NIR fluorescence could be clearly seen after the co-incubation with TTAP−AB (5 μМ) for 1 h (Figure 6e). Moreover, when HepG2 cells were successively treated with the 5-FU (100 μM) and TTAP−AB (5 μМ), the fluorescence intensity was obviously enhanced (Figures 6h and S4). However, when the cells were pre-incubated with 1 mM AEBSF (4-(2-Aminoethyl)benzenesulfonyl fluoride hydrochloride, a CEs inhibitor) for 2 h, the fluorescence intensity in NIR channel was seriously blocked (Figure 6k). On account of these results, probe TTAP−AB could monitor the dynamic change of CEs level induced by the drug 5-FU and CEs inhibitor in living cells.
2.6. Visualization of CEs levels in zebrafish
Encouraged by the excellent performance of cell imaging, the feasibility of probe TTAP−AB to visualize CEs in vivo was studied, and zebrafish larvae was chose as the vertebrate model. As shown in Figure 7, the zebrafish exhibited a weak NIR emission in abdomen after treating only with TTAP−AB (5 μM), mainly due to the normal levels of CEs in zebrafish body. While treating with different concentrations of 5-FU (50 μM, 100 μM) for 10 h, respectively, the probe-loaded zebrafish presented a bright NIR fluorescence in zebrafish body, and the intensity of NIR fluorescence was obviously enhanced with increasing 5-FU concentration (Figure 7b and Figure 7c), indicating that more endogenous CEs was generated. But after the further incubation with AEBSF, the fluorescence signals decreased rapidly (Figure 7d), mainly due to the decomposition of CEs. These results were well consistent with that of cell imaging. Taken together, probe TTAP−AB was able to penetrate the tissues of zebrafish, and monitor the dynamic change of CEs level in zebrafish.
2.7. Bioimaging of CEs in Tumor-Bearing Mice
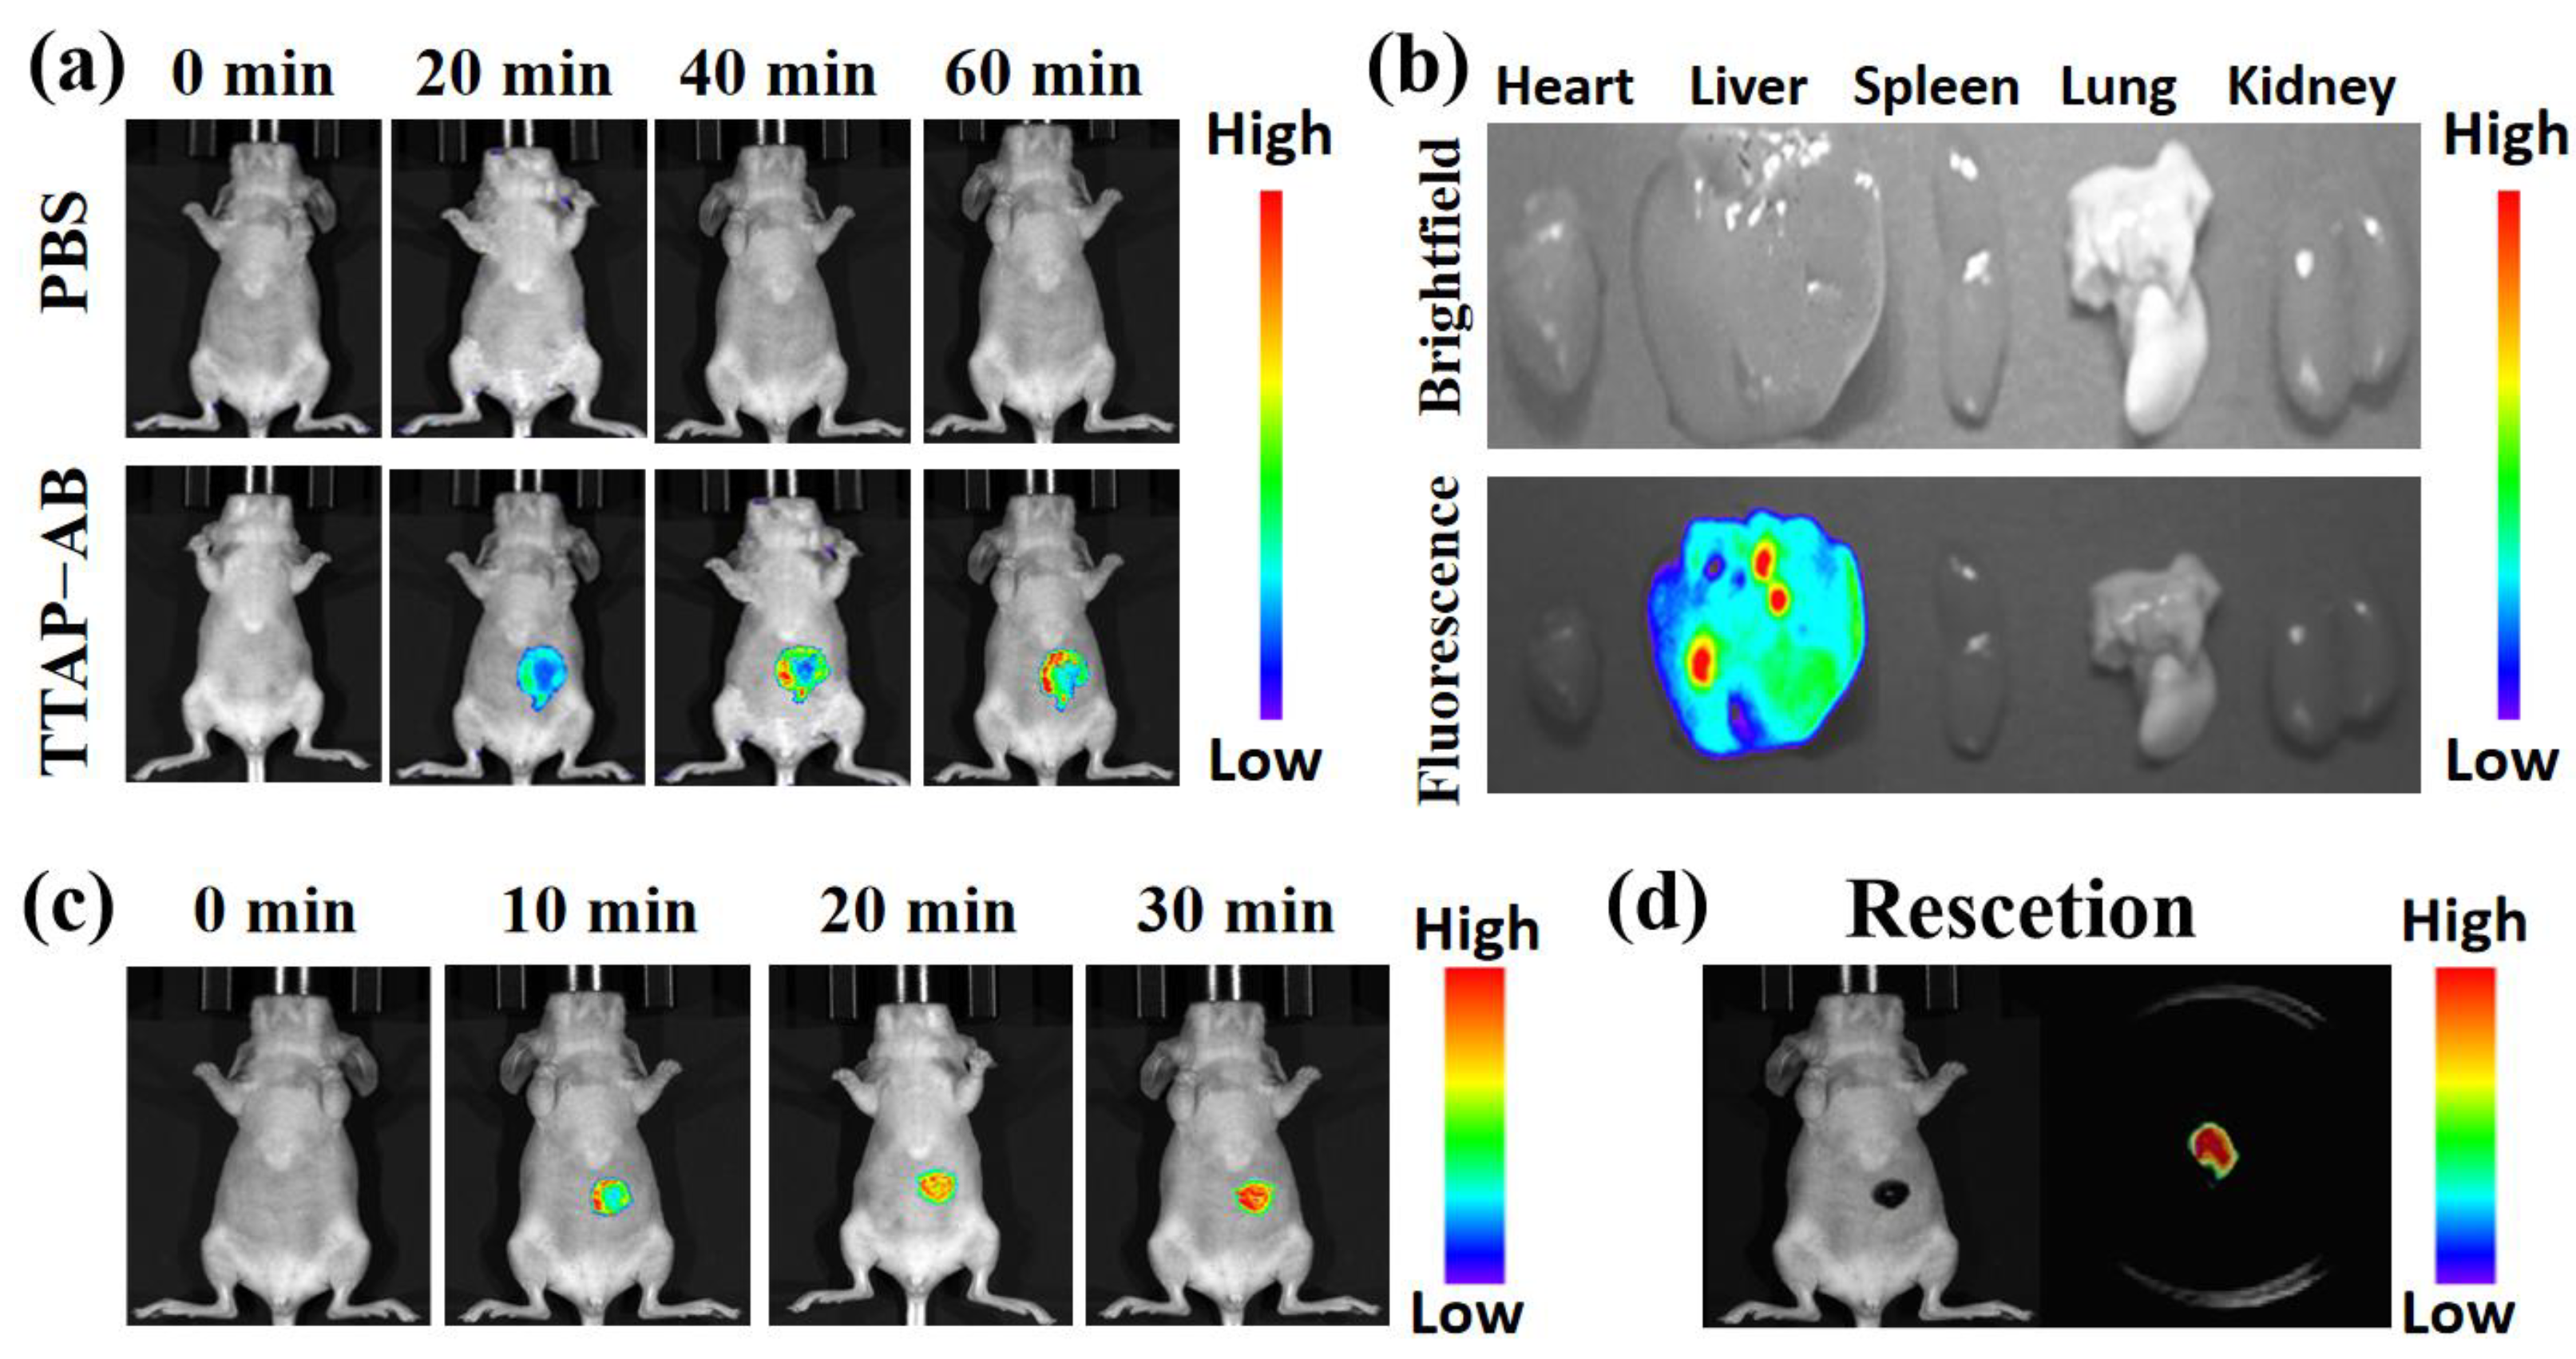
As previously reported, CEs was mainly distributed in the liver, and its activity was closely related to cholesterol-induced liver injury disease, especially liver cancer [12,19]. In view of this, the ability of probe TTAP−AB to image CEs in tumor-bearing mice was investigated. Before fluorescence imaging, the bio-safety testing of TTAP−AB was investigated in the nude mice by histologic staining (hematoxylin and eosin, H&E) assays for 24 h. As known from Figure S5, probe TTAP−AB did not caused significant pathological changes in some primary organs, including heart, liver, lung, kidney, and spleen. Therefore, probe TTAP−AB had no obvious toxicity in vivo, and it was suitable for imaging CEs in mice. Afterward, the liver imaging was carried out. As a control group, the mice were only injected with saline, and no obvious fluorescence signal was observed (Figure 8a). But in experimental group, the mice were intravenously injected with TTAP−AB (100 μL, 200 μM), and the fluorescence signal in abdomen of mice increased quickly and reached the maximum level at about 60 min, indicating that TTAP−AB was hydrolysis catalyzed by CEs. Simultaneously, the bio-distribution of TTAP−AB was determined. These mice were killed by euthanasia method, and their organs (heart, liver, spleen, lung, kidney) were dissected for fluorescence imaging. As exhibited in Figure 8b, bright fluorescence signal could be clearly observed in the liver, while there was almost no fluorescence in other organs. These results indicated that CEs were mainly distributed in the liver, and probe TTAP−AB was able to enter and accumulate in the liver of mice for imaging.
Afterward, the imaging experiments in tumor-bearing mice were conducted. The HepG2 cells (Human hepatocarcinoma cells) were implanted into BALB/c mice to induce the formation of liver tumor. As depicted in Figure 8c, when the tumor-bearing BALB/c mice was injected with probe TTAP−AB (20 μL, 100 μM), the NIR signal of tumor site increased obviously over time and reached to the maximum intensity at 30 min, mainly due to the over-expression of CEs in liver tumor. Obviously, probe TTAP−AB was successfully visualized liver tumors in vivo. More excitingly, when the tumor was dissected from the mouse body, it still presented an intense NIR fluorescence, but there were no fluorescent signals in the mouse (Figure 8d), implying that TTAP−AB could realize tumor imaging and assist in tumor resection. Taken together, probe TTAP−AB was capable for the real-time imaging of CEs in liver tumors, and it exhibited a great potential for practical clinical applications.
3. Materials and Methods
3.1. Materials and Instruments
Unless otherwise stated, all chemicals were purchased from commercial suppliers and used without further purification. Double-distilled water and chromatographic solvents were used for fluorescence tests. A Bruker AV-400 spectrometer was employed to record 1H NMR and 13C NMR spectra. High-resolution mass spectra (HRMS) were obtained with a Thermo Scientific Q Exactive type mass spectrometer. Fluorescence spectra were collected by Hitachi F-4500 fluorescence spectrometer. Dynamic light scattering (DLS) experiments were investigated with ZEN3600 Malvern particle sizer. Fluorescence images of living cells and zebrafish were obtained with a Zeiss LSM 880 confocal laser scanning microscope (Germany). All fluorescence imaging of living mice was performed by a BLT AniView 600 small animal optical imaging system (China).
3.2. Synthesis of Fluorophore TTAP
Compound 2 was synthesized according to the previous method [31], and its synthetic procedure was exhibited in the Supporting Information (Section S4). After that, compound 2 (1.14 g, 3.00 mmol) and 4-pyridineacetonitrile (0.17 g, 3.60 mmol) were dissolved in 15 mL ethanol, and then 0.6 mL piperidine was added into the solution. This mixture was reacted at 80 ℃ for 8 h under N2 atmosphere. After cooling to room temperature, the mixture was concentrated using rotary evaporators, and the remaining solid was purified by column chromatography (CH2Cl2/CH3OH as eluent, v/v = 30:1). The final product TTAP was obtained as a dark red solid (0.93 g, 64% yield). 1H NMR (400 MHz, DMSO-d6): δ (ppm) 8.65 (d, J = 6.0 Hz, 2H, -PyH), 8.21 (d, J = 7.2 Hz, 1H, thiophene H), 7.65-7.68 (m, 2H, -PyH), 7.61-7.63 (m, 2H, thiophene H and vinyl H), 7.30-7.38 (m, 8H, -ArH and vinyl H ), 7.04-7.15 (m, 8H, -ArH); 13C NMR (100 MHz, DMSO-d6): δ (ppm) 150.48, 150.13, 147.76, 147.00, 146.58, 145.77, 138.65, 137.23, 133.66, 129.74, 129.65, 126.89, 124.75, 123.87, 123.24, 122.18, 119.20, 116.14. HRMS (ESI+): calcd for C32H23N3S [M+H]+ 482.16854, found 482.16852.
3.3. Synthesis of Probe TTAP−AB
Compound TTAP (0.72 g, 1.50 mmol) and 4-(bromomethyl)phenyl acetate (0.36 g, 1.60 mmol) were dissolved in 6 mL dry ethanol, and the mixture was then refluxed under N2 atmosphere overnight. After cooling to room temperature, the mixture was concentrated using rotary evaporators, and the obtained residue was then purified using a neutral aluminum oxide column (CH2Cl2/CH3OH as eluent, v/v = 6:1). The final product TTAP−AB was obtained as a purple black solid (0.66 g, 62% yield). 1H NMR (400 MHz, DMSO-d6): δ (ppm) 9.14 (d, J = 7.2 Hz, 2H, -PyH), 8.62 (d, J = 11.6 Hz, 1H, vinyl H), 8.26 (d, J = 6.8 Hz, 1H, thiophene H), 7.57-7.80 (m, 7H, -PyH, thiophene H and -ArH), 7.35-7.40 (m, 4H, -ArH), 6.94-7.23 (m, 12H, vinyl H and -ArH), 5.79 (s, 2H, -CH2), 2.27 (s, 3H, -CH3); 13C NMR (100 MHz, DMSO-d6): δ (ppm) 169.32, 159.96, 154.66, 150.81, 150.09, 149.07, 146.22, 144.61, 142.34, 135.63, 135.43, 134.69, 132.40, 131.55, 130.20, 129.87, 128.83, 127.70, 125.28, 124.93, 124.45, 122.79, 121.33, 116.64, 98.90, 61.67, 22.11. HRMS (ESI+): calcd for C32H23N3S [M-Br]+ 630.22097, found 630.22103.
3.4. Optical Study
Stock solutions of probe TTAP−AB (5 μM) were prepared in PBS buffer (10 mM, pH 7.4). Stock solutions of the cations (K+, Na+, Zn2+, Cu2+, Mg2+), anions (Cl−, CO32−, SO32−, S2−, H2PO4−), and amino acids (glutamic acid (Glu), cysteine (Cys), glutathione (GSH), Homocysteine (Hcy)) were prepared in deionized water (5 mM). Stock solutions of different enzymes (carboxylesterases, acetyl cholinesterase (AchE), carbonic anhydrase I (CAI), xanthine oxidase (XO), peroxidase (POD), carboxypeptidase A (CPA), leucine aminopeptidase (LAP)) were prepared in sterilized water (8 U/mL). The fluorescence spectra of probe TTAP−AB (5 μM) with different concentrations of CEs or other interferents in PBS buffer (10 mM, pH 7.4) were recorded at 37 ℃.
3.5. Living Cell Imaging
All HepG2 cells were purchased from Wuhan Mingde Biotechnology Co., LTD. For cytotoxicity assay, the cells were firstly incubated in Dulbecco’s modified Eagle medium containing 10% fetal bovine serum, and then the cells were kept at 37 °C under the condition of 5% CO2 for 24 h. After that, the cells were incubated with various concentrations of probe TTAP−AB (5, 10, 15, 20, 25 μM) for 10 h. After washing with PBS, 3-(4,5-dimethylthiazol-2-yl)-2,5-diphenyltetrazolium bromide (MTT) was added and the medium was incubated at 37 °C for 4h. Finally, the absorbance was read at 490 nm using an ELISA reader (Varioskan Flash). The percentage of cell viability was calculated relative to control wells designated as 100% viable cells.
For exogenous CEs imaging, HepG2 cells were firstly stained with TTAP−AB (5 μM) for 30 min, and then incubated with different concentration of CEs (0.10 U/mL, 0.15 U/mL, 0.20 U/mL) at 37 °C for 1 h, respectively. After PBS washing, the image was taken by a confocal fluorescence microscopy (λex = 560 nm; λem = 650–750 nm). For endogenous CEs imaging, HepG2 cells were divided into four groups. As a control group, HepG2 cells were only cultivated with PBS buffer for 30 min. In the second group, the cells were incubated with probe TTAP−AB (5 μM) for 1 h. In the third group, HepG2 cells were pre-treated with the drug 5-fluorouracil (5-FU, 100 μM) for 6 h, and then incubated with TTAP−AB (5 μM) for 1 h. In the final group, HepG2 cells were pre-treated with (4-(2-Aminoethyl)benzenesulfonyl fluoride hydrochloride (AEBSF, a CEs inhibitor, 1 mM) for 2 h, and then incubated with TTAP−AB (5 μM) for another 1 h. Prior to imaging, the above cells were washed with PBS buffer (10 mM, pH = 7.4) for 3 times. And then, fluorescence imaging was taken by a confocal fluorescence microscopy (λex = 560 nm; λem = 650–750 nm).
3.6. Zebrafish Imaging
Zebrafish embryos were purchased from Shanghai FishBio Co., Ltd. (Shanghai, China). Larval zebrafish (4 days old) were used for imaging, and they were divided into four groups. In a control group, zebrafish were only cultured with probe TTAP−AB (5 μM) at 37 ℃ for 1 h. In the second group, zebrafish were grown with drug 5-FU (50 μM) for 10 h, and then stained with TTAP−AB (5 μM) at 37 ℃ for another 1 h. In the third group, zebrafish were stained with drug 5-FU (100 μM) for 10 h, and then incubated with TTAP−AB (5 μM) at 37 ℃ for another 1 h. In the last group, zebrafish were firstly treated with 5-FU (100 μM) for 10 h, and then cultivated with AEBSF (1 mM) for 4 h, finally stained with TTAP−AB (5 μM) at 37 °C for another 1 h. All zebrafish were washed three times with embryo media, and then transferred to a confocal fluorescence microscopy for imaging (λex = 560 nm; λem = 650–750 nm).
3.7. Fluorescence Imaging in Mice
All animal experiments were approved by the Experimental Animal Ethics Committee of Wuchang University of Technology, which were conducted according to the guidelines for animal experiments. All BALB/c mice (18-20 g) were purchased from Shanghai Slac Laboratory Animal Co., Ltd. (Shanghai, China), and operated in accordance with Wuchang University of Technology guidelines.
For histology and immunohistochemical staining, all tissues of BALB/c mice were immediately fixed in 10% formaldehyde after sacrifice. Histological examination was carried out according to a conventional methods [12,13,19], and stained with hematoxylin and eosin (H&E). The morphology of any observed lesions was classified and recorded according to the classification criteria.
For imaging CEs in vivo, The mice were divided into two groups. As a control group, mice were intravenously injected with PBS (100 μL). In the experimental group, mice were intravenously with probe TTAP−AB (100 μL, 200 μM) for real-time recording. All the mice were anaesthetized and performed in vivo imaging. After that, they were used for the biodistribution studies. These mice were killed by euthanasia, and their organs (heart, liver, spleen, lung, kidney) were dissected for fluorescence measurements. The fluorescence images were obtained by a BLT AniView 600 small animal optical imaging system (China) (λex = 600 nm, λem = 650-750 nm).
For visualizing CEs in tumor-bearing mice, the HepG2 cells (5 × 10⁷ cells) were subcutaneously injected into female BALB/c mice (18-20 g) to establish a mouse tumor model. After 20 days, probe TTAP−AB (20 μL, 100 μM) was injected into tumor-bearing mice. All the mice were anaesthetized in vivo imaging, and the liver tumor was dissected from mice after the euthanasia. The fluorescence images were obtained by a BLT AniView 600 small animal optical imaging system (China) (λex = 600 nm, λem = 650-750 nm).
4. Conclusions
In summary, a new NIR fluorescent probe TTAP−AB has been reasonably constructed for visualizing CEs in living systems. Under physiological conditions, probe TTAP−AB could selectively, sensitively, and fast detect CEs through AIE mechanism. The sensing mechanism was confirmed by HRMS, 1H NMR and fluorescence spectra. In addition, probe TTAP−AB exhibited the good biocompatibility as well as the excellent cell, tissue permeability, and it was favorably employed to monitor the dynamic change of CEs levels under drug-induced modulation in living cells and zebrafish. More importantly, probe TTAP−AB was able to image the liver tumor and assisted tumor resection by the real-time detection of CEs, indicating that TTAP−AB has a great potential for practical clinical applications. Taken together, probe TTAP−AB can not only enrich the strategies for CEs detection in biological systems, but also exhibit great potential for some clinical imaging applications, including medical diagnosis, preclinical research, and imaging-guided surgery.
Supplementary Materials
The following supporting information can be downloaded at the website of this paper posted on Preprints.org, Table S1: Summary of the recent single detection probes for CEs; Section S2: Calculation of the detection limit; Section S3: The synthesis of product from probe TTAP−AB with CEs; Section S4: Synthesis of compound 2; Figure S1: The HRMS data of TTAP−AB before and after treating with CEs; Figure S2: The DLS profiles of probe TTAP−AB (15 μM) in PBS buffer (with 1% DMSO) (a) and compound TTAP (15 μM) in PBS buffer (with 1% DMSO) (b); Figure S3: Viability of HepG2 cells after the incubation with different concentrations of probe TTAP−AB; Figure S4: Normalized fluorescence intensity for cell imaging, error bars are ± SD (n = 3); Figure S5: Representative histological sections (H&E staining) for main organs of the mice without and with the injection of probe TTAP−AB (100 μL, 200 μM). Scale bar = 100 μm; Figure S6: 1H NMR (400 MHz, DMSO-d6) spectrum of compound 2; Figure S7: 13C NMR (100 MHz, DMSO-d6) spectrum of compound 2; Figure S8: 1H NMR (400 MHz, DMSO-d6) spectrum of TTAP; Figure S9: 13C NMR (100 MHz, DMSO-d6) spectrum of TTAP; Figure S10: 1H NMR (400 MHz, DMSO-d6) spectrum of TTAP−AB; Figure S11: 13C NMR (100 MHz, DMSO-d6) spectrum of TTAP−AB; Figure S12: HRMS spectrum of TTAP; Figure S13: HRMS spectrum of TTAP−AB.
Author Contributions
Conceptualization and data curation, C.G.; Validation and formal analysis, D.C.; Resources, and funding acquisition, H.L.; Visualization and software, M.M.; Investigation, L.Z.; Writing—review and editing, and Supervision, H.C. All authors have read and agreed to the published version of the manuscript.
Funding
This research was funded by the Natural Science Foundation of China (No. 22174100).
Institutional Review Board Statement
Not applicable.
Informed Consent Statement
Not applicable.
Data Availability Statement
The data presented in this study are available on request from the corresponding author.
Acknowledgments
Thanks for the support and assistance from Wuchang University of Technology during the research process.
Conflicts of Interest
The authors declare no conflicts of interest.
References
- Laizure, S.C.; Herring, V.; Hu, Z.; Witbrodt, K.; Parker, R.B. The role of human carboxylesterases in drug metabolism: have we overlooked their importance? Pharmacotherapy. 2013, 33, 210–222. [Google Scholar] [CrossRef] [PubMed]
- Wang, D.; Zou, L.; Jin, Q.; Hou, J.; Ge, G.; Yang, L. Human carboxylesterases: a comprehensive review, Acta Pharm. Sin B. 2018, 8, 699–712. [Google Scholar]
- Lian, J.; Nelson, R.; Lehner, R. Carboxylesterases in lipid metabolism: from mouse to human. Protein. Cell. 2018, 9, 178–195. [Google Scholar] [CrossRef] [PubMed]
- Na, K.; Lee, E.Y.; Lee, H.J.; Kim, K.Y.; Lee, H.; Jeong, S.K.; Jeong, A.S.; Cho, S.Y.; Kim, S.A.; Song, S.Y.; Kim, K.S.; Cho, S.W.; Kim, H.; Paik, Y.K. Human plasma carboxylesterase 1, a novel serologic biomarker candidate for hepatocellular carcinoma. Proteomics. 2009, 9, 3989–3999. [Google Scholar] [CrossRef]
- Feng, J.; Xu, Y.; Huang, W.; Kong, H.; Li, Y.; Cheng, H.; Li, L. A magnetic SERS immunosensor for highly sensitive and selective detection of human carboxylesterase 1 in human serum samples. Anal. Chim. Acta. 2020, 1097, 176–185. [Google Scholar] [CrossRef] [PubMed]
- Liu, X.; Flinders, C.; Mumenthaler, S.M.; Hummon, A.B. MALDI mass spectrometry imaging for evaluation of therapeutics in colorectal tumor organoids. J. Am. Soc. Mass Spectrom. 2018, 29, 516–26. [Google Scholar] [CrossRef]
- Wang, D.D.; Jin, Q.; Hou, J.; Feng, L.; Li, N.; Li, S.Y.; Zhou, Q.; Zou, L.W.; Ge, G.B.; Wang, J.G.; Yang, L. Highly sensitive and selective detection of human carboxylesterase 1 activity by liquid chromatography with fluorescence detection. J. Chromatogr. B 2016, 1008, 212–218. [Google Scholar] [CrossRef]
- Zhao, M.; Zhang, T.; Yu, F.; Guo, L.; Wu, B. E4bp4 regulates carboxylesterase 2 enzymes through repression of the nuclear receptor Rev-erbα in mice. Biochem. Pharmacol. 2018, 152, 293–301. [Google Scholar] [CrossRef]
- Singh, A.; Gao, M.; Beck, M.W. Human carboxylesterases and fluorescent probes to image their activity in live cells. RSC Med. Chem. 2021, 12, 1142–1153. [Google Scholar] [CrossRef]
- Wang, K.; Wang, R.; Yan, Z.; Li, Y.; Shi, Y.; Ge, J.Y.; Bai, Y.; Chen, Z.; Zhang, L. Rational design of a highly sensitive carboxylesterase probe and its application in high-throughput screening for uncovering carboxylesterase inhibitors. J. Org. Chem. 2024. [Google Scholar] [CrossRef]
- Lin, X.; Liu, M.; Yi, Q.; Zhou, Y.; Su, J.; Qing, B.; Lu, Y.; Pu, C.; Lan, W.; Zou, L.; Wang, J. Design, synthesis, and evaluation of a carboxylesterase detection probe with therapeutic effects. Talanta. 2024, 274, 126060. [Google Scholar] [CrossRef] [PubMed]
- Qi, Y.I.; Wang, H.R.; Chen, L.L.; Yang, B.; Yang, Y.S.; He, Z.X.; Zhu, H.L. Multifunctional fluorescent probe for simultaneously detecting microviscosity, micropolarity, and carboxylesterases and its application in bioimaging. Anal. Chem. 2022, 94, 4594–4601. [Google Scholar] [CrossRef] [PubMed]
- Zhang, B.; Qin, S.; Wang, N.; Lu, X.; Jiao, J.; Zhang, J.; Zhao, W. Diketopyrrolopyrrole-based fluorescent probe for visualizing over-expressed carboxylesterase in fever via ratiometric imaging. Talanta. 2024, 266, 124971. [Google Scholar] [CrossRef]
- Zhang, W.; Qi, C.; Wang, X.; Fu, Z.; Zhang, J.; Zhou, Y.; Wang, Y. An ultrasensitive and selective near-infrared fluorescent probe for tracking carboxylesterases with large Stokes shift in living cells and mice. Spectrochim Acta A. 2024, 308, 123708. [Google Scholar] [CrossRef]
- Li, N.; Yang, W.; Liu, R.; Chen, Q.; Yang, J.; Ni, Z.; Yin, X.; Zhou, Q.; Tang, Z. An innovative near-infrared fluorescent probe designed to track the evolution of carboxylesterase in drug-induced liver injury. Sens. Actuators, B 2024, 402, 135133. [Google Scholar] [CrossRef]
- Yang, B.; Ding, X.; Li, J.; Lai, J.; Zhang, Z.; Xu, X.; Liu, Z.; Song, Z.; Wang, X.; Wang, B. Dihydroxanthene-derived fluorescent probe with near-infrared excitation and emission maxima for detecting human carboxylesterase-2 and bioimaging. Sens. Actuators, B 2023, 395, 134503. [Google Scholar] [CrossRef]
- Liu, S.Y.; Zou, X.; Guo, Y.; Gao, X. A highly sensitive and selective enzyme activated fluorescent probe for in vivo profiling of carboxylesterase 2. Anal. Chim. Acta. 2022, 1221, 340126. [Google Scholar] [CrossRef] [PubMed]
- Shu, Y.; Huang, C.; Liu, H.; Hu, F.; Wen, H.; Liu, J.; Wang, X.; Shan, C.; Li, W. A hemicyanine-based fluorescent probe for simultaneous imaging of carboxylesterases and histone deacetylases in hepatocellular carcinoma. Spectrochim. Acta A 2022, 281, 121529. [Google Scholar] [CrossRef] [PubMed]
- Wen, Y.; Jing, N.; Zhang, M.; Huo, F.; Li, Z.; Yin, C. A space-dependent ‘enzyme-substrate’ type probe based on ‘carboxylesterase-amide group’ for ultrafast fluorescent imaging orthotopic hepatocellular carcinoma. Adv. Sci. 2023, 10, 2206681. [Google Scholar] [CrossRef]
- Sun, Y.; Zhou, X.; Sun, L.; Zhao, X.; He, Y.; Gao, G.; Han, W.; Zhou, J. Lysosome-targeting red fluorescent probe for broad carboxylesterases detection in breast cancer cells. Chin. Chem. Lett. 2022, 33, 4229–4232. [Google Scholar] [CrossRef]
- Kong, Q.; Wang, J.; Chen, Y.; Zheng, S.; Chen, X.; Wang, Y.; Wang, F. The visualized fluorescent probes based on benzothiazole used to detect esterase. Dye. Pigment. 2021, 191, 109349. [Google Scholar] [CrossRef]
- Dai, J.; Zhao, Y.; Hou, Y.; Zhong, G.; Gao, R.; Wu, J.; Shen, B.; Zhang, X. Detection of carboxylesterase 1 and carbamates with a novel fluorescent protein chromophore based probe. Dye. Pigment. 2021, 192, 109444. [Google Scholar] [CrossRef]
- Hilderbrand, S.A.; Weissleder, R. Near-infrared fluorescence: application to in vivo molecular imaging. Curr. Opin. Chem. Biol. 2010, 14, 71–79. [Google Scholar] [CrossRef] [PubMed]
- Reja, S.I.; Minoshima, M.; Hori, Y.; Kikuchi, K. Near-infrared fluorescent probes: a next-generation tool for protein-labeling applications. Chem. Sci. 2020, 12, 3437–3447. [Google Scholar] [CrossRef]
- Luo, J.; Xie, Z.; Lam, J.W.Y.; Cheng, L.; Tang, B.Z.; Chen, H.; Qiu, C.; Kwok, H.S.; Zhan, X.; Liu, Y.; Zhu, D. Aggregation-induced emission of 1-methyl-1,2,3,4,5-pentaphenylsilole. Chem. Commun. 2001, 18, 1740–1741. [Google Scholar] [CrossRef] [PubMed]
- Mei, J.; Huang, Y.; Tian, H. Progress and trends in AIE-based bioprobes: a brief overview. ACS Appl. Mater. Interfaces 2018, 10, 12217–12261. [Google Scholar] [CrossRef] [PubMed]
- Zhu, F.Y.; Mei, L.J.; Tian, R.; Li, C.; Wang, Y.L.; Xiang, S.L.; Zhu, M.Q.; Tang, B.Z. Recent advances in super-resolution optical imaging based on aggregation-induced emission. Chem. Soc. Rev. 2024, 53, 3350–3383. [Google Scholar] [CrossRef] [PubMed]
- Wang, R.; Hou, M.; Xu, Z.; Tan, L.; Zhong, C.; Zhu, L. A new red fluorophore with aggregation enhanced emission by an unexpected “One-step” protocol. RSC Adv. 2018, 8, 18327–18333. [Google Scholar] [CrossRef]
- Shen, X.Y.; Wang, Y.J.; Zhao, E.; Yuan, W.Z.; Liu, Y.; Lu, P.; Qin, A.; Ma, Y.; Sun, J.Z.; Tang, B.Z. Effects of substitution with donor−acceptor groups on the properties of tetraphenylethene trimer: aggregation-induced emission, solvatochromism, and mechanochromism. J. Phys. Chem. C 2013, 117, 7334–7347. [Google Scholar] [CrossRef]
- Hong, Y.; Lam, J.W.Y.; Tang, B.Z. Aggregation-induced emission: phenomenon, mechanism and applications. Chem. Commun. 2009, 29, 4332–4353. [Google Scholar] [CrossRef]
- Li, Q.; Zhu, W.; Gong, S.; Jiang, S.; Feng, G. Selective visualization of tumor cell membranes and tumors with a viscosity-sensitive plasma membrane probe. Anal. Chem. 2023, 95, 7254–7261. [Google Scholar] [CrossRef] [PubMed]
Scheme 1.
The proposed mechanism of probe TTAP−AB toward CEs.
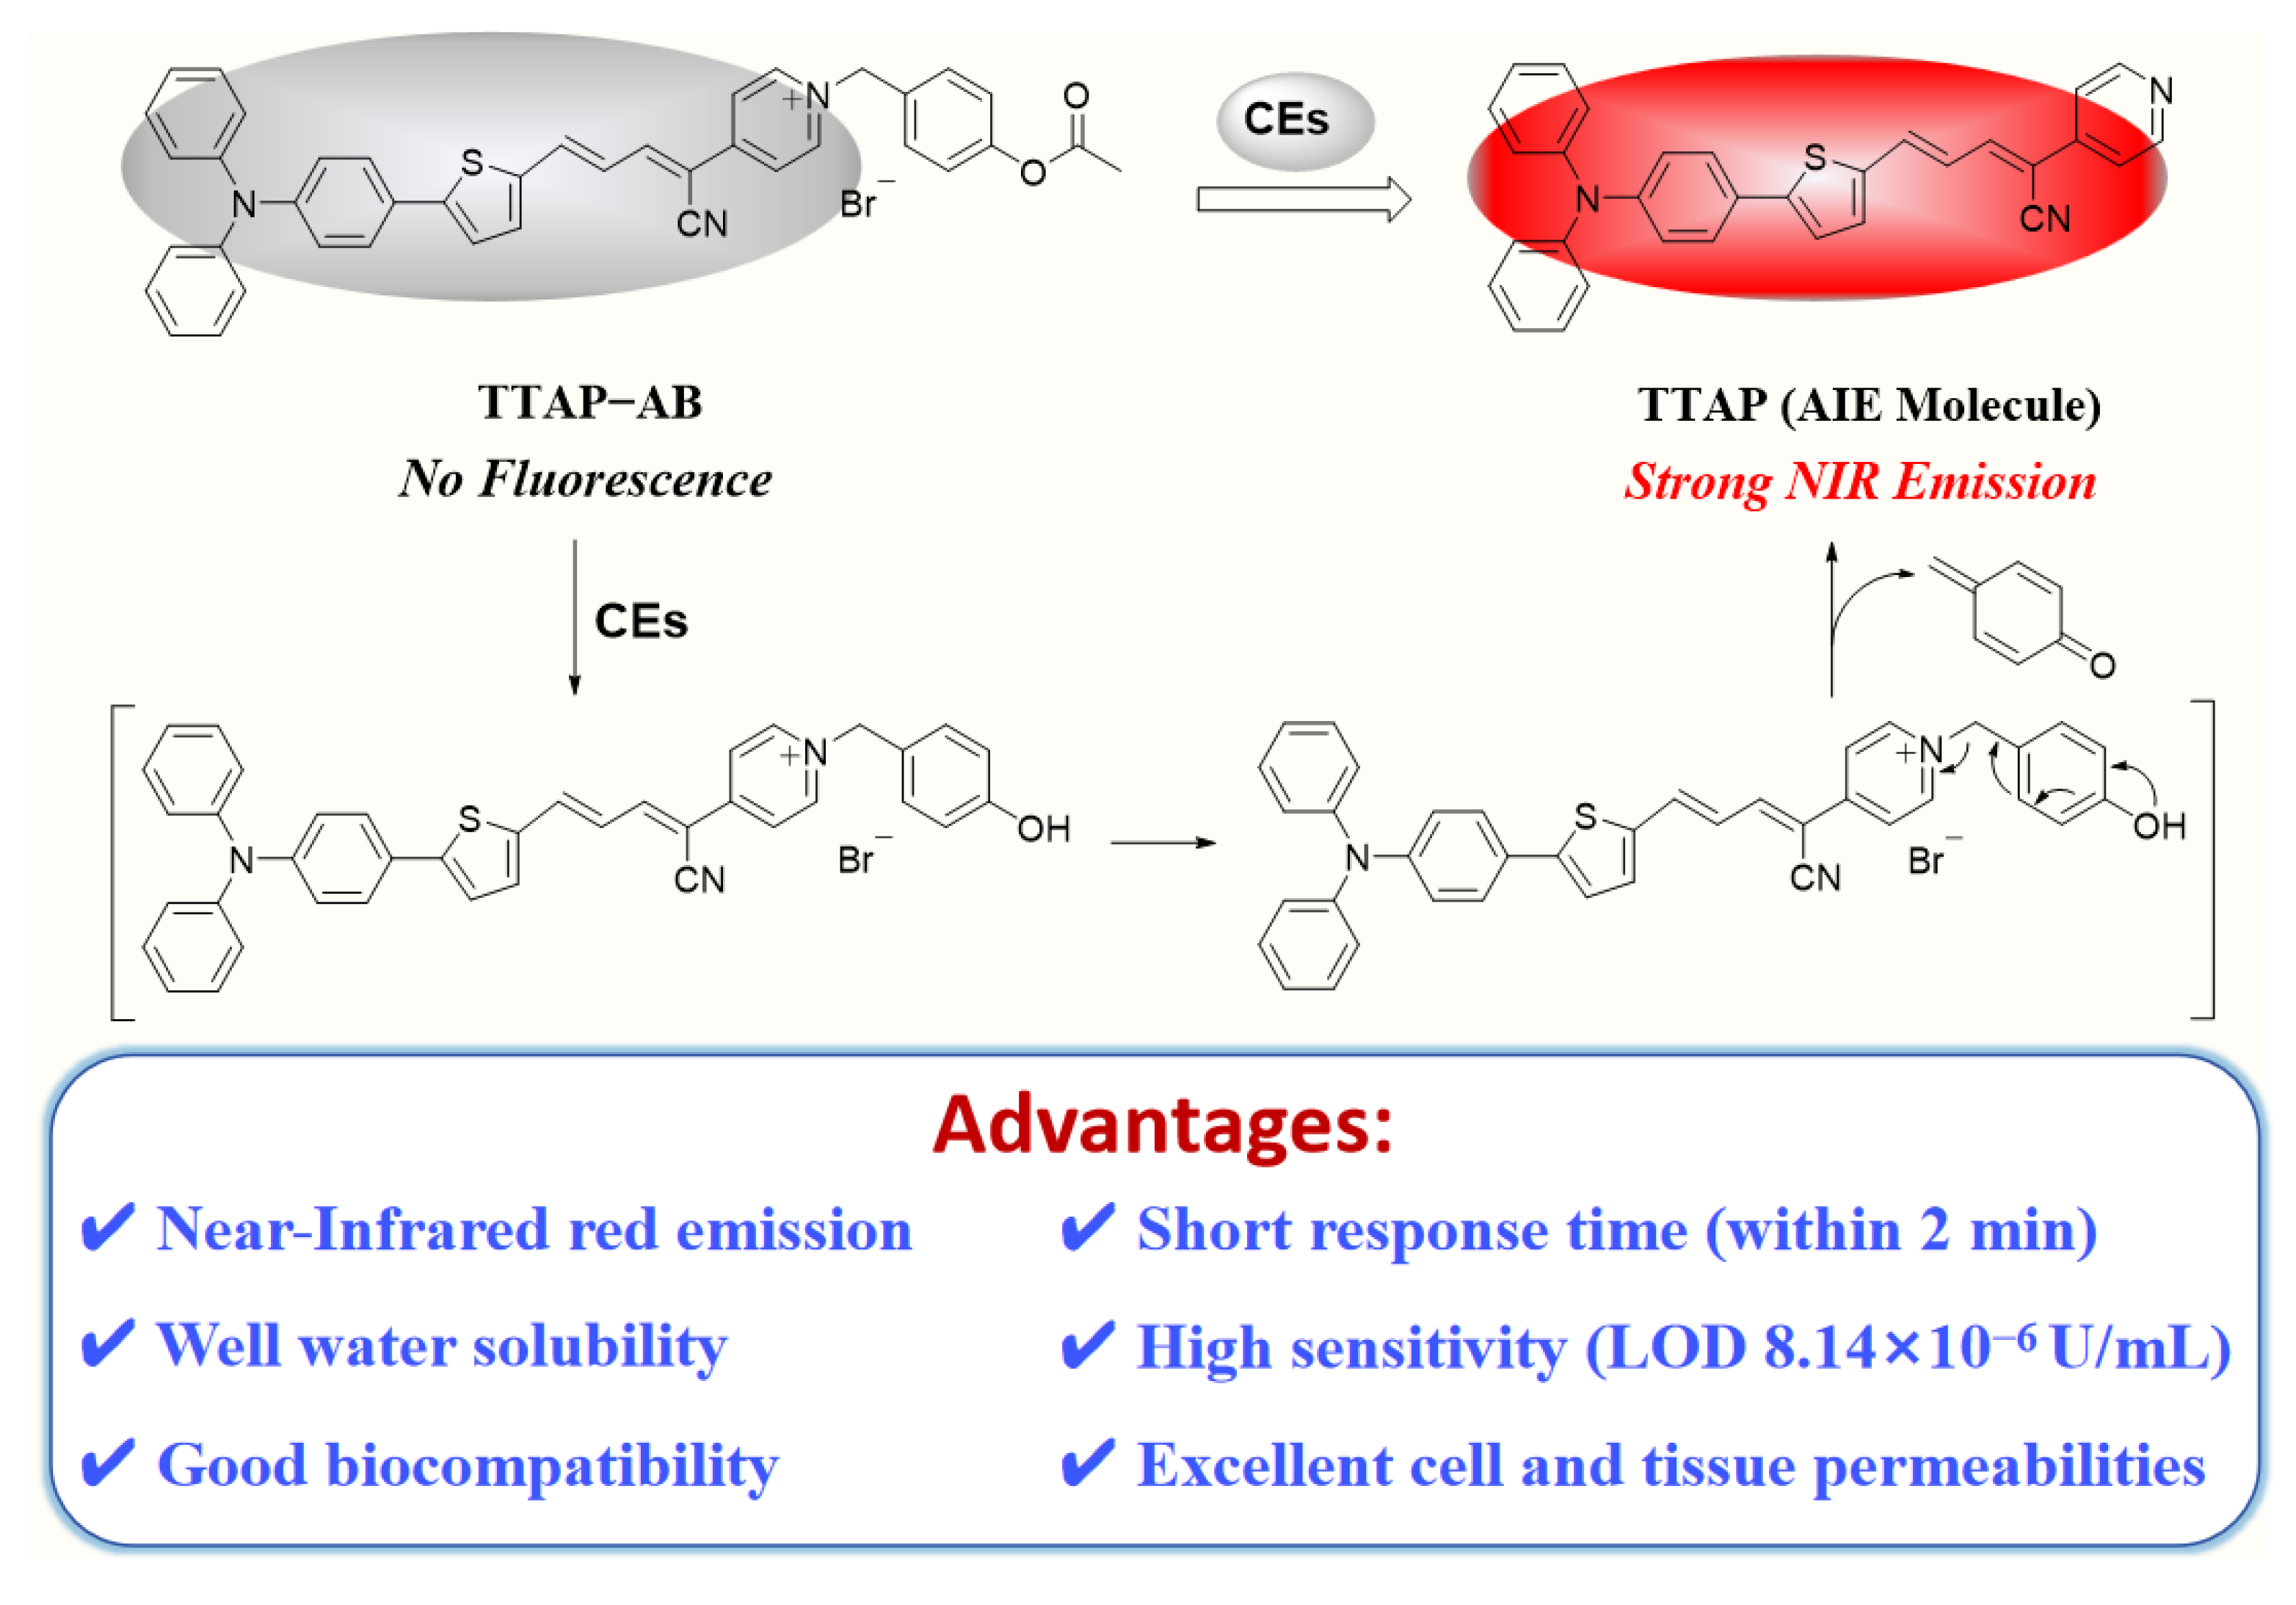
Figure 1.
(a) Normalized absorption of probe TTAP−AB (5 μM) toward 0.25 U/mL CEs. Inset: the corresponding photographs taken under sun light. (b) Fluorescence spectra of probe TTAP−AB (5 μM) toward CEs (0.00–0.25 U/mL). λex = 505 nm; Slit width: 5 nm. Inset: the corresponding photographs taken under 365 nm light. (c) The fitted linear relationship of fluorescence intensity at 692 nm versus CEs concentrations. (d) DLS profiles of TTAP−AB (5 μM) with 0.25 U/mL of CEs in PBS buffer. Error bars are ± SD (n = 3).
Figure 1.
(a) Normalized absorption of probe TTAP−AB (5 μM) toward 0.25 U/mL CEs. Inset: the corresponding photographs taken under sun light. (b) Fluorescence spectra of probe TTAP−AB (5 μM) toward CEs (0.00–0.25 U/mL). λex = 505 nm; Slit width: 5 nm. Inset: the corresponding photographs taken under 365 nm light. (c) The fitted linear relationship of fluorescence intensity at 692 nm versus CEs concentrations. (d) DLS profiles of TTAP−AB (5 μM) with 0.25 U/mL of CEs in PBS buffer. Error bars are ± SD (n = 3).
Figure 2.
(a) Fluorescence spectra of probe TTAP−AB (5 μM) in response to various species (0.20 U/mL CEs, 0.60 U/mL other enzymes, 100 μM different amino acids and ions) in PBS buffer (10 mM, pH 7.4). 1: Blank; 2: CEs; 3: AchE; 4: CAI; 5: XO; 6: POD; 7: CPA; 8: LAP; 9: Glu; 10: Cys; 11: GSH; 12: Hcy; 13: K+; 14: Na+; 15: Zn2+; 16: Cu2+; 17: Mg2+; 18: Cl−; 19: CO32−; 20: SO32−; 21: S2−; 22: H2PO4−. Insert: The corresponding photos taken under 365 nm light. (b) The fluorescence intensity of TTAP−AB (5 μM) in the presence of various analytes (100 μM or 0.60 U/mL) without and with CEs (0.20 U/mL). 1: Blank; 2: AchE; 3: CAI; 4: XO; 5: POD; 6: CPA; 7: LAP; 8: Glu; 9: Cys; 10: GSH; 11: Hcy; 12: K+; 13: Na+; 14: Zn2+; 15: Cu2+; 16: Mg2+; 17: Cl−; 18: CO32−; 19: SO32−; 20: S2−; 21: H2PO4−. (c) The time-dependent experiments of probe TTAP−AB (5 µM) without and with CEs (0.20 U/mL). (d) Fluorescence intensity changes of TTAP−AB (5 µM) in the presence of CEs (0.20) under different pH conditions. The fluorescence intensity was recorded at 692 nm. λex = 505 nm, error bars are ± SD (n = 3).
Figure 2.
(a) Fluorescence spectra of probe TTAP−AB (5 μM) in response to various species (0.20 U/mL CEs, 0.60 U/mL other enzymes, 100 μM different amino acids and ions) in PBS buffer (10 mM, pH 7.4). 1: Blank; 2: CEs; 3: AchE; 4: CAI; 5: XO; 6: POD; 7: CPA; 8: LAP; 9: Glu; 10: Cys; 11: GSH; 12: Hcy; 13: K+; 14: Na+; 15: Zn2+; 16: Cu2+; 17: Mg2+; 18: Cl−; 19: CO32−; 20: SO32−; 21: S2−; 22: H2PO4−. Insert: The corresponding photos taken under 365 nm light. (b) The fluorescence intensity of TTAP−AB (5 μM) in the presence of various analytes (100 μM or 0.60 U/mL) without and with CEs (0.20 U/mL). 1: Blank; 2: AchE; 3: CAI; 4: XO; 5: POD; 6: CPA; 7: LAP; 8: Glu; 9: Cys; 10: GSH; 11: Hcy; 12: K+; 13: Na+; 14: Zn2+; 15: Cu2+; 16: Mg2+; 17: Cl−; 18: CO32−; 19: SO32−; 20: S2−; 21: H2PO4−. (c) The time-dependent experiments of probe TTAP−AB (5 µM) without and with CEs (0.20 U/mL). (d) Fluorescence intensity changes of TTAP−AB (5 µM) in the presence of CEs (0.20) under different pH conditions. The fluorescence intensity was recorded at 692 nm. λex = 505 nm, error bars are ± SD (n = 3).
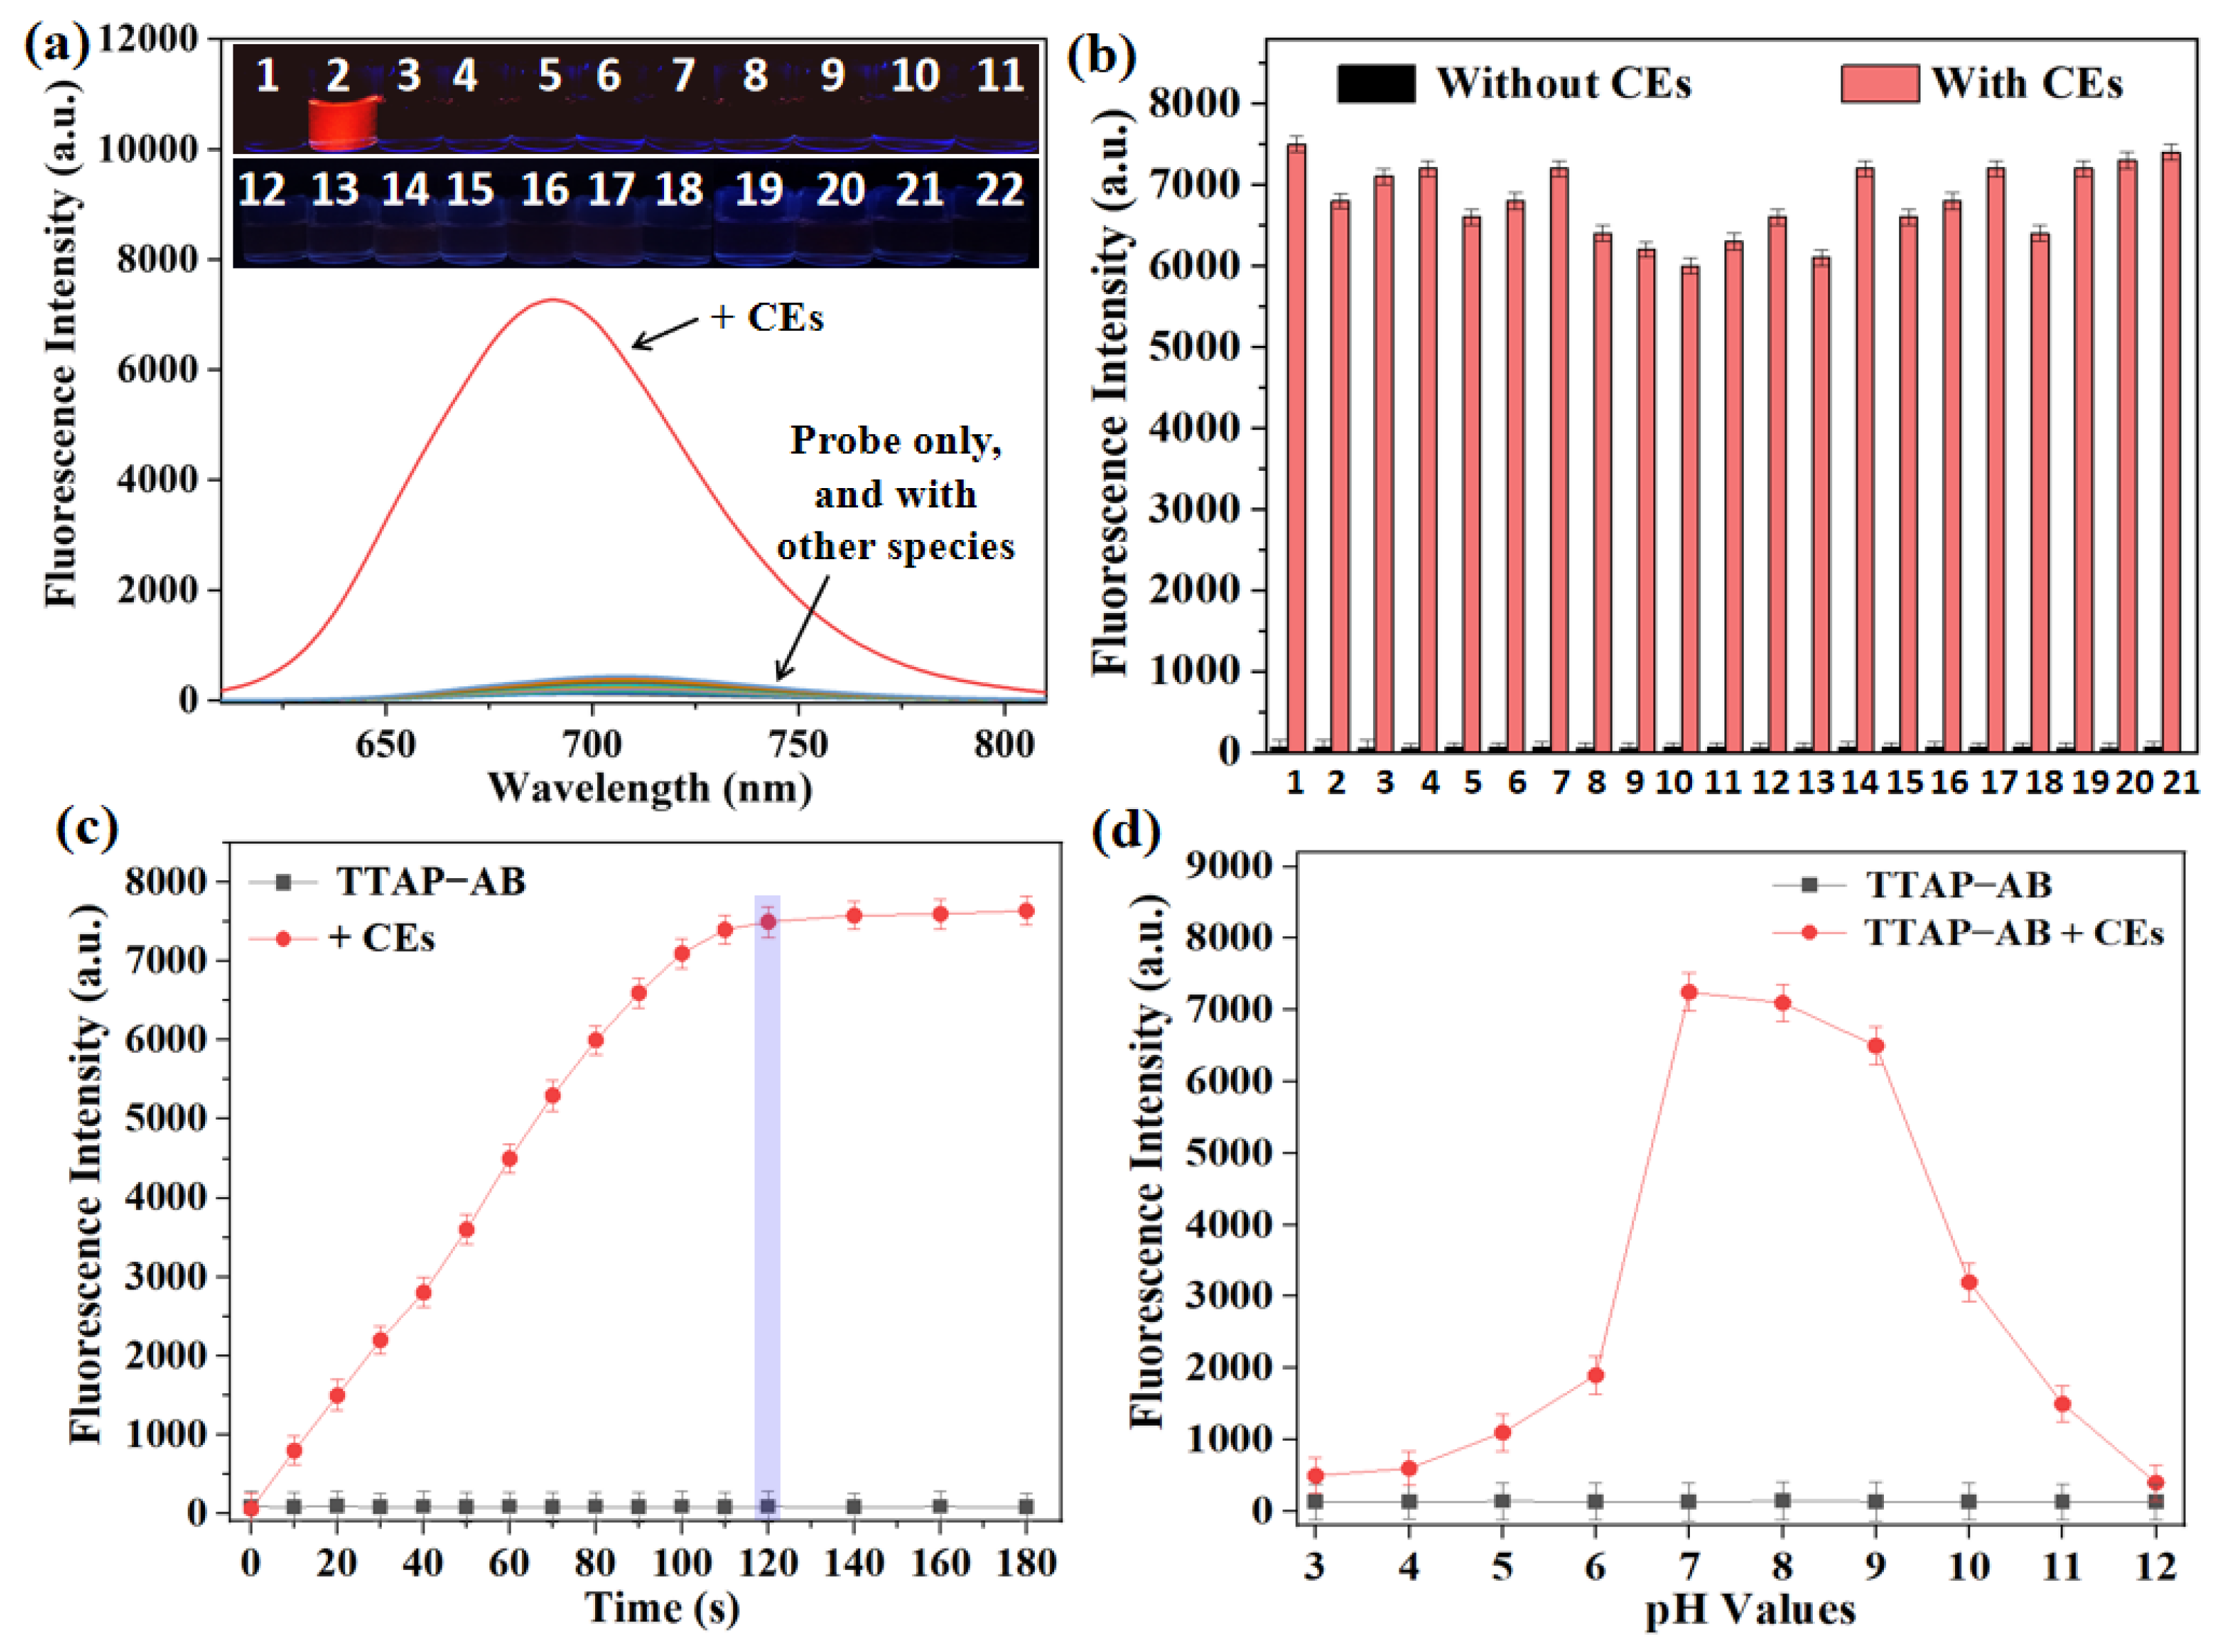
Figure 3.
1H NMR spectra of compound TTAP, probe TTAP−AB, and the isolated product of TTAP−AB with CEs conducted in DMSO-d6.
Figure 3.
1H NMR spectra of compound TTAP, probe TTAP−AB, and the isolated product of TTAP−AB with CEs conducted in DMSO-d6.
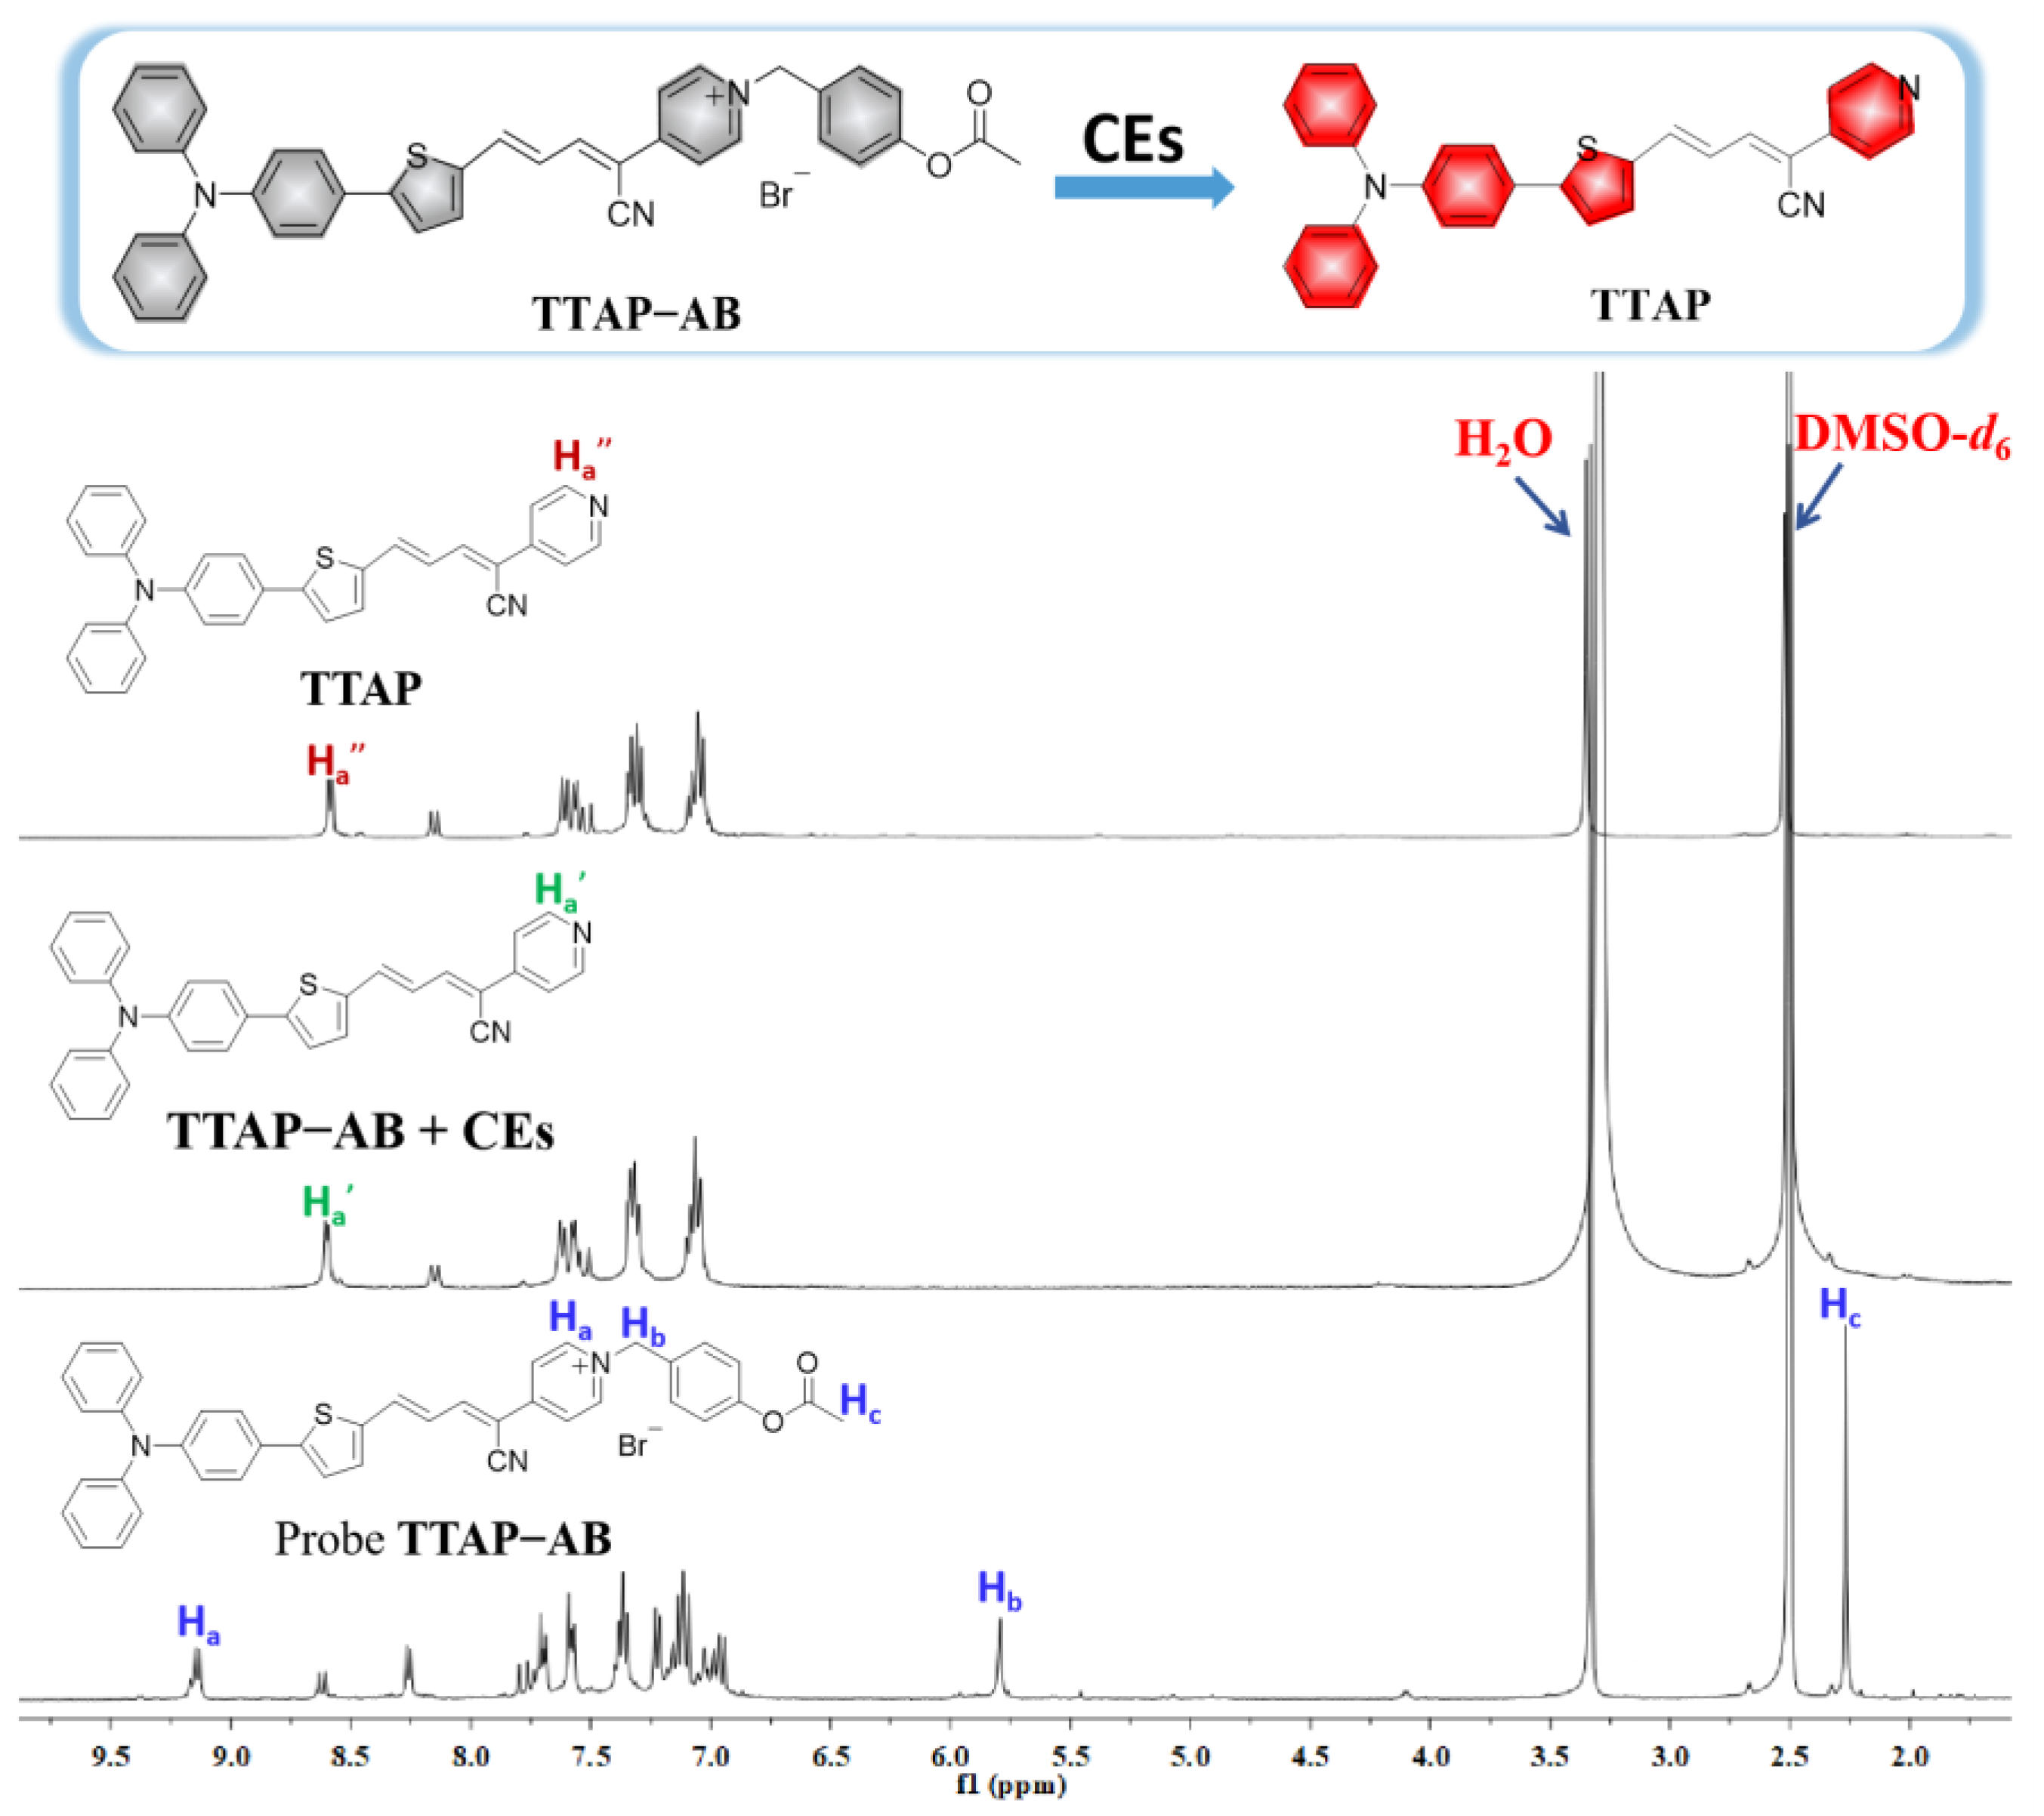
Figure 4.
The fluorescence intensity of probe TTAP−AB (15 μM) and compound TTAP (15 μM) in DMSO–PBS buffer mixture with different volume fractions of PBS buffer (fP %). Insert: the photos of TTAP in different solutions taken under 365 nm light irradiation. Error bars are ± SD (n = 3).
Figure 4.
The fluorescence intensity of probe TTAP−AB (15 μM) and compound TTAP (15 μM) in DMSO–PBS buffer mixture with different volume fractions of PBS buffer (fP %). Insert: the photos of TTAP in different solutions taken under 365 nm light irradiation. Error bars are ± SD (n = 3).
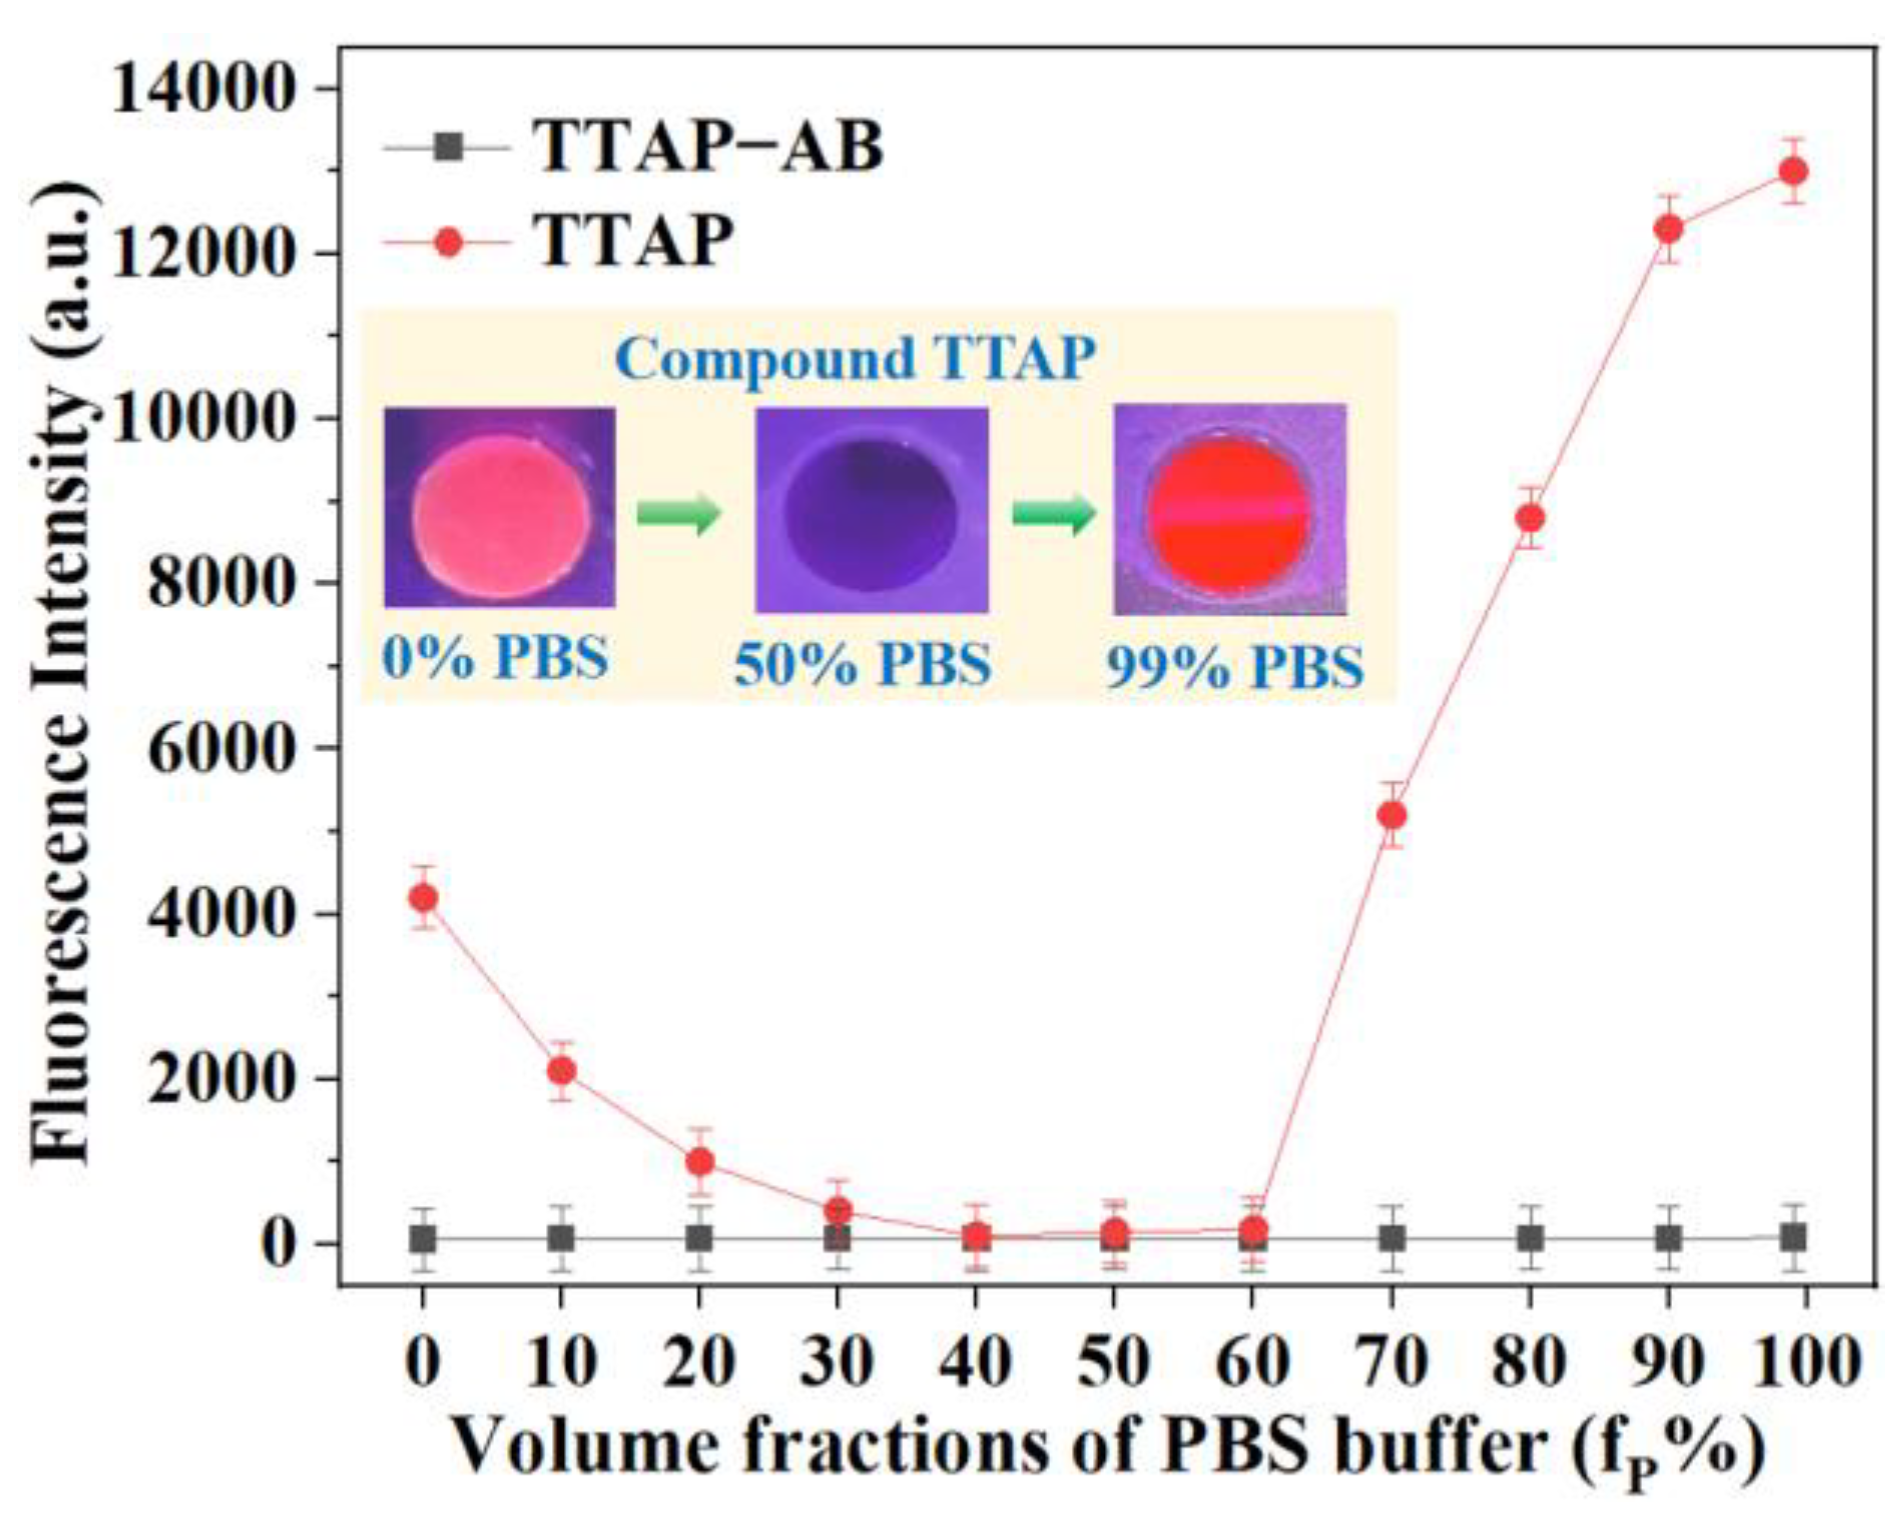
Figure 5.
(a) Confocal imaging of the different concentrations of CEs in living HepG2 cells. λex = 560 nm; λem = 650–750 nm. (b) Relative intensities of cell imaging. Error bars are ± SD (n = 3).
Figure 5.
(a) Confocal imaging of the different concentrations of CEs in living HepG2 cells. λex = 560 nm; λem = 650–750 nm. (b) Relative intensities of cell imaging. Error bars are ± SD (n = 3).
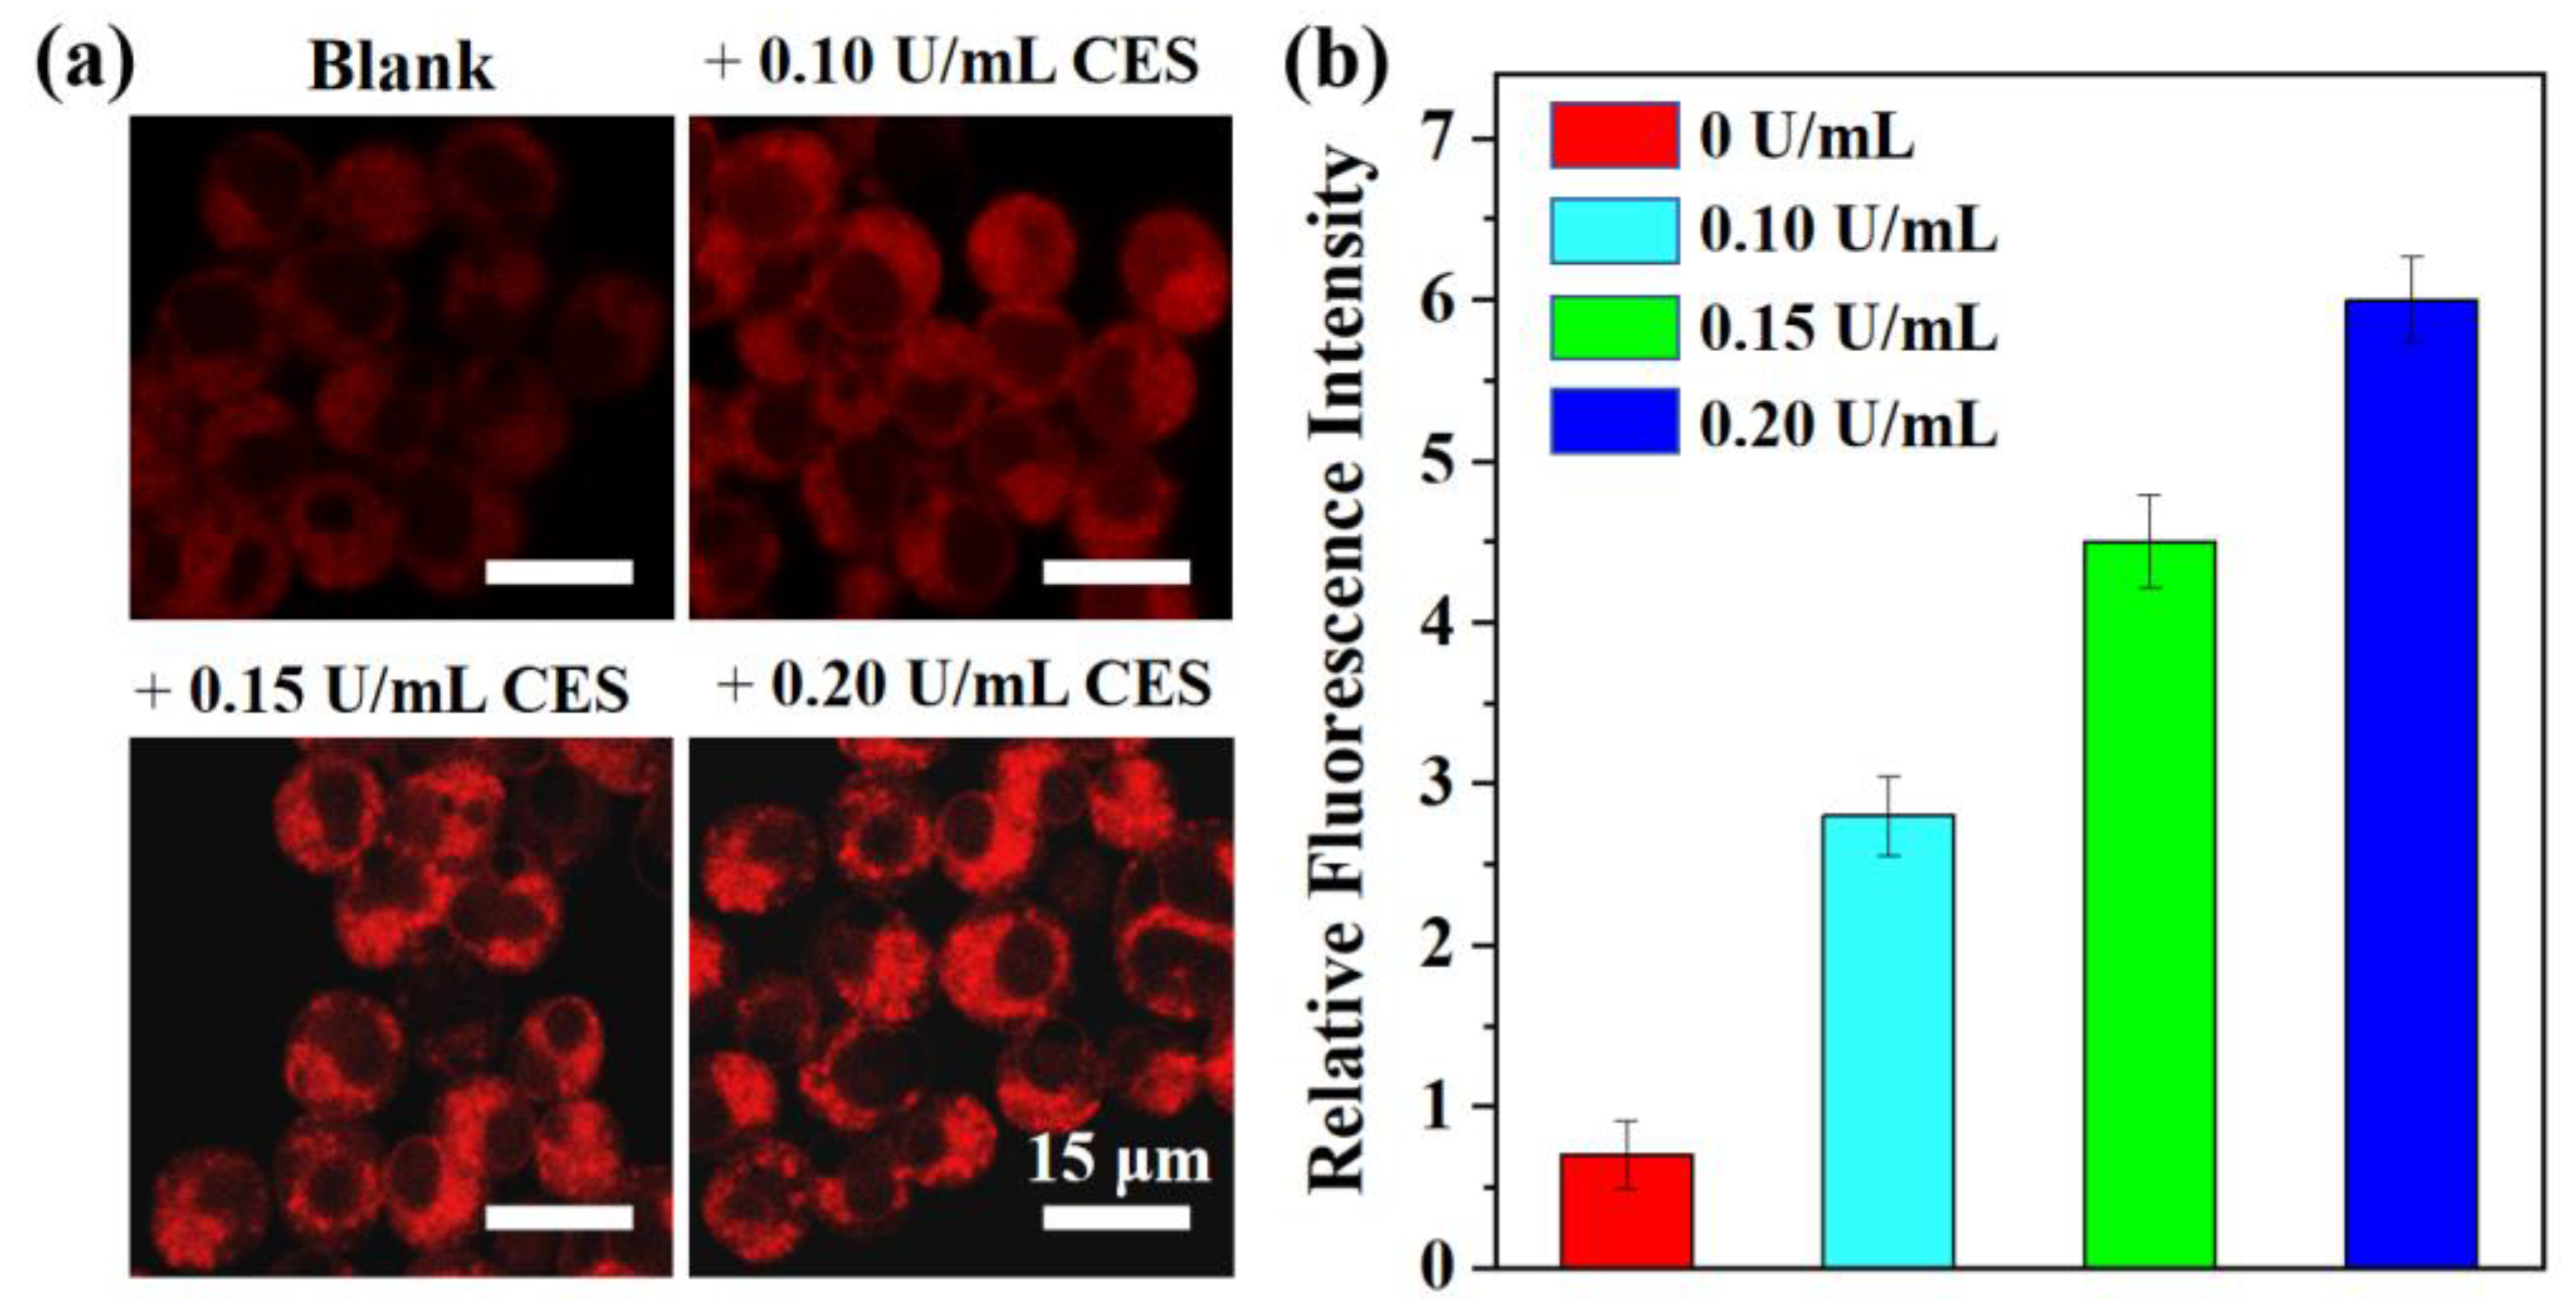
Figure 6.
Confocal imaging of CEs in living HepG2 cells. (a-c) Untreated cells. (d-f) Cells incubated with probe TTAP−AB (5 μM) for 1 h. (g-i) Cells successively treated with 5-FU (100 μM) for 6 h and TTAP−AB (5 μM) for 1 h. (j-l) Cells successively treated with AEBSF (1 mM) for 2 h and TTAP−AB (5 μM) for another 1 h. Incubation temperature, 37 ℃; λex = 560 nm, λem = 650–750 nm.
Figure 6.
Confocal imaging of CEs in living HepG2 cells. (a-c) Untreated cells. (d-f) Cells incubated with probe TTAP−AB (5 μM) for 1 h. (g-i) Cells successively treated with 5-FU (100 μM) for 6 h and TTAP−AB (5 μM) for 1 h. (j-l) Cells successively treated with AEBSF (1 mM) for 2 h and TTAP−AB (5 μM) for another 1 h. Incubation temperature, 37 ℃; λex = 560 nm, λem = 650–750 nm.
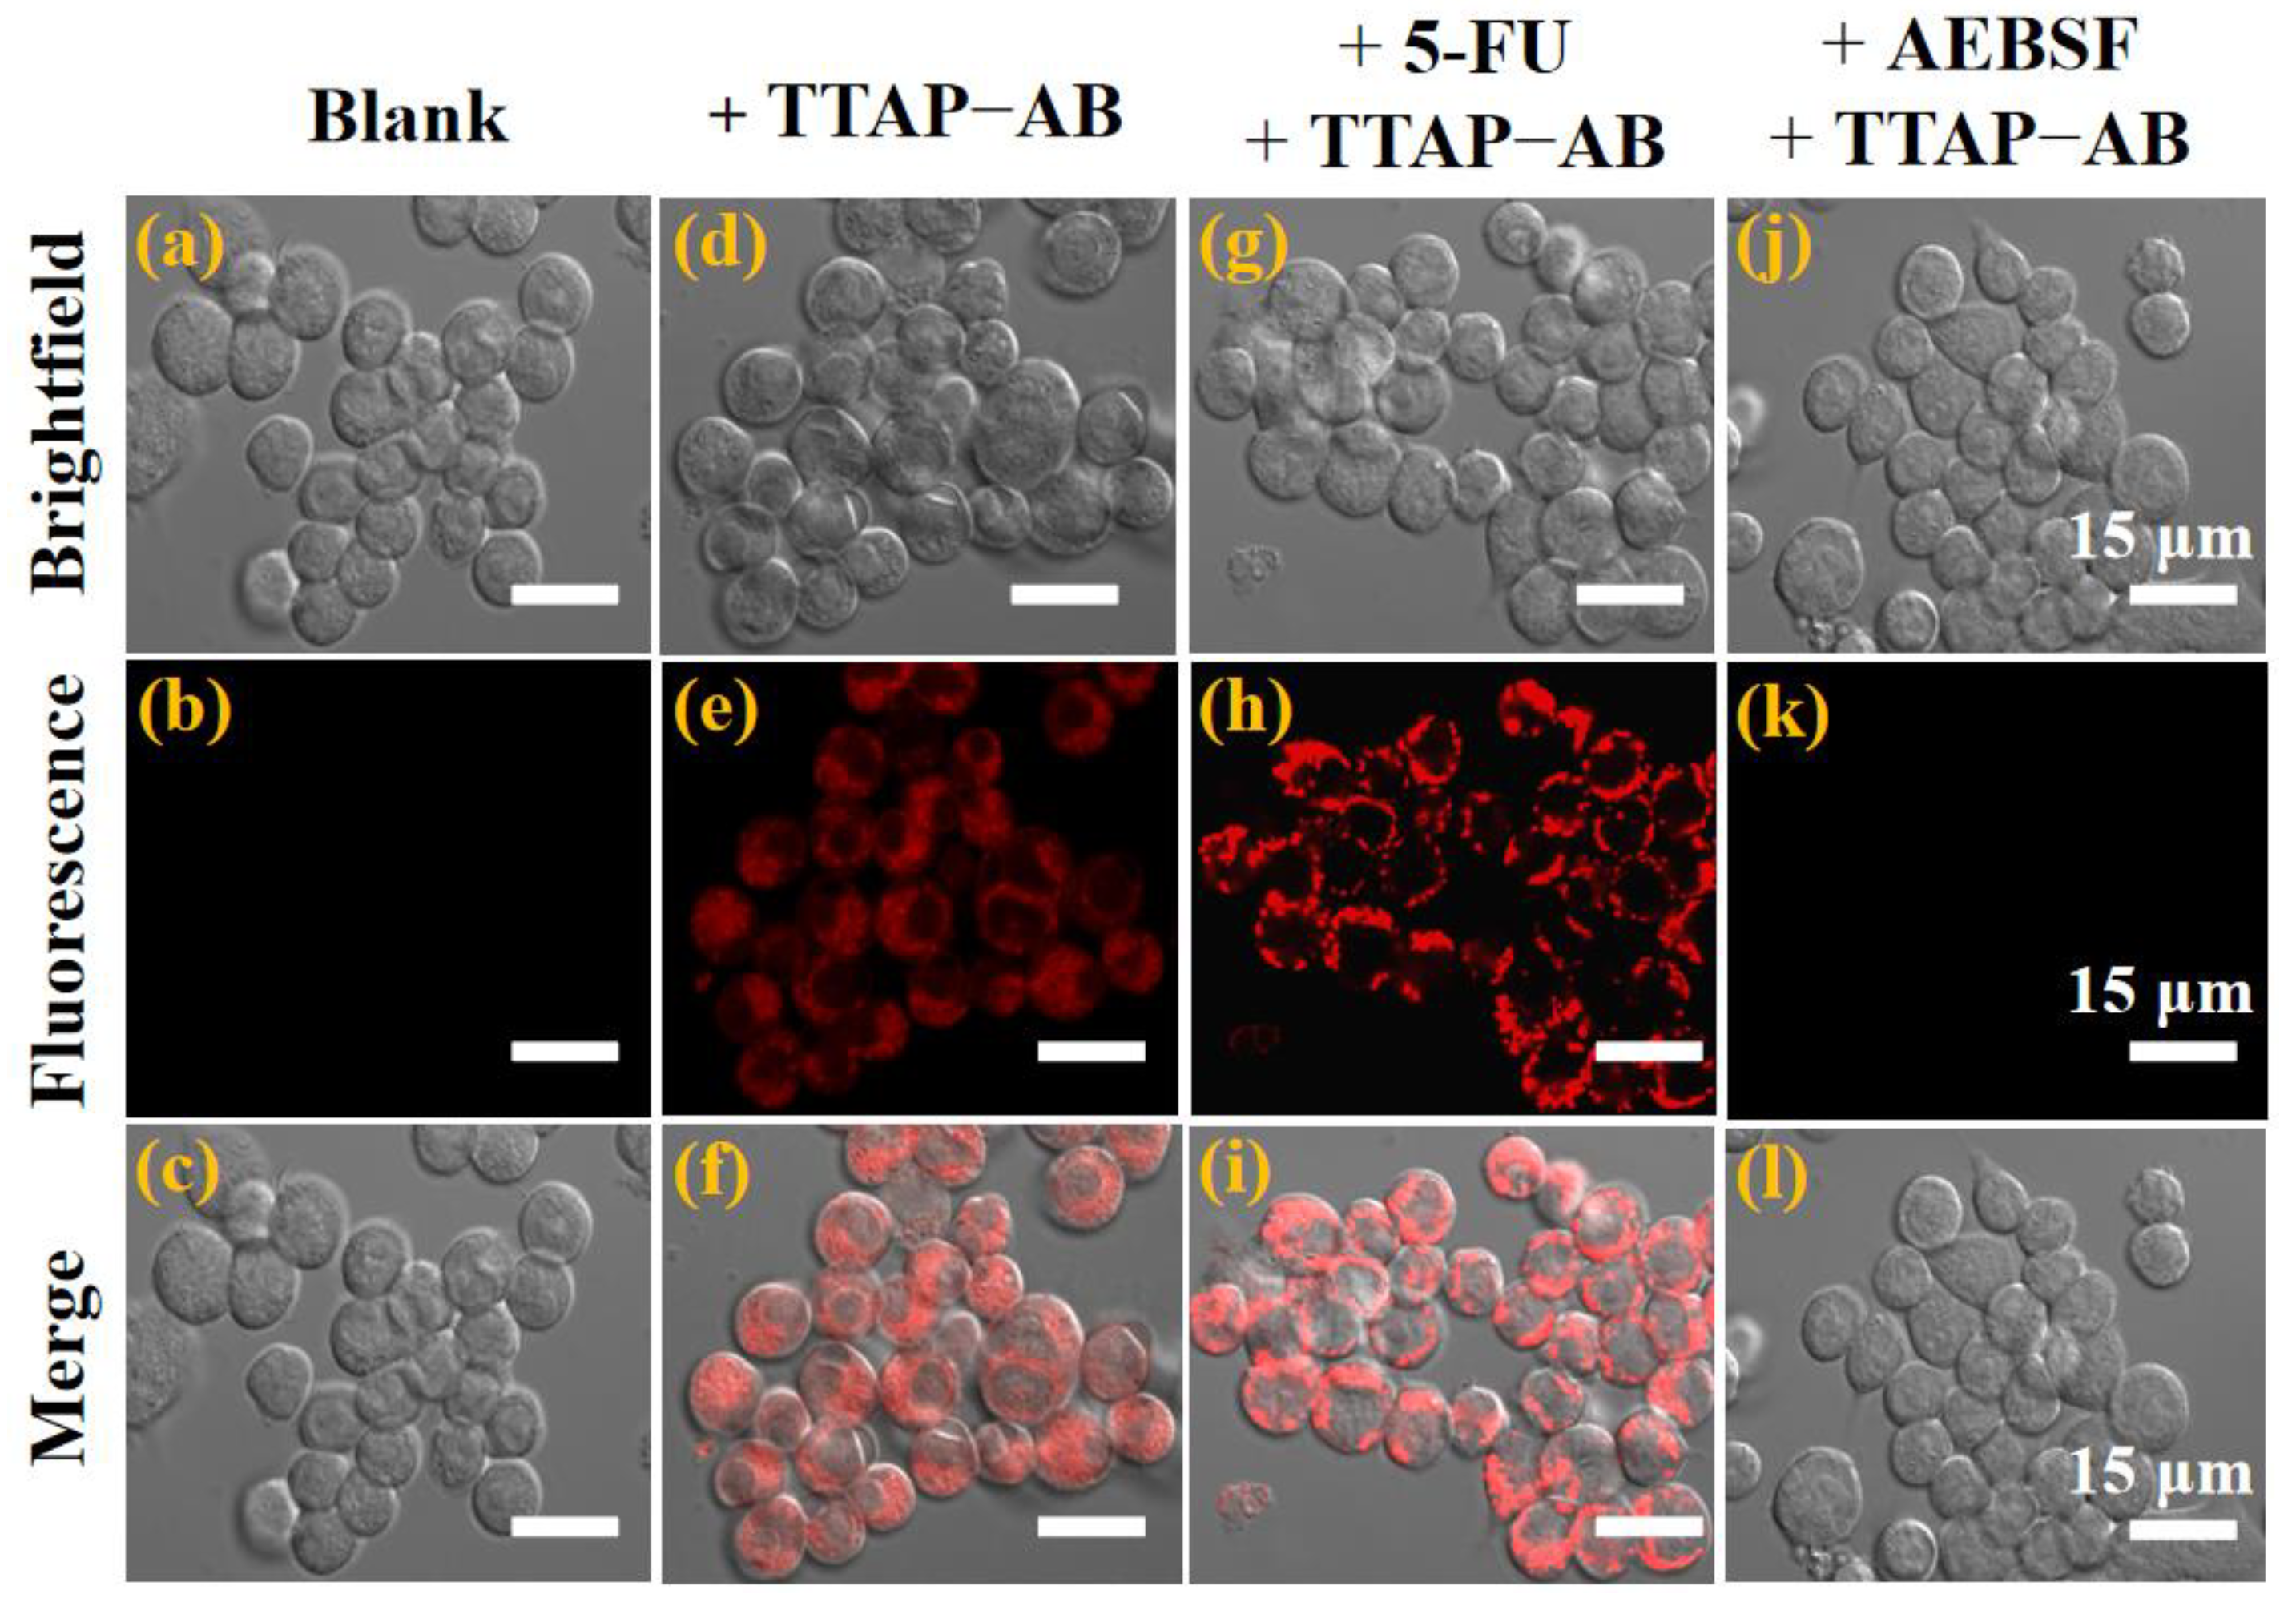
Figure 7.
Imaging the dynamic change of CEs levels in living zebrafish. Cells were stained with TTAP−AB (5 μM) only as a control (a, e), and with 50 μM 5-FU (b, f), with 100 μM 5-FU(c, g), with 5-FU (100 μM) and AEBSF (1 mM) (d, h), respectively. λex = 560 nm; λem = 650–750 nm.
Figure 7.
Imaging the dynamic change of CEs levels in living zebrafish. Cells were stained with TTAP−AB (5 μM) only as a control (a, e), and with 50 μM 5-FU (b, f), with 100 μM 5-FU(c, g), with 5-FU (100 μM) and AEBSF (1 mM) (d, h), respectively. λex = 560 nm; λem = 650–750 nm.
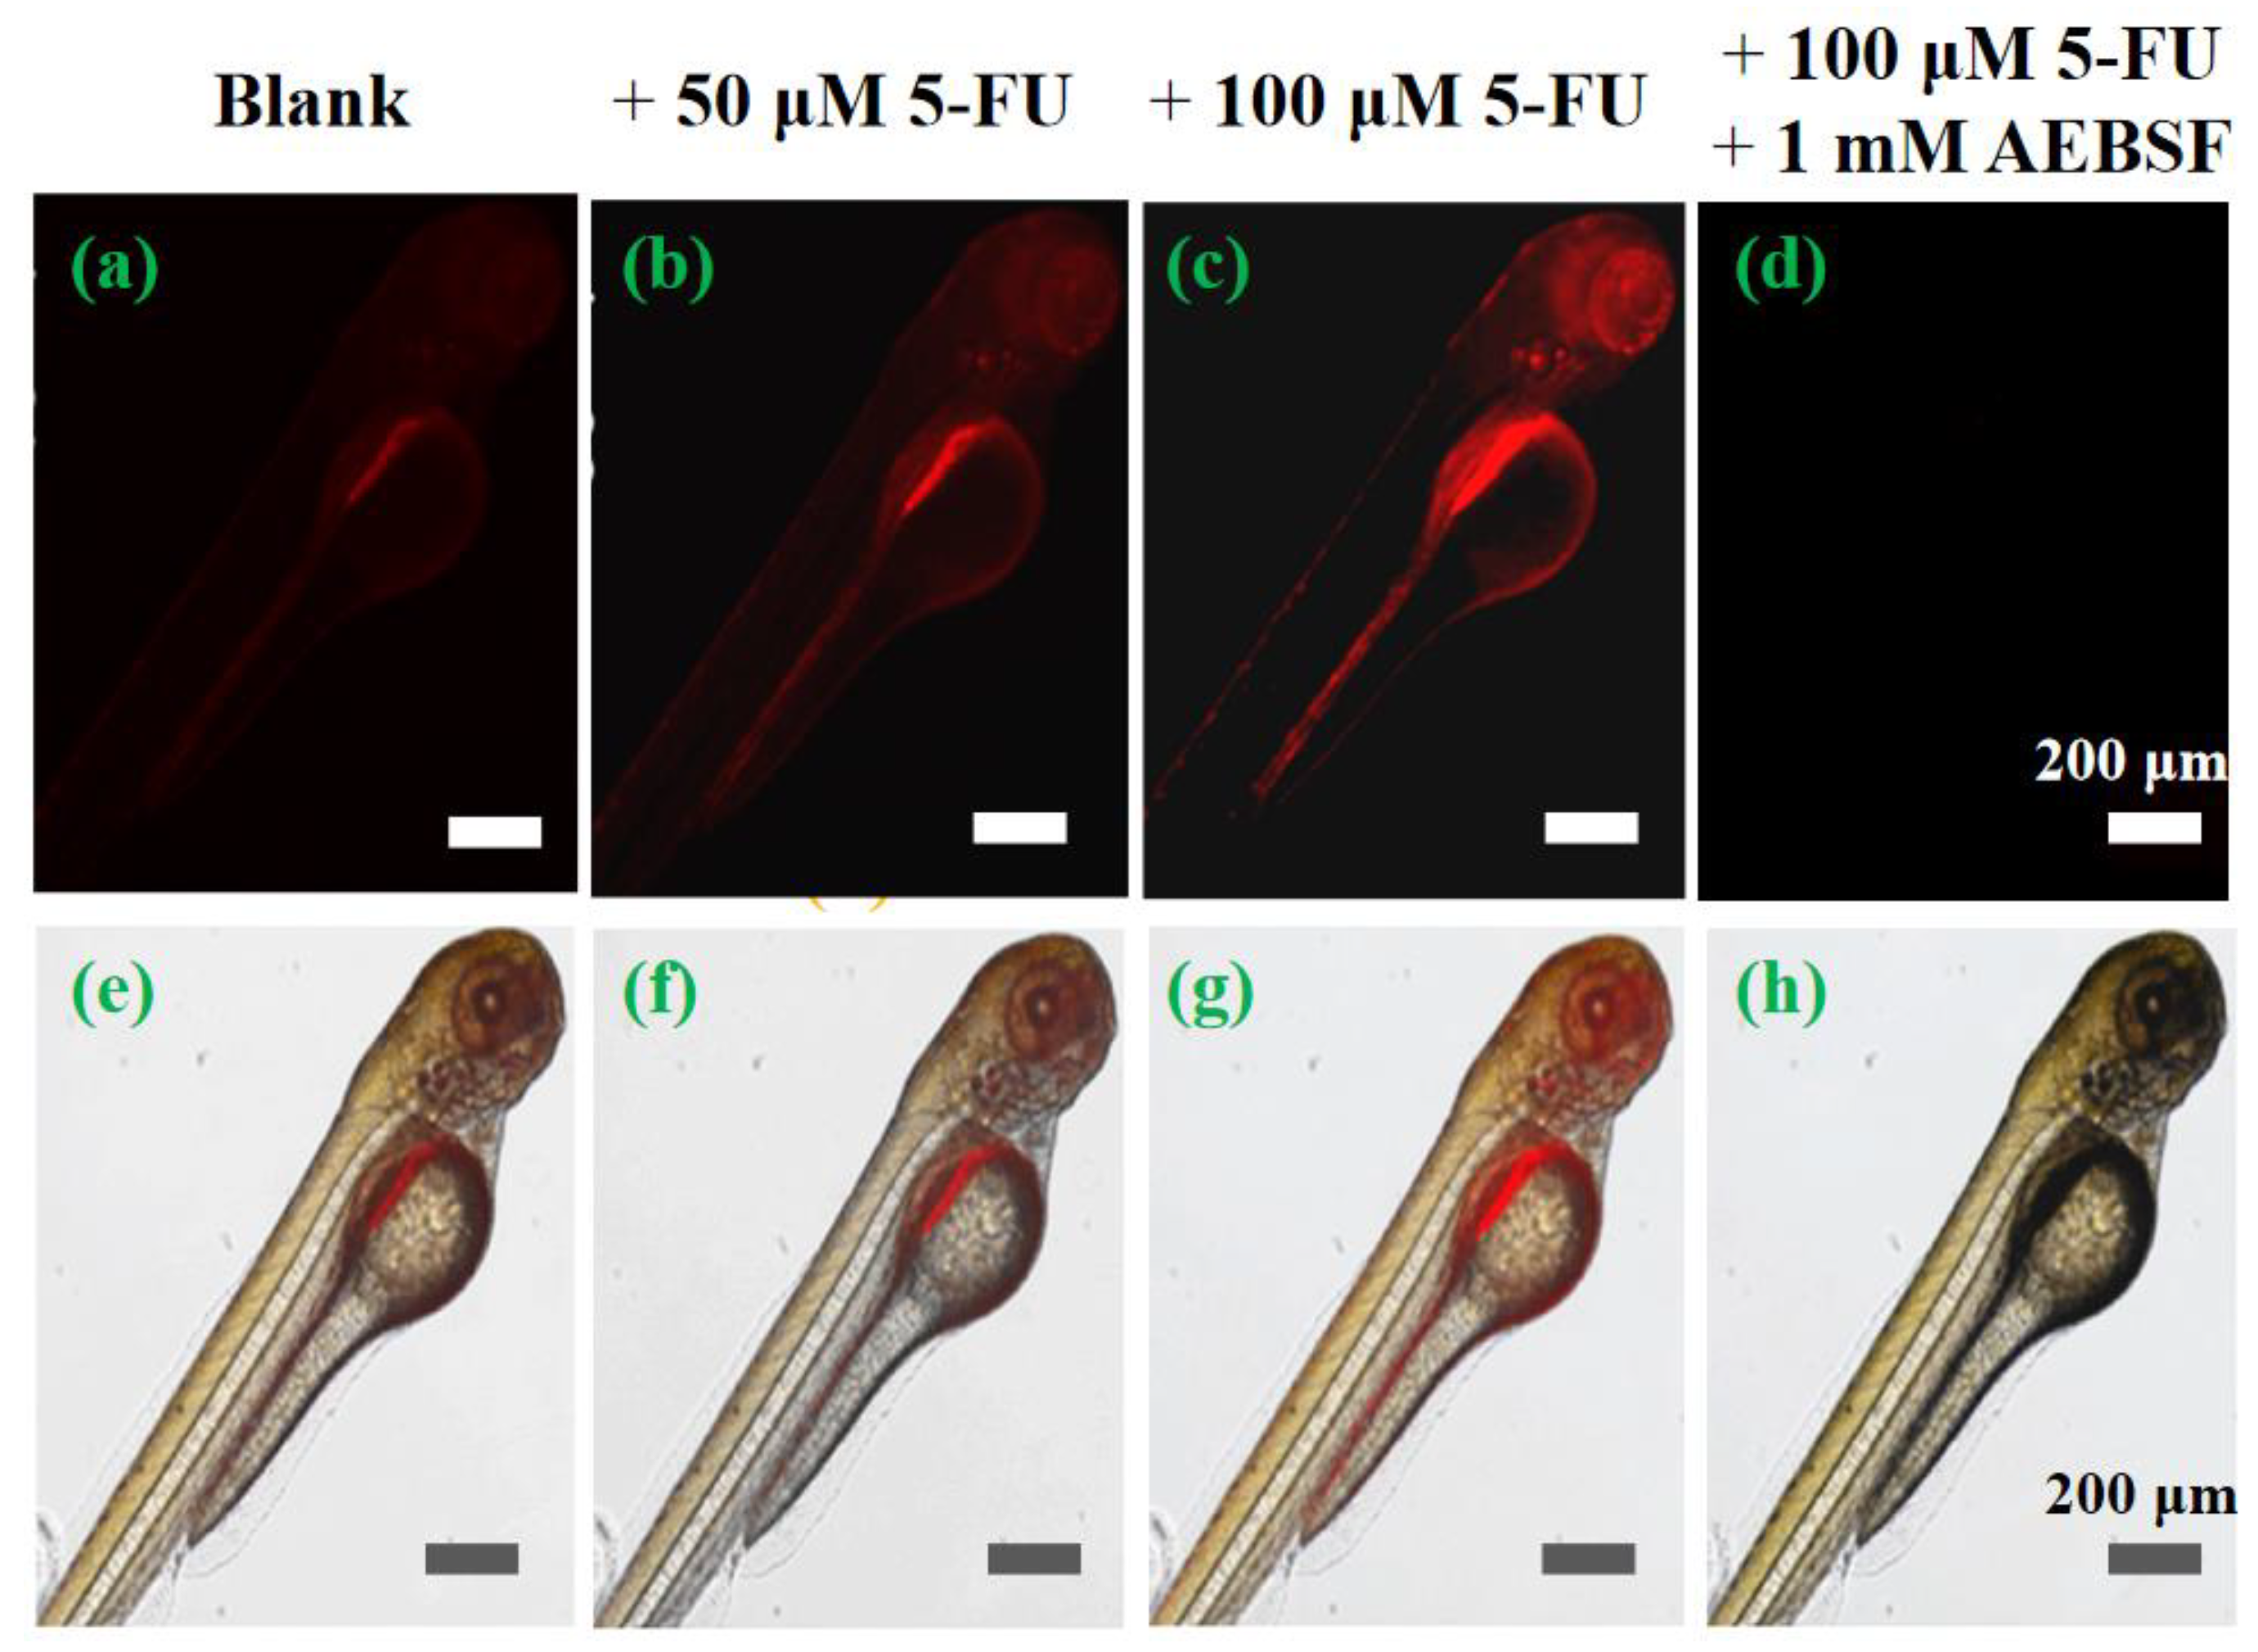
Figure 8.
(a) Real-time imaging of mice injecting with PBS (100 μL) and probe TTAP−AB (100 μL, 200 μM). (b) Ex vivo imaging of the major organs in mice dissected after euthanasia. (c) Real-time imaging of the liver tumor injecting with TTAP−AB (20 μL, 100 μM). (d) Ex vivo imaging of the tumour cut from the mouse body after euthanasia. λex = 600 nm, λem = 650–750 nm.
Figure 8.
(a) Real-time imaging of mice injecting with PBS (100 μL) and probe TTAP−AB (100 μL, 200 μM). (b) Ex vivo imaging of the major organs in mice dissected after euthanasia. (c) Real-time imaging of the liver tumor injecting with TTAP−AB (20 μL, 100 μM). (d) Ex vivo imaging of the tumour cut from the mouse body after euthanasia. λex = 600 nm, λem = 650–750 nm.
Disclaimer/Publisher’s Note: The statements, opinions and data contained in all publications are solely those of the individual author(s) and contributor(s) and not of MDPI and/or the editor(s). MDPI and/or the editor(s) disclaim responsibility for any injury to people or property resulting from any ideas, methods, instructions or products referred to in the content. |
© 2024 by the authors. Licensee MDPI, Basel, Switzerland. This article is an open access article distributed under the terms and conditions of the Creative Commons Attribution (CC BY) license (http://creativecommons.org/licenses/by/4.0/).
Copyright: This open access article is published under a Creative Commons CC BY 4.0 license, which permit the free download, distribution, and reuse, provided that the author and preprint are cited in any reuse.