
Submitted:
18 June 2024
Posted:
19 June 2024
You are already at the latest version
Abstract
Pump-as-turbines (PAT) have been widely used during the last decade as one of the most interesting technologies in the field of energy recovery. A large number of studies and papers have been published in which the performance of the pumps in the turbine operating regime are analysed. Since horizontal single stage centrifugal norm pumps are most commonly used as PATs, their performances are analysed in this paper. Most of the research was related to individual pump aggregates or smaller groups and to obtaining their performance curves in turbine random mode. In this work, extensive experimental, numerical and theoretical investigations are conducted to obtain complete dimensionless performance characteristics of the single stage centrifugal norm pumps operating as turbines. The main goal of this research was to form a simple analytical expression that will, for this type of aggregate, map the pump operating characteristic to the appropriate turbine operating regime. By using the expressions obtained and presented in the work, engineers are enabled to make the appropriate choice of pump aggregate for operation in the turbine random mode for potential locations. This can allow us to quickly make selection of potential locations and to carry out appropriate techno-economic analyses and analyses of possible energy savings.
Keywords:
pump-as-turbine (PAT)
; performance curves
; performance prediction
1. Introduction
Hydroelectric power is a renewable energy source, due to the water cycle – as long as the water cycle continues, this energy source will be usable. Hydropower plants are used in the production of electric energy, without significant environmental impact. Compared to thermal and nuclear power plants, from an environmental point of view, hydropower plants have incomparable advantages. Although they do not have comparable capacity factor with conventional power plants, hydro-energy, especially small-scale hydro-energy represent a promising solution for a large number of existing and still unused locations. The foregoing facts should be especially considered from the position of increasing electricity needs and long-term environmental strategies. Hydropower plants can provide electricity for base load and/or peak load, depending on their design and the needs of the electrical system users. They are very responsive and capable of achieving rapid changes of operation.
Hydroelectric power is the main form of renewable energy used in Europe and also in the world, generating more than all other renewable technologies combined. Even though in Europe nearly 40% of the economically viable hydropower potential is not being tapped [1].
Production of electricity from renewable energy sources (RES) has become a major issue in meeting the ambitious European renewable energy targets set in the European Commission (EC) legislations [2] and confirmed in the action plans of the Member States (EU27) [3].
Modern environmental standards that fall under designated areas such as Natura 2000 and the Water Framework Directive significantly affect small hydro power (SHP) potential. According to ESHA [4] research, for some countries, the SHP economically feasible potential was reduced by more than a half, but there is still a large potential for SHP development in the EU-27. Less than half of the potential has already been used - some 44 TWh/ year, and more than 50 TWh/year can be brought in the future. In order to achieve this task and to take advantage of the remaining potential SHP must be designed site by site in order to comply with all the environmental requirements [4].
There are many things that must be considered when designing a hydroelectric power plant, but the choice of an adequate turbine unit is of particular importance. Due to the technological complexity of small size turbines, in SHPs the use of pumps operating under reverse mode (pump as turbine, or PAT) represents a practical solution, considering their wide range of specific speed numbers and available standard sizes. For this reason, PATs are often used in water distribution systems, gravitational pipelines and oil pipelines, where they can replace pressure reducing valves in hydraulic pumped storage plants. PATs can also be used in small hydropower plants during the periods of low water levels. PATs can become a cost-effective alternative to traditional turbines as long as their turbine mode performance can be accurately predicted. However, pump manufacturers do not usually offer performance curves of their pumps operating under turbine mode.
There are manuals dealing with small and micro hydropower systems based on PAT, where all aspects of these systems are represented and analysed [5,6].
Some experimental studies of characteristic curves of centrifugal pumps working as turbines in different specific speeds are presented in order to obtain an adequate choice of PAT. A closed-loop test rig for experimental studies on hydraulic pumps and turbines has been used with the aim to support experimentally the theoretical studies in the development of accurate and robust models for prediction of PAT performance [7,8].
Some other experimental studies, such as experimental investigation of Derakhshan and Nourbakhsh [9] lead to the prediction of best efficiency point (BEP) operating parameters of a PAT and dimensionless equations are also proposed for low-specific-speed centrifugal pumps. Authors obtained second order polynomials for turbine head dimensionless curve and third order polynomial for turbine power dimensionless curve, but only for BEP.
Analytical prediction models for evaluating PAT performance, also in BEP, obtained by Rossi and Renzi, is the result of analysis of 32 available curves given in literature [10].
The procedure of selecting the proper pump operating as a turbine requires a detailed analysis, and the goal of many researchers was to obtain an adequate procedure for PAT selection that would be also as universal as possible.
Barbarelli at al. presented a combined method using statistical and numerical models for selecting a pump operating as turbine in micro hydro plants [11].
Last two decades CFD methodology is widely used for predicting PAT performance [12,13,14]. Most cases used performance prediction techniques of the turbine operation of pumps based on best efficiency or on specific speed, such as given in paper by Frosina et al [12]. Numerical investigation given in the research of Bogdanovic Jovanovic et al [13], which compared results with available methods, such as BUTU method, give the advantages of using CFD techniques in PAT performance prediction. An empirical method, based on curve fitting of experimental data, is presented in the BUTU method which predicts turbine performance at both best efficiency point (BEP) and values away from this point. This is very valuable as a selected PAT will typically not operate at exactly its BEP but somewhere close to it.
Formulas for performance predictions, based on theoretical research are provides by Stepanoff [15], Alatorre-Frenk [16], Sharma [17], Shmiedl [18], Grover [19] and Hergt [20], where some of results are based on experimental data and some of them assumed that pump and turbine operating mode achieve the same efficiency.
Nowadays there are more studies that use artificial neural networks and evolutionary polynomial regression methods for prediction PAT performance, such as Balacco [21], giving the starting point for similar future research.
2. Pumps Used as Turbines
Turbine aggregates are generally manufactured according to expected operating parameters, which are primarily defined by the location where the hydropower system is installed.
Small hydropower plants can be a significant source of hydropower everywhere, especially in the rural areas. Designing a hydropower system, selecting and purchasing a turbine for each specific location represent a fundamental challenge, both engineering and economic. Using standard pumps as turbines (PAT) can be an alternative with huge economic advantage. PATs are selected, like any other hydraulic turbines, according to their head and volume flow rate range, while having the maximum possible efficiency, i.e. they have to operate around BEP.
There are two particular cases where the use of PATs can be used without any reservations.
First of all, there are gravity water supply systems with the problem of pipeline damping by the valve, which occurs in periods of less water supply regime. In gravity water supply systems water tank is placed at a high altitude and water flows by gravity. The water pressure is lowered down to a threshold value in order to guarantee the water supply to all the end-users. The excess of hydraulic energy is dissipated through pressure reducing valves and that significantly increases the inefficiency of the entire hydraulic system. One of solutions for increasing the energy efficiency of such a water supply system is to install hydraulic turbines, which could recover some of the hydraulic energy [22,23]. In such situations it is always better to install PAT, rather than conventional hydraulic turbines, as an effective and less expensive solution. Besides gravitational water distribution network, PAT can be applied in any gravity water pipeline system [24].
Another suitable application of PAT is small hydropower plants [25]. Small hydropower plants are located in small rivers which have low water levels in certain periods of the year. Recommendation for turbine selection is that volume flow rate of the turbine () is within the limits , where is an average year water flow rate. Standard turbines, like Francis for example, cannot be used in months of low water levels. Therefore, it would be justified from a technical and economic point of view adding PAT aggregates in order to use the maximum flow rate even during those months of low water levels. In addition to small hydropower plants, PAT generators can also be used in smaller hydropower systems, such as micro, nano and Pico hydropower plants [11,26].
The purchase and installation of PAT unit is significantly cheaper compared to conventional hydraulic turbines; the capital cost of PAT may be less than 50% of comparable conventional turbine. Also, they have lower maintenance and operation costs.
The main issue is that, in most cases, there are not available the turbine performance. The prediction of turbine performance in the PAT aggregate has become an increasingly important topic of numerous research in recent years. Many researchers offer their procedures for selecting PAT [9,10,11,12], with more or less accuracy and with certain limitations related to the hydro energetic system. The given methods achieve a relatively good prediction for BEP but they show certain errors at operating points away from the best efficiency point.
Single-stage, normal-priming spiral casing pumps, so-called norm pumps, are most often used as PAT aggregates, due to their similarity in operating performance when produced by different manufacturers.
In this paper, we will deal with the operating characteristics of norm pumps when operating in turbine mode. A part of dimensional and all dimensionless operating characteristics will be given in the paper, for all sizes of the studied PAT aggregates. The goal is to reduce the turbine performance curves to dimensionless in order to approximate one universal dimensionless curve of the operating regime for all PAT aggregates. The methodology for PAT selection and obtaining its performance curves will be presented in this paper.
3. The Overview of Previous Research
The main difficulties using PAT aggregate is lack of performance curves when PAT operates in turbine mode. The current efforts have been in the direction of defining the way of predicting the turbine performance curves, which is essential for choosing PAT aggregate. Many have tried to connect efficiency values of pump and turban operation, creating the coupling of these two operation modes.
The best efficiency point in turbine mode is different than BEP in turbine mode, and it depends on the type and size of PAT, and the specific speed [5].
Stepanoff [15], Alatorre-Frenk [16], Sharma [17] investigated the relation between two coefficients: head ratio and flow rate ratio coefficients and linked them with pump efficiency.
Tan and Engerda [7] tested four PATs operated in both pump and turbine mode and presented a prediction of PAT performance running in turbine mode referring previous methods available in literature and considering the specific angular speed and the specific diameter as main evaluation parameters:
Balacco [21] presented a table of PAT performance models in chronological order from 1957. to 2017, where the criteria was BEP or specific speed of the pump. It is noticeable that there is a significant difference in the form of given formulas which predict the PAT performance.
Barbarelli et al [11] suggested dependence of nsp and nst, and defined head ratio and flow rate ratio coefficients as a polynomial dependence of specific speed of the pump, based on the sample of 26 investigated PATs:
Where, q is the ratio between turbine and pump volume flow rates at the BEP, h is the ration between turbine and pump head in BEP:
While specific speed of pump and turbine is defined as:
Stefanizzi et al. [8] conducted experimental investigation and performance prediction modelling of single stage centrifugal pump operating as turbine recommended following procedure for prediction of pump performance curve in turbine operating mode:
Where,
The turbine head and volume flow rate at BEP were calculated using the following equations:
Rossi and Renzi [10] collected the running data of 32 PATs that were studied and analysed in the previous papers, in order to define analytical equations for forecasting the main magnitudes involved on the PATs performance evaluation.
In the non-dimensional analysis, three coefficients are used: flow coefficient (ϕ), head coefficient (ψ) and power coefficient (Λ). These coefficients are evaluated considering the flow rate [m3/s], the head [m], the power output of the PAT [W], the impeller diameter [m] and the rotating speed [rad/s]. Both flow and head coefficients are normalized with respect to the corresponding BEP:
Most models are based on the specific speed number rather than on the efficiency at BEP, to take into account different PATs which operate in similar operating conditions [7].
Most of predictions are given for the BEP and cannot be considered valid for the whole range of performance curve.
4. Experimental Research and Recalculation of Pat Performance
For the purposes of this research, the performance of numerous PAT aggregates of the reputable pump manufacturers (KSB, Grundfos) was tested experimentally. Comparisons of performance curves in turbine and pump mode were made, obtaining dimensionless performance curves of PAT aggregates. Approximation of PAT operating curves was performed, i.e., turbine head and turbine power performance curves were obtained using the regression analysis method. Polynomial curves of the fifth degree were obtained, which approximate very well the dimensionless performance curves of PATs.
In this paper, single stage centrifugal norm pumps are analysed, which in the pump regime operate with a nominal speed around 1450 min-1 (14, depending on pump manufacturer. This selection is made because in many cases PAT units have asynchronous motors which go into the generator mode when the rpm exceeds the synchronous value of 1520 rpm.
On the other hand, asynchronous motors are designed for speeds up to 3000 rpm, of course for markets where the frequency is 50 Hz. In case of grid failure PAT rpm increases to runaway speed. In the case of pump selection with nominal speed of 3000 rpm runaway operation mode is difficult to handle. The choice of aggregates with lower rpm is completely justified, and this choice overcomes the problems with runaway operation mode. Also, the durability of aggregates working with lower rpm is higher, as are their reliability in operation, as well as NPSH characteristics for both pump and turbine mode of operation. On the other hand, if the same aggregates are used in modes with lower rpm, their larger number is needed or their price per unit of installed power is higher.
During our research, a large number of pumps were tested in turbine operating mode both experimentally and using CFD analyses. The most important experimental investigations were carried out on several mini-hydroelectric plants. The first analysis was carried out on two mini-hydroelectric plants, SHPP Dzep and SHPP Ljuti Dol. These power plants are characterized by the following operating parameters.
The technical solution of SHPP Dzep includes two water intakes at Mutnica and Garvanica, shorter pipeline routes than these water intakes with a diameter of DN800 and DN700 from water intake Garvanici with a length of approximately 836 m to the mouth of the rivers, and then a gravity pipeline DN1000 to the facility of SHPP DŽEP with a length of approximately 2244 m. At this location the gross head of the turbine is 86 m. The installed flow rate of the SHPP is 1.6 m3/s, and the installation of two turbine aggregates of the Francis type is planned. Since the turbine aggregates have a maximum capacity of approximately 0.9 m3/s, their operation below 360 l/s is not optimal in terms of usefulness, and there is a possibility of vibrations and vortex shedding in the turbine diffuser. For this location, the tests and analysis of the installation of the PAT aggregate - produced by KSB, which would work in the period of low water, where there is no major change in the net head, and the available potential is used and increases the efficiency of the operation of the plant with relatively small investments. For this location, turbine aggregates manufactured by KSB: Etanorm-R 200-400, Etanorm-R 300-500 and Etanorm-R 250-500 were considered.
The technical solution of SHPP Ljuti Dol includes three water intakes: the largest in the Bratina dol basin, and two smaller ones in the Glozanska Mahala and Romanova Mahala locations. A pipeline with a diameter of DN800 and a total length of 3450 meters runs from the main water intake on Bratina dol. Short pipelines with a length of about 400 m go from Glozanska and Romanova mahala. The gross head of the turbine at this location is 72.5 m. The installed flow rate of the SHPP is 0.916 m3/s, and the installation of two turbine aggregates of the Francis type is planned. Since the turbine aggregates have a maximum capacity of approximately 0.52 m3/s, their operation below 210 l/s is not optimal in terms of usefulness, and there is a possibility of vibrations and vortex shedding in the turbine diffuser. For this location, the tests and analysis of the installation of the PAT aggregate – manufactured by KSB, which would operate in the period of low water, where there is no major change in the net head, due to low speeds in the DN800 diameter pipeline, and at the same time the available potential is used, and efficiency increases operation of the plant with relatively small investments.
Since two mini hydro power plants were built at the same time, the same aggregates were considered, and they were made at the test facility at the KSB factory. Some of the test curves are shown below, in the Figure 1.
Test facility, where all experimental measurements of KSB pumps were conducted is presented in Figure 2.
The locations where testing was performed in real conditions at mini hydropower plants are as follows:
The first location is SHPP Slavnik (Figure 3). This location is directly below the reservoir lake Brestovac on the Pusta River. At this location, there is a pipeline whose purpose is irrigation and water supply to the drinking water factory.
The main pipeline has a diameter of DN 600, while the water supply connection to the mini-hydroelectric power plant is DN150. The installed capacity of the HPP is approximately 150 l/s, while the length of the pipeline to the HPP location is 3,745 m. As the location is directly below the storage lake and the capacity of the pipeline is significantly larger, the solution of installing a PAT unit instead of a classic turbine unit was designed, the price of which would be very high for such a small flow and installed power. For the needs of this location, two aggregates KSB Etanorm 150-315 with impeller diameter 334 mm and Croatia pump NN 150-315 with impeller diameter 335 mm were tested. The pump produced by KSB was tested in the factory, while the pump produced by Croatia pump was installed on site and tested on site Figure 4.
It should be emphasized that during the research and analyzing PAT operation in the turbine random regime, a project was also carried out for the purpose of the water supply of the city of Nis, where there are two locations with gravity pipelines, where the flow rate is regulated by valves. The flow regulation by valves is done depending on the needs of the water supply system and it’s around 4 bars. Detailed analyses, calculations and tests of etanorm aggregates produced by KSB have been done for these locations as well, and further implementation and installation of aggregates is expected.
Comparison of obtained performance curves in pump and turbine regime is shown in Figure 4.
The last example given in the paper is SHPP Citluk in the vicinity of Soko Banja. As with the other SHPPs mentioned, the reason for installing the PAT aggregate is the unevenness of the flow duration curve at the water intakes and enabling the use of all available potential (Figure 5).
The pipeline is 1304 m long and has an internal diameter of 592 mm, which corresponds to a HDPE pipeline with a nominal pressure of 4 bar. The gross head of the turbine is 36 m, while the installed flow rate is 0.48 m3/s. A PAT aggregate was installed at this location, i.e. pump manufactured by Grundfos, whose purpose is to maintain production and use available potential during periods of low water when the turbine cannot operate. One aggregate with two different impellers was tested at the facility, one is NK 100-250/269, while the other is NK 100-250/274 (Figure 6).
Based on tests which were carried out at the presented locations, CFD analysis, company data, data from scientific and professional paper works, this study was continued with the aim of providing the dimensionless characteristics of the PAT aggregates, in order to enable quick and efficient assessments of the possibility of installing PAT aggregates and to choose an adequate PAT aggregate. Some of the test results are presented in the paper, as well as the procedure and expressions, given in the next chapter 5, which can be used to predict, with high accuracy, the turbine operating regime of the NORM pump aggregate.
Many different PATs were experimentally tested, mainly norm pump units of the renowned pump manufacturers KSB and Grundfos. Performance curves of some of the tested pumps are presented in Figure 7 and Figure 8.
4.1. Comparation of Results
Some researchers conducted in Stellenbosch University [27] were involved in the implementation of PAT in SHPP (up to 10 kW), using norm pumps for that purpose. They also conducted PAT testing in turbine mode, for pump 50-160. A comparison of the results we obtained with the results presented in reference [27] are given in Figure 9, showing an excellent agreement for both turbine parameters: turbine head and turbine power.
5. Performance Prediction of Norm Pumps Operate in Turbine Mode
As norm pump aggregates are standardized according to dimensions, connection flanges and their markings, the table lists the analyzed pump aggregates according to the aforementioned nomenclature. All standard aggregates at the pump manufacturer bear the mark: DN (suction) -DN (discharge) -Impeller diameter, for example: 100-80-200.
The analysis of the operation of PAT was performed on the basis of the measured operating curves, the analysis of the numerical simulations of flow that have been done in earlier research of PAT, as well as the application of the regression analysis of the obtained data.
In order to check the possibility of PAT application and to make the universal PAT performance curves, 47 aggregates were analyzed. Data on aggregates were collected systematically over a long period of time, from experimental testing, data from built-in PAT aggregates, CFD simulations for individual circuits and published papers [13].
All the data obtained for norm pumps starting with 32 to 300 mm, are divided into two groups: smaller pumps from 32 to 65 and larger one from 80 to 300.
All performance curves are given as dimensionless, in order to compare different PAT sizes and to present the universal performance curve. Dimensionless head curves are given in Figure 10, Figure 11 and Figure 12, while dimensionless power curves are given in Figure 13 and Figure 14.
The theory of similarity is used to recalculate the performance curves for the required number of revolutions of the machine, using the following expressions:
while for the efficiency calculation, the following formula is used:
For the obtained performance curves, the point of the maximum efficiency and corresponding value of volume flow rate, head and power is determined.
The data on the obtained performance curves of PAT units are now translated into a dimensionless form in the following way:
In Figure 10 different dimensionless head curves are presented, for various PAT aggregates produced by KSB pump factory, and Figure 11 shows curves for some pumps manufactured by Grundfos.
Similar to the previous diagrams for dimensionless head curves, Figure 13 and Figure 14 show some of the dimensionless power curves of well-known pump manufacturers: KSB and Grundfos, respectively.
According to obtained data for different PATs, the analytical equation for obtaining dimensionless curves is derived, due to conducted regression analysis. a polynomial distribution of the fifth degree was used to ensure that the curve represented the data as well as possible.
For average head curve and for the smaller PATs from 32 to 65, the formula is as follows:
while for larger PATs the obtained polynomial distribution is:
When talking about dimensionless power curves, for PATs from 32 to 65, the obtained distribution is:
while for larger PATs it is:
6. Hydrotechnical Characteristics and Selection of Pat
In order to show the selection of the appropriate PAT aggregate based on the presented extensive research and formed equations, the procedure is further presented in the paper. The procedure for choosing the appropriate PAT is shown on the previously mentioned and analyzed plant, and that is the one of the locations of gravity pipelines of the water supply system of the city of Nis, where flow control is performed by closing the valves.
As a basis for adopting the technical performance of the turbines, the following data on the considered location were used, which were also verified by measurements:
- The volume of the tank at the „Cukljenik” location: 1 x 200 m3
- Total length of pipeline : 2510 m
- Elevation of the bottom of the tank: 320.7 mnm
- Elevation of the reservoir overflow: 324.4 mnm
- Optimum level during turbine operation: 323.5 do 324 mnm
- Elevation of the springs „Studena”: 397.0 mnm
- Supply pipeline to the reservoir: DN400
- Elevation of gallery for equipment accommodation: 324.5 mnm
- Maximum gross turbine head: 73.5 m
- Minimum gross turbine head: 72.5 m
In addition to the previous analysis of the hydrology of the springs from which NIVOS is supplied, there are also multi-year measurements of the public utility company „NAISSUS”, which provide relevant data on average daily flows at the location.
The following diagram shows the mean daily flow and the mean annual flow for the period 2003-2013 (Figure 17).
In order to check the data and determine the possible installed flow and net head of the PAT aggregate, measurements of pressure and flow rate were made on the supply pipeline to the „Cukljenik” reservoir. These measurements were carried out to determine with high reliability the so-called system curve. The measurement results are shown in the Table 1:
The determined maximum and minimum curves of the system are given in the following diagram, as well as a comparison with the results obtained by measurement (Figure 18).
6.1. System Operating Curves, Measurement Results and Location
Based on all previous analyzes and in accordance with the needs of the water supply system, which must first satisfy the needs of the complete supply of the water supply system, the following installed flow and effort are adopted:
First, pump aggregates are selected, whose optimal operating point (in terms of pump head and flow rate) is determined on the basis of the following newly formed expressions, where the possibility of installing one or two aggregates at the observed location is determined.
In the case of installing one unit, the flow rate is QT=300 l/s=0.3 m3/s, while in the case of operation of two aggregates, the flow rate is 150 l/s=0.15 m3/s per aggregate, while the head in the turbine regime remains the same HT=45 m. The number of revolutions of the PAT aggregate is 1500 rpm.
The specific number of revolution for both cases now can be calculated:
The relationship between the specific number of revolutions of the pump and is given by the expression:
The obtained specific number of revolutions of the pump are now:
Based on previous research, the relation between the net head of the pump unit and the net head of the turbine regime, as well as the flow ratio between these two operating regimes, is now determined:
The expression for determination of h is defined as follows:
Where proposed coefficients are given in the following table:
| h1 | 5.03908 |
| h2 | -0.26186 |
| h3 | 0.00717 |
| h4 | -0.000098547 |
| h5 | 0.000000770831 |
| h6 | -0.00000000324839 |
The expression for determination of h is defined as follows:
Where proposed coefficients are given in the following table:
| q1 | 2.05265 |
| q2 | -0.02814 |
| q3 | 0.00020067 |
| q4 | 0.00000263 |
| q5 | -0.00000002 |
For the established parameters, in the given example, the following characteristics of the pump aggregates are obtained:
An aggregate which has the closest operating parameters is required. For the example presented it is Etanorm 250-400, operating with n=1450 rpm (Figure 19).
For the needs of the considered location, first, one pump unit is adopted in the turbine operating regime. Its optimal head for a 360-diameter impeller is Hbep,p=33 m, while the flow rate Qbep,p=210.0 l/s, which is very close to the required operating characteristics. The other option is a pump aggregate with a 380-diameter impeller with the optimal operating regime Hbep,p=37.2 m and Qbep,p=227.0 l/s.
Then, for the case of installing two aggregates, the following parameters are obtained:
and then looking for a pump unit that has the closest operating regime.
For the considered location, two pump aggregates are chosen in the turbine operating mode. The optimal operating point for the impeller with a diameter of 334 mm is Hbep,p=32 m and Qbep,p=120.0 l/s, while for the defined flow rate 110 l/s, the aggregate operates with the head of 33 m and a efficiency around 86% (Figure 20).
By applying the expressions obtained on the basis of our research presented in the paper, the following curve of the PAT aggregate is obtained while maintaining the efficiency at the around optimal operating point:
According to the proposed procedure, the turbine head curves were obtained, and for a shown example they are represented by diagrams in Figure 21, while power curves are given in Figure 22.
The procedure of choosing PAT aggregates and the calculation of its operating curves is simple and very accurate. With a few corrections on the impeller (for example trimming) the operation of the PAT aggregate can be brought to the optimal mode.
In Figure 21 is noticeable that all the proposed solutions are practically satisfactory, within the limits of small changes in turbine head, which are usual for such plants.
7. Conclusion
This paper presents a new methodology used to make a selection of the appropriate pump unit for operation in turbine random mode. The data presented in this paper are the result of many years of research, experimental tests, tests on objects and numerical ie. CFD analysis. For a large number of single-stage centrifugal, so-called norm pump aggregates, operating curves are determined in the turbine operating regime and the curves were then converted into a dimensionless form and divided into two groups according to a specific number of revolutions. The quality of this research in regard to previous analyses that have been done is reflected in the fact that the defined procedure and the obtained results provide the complete operating curve of the PAT aggregate, not just the BEP regime.
The paper presents a detailed procedure for the selection of two PAT aggregates, both for an individual (single) operating regime and for a parallel one for an existing facility on the water supply system. The advantage of the presented procedure is the possibility of analysing the proposed solution and obtaining the actual operating regimes of the PAT aggregates in the system. Also, in this way, it is possible to analyse the PAT aggregate operating in a system that changes its regimes during the operation, which is the reality in a large number of cases. In addition to determining the operating regime according to turbine head and flow rate, the described procedure also obtains the power of the aggregate in the turbine operating regime, thus enabling the procedure of determining the possible production of electricity. All the results presented in the paper are given in a dimensionless form and the procedures for translating the data into a dimensional form, for a potential location, are also shown. In this way it is possible to perform engineering calculations and techno-economic analysis of the application of PAT aggregates.
Acknowledgements
This research was financially supported by the Ministry of Science, Technological Development and Innovation of the Republic of Serbia (Contract No.451-451-03-65/2024-03).
References
- Morales Pedraza, J., Electrical Energy Generation in Europe, ISBN 978-3-319-16082-5, Springer, 2015. [CrossRef]
- European Commission. RES Directive 2009/28/EC of the European Parliament and of the Council of 23 April 2009 on the promotion of the use of energy from renewable, Official Journal, L 140 05/06/2009; 2009a. p. 0016–0062.
- European Commission. Directive 2009/29/EC of the European Parliament and of the Council of 23 April 2009 amending Directive 2003/87/EC so as to improve and extend the greenhouse gas emission allowance trading scheme of the Community. Official Journal, L 140 05/06/2009; 2009b. p. 0063–0087.
- Small Hydropower Roadmap, Condensed research data for EU-27, ESHA 2012.
- Chapallaz, J.M., Eichenberger P., Fischer, G, Manual on pumps used as turbines. Vieweg, Braunschweig, 1992.
- Teuteberg., B.T., 2010, Design of a Pump-As-Turbine Microhydro System for an Abalone Farm, Department of Mechanical and Mechatronic Engineering, Stellenbosch University.
- Tan, X., Engeda, A., 2016, Performance of centrifugal pumps running in reverse as turbine: Part Ⅱ- systematic specific speed and specific diameter based performance prediction. Renewable Energy, 99, Year 2016, p. 188–197.
- Stefanizzi, M.; Torresi, M.; Fortunato, B., Camporeale, S.M., 2017, Experimental investigation and performance prediction modeling of a single stage centrifugal pump operating as turbine, Energy Procedia 2017, 126, p. 589–596.
- Derakhshan, S., Nourbakhsh A., 2008, Experimental study of characteristic curves of centrifugal pumps working as turbines in different specific speeds, Experimental Thermal and Fluid Science 32, 2008, p. 800–807.
- Rossi, M.; Renzi, M.A., 2017, Analytical Prediction Models for Evaluating Pumps-As-Turbines (PaTs) Performance, Energy Procedia, 2017, 118, p. 238–242.
- Barbarelli, S.; Amelio, M.; Florio, G., 2016, Predictive model estimating the performances of centrifugal pumps used as turbines, Energy, 2016, 107, p. 103–121.
- Frosina, E., Buono., D, Senatore, A., 2017, A Performance Prediction Method for Pumps as Turbines (PAT) Using Computational Fluid Dynamics (CFD), Modeling Approach Energies, Vol. 10(1), 103, pp. 1-19.
- Bogdanovic Jovanovic, J., Miklenkovic, D., Svrkota, D., Bogdanovic, B., Spasic, Z., 2014, Pumps used as Turbines – Power Recovery, Energy Efficiency, CFD Analysis, THERMAL SCIENCE: Year 2014, Vol. 18, No. 3, p. 1029-1040.
- Páscoa1 J. C., Silva, F. J., Pinheiro, J. S., Martins, D. J., 2012, A new approach for predicting PAT-pumps operating point from direct pumping mode characteristics, 144 Journal of Scientific & Industrial Research, Vol. 71, February 2012, p. 144-148.
- Stepanoff A. J, 1957, Centrifugal and Axial Flow Pumps, John Wiley, USA.
- Alatorre-Frenk C, 1994, Cost Minimization in Micro Hydro Systems Using Pumps as Turbines, Ph.D. Thesis, University of Warwick, Coventry, UK.
- Sharma K, 1985, Small Hydroelectric Project-Use of Centrifugal Pumps as Turbines, Technical Report; Kirloskar Electric Co.: Bangalore, India.
- Schmiedl E, 1988, Kreiselpumpen im Turbinenbetrieb Pumpentagung, Karlsruhe, Germany.
- Grover K.M, 1980, Conversion of Pumps to Turbines, GSA Inter Corp, NY, USA.
- Hegrt P, Krieger P, Tommes S, 1984, Die stromungstechnischen Eigenschaften von Kreiselpumpen in Turbinenbetrieb, Pumpentagung, Karlsruhe, Germany.
- Balacco, G., 2018, Performance Prediction of a Pump as Turbine: Sensitivity Analysis Based on Artificial Neural Networks and Evolutionary Polynomial Regression, Energies 2018, 11, 3497. [CrossRef]
- Patelisa. M., Kanakoudisa,V., Gonelas, K., 2016, Pressure management and energy recovery capabilities using PATs, Procedia Engineering 162, 2016, p. 503 – 510.
- Spedaletti, S., Rossi, M., Comodi, G., Salvi, D., Renzi, M., 2021, Energy recovery in gravity adduction pipelines of a water supply system (WSS) for urban areas using Pumps-as-Turbines (PaTs), Sustainable Energy Technologies and Assessments, Volume 45, June 2021, 101040.
- Plusa, T., Kocewiak, K., Duda, P., 2024, Analysis of the Possibilities of Energy Recovery from Gravity Flows in Pipelines in a Copper Ore Enrichment Plant, Energies 2024, 17, 1548. [CrossRef]
- Ali, A., Yuan, J., Javed, H., Si, Q., Fall, I., Ohiemi, I. E., Osman, F. K., Islam, R., 2023, Small hydropower generation using pump as turbine; a smart solution for the development of Pakistan’s energy, Heliyon, Vol. 9, Issue 4 (2023) e14993.
- Nejadali, J., 2021, Analysis and evaluation of the performance and utilization of regenerative flow pump as turbine (PAT) in Pico-hydropower plants, Energy for Sustainable Development, Vol. 64, October 2021, p. 103-117.
- Cornelius Johannes Lombard, A., 2010, Design and Implementation of low cost grid-connected 10 kW Hydro Power System, Master of Science Thesis in Engineering at Stellenbosch University, 153 pages.
Figure 1.
Etanorm performance curves in a) pump and b) turbine operating regime (n=1520 rpm).
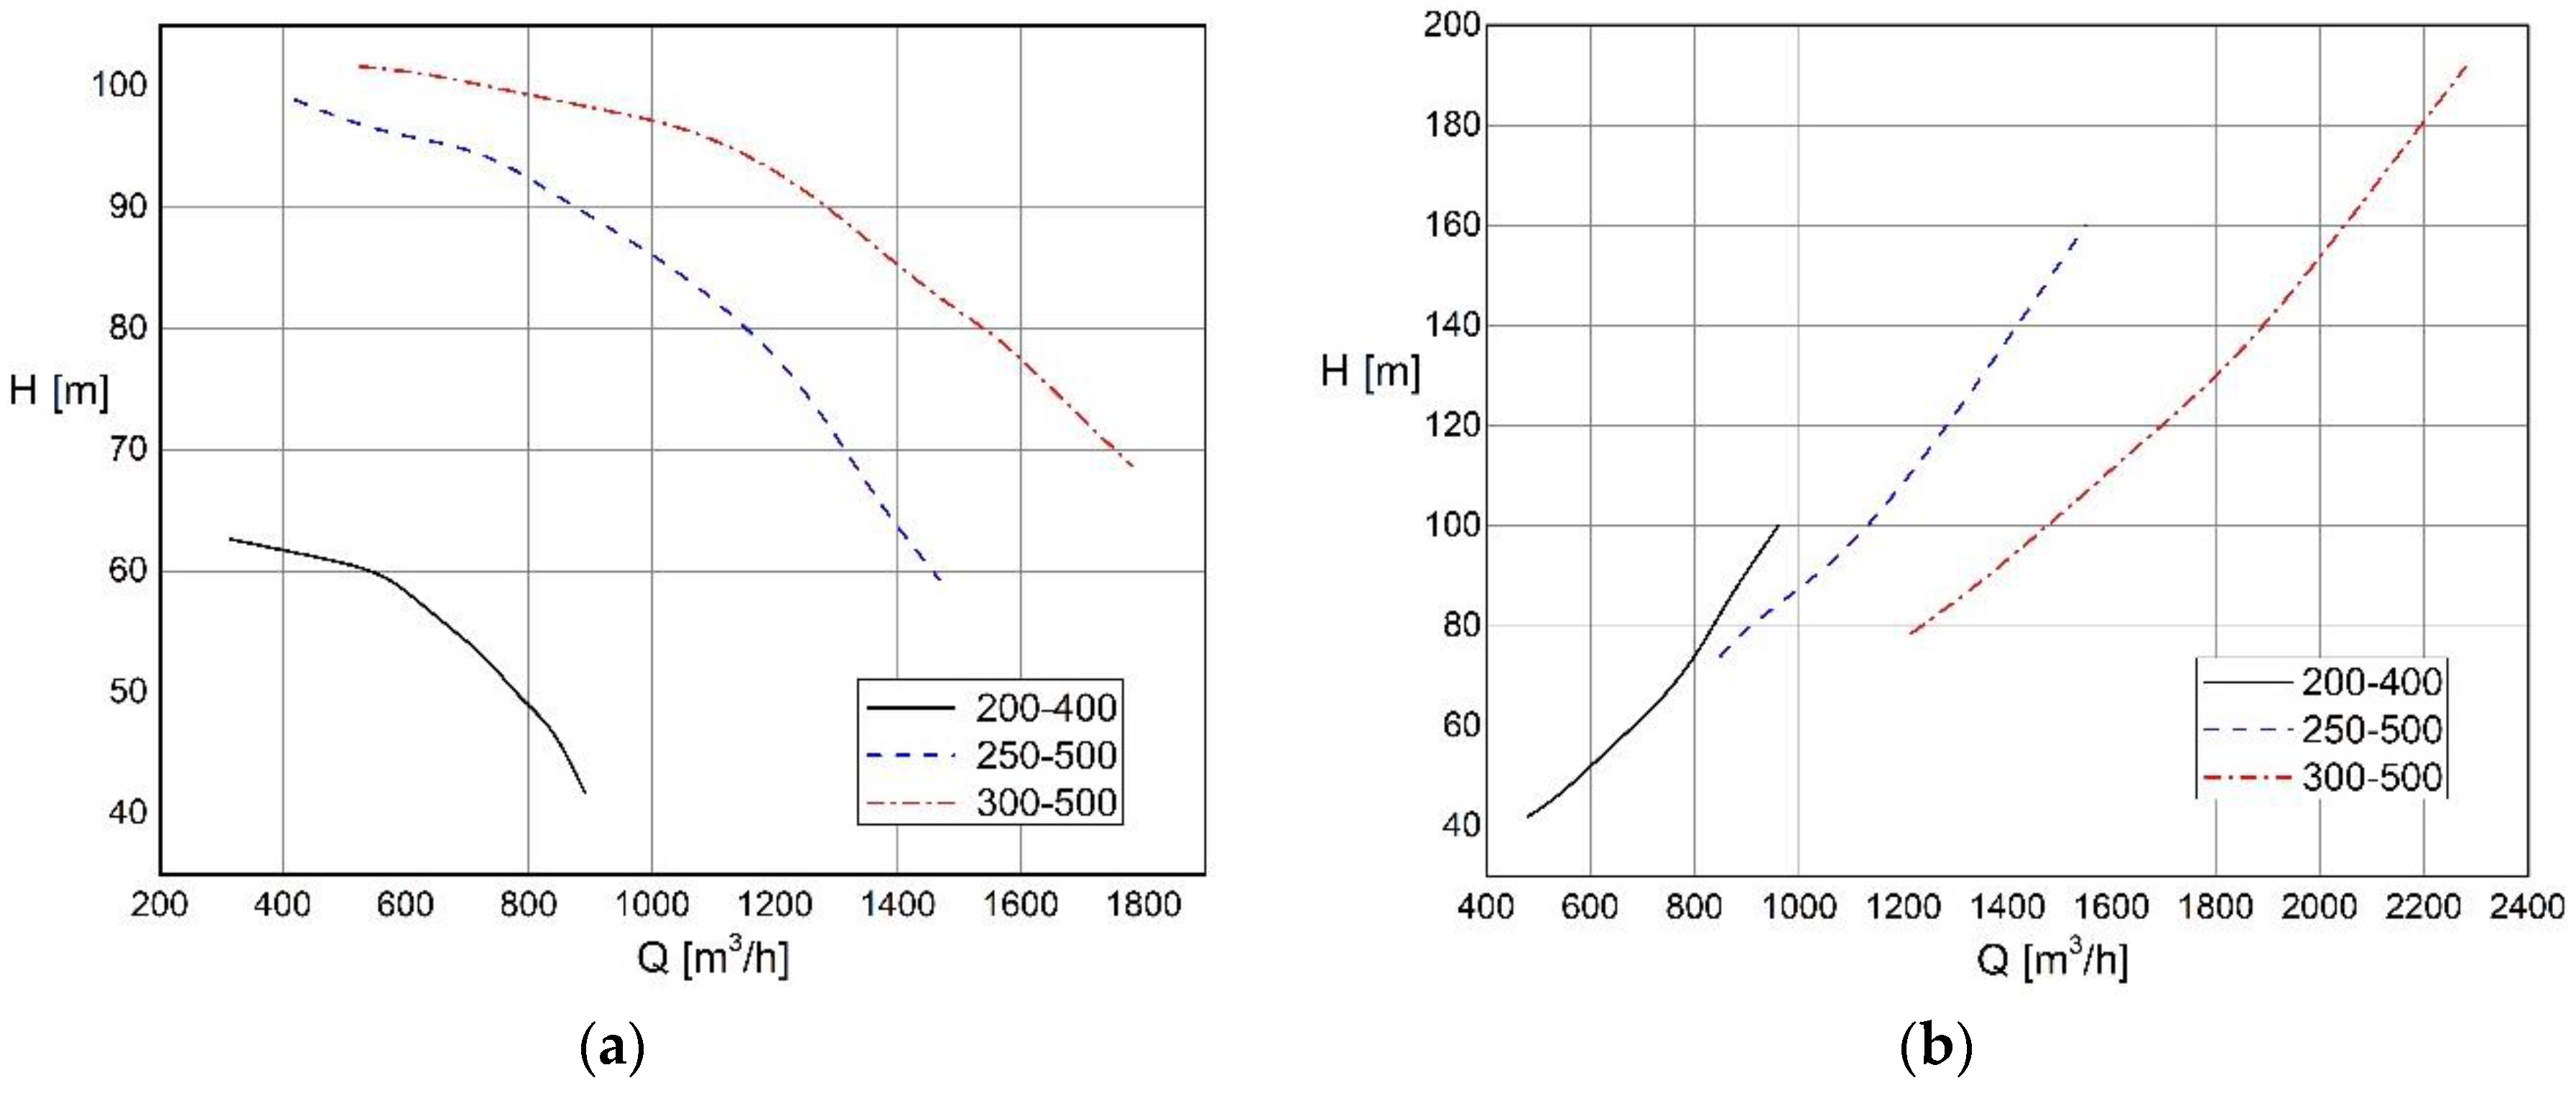
Figure 2.
KSB test facility.
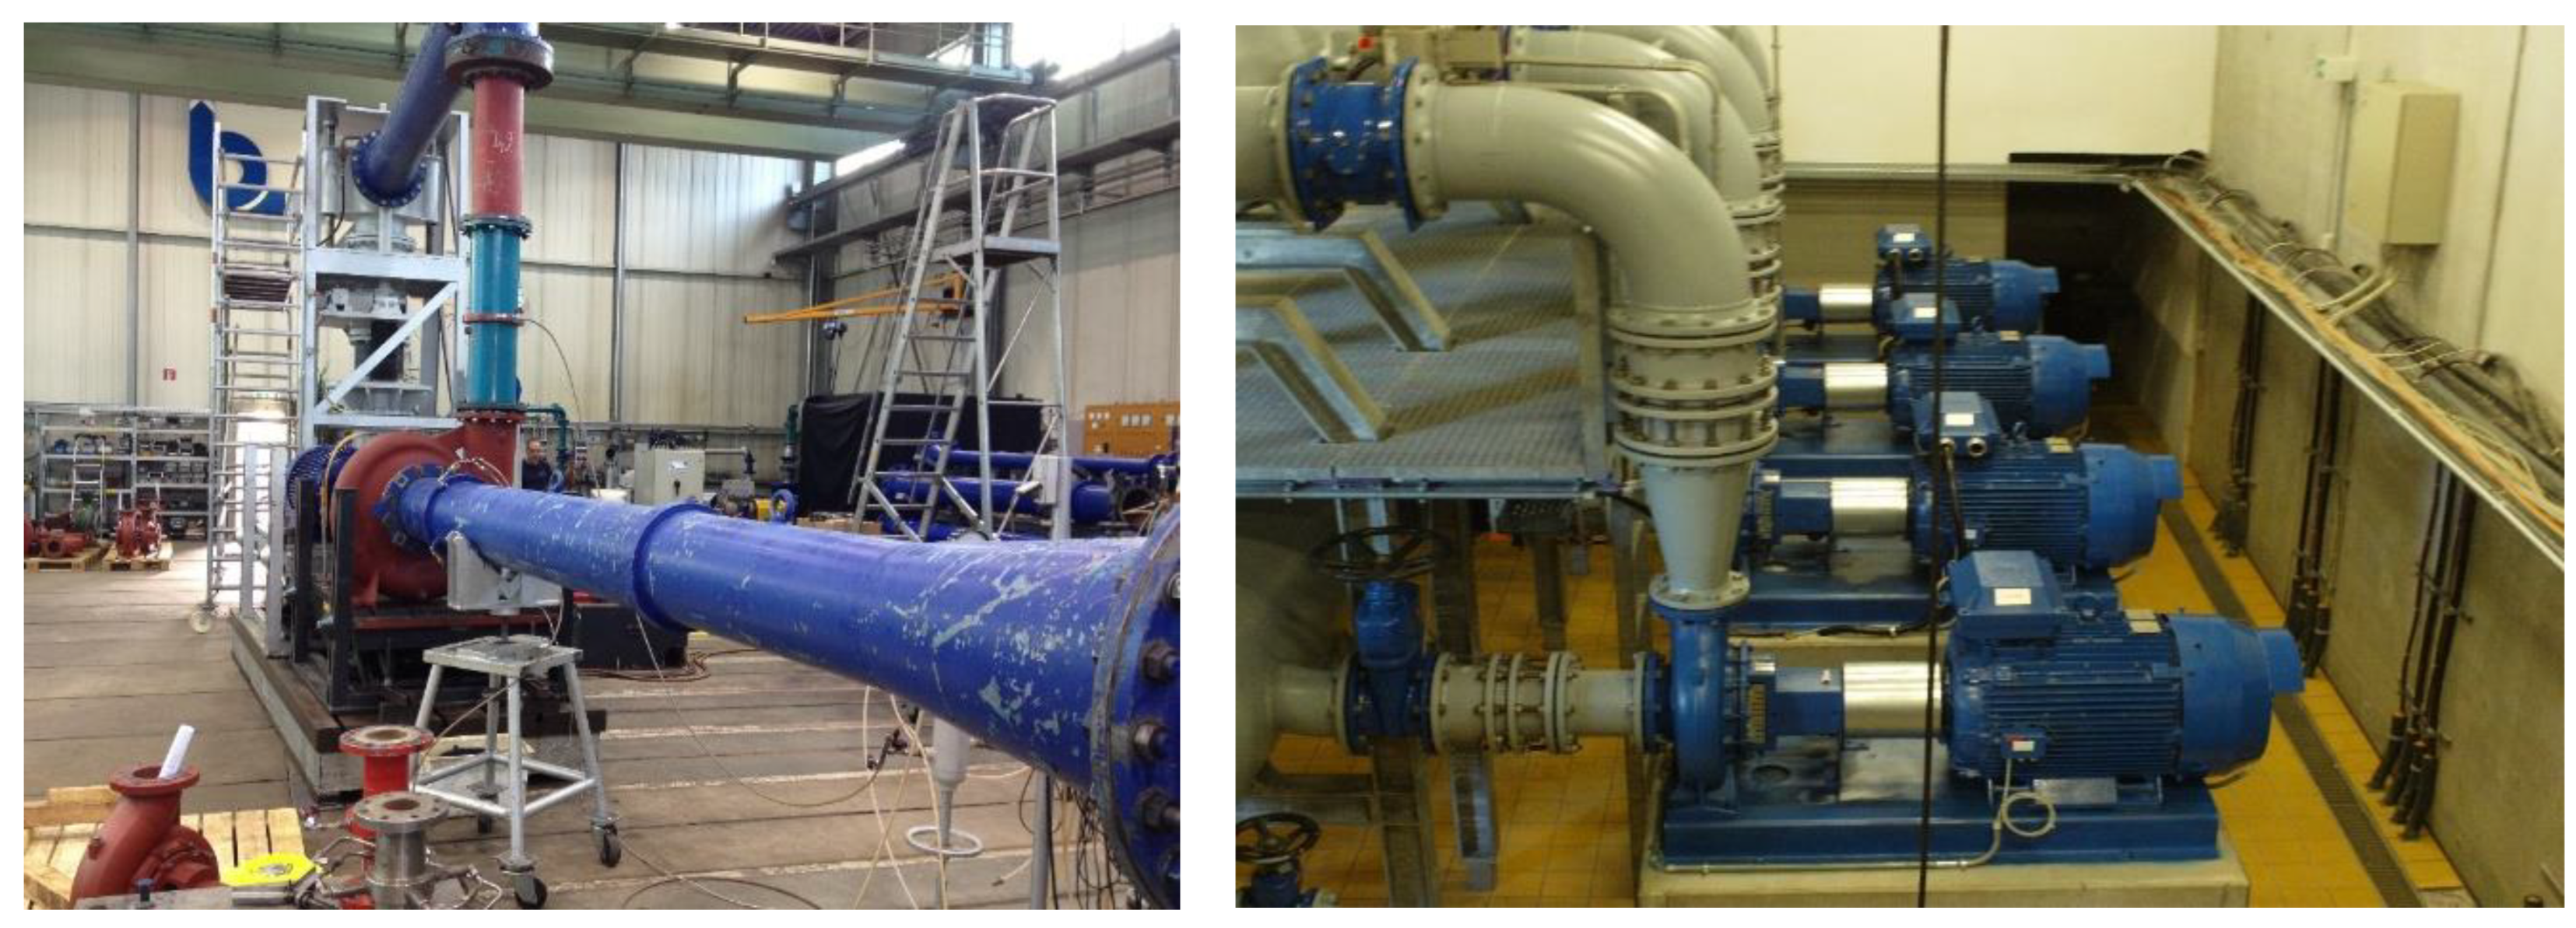
Figure 3.
Instalcija of PAT agregata in SHPP Slavnik and test facility.
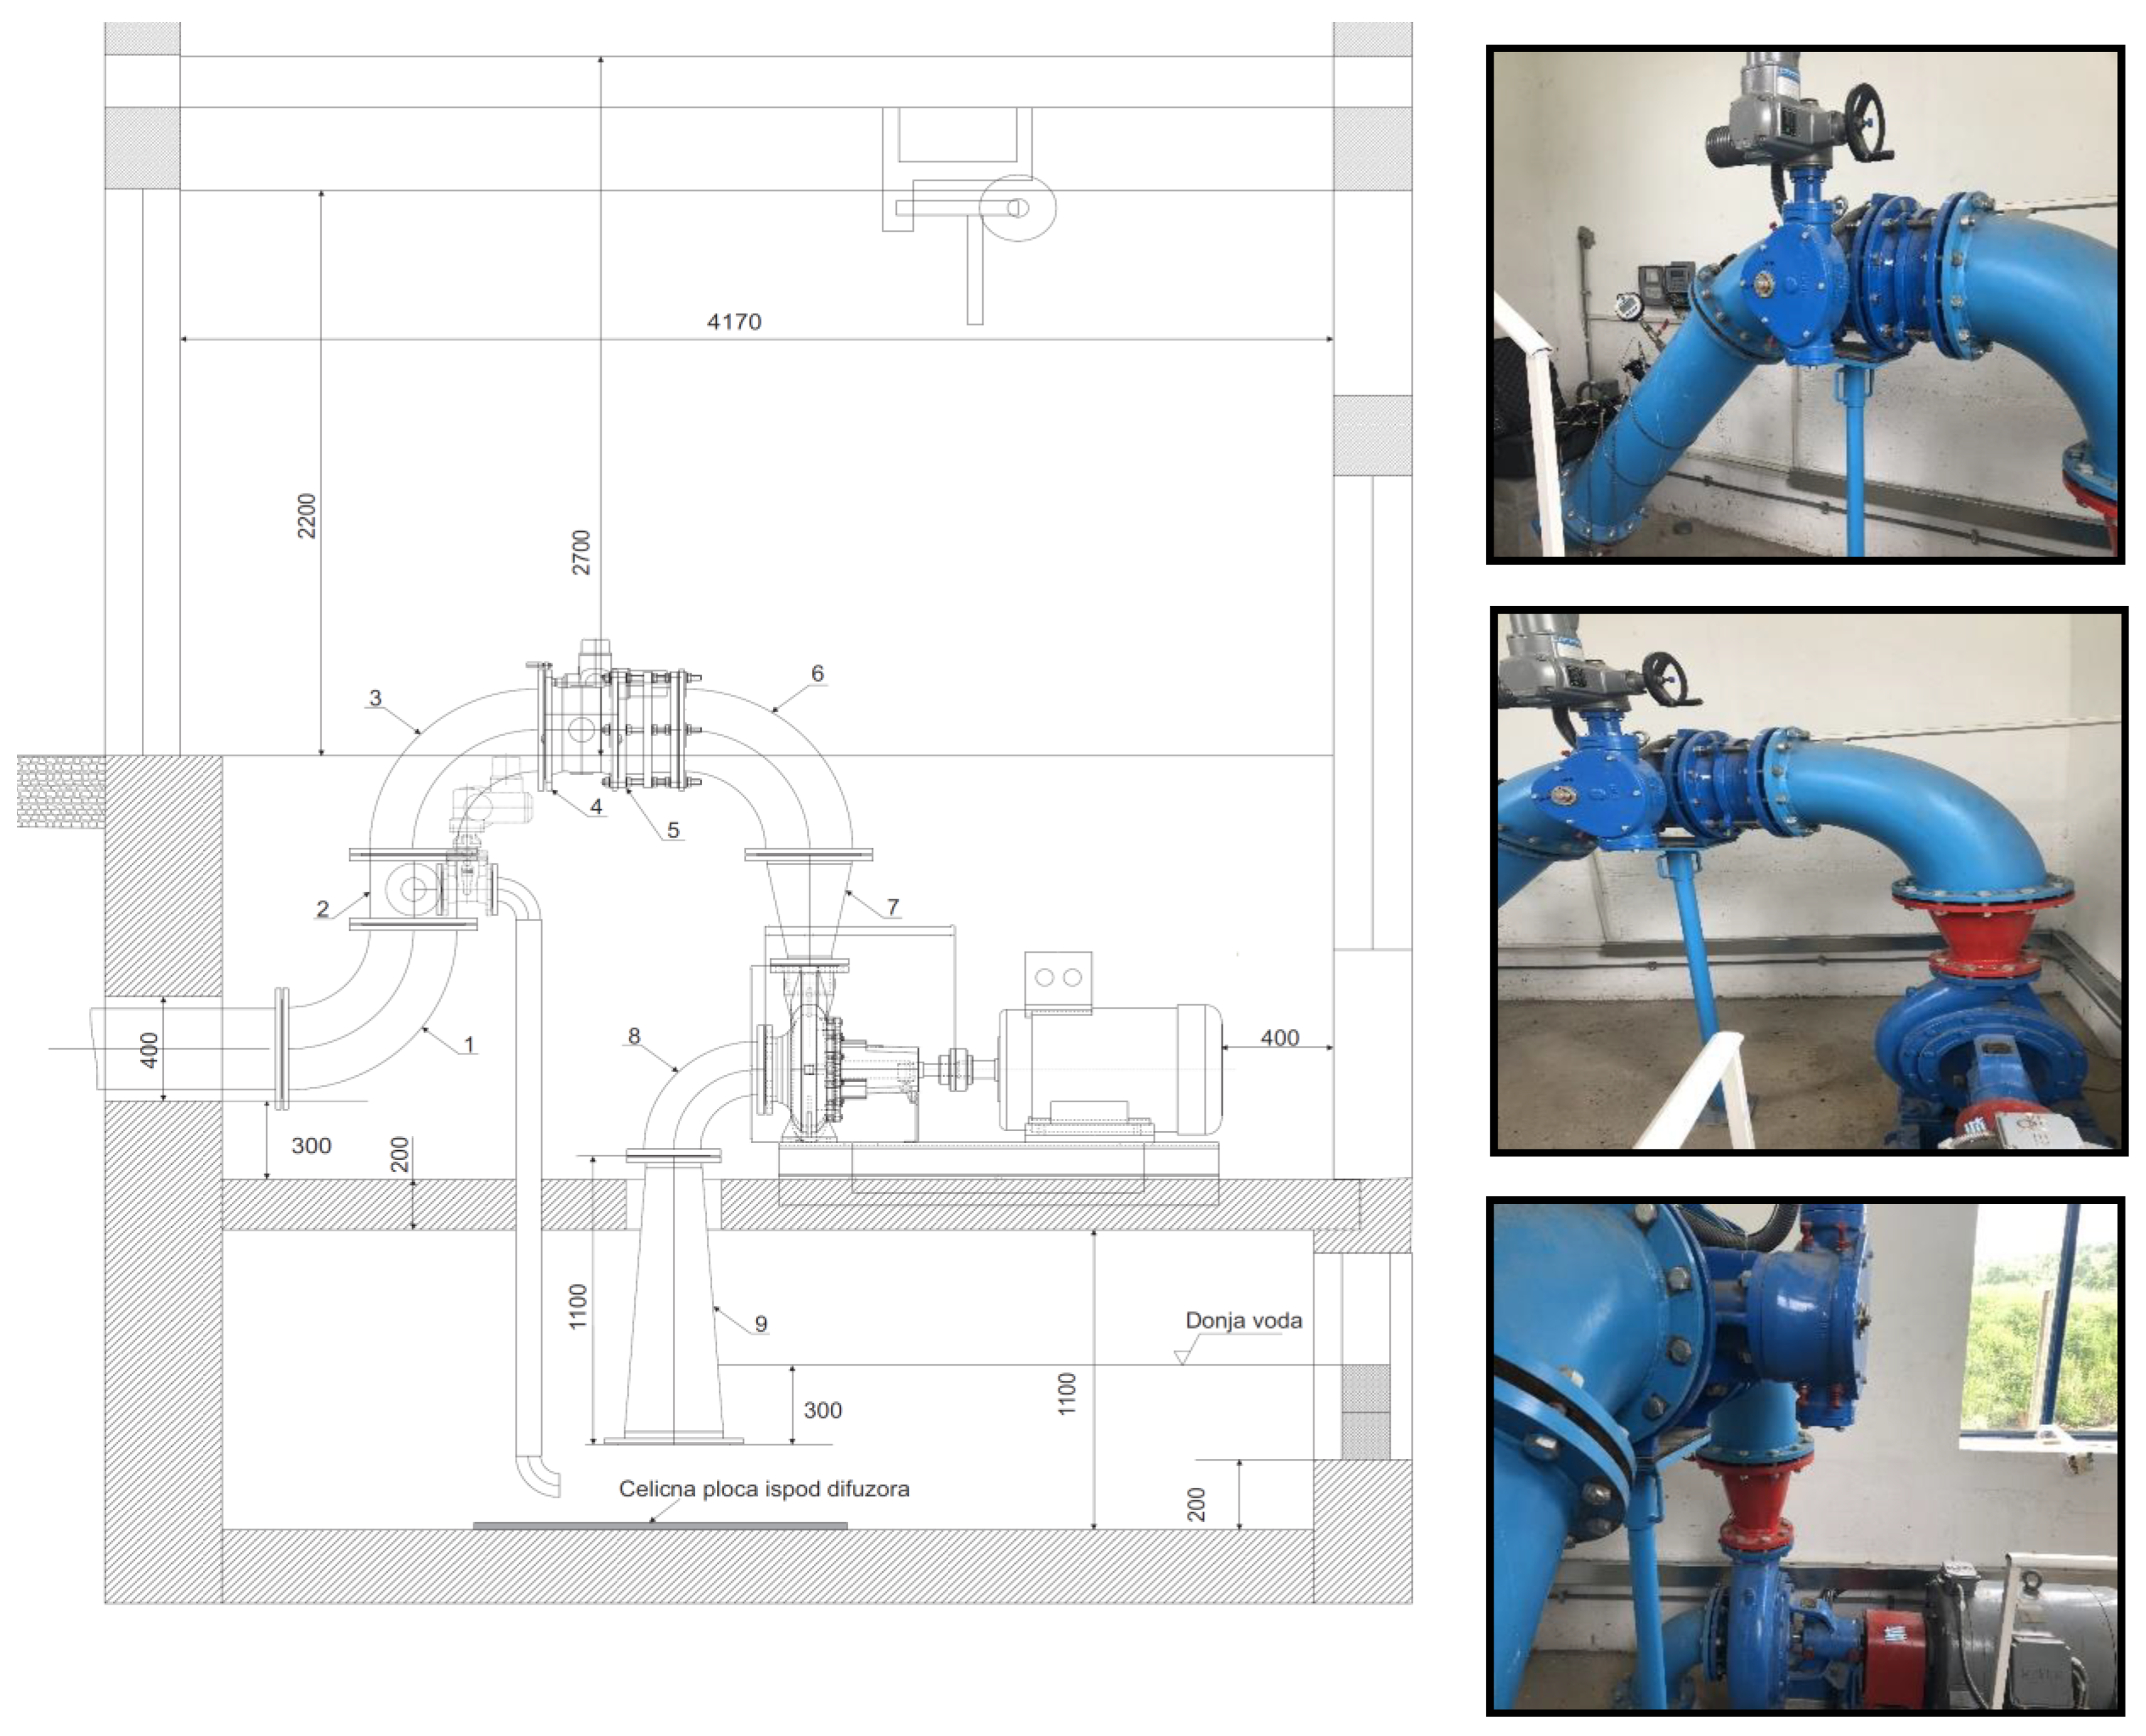
Figure 4.
NN 150-315 and KSB 150-315 curves in a) pump and b) turbine regime (n=1520 rpm).
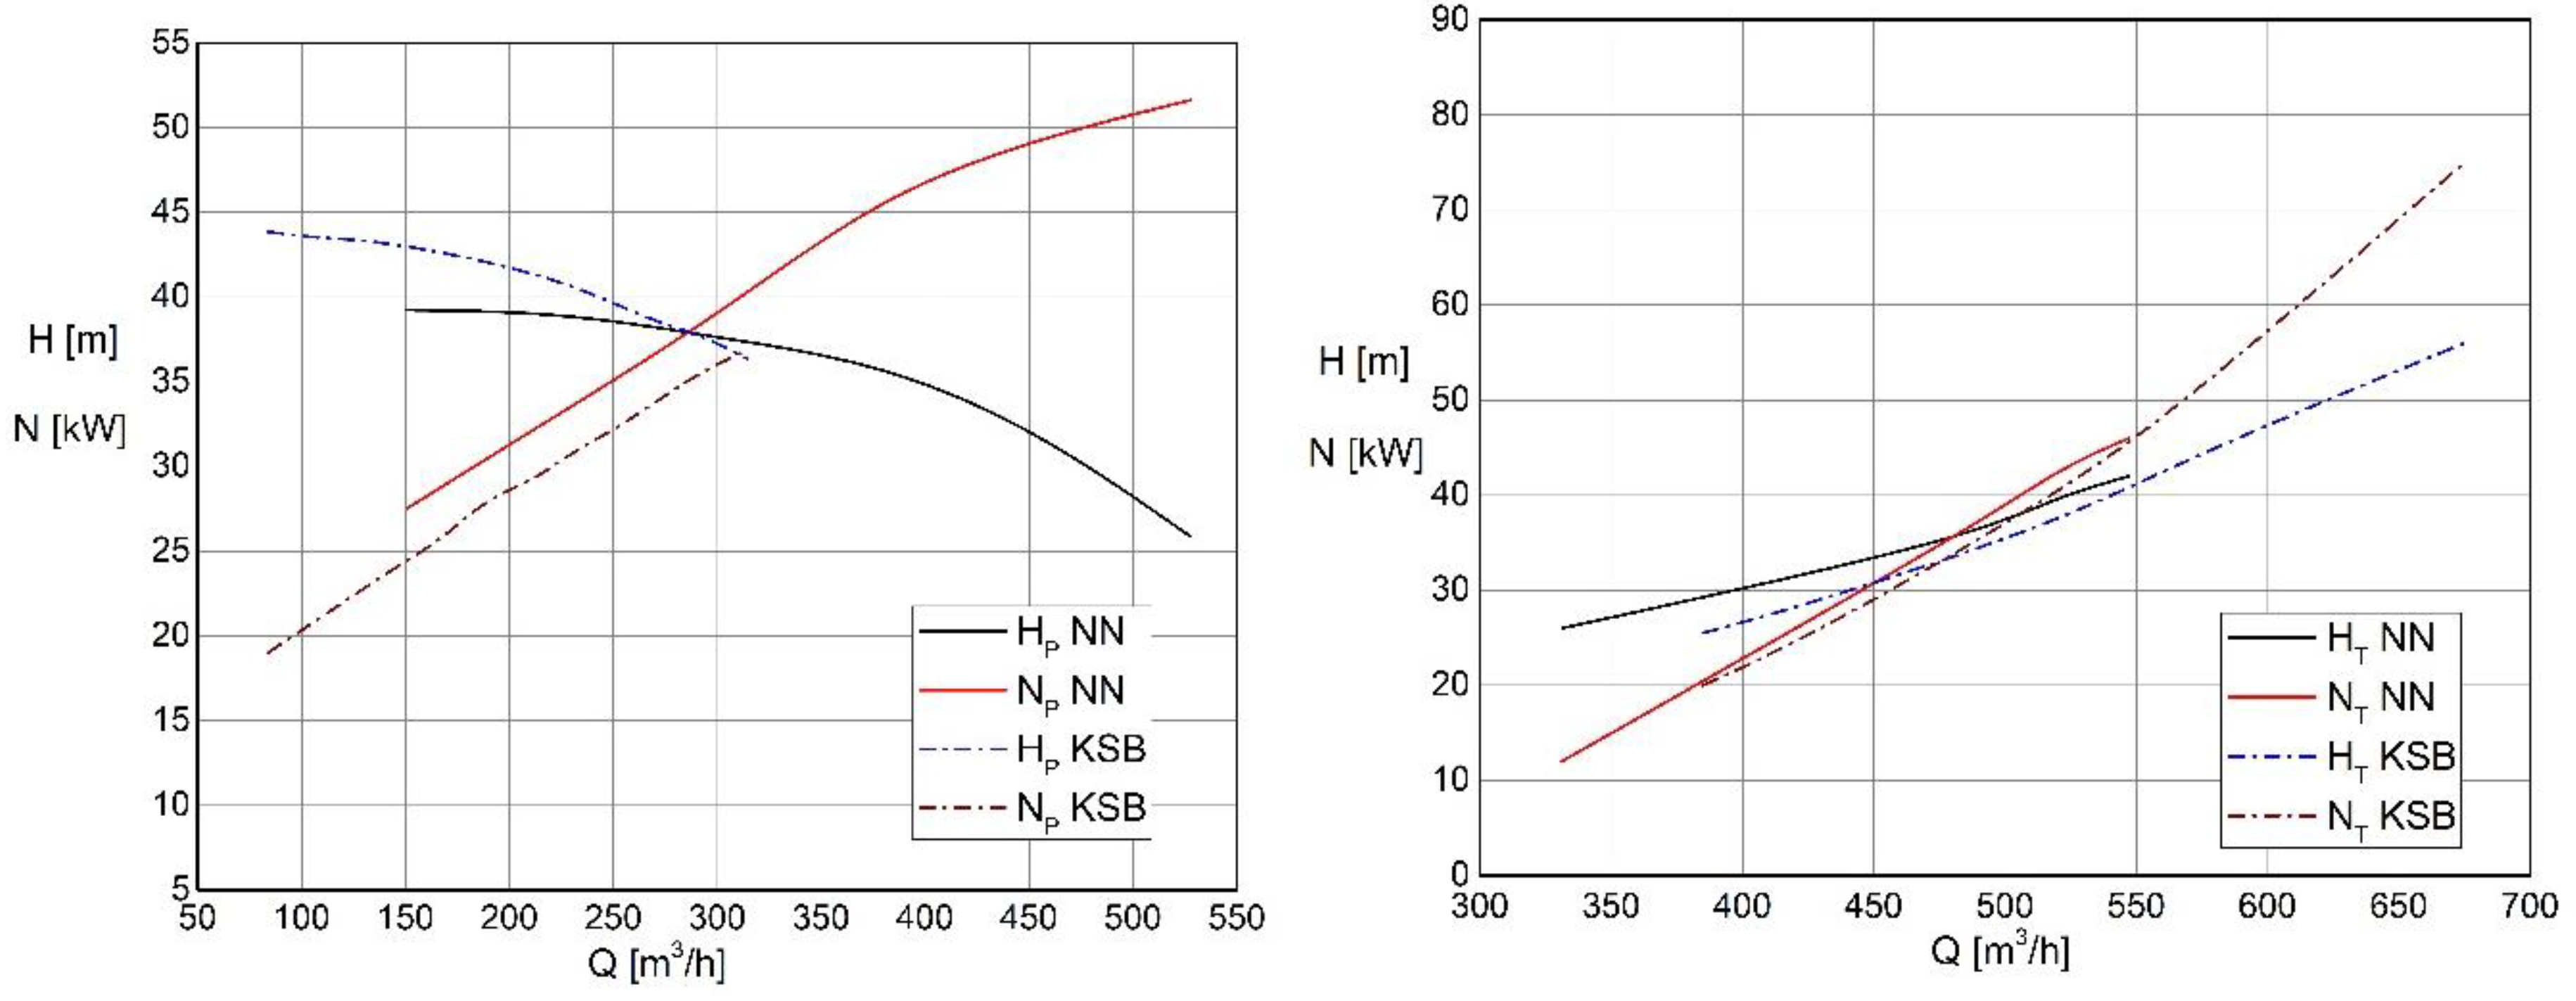
Figure 5.
Turbine aggregate in SHPP Citluk.
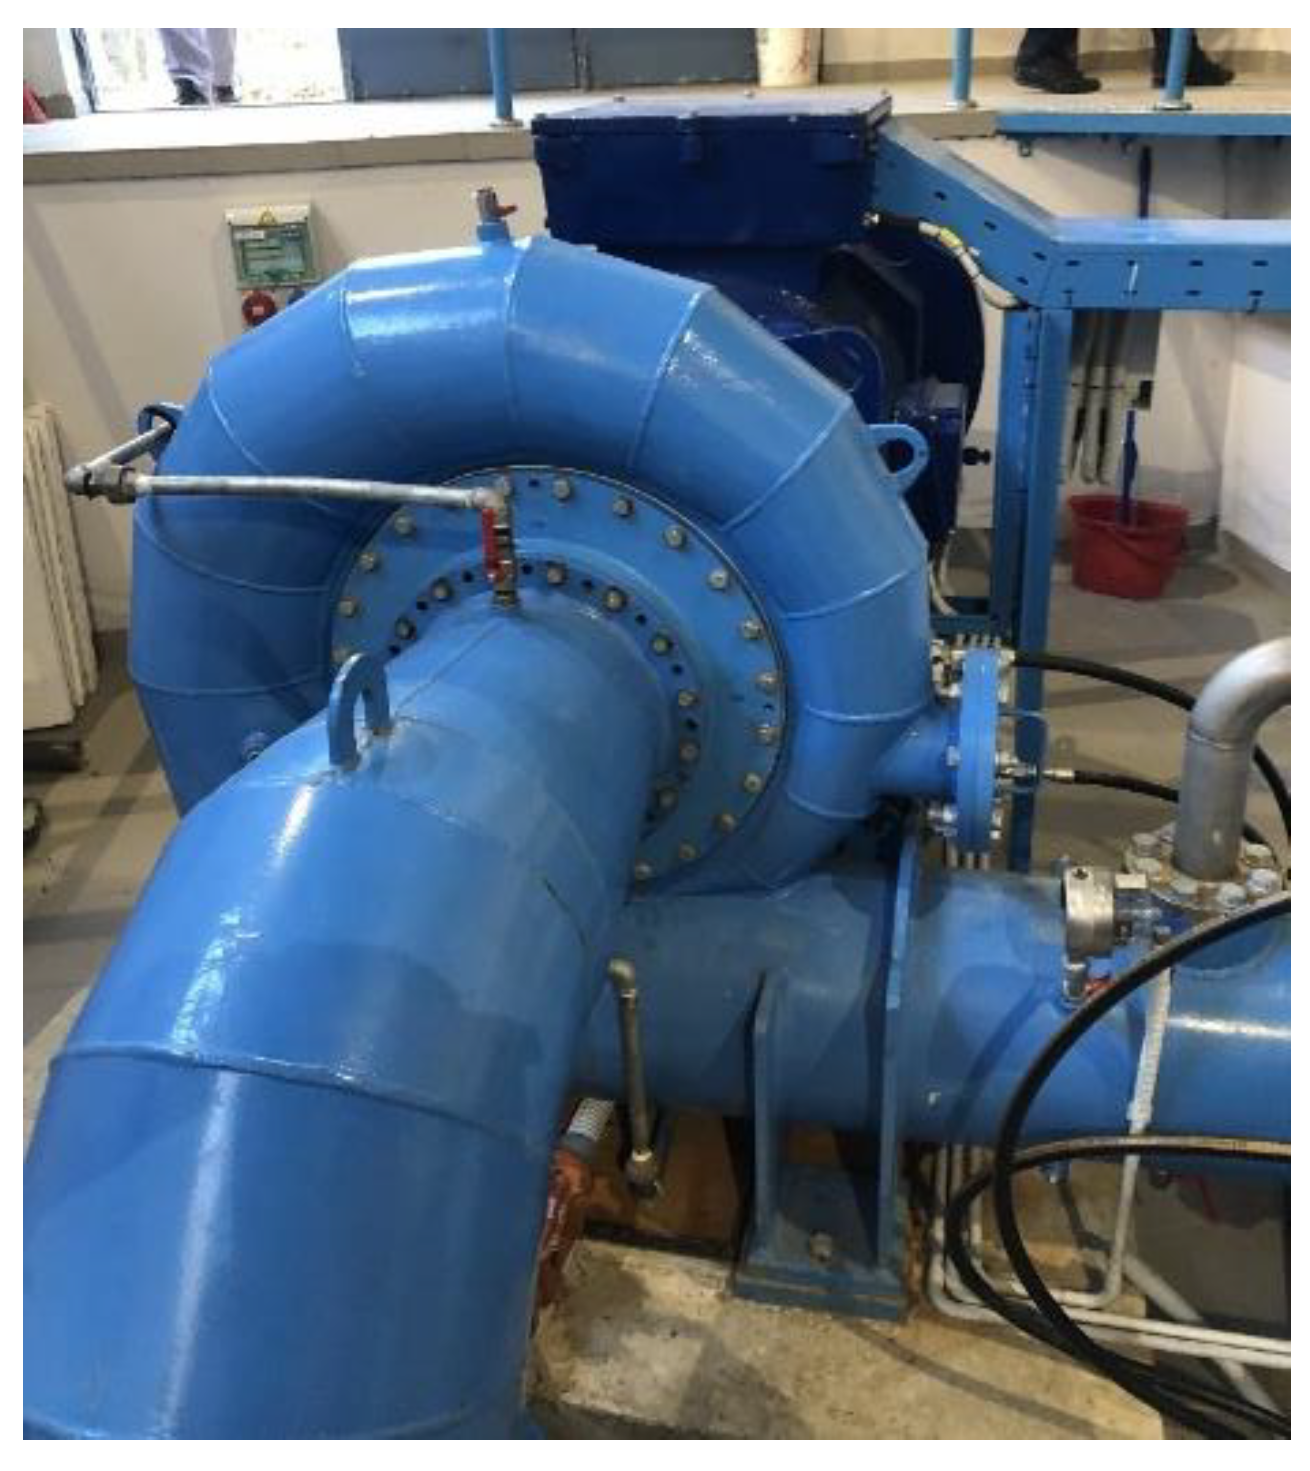
Figure 6.
Performance curves of PAT.
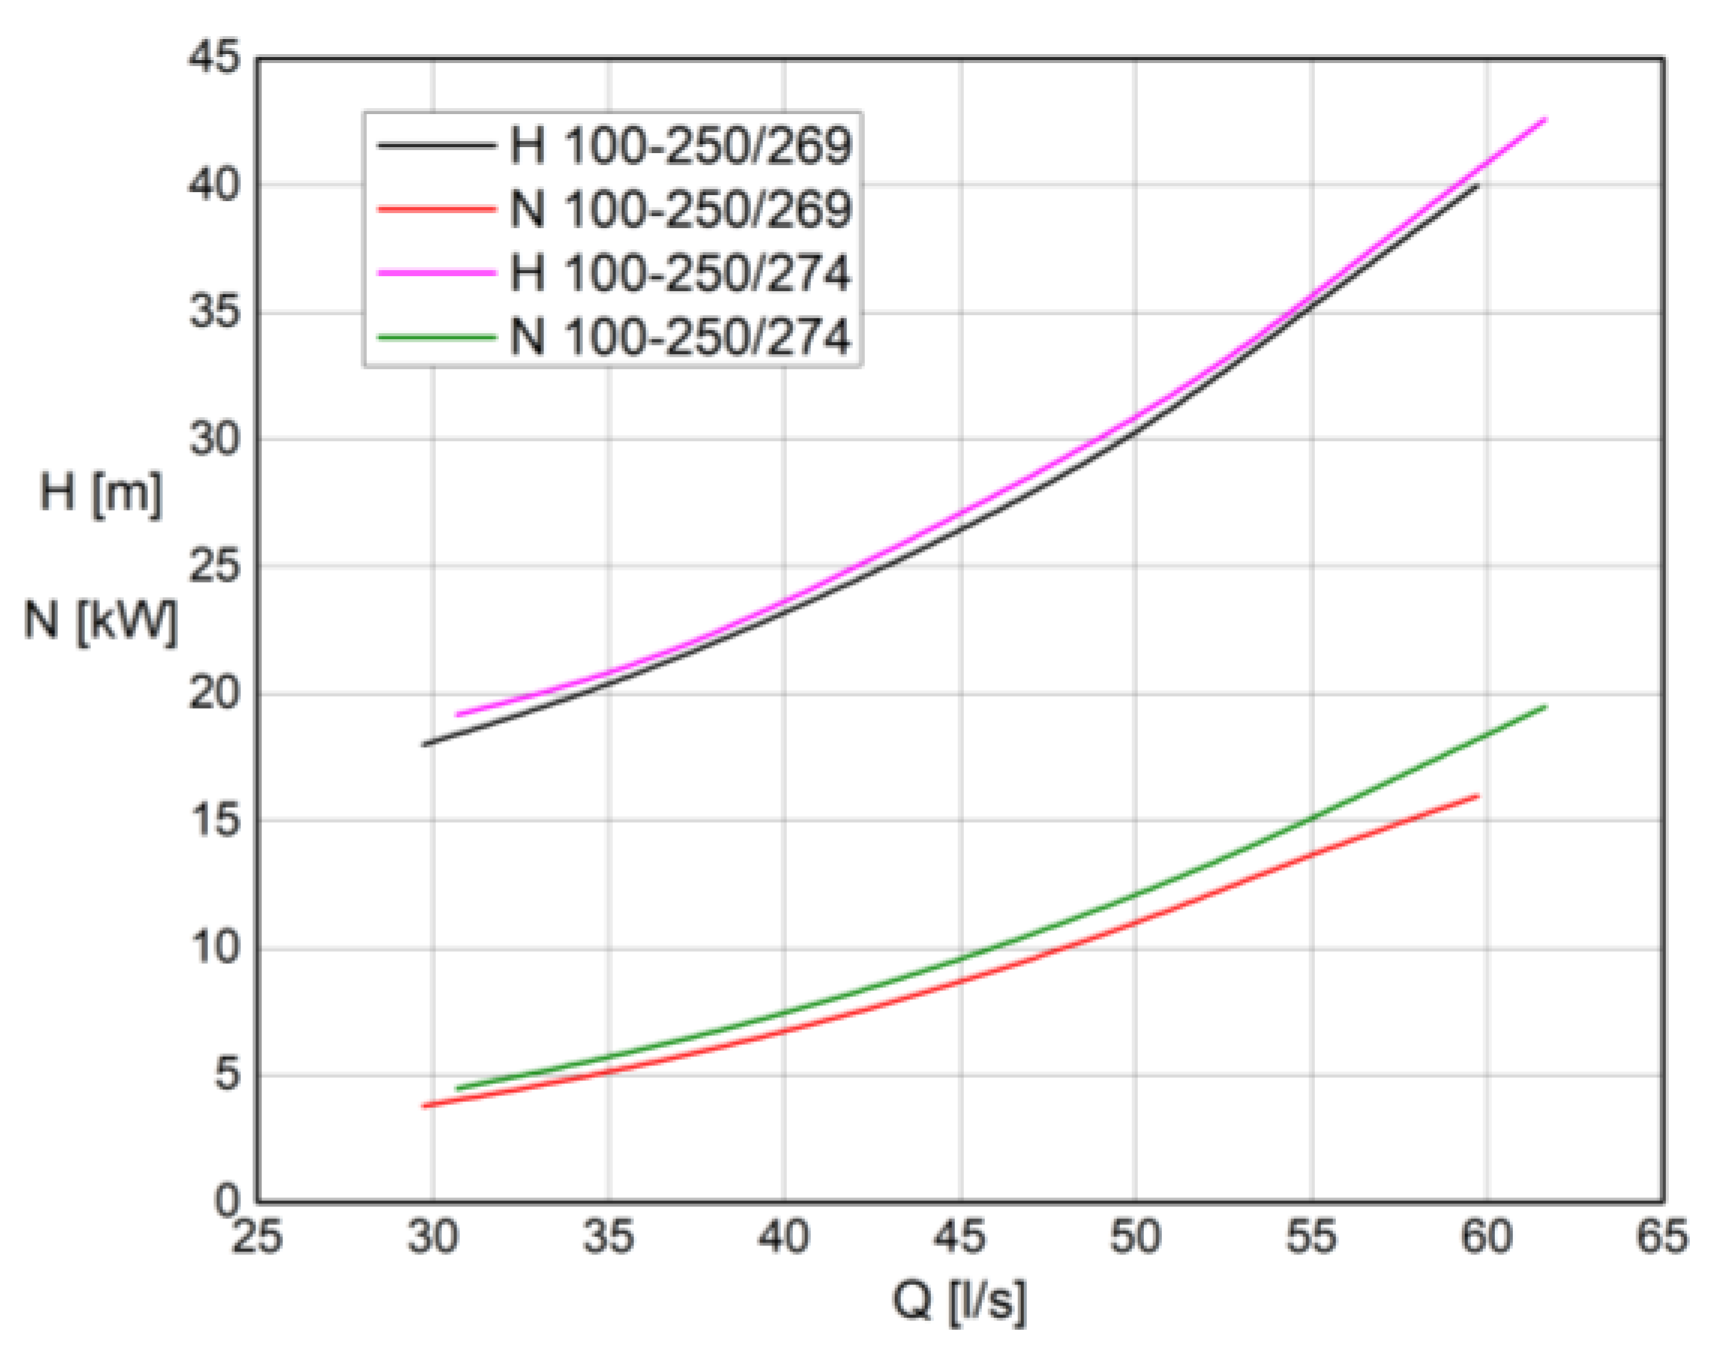
Figure 7.
Some of the KSB norm pumps tested experimentally: a) Etanorm 150-315/334 and b) Etanorm 250-500/520 operating in pump (n=1450 rpm) and in turbine mode (n=1520 rpm and n=1000 rpm).
Figure 7.
Some of the KSB norm pumps tested experimentally: a) Etanorm 150-315/334 and b) Etanorm 250-500/520 operating in pump (n=1450 rpm) and in turbine mode (n=1520 rpm and n=1000 rpm).
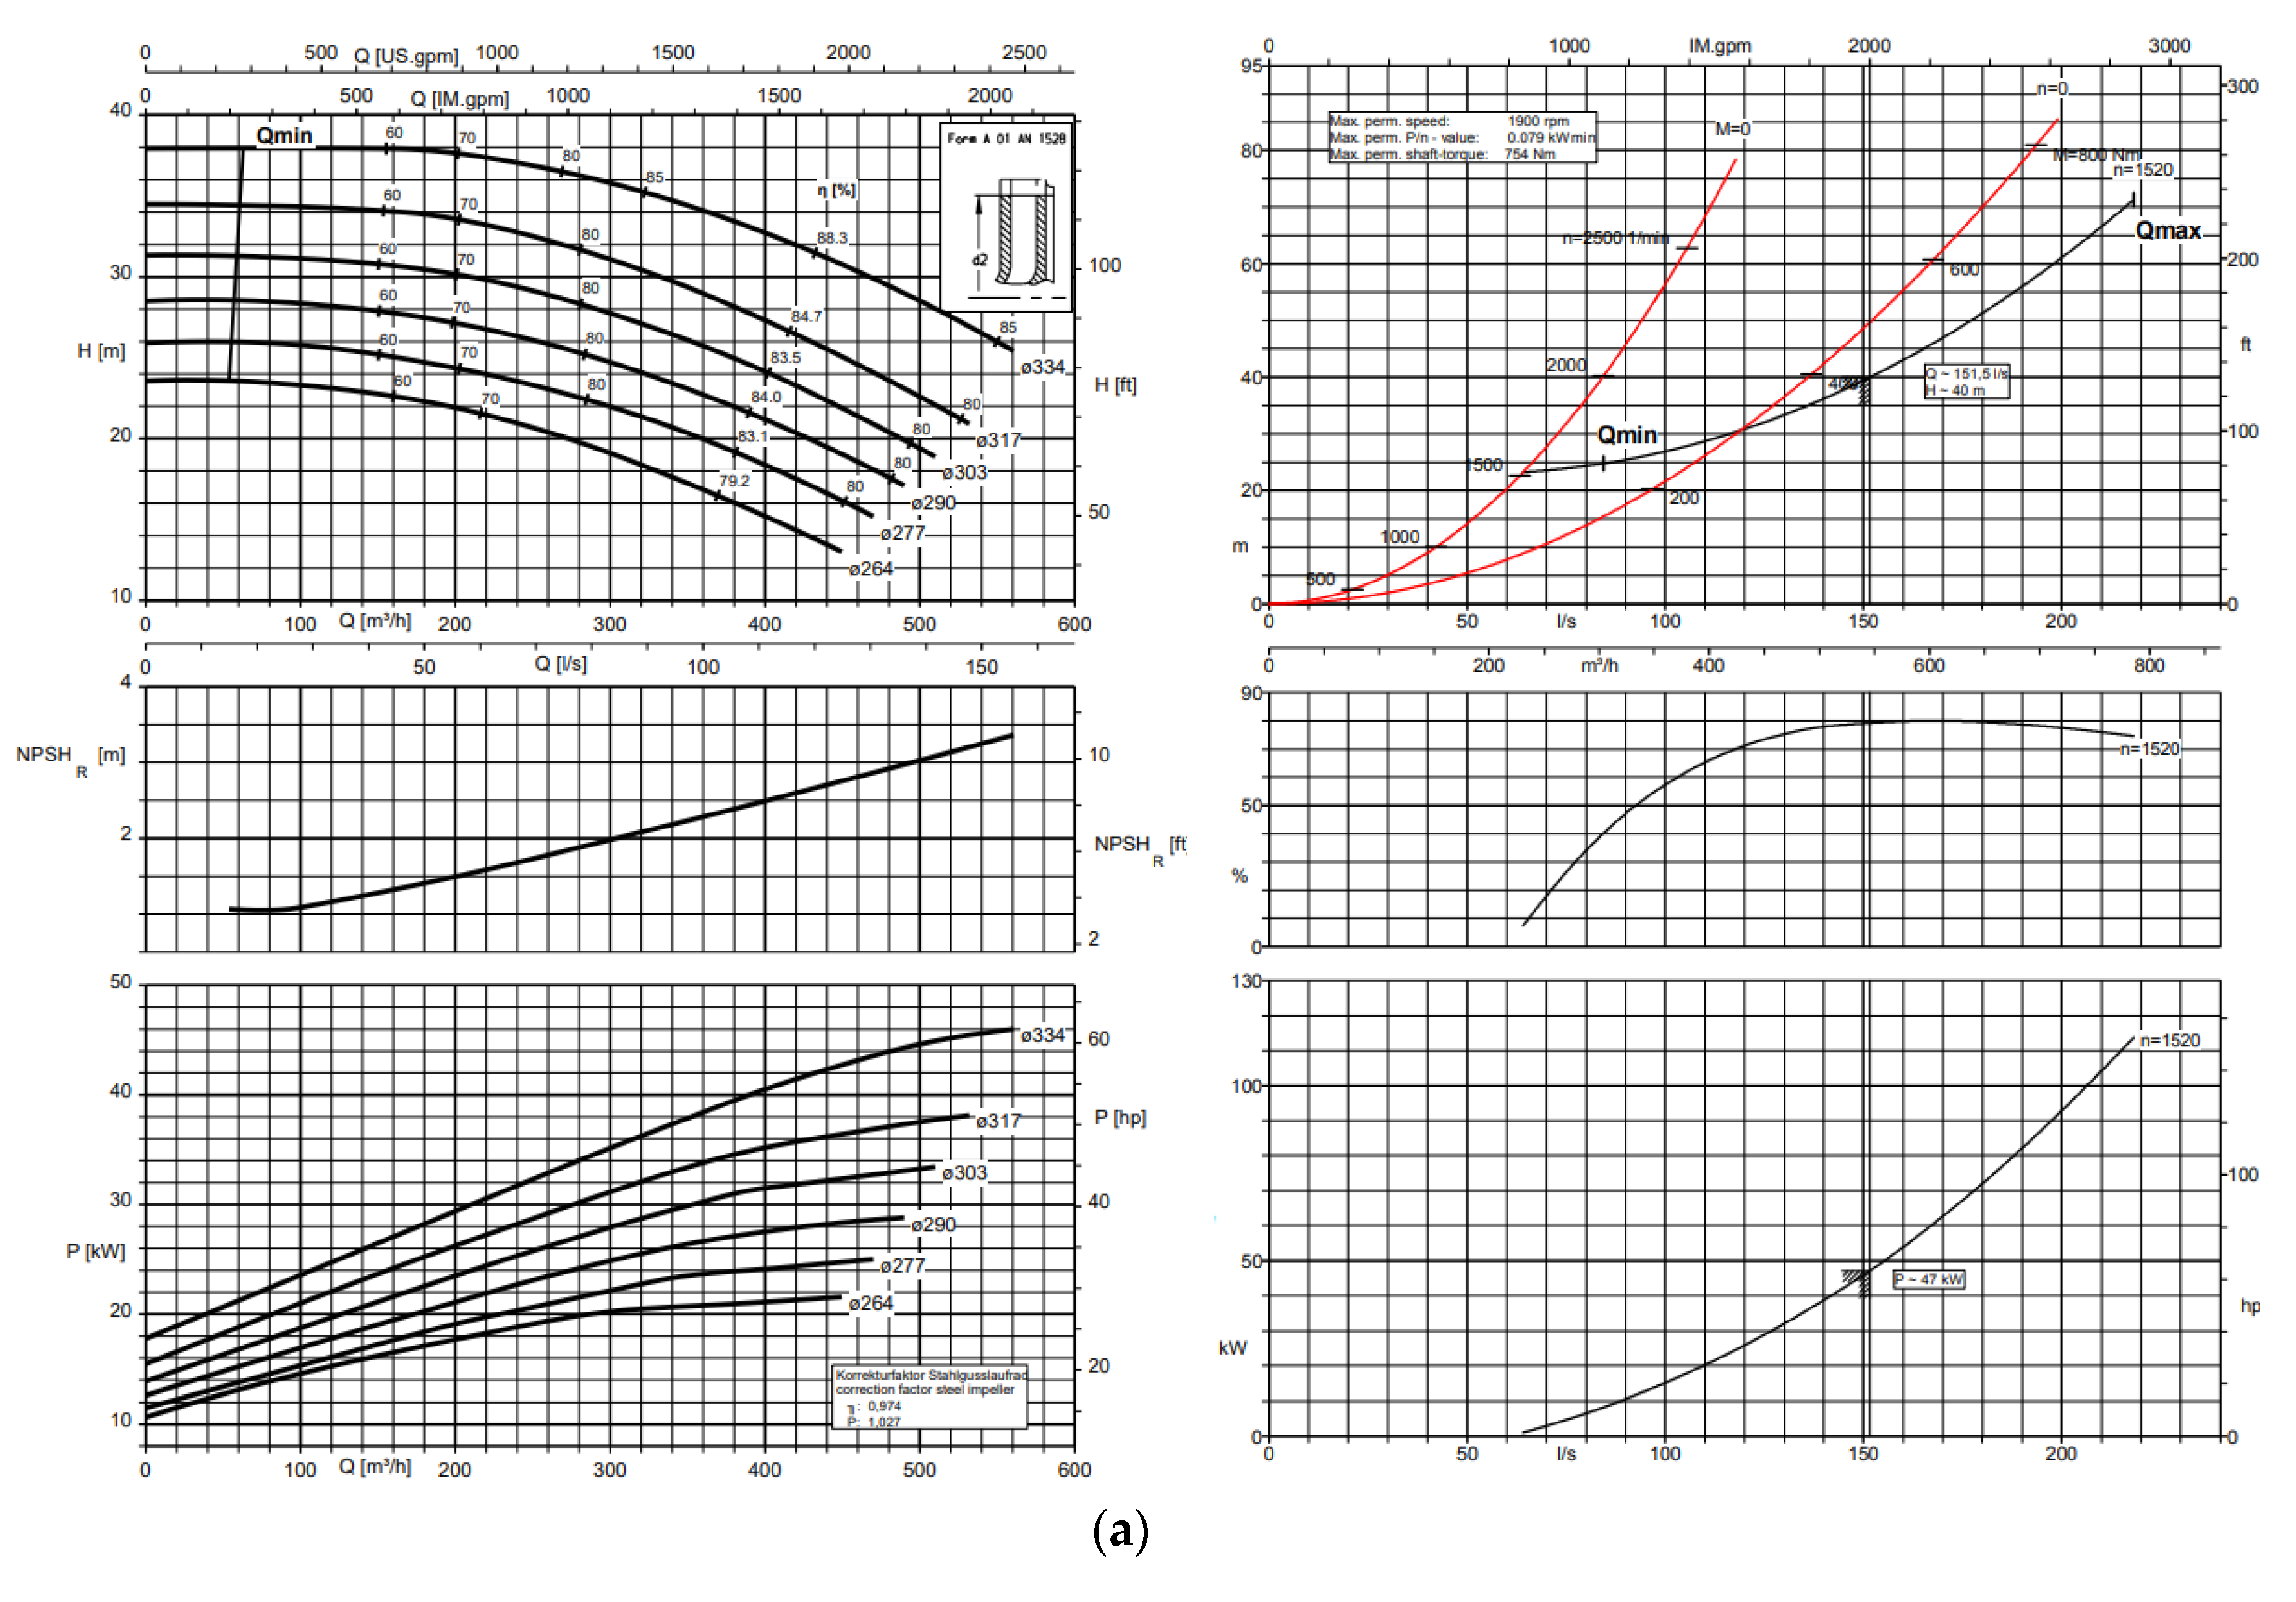
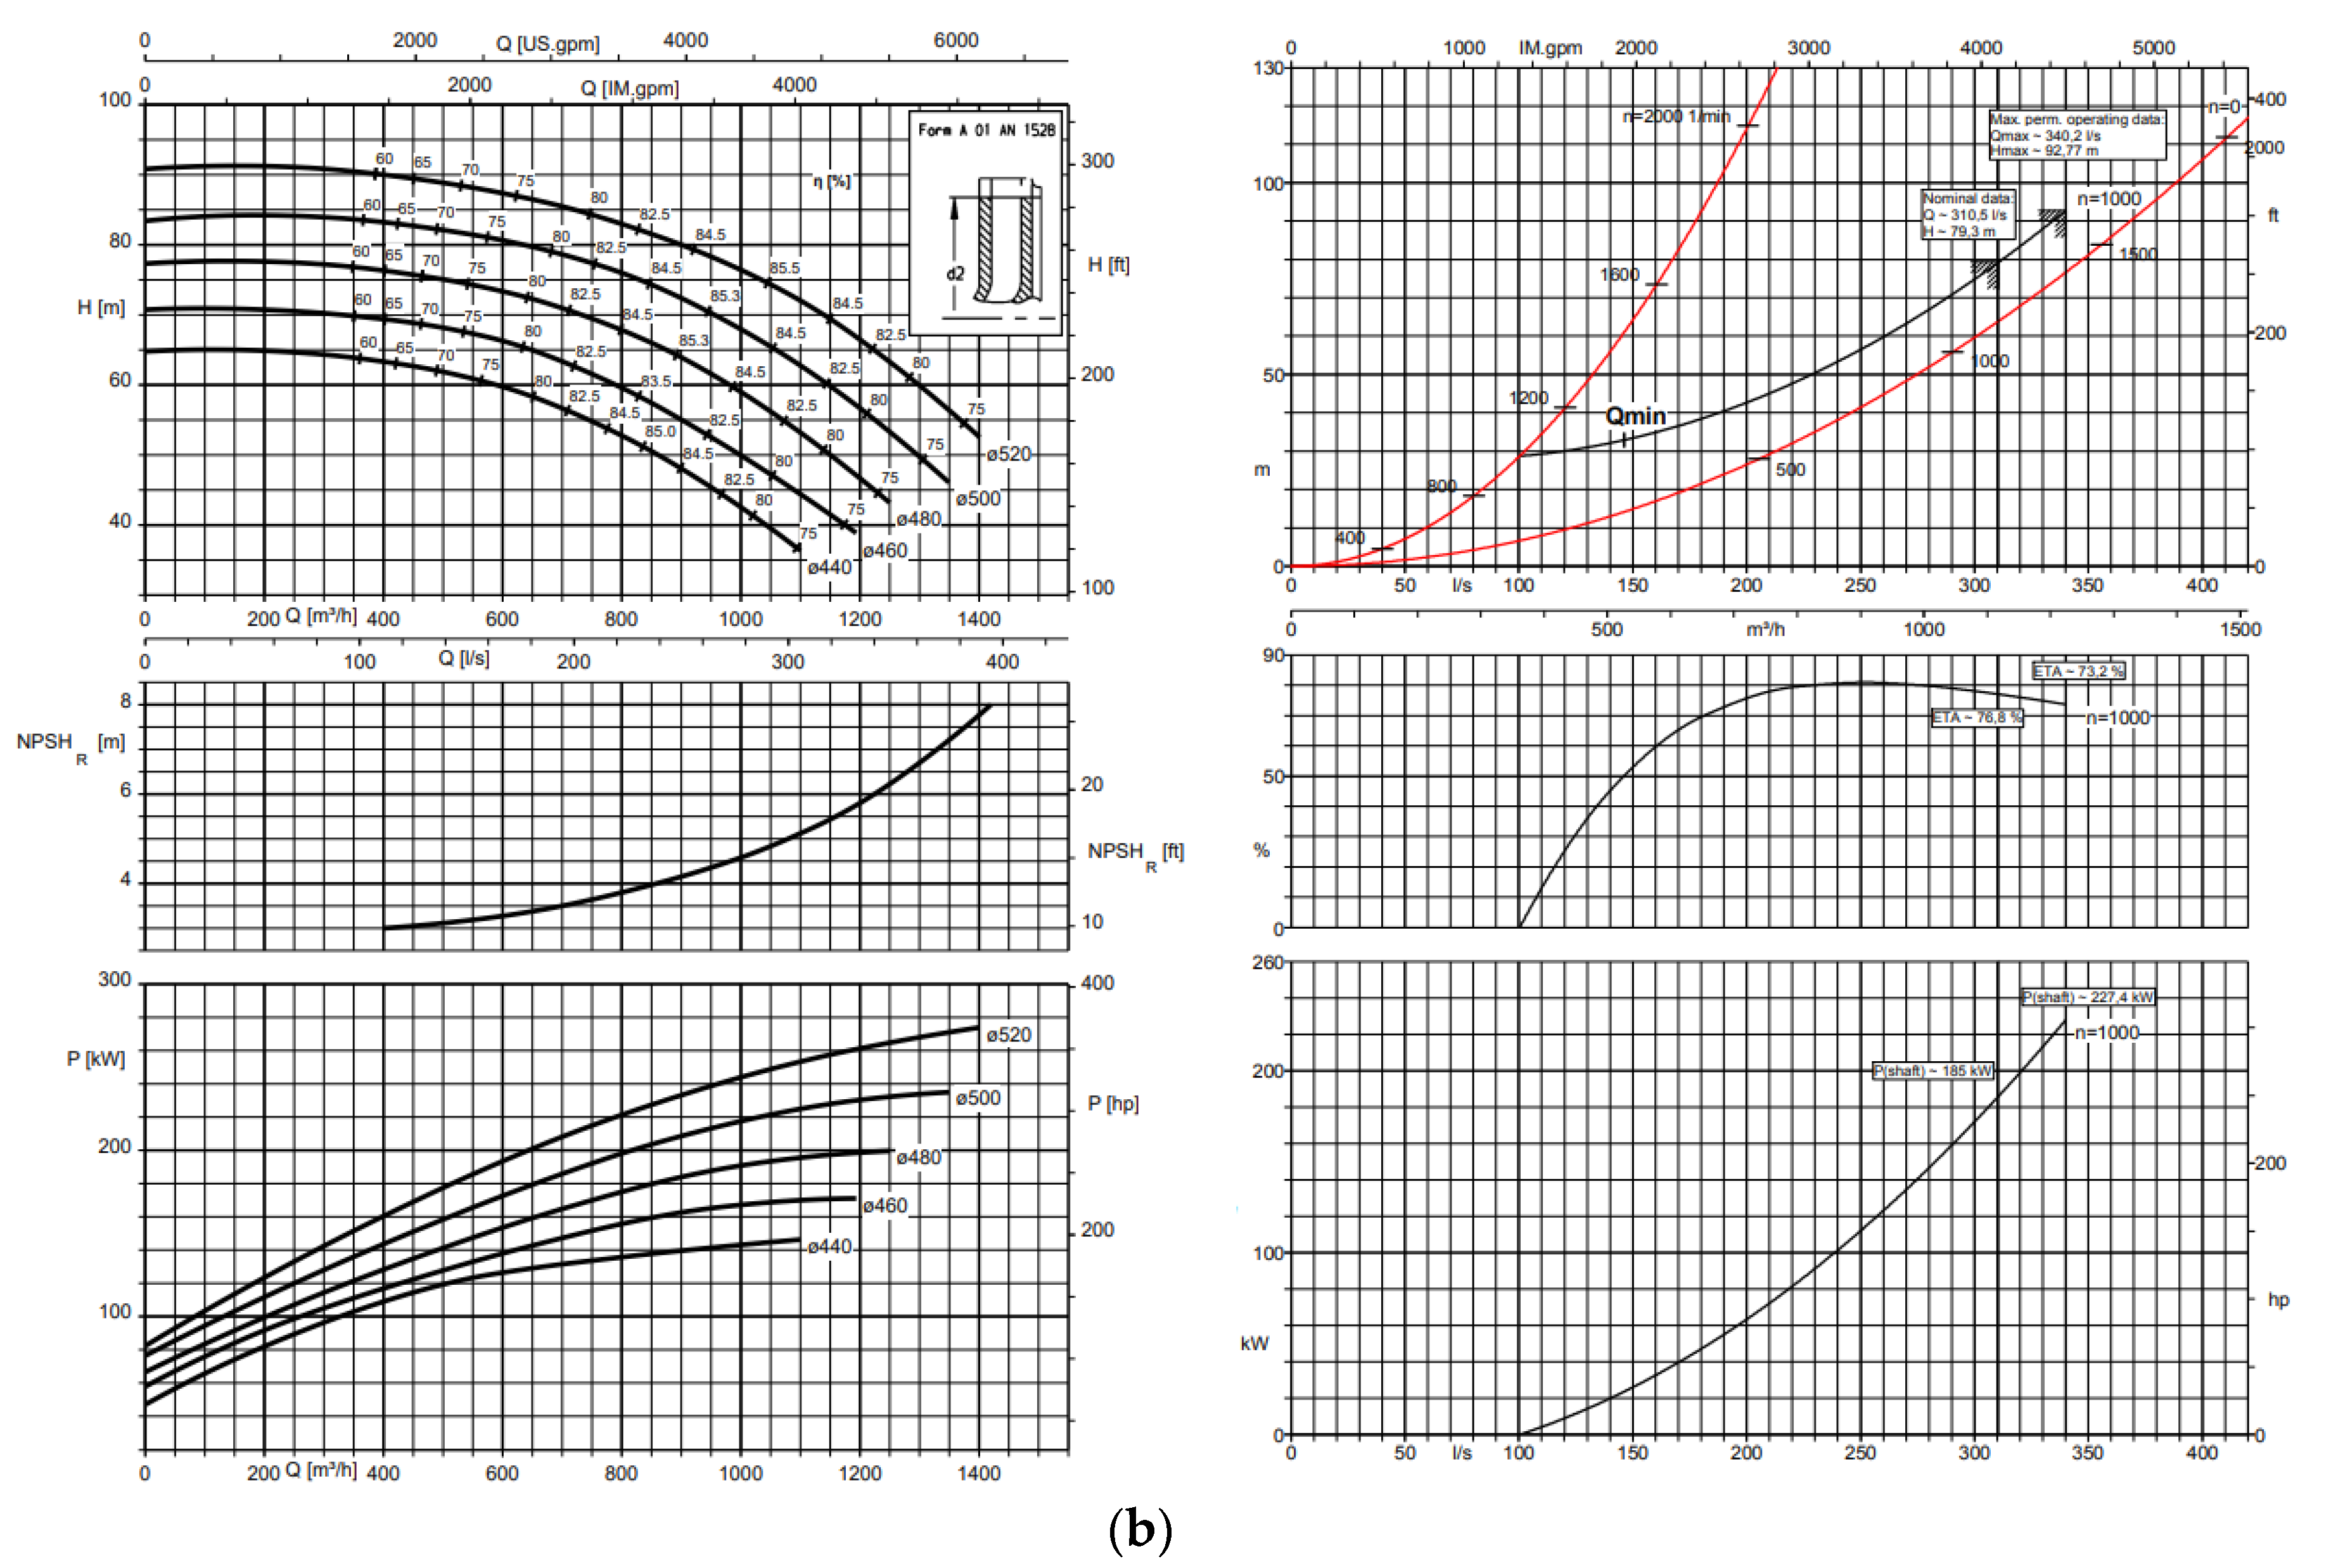
Figure 8.
Some of the Grundfos norm pumps tested experimentally: a) NK 100-315/295 and b) NK 125-315/290 operating in pump (n=1470 rpm) and in turbine mode (n=1520 rpm).
Figure 8.
Some of the Grundfos norm pumps tested experimentally: a) NK 100-315/295 and b) NK 125-315/290 operating in pump (n=1470 rpm) and in turbine mode (n=1520 rpm).

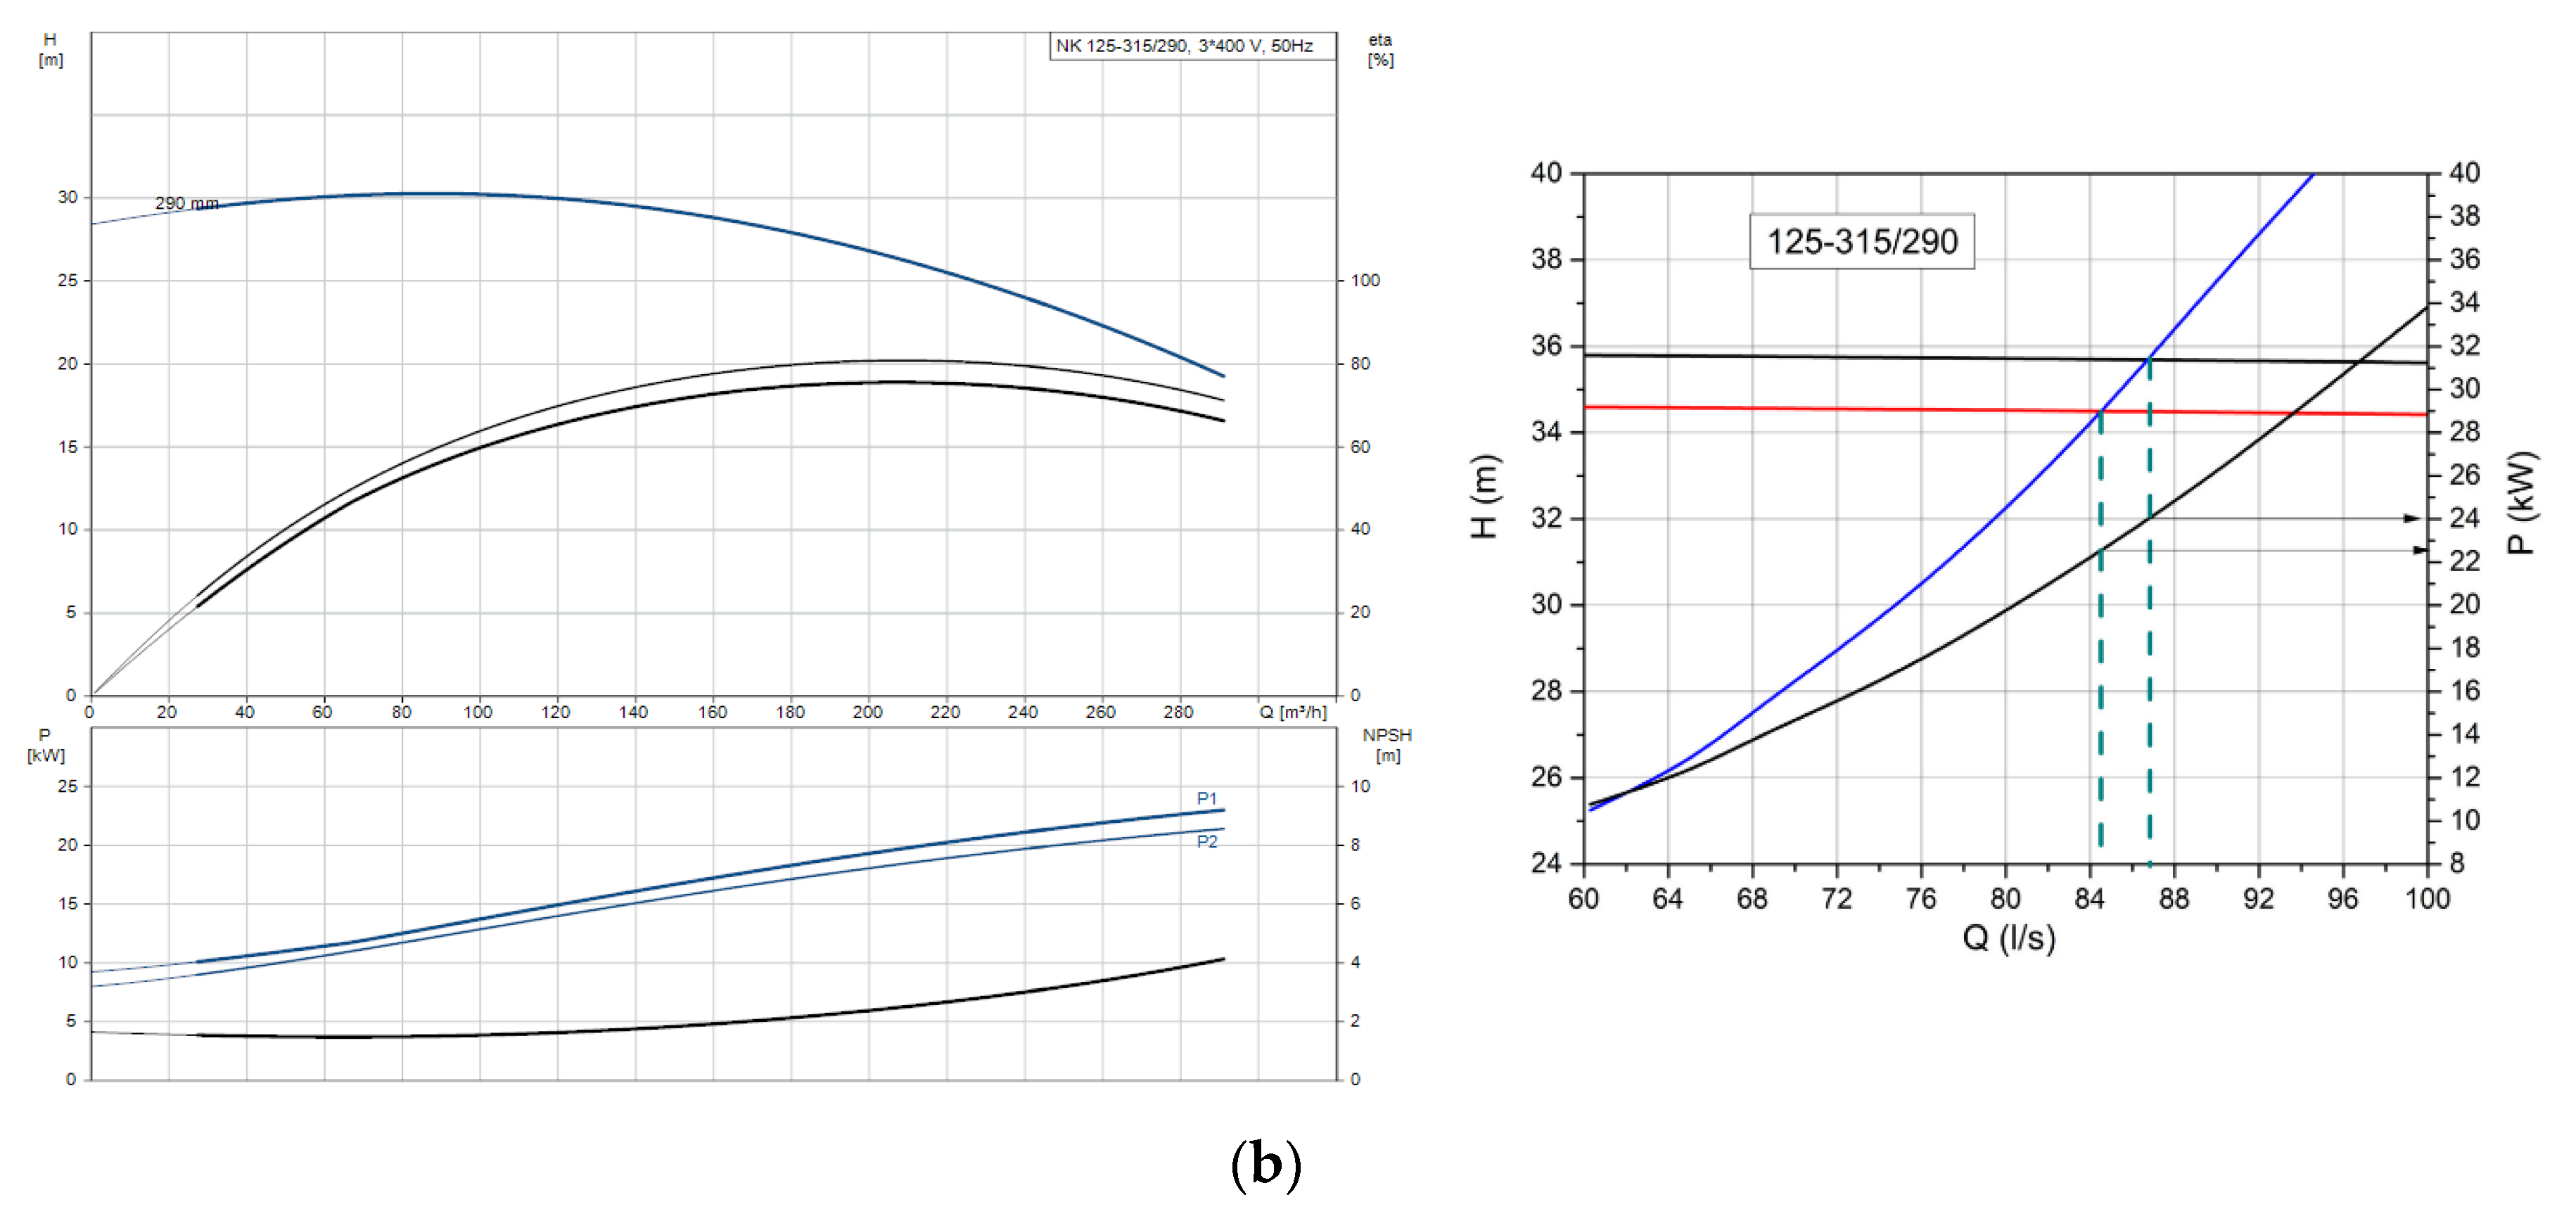
Figure 9.
Comparison of a) turbine head and b) turbine power for Etanorm 50-160, n=1520 rpm.
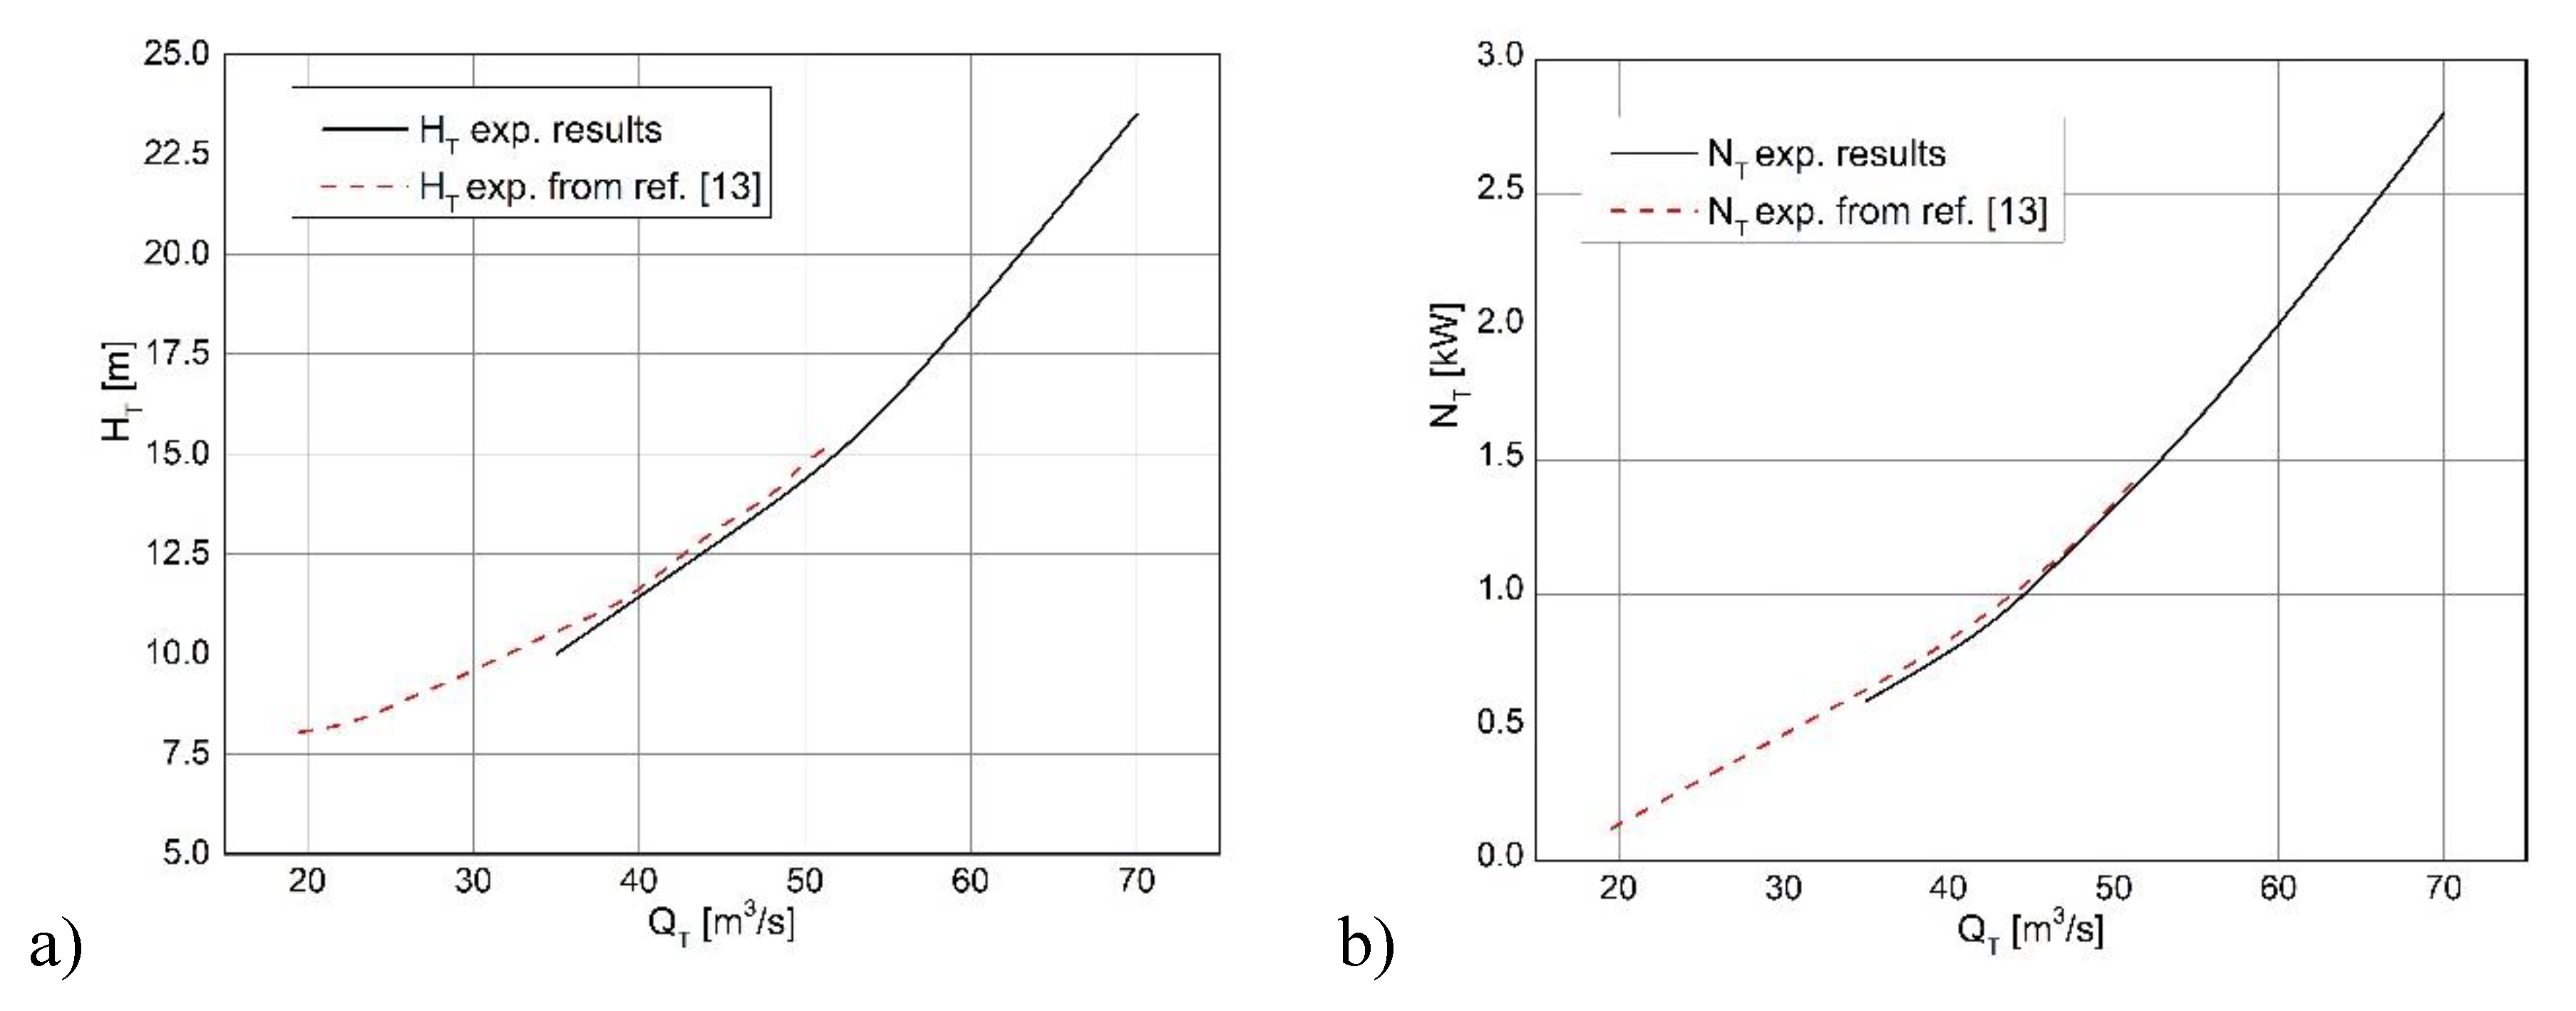
Figure 10.
Dimensionless head curves of pump and turbine mode: a) Etanorm 40, b) Etanorm 65.
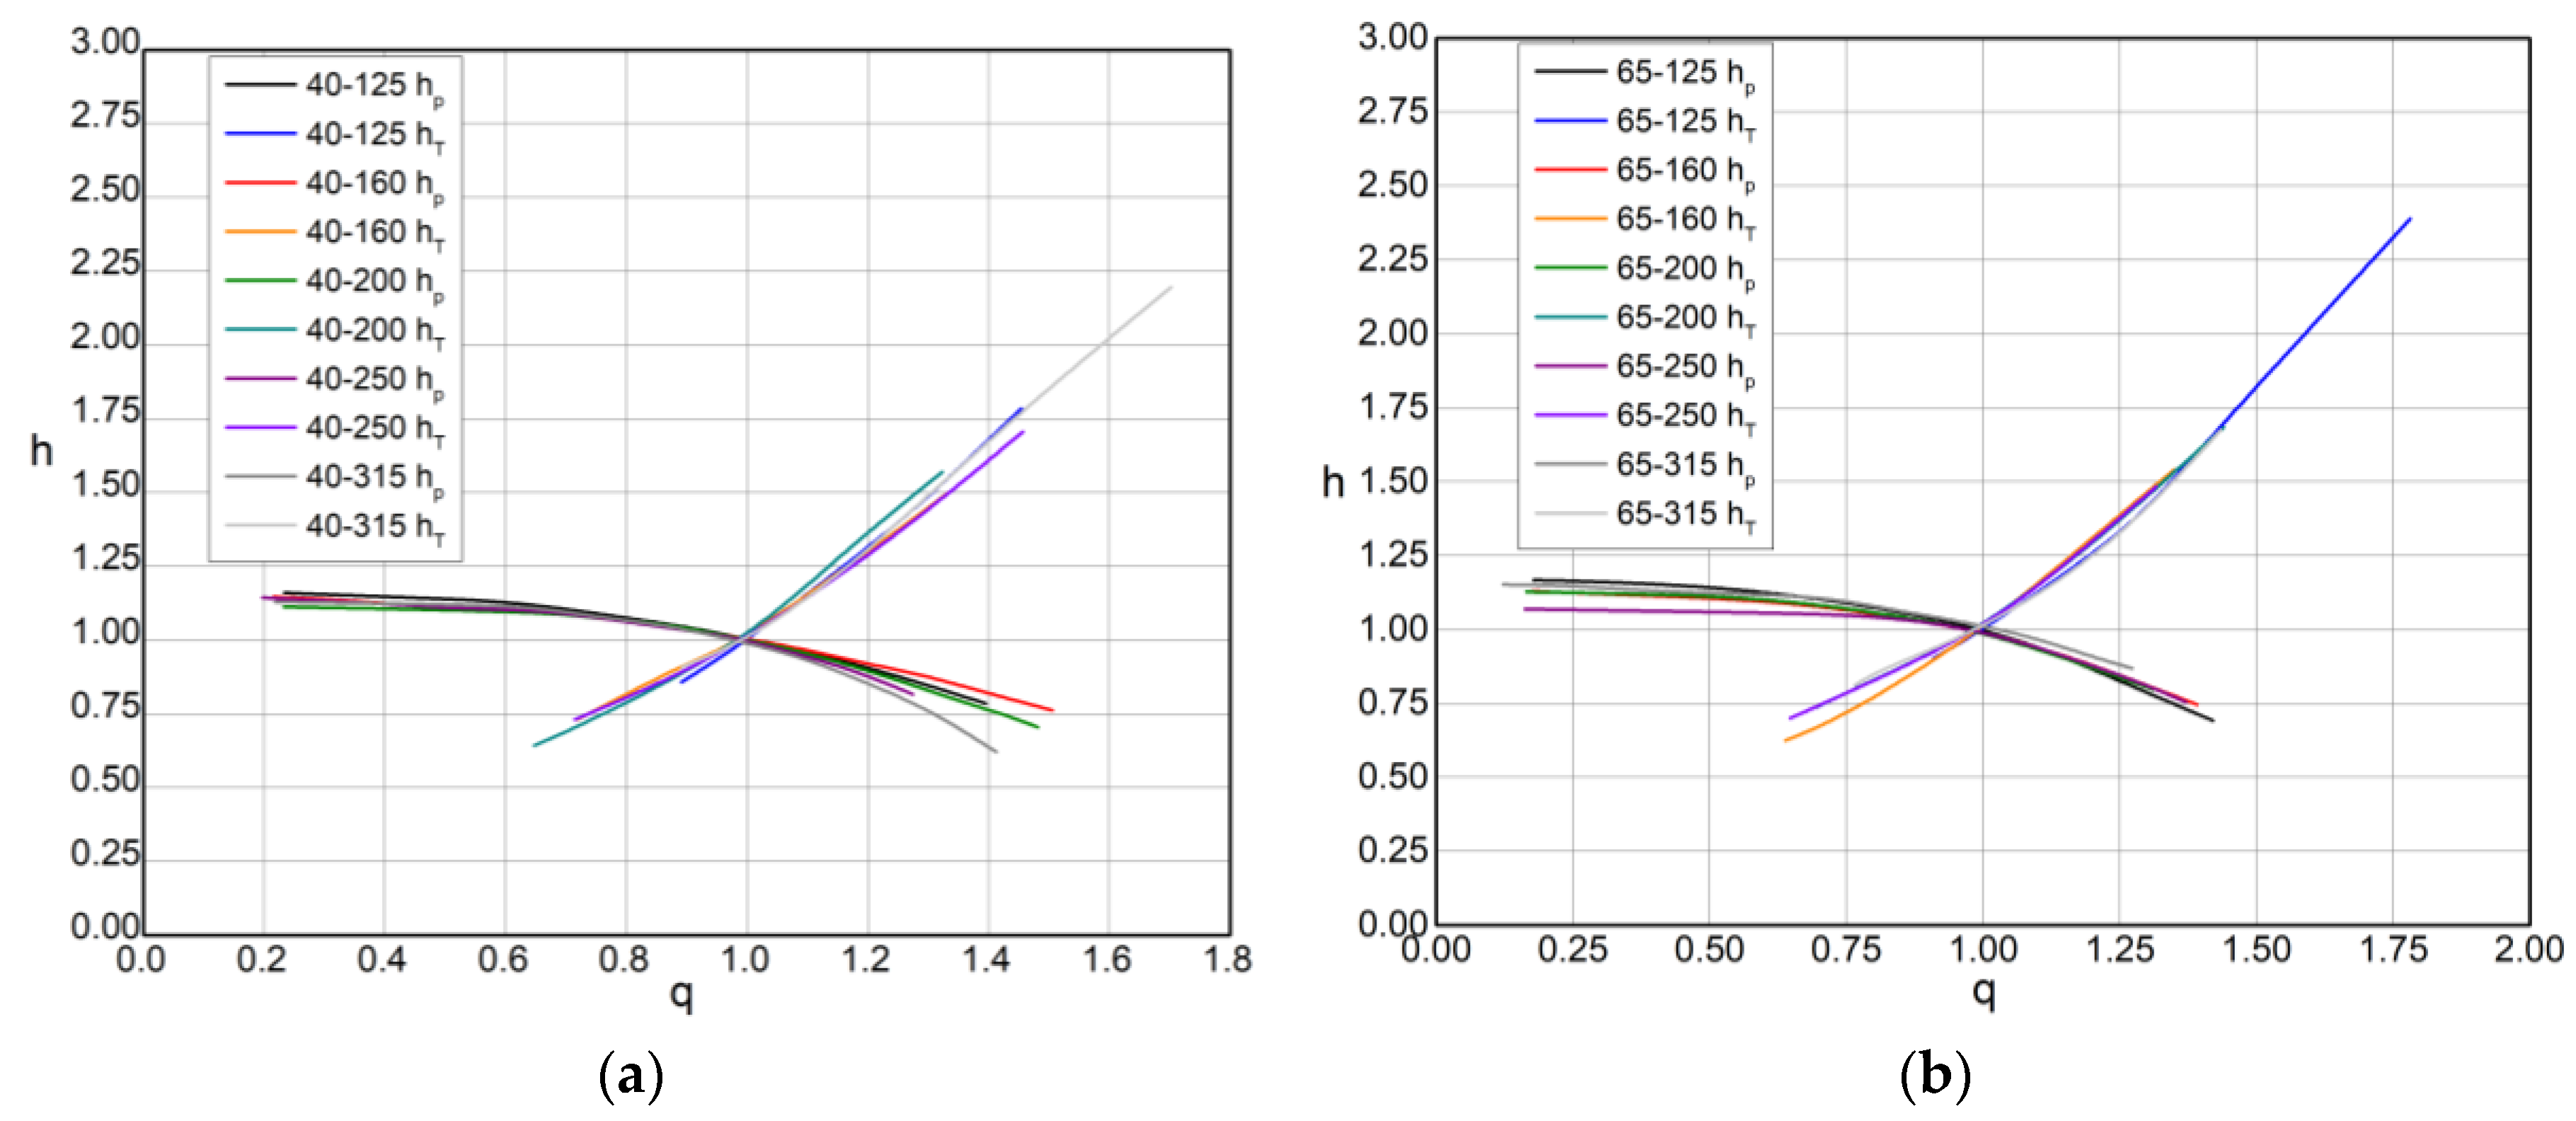
Figure 11.
Dimensionless head curves (Etanorm 32, 50, 80, 100, 125, 150, 200, 250, 300).
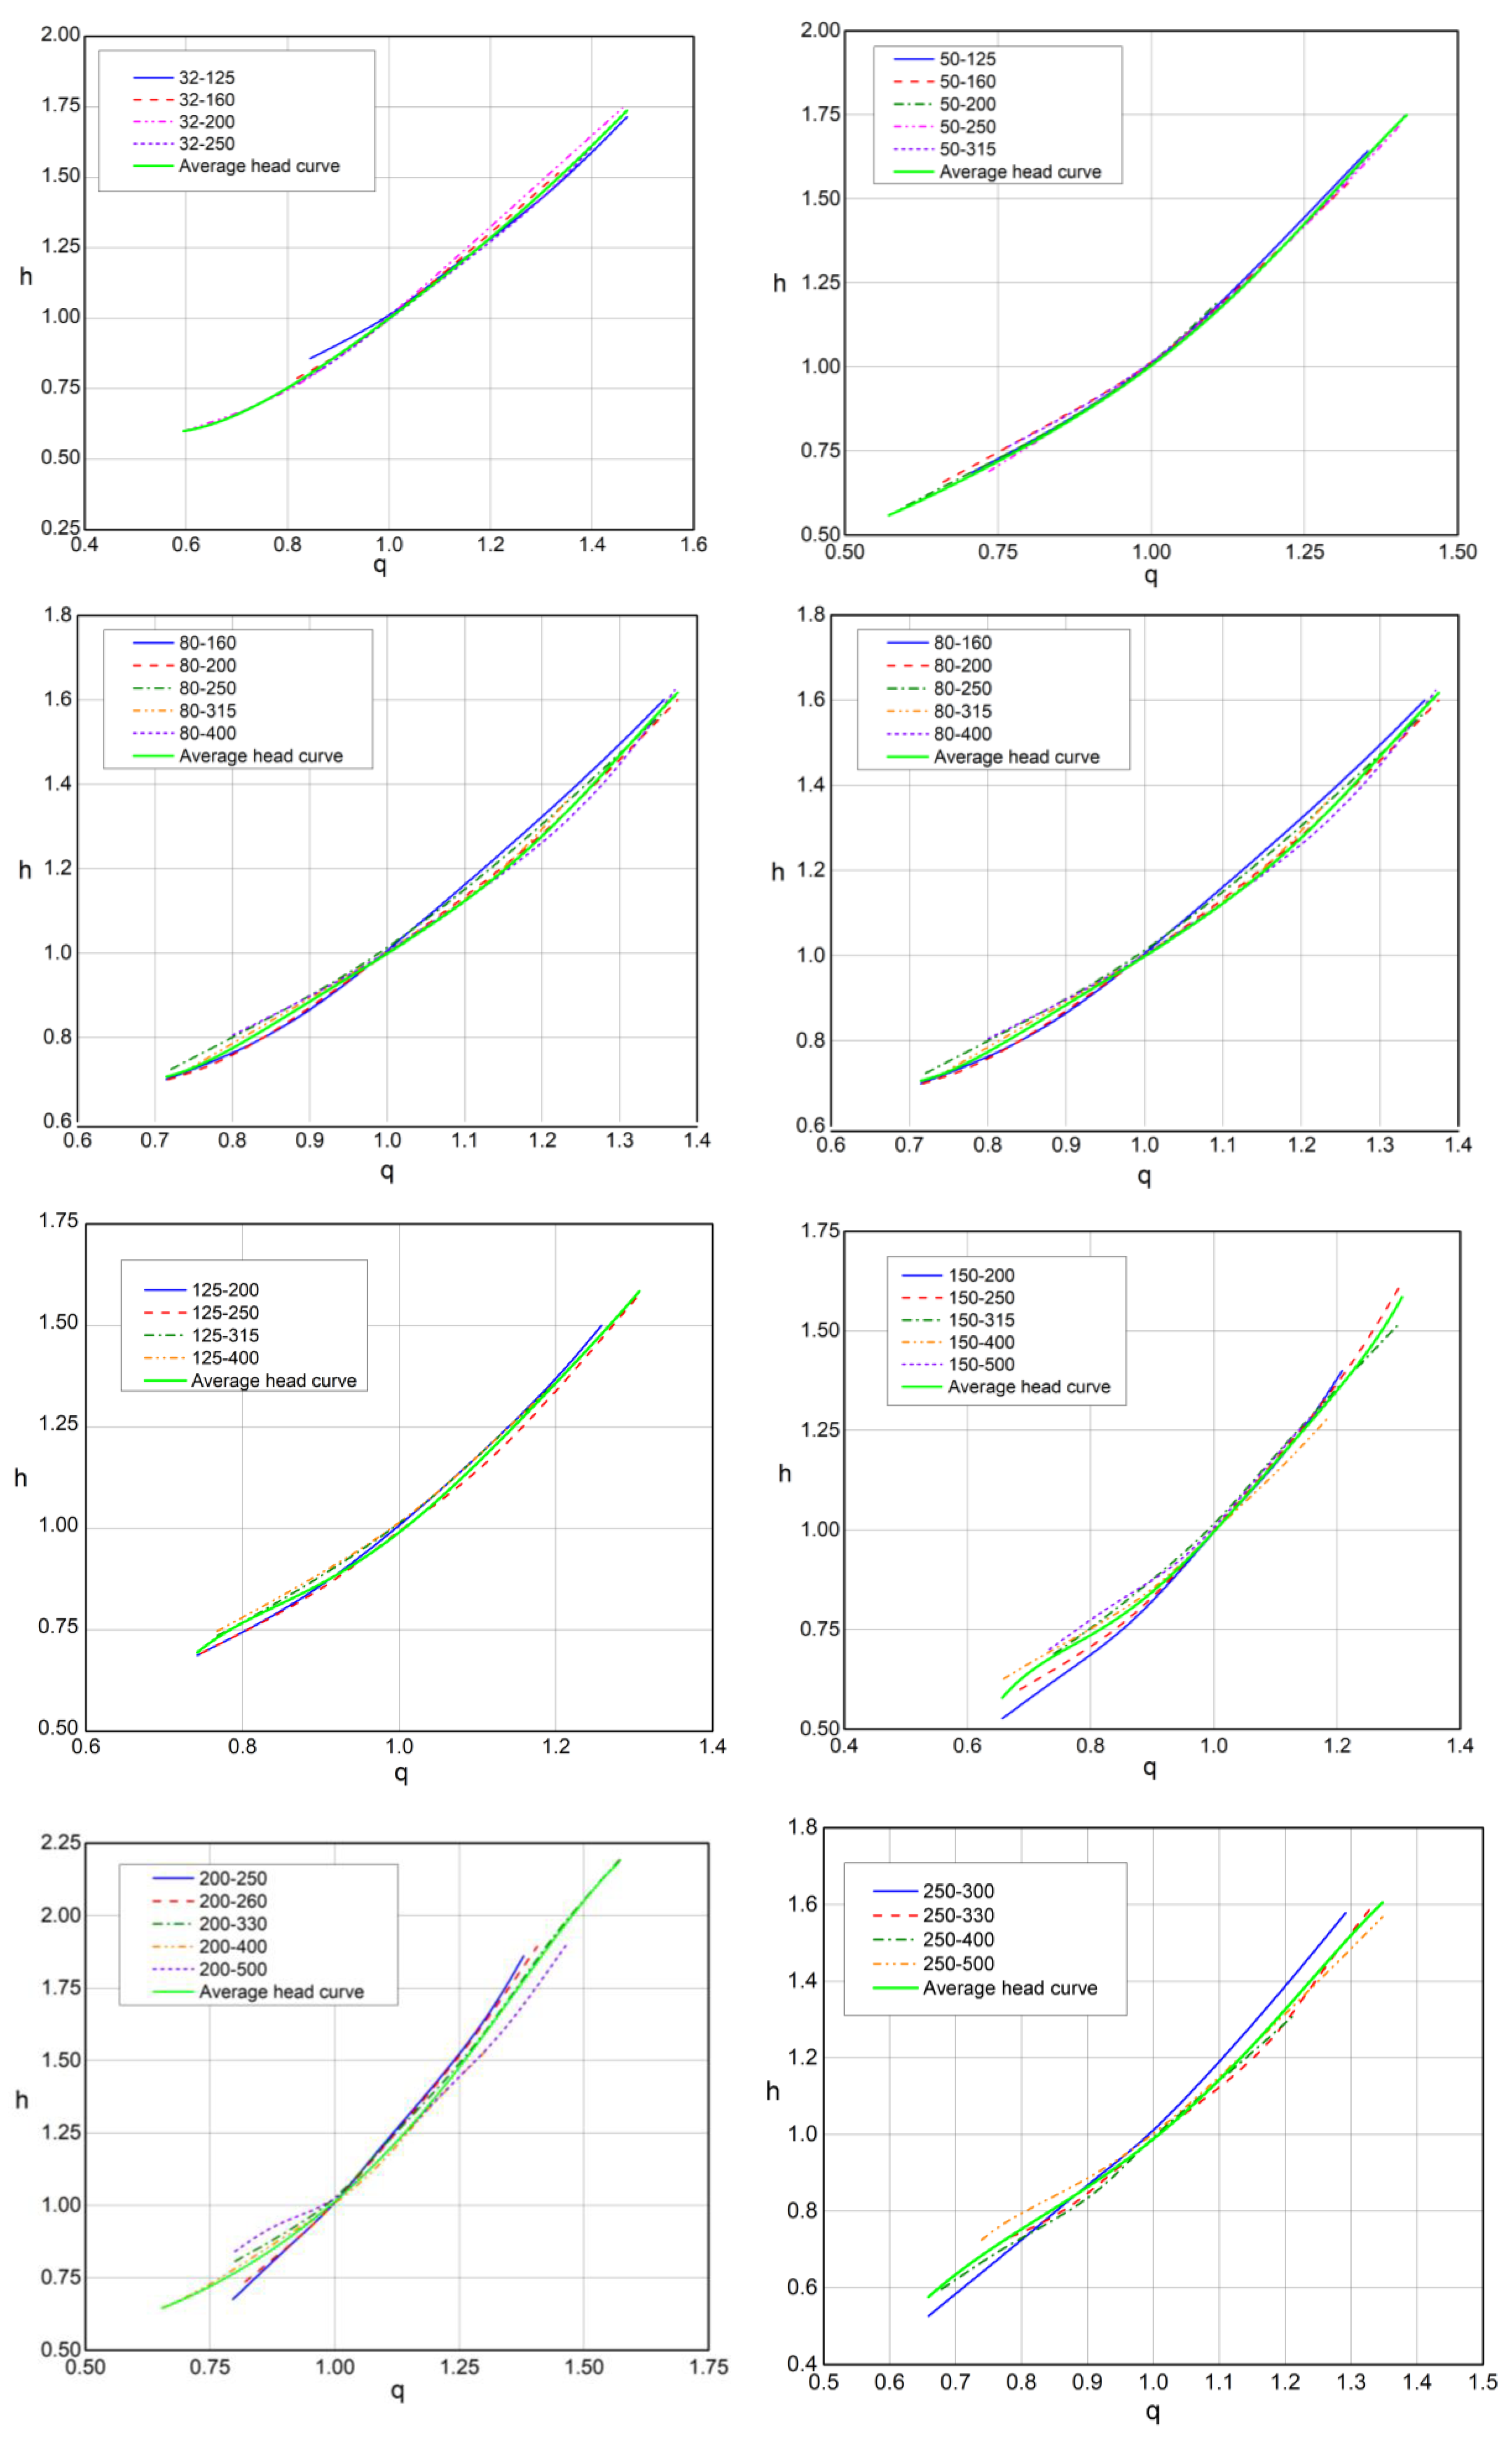
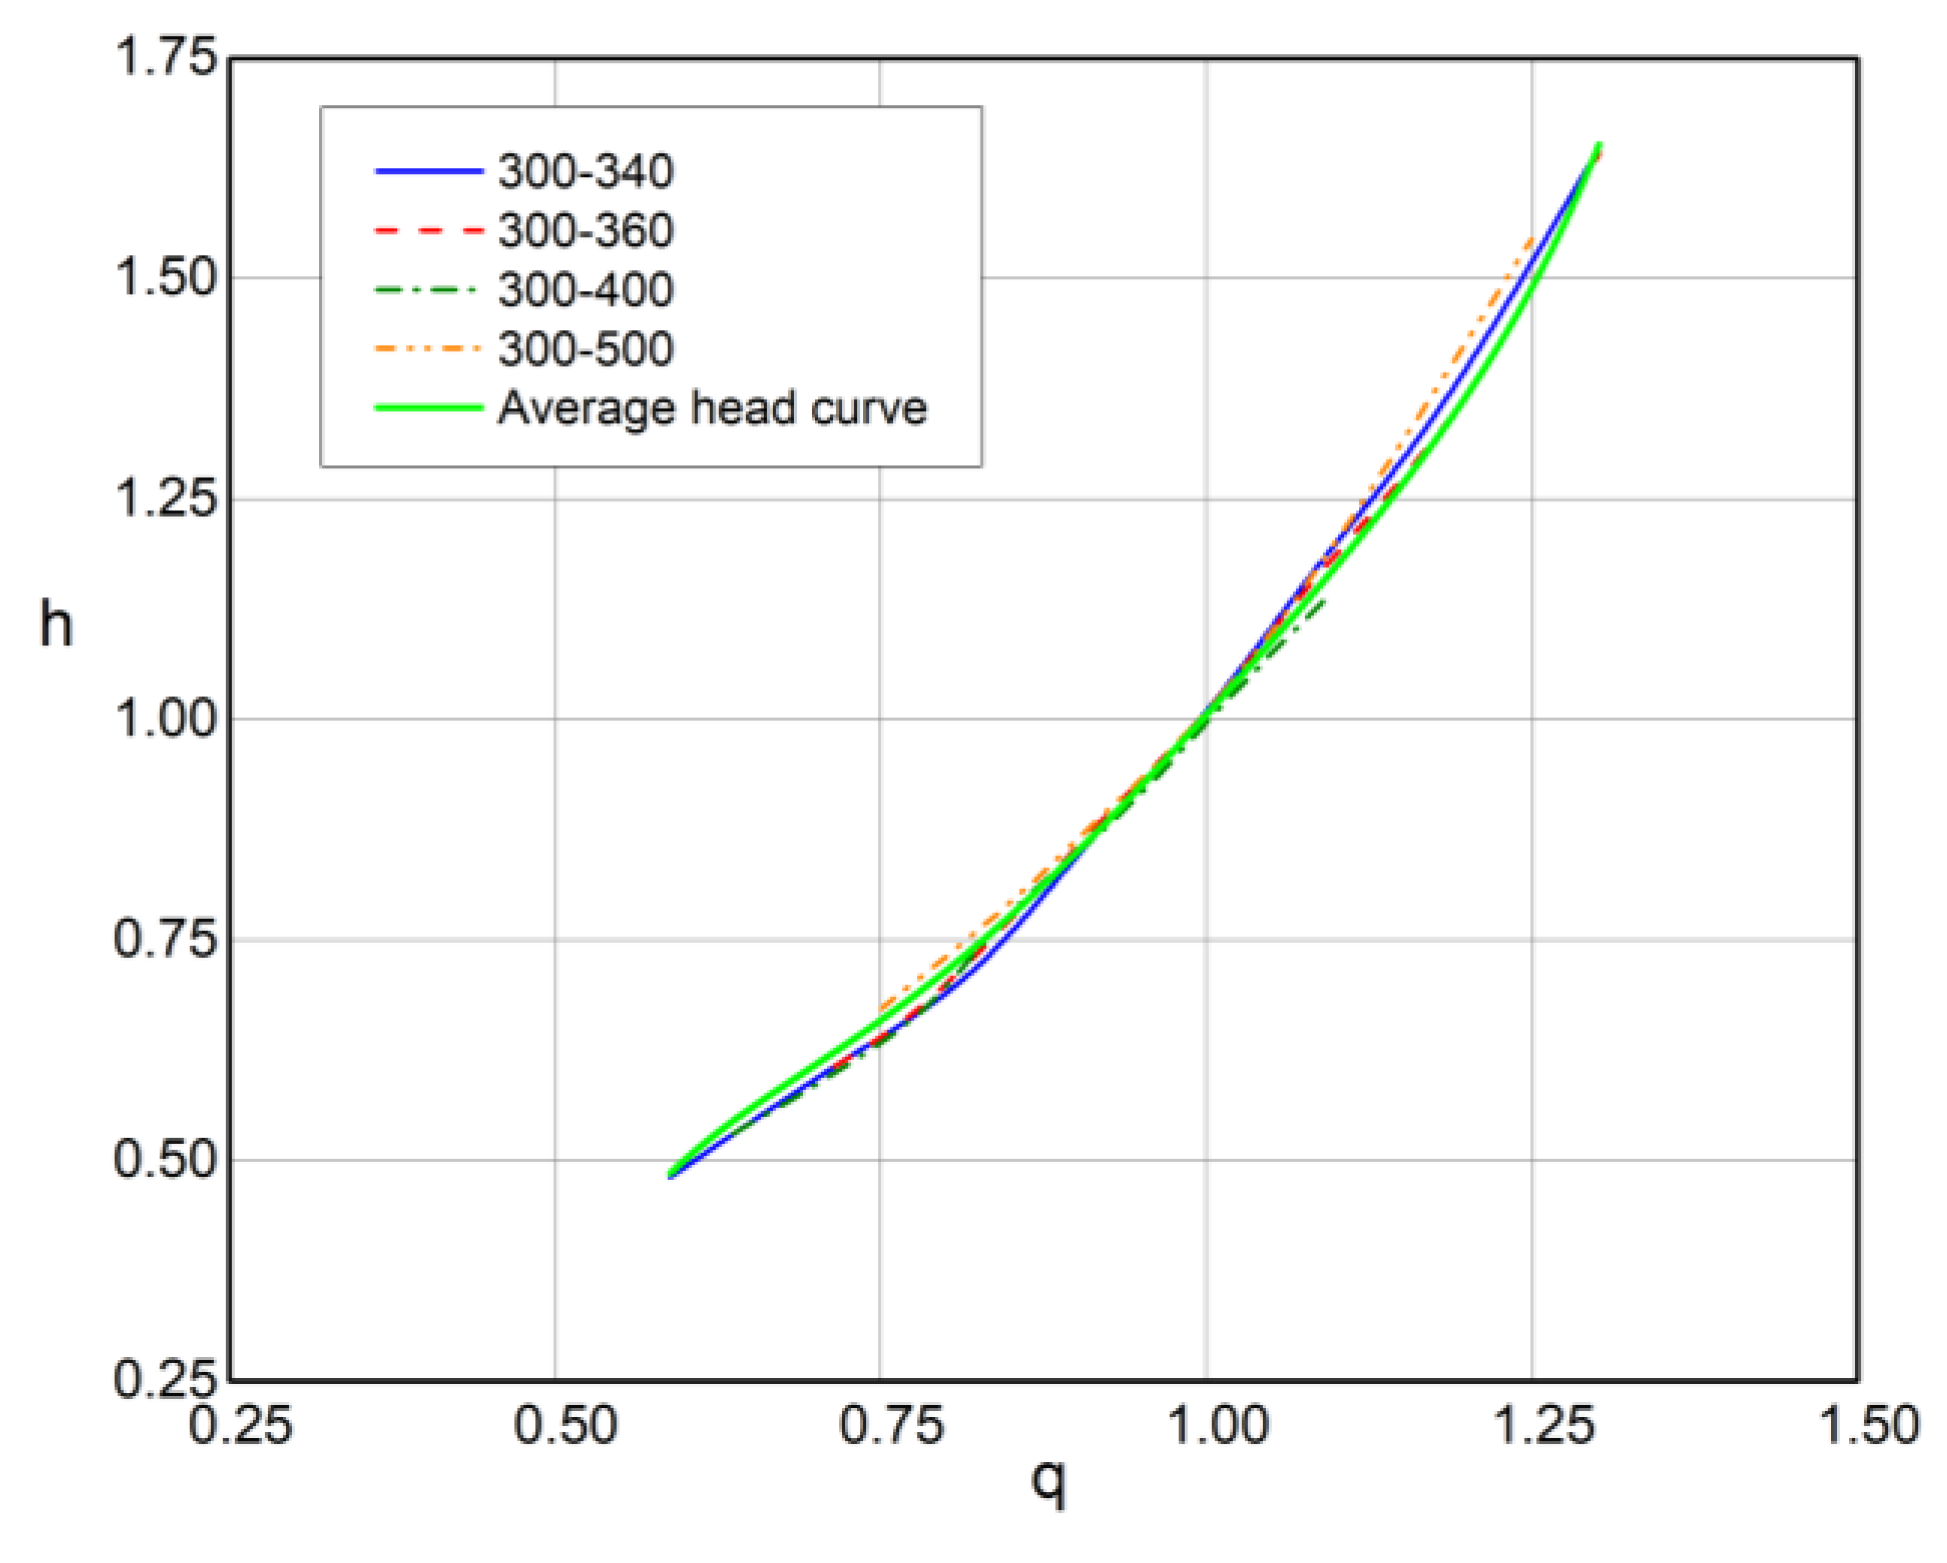
Figure 12.
Dimensionless head curves (Grundfos 100 and 125).
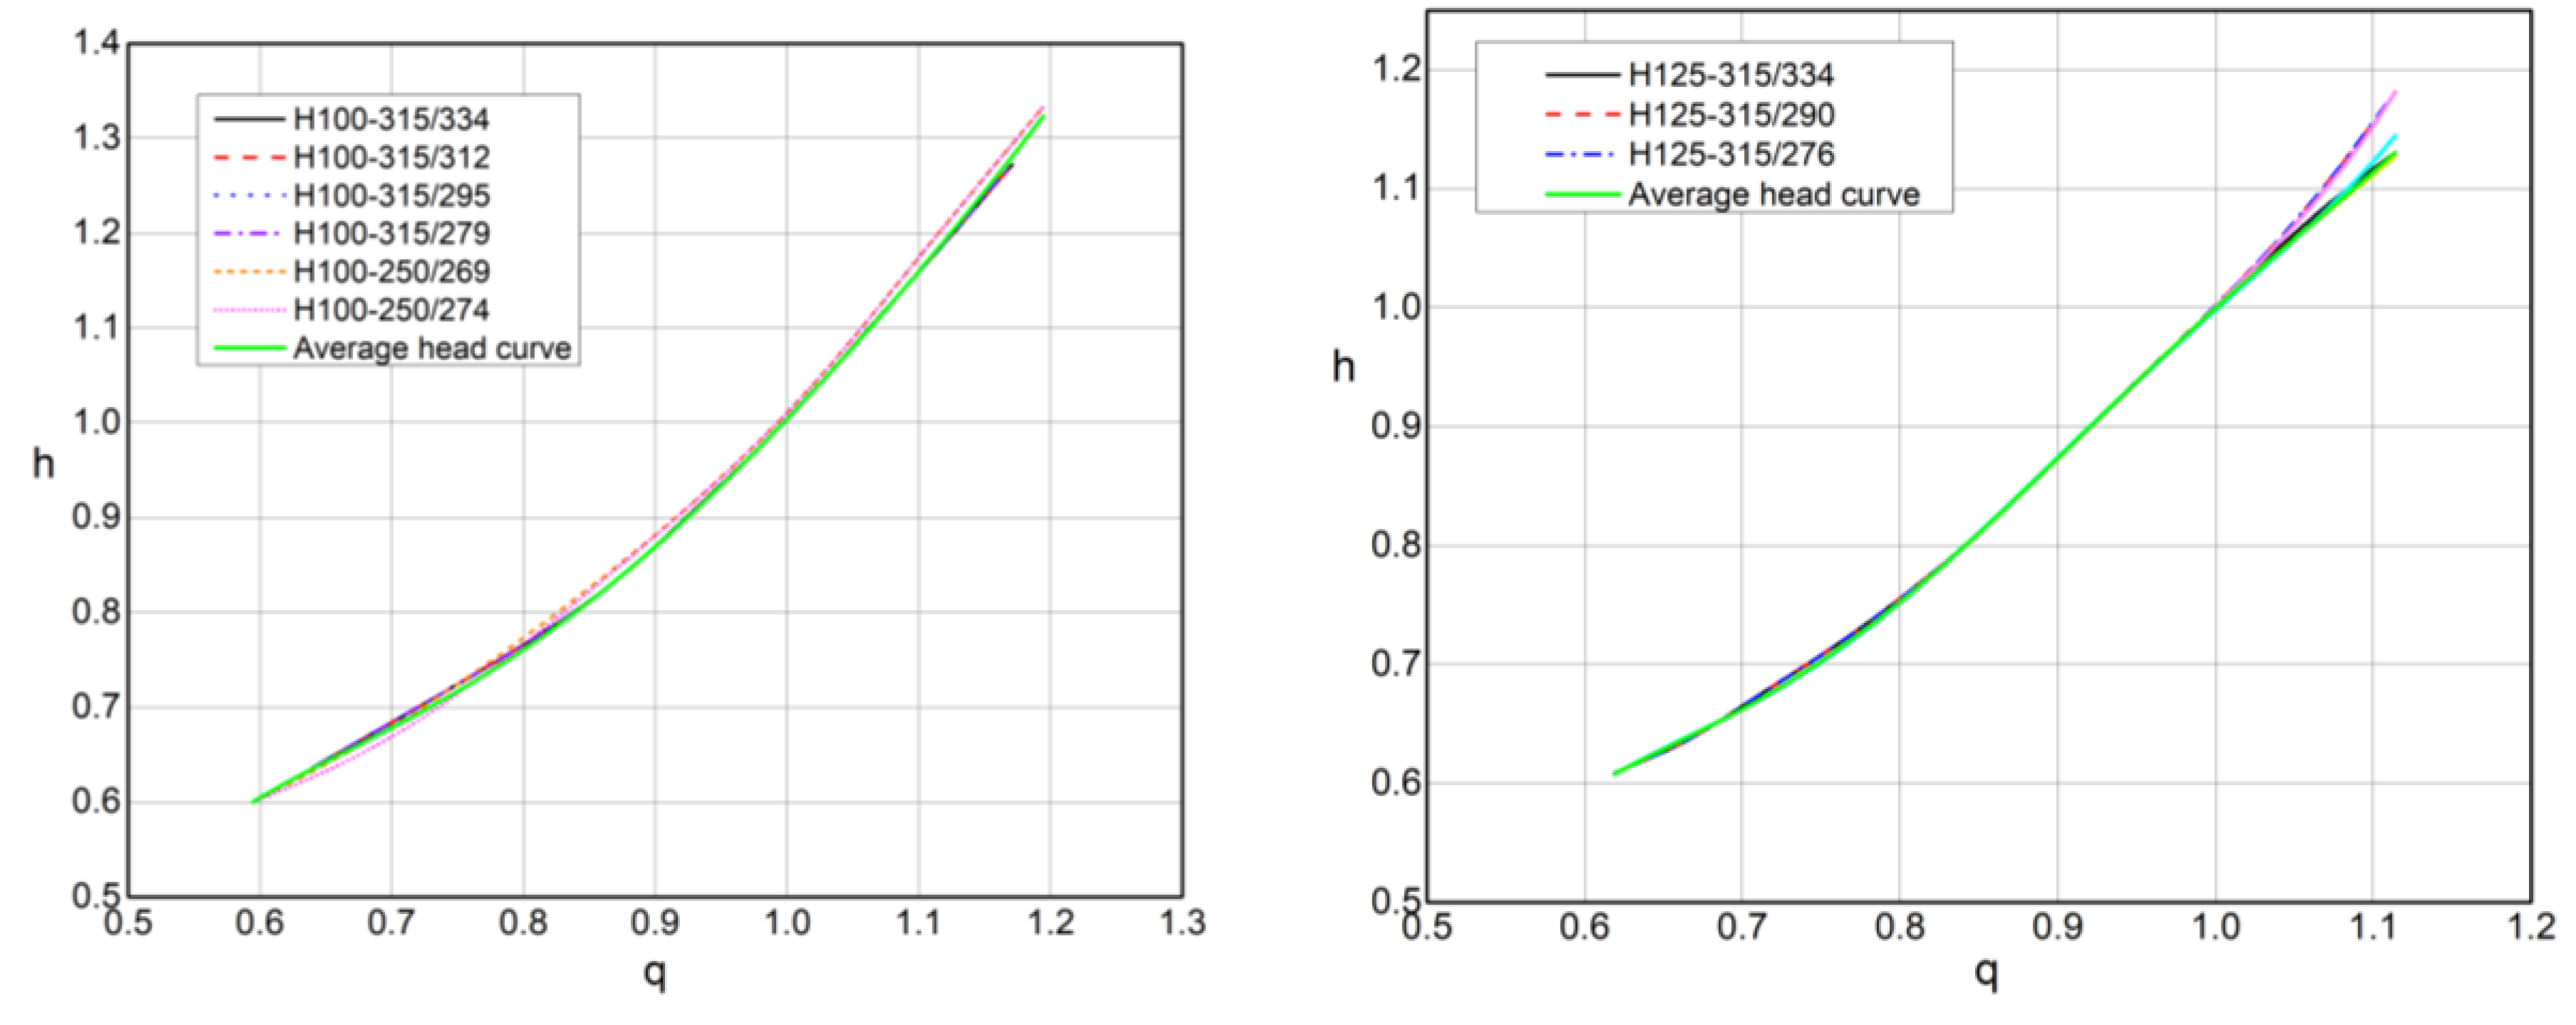
Figure 13.
Dimensionless power curves Etanorm 32, 40, 50, 65, 80, 100, 125, 150, 200, 250, 300.
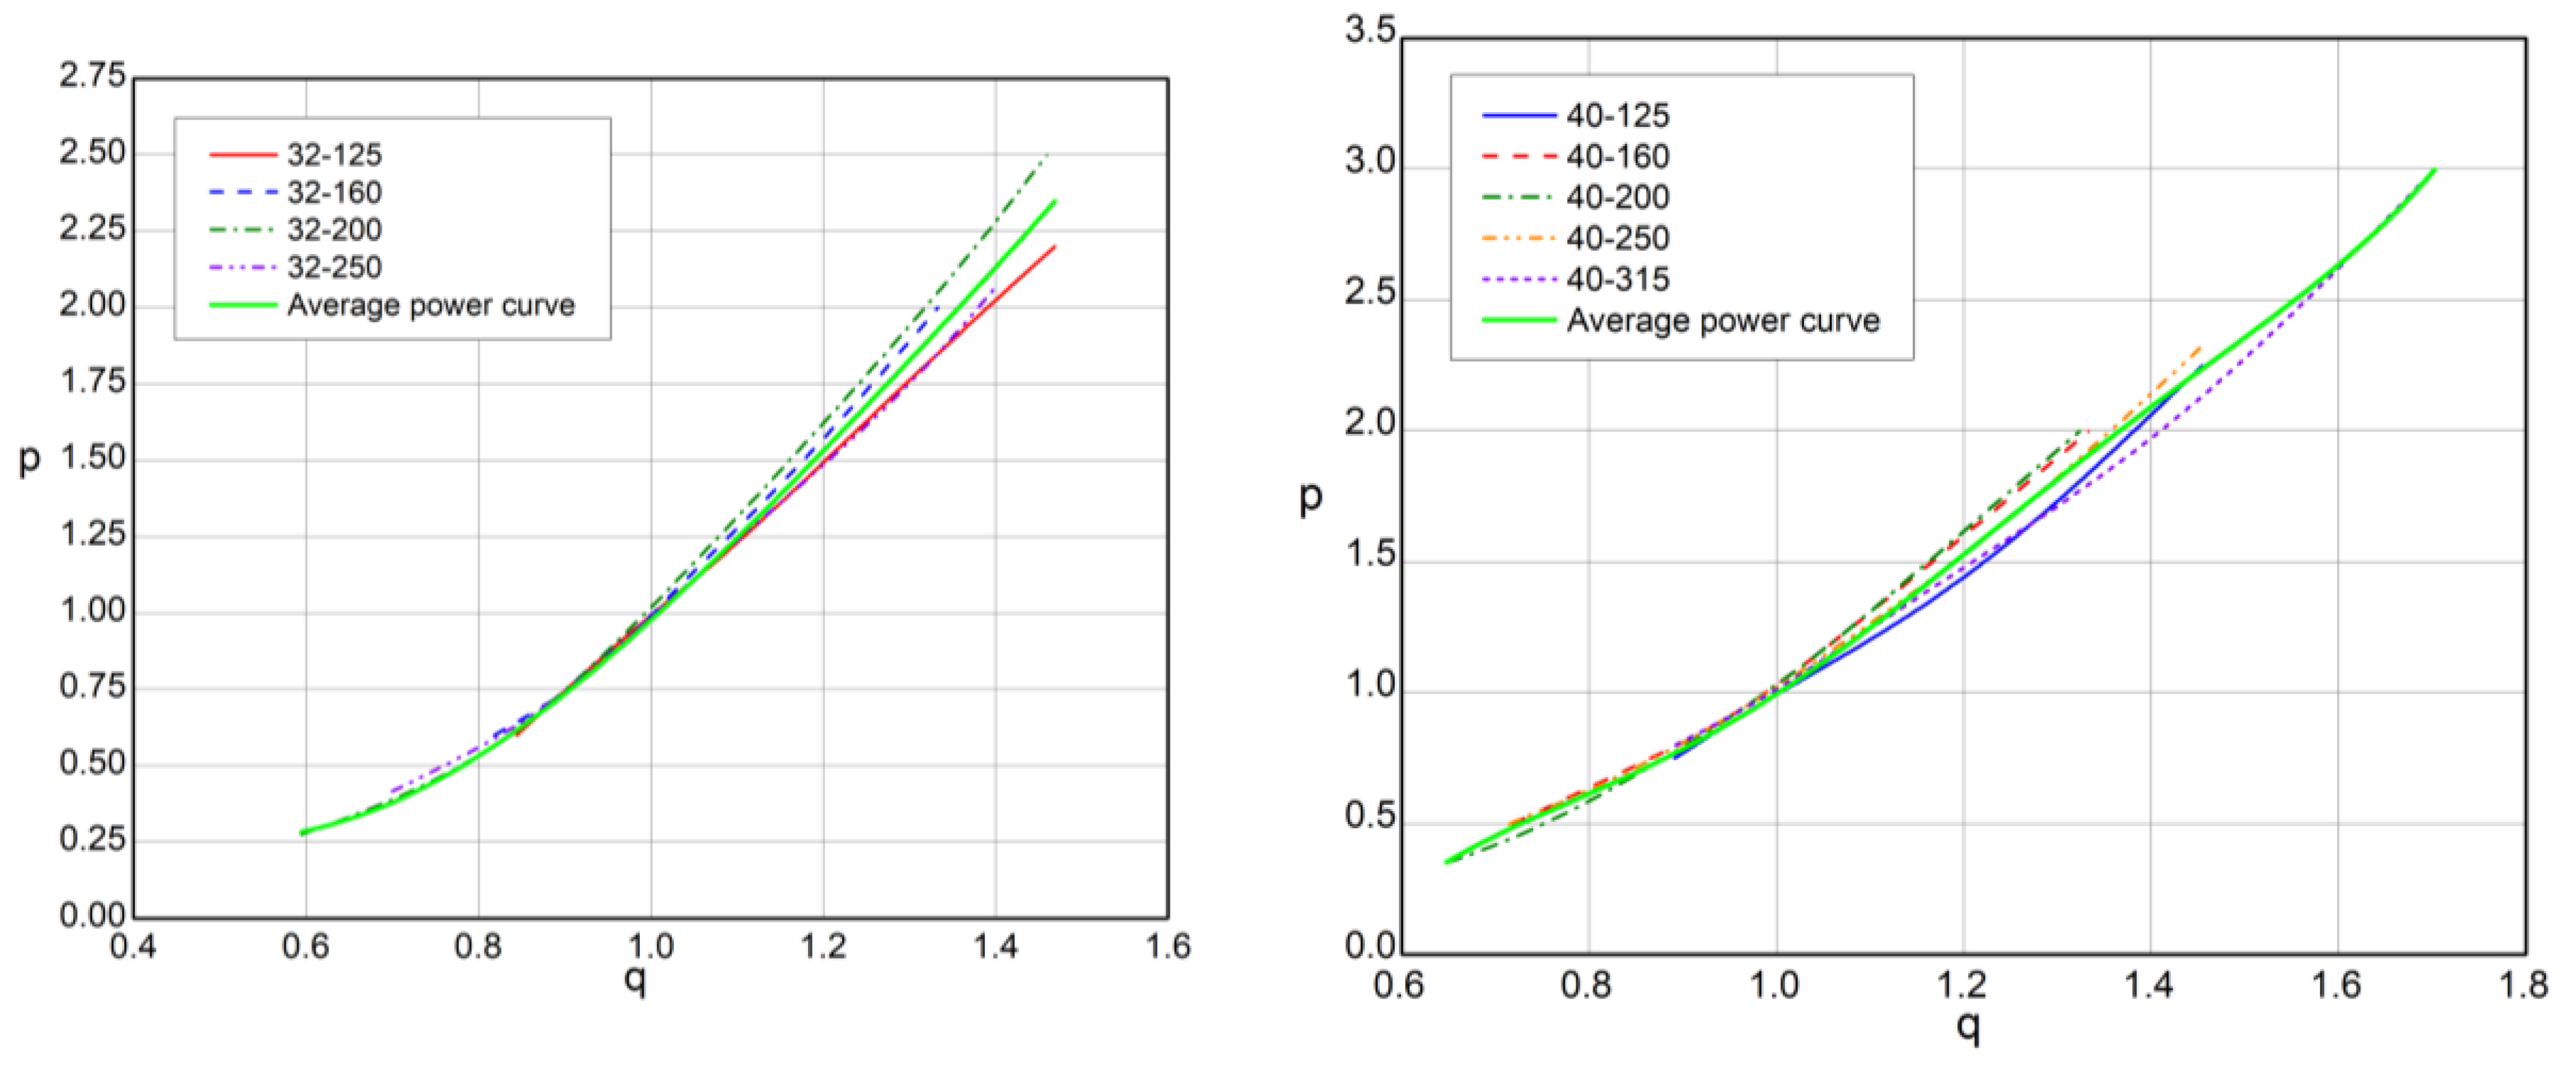
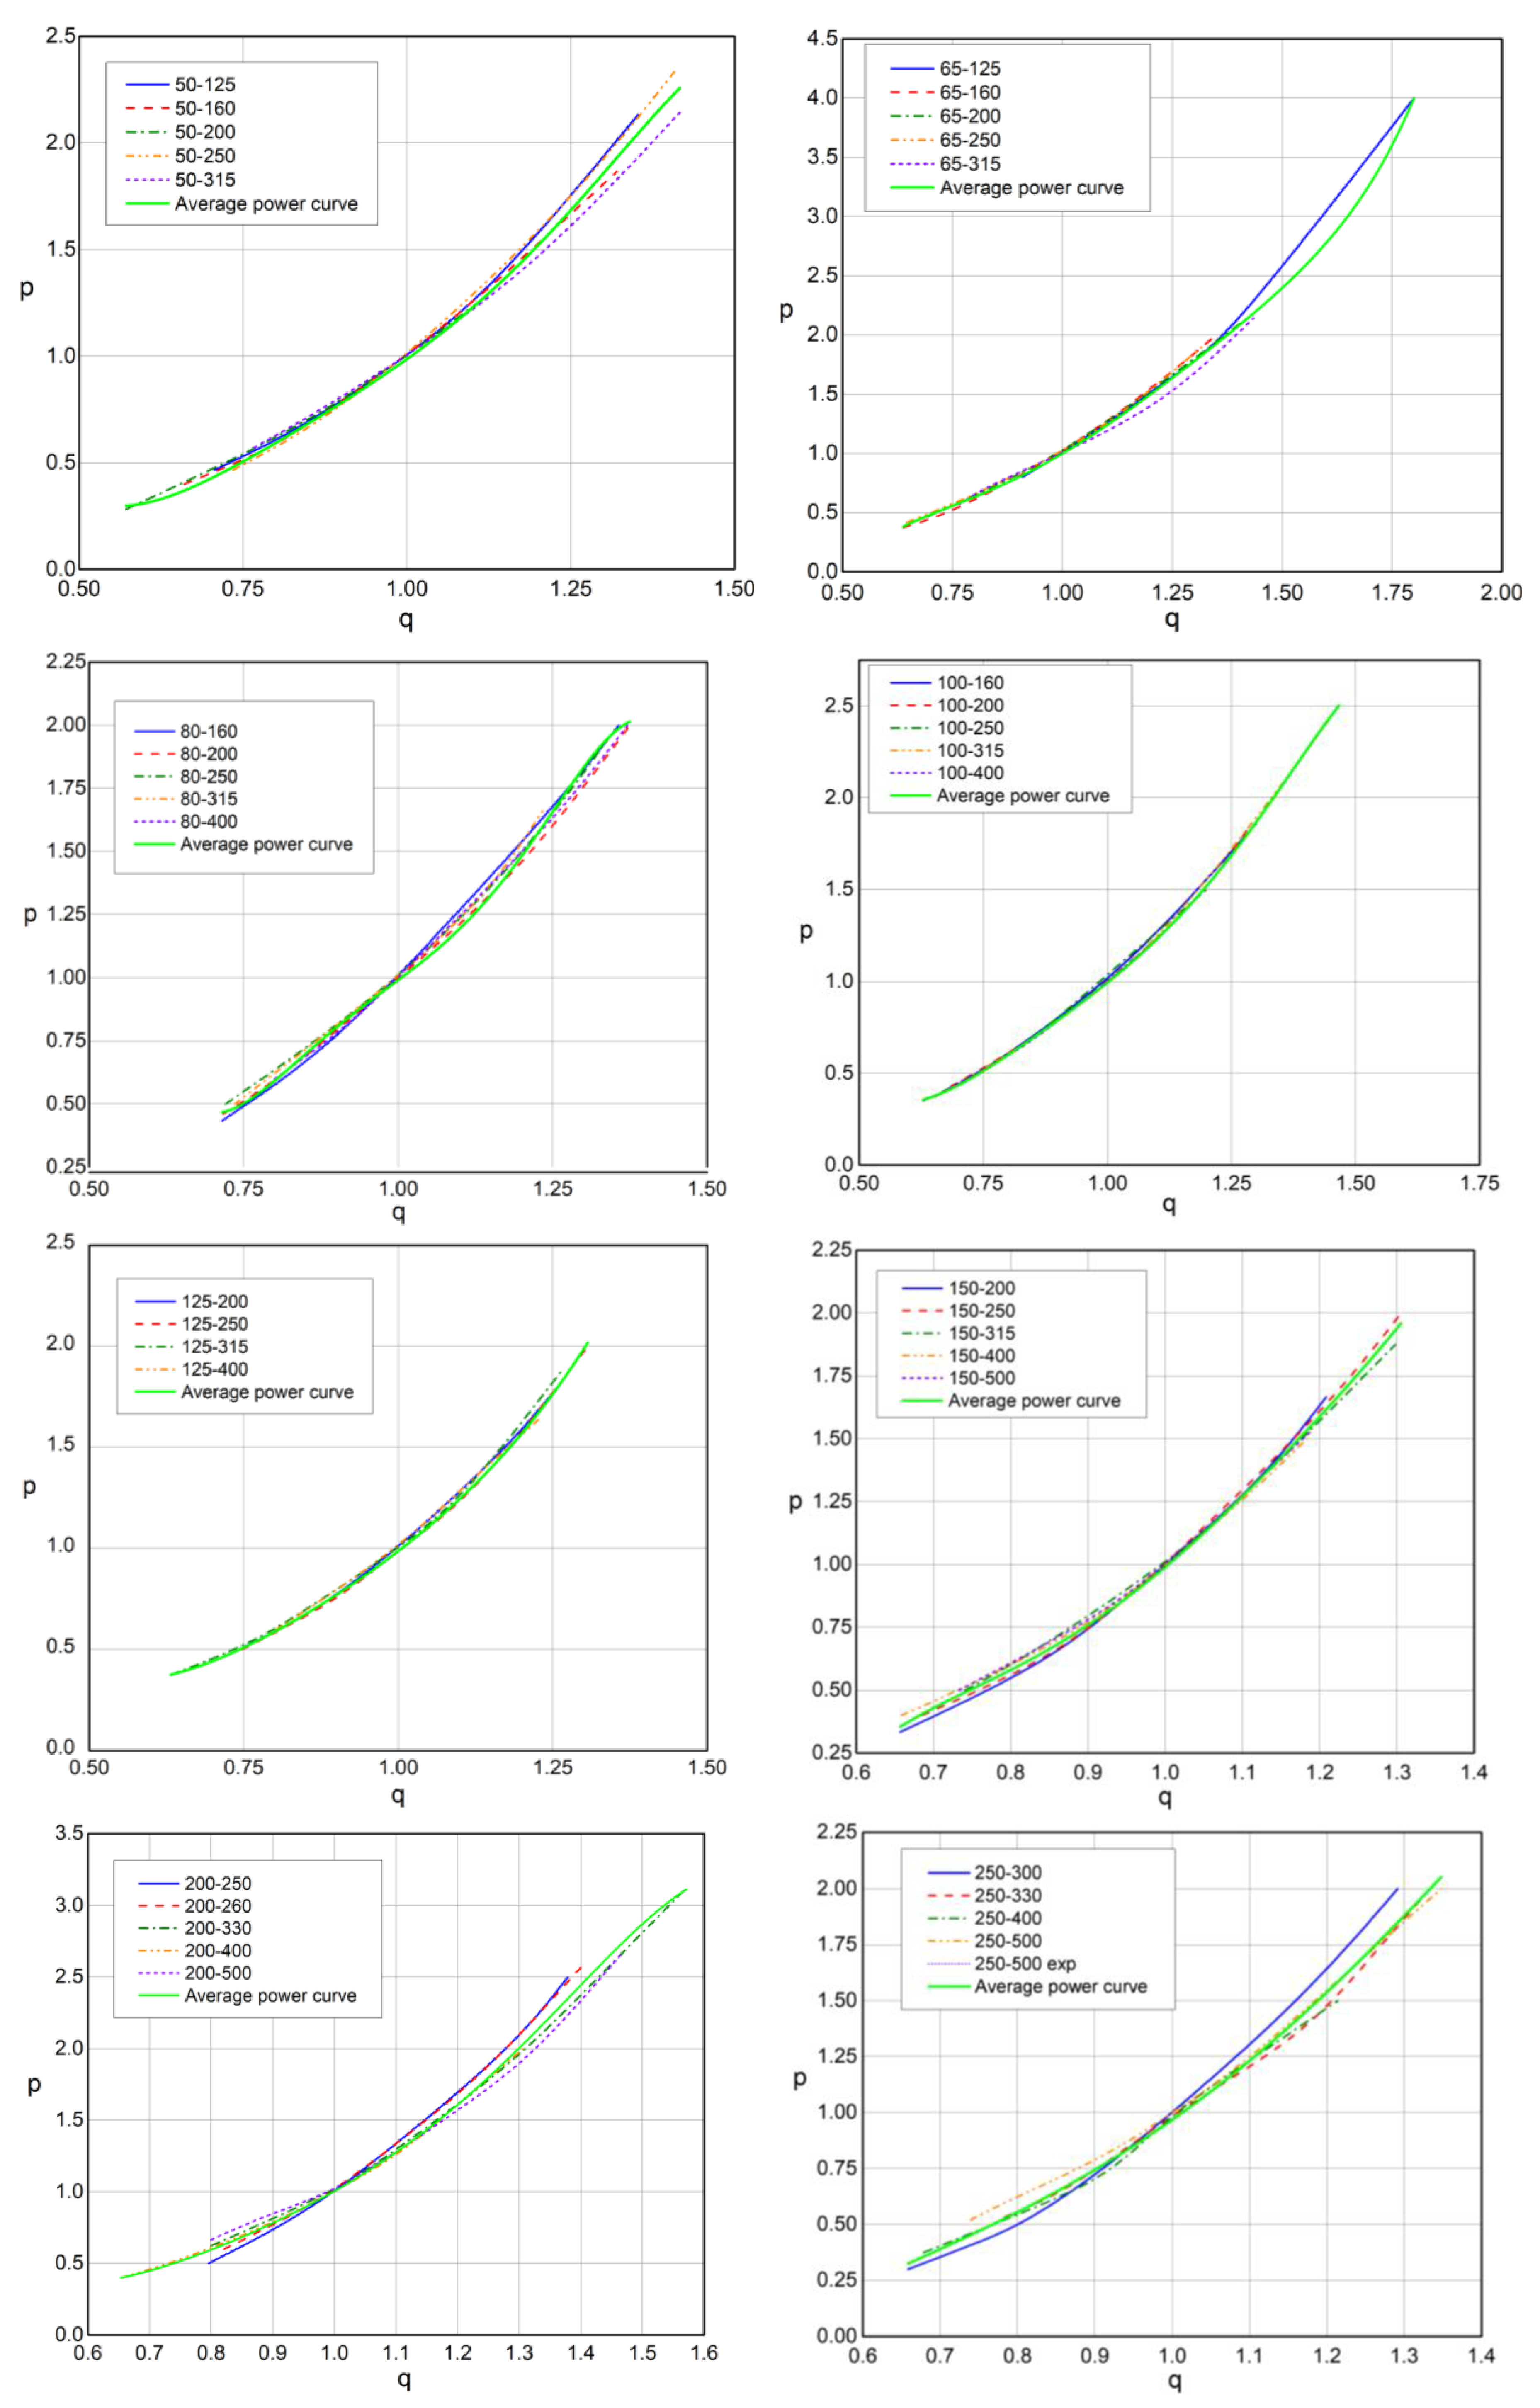
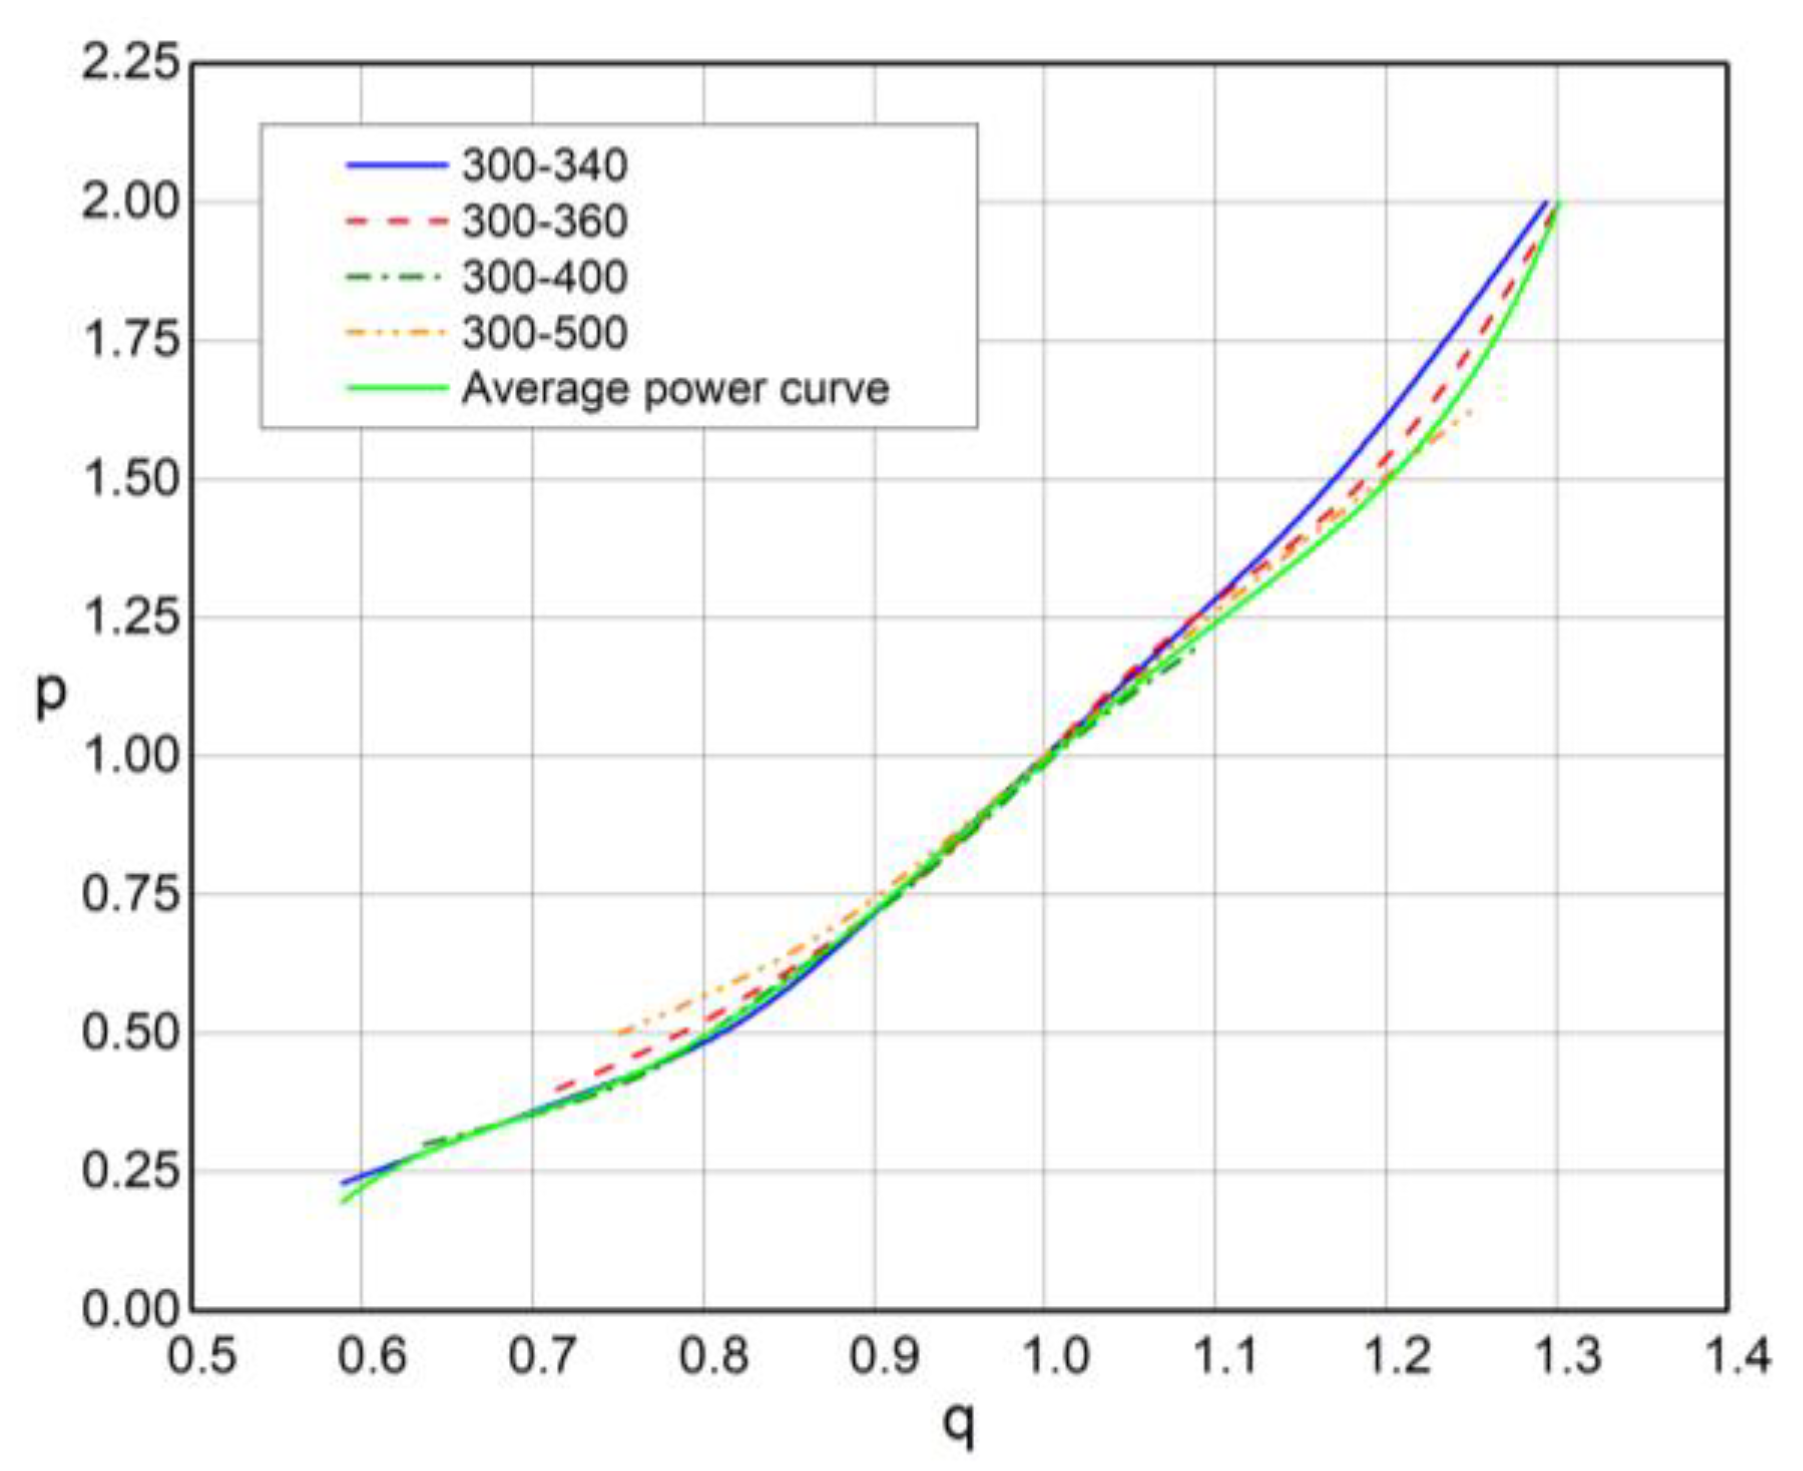
Figure 14.
Dimensionless power curves of PAT: a) Grundfos 100 and b) Grundfos 125.
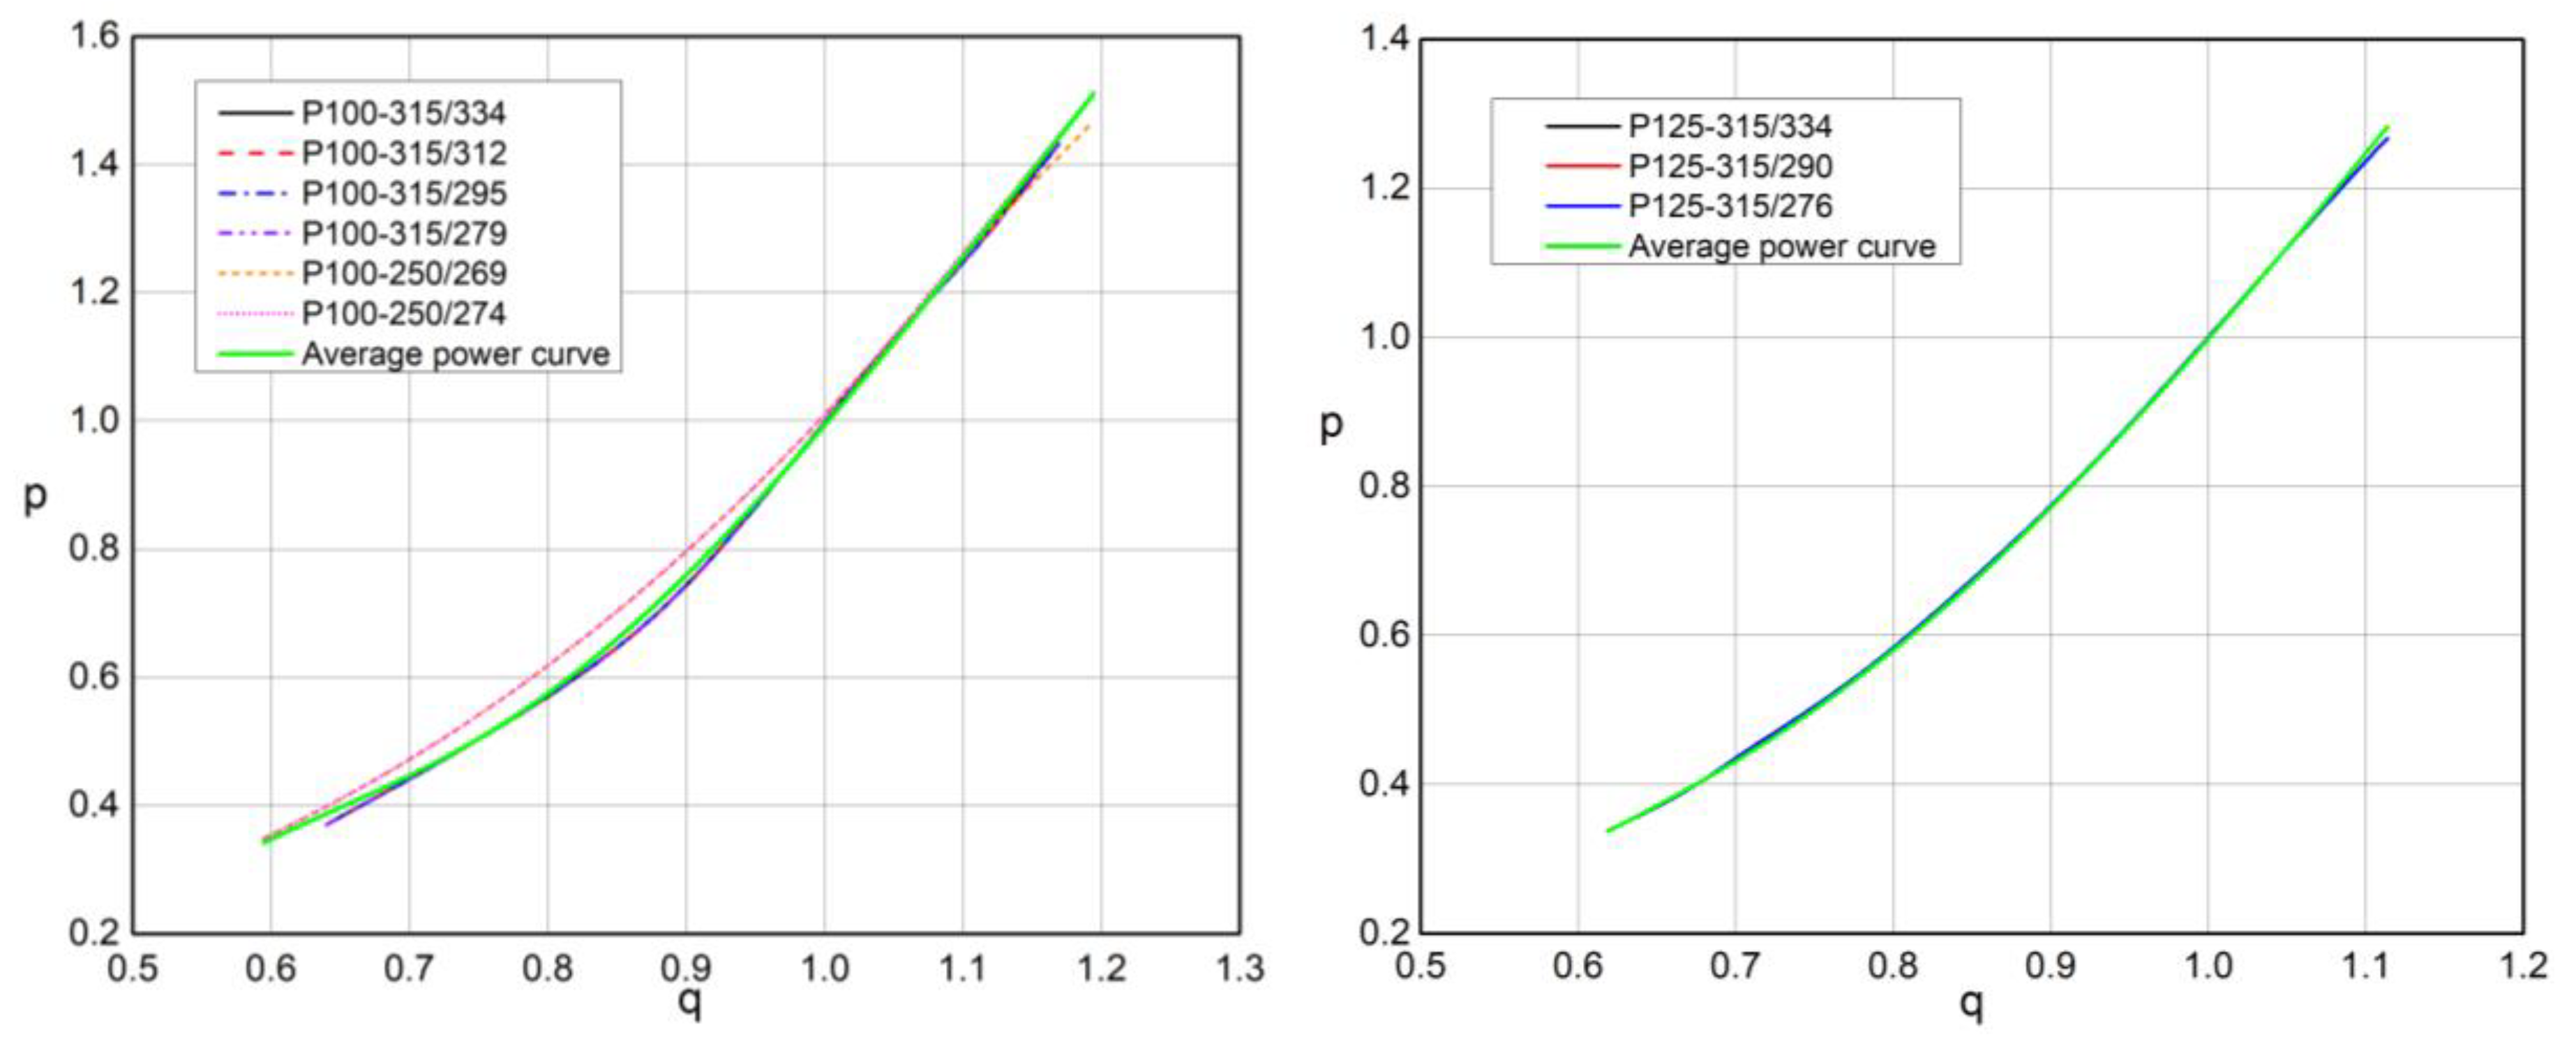
Figure 15.
Dimensionless head curves of PATs and average head curves.
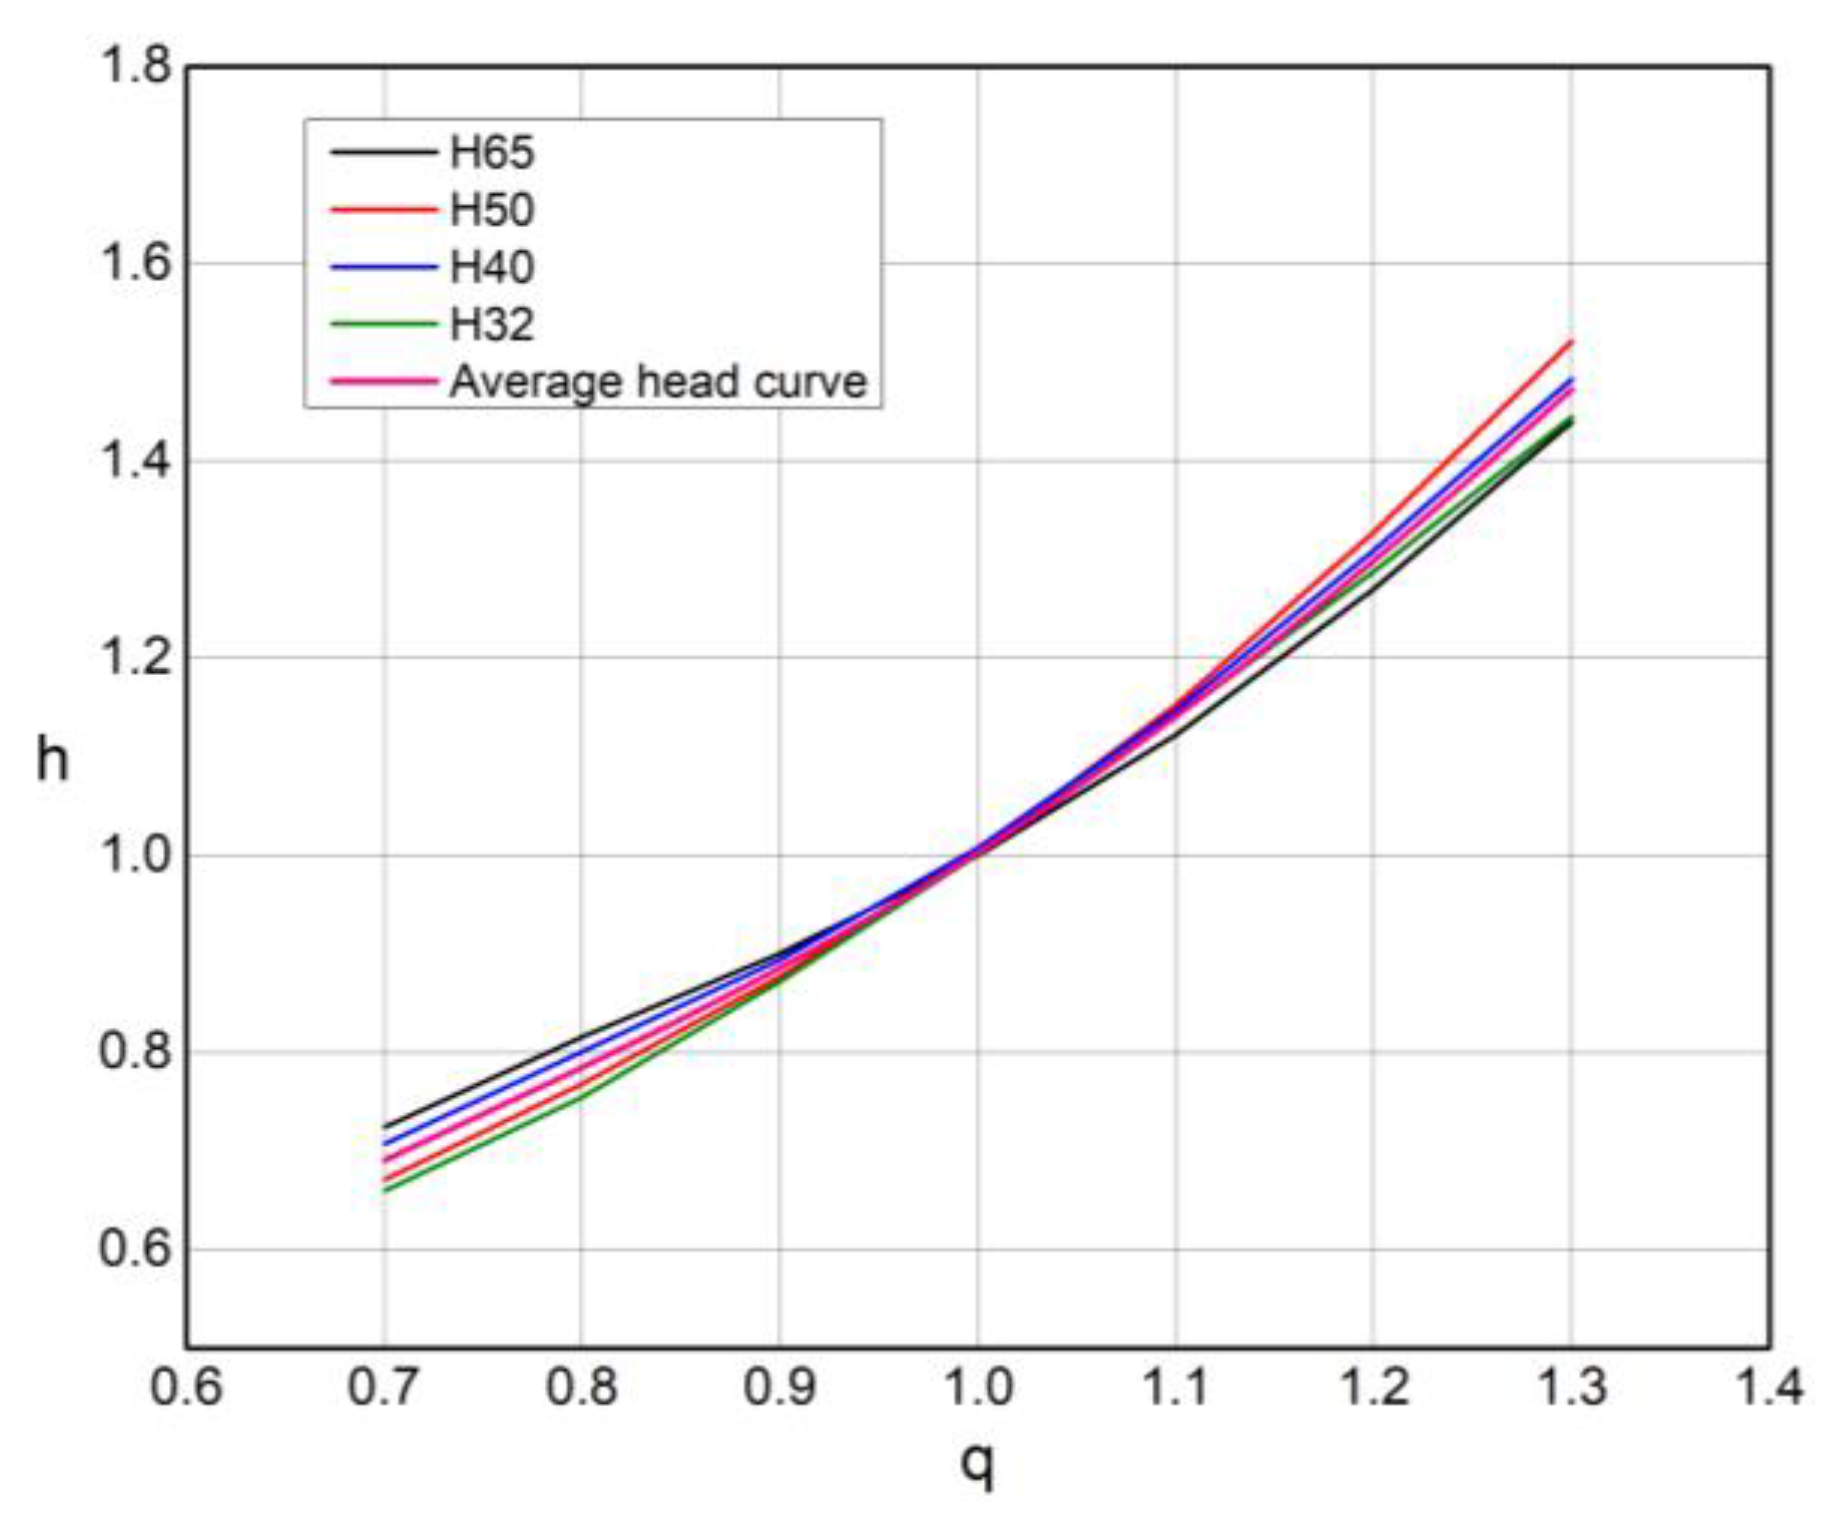
Figure 16.
Dimensionless power curves of PATs and average head curves.
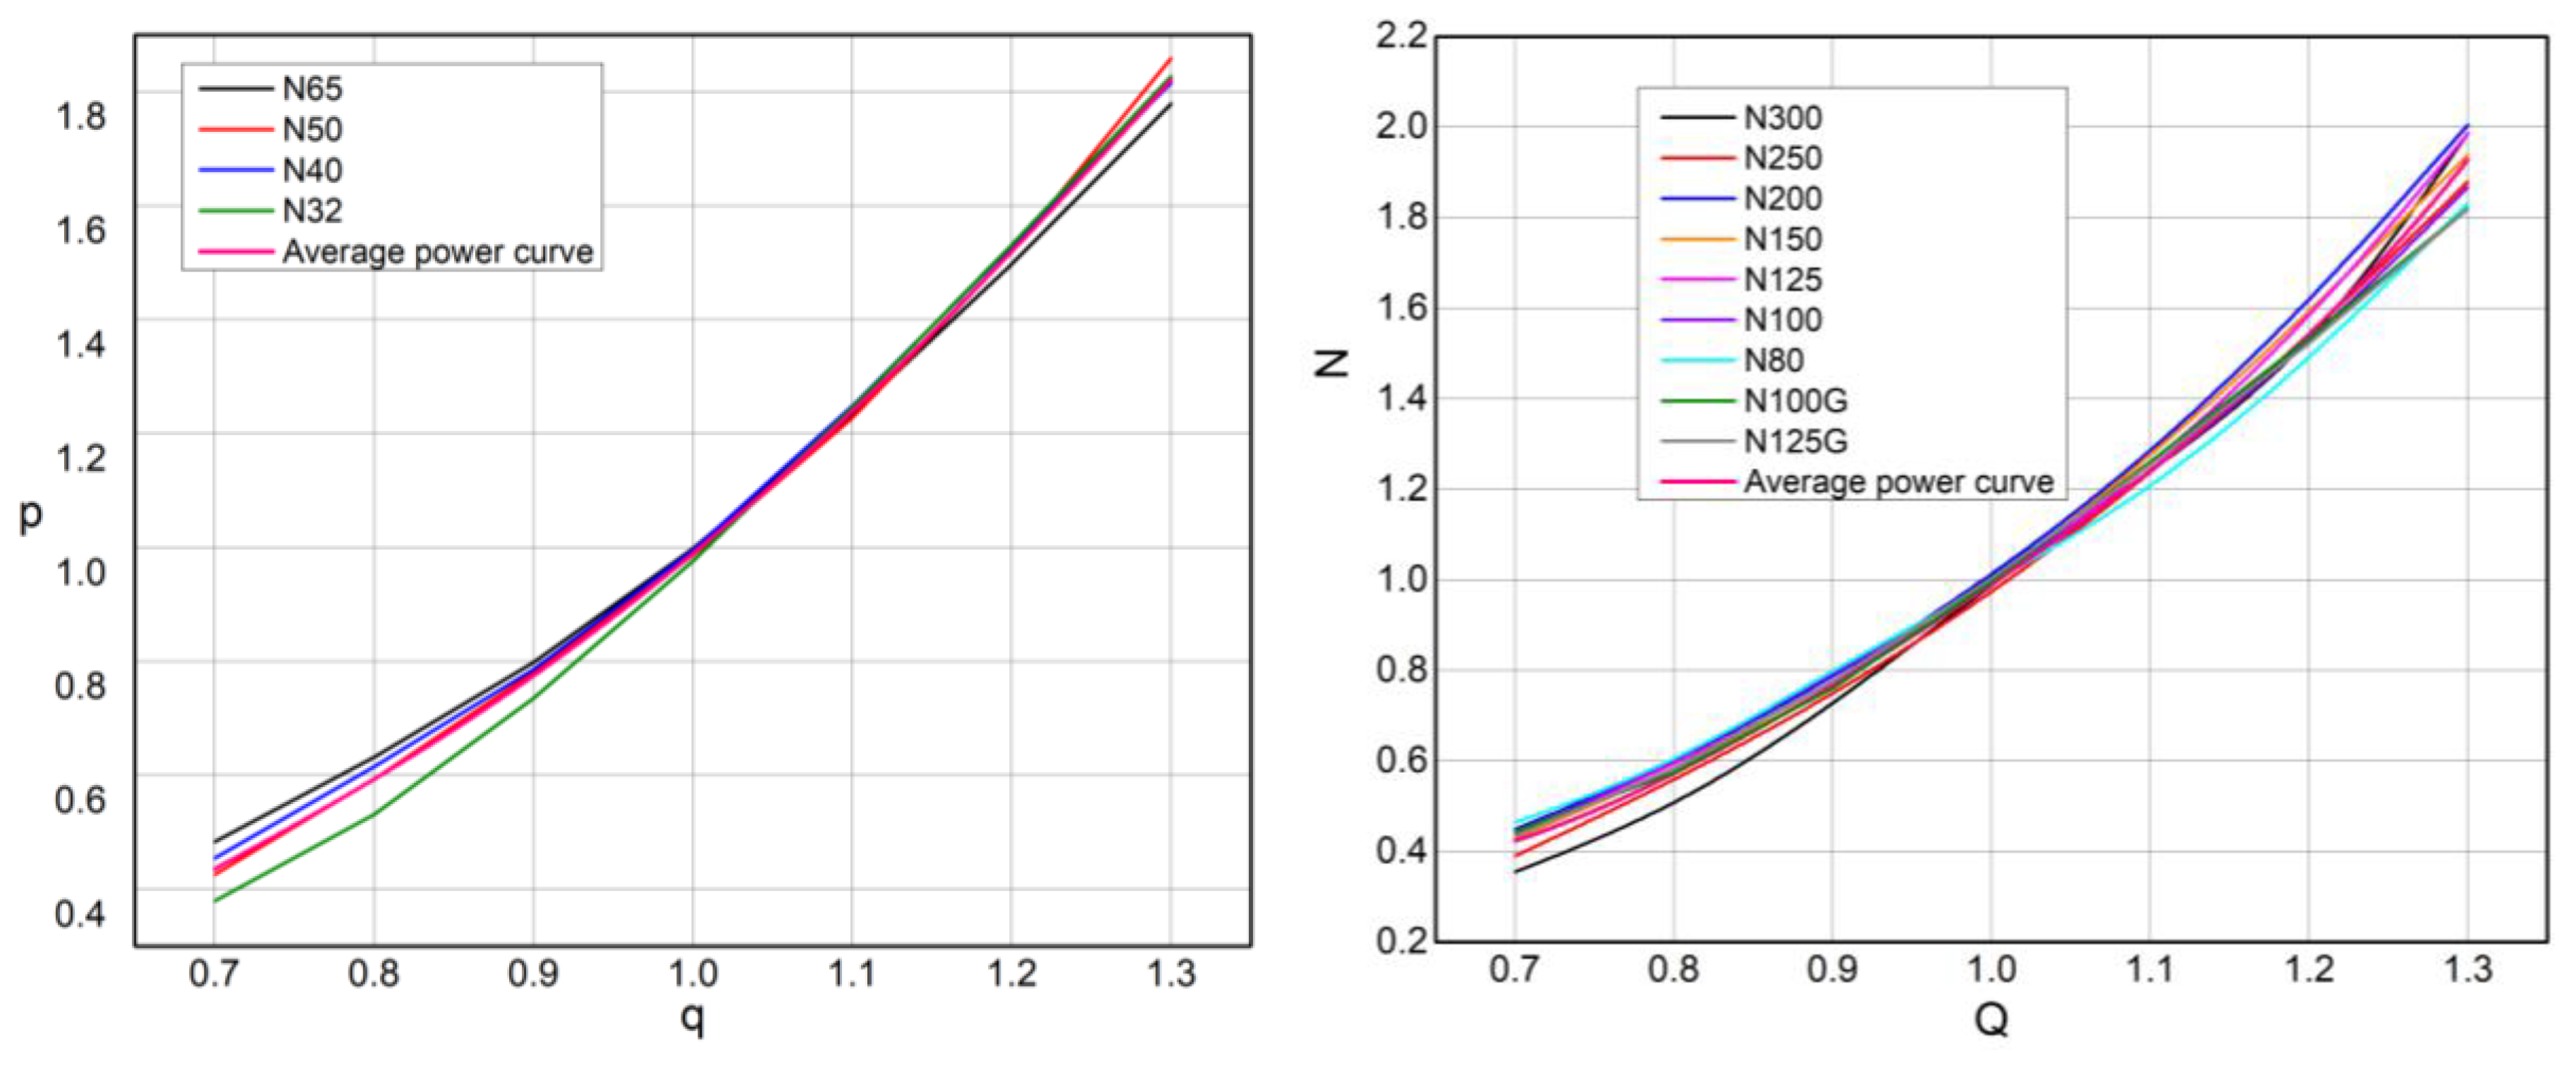
Figure 17.
Diagram of the mean daily flow and the mean annual flow of the reservoir „Cukljenik” for the period 2003-2013.
Figure 17.
Diagram of the mean daily flow and the mean annual flow of the reservoir „Cukljenik” for the period 2003-2013.
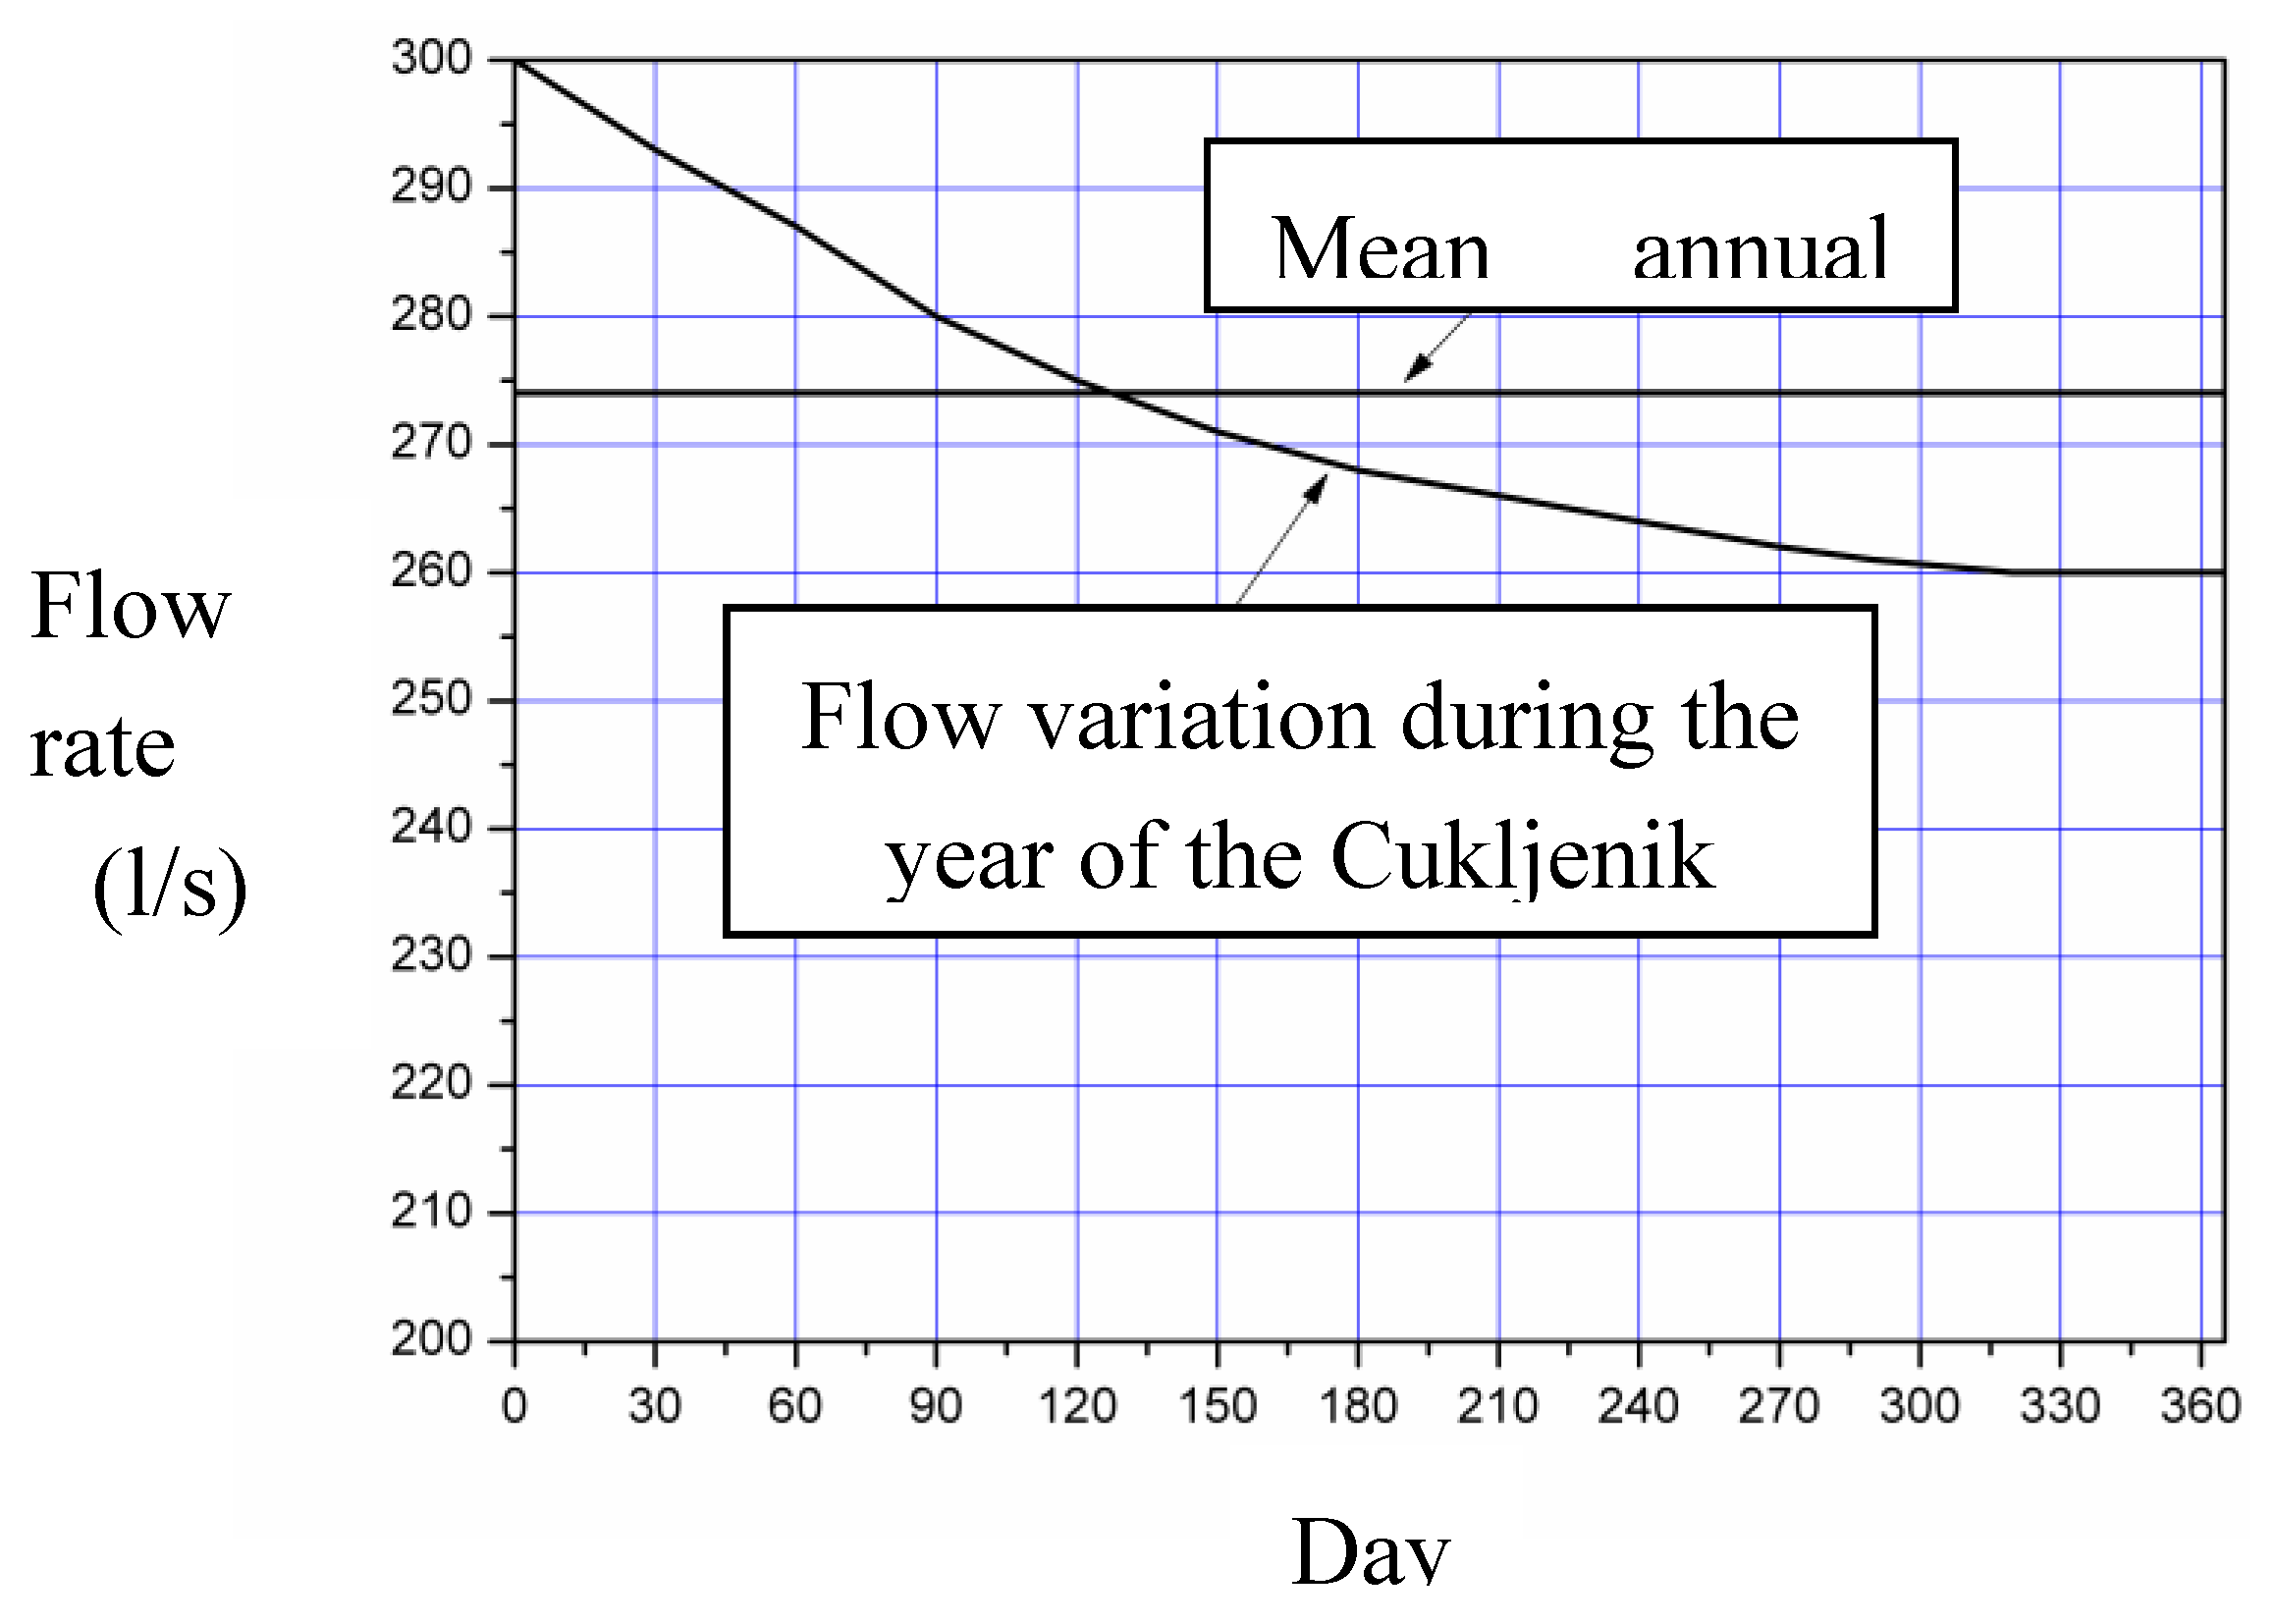
Figure 18.
Curves of the system for maximum and minimum water levels in the reservoir.
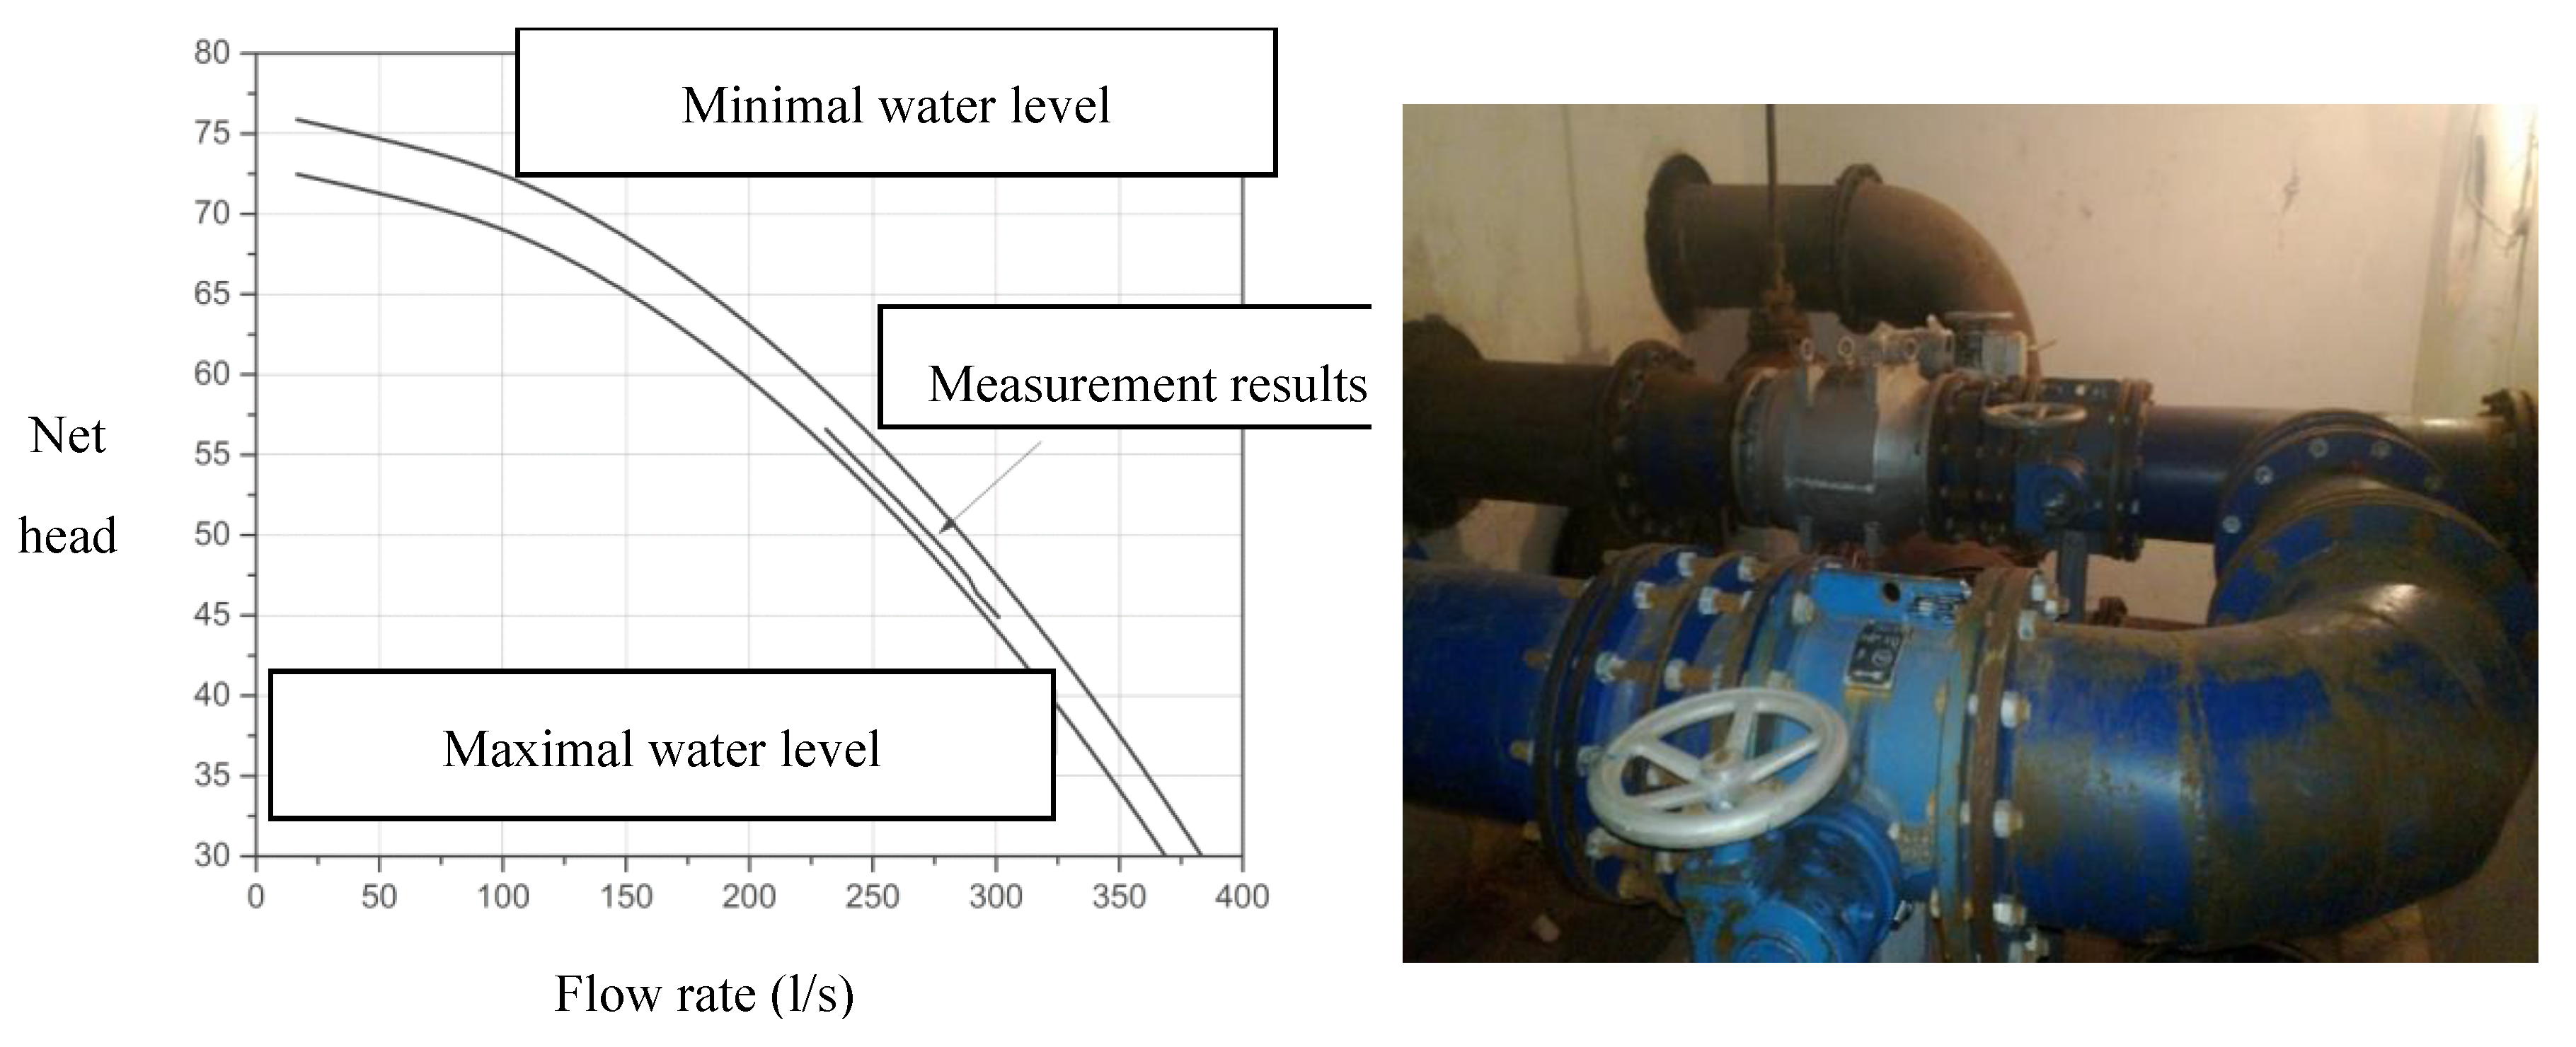
Figure 19.
Performance curves of Etanorm 250-400 D=360 mm and D=380 mm, n=1450 rpm.
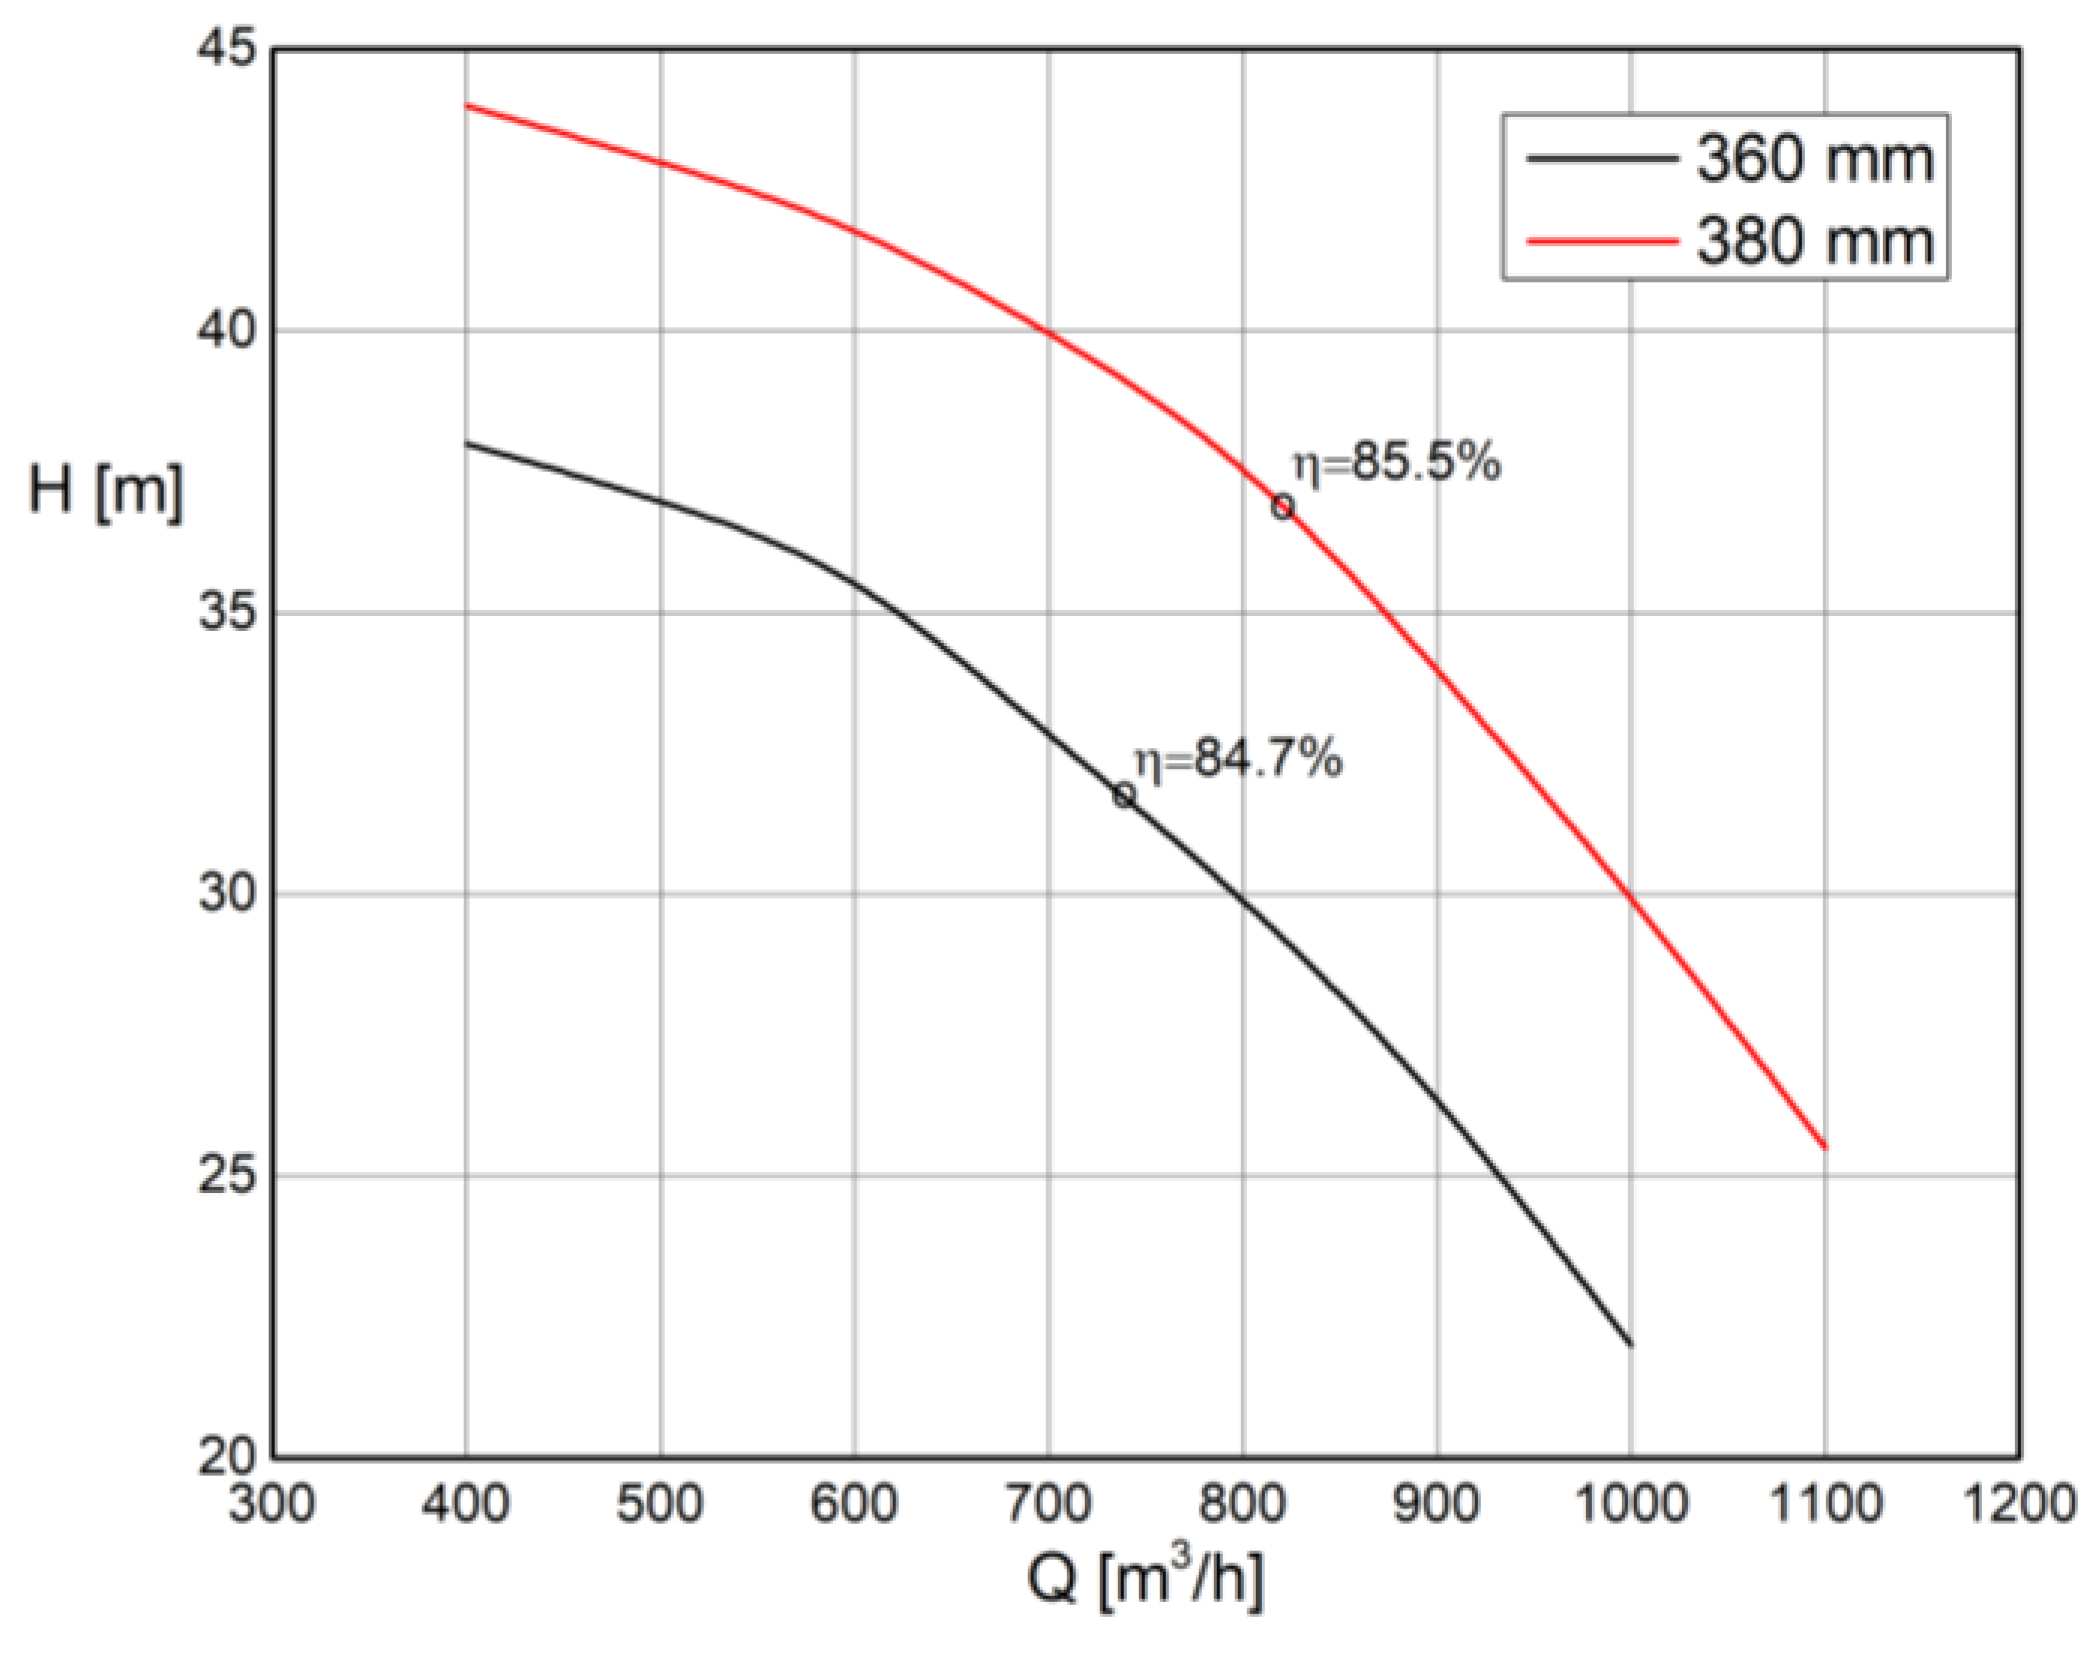
Figure 20.
Performance curves of Etanorm 150-315, D=334 mm, n=1450 rpm.
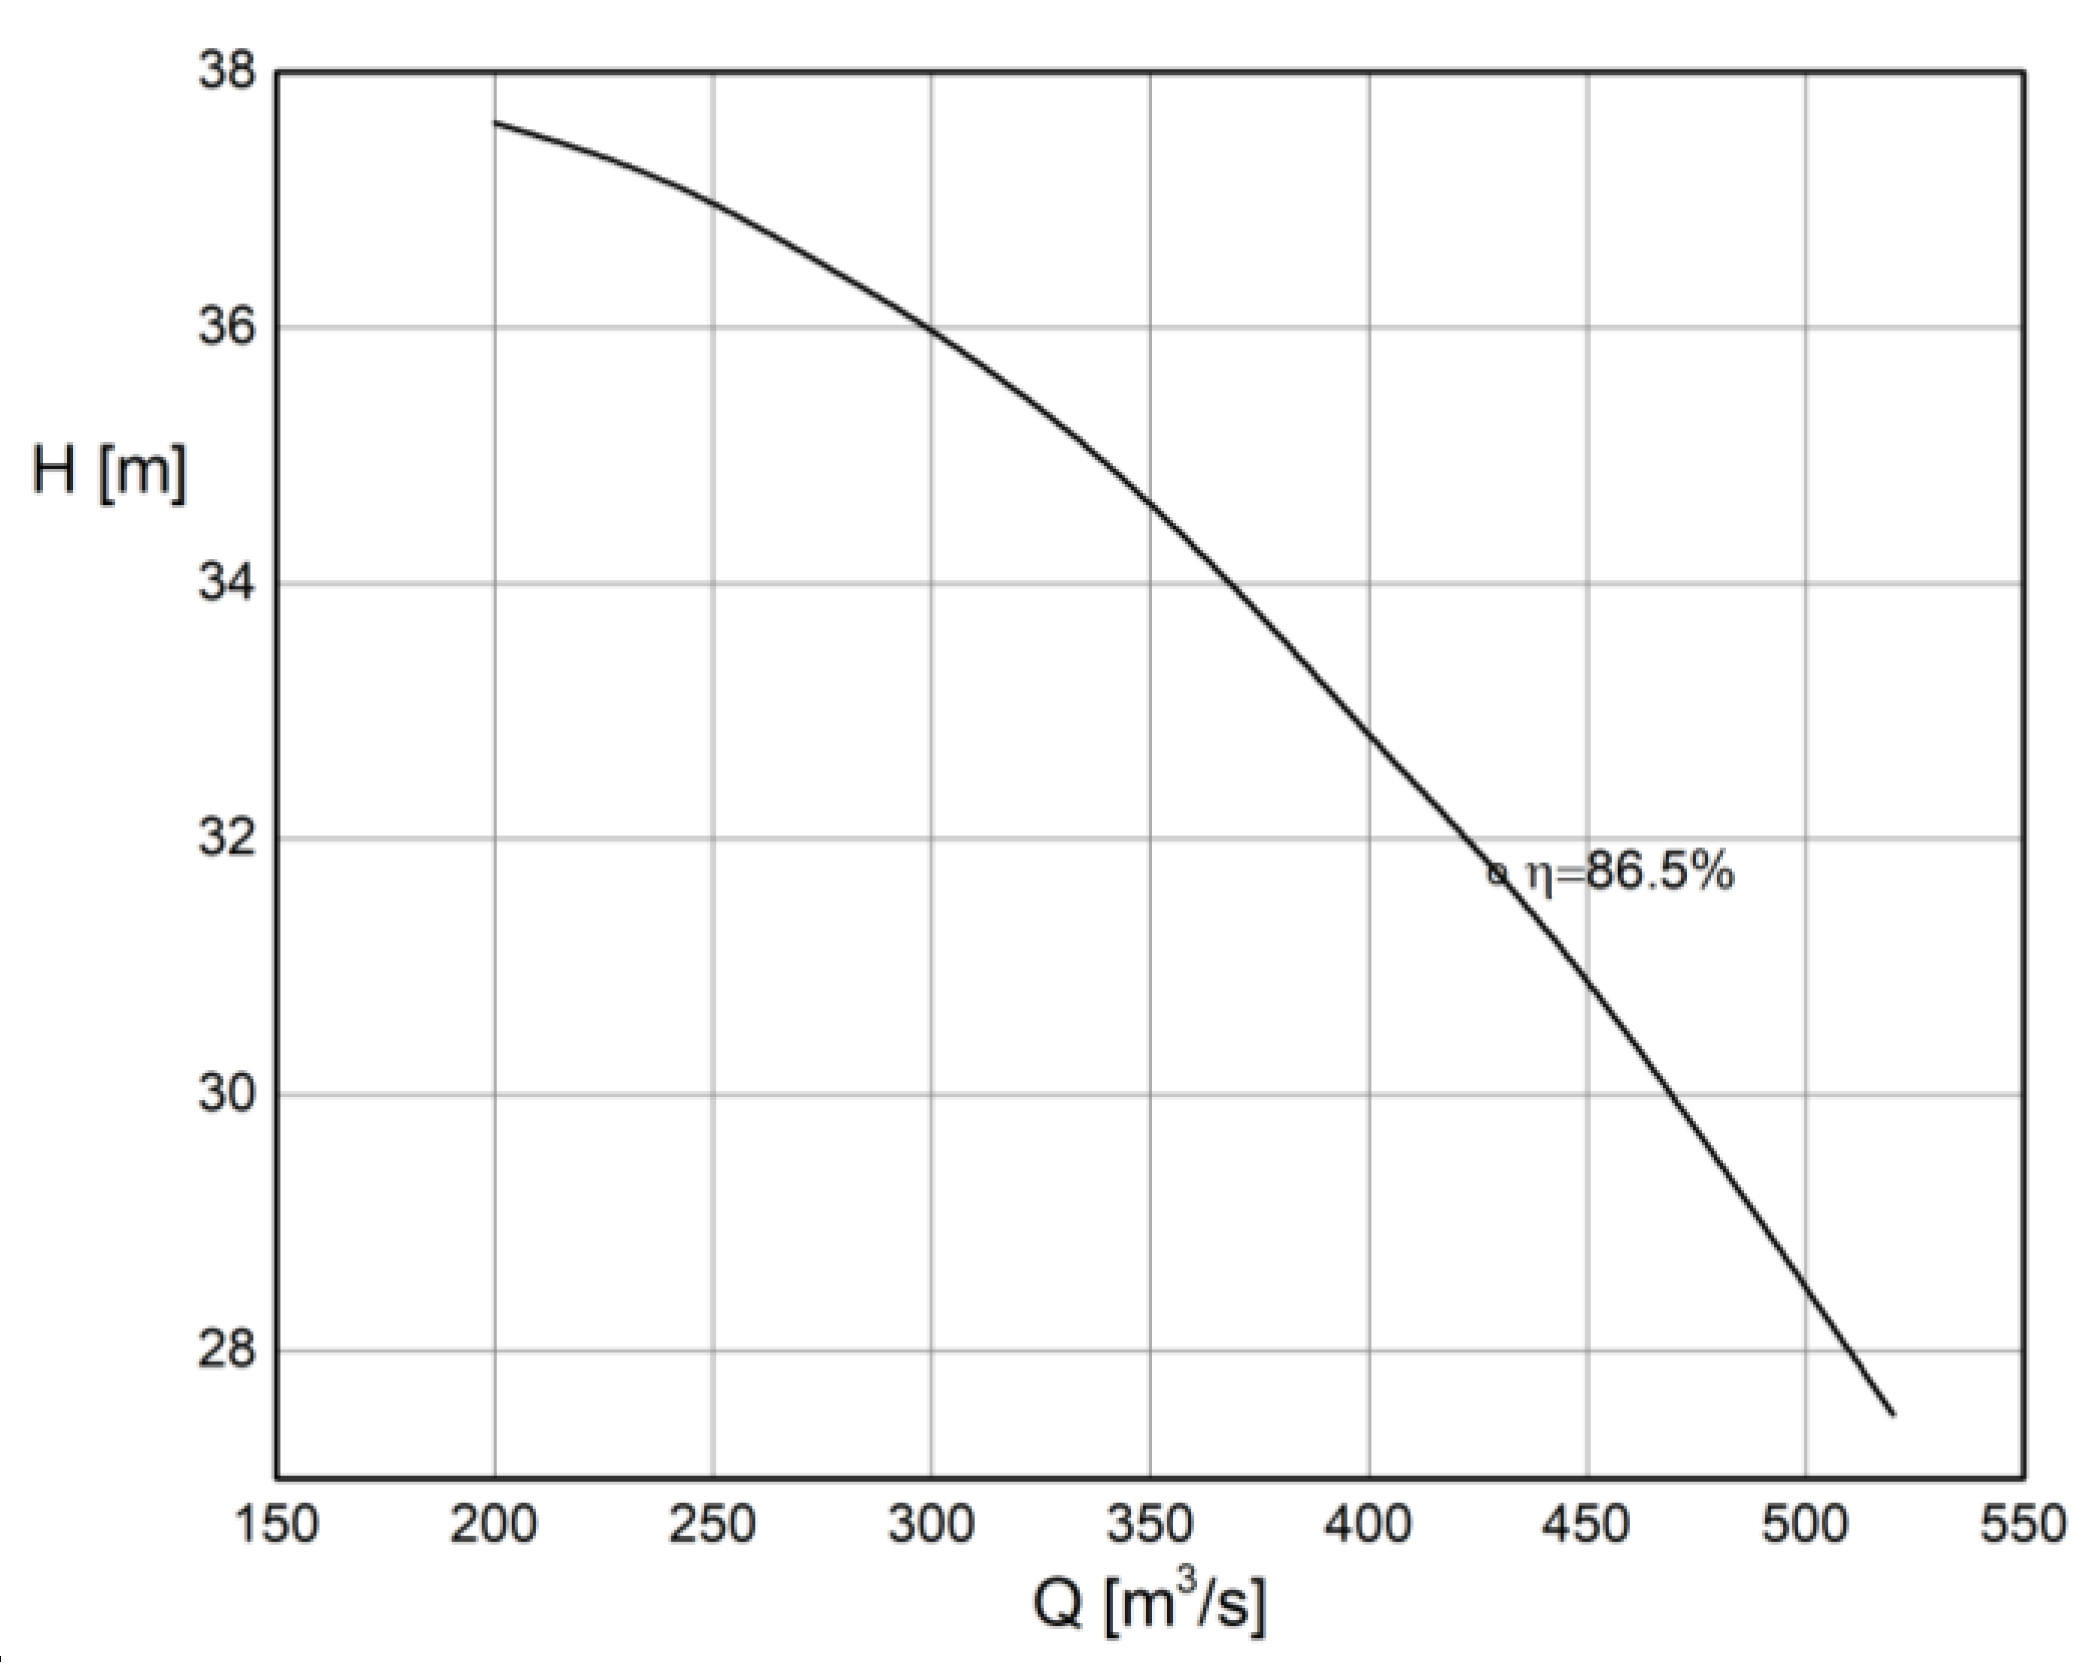
Figure 21.
Calculated head curves for different PAT solutions (250-400 and 150-315).
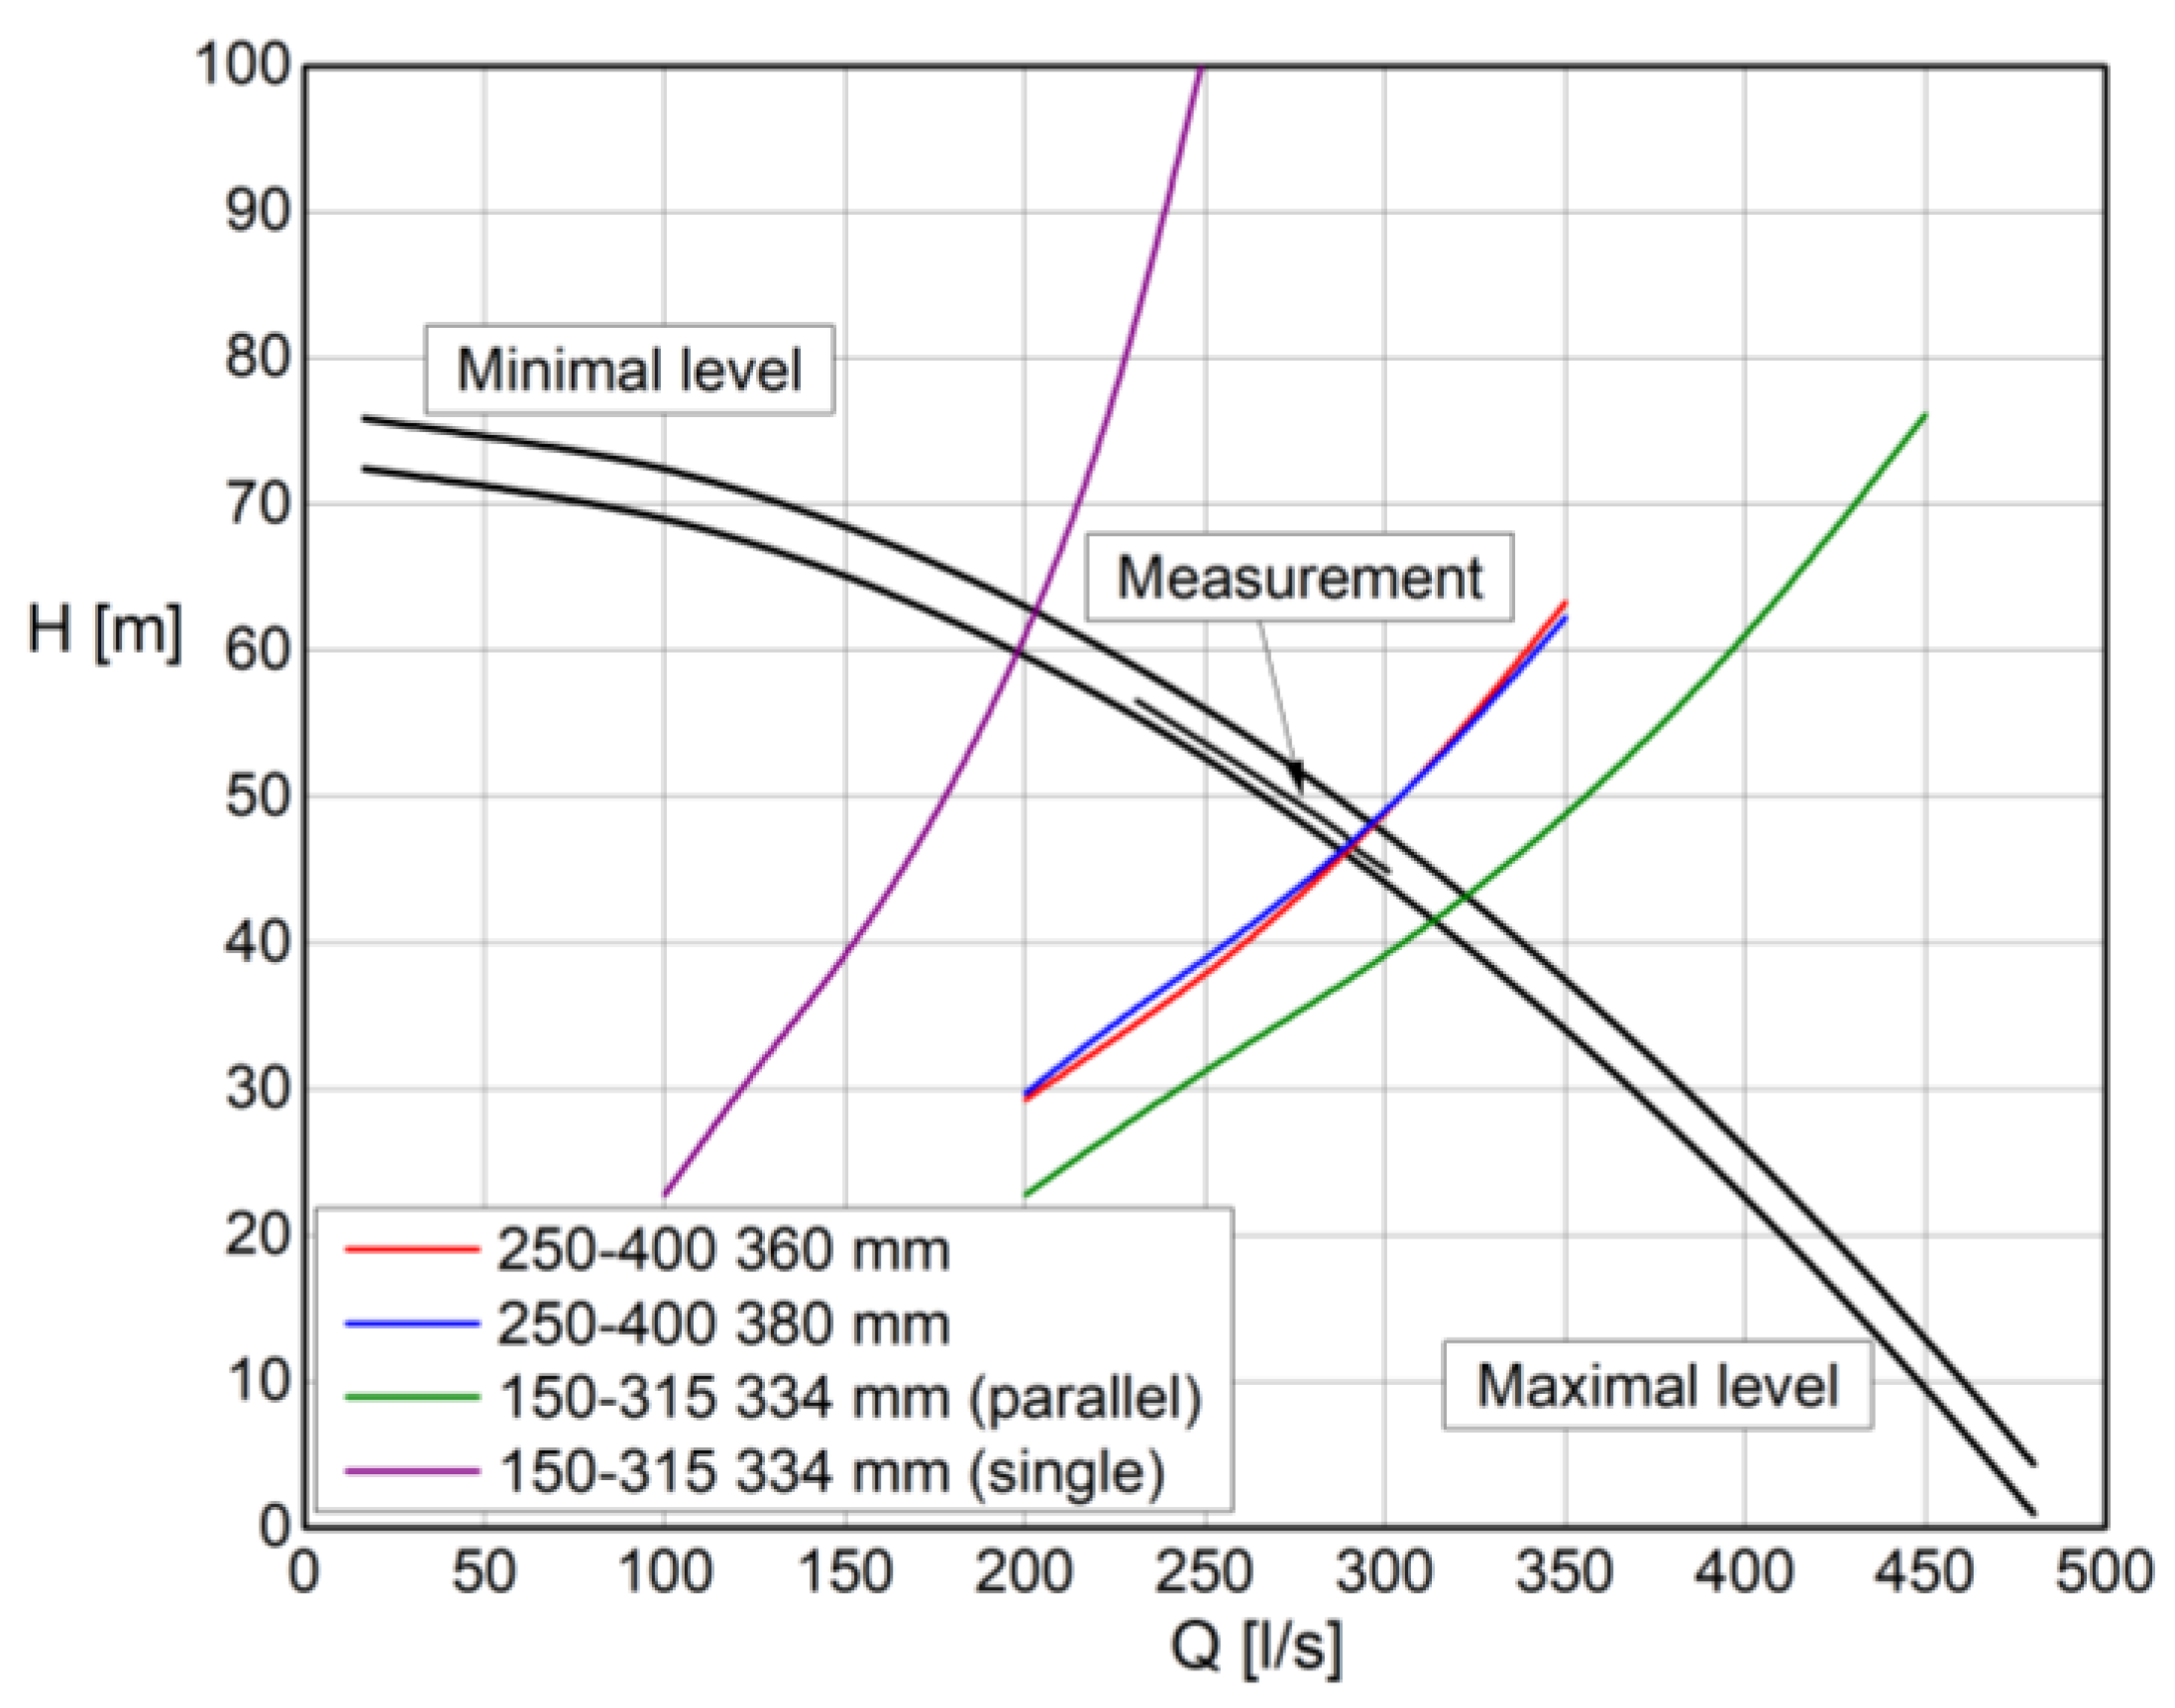
Figure 22.
Calculated power curves for different PAT solutions (250-400 and 150-315).


| Flow rate (l/s) | 231 | 260 | 282 | 289 | 292 | 301 |
| Pressure in front of the valve (bar) | 5.549 | 5.112 | 4.765 | 4.64 | 4.550 | 4.402 |
| Level in the tank (m) | 3.3 | 3.3 | 3.3 | 3.3 | 3.3 | 3.3 |
| Available net head (mVs) | 56.5998 | 52.1424 | 48.603 | 47.38 | 46.41 | 44.9004 |
Disclaimer/Publisher’s Note: The statements, opinions and data contained in all publications are solely those of the individual author(s) and contributor(s) and not of MDPI and/or the editor(s). MDPI and/or the editor(s) disclaim responsibility for any injury to people or property resulting from any ideas, methods, instructions or products referred to in the content. |
© 2024 by the authors. Licensee MDPI, Basel, Switzerland. This article is an open access article distributed under the terms and conditions of the Creative Commons Attribution (CC BY) license (http://creativecommons.org/licenses/by/4.0/).
Copyright: This open access article is published under a Creative Commons CC BY 4.0 license, which permit the free download, distribution, and reuse, provided that the author and preprint are cited in any reuse.


