
Submitted:
26 June 2024
Posted:
27 June 2024
You are already at the latest version
Abstract
Amidst the escalating demands for efficient Intelligent Transportation Systems (ITS) management, the significance of accurate Origin-Destination (OD) data prediction has emerged as a paramount concern, given its indispensable role in the ITS domain. This paper introduces a groundbreaking integrated model, creatively fusing the unique strengths of Graph Convolutional Network (GCN), Residual Neural Network (ResNet), and Long Short-Term Memory Network (LSTM) into a single architecture, which we name GraphResLSTM, to exploit road segment average speed data for OD prediction. Compared with conventional road segment traffic volume data, average speed data is more readily available, significantly reducing the data accessibility barrier for OD prediction. We underscore the critical role of selection of key road segments and employs a combination of Entropy Weight Method and Technique for Order Preference by Similarity to Ideal Solution (TOPSIS) to identify 41 representative road segments from the experimental road network. In the experimental phase, we simulate 86400000 seconds of traffic conditions, generating a total of 1440000 data records. Utilizing these simulated data, we design and conduct comparative experiments between models as well as data types. The results demonstrate that both the GraphResLSTM model and road segment average speed data outperform other models and data types notably in OD prediction tasks.
Keywords:
OD prediction
; Deep learning
; Complex network
; Intelligent Transportation System
; Spatiotemporal dependency
; Key Road segment selection
1. Introduction
Origin-Destination (OD) prediction is a pivotal aspect of urban mobility planning and intelligent transportation system (ITS), as it aids in alleviating congestion and optimizing travel efficiency during peak hours and in heavily trafficked regions [1]. Emerging transportation solutions such as customized bus, carpooling, shared mobility services, taxi dispatching, and shared parking [2,3,4,5,6] are grouped under the umbrella term Intelligent Dispatched Mobility on Demand (IDMoD). IDMoD utilizes inferred OD matrix to proactively strategize ideal travel modes for passengers, thereby substantially cutting waiting times and enhancing overall travel efficacy. With the provision of an intelligent and flexible transportation solution, IDMoD not only boosts customer delight but also actively supports energy thrift, traffic flow optimization, and green urban growth [7]. This research focuses on investigating ways to minimize data requirements for OD prediction algorithms to cater to the burgeoning need for efficient travel in Smart City.
Nowadays, OD prediction research primarily relies on traffic volume data collected from road segments. However, the collection of traffic volume data is often limited by equipment and resource, which means that data is only available for specific times and locations [8,9,10]. It is challenging to satisfy real-time OD data requirements for non-specific locations in traffic management. Instead of requiring information from every vehicle, road segment average speed data can reliably estimate vehicle speeds by considering only a subset of vehicles on the road, particularly in congested situations where the majority of vehicles typically travel at similar velocities. Moreover, compared to the scarcity of publicly available traffic volume data, most map APIs typically provide road segment average speed data. Therefore, leveraging road segment average speed data in OD prediction can lower the threshold for data requirements in traffic research and mitigate data inequality.
To estimate and predict OD matrix, researchers have developed a wide array of methodologies and models, which include traditional approaches, probabilistic models, deep learning methodologies, and various structural techniques. Several scholars have employed various models such as the least squares method [11], structural state-space models [12,13,14,15], maximum entropy models [16], and dynamic mode decomposition [17] to estimate and predict time-varying OD matrices. Another category of methods relies on probability model and statistical analysis, the concept of maximum probable relative error (MPRE) [18] and encompassing Bayesian analysis [19,20,21]. Deep learning techniques have emerged as a promising field in OD prediction. Researchers have employed various deep learning architectures such as Convolutional Long Short-Term Memory Networks (ConvLSTM) [22], Multi-scale Convolutional LSTM (MultiConvLSTM) [23], Spatio-Temporal Graph Convolutional Networks (ST-GCN), Spatio-Temporal Graph Attention Networks [24], Generative Adversarial Networks (GANs) [25], and custom-designed deep learning frameworks [26,27], to enhance the accuracy of short-term OD prediction. These deep learning applications have demonstrated exceptional proficiency in addressing specific challenges inherent to OD prediction, such as sparse destination distributions [24,28,29], incomplete OD matrices [30], and complex Spatio-temporal environments [31,32,33,34], which has resulted in substantial improvements in prediction accuracy.
In this study, we employ a GraphResLSTM (GCN-ResNet-LSTM) deep learning model that specifically targets the in-depth exploration of Spatio-temporal relationships between road network structures and average speed data along various road segments, thereby forging a new path for accurately predicting OD matrix. The distinctiveness of the GraphResLSTM model lies in the comprehensive integration of road segment average speed data with a nuanced consideration of the underlying road network structure, an aspect that is often overlooked in conventional travel demand and OD prediction models. This hybrid deep learning model, merging road network structure with road segment speeds, offers a fresh perspective that holds promise for significant advancements in predicting OD metrics. We conduct experiments utilizing approximately 4 million simulated vehicle records from the Huilongguan and Tiantongyuan area (commonly known as the 'HuiTian region') in Beijing, substantiate that the proposed method outperforms existing ones.
The principal contributions of this paper can be summarized as follows:
- Model Innovation: we propose a novel hybrid model named GraphResLSTM, which boasts a distinctive architecture that represents a theoretical and methodological breakthrough in the task of OD prediction for ITS;
- Data Processing and Source Innovation: departing from the conventional reliance on road segment traffic volume data, the study adopts road segment average speed data along road segments for OD prediction. This strategy not only simplifies the data acquisition process but also enhances both the accuracy and real-time nature of the predictions;
- Critical Road Section Selection and Data Preprocessing Methodology Innovation: We employ a synthesis of the Entropy Weight Method and the Technique for Order Preference by Similarity to Ideal Solution (TOPSIS) to identify 41 most distinctive key road segments within the experimental road network;
The remainder of the paper is organized as follows: Section 2 defines the OD prediction problem and introduces the data structures and data preprocessing methods. Section 3 elucidates the benefits and necessity of road segment selection. In Section 4, we present our proposed GraphResLSTM model. Section 5 provides experimental results based on simulated data. Section 6 concludes the content of this paper with a summary and discussion of the findings.
2. Data
Our primary focus revolves around the transportation system within the HuiTian region in Beijing, an area that holds a prominent position among Asia's most extensive residential communities and serves as a quintessential exemplar of an urban-rural interface. Amidst the ongoing urbanization process, the HuiTian region has witnessed substantial population growth and urban sprawl. As of 2022, the geographical expanse of the region stretches across approximately 168 square kilometers, accommodating a resident population of 1.44 million individuals. Concomitant with these demographic and spatial transformations, the regional transportation infrastructure has undergone substantial development, encompassing a total road network length of 327 kilometers. This encompasses 1 freeway, 2 urban expressways, 16 urban arterial roads, roughly 30 urban secondary trunk roads, and upwards of 100 urban service roads, collectively constituting a vast and intricate transportation network, as visually illustrated in Figure 1 [35]. The transportation network within the HuiTian region functions much like a complex multi-directional input-output system, where a multitude of roadways function as crucial access and departure points for traffic flowing in and out of the region. Within the purview of this investigation, these routes are conceptualized as Origin and Destination points, signifying the origin and termination points of journeys.
We employ the Simulation of Urban Mobility (SUMO), a powerful platform for simulating microscopic traffic, to model the road network in the HuiTian region. SUMO offers a realistic simulation environment that replicates traffic flow conditions in the real world, thus providing a solid foundation for our study. We gain access to simulated average speed data for each individual road segment in the area by employing this platform, which is derived by aggregating and averaging the instantaneous speeds of all vehicles on every individual road, as detailed in Table 1. This provided format offers a holistic view into the functioning status of the road network, acting as a crucial indicator for examining traffic flow and congestion trends.
In addition, we gather vehicle OD data that specifies the origin and destination of each vehicle coinciding with the time frame in which the average speed data for roads was gathered. The origins are designated at residential areas while destinations are set at entry and exit points along the roads of the region, resulting in a selection of 16 distinct OD pairs that are organized into a one-dimensional OD matrix, as exemplified in Table 2.
It is worth noting that both the road segment average speed data and the OD data are sourced directly from the simulation without any preliminary preprocessing, thereby preserving their authenticity, ensures that our dataset maintains its integrity and offers a robust foundation for further in-depth analysis. The combined application of these datasets allows us to gain a more holistic understanding of the transportation characteristics within the HuiTian region, providing strong empirical support for future urban planning and management endeavors.
3. Road Selection
In this section, we elucidate the advantages of road segment selection and detail the methods employed to identify key road segments.
3.1. Necessity and Advantages of Road Selection
With ITS constantly evolving and growing in complexity, the task of OD prediction becomes increasingly intricate due to the multitude of road segments and intersections. Consequently, the careful selection of road segments emerges as a critically important aspect. The advantages inherent in such a selective strategy include:
- Focus on Critical Areas: concentrate on areas that significantly influence overall traffic conditions, thereby gaining deeper insights and explanations of the operational characteristics of the transportation system, enhancing both depth and accuracy of the study;
- Cost-Effective Data Collection: Targeted selection of representative road segments enables us to reduce time and resource costs associated with data collection;
- Optimized Resource Utilization: significantly alleviate the demands on data gathering and processing, ultimately enabling a more effective allocation of finite research resources;
- Enhanced Explainability and Applicability: refines the model's emphasis on key road sections, which not only boosts the model's interpretability but also significantly aids in elucidating the underlying logic behind its predictions.
By concentrating attention on the most representative and influential road segments, we can maintain prediction quality while efficiently boosting computational efficiency, providing more viable solutions for real-world traffic management and planning practices.
3.2. Entropy of Road Sections and the Method for Allocating Weights
In the road segment selection process, we employ a suite of six metrics: degree, clustering coefficient, degree centrality, betweenness centrality, closeness centrality, and eigenvector centrality. We use these metrics to calculate entropy for each road segment and subsequently apply an entropy weighting method to assign weights accordingly. Here is a detailed introduction to the six key metrics:
- Degree: represents the number of other road segments connected to a given road segment. A higher degree indicates stronger connectivity of the road segment within the network;
- Clustering Coefficient: measures the ratio of actual connections among a road segment's neighboring nodes to the maximum possible connections. The higher the clustering coefficient, the closer-knit the connections are among the neighboring road segments;
- Degree Centrality: quantifies the relative importance of a road segment in the entire network. A higher degree centrality signifies a more prominent position for the road segment in the network;
- Betweenness Centrality: reflects the significance of a road segment in connecting other road segments within the network. A higher betweenness centrality implies greater control or influence over the flow of traffic within the network by the road segment;
- Closeness Centrality: gauges how easily a road segment can reach all other road segments in the network. A higher closeness centrality means better accessibility from the road segment to the rest of the network;
- Eigenvector Centrality: assesses the extent to which a road segment is linked with other important road segments in the network. Higher eigenvector centrality indicates a stronger connection between the road segment and other influential nodes in the network.
By examining these metrics, we conduct a comprehensive evaluation of the status and function of road segments within the transportation network, thereby establishing a foundation for our subsequent road segment selection.
3.2.1. Entropy of Road Section
For each road segment, we calculate six key metrics: degree, clustering coefficient, degree centrality, betweenness centrality, closeness centrality, and eigenvector centrality. Subsequently, we employ an entropy formula to compute the entropy of the road segment, as expressed in Equation (1):
where represents the number of metrics, and denotes the normalized value of the road segment in the -th metric.
3.2.2. Entropy Weight Method
In order to consider the influence of each metric on the road segments, we utilize the Entropy Weighting Method to assign weights, which is a well-established technique in decision-making processes involving multiple criteria. This method initiates with calculating the entropy weight for each metric and normalize these weights to arrive at the final weights. The formula for computing the entropy weight of a metric is given below:
3.2.3. Weight Distribution
Upon computation of the entropy weights corresponding to each metric, we proceed to multiply these weights with the respective metric values recorded for each individual road segment. This multiplication yields a comprehensive assessment score for each road segment, which subsequently serves as its weight, accurately reflecting its comparative significance within the broader transportation network.
3.3 Representative Road Section Selection Based on Weighted TOPSIS Method
In this section, we employ the TOPSIS to identify the most representative road segments based on their weights. TOPSIS assigns a comprehensive score to each road segment by assessing its proximity to both the Positive Ideal Solution (PIS) and Negative Ideal Solution (NIS).
The PIS and NIS are established by extracting the best and worst attribute values from the decision matrix. Within our context, the PIS embodies a hypothetical road segment with the highest scores across all considered metrics, while the NIS signifies the road segment with the least favorable values in each metric. The calculation method for the j-th component of the PIS and NIS solutions is as follows:
Mathematically, these vectors are represented as and , respectively denoting the ideal and non-ideal state for all evaluation criteria.
To perform TOPSIS calculations, we initially normalize the performance metrics of each road segment. For each criterion, we standardize the road segment's value by dividing it by the maximum value of that particular criterion, thus creating a normalized decision matrix. Subsequently, we multiply each element of this normalized matrix by its corresponding entropy-based weight, generating a weighted normalized decision matrix.
After that, we use the Euclidean distance as the similarity metric to quantify the degree of similarity between each road segment and both the PIS and NIS, which produces two separate similarity matrices. Ultimately, these similarity matrices are combined, and the overall performance score for the -th alternative is computed according to Equation (5):
where signifies the element in the -th row and -th column of the weighted and normalized decision matrix, indicating the performance of the -th alternative on the -th evaluation criterion. denotes the total number of evaluation indicators.
Employing this weight based TOPSIS method, we identify the top 41 road segments with the highest overall scores, directing future data procurement activities, thereby guaranteeing that the collected data is both more exhaustive and illustrative of the transportation network's characteristics.
4. Method
In this section, we review four related popular neural network architectures, include CNN (Convolutional Neural Networks), GCN, LSTM, and ResNet (Residual Networks), followed by a discussion of the proposed GraphResLSTM.
4.1. CNN
The task of predicting travel demand and OD flows necessitates spatial relationship modeling, making CNN potentially powerful tools for processing geospatial data. In the context of 2D convolutional operations applied to input data for feature extraction, the mathematical expression can be expressed as:
f represents the input data, and g denotes the convolution kernel, where yields the output feature map.
Pooling operations serve to diminish the dimensions of feature maps, thereby decreasing computational complexity. A common mathematical expression for max pooling, which retains only the maximum value within each pooling region, is as follows:
x represents the input data.
It is crucial to take advantage of their proficiency in identifying local patterns while acknowledging their potential shortcomings in unraveling long-term dependencies when utilizing CNN to forecast OD flows.
4.2. GCN
GCN demonstrates exceptional proficiency in processing complex relational data structures, particularly those characterizing the interwoven road segments within an urban mobility fabric. It employs nodes to denote entities such as junctions or stations, and edges to manifest their interconnections, exemplified by the joining of streets or public transport corridors. Consequently, each node assimilates context from its surrounding nodes, thereby enhancing its encoded understanding of its positional relevance and significance within the broader network fabric, a process that is rigorously defined by Equation (8):
represents the node feature representations in the layer, where denotes the degree matrix, is the symmetrically normalized adjacency matrix, stands for the weight matrix at the -th layer, and represents the activation function.
In summary, the integration of GCN into OD estimation assignments fundamentally elevates the spatial modeling faculties of deep learning algorithms, thereby furnishing them with enhanced capacity to decode the diverse complexities and dynamic nature characteristic of urban transportation environments.
4.3. LSTM
LSTM, a variant of Recurrent Neural Network (RNN), is specifically engineered to handle the challenge of long-term dependencies in sequential data. Distinct from conventional RNN, LSTM incorporates a sophisticated internal architecture that efficiently captures and maintains long-term context information. The fundamental unit within an LSTM cell comprises three critical gating mechanisms: the forget gate, input gate, and output gate.
The forget gate determines how much of the past information from the previous time step should be discarded at the current time step:
The input gate controls the amount of new information to be admitted into the cell:
The candidate memory cell is computed by the tanh function:
Using the outputs from both the forget gate and input gate, the cell state is updated:
The output gate determines the hidden state at the current time step, which is based on a weighted combination of the current input and the cell state:
These gates regulate the flow of information, facilitating LSTM to strategically neglect superfluous data, preserve salient details, and generate fitting outputs. Due to this gating apparatus, LSTM excels in preserving prolonged contextual insights and proficiently tackling the vanishing gradient issue, thereby solidifying its indispensable status in processing temporal data.
4.4. ResNet
ResNet is a deep learning architecture devised to mitigate the gradient vanishing and exploding issues prevalent during the training of deep neural networks. For a given input x, the output y of a residual block is computed as follows:
represents the residual mapping function parameterized by the set of weights .
Residual Network represents a robust modeling instrument for OD prediction, as it overcomes hurdles linked to the training of deep architectures. This capacitates the model to better assimilate the spatiotemporal variations of traffic information, thus engendering advancements in both predictive accuracy and intelligibility.
4.5. GraphResLSTM
We develop a groundbreaking hybrid model named GraphResLSTM by merging GCN, LSTM, and ResNet. GraphResLSTM manifests several pivotal strengths when engaged in the task of prognosticating OD matrices predicated on mean velocity data for road segments.
Chiefly, GCN ingeniously discerns the intricate spatial interdependencies among road segments. Employing graph-based configurations, the model amplifies our comprehension of the interconnectedness and reciprocal impacts among diverse road segments within the traffic network, thereby augmenting its responsiveness to fluctuations in traffic flow patterns. Secondly, LSTM demonstrates an extraordinary aptitude for revealing long-term dependencies within historical time series data, which empowers the model to extract insights from past traffic conditions and make well-informed predictions regarding future variations in road segment average speeds. Lastly, the unique residual learning architecture of ResNet addresses the challenges of gradient vanishing and overfitting, enabling the model to efficiently analyze a wide range of features embedded in extensive average speed datasets while preserving the subtleties of both spatial and temporal dependencies. Hence, GraphResLSTM synergistically combines these three components to provide a more robust and perspicacious prediction framework for estimating OD matrices in urban transportation systems. The network architecture diagram is presented in Figure 2.
Consequently, GraphResLSTM is able to analyze and forecast changes in OD matrices with heightened robustness and efficiency, thereby enhancing prediction accuracy. Moreover, it ensures sustained generalization performance and resilience when confronted with expansive, high-dimensional transportation datasets.
5. Experiment
In this section, we conduct a series of comparative experiments aimed at evaluating the performance of GraphResLSTM model and investigating the impact of diverse data types on OD prediction tasks. Through meticulous analysis, we explore the model's behavior across various conditions, highlighting the distinct effects that different data types have on OD prediction results. Furthermore, we perform sensitivity analyses to gain deeper insights into the disparities in model performance and assess the suitability of various data types for OD prediction.
5.1. Experiment Design
We utilize a dataset containing 24000 hours of simulated traffic conditions embracing all roads in the Huitian region, augmented with real-time OD data for every vehicle. Each entry in the dataset encapsulates the traffic situation at a specific juncture in time, incorporating elements such as the recording timestamp, average speed, traffic volume, wait duration, travel time, stopping frequency for each road segment, and the quantity of vehicles corresponding to every OD pair. To simplify the training process, we convert the OD matrix into a one-dimensional tensor where each index represents a unique OD pair; a more detailed explanation of this transformation is provided in Section 3. We set the time interval at 1 minute, which results in approximately 1.44 million records of traffic condition data. Our experimental setup involves allocating 80% of this data for training and reserving the remaining 20% for testing. To evaluate the performance of our model, we adopt four commonly used metrics: Mean Absolute Error (MAE), Mean Squared Error (MSE), Root Mean Squared Error (RMSE), and Symmetric Mean Absolute Percentage Error (SMAPE), with their respective formulas as follows:
Here, and denote actual and predicted values respectively, and is the sample size. SMAPE is used to avoid division errors when the true value equals zero in MAPE. The experimental runs are currently executed on a GPU-equipped system featuring a GeForce GTX 3060 graphics card. The standard parameter configurations for each model are presented in Table 3. Hyperparameters are being fine-tuned through an iterative process. We are systematically experimenting with multiple typical hyperparameter values and choosing those that yield the most favorable outcomes.
5.2. Model Evaluate
To guarantee a fair comparison, identical parameter configurations are utilized across all models. The input sample time length is kept uniform with that of the GraphResLSTM model, and the final embedding dimension is set to 64 for all baseline models. Top-performing models on the validation set are selected for comparative analysis. For a comprehensive evaluation of the GraphResLSTM model, several classic models are chosen for comparison, such as CNN, GCN, LSTM, CNN-LSTM, and GCN-LSTM. Each model undergoes training and testing under the same dataset and experimental conditions, thereby ensuring an equitable and reliable assessment in the comparative study.
Table 4 shows the performance of GraphResLSTM compared to other models according to four commonly used measures: MAE, MSE, RMSE, and SMAPE. The MAE metric indicates the average absolute difference between predicted and actual values. The GraphResLSTM model achieves an MAE score of 0.075958893, which is 4.34% lower than that of the LSTM model and nearly 10% below other models, signifying enhanced precision in OD prediction. The MSE measure represents the squared differences between forecasted and actual values. With an MSE of 0.009412067, GraphResLSTM outperforms the LSTM model by 8.2% and other models by over 16%, implying greater resilience in OD prediction. When considering RMSE, which is the square root of MSE and reflects the typical error magnitude, the GraphResLSTM model records 0.096057905. This is 3.9% lower than the GCN-LSTM model and more than 5% below other models, indicating improved consistency in OD prediction. Regarding SMAPE, which evaluates the relative percentage error between predictions and actuals, the GraphResLSTM model attains a score of 20.64%. Although slightly higher (by 0.68%) than the GCN-LSTM model, it remains over 6% below other models, suggesting heightened explainability in OD prediction.
Current results consistently demonstrate that, when predicting OD using road segment average speed data, the GraphResLSTM model outperforms other baseline models. Its lowest MAE, MSE, and RMSE scores, along with an SMAPE that is just 0.68% above the minimum level, attest to its strong predictive accuracy, robustness, and consistency in OD prediction. In summary, the GraphResLSTM model currently serves as an effective, efficient, and reliable deep learning solution with exceptional performance in OD prediction using road segment average speed data, providing a solid basis for potential applications in future intelligent transportation systems.
5.3. Data Evaluate
The OD prediction results across five distinct input data scenarios are presented in Table 5, and they illustrate the extent to which these various data types influence model performance. Regarding MAE values, all five data categories exhibit closely similar MAEs near 0.08, indicating that the model consistently maintains a relatively low average error independent of the data type. Notably, the MAE for speed data is at 0.076, slightly lower than the others, suggesting a potentially smaller average error when predicting with speed data inputs.
When examining MSE values, the MSEs for the five data types are similarly close, approximating 0.011, denoting that the model consistently achieves a relatively low mean squared deviation in predictions for each data type. Of these, the MSE for speed data is recorded as 0.0094, a marginal decrease from the other four types, indicating a smaller mean squared deviation particularly when predicting with speed data.
Regarding RMSE values, the RMSEs across the five data types are uniformly low, averaging around 0.10, thereby demonstrating that the model consistently exhibits a small average absolute error in predictions across these varied data types. The RMSE for speed data sits at 0.0961, slightly under the figures for the other four data types, suggesting a potentially smaller average absolute error when predicting speed data.
In terms of SMAPE values, all five data types present SMAPE percentages clustered around 22%, inferring that the model sustains a relatively small average relative error throughout predictions on these data types. Of particular note, the SMAPE value for speed data is measured at 20.64%, slightly lower than the others, indicating a potentially smaller average relative error when predicting with speed data.
In conclusion, the MAE, MSE, RMSE, and SMAPE metrics for the five data types are quite comparable, collectively demonstrating that the model displays a generally strong predictive performance. Among these, the prediction precision for speed data is modestly superior to the other four data types.
5.4. Sensitive Analysis
We select three distinct time intervals (90-120, 1090-1120, and 2090-2120) from the testing dataset to visually depict the prediction outputs produced by GraphResLSTM, as shown in Figure 3. In these visualizations, the upper row of graphs portrays the model-generated traffic patterns, while the lower row presents the actual observed values. Across each subplot, the x-axis signifies the 16 unique OD pairs, and the y-axis represents the various time intervals within the chosen periods.
A striking observation is that there is a considerable volume of vehicle traffic between OD pair number 6 and 7, with appreciably fewer vehicles traveling via other OD pairs. Throughout the different timeframes, the GraphResLSTM model generally excels in accurately forecasting the OD data for most regions. However, it is crucial to recognize that the model sometimes encounters difficulties in accurately predicting OD pairs with lower volumes; these instances are less reliably identified by the GraphResLSTM model.
Figure 3 Comparison of True OD versus Predicted OD across different times and road segments
Furthermore, we conduct a sensitivity analysis on crucial hyperparameters within the GraphResLSTM model. The key parameters include: (1) the learning rate; (2) the L2 regularization coefficient in the optimizer; and (3) the residual ratio in the residual layers. The learning rate acts as a central control parameter influencing the training process, determining the magnitude of parameter adjustments at each iteration. With other parameters held constant at their defaults, we are varying the learning rate across the set [1e-6, 5e-6, 1e-5, 3e-5, 5e-5]. According to Figure 4, as the learning rate increases, all four evaluation metrics tend to rise initially and then decrease, with the model exhibiting optimal performance on MAE, MSE, and RMSE when the learning rate is set to 1e-5, and second-best performance for SMAPE.
L2 regularization is a common technique employed to prevent overfitting by incorporating a penalty term proportional to the squared L2 norm of the weight matrix into the loss function, thereby limiting model complexity. Figure 4 shows that the fluctuations of all four metrics are relatively minor as the L2 regularization coefficient in the optimizer changes, suggesting that the model is not highly sensitive to adjustments in this specific parameter. Therefore, a default value of 5e-4 can be appropriately chosen based on its generally stronger model performance across the investigated range.
The residual ratio parameter represents the extent to which the original input signal is combined with the signal processed by GCN layers. As depicted in the relevant chart, no clear pattern emerges in the four metrics as the residual ratio shifts. Nevertheless, it can be observed that the model performs favorably with other settings when the residual ratio is fixed at 1, thus supporting the selection of a default value of 1, which aligns with the commonly used residual link ratio in residual networks.
6. Conclusions
In this study, we utilize the GraphResLSTM model to infer Origin-Destination (OD) pairs utilizing speed data from road segments. By integrating an entropy-based weight allocation strategy and the weighted TOPSIS method for selecting representative sections, our deep learning architecture efficiently captures spatial-temporal dependencies. The experimental outcomes thus far have demonstrated that the GraphResLSTM model excels in OD prediction tasks, offering a state-of-the-art and efficient solution with exceptional accuracy for traffic management and the advancement of Intelligent Transportation Systems (ITS). Going forward, we intend to continually refine the model and explore additional relevant features to enhance prediction accuracy further.
Author Contributions
Conceptualization, Jun Zhang and Guangtong Hu; methodology, Guangtong Hu; software, Jun Zhang; validation, Guangtong Hu; formal analysis, Guangtong Hu; investigation, Guangtong Hu; resources, Guangtong Hu; data curation, Guangtong Hu; writing—original draft preparation, Guangtong Hu; writing—review and editing, Jun Zhang; visualization, Guangtong Hu; supervision, Guangtong Hu; project administration, Jun Zhang; funding acquisition, Jun Zhang. All authors have read and agreed to the published version of the manuscript.
Funding
This study is supported by grants from the National Social Science Foundation of China (grant number 20BGL001), which is required to be unique.
Institutional Review Board Statement
Not applicable.
Informed Consent Statement
Not applicable.
Data Availability Statement
The EXCEL data used to support the findings of this study have been deposited in the Mendeley Data repository (DOI: 10.17632/x28rjycz23.2).
Conflicts of Interest
The authors declare no conflicts of interest.
References
- Munizaga, M.A.; Palma, C. Estimation of a disaggregate multimodal public transport Origin–Destination matrix from passive smartcard data from Santiago, Chile. Transport Res C-Emer 2012, 24, 9–18. [Google Scholar] [CrossRef]
- B. Zhang, Z. Zhong, X. Zhou et al., Optimization Model and Solution Algorithm for Rural Customized Bus Route Operation under Multiple Constraints. Sustainability 2023, 15, 3883. [CrossRef]
- Ou, H.; Tang, T.-Q. Impacts of carpooling on trip costs under car-following model. Physica A 2018, 505, 136–143. [Google Scholar] [CrossRef]
- Bąk, A.; Nawrocka, E.; Jaremen, D.E. “Sustainability” as a Motive for Choosing Shared-Mobility Services: The Case of Polish Consumers of Uber Services. Sustainability 2022, 14, 6352. [Google Scholar] [CrossRef]
- H. Ding, J. Li, N. Zheng et al., Dynamic dispatch of connected taxis for large-scale urban road networks with stochastic demands: An MFD-enabled hierarchical and cooperative approach. Transport Res C-Emer 2022, 142, 103792. [Google Scholar] [CrossRef]
- Y. Ji, X. Lu, H. Jiang et al., Layout Optimization for Shared Parking Spaces Considering Shared Parking Walking Time and Parking Fee. Sustainability 2022, 14, 5635. [CrossRef]
- S. Singh, J. Singh, S. B. Goyal et al., A novel framework to avoid traffic congestion and air pollution for sustainable development of smart cities. Sustain Energy Techn 2023, 56, 103–125. [Google Scholar] [CrossRef]
- N. Tsanakas, D. Gundlegård, and C. Rydergren, O–D matrix estimation based on data-driven network assignment, Transportmetrica B 2023, 11, 376–407. [CrossRef]
- Y. Mei, S. Wang, M. Gong et al., Urban Traffic Dominance: A Dynamic Assessment Using Multi-Source Data in Shanghai. Sustainability 2024, 16, 4956. [Google Scholar] [CrossRef]
- Bell, M.G.H. The Estimation of an Origin-Destination Matrix from Traffic Counts. Transport Sci. 1983, 17, 198–217. [Google Scholar] [CrossRef]
- Krishnakumari, P.; van Lint, H.; Djukic, T.; et al. A data driven method for OD matrix estimation. IEEE T Intell Transp 2020, 113, 38–56. [Google Scholar] [CrossRef]
- P.-W. Lin, and G.-L. Chang, A generalized model and solution algorithm for estimation of the dynamic freeway origin–destination matrix. Transp. Res. Part B Methodol. 2007, 41, 554–572. [CrossRef]
- Zhou, X.; Mahmassani, H.S. A structural state space model for real-time traffic origin–destination demand estimation and prediction in a day-to-day learning framework. Transp. Res. Part B Methodol. 2007, 41, 823–840. [Google Scholar] [CrossRef]
- Ashok, K.; Ben-Akiva, M.E. Alternative Approaches for Real-Time Estimation and Prediction of Time-Dependent Origin–Destination Flows, Transport Sci. 34, 36. [CrossRef]
- Yang, H.; Iida, Y.; Sasaki, T. An analysis of the reliability of an origin-destination trip matrix estimated from traffic counts. Transp. Res. Part B Methodol. 1991, 25, 351–363. [Google Scholar] [CrossRef]
- K. Ashok, and M. E. Ben-Akiva, Estimation and Prediction of Time-Dependent Origin-Destination Flows with a Stochastic Mapping to Path Flows and Link Flows. Transport Sci. 2002, 36, 184–198. [Google Scholar] [CrossRef]
- Hazelton, M.L. Inference for origin–destination matrices: estimation, prediction and reconstruction. Transp. Res. Part B Methodol. 2001, 35, 667–676. [Google Scholar] [CrossRef]
- F. Yang, C. Shuai, Q. Qian et al., Predictability of short-term passengers’ origin and destination demands in urban rail transit. Transportation 2023, 50, 2375–2401. [CrossRef]
- Cheng, Z.; Trépanier, M.; Sun, L. Real-Time Forecasting of Metro Origin-Destination Matrices with High-Order Weighted Dynamic Mode Decomposition. Transport Sci. 2022, 56, 904–918. [Google Scholar] [CrossRef]
- J. Tang, S. Zhang, X. Chen et al., Taxi trips distribution modeling based on Entropy-Maximizing theory: A case study in Harbin city—China. Physica A 2018, 493, 430–443. [CrossRef]
- M. Vahidi, and Y. Shafahi, Time-dependent estimation of origin–destination matrices using partial path data and link counts, Transportation, 2023. [CrossRef]
- J. Ye, J. Zhao, F. Zheng et al., Completion and augmentation-based spatiotemporal deep learning approach for short-term metro origin-destination matrix prediction under limited observable data. Neural Comput Appl 2023, 35, 3325–3341. [CrossRef]
- W. Jiang, Z. Ma, and H. N. Koutsopoulos, Deep learning for short-term origin–destination passenger flow prediction under partial observability in urban railway systems. Neural Comput Appl 2022, 34, 4813–4830. [CrossRef]
- K.F. Chu, A. Y. S. Lam, and V. O. K. Li, Deep Multi-Scale Convolutional LSTM Network for Travel Demand and Origin-Destination Predictions. IEEE T Intell Transp 2020, 21, 3219–3232. [CrossRef]
- D. Zhang, F. Xiao, M. Shen et al., DNEAT: A novel dynamic node-edge attention network for origin-destination demand prediction. Transport Res C-Emer 2021, 122, 102851. [CrossRef]
- D. Zhang, and F. Xiao, Dynamic Auto-Structuring Graph Neural Network: A Joint Learning Framework for Origin-Destination Demand Prediction. IEEE T Knowl Data En 2023, 35, 3699–3711. [CrossRef]
- P. Noursalehi, H. N. Koutsopoulos, and J. Zhao, Dynamic Origin-Destination Prediction in Urban Rail Systems: A Multi-Resolution Spatio-Temporal Deep Learning Approach. IEEE T Intell Transp 2022, 23, 5106–5115. [CrossRef]
- T. Pamuła, and R. Żochowska, Estimation and prediction of the OD matrix in uncongested urban road network based on traffic flows using deep learning. Eng Appl Artif Intel 2023, 117, 105550. [CrossRef]
- X. Zou, S. Zhang, C. Zhang et al., Long-Term Origin-Destination Demand Prediction With Graph Deep Learning. IEEE Trans. Big Data 2022, 8, 1481–1495. [CrossRef]
- L. Liu, Y. Zhu, G. Li et al., Online Metro Origin-Destination Prediction via Heterogeneous Information Aggregation. IEEE Trans. Pattern Anal. Mach. Intell. 2023, 45, 3574–3589. [CrossRef]
- C. Shuai, J. Shan, J. Bai et al., Relationship analysis of short-term origin–destination prediction performance and spatiotemporal characteristics in urban rail transit. Transport Res A-Pol 2022, 164, 206–223. [CrossRef]
- J. Zhang, H. Che, F. Chen et al., Short-term origin-destination demand prediction in urban rail transit systems: A channel-wise attentive split-convolutional neural network method. Transport Res C-Emer 2021, 124, 102928. [CrossRef]
- Q. Wang, Y. Yuan, Q. Zhang et al., Signalized arterial origin-destination flow estimation using flawed vehicle trajectories: A self-supervised learning approach without ground truth. Transport Res C-Emer 2022, 145, 103917. [CrossRef]
- Jin, M.; Wang, M.; Gong, Y.; et al. Spatio-temporally constrained origin–destination inferring using public transit fare card data. Physica A 2022, 603, 127642. [Google Scholar] [CrossRef]
- Municipality, C.D.G.o.B. Control detailed plan for CP02-0101~0602 blocks (neighborhood level) of Huiyuan and Tiantongyuan areas, Changping District, Beijing (2020-2035). 2022. http://www.bjchp.gov.cn/cpqzf/xxgk2671/tzgg30/zwgg/cp5509619/index.html.
Figure 1.
Huitian Region Road Network Map.
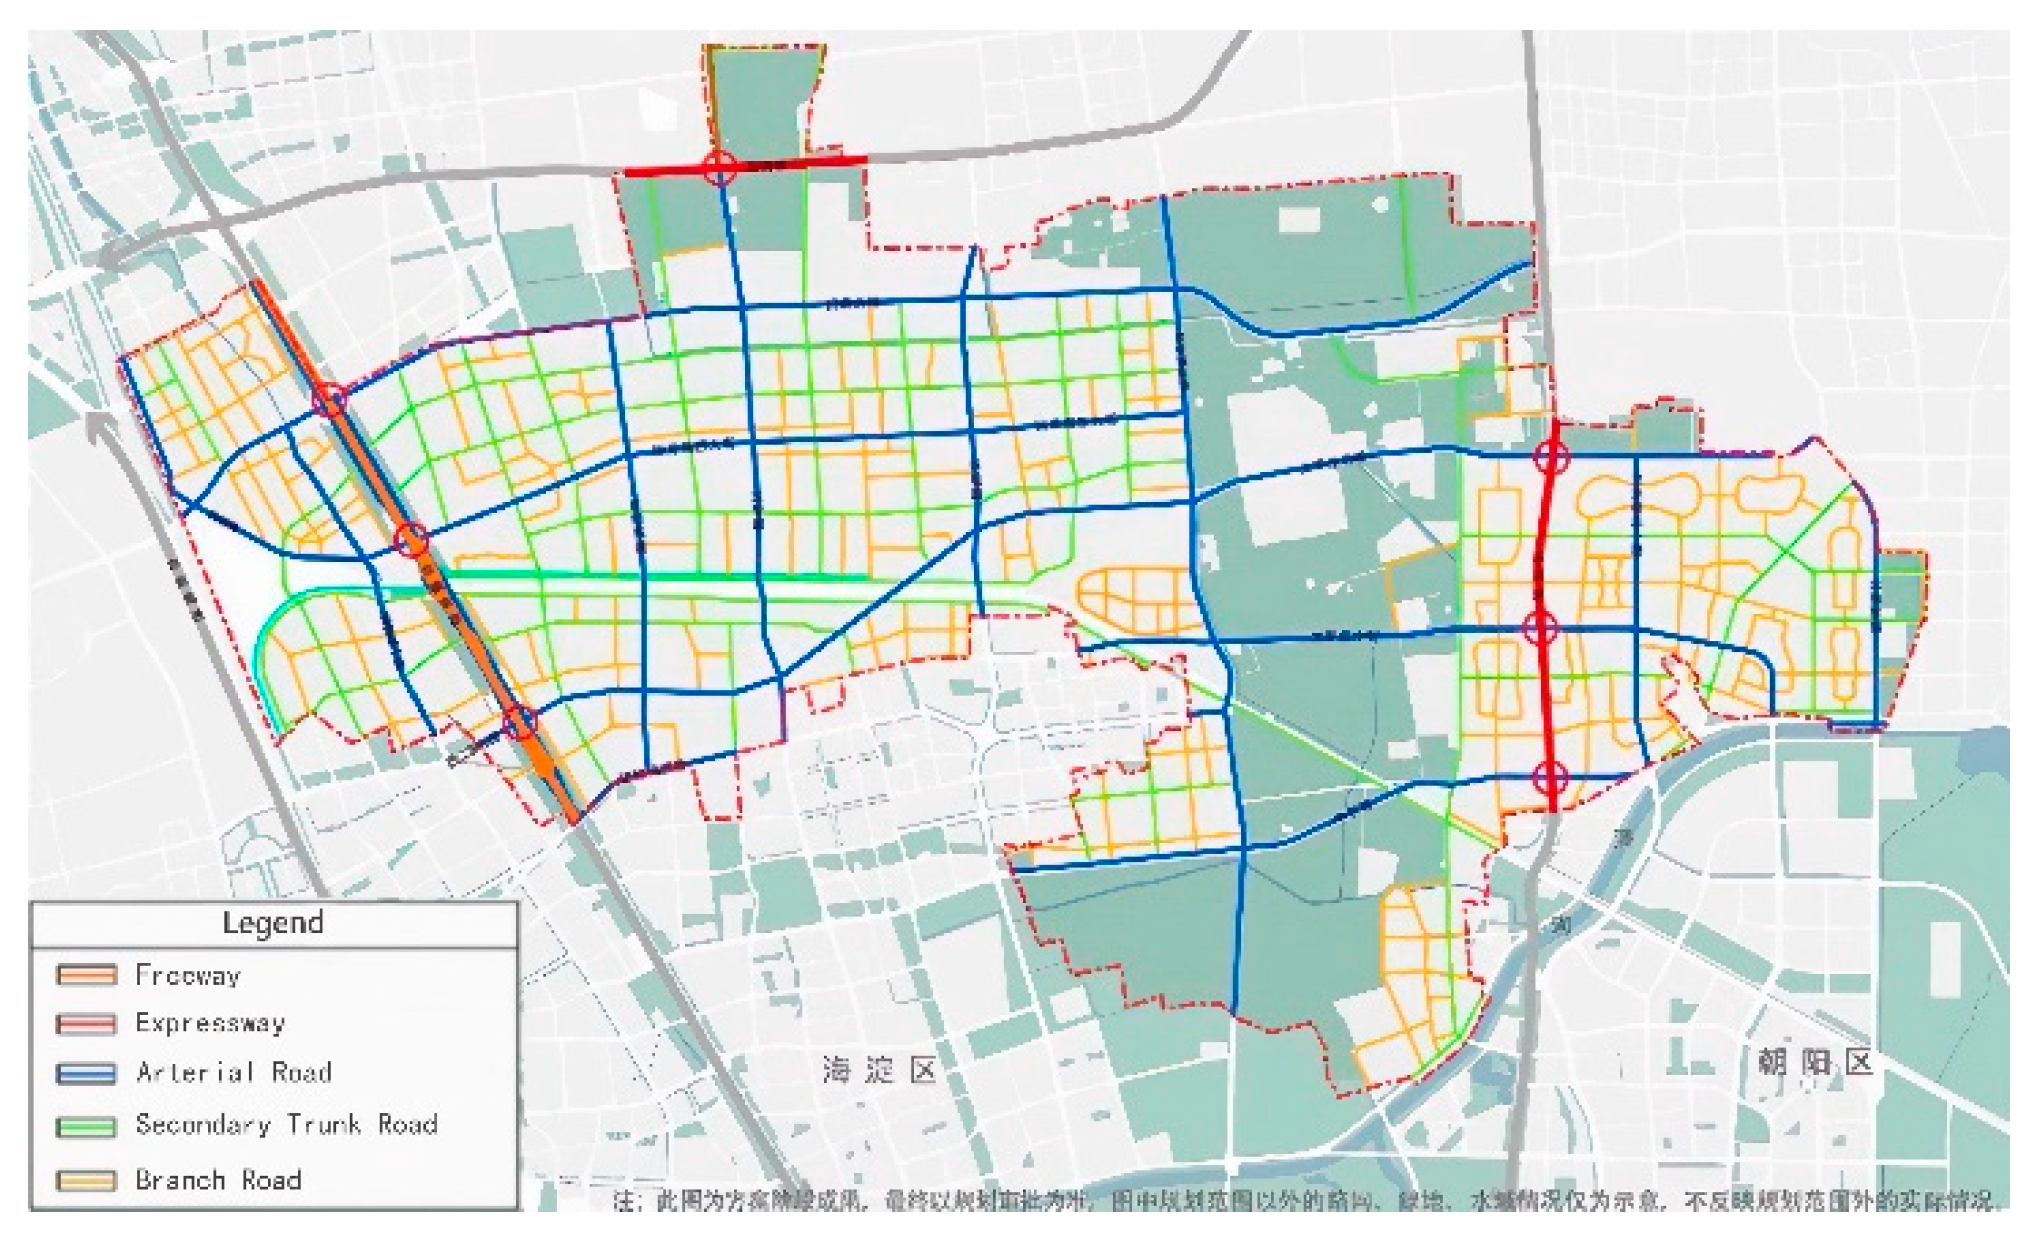
Figure 2.
GraphResLSTM network architecture diagram.
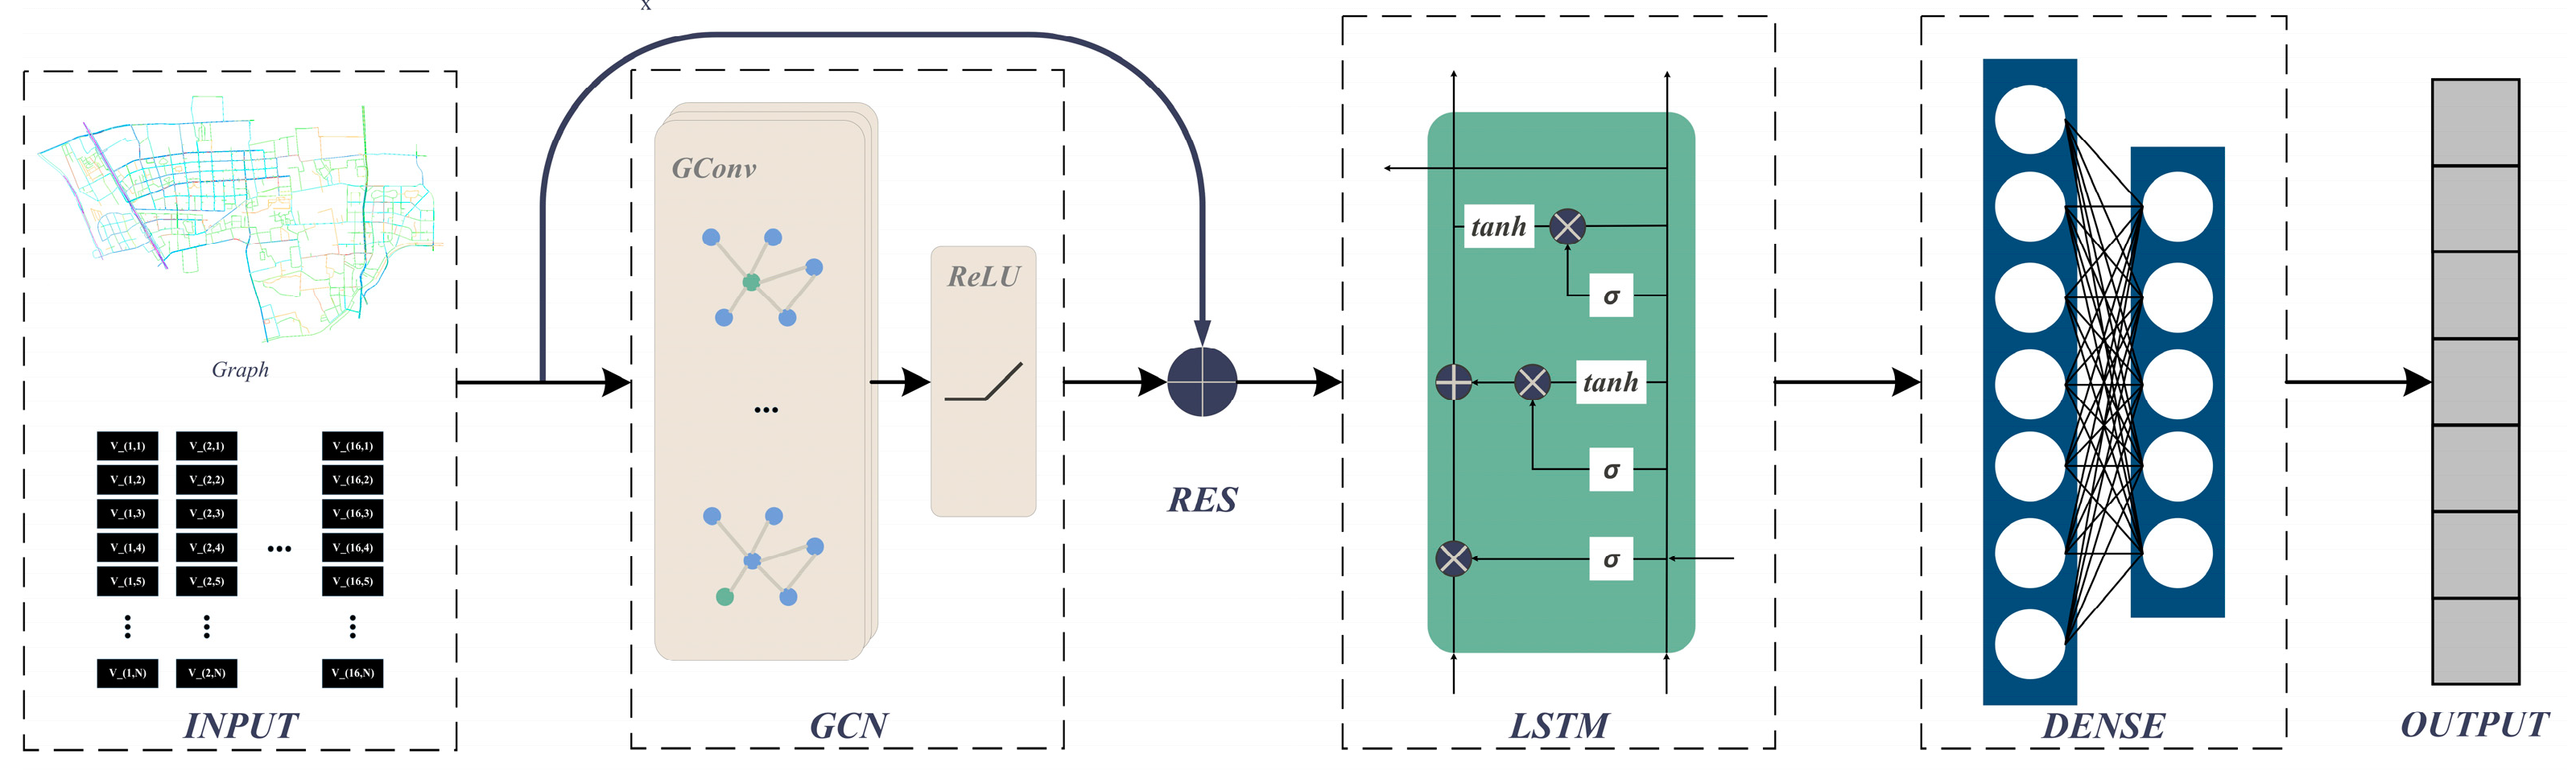
Figure 3.
Comparison of True OD versus Predicted OD across different times and road segments.
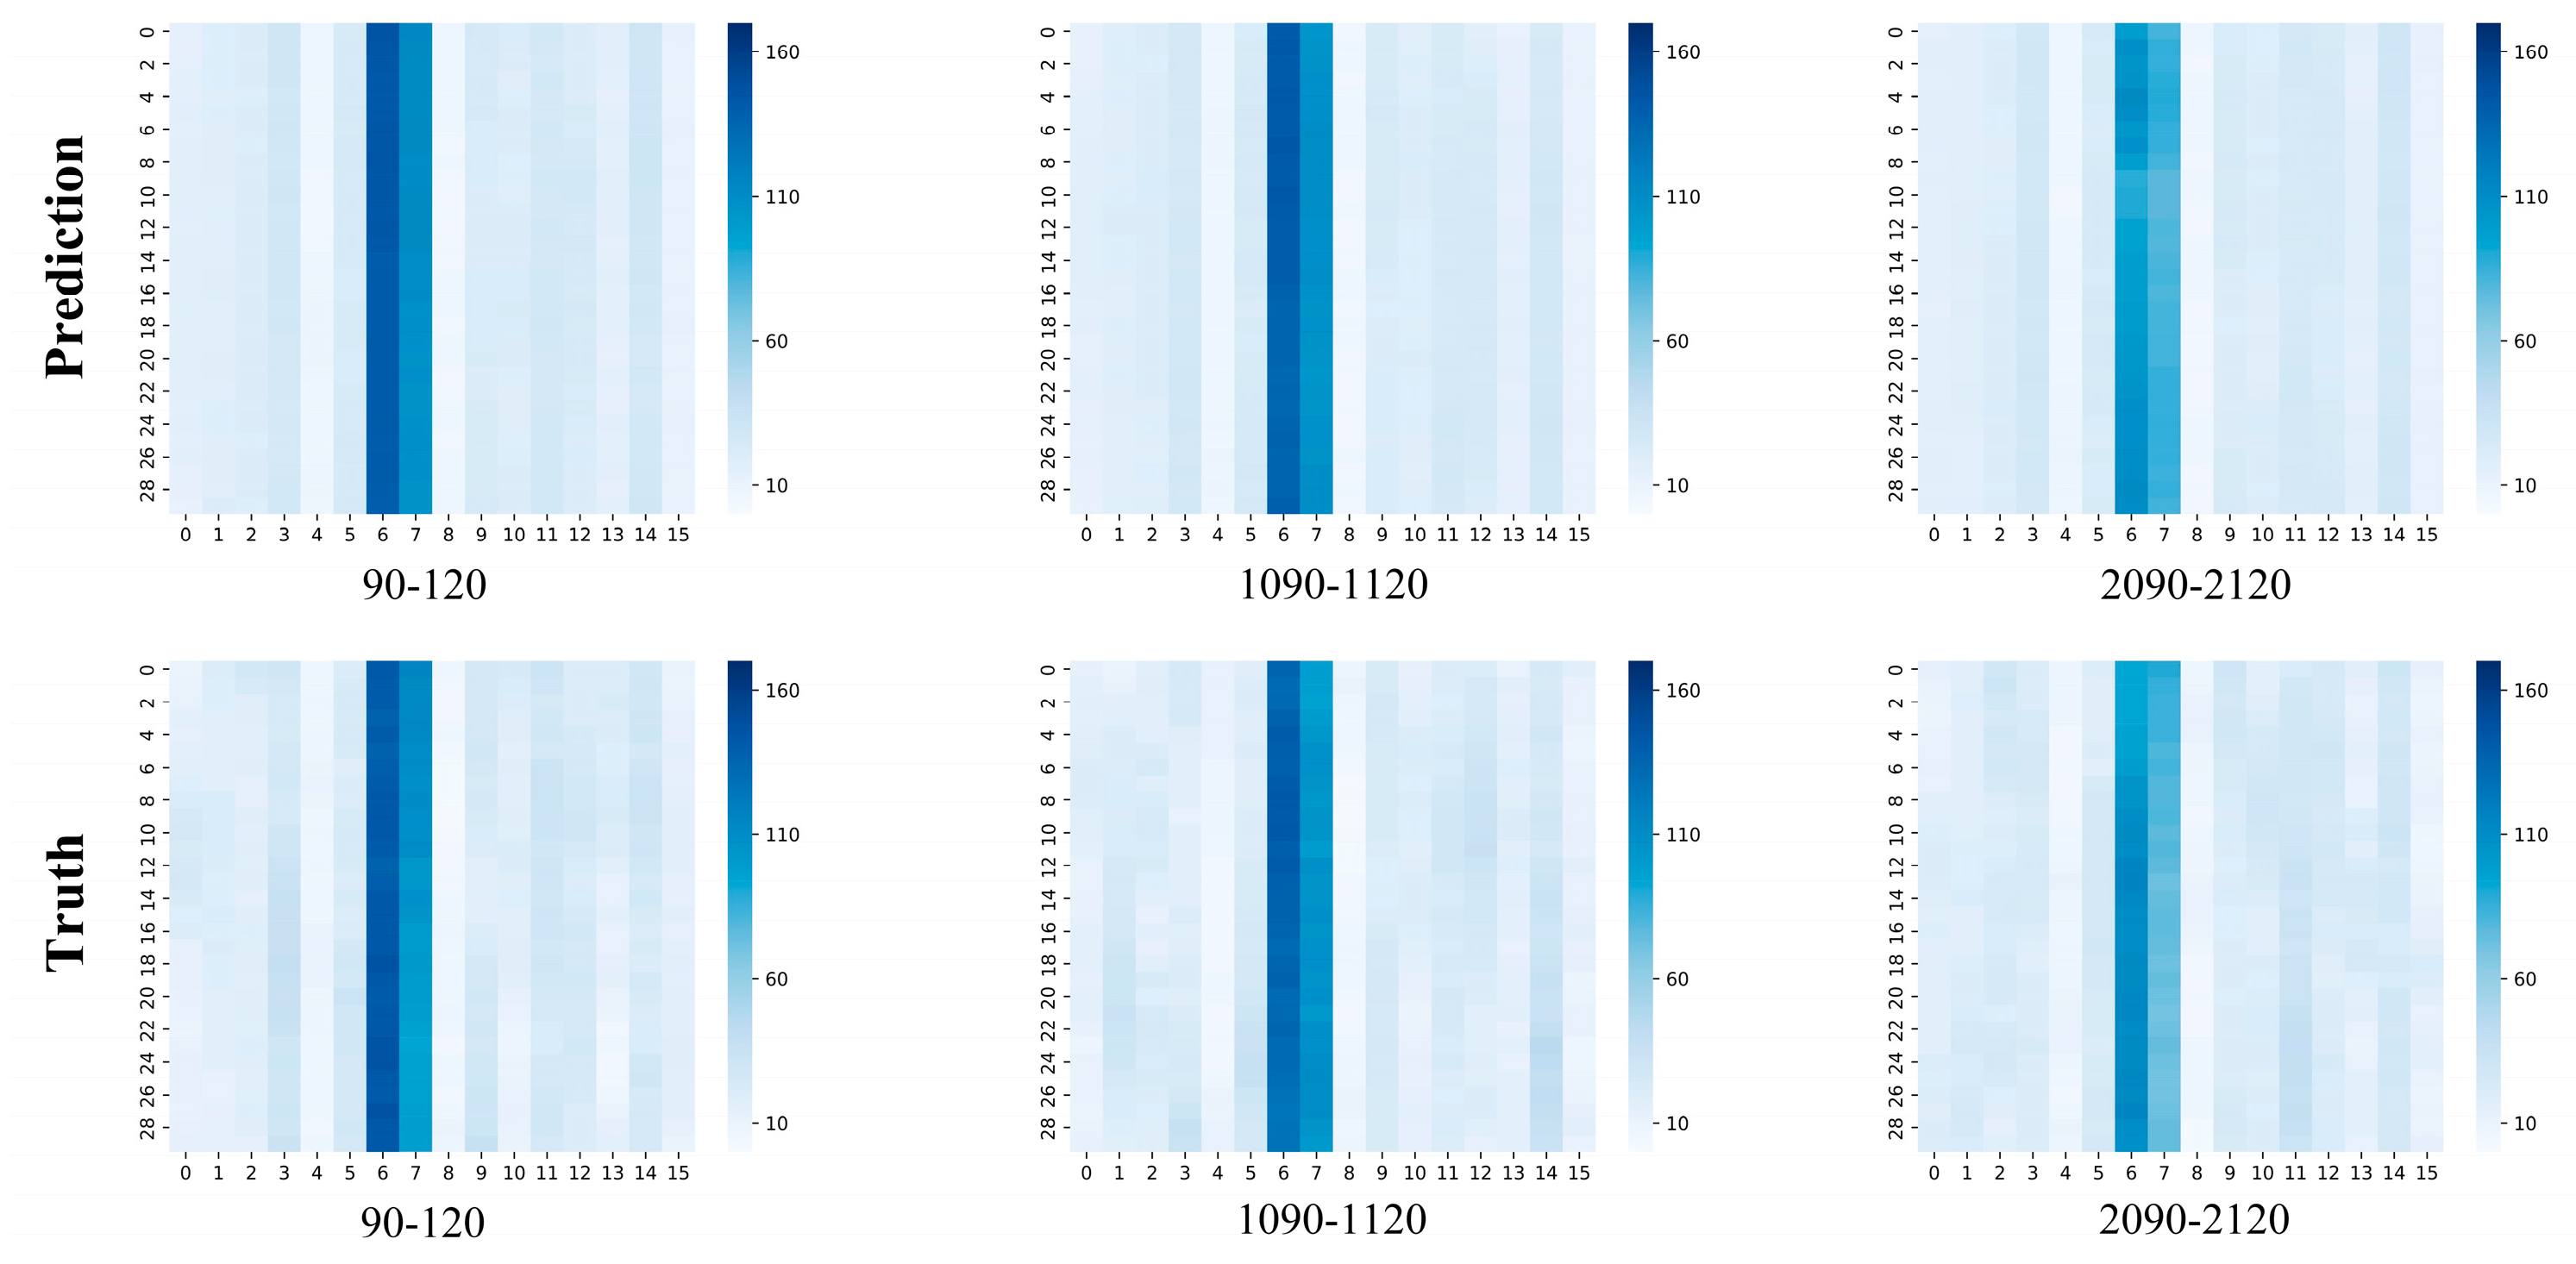
Figure 4.
sensitivity analysis on crucial hyperparameters within the GraphResLSTM.
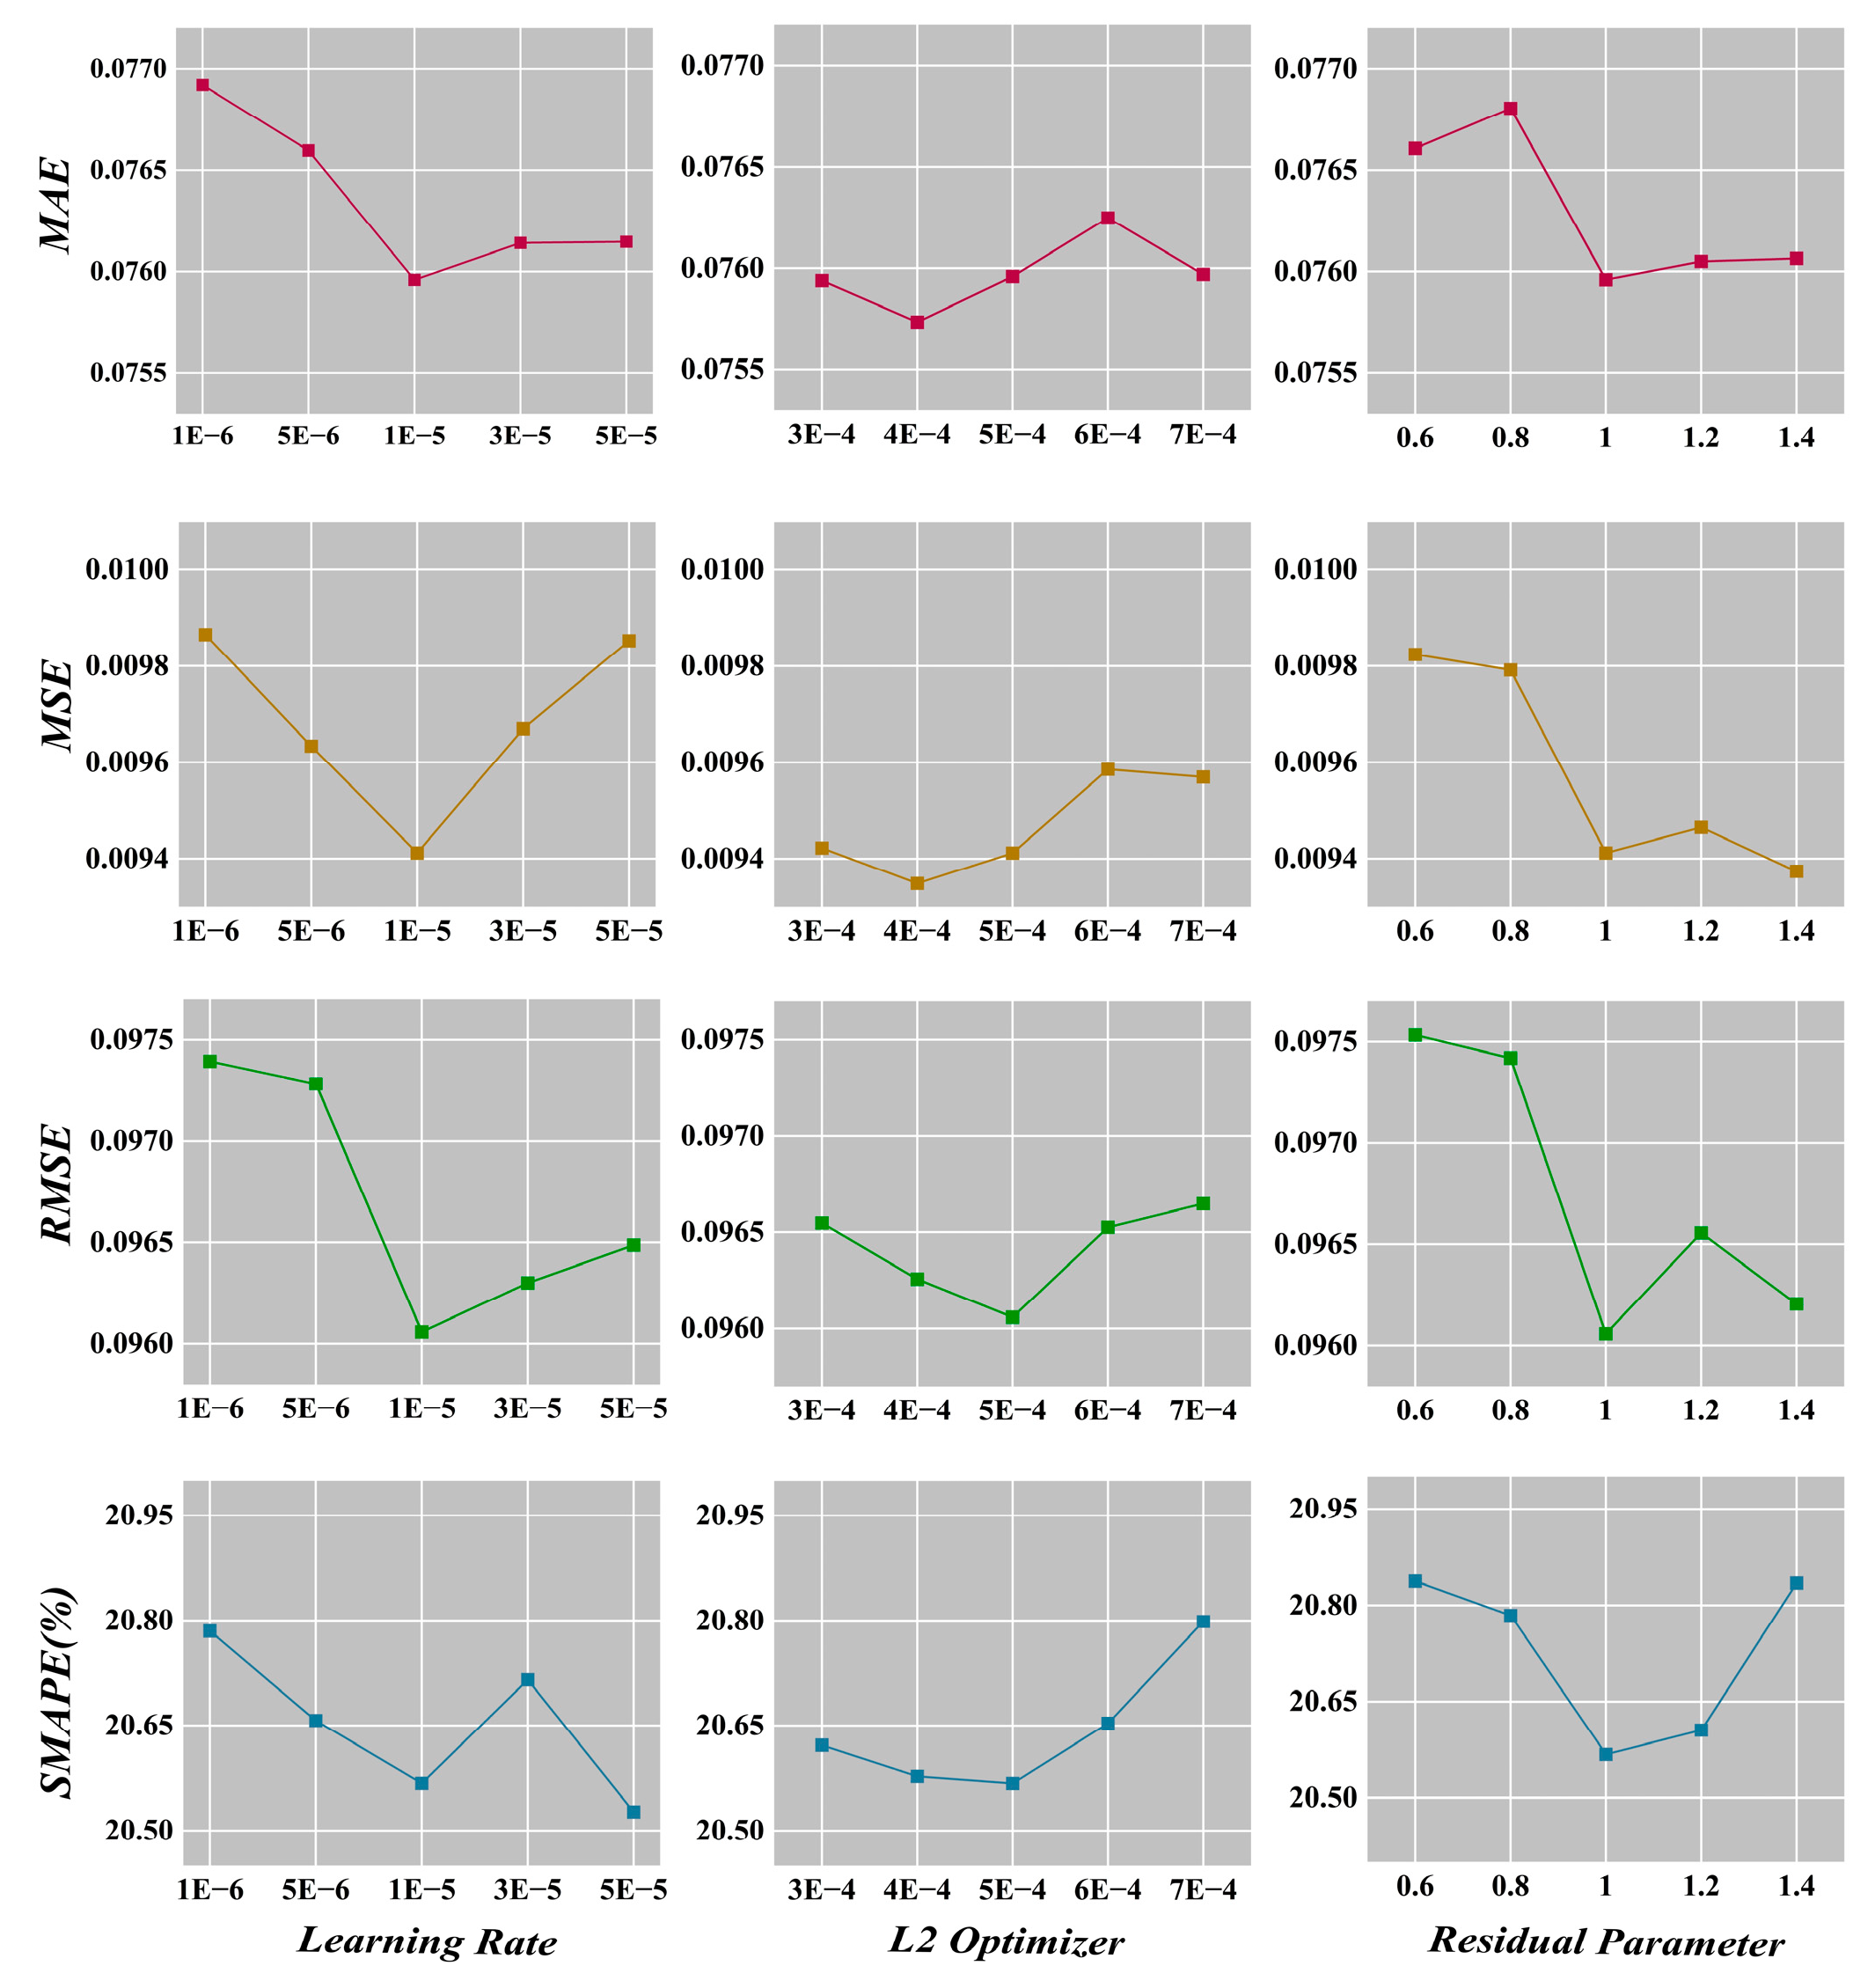

Table 1.
Road segment average speed data samples.
| Data ID | Time | Road 0 | Road 1 | … | Road 40 |
|---|---|---|---|---|---|
| 0 | 6000 | 15.22 | 3.63 | … | 12.61 |
| 1 | 6060 | 14.08 | 4.87 | … | 11.08 |
| 2 | 6120 | 14.13 | 5.25 | … | 13.25 |
| … | … | … | … | … | … |
| 1439800 | 86394000 | 0.00 | 0.00 | … | 7.00 |
Table 2.
OD Data Samples.
| OD ID | Time | OD 0 | OD 1 | … | Road 15 |
|---|---|---|---|---|---|
| 0 | 6000 | 417 | 216 | … | 290 |
| 1 | 6060 | 322 | 190 | … | 316 |
| 2 | 6120 | 386 | 220 | … | 356 |
| … | … | … | … | … | … |
| 1439800 | 86394000 | 18 | 14 | … | 16 |
Table 3.
Default values of Parameters.
| Parameters | Describe | Values |
|---|---|---|
| out_channels_gcn | number of channels in the output data of GCN | 64 |
| hidden_size_lstm | size of LSTM hidden layer | 64 |
| learning_rate | learning rate | 0.00001 |
| num_epochs | num of epochs | 1000 |
| batch_size_train | batch size | 512 |
| l2_loss | L2 regularization coefficient in the optimizer | 0.0005 |
| res_ratio | the residual ratio in the residual layers | 1 |
Table 4.
Models performance evaluation.
| MAE | MSE | RMSE | SMAPE | |
|---|---|---|---|---|
| CNN | 0.082804094 | 0.011285882 | 0.10456171 | 22.37051838 |
| GCN | 0.084134158 | 0.011512537 | 0.106558977 | 22.83664327 |
| LSTM | 0.07940893 | 0.010252437 | 0.101354543 | 22.0205108 |
| CNN LSTM | 0.084023348 | 0.011509673 | 0.10608842 | 22.45860681 |
| GCN LSTM | 0.084090347 | 0.011510888 | 0.099953406 | 20.50259149 |
| GraphResLSTM | 0.075958893 | 0.009412067 | 0.096057905 | 20.64164395 |
Table 5.
Data performance evaluation.
| MAE | MSE | RMSE | SMAPE | |
|---|---|---|---|---|
| flow | 0.082804094 | 0.011285882 | 0.10456171 | 22.37051838 |
| waiting | 0.084134158 | 0.011512537 | 0.106558977 | 22.83664327 |
| travel | 0.07940893 | 0.010252437 | 0.101354543 | 22.0205108 |
| halting | 0.084023348 | 0.011509673 | 0.10608842 | 22.45860681 |
| speed | 0.075958893 | 0.009412067 | 0.096057905 | 20.64164395 |
Disclaimer/Publisher’s Note: The statements, opinions and data contained in all publications are solely those of the individual author(s) and contributor(s) and not of MDPI and/or the editor(s). MDPI and/or the editor(s) disclaim responsibility for any injury to people or property resulting from any ideas, methods, instructions or products referred to in the content. |
© 2024 by the authors. Licensee MDPI, Basel, Switzerland. This article is an open access article distributed under the terms and conditions of the Creative Commons Attribution (CC BY) license (http://creativecommons.org/licenses/by/4.0/).
Copyright: This open access article is published under a Creative Commons CC BY 4.0 license, which permit the free download, distribution, and reuse, provided that the author and preprint are cited in any reuse.


