
Submitted:
17 June 2024
Posted:
17 June 2024
You are already at the latest version
Abstract
Predicting type 2 diabetes mellitus (T2DM) using phenotypic data with machine learning (ML) techniques has received significant attention in recent years. PyCaret, an ML tool that enables the simultaneous application of 16 different algorithms, was used to predict T2DM using phenotypic variables from the “Nurses’ Health Study” and “Health Professionals’ Follow-up Study” datasets. Ridge classifier, Linear Discriminant Analysis, and Logistic Regression (LR) were the best-performing models for the male-only data subset. For the female-only data subset, LR, Gra-dient Boosting Classifier, and CatBoost Classifier were the strongest models. The AUC, accuracy, and precision were 0.77, 0.70, and 0.70 for males and 0.79, 0.70, and 0.71 for females, respective-ly. The feature importance plot showed that familial history of diabetes (famdb), never having smoked, and high blood pressure (hbp) were the most influential features in females, while famdb, hbp, and current smoking were the major variables in males. In conclusion, PyCaret was used successfully for speed analysis for the prediction of T2DM by simplifying complex ML tasks. Gen-der differences are an important consideration for T2DM prediction. Despite this comprehensive ML tool, phenotypic variables alone may not be sufficient for early T2DM prediction; genotypic variables could also be used in combination for future studies.
Keywords:
type 2 diabetes mellitus
; PyCaret
; machine learning
; prediction
; feature importance plot
; SHAP value
1. Introduction
Type 2 diabetes mellitus (T2DM) is a chronic metabolic disorder that affects millions of people worldwide, posing significant health and economic burdens. Early detection and prevention of T2DM are crucial for reducing its complications and improving the quality of life of patients [1]. Predicting diabetes allows for earlier detection and intervention, potentially delaying or preventing disease progression. This aligns with personalized medicine’s emphasis on proactive healthcare. However, the current diagnostic methods for T2DM, such as the oral glucose tolerance test (OGTT) and the glycated hemoglobin (A1C) test, can be invasive, costly, and time-consuming.
Phenotypic data can provide valuable insights into the risk factors and pathophysiology of T2DM. Phenotypic data include anthropometric measurements, biochemical markers, lifestyle habits, medical history, and family history. Machine learning (ML) techniques, which are computational methods that learn from data and make predictions, can leverage phenotypic data to build predictive models for T2DM [2]. ML techniques have several advantages over conventional statistical methods, such as the ability to handle high-dimensional and nonlinear data, discover complex patterns and interactions, and improve accuracy and generalization [3,4,5].
Several studies have applied different ML techniques to predict T2DM using phenotypic data from various populations. For example, Yu et al. (2010) used a support vector machine (SVM) to classify instances of diabetes using data from the National Health and Nutrition Examination Survey (NHANES) [6]. Deberneh and Kim utilized five ML algorithms for the prediction of T2DM using both laboratory results and phenotypic variables [2]. Anderson et al. used a reverse engineering and forward simulation (REFS) analytical platform that relies on a Bayesian scoring algorithm to create prediction-model ensembles for progression to prediabetes or T2DM in a large population [7]. Cahn et al. used electronic medical records (EMR) data from The Health Improvement Network (THIN) database that represents the UK population to identify prediabetic individuals [8]. Shin et al. used logistic regression (LR), decision tree, random forest (RF), eXtreme Gradient Boosting (XGBoost), Cox regression, and XGBoost Survival Embedding (XGBSE) for prediction of diabetes [9]. Gul et al. investigated the prediction value of phenotypic variables (body mass index, cholesterol, familial diabetes history, and high blood pressure) with LR [10]. Dinh et al. achieved high area under curve (AUC) scores with and without laboratory data with LR, SVM, and three ensemble models (RF, gradient boosting-XGBoost, and a weighted ensemble model) [11]. Viloria et al. used SVM to predict T2DM only using body mass index (BMI) and blood glucose concentration [12]. Wang et al. compared XGBoost, SVM, RF, and K-nearest neighbor (K-NN) algorithms to predict the risk of T2DM [13].
Previous studies have shown that ML techniques can be used to predict T2DM using phenotypic data. However, these studies have several limitations. First, they focused on a few ML algorithms or compared them in isolation without considering the full range of existing methods or novel algorithms. Second, some of these studies used laboratory results that are directly related to glucose metabolism and may not reflect other aspects of phenotypic variation. Another limitation of these studies is their lack of consideration for gender disparities in risk factors, disease outcomes, and model performance for T2DM. Additionally, some studies relied on datasets that were either small or of questionable quality [13]. Despite these limitations, the previous studies provide promising evidence that ML techniques can be used to develop accurate and robust models for predicting T2DM risk.
This study aimed to address the limitations of previous studies by using PyCaret, an open-source, low-code ML library in Python that automates ML workflows [14]. PyCaret allows simultaneous evaluation of multiple ML algorithms, including newly developed ones, such as XGBoost, LightGBM, and CatBoost for predicting T2DM. PyCaret eliminates the need for extensive domain expertise, reduces the analysis time, and allows to obtain more comprehensive evaluation metrics.
Another aim of the research was to explore the differences between male and female populations for predicting T2DM. By analyzing how phenotype and gender interact, we can identify risk factors that are more prominent in one sex compared to the other. This knowledge allows healthcare providers to tailor screening and prevention personalized strategies for men and women.
2. Materials and Methods
2.1. Dataset Overview
Raw data from controls and patients were obtained from the Nurses’ Health Study (NHS), an all-female cohort, and the Health Professionals Follow-up Study (HPFS), an all-male cohort. Data are available at the database of Genotypes and Phenotypes (dbGaP) under accession phs000091.v2.p1 and were obtained with permission [15].
NHS and HPFS are well-established cohorts that are part of the Genes and Environment Initiatives (GENEVA). In addition to investigating the genetic factors contributing to the development of T2DM, they also aim to explore the role of environmental exposures. These cohorts offer a resource for studying the genetic and environmental factors associated with T2DM. Participants in both cohorts completed comprehensive mailed questionnaires regarding their medical history and lifestyle.
2.2. Variables
The variables used for analysis in this study include:
- Medical history variables: family history of diabetes among first-degree relatives (famdb), reported high blood pressure (hbp), reported high blood cholesterol at/before blood draw (chol)
- Intake variables: alcohol intake (alcohol)
- Nutrient variables: heme iron intake (heme), magnesium intake (magn), cereal fiber intake (ceraf), polyunsaturated fat intake (pufa), trans fat intake (trans), glycemic load (gl)
- Lifestyle variables: cigarette smoking (smk), exercise habits (total physical activity, act)
- Body measurements: body mass index (BMI or bmi)
- Gender (for total data)
Categorical variables are used as they are, with no numeric conversion applied for analysis.
2.3. Data preprocessing
The data contains information about the disease status of a total of 6,033 individuals: 3,429 females (NHS) and 2,604 males (HPFS). The analysis focused on white individuals. Participants of other races (158), Hispanic (37), those with other types of diabetes (133), individuals without genotype ID (25), and first-degree relatives (8) of the participants were excluded. The characteristics of the remaining 5,672 individuals, which includes both controls and T2DM individuals, are presented in Table 1.
2.4. PyCaret Analysis
PyCaret was used to analyze a dataset of 5,672 individuals with 14 phenotypic variables for the male and female datasets and 15 variables, including gender, in the total dataset. The dataset was divided into male and female subsets, and the performance and features of 16 machine learning (ML) classification algorithms were compared for each subset.
PyCaret analysis was performed in the following order: importing the necessary libraries and the data (as a .csv file), then preprocessing the data using PyCaret, displaying data features (numeric or categorical), and handling missing data. Since the missing values accounted for 3.5% of the total dataset, with a maximum rate of 1.5% in individual features, no data points were dropped. PyCaret used a simple imputation method to address the missing data.
Next, the classification command was used to compare the available classification algorithms. Once the results were available, the best algorithm was selected and performed 10-fold cross-validation for tuning the model’s hyperparameters. The model’s performance and robustness were evaluated using stratified 10-fold cross-validation with a train-test split ratio of 70:30. The analysis was implemented using the Anaconda Navigator IDE with Python in the Jupyter Notebook (version 6.5.2) editor, along with PyCaret (version 3.0.0), on a 64-bit Windows 11 computer.
The analysis provided the following evaluation metrics: accuracy, area under curve (AUC), recall, precision, F1-score, kappa score, Matthews Correlation Coefficient (MCC), and analysis time (TT). A variable importance graph was also produced. SHAP values graph was generated using subsequent commands.
Accuracy is the percentage of correct predictions out of all predictions. Precision is the percentage of correct positive predictions out of all positive predictions. Recall is the percentage of correct positive predictions out of all actual positives. The F1-score is a harmonic mean of precision and recall that balances both metrics. AUC (area under the curve) is a measure of how well a model can rank positive and negative examples correctly. The kappa score is a measure of agreement between the model’s predictions and the actual labels. MCC (Matthews correlation coefficient) is a balanced measure of performance that takes into account true positives, true negatives, false positives, and false negatives. The formulas for these metrics are:
Accuracy = (True Positives + True Negatives) / (Total Predictions)
Precision = True Positives / (True Positives + False Positives)
Recall = True Positives / (True Positives + False Negatives)
F1-score = 2 * (Precision * Recall) / (Precision + Recall)
2.5. Statistical Analysis
SPSS software (version 28.0.0.0; SPSS Inc., Chicago, IL, USA) was used to construct the tables and Real Statistics Resource Pack for Excel (version 8.8.2) [16] to analyze the numerical data, as SPSS does not provide more than 36 decimals or exact p-values for very low p-values. A chi-square test was used to examine the association between categorical variables using Chi-Square Test Calculator [17]. The independent samples t-test was used to compare the means of numerical variables between groups. Numerical variables were presented as means ± standard deviations (SD) and categorical variables as frequencies and percentages. The significance level was set at p < 0.05.
3. Results
3.1. The Results of The Statistical Analysis
The ages of the control and diabetic groups were similar. Statistical comparisons of the other numerical variables are provided in Table 1.
Overall, the table suggests that people with T2DM are more likely to have a higher body mass index, lower activity level, lower alcohol intake, lower cereal fiber intake, and higher heme intake.
Statistical comparisons of the categorical variables are provided in Table 2.
The findings suggest that certain factors may be associated with T2DM risk, such as having a family history of DM, high blood pressure, high cholesterol, and smoking status. It is important to note that this is an observational study, so it cannot establish causality. More research is needed to determine the causal relationships between these factors and T2DM.
3.2. The Results of the Machine Learning Analysis
The performance of 16 different machine learning models on a classification task for predicting diabetes in male-only, female-only, and total (male+female) data subsets is shown in Table 3, Table 4 and Table 5, respectively. The metrics used to evaluate the models are accuracy, AUC, recall, precision, F1-score, Kappa score, and MCC. The highest score for each metric and subset is highlighted in yellow.
Ridge classifier, linear discriminant analysis (LDA), and LR were the top-performing models for the male-only data subset (Table 3), with similar scores on metrics. However, ridge classifier could not distinguish between the positive and negative classes, as indicated by its zero AUC value. LDA and LR had higher AUC values of 0.77 than the other models.
For the female-only data subset (Table 4), LR, ridge classifier and LDA achieved the best results on the analysis metrics. LDA had the highest AUC value of 0.79, followed by LR with the similiar AUC value of 0.79. Ada Boost and CatBoost classifier had marginally lower AUC values of 0.77 each.
For the total data subset (Table 5), LR, Gradient Boosting Classifier (GBC), and CatBoost classifier were the best models on the analysis metrics. LR had the highest AUC values of 0.79, followed by GBC, and CatBoost classifier with a slightly lower AUC value of 0.78.
3.3. The Results of the Feature Importance Plot
The feature importance plot in Figure 1 for the female-only data subset shows that the most informative feature for the prediction model. “famdb”, which has a variable importance of approximately 1.15. This means that this feature has a strong influence on the model’s performance, and removing or shuffling it would significantly reduce the accuracy or increase the error of the model. The other features, such as “smoker_never”, “hbp”, “smoker_past”, and “chol”, are the next most important features, with values between 0.4 and 1.1. It is important to note that this is just one interpretation of the variable importance plot.
Figure 2 shows the feature importance plot for the male only data subset. The most important feature for the prediction model is famdb, which has a variable importance of approximately 0.45. The other features that follow in terms of importance are hbp, smoker_current, chol, smoker_never, heme, and bmi. It can be noted that the value of the variables for males in the feature importance plot is lower than that for females.
The Figure 3 shows that the most important feature for the prediction model is “smoker_never”, which has a variable importance of approximately 1.25 in total (female+male). The other features have variable importance values between 0.0 and 1.15, indicating that they have varying degrees of influence on the model’s performance. Some features, such as “famdb”, “smoker_past”, “hbp”, “smoker_current”, “chol”, and “gender” have relatively high variable importance values, suggesting that they are important for the model. Other features, such as “bmi”, “pufa”, “trans”, and “alcohol” have relatively low variable importance values, suggesting that they are less important for the prediction model.
By comparing the three figures, it is possible to observe how the importance of each feature varies across different data subsets. It can be noted that “gender” is one of the important factors for predicting diabetes in the total dataset, suggesting that gender is an important feature for modeling.
3.4. SHAP Analysis
SHAP values correlation analysis was performed for variables with T2DM using PyCaret analysis. Since the SHAP value function is only compatible with tree-based models for binary classification, the best-performing one was chosen from among decision tree (dt), CatBoost, XGBoost, Extra Trees (et), LightGBM, and random forest (rf) to plot the SHAP values graph. Therefore, the CatBoost algorithm, which had the highest score among the tree-based models, was used for SHAP analysis. The results of the SHAP analysis are shown in Figure 4, Figure 5 and Figure 6 for the female-only, male-only, and total (female+male) datasets, respectively.
SHAP is a theoretical approach to explaining the model output of a machine learning model in a relatively easy way. SHAP values show the distribution of impacts that each feature has on the model output. They show which features are most crucial for the model’s performance. Unlike ROC and AUC analysis, SHAP values do not show the model performance, but rather interpret the impact of having a certain value for a given feature compared to the prediction we would make if that feature took some baseline value [18]. The y-axis shows the features of the model, and the x-axis is the SHAP value of the associated features. The color represents the value of the feature, with red being high and blue being low. The higher the SHAP value is (x-axis), the higher the likelihood of the positive class, which means it has more impact on the model’s output.
In the figures, the blue section indicates that lower feature values have higher SHAP values, meaning that they increase the probability of diabetes. The red section indicates that higher feature values have higher SHAP values, meaning that they decrease the probability of diabetes. The pink section indicates that there is no clear relationship between feature values and SHAP values.
4. Discussion
ML algorithms, which are a set of rules that do not require explicit programming, allow computers to learn and make predictions from data. They are used for a variety of applications, such as natural language processing, image recognition, fraud detection, and disease prediction [19]. In the past, the use of most prevalent ML algorithms simultaneously was infeasible due to the need for programming expertise and time-consuming testing. However, developments in information technologies have made it possible to run ML algorithms without knowing much code and to analyze many ML algorithms simultaneously.
Machine learning and statistical analysis were applied in the current study to investigate the factors associated with T2DM in the NHS and HPFS datasets. PyCaret classification analysis [14] was used as a machine learning tool to run 16 classification algorithms simultaneously with minimal coding to predict T2DM. The performance of the models was evaluated using various metrics, such as accuracy, AUC, recall, precision, F1-score, kappa, MCC, and TT (Sec). Feature importance plots and SHAP values were used to interpret the models and identify the most relevant features for the prediction.
The ridge classifier, LDA, and LR exhibited the best performance among models for the male-only data subset, all achieving similar scores. In contrast, for the female-only data subset LR, ridge, and LDA were the top-performing models, also with similar scores. In the total data subset, LR, GBC, and CatBoost classifier emerged as the best-performing models demonstrating comparable scores.
The feature importance plot, one of the most commonly used explanation tools in machine learning analysis, was also utilized [20]. This tool shows how much each feature contributes to the prediction model, based on the change in accuracy or error when the feature is removed or shuffled [21]. The higher the variable importance, the more important the feature is for the model. However, this tool does not imply any causal relationship between the features and the outcome, as there may be other factors or interactions that affect the model. A feature may have a high statistical significance, but a low variable importance, if it does not improve the prediction model much.
The feature importance plot aids in understanding relevant features for the prediction model and identifying irrelevant or redundant ones. Additionally, it assists in selecting or eliminating features to enhance or simplify the model. However, it should be noted that the feature importance plot may vary depending on the type of machine learning technique, the dataset, and the evaluation metric used for measuring the model’s performance. Therefore, it should be interpreted with caution and in conjunction with other methods of machine learning analysis. The feature importance plot showed that features had different importance values for the prediction model in different data subsets. The most important features were “famdb”, “smoker_never”, and “hbp” in the female-only data subset, and “famdb”, “hbp”, and “smoker_current” in the male-only data subset. Furthermore, the order of the variables and their values differ across genders.
SHAP values correlation analysis was also performed for variables with T2DM using PyCaret analysis. SHAP values show how each feature affects the model output. It can be a useful visual tool for understanding how machine learning models work and for identifying the most important features for a given prediction task. The SHAP values plot showed the distribution of impacts that each feature had on the model output. The color represented the value of the feature, with red being high and blue being low. The higher the SHAP value was (x-axis), the higher the likelihood of positive class. The SHAP values plot also showed some interactions between features that affected the model output.
Dinh et al. used 123 variables for 1999-2014, and 168 variables for 2003-2014, including survey questionnaire and laboratory results [11]. They found that AUC was 73.7% and 84.4% without and with the laboratory data for prediabetic individuals, respectively. In the other study, Lai et al. found that the GBM and Logistic Regression model performed better than the Random Forest and Decision Tree models. However, they used several laboratory data, such as fasting blood glucose, in their models as well as BMI, high-density lipoprotein (HDL), and triglycerides as the most important predictors [22]. The well-known Framingham Diabetes Risk Scoring Model (FDRSM) is a simple clinical model that uses eight factors: gender, age, fasting blood glucose, blood pressure, triglycerides, HDL, BMI, and parental history of diabetes; in order to predict the 8-year risk for developing diabetes by logistic regression models [23,24]. They also used 2-hour post-OGTT in complex clinical models [24]. While AUC was 0.72 in the simple model, it increased to 0.85 in the complex clinical model. The use of either blood glucose levels or OGTT in model creation clearly has a significant impact on model performance alone. However, it is crucial to establish the predictive effectiveness of variables prior to the onset of elevated blood glucose levels. An AUC of 0.79 was obtained in ML analysis conducted on the total dataset in the current study. The relatively lower performance can be attributed to the use of fewer variables, especially phenotypic variables instead of direct glucose or OGTT measurements, and less laboratory data in the current models. Moreover, the current approach employed a broader range of ML algorithms compared to previous studies, enabling a comprehensive comparison and selection of the most effective methodologies. Utilizing PyCaret for ML algorithms streamlined the process by automating data processing and model evaluation steps. Therefore, differences between this and other studies primarily stem from variations in the nature of the data.
An in-depth investigation into the predictive potential of phenotypic variables for T2DM was conducted. To complement the current ML approach, a rigorous statistical analysis was undertaken to assess the inferential strength of each individual variable. Statistical analysis tests hypotheses and infers causal relationships between individual variables and diabetes risk, while ML builds models and makes predictions based on the data, without necessarily explaining how the data is related or what causes the outcome [25]. However, statistical methods do not capture the nonlinear and interactive effects of multiple variables on diabetes risk. In contrast, ML algorithms can uncover intricate patterns and interactions within the data, which are not evident through conventional statistical measures alone. Therefore, the complementary strengths of both statistics and ML were leveraged to provide a more comprehensive understanding of the predictive factors for T2DM, allowing for prioritization of variables that may have been overlooked by traditional statistical analysis. As Bennett et al. suggest, ML and statistical analysis are different but complementary methods that can provide different insights into the data, depending on the research question and the data available [25].
Furthermore, gender differences in diabetes risk and outcomes have been extensively reviewed in previous studies [26]. However, most of these investigations have primarily focused on the role of sex hormones, sex chromosomes, or sex-specific environmental factors in explaining these disparities. This study aimed to investigate whether phenotypic variables, including BMI, blood pressure, and lipid levels, demonstrate distinct predictive patterns for diabetes risk among males and females. Leveraging ML techniques, a substantial dataset comprising phenotypic variables was analyzed from individuals with and without T2DM. The current findings revealed that certain phenotypic variables displayed varying degrees of predictive power for diabetes risk across genders. Notably, variables like famdb, hbp, and chol exhibited higher feature importance scores for females than for males, whereas heme emerged as a more significant predictor for men compared to women if we disregard smoking status in the modeling. Furthermore, the feature importance analysis also revealed gender as one of the significant factors in the overall dataset. These results suggest that phenotypic variables can capture certain facets of sex-specific pathophysiological aspects of diabetes and have the potential to enhance the accuracy and personalization of diabetes risk prediction models. Further studies are needed to validate the current findings and delve into the underlying mechanisms contributing to the sex differences observed in phenotypic-based diabetes prediction.
5. Conclusions
In conclusion, this study successfully demonstrated the utility of PyCaret for T2DM prediction. However, it also highlighted the limitations of phenotypic variables in T2DM prediction due to their relatively low predictive power. The combination of genotypic and phenotypic data holds promise for early T2DM detection. Previous research has demonstrated the feasibility of genotype-based T2DM prediction with high accuracy using logistic regression [10]. Automated machine learning frameworks, capable of employing multiple sophisticated algorithms simultaneously, offer an avenue for novel analyses integrating genotype and phenotype data. PyCaret empowers scientists with limited coding expertise to conduct comprehensive data analysis in T2DM research, facilitating a more efficient approach. By automating the entire workflow of building and deploying ML models, enabling researchers to leverage these powerful tools for diabetes research.
Author Contributions
Conceptualization, F.H. and S.G.; methodology, S.G.; software, S.G.; validation, K.A.; formal analysis, S.G.; investigation, S.G.; resources, K.A.; data curation, S.G.; writing—original draft preparation, S.G.; writing—review and editing, K.A., F.H.; visualization, S.G., K.A.; supervision, F.H.; project administration, F.H. All authors have read and agreed to the published version of the manuscript.
Funding
This research received no external funding.
Institutional Review Board Statement
Not applicable.
Informed Consent Statement
Informed consent for GENEVA was obtained from the participants included in the dataset.
Data Availability Statement
phs000091 samples are available from the https://www.ncbi.nlm.nih.gov/gap database (accession number: phs000091.v2.p1).
Acknowledgments
The authors would like to express their gratitude to all the participants of the Nurses’ Health Studies (NHS) and the Health Professionals Follow-up Study (HPFS) for their continued cooperation.
Conflicts of Interest
The authors declare no conflicts of interest.
References
- Hill-Briggs, F.; Adler, N.E.; Berkowitz, S.A.; Chin, M.H.; Gary-Webb, T.L.; Navas-Acien, A.; Thornton, P.L.; Haire-Joshu, D. Social Determinants of Health and Diabetes: A Scientific Review. Diabetes Care 2021, 44, 258–279. [CrossRef]
- Deberneh, H.M.; Kim, I. Prediction of Type 2 Diabetes Based on Machine Learning Algorithm. Int. J. Environ. Res. Public. Health 2021, 18, 3317. [CrossRef]
- Rajula, H.S.R.; Verlato, G.; Manchia, M.; Antonucci, N.; Fanos, V. Comparison of Conventional Statistical Methods with Machine Learning in Medicine: Diagnosis, Drug Development, and Treatment. Medicina (Mex.) 2020, 56, 455. [CrossRef]
- Bzdok, D.; Altman, N.; Krzywinski, M. Statistics versus Machine Learning. Nat. Methods 2018, 15, 233–234. [CrossRef]
- Spooner, A.; Chen, E.; Sowmya, A.; Sachdev, P.; Kochan, N.A.; Trollor, J.; Brodaty, H. A Comparison of Machine Learning Methods for Survival Analysis of High-Dimensional Clinical Data for Dementia Prediction. Sci. Rep. 2020, 10, 20410. [CrossRef]
- Yu, W.; Liu, T.; Valdez, R.; Gwinn, M.; Khoury, M.J. Application of Support Vector Machine Modeling for Prediction of Common Diseases: The Case of Diabetes and Pre-Diabetes. BMC Med. Inform. Decis. Mak. 2010, 10, 16. [CrossRef]
- Anderson, J.P.; Parikh, J.R.; Shenfeld, D.K.; Ivanov, V.; Marks, C.; Church, B.W.; Laramie, J.M.; Mardekian, J.; Piper, B.A.; Willke, R.J.; et al. Reverse Engineering and Evaluation of Prediction Models for Progression to Type 2 Diabetes: An Application of Machine Learning Using Electronic Health Records. J. Diabetes Sci. Technol. 2016, 10, 6–18. [CrossRef]
- Cahn, A.; Shoshan, A.; Sagiv, T.; Yesharim, R.; Goshen, R.; Shalev, V.; Raz, I. Prediction of Progression from Pre-Diabetes to Diabetes: Development and Validation of a Machine Learning Model. Diabetes Metab. Res. Rev. 2020, 36, e3252. [CrossRef]
- Shin, J.; Lee, J.; Ko, T.; Lee, K.; Choi, Y.; Kim, H.-S. Improving Machine Learning Diabetes Prediction Models for the Utmost Clinical Effectiveness. J. Pers. Med. 2022, 12, 1899. [CrossRef]
- Gül, H.; Aydin Son, Y.; Açikel, C. Discovering Missing Heritability and Early Risk Prediction for Type 2 Diabetes: A New Perspective for Genome-Wide Association Study Analysis with the Nurses’ Health Study and the Health Professionals’ Follow-Up Study. Turk. J. Med. Sci. 2014, 44, 946–954. [CrossRef]
- Dinh, A.; Miertschin, S.; Young, A.; Mohanty, S.D. A Data-Driven Approach to Predicting Diabetes and Cardiovascular Disease with Machine Learning. BMC Med. Inform. Decis. Mak. 2019, 19, 211. [CrossRef]
- Viloria, A.; Herazo-Beltran, Y.; Cabrera, D.; Pineda, O.B. Diabetes Diagnostic Prediction Using Vector Support Machines. Procedia Comput. Sci. 2020, 170, 376–381. [CrossRef]
- Wang, L.; Wang, X.; Chen, A.; Jin, X.; Che, H. Prediction of Type 2 Diabetes Risk and Its Effect Evaluation Based on the XGBoost Model. Healthcare 2020, 8, 247. [CrossRef]
- Ali, M. PyCaret: An Open Source, Low-Code Machine Learning Library in Python. PyCaret Version 2020, 2.
- https://www.ncbi.nlm.nih.gov/projects/gap/cgi-bin/study.cgi?study_id=phs000091.v2.p1.
- Zaiontz, C. Real Statistics Resource Pack for Excel.
- Stangroom, J. Chi-Square Test Calculator.
- Chen, G.; Dai, X.; Zhang, M.; Tian, Z.; Jin, X.; Mei, K.; Huang, H.; Wu, Z. Machine Learning-Based Prediction Model and Visual Interpretation for Prostate Cancer. BMC Urol. 2023, 23, 164. [CrossRef]
- Sarker, I.H. Machine Learning: Algorithms, Real-World Applications and Research Directions. SN Comput. Sci. 2021, 2, 160. [CrossRef]
- Bhatt, U.; Xiang, A.; Sharma, S.; Weller, A.; Taly, A.; Jia, Y.; Ghosh, J.; Puri, R.; Moura, J.M.F.; Eckersley, P. Explainable Machine Learning in Deployment. 2019. [CrossRef]
- Saarela, M.; Jauhiainen, S. Comparison of Feature Importance Measures as Explanations for Classification Models. SN Appl. Sci. 2021, 3, 272. [CrossRef]
- Lai, H.; Huang, H.; Keshavjee, K.; Guergachi, A.; Gao, X. Predictive Models for Diabetes Mellitus Using Machine Learning Techniques. BMC Endocr. Disord. 2019, 19, 101. [CrossRef]
- Mashayekhi, M.; Prescod, F.; Shah, B.; Dong, L.; Keshavjee, K.; Guergachi, A. Evaluating the Performance of the Framingham Diabetes Risk Scoring Model in Canadian Electronic Medical Records. Can. J. Diabetes 2015, 39, 152–156. [CrossRef]
- Wilson, P.W.F.; Meigs, J.B.; Sullivan, L.; Fox, C.S.; Nathan, D.M.; D’Agostino, R.B. Prediction of Incident Diabetes Mellitus in Middle-Aged Adults: The Framingham Offspring Study. Arch. Intern. Med. 2007, 167, 1068–1074. [CrossRef]
- Bennett, M.; Hayes, K.; Kleczyk, E.J.; Mehta, R. Similarities and Differences between Machine Learning and Traditional Advanced Statistical Modeling in Healthcare Analytics. 2022. [CrossRef]
- Deutsch, A.J.; Ahlqvist, E.; Udler, M.S. Phenotypic and Genetic Classification of Diabetes. Diabetologia 2022, 65, 1758–1769. [CrossRef]
Figure 1.
Feature importance plot for female only.
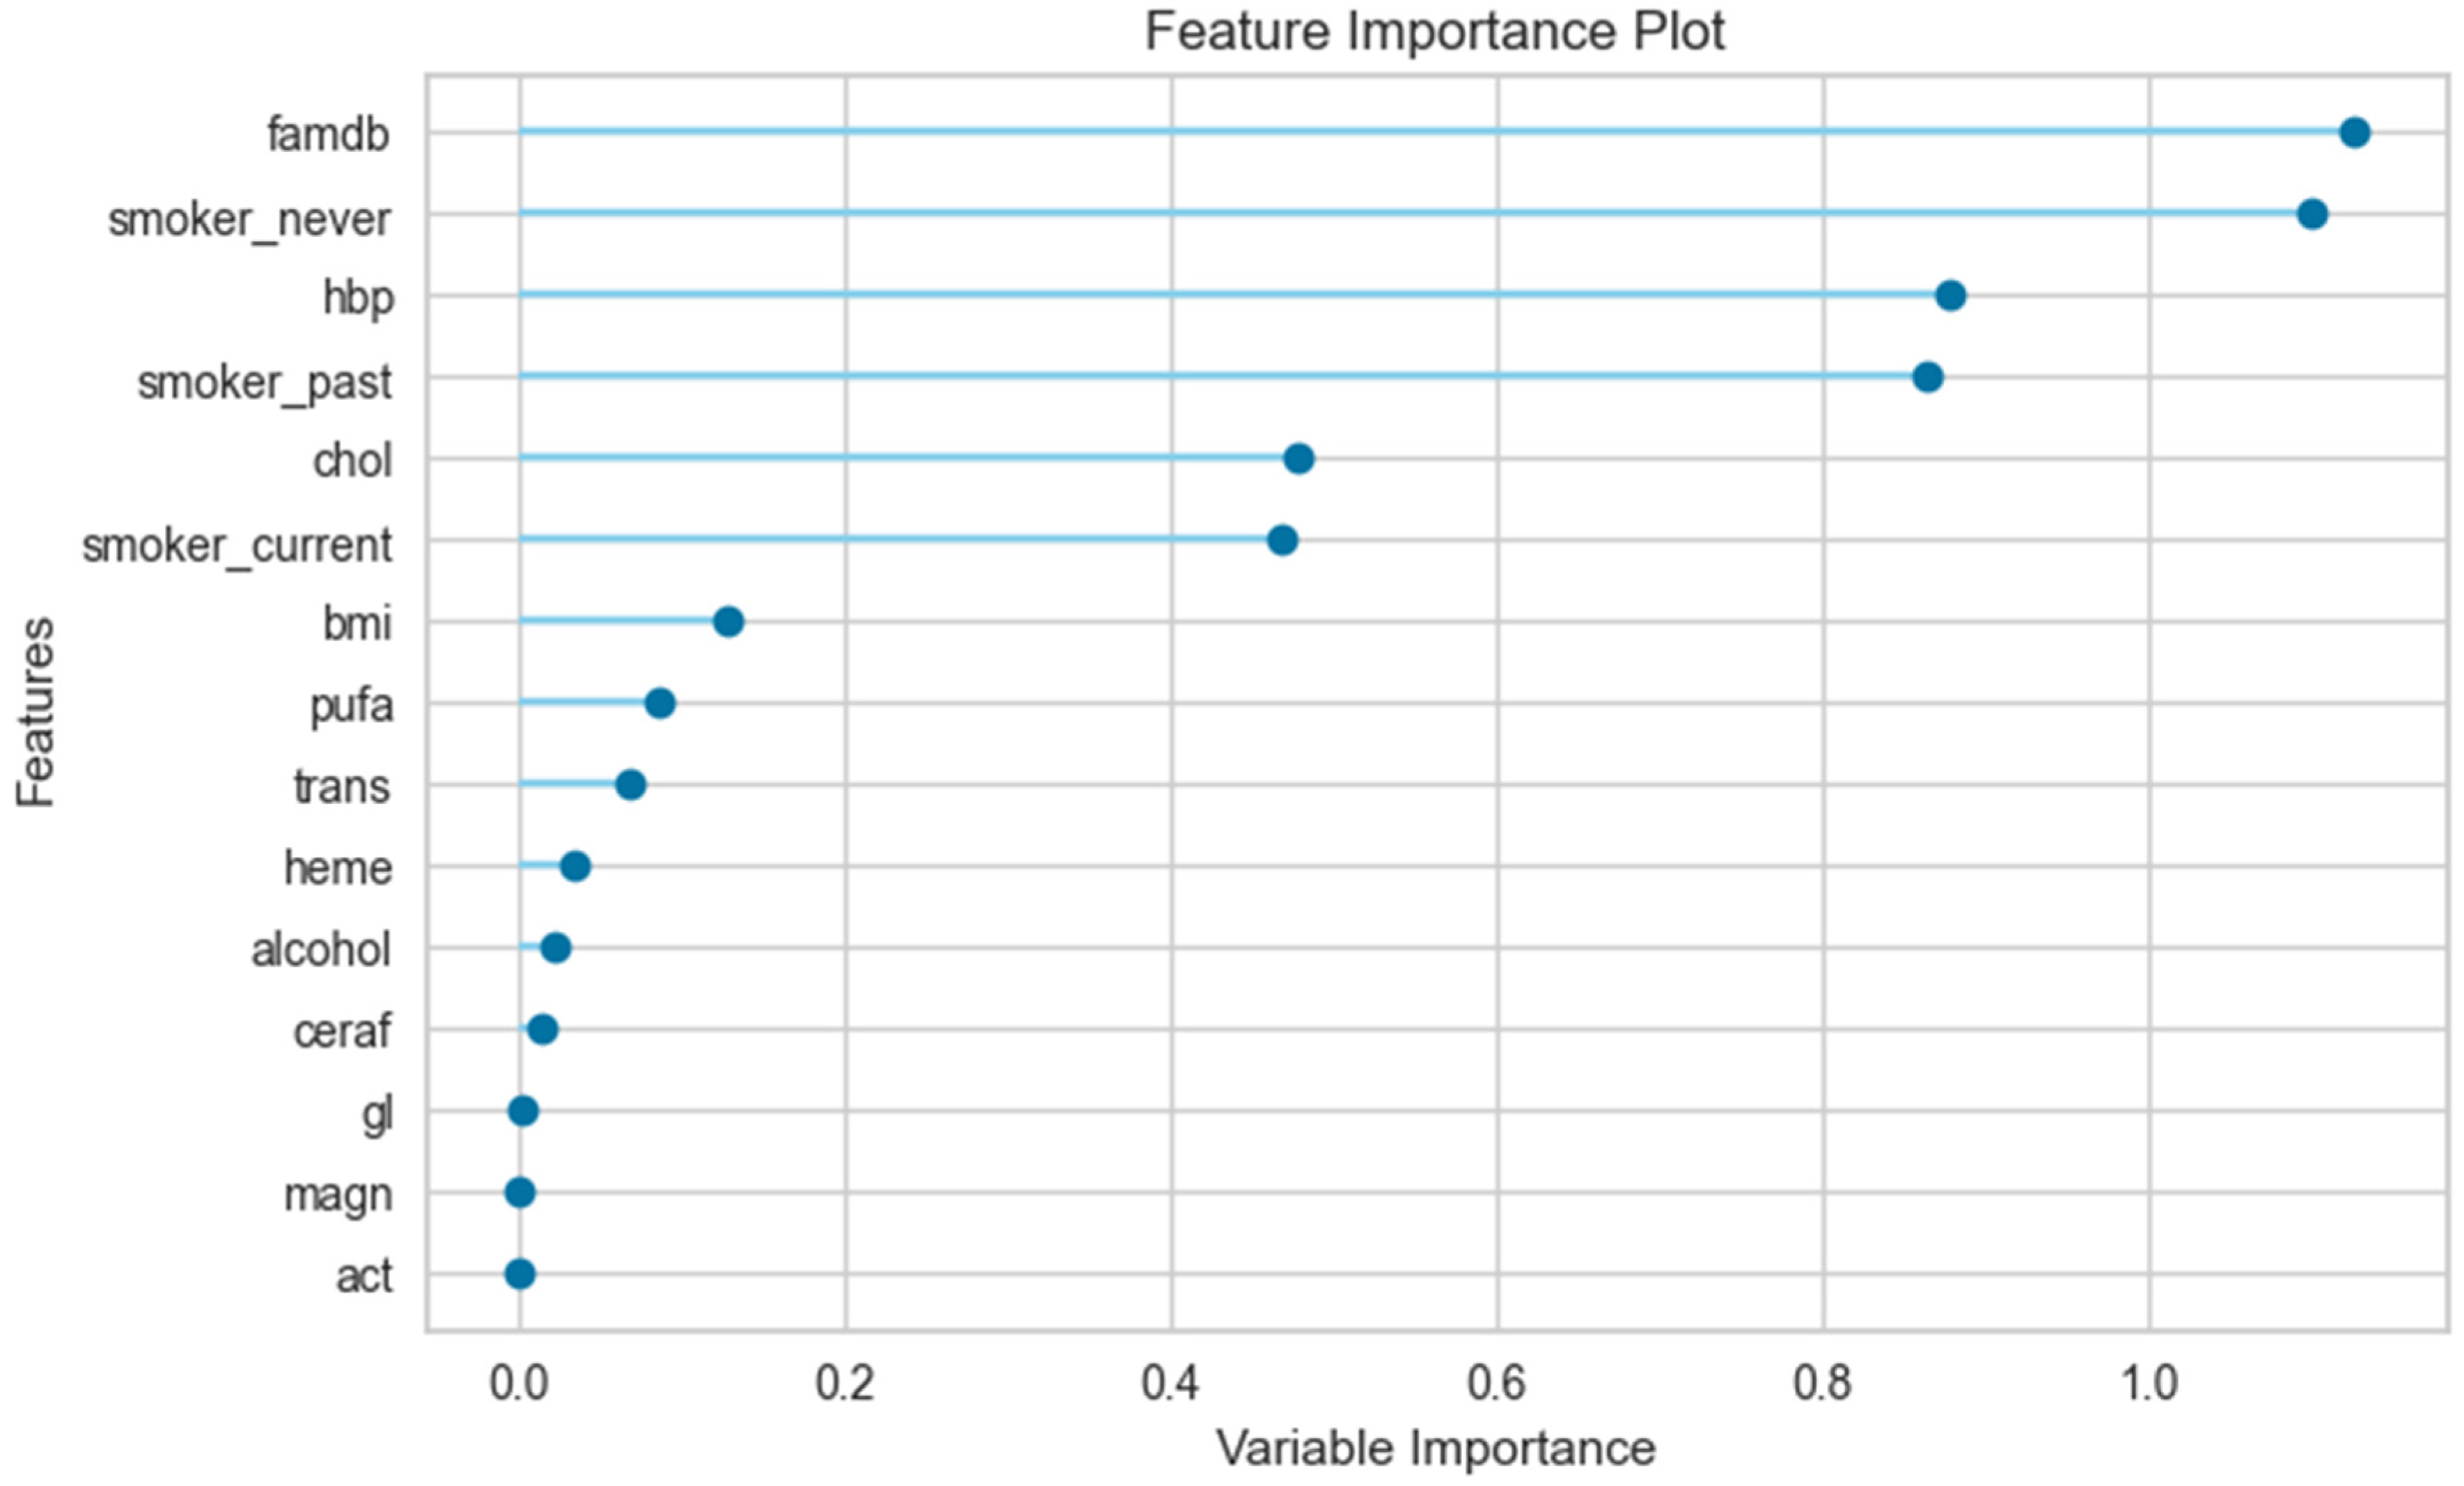
Figure 2.
Feature importance plot for male only.
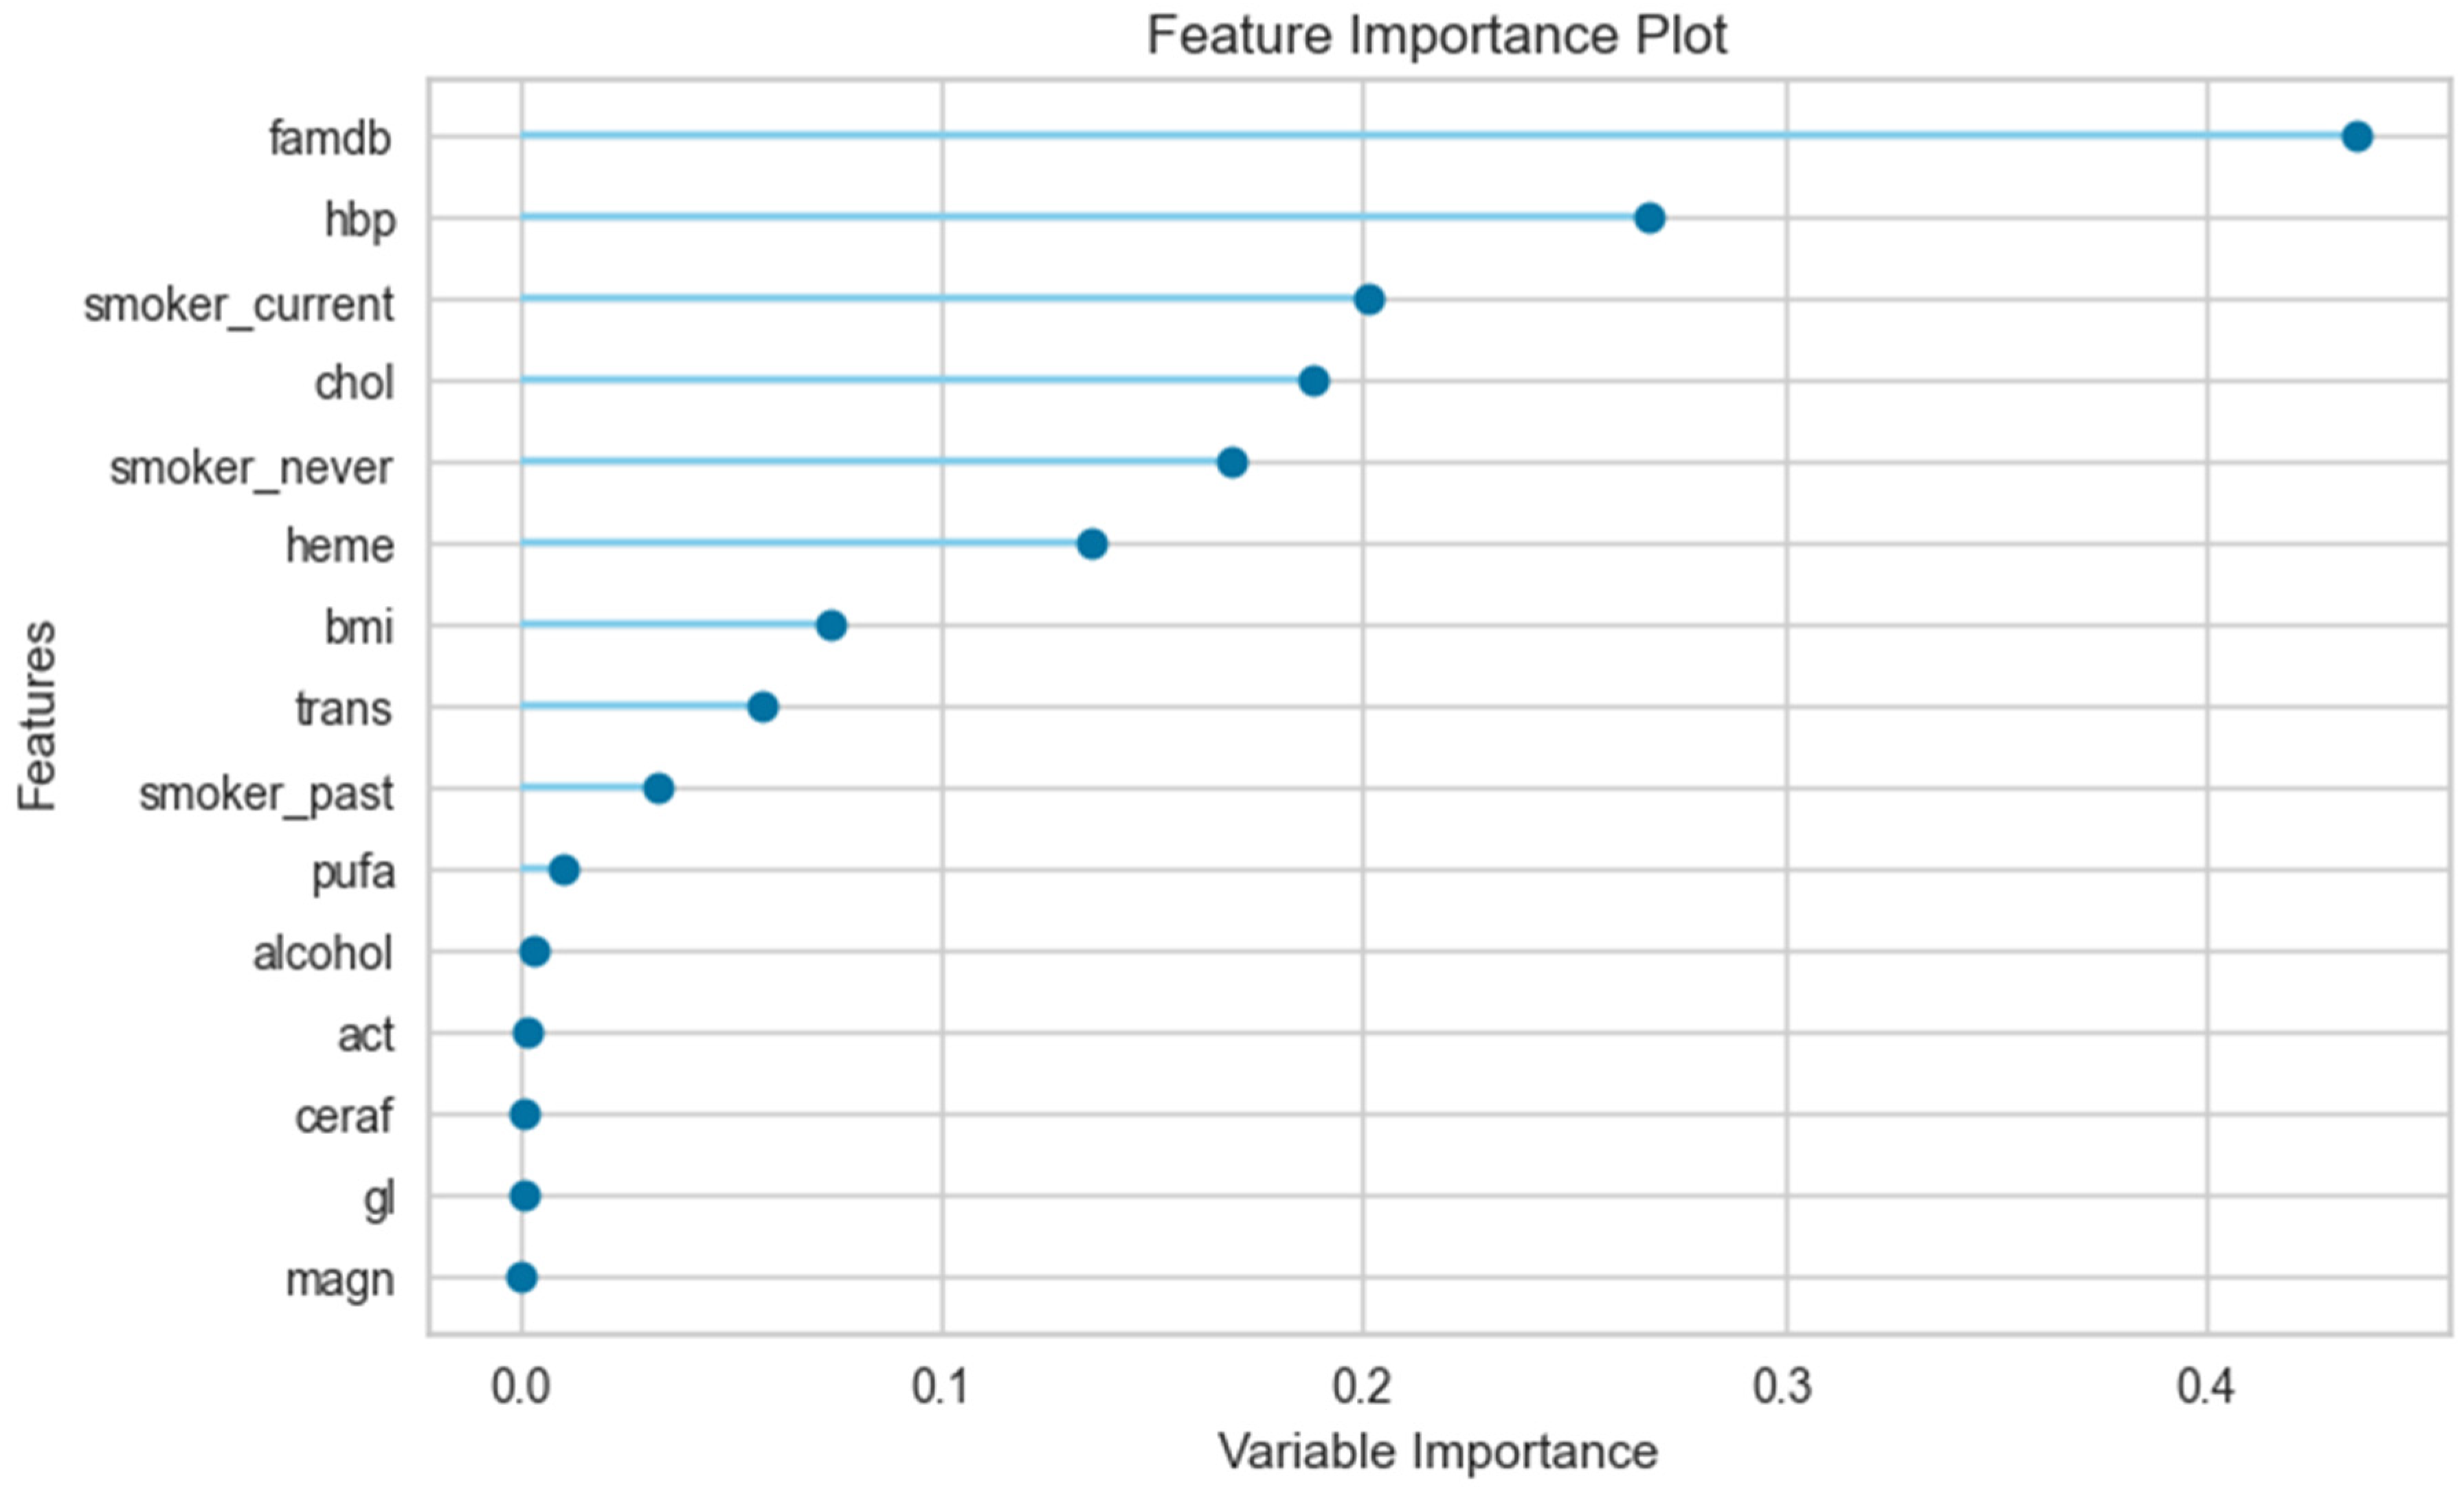
Figure 3.
Feature importance plot for total (female+male).
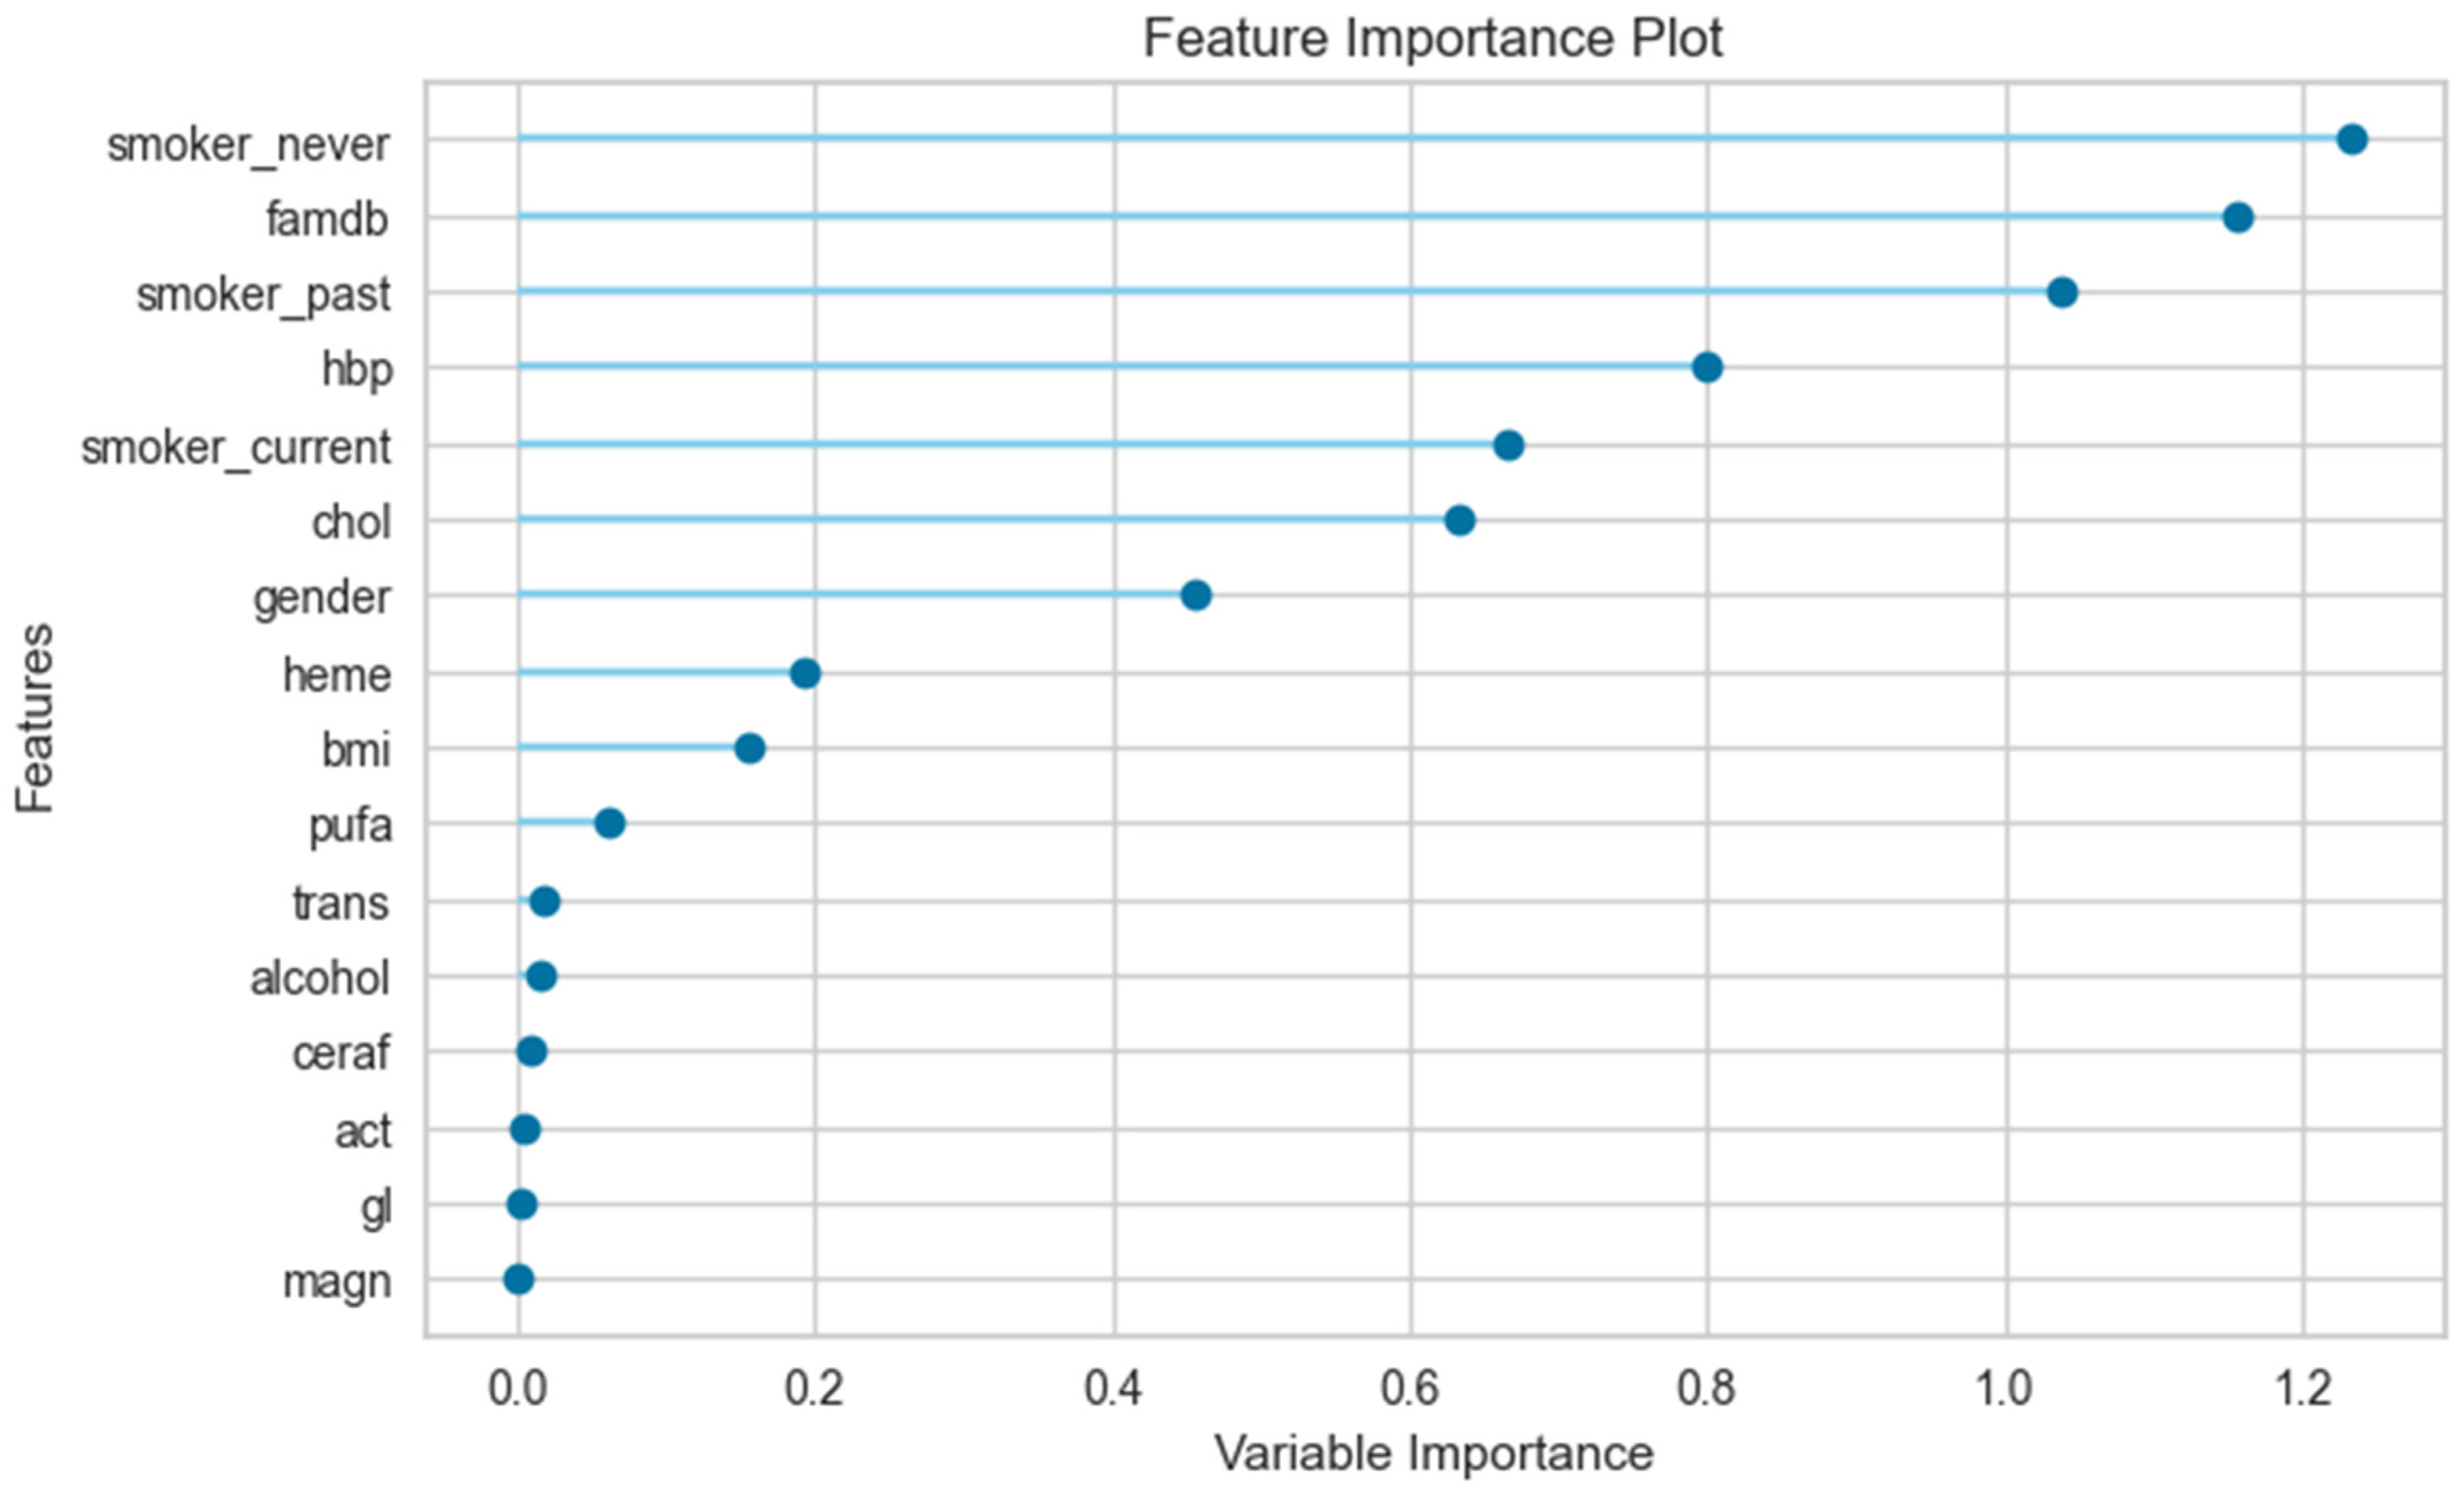
Figure 4.
SHAP values for female only.
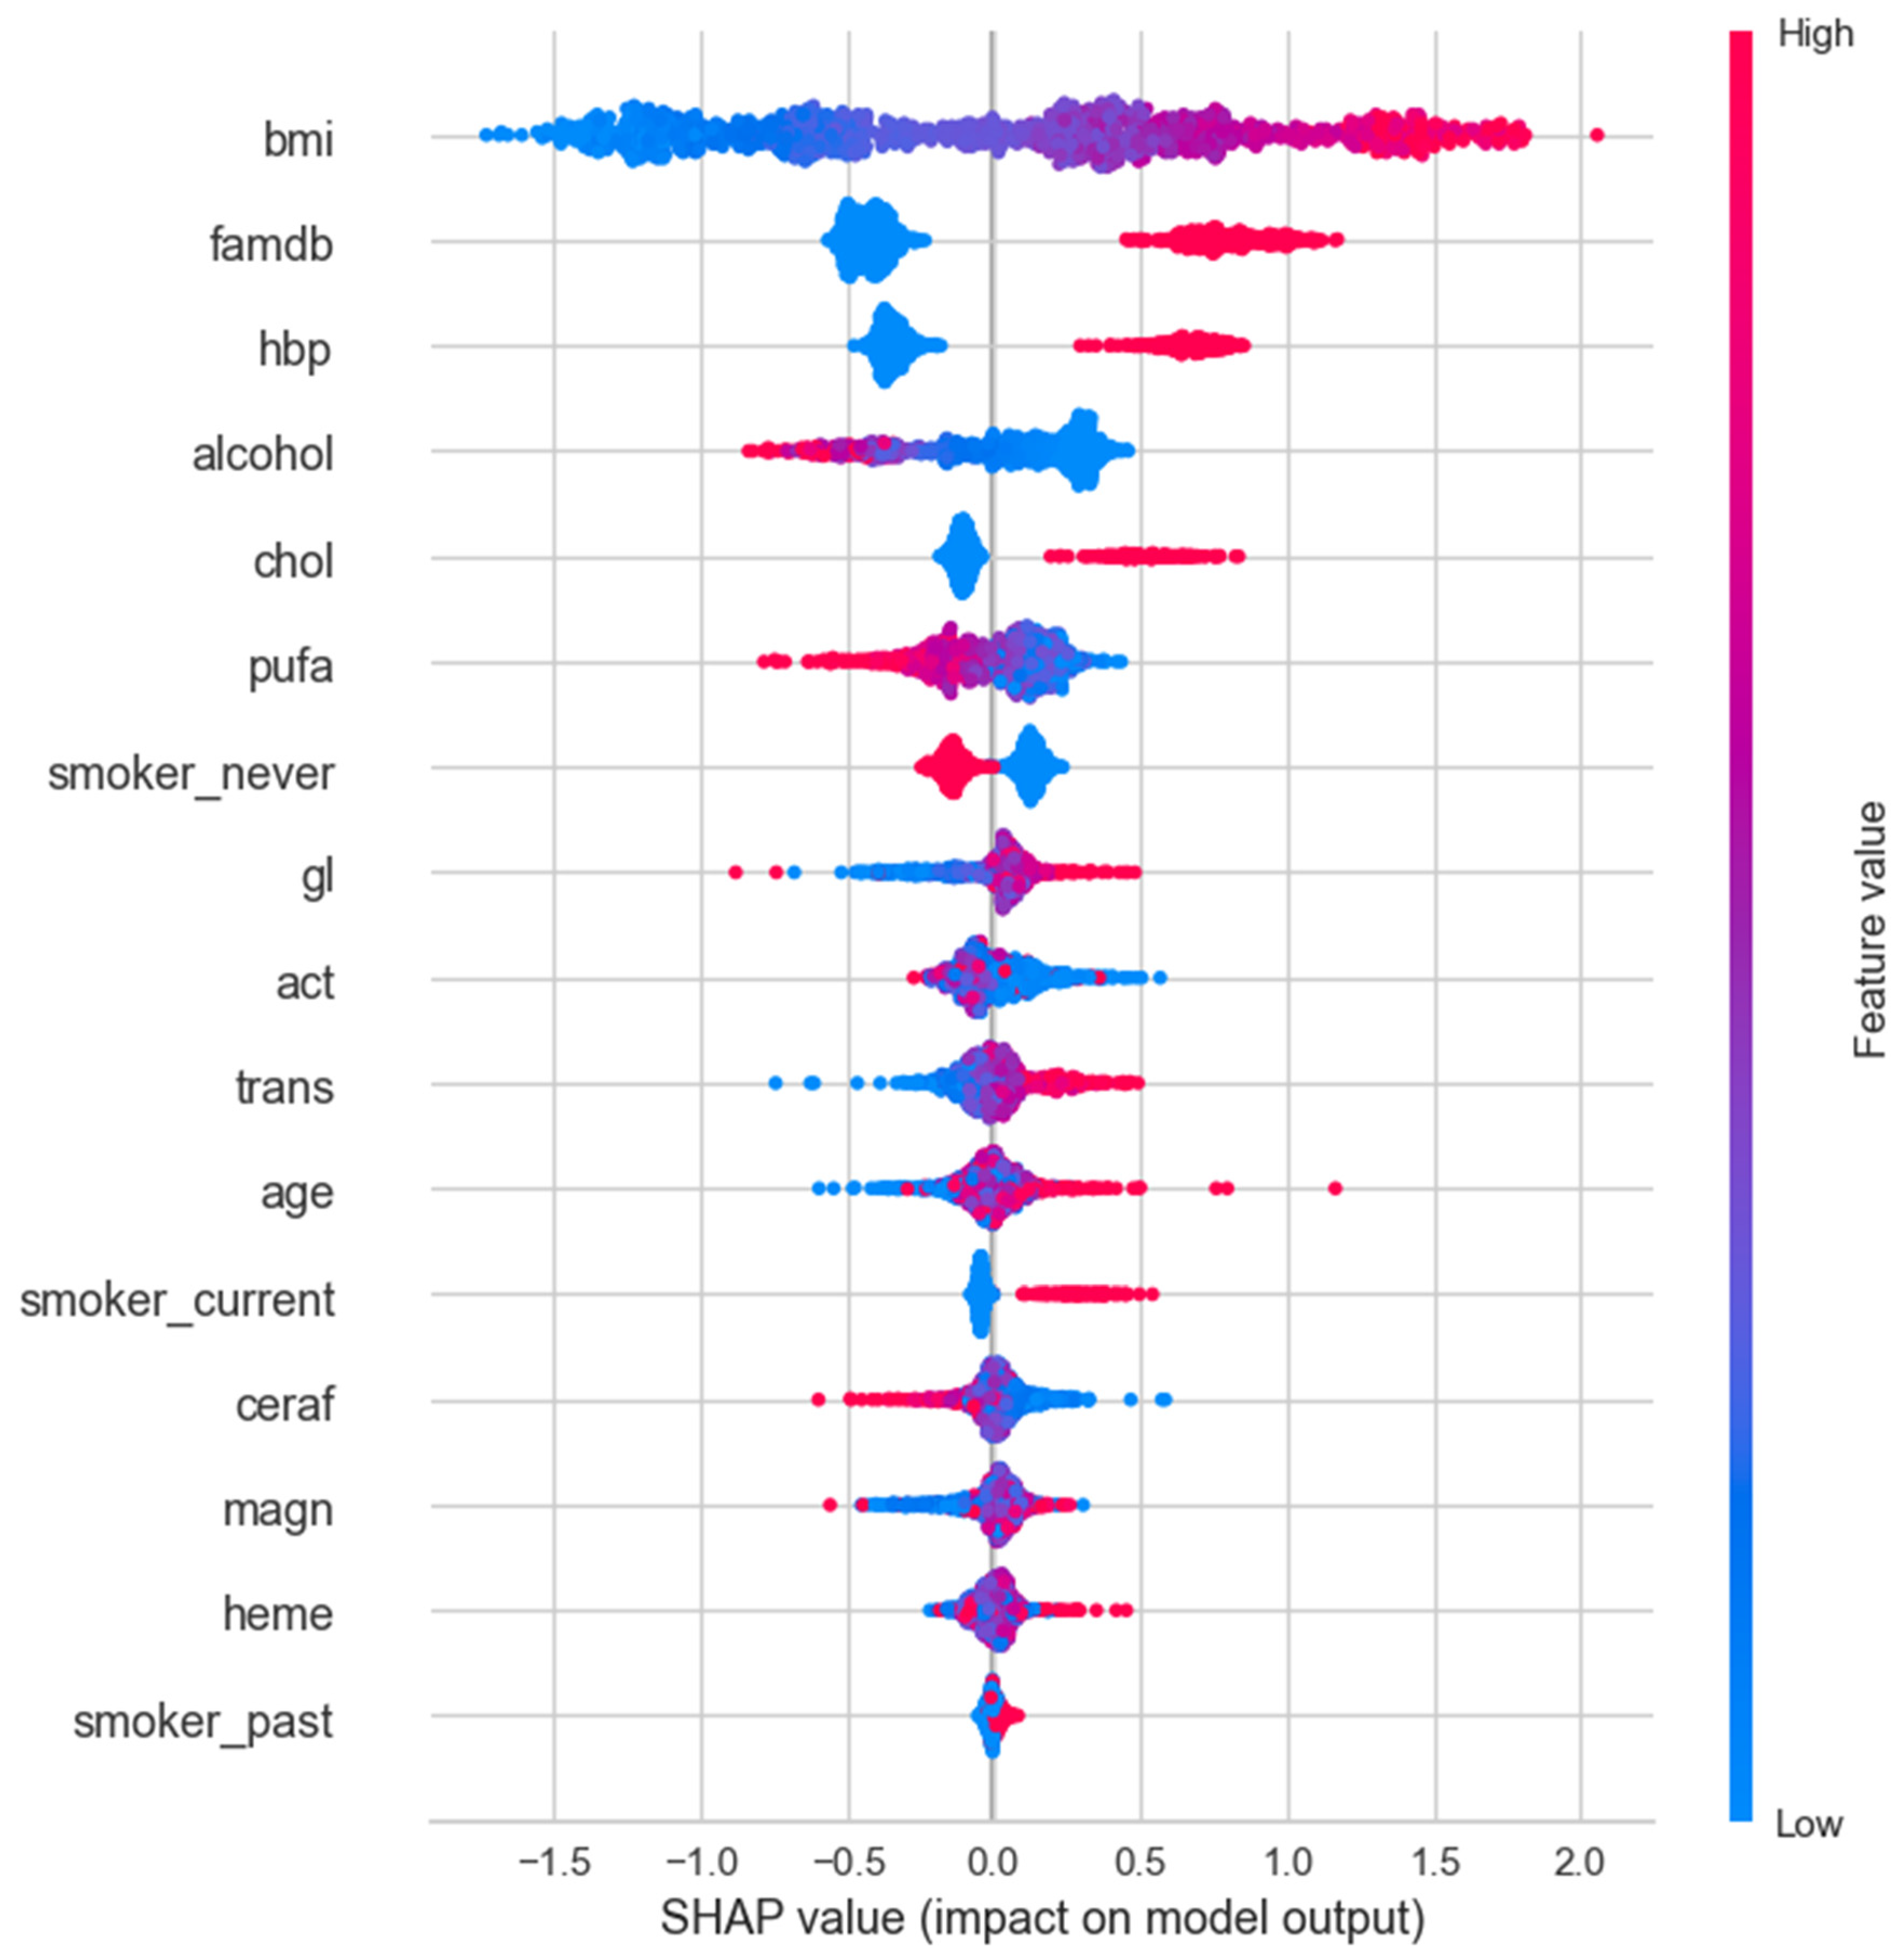
Figure 5.
SHAP values for male only.
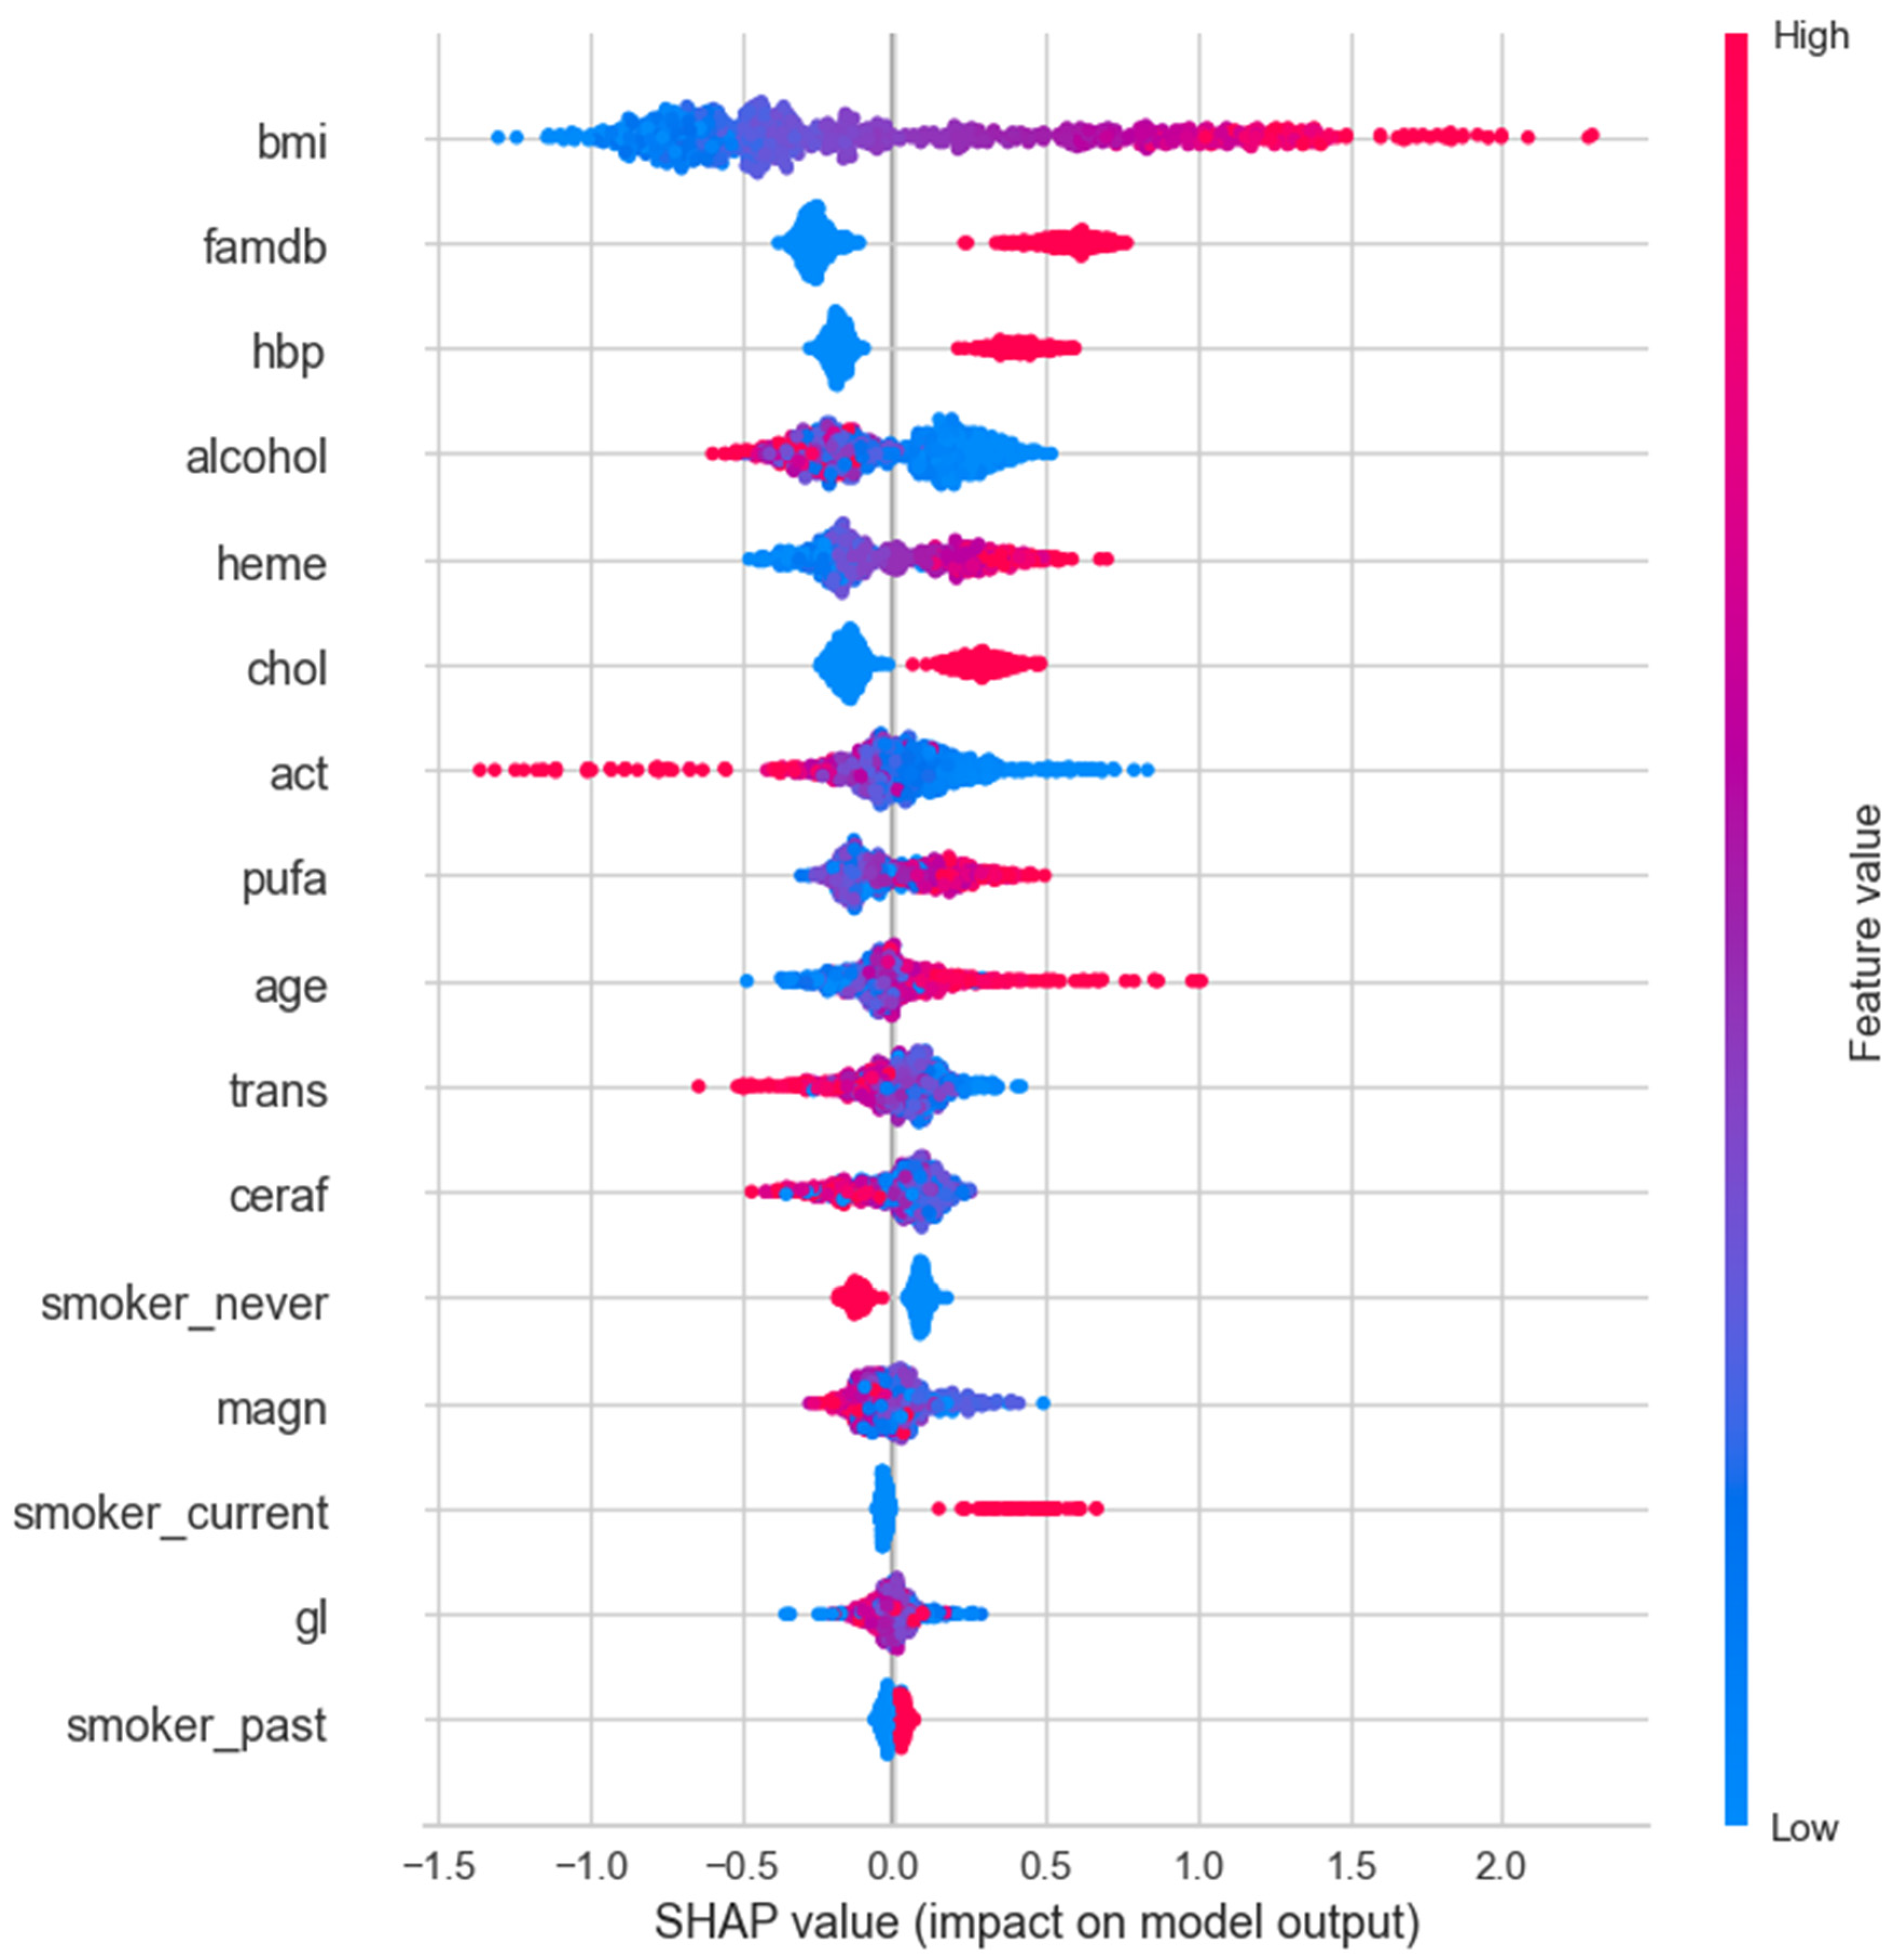
Figure 6.
SHAP values for total (female+male).
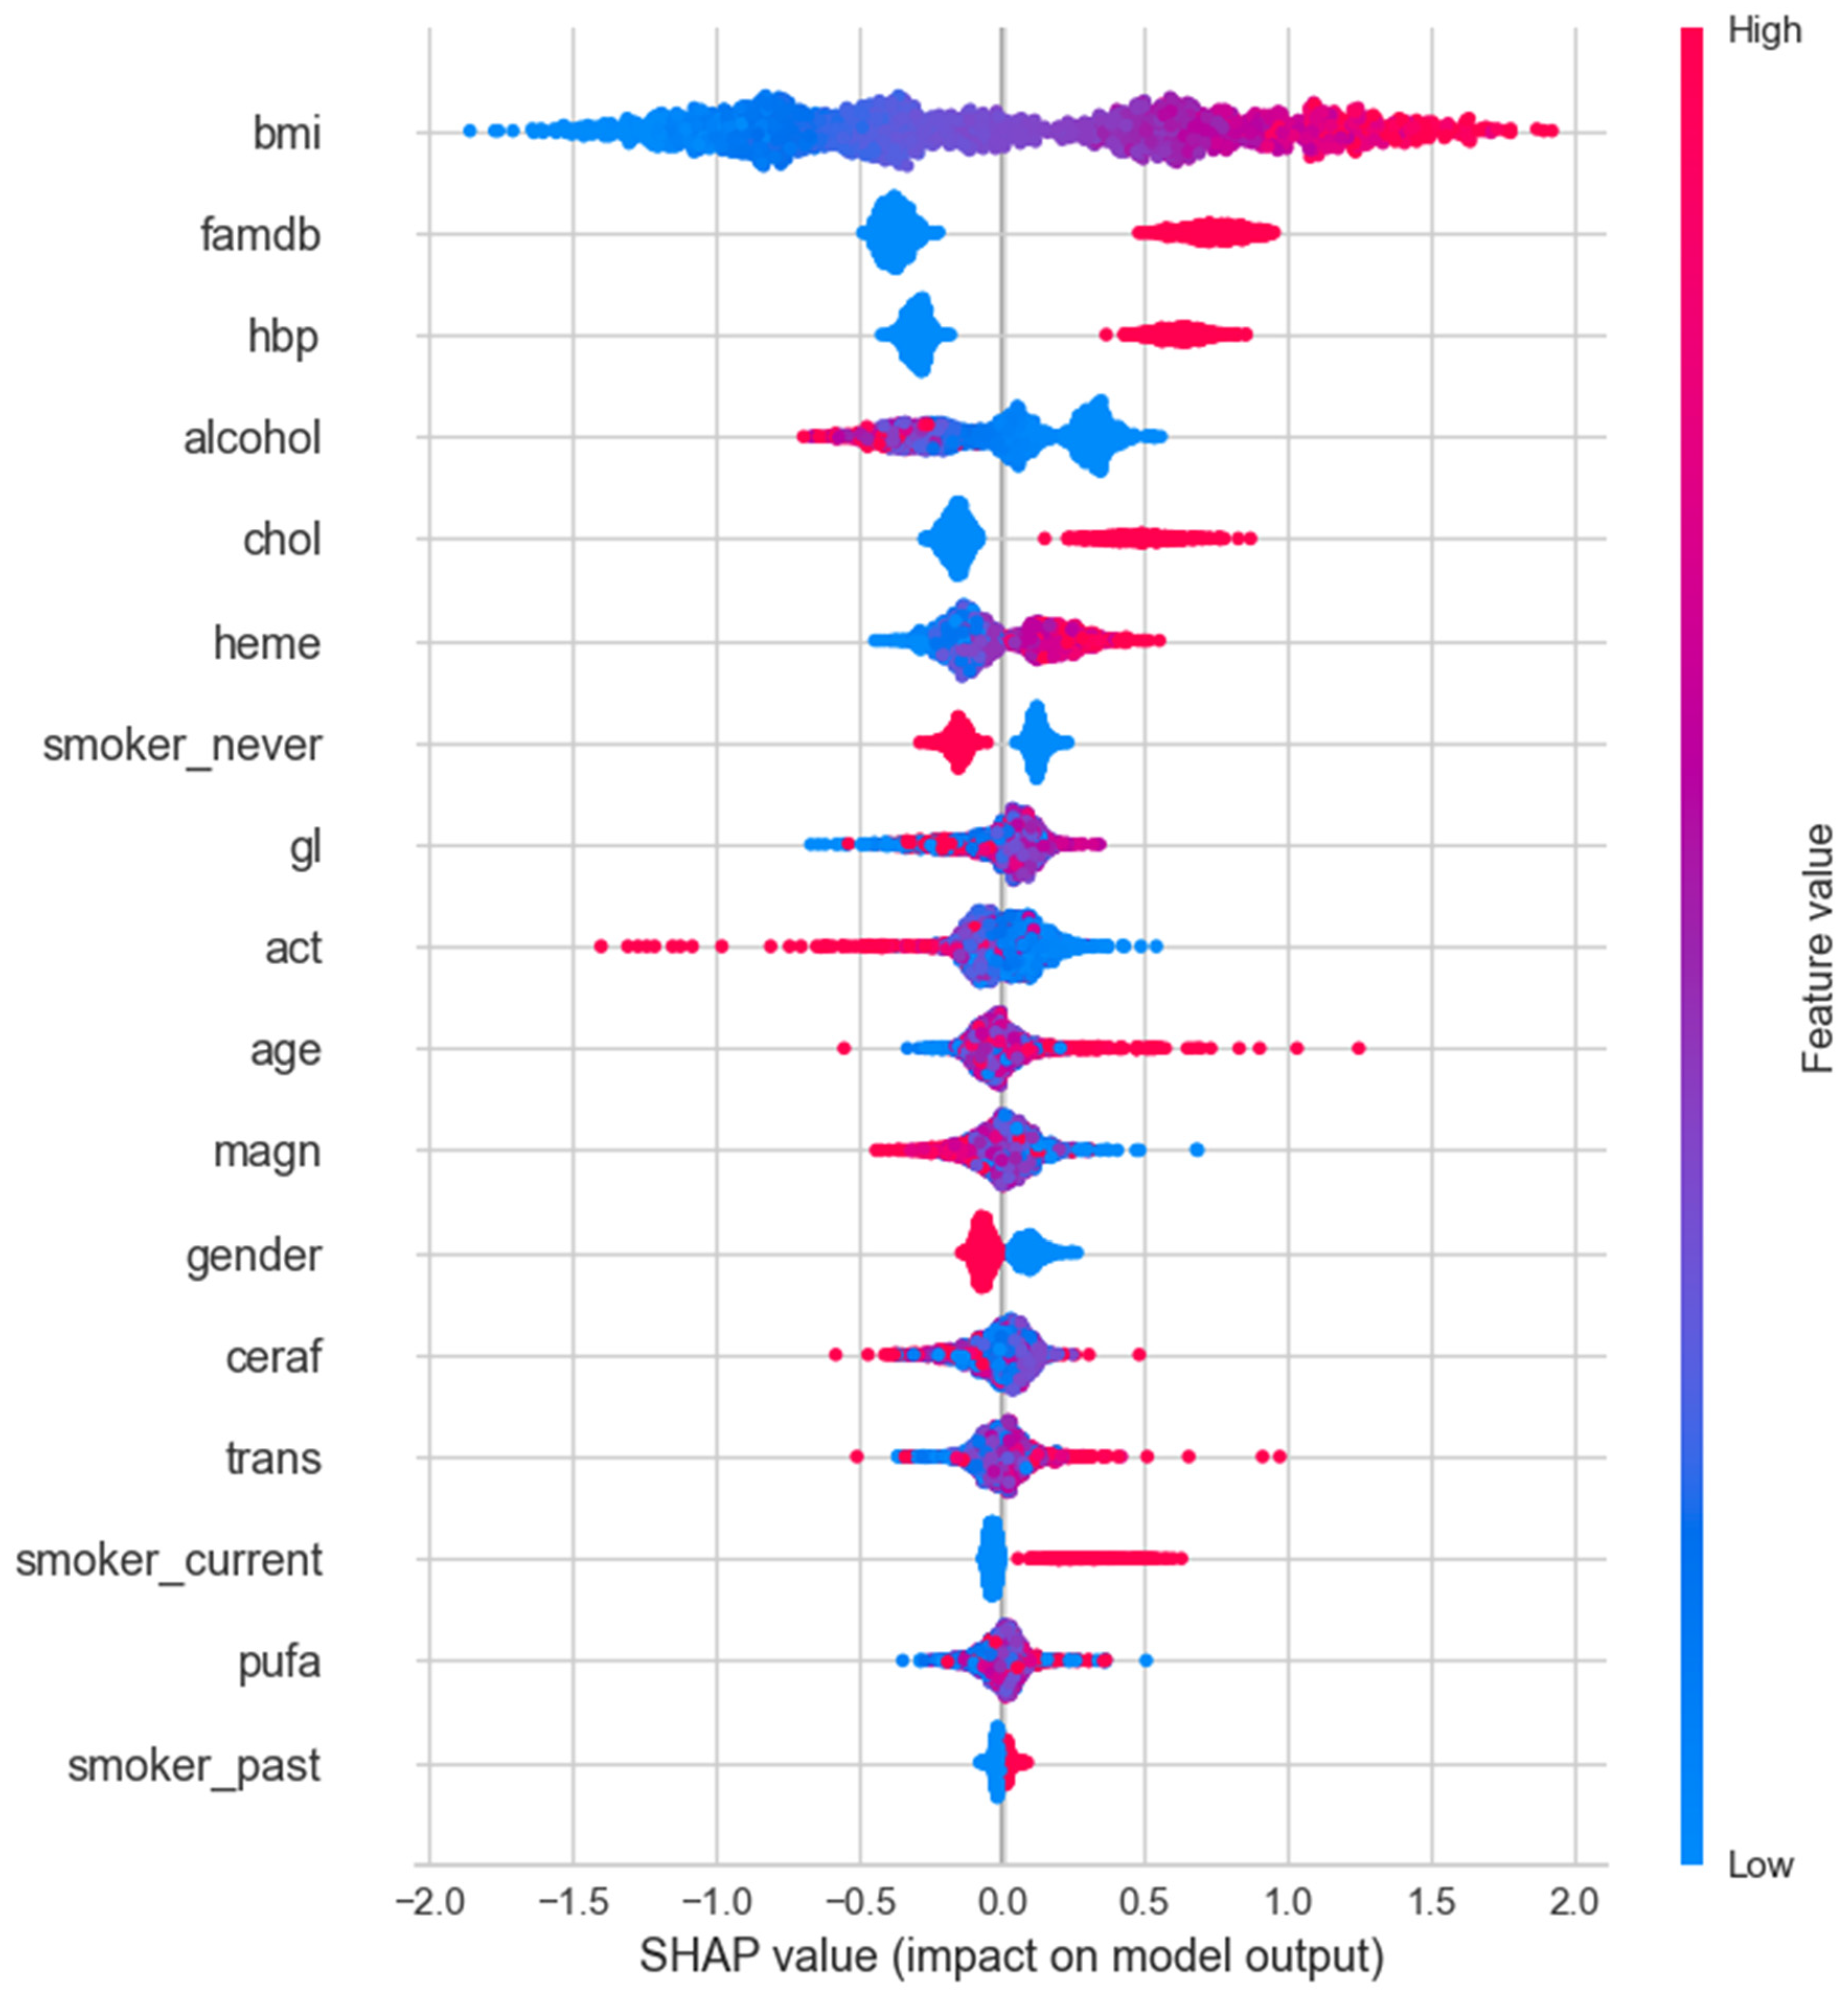

Table 1.
Age and numerical phenotypic characteristics of control and T2DM individuals.
| Male | female | |||||
|---|---|---|---|---|---|---|
| Control | T2DM | p value | Control | T2DM | p value | |
| n | 1289 | 1127 | 1774 | 1482 | ||
| Age | 59.22 ± 8.36 | 59.38 ± 8.48 | 0.64 | 55.63 ± 6.74 | 55.97 ± 6.76 | 0.16 |
| Body mass index | 25.21 ± 2.83 | 27.89 ± 4.13 | 7.94E-74 | 25.36 ± 4.80 | 29.88 ± 5.73 | 1.8E-121 |
| Activity | 40.8 ± 42.96 | 29.98 ± 33.10 | 8.73E-12 | 15.57 ± 18.50 | 12.86 ± 15.61 | 9.44E-6 |
| Alcohol | 11.05 ± 15.02 | 9.57 ± 14.69 | 0.006 | 6.55 ± 10.32 | 4.04 ± 9.44 | 6.96E-13 |
| Polyunsaturated fatty acid | 5.88 ± 1.55 | 6.12 ± 1.68 | 0.00014 | 6.32 ± 1.68 | 6.17 ± 1.57 | 0.006 |
| Trans | 1.51 ± 0.62 | 1.56 ± 0.61 | 0.027 | 1.69 ± 0.53 | 1.73 ± 0.55 | 0.026 |
| Magnesium | 386.01 ± 87.67 | 378.08 ± 86 | 0.013 | 304.66 ± 71.83 | 300.29 ± 69.12 | 0.042 |
| Ceraf | 7.26 ± 4.33 | 6.61 ± 3.8 | 6.2E-05 | 4.59 ± 3.19 | 4.39 ± 2.74 | 0.03 |
| Heme | 1.19 ± 0.45 | 1.34 ± 0.5 | 1.91E-15 | 1.13 ± 0.45 | 1.2 ± 0.45 | 1.27E-05 |
| Glycemic Index | 130.85 ± 25.75 | 124.14 ± 24.38 | 4.53E-11 | 97.52 ± 19.58 | 98.58 ± 18.5 | 0.06 |
Data are presented as mean ± standard deviation. n denotes number of individuals, and T2DM = Type 2 diabetes mellitus. The p-value represents the statistical significance of the difference between male and female sample means in the Student’s t-test analysis.
Table 2.
The table shows the distribution of categorical data, including familial history of diabetes (famdb), high blood pressure (hbp), cholesterol, and cigarette smoking, across gender and disease status.
Table 2.
The table shows the distribution of categorical data, including familial history of diabetes (famdb), high blood pressure (hbp), cholesterol, and cigarette smoking, across gender and disease status.
| Male | Female | ||||||||||||
| Control | T2DM | χ2 | p value |
Control | T2DM | χ2 | P value |
||||||
| n | % | n | % | n | % | n | % | ||||||
| Famdb | no | 1014 | 78.7 | 642 | 57.0 | 131.32 | <0.00001 | 1382 | 77.9 | 749 | 50.5 | 267.35 | <0.00001 |
| yes | 275 | 21.3 | 485 | 43.0 | 392 | 22.1 | 733 | 49.5 | |||||
| Hbp | no | 1008 | 78.2 | 667 | 59.2 | 102.26 | <0.00001 | 1421 | 80.1 | 760 | 51.3 | 303.24 | <0.00001 |
| yes | 281 | 21.8 | 460 | 40.8 | 353 | 19.9 | 722 | 48.7 | |||||
| Cholesterol | no | 923 | 71.7 | 668 | 59.3 | 40.67 | <0.00001 | 1585 | 89.3 | 1134 | 76.5 | 96.47 | <0.00001 |
| yes | 366 | 28.3 | 459 | 40.7 | 189 | 10.7 | 348 | 23.5 | |||||
| Cigarette smoking | current | 75 | 6.0 | 102 | 9.3 | 26.70 | <0.00001 | 190 | 10.8 | 210 | 14.2 | 14.97 | <0.00056 |
| never | 597 | 47.8 | 415 | 38.0 | 883 | 50.0 | 652 | 44.0 | |||||
| past | 576 | 46.2 | 576 | 52.7 | 693 | 39.2 | 618 | 41.8 | |||||
The data are presented as counts and percentages. χ2: Chi-Square test value.
Table 3.
Performance of 16 machine learning techniques for predicting diabetes in male only data subsets.
Table 3.
Performance of 16 machine learning techniques for predicting diabetes in male only data subsets.
| Model | Accuracy | AUC | Recall | Prec. | F1 | Kappa | MCC | TT (Sec) | |
|---|---|---|---|---|---|---|---|---|---|
| ridge | Ridge Classifier | 0.70 | 0.00 | 0.70 | 0.70 | 0.70 | 0.40 | 0.40 | 0.04 |
| lda | Linear Discriminant Analysis | 0.70 | 0.77 | 0.70 | 0.70 | 0.70 | 0.40 | 0.40 | 0.04 |
| lr | Logistic Regression | 0.70 | 0.77 | 0.70 | 0.70 | 0.70 | 0.39 | 0.40 | 0.65 |
| gbc | Gradient Boosting Classifier | 0.69 | 0.74 | 0.69 | 0.69 | 0.69 | 0.38 | 0.38 | 0.20 |
| nb | Naive Bayes | 0.69 | 0.74 | 0.69 | 0.69 | 0.69 | 0.37 | 0.37 | 0.03 |
| ada | Ada Boost Classifier | 0.69 | 0.74 | 0.69 | 0.69 | 0.68 | 0.37 | 0.37 | 0.08 |
| catboost | CatBoost Classifier | 0.68 | 0.74 | 0.68 | 0.68 | 0.68 | 0.35 | 0.36 | 1.30 |
| rf | Random Forest Classifier | 0.68 | 0.73 | 0.68 | 0.68 | 0.68 | 0.35 | 0.35 | 0.17 |
| et | Extra Trees Classifier | 0.68 | 0.73 | 0.68 | 0.68 | 0.68 | 0.35 | 0.35 | 0.12 |
| xgboost | Extreme Gradient Boosting | 0.67 | 0.71 | 0.67 | 0.67 | 0.67 | 0.33 | 0.34 | 0.11 |
| lightgbm | Light Gradient Boosting Machine | 0.66 | 0.71 | 0.66 | 0.66 | 0.66 | 0.32 | 0.32 | 0.07 |
| svm | SVM - Linear Kernel | 0.60 | 0.00 | 0.60 | 0.66 | 0.54 | 0.18 | 0.23 | 0.04 |
| dt | Decision Tree Classifier | 0.59 | 0.59 | 0.59 | 0.60 | 0.59 | 0.19 | 0.19 | 0.04 |
| qda | Quadratic Discriminant Analysis | 0.59 | 0.61 | 0.59 | 0.60 | 0.58 | 0.18 | 0.18 | 0.04 |
| dummy | Dummy Classifier | 0.53 | 0.50 | 0.53 | 0.28 | 0.37 | 0.00 | 0.00 | 0.05 |
| knn | K Neighbors Classifier | 0.52 | 0.52 | 0.52 | 0.52 | 0.52 | 0.03 | 0.03 | 0.04 |
Table 4.
Performance of 16 machine learning techniques for predicting diabetes in female only data subsets.
Table 4.
Performance of 16 machine learning techniques for predicting diabetes in female only data subsets.
| Model | Accuracy | AUC | Recall | Prec. | F1 | Kappa | MCC | TT (Sec) | |
|---|---|---|---|---|---|---|---|---|---|
| lr | Logistic Regression | 0.71 | 0.789 | 0.71 | 0.71 | 0.71 | 0.42 | 0.42 | 0.81 |
| ridge | Ridge Classifier | 0.71 | 0.00 | 0.71 | 0.71 | 0.71 | 0.41 | 0.41 | 0.09 |
| lda | Linear Discriminant Analysis | 0.71 | 0.790 | 0.71 | 0.71 | 0.71 | 0.41 | 0.41 | 0.10 |
| ada | Ada Boost Classifier | 0.71 | 0.77 | 0.71 | 0.71 | 0.70 | 0.40 | 0.41 | 0.28 |
| catboost | CatBoost Classifier | 0.70 | 0.77 | 0.70 | 0.70 | 0.70 | 0.40 | 0.40 | 3.21 |
| nb | Naive Bayes | 0.70 | 0.76 | 0.70 | 0.70 | 0.70 | 0.39 | 0.39 | 0.10 |
| rf | Random Forest Classifier | 0.70 | 0.76 | 0.70 | 0.70 | 0.70 | 0.39 | 0.39 | 0.52 |
| gbc | Gradient Boosting Classifier | 0.70 | 0.77 | 0.70 | 0.70 | 0.69 | 0.39 | 0.39 | 0.65 |
| et | Extra Trees Classifier | 0.69 | 0.76 | 0.69 | 0.69 | 0.69 | 0.37 | 0.37 | 0.37 |
| lightgbm | Light Gradient Boosting Machine | 0.68 | 0.75 | 0.68 | 0.68 | 0.68 | 0.36 | 0.36 | 0.18 |
| xgboost | Extreme Gradient Boosting | 0.67 | 0.74 | 0.67 | 0.67 | 0.67 | 0.34 | 0.34 | 0.34 |
| qda | Quadratic Discriminant Analysis | 0.64 | 0.67 | 0.64 | 0.65 | 0.64 | 0.28 | 0.28 | 0.09 |
| dt | Decision Tree Classifier | 0.62 | 0.62 | 0.62 | 0.62 | 0.62 | 0.24 | 0.24 | 0.12 |
| svm | SVM - Linear Kernel | 0.60 | 0.00 | 0.60 | 0.67 | 0.53 | 0.18 | 0.22 | 0.10 |
| knn | K Neighbors Classifier | 0.59 | 0.61 | 0.59 | 0.59 | 0.59 | 0.16 | 0.16 | 0.11 |
| dummy | Dummy Classifier | 0.55 | 0.50 | 0.55 | 0.30 | 0.38 | 0.00 | 0.00 | 0.09 |
Table 5.
Performance of 16 ML techniques for predicting diabetes in total (male+female) data sets.
| Model | Accuracy | AUC | Recall | Prec. | F1 | Kappa | MCC | TT (Sec) | |
|---|---|---|---|---|---|---|---|---|---|
| lr | Logistic Regression | 0.72 | 0.79 | 0.72 | 0.72 | 0.72 | 0.43 | 0.43 | 0.76 |
| gbc | Gradient Boosting Classifier | 0.72 | 0.78 | 0.72 | 0.72 | 0.72 | 0.43 | 0.43 | 0.40 |
| catboost | CatBoost Classifier | 0.72 | 0.78 | 0.72 | 0.72 | 0.72 | 0.43 | 0.43 | 1.79 |
| ada | Ada Boost Classifier | 0.71 | 0.78 | 0.71 | 0.71 | 0.71 | 0.42 | 0.42 | 0.14 |
| lda | Linear Discriminant Analysis | 0.71 | 0.79 | 0.71 | 0.71 | 0.71 | 0.42 | 0.42 | 0.04 |
| ridge | Ridge Classifier | 0.71 | 0.00 | 0.71 | 0.71 | 0.71 | 0.42 | 0.42 | 0.04 |
| nb | Naive Bayes | 0.71 | 0.77 | 0.71 | 0.71 | 0.71 | 0.42 | 0.42 | 0.05 |
| lightgbm | Light Gradient Boosting Machine | 0.71 | 0.78 | 0.71 | 0.71 | 0.71 | 0.41 | 0.41 | 0.09 |
| rf | Random Forest Classifier | 0.71 | 0.78 | 0.71 | 0.71 | 0.71 | 0.41 | 0.41 | 0.35 |
| et | Extra Trees Classifier | 0.70 | 0.77 | 0.70 | 0.70 | 0.70 | 0.40 | 0.40 | 0.20 |
| xgboost | Extreme Gradient Boosting | 0.70 | 0.76 | 0.70 | 0.70 | 0.70 | 0.39 | 0.39 | 0.20 |
| qda | Quadratic Discriminant Analysis | 0.67 | 0.72 | 0.67 | 0.67 | 0.67 | 0.33 | 0.34 | 0.05 |
| dt | Decision Tree Classifier | 0.63 | 0.62 | 0.63 | 0.63 | 0.63 | 0.25 | 0.25 | 0.06 |
| svm | SVM - Linear Kernel | 0.61 | 0.00 | 0.61 | 0.64 | 0.54 | 0.19 | 0.24 | 0.06 |
| dummy | Dummy Classifier | 0.54 | 0.50 | 0.54 | 0.29 | 0.38 | 0.00 | 0.00 | 0.05 |
Disclaimer/Publisher’s Note: The statements, opinions and data contained in all publications are solely those of the individual author(s) and contributor(s) and not of MDPI and/or the editor(s). MDPI and/or the editor(s) disclaim responsibility for any injury to people or property resulting from any ideas, methods, instructions or products referred to in the content. |
© 2024 by the authors. Licensee MDPI, Basel, Switzerland. This article is an open access article distributed under the terms and conditions of the Creative Commons Attribution (CC BY) license (http://creativecommons.org/licenses/by/4.0/).
Copyright: This open access article is published under a Creative Commons CC BY 4.0 license, which permit the free download, distribution, and reuse, provided that the author and preprint are cited in any reuse.


