Submitted:
17 June 2024
Posted:
17 June 2024
You are already at the latest version
Abstract
In the 21st century, climate change and its consequences are getting more serious. The changes in temperature and precipitation alter the run-off conditions, subsequently influencing the channel processes of rivers. The study aims to analyse the hydrological changes of a small, sub-alpine river (Rába River, Central Europe) and the bank erosional processes since the 1950s. The bank erosion was determined based on topographical maps, aerial photographs, and RTK–GPS surveys. Short (2–3 days) floods were common between 1950–1980, and low stages occurred in 65–81% of a year. However, in the 21st century, extreme regimes developed, as record-high, flashy floods alter with long low stages (91–96% of a year). The bank erosion shows a cyclic temporal pattern, gradually increasing until it reaches a high value (4.1–4.9 m/y), followed by a limited erosional rate (2.2–2.8 m/y). However, the magnitude of the bank erosion is decreasing. It could be explained by (1) the lower transport capacity of the more common low stages and (2) the seasonal shift of the flood waves, appearing in the vegetational period when the riparian vegetation can more effectively protect the banks from erosion.
Keywords:
lateral erosion
; channel shift
; meander types
; meander development
; low stage
; flood
; intra annual variability
1. Introduction
In the 21st century, climate change and its impact on the natural environment are becoming increasingly evident. Changes in temperature and precipitation patterns significantly impact on all elements of the natural environment. Climate change in river basins affects water and sediment transport of rivers through altered runoff and soil erosion [1,2], water flow [3], and processes in riverbeds [4,5,6]. Knox [7,8] suggested that annual changes in temperature of ±1–2 °C and precipitation of ±12–20% can already cause significant changes in the magnitude and frequency of floods. Increases in temperature result in an increase in evapo-transpiration rates and an earlier snowmelt date, so it can indirectly influence water flow [9]. In turn, changes in the amount, intensity, and temporal distribution of precipitation directly influence runoff, water, and sediment yields and their annual changes [9,10,11]. These ultimately result in changes in river bed development and channel patterns [12].
The consequences of climate change induced impacts may differ between rivers [13]. In fluvial systems, the response to change may vary in space and time, even within the same river, depending on the current state of the system [13,14]. The hydro-morphological response to climate change manifest in changes in the characteristics of the water system (e.g., water level, sediment yield), such as changes in frequency, magnitude, duration, sequence, and trend of low stages or flood waves [15]. Past climate changes have resulted in distinct periods of high and low river flow, with significant morphological consequences [4]. Changes have occurred in the course of channel and floodplain development, the rate of lateral displacement of river channels, the extent of the point-bar surfaces, and the size and shape of meanders [4,5,16,17].
The frequency of flashy floods has increased in recent decades [18]. These extreme floods result in significant sediment transport and cause widening or incision of the river bed [19]. In the lowland areas, heavy flooding could lead to intense bed migration and avulsions [20,21], and intense aggradation in floodplains and some segments of the channel [22]. A decrease in annual precipitation and discharge triggers opposite processes. The increasing frequency of small floods can lead to the secondary loop formation on large meanders and channel narrowing [23]. However, these processes can impede the conveyance of subsequent large floods and thus lead to increased flood risk [23,24].
Heavier rains and longer dry periods can lead to more extreme flows [7]. However, while some rivers have experienced more frequent low flows and disappearing floods [5], in others, the magnitude and frequency of floods have increased [14,25]. Researchers differ in their opinions on which characteristic discharge plays the most important role in transforming channels and floodplains. Gilvear et al. [14] stressed the role of increasingly frequent extreme floods; others considered the changes in bankfull discharge as the key factor [26,27]. However, the role of increasingly frequent and persistent low stages in shaping the riverbed is also not negligible [28].
The impact of climate change is not only reflected in changes in the regime of rivers. Climate change-driven changes in catchment vegetation and land cover can modify the spatial and temporal distribution of runoff and sediment discharge by controlling soil erosion and water retention [29,30], which in turn change the parameters of the channel [31]. Climate change also alters the intensity of surface erosion processes. For example, changes in the intensity of soil erosion, altered denudation rates, and mass movements lead to the altered amount of sediment entering rivers [32,33,34]. For example, the additional sediment decreases the transport capacity, causing sediment deposition and leading to the aggradation of the channel and floodplain [35]. The aggraded riverbed has a lower conveyance capacity; thus, it is less able to drain high flows, so floods might become more frequent, leading to further rapid sediment accumulation of the floodplain [36]. As a result, catchments become more vulnerable to extreme weather events [37].
The main difficulties in analysing the effects of environmental change are the uncertainties of the initial state and the non-linearity of the processes involved [38]. Moreover, the effects of different processes can amplify or extinguish each other [35,36]. The nature of the consequences depends on the internal (in)stability of the river system and its capacity to adapt to change, i.e., the sensitivity of a given reach and its environment [39,40]. In this respect, the closeness of the hydro-morphological regime of the river to some threshold of equilibrium and the capacity of the system to regenerate are important [41,42].
In Central Europe, decreasing snow cover, warmer temperatures, and more frequent dry periods [43,44] could reduce flood discharges [11]. However, the Rába River, originating in the Eastern Alps, is under a double effect. On its sub-alpine catchment slight increase in flood discharge was indicated; however, along its lowland reach, a decrease of floods was reported [11]. In the lowland, Hungarian section, prolonged low stages alter with flashy flood waves. As most of the meanders in the upstream reach of the Rába in Hungary are free developing, they provide an excellent opportunity to analyse the effect of altering flow conditions on channel morphology. Therefore, the objectives of this research are (1) to analyse the hydrological changes of the Rába River since the 1950s, (2) to determine the extent of bank erosion, and finally (3) to analyse the relationship between the regime and bank erosion, which will reveal the river’s response to climate change. Our ultimate goal is to evaluate the river’s morphological response to climate change regarding flood prevention and river restoration.
2. Study Area
The Rába River (length: 287 km) is a small river shared by Austria and Hungary in Central Europe (Bergmann et al., 1996). Most of its catchment (10,113 km2) is located in the Eastern Alps, but its lowland reach is located in a plain in Hungary (Figure 1).
The Alpine catchment has a key influence on the regime. In its natural state, the river had three floods [45]. Snowmelt and rainfall initiated the flood in March, and heavy rainfalls caused flashy flood waves in July. A third, smaller flood in November was related to Mediterranean cyclones. Flood waves usually quickly develop [46]. The maximum (Qmax= 471 m3/s) discharge measured at Szentgotthárd (Hungary) is almost two hundred times larger than the minimum discharge (Qmin= 2.6 m3/s). The hydrology of the Hungarian lowland reach is determined by the tributaries draining the mountainous sub-catchments in the Eastern Alps. In the study area, the Lapincs Brook has the greatest influence on the water and sediment transport of the Rába. The mean discharge of the brook is three times greater than the mean discharge of the Rába at the confluence, and its coarse sediments also have a major influence on the channel processes of the main river [47].
The Upper Rába (from its source in Austria to Sárvár in Hungary) has been regulated only at some points; thus, it still meanders freely on its floodplain. The local regulation works aimed to protect settlements and transport infrastructure from lateral erosion and to provide flood safety. Besides, several lock dams were built on the Upper Rába [46]. On the other hand, the Lower Rába (between Sárvár and the Danubian confluence) is confined by artificial levees, and the channel is regulated by cut-offs and revetments to a large extent [48].
The middle reach of the Rába River (length: 127 km) was selected as a study area (Figure 1). The local river engineering works were mostly performed between 1968 and 1977. Based on the extent of human influence and meander migration characteristics, altogether 14 units were identified. Some units are free of direct human impact, so they reflect the natural state of the channel (U1, U3, U5–6, U8, U10, U12, and U13); in other units the channel is slightly regulated by revetments at some points (U1, U8, U10, and U12), while other units (U2, U4, U7, U9, U11, and U14) have intensively regulated channel (revetment, cut-offs) and artificially confined floodplain. As the units free of engineering works are in between modified units, they were also influenced by human impact but indirectly. The artificial cut-offs or the revetments increase the slope and flow velocity and alter the sediment household, which propagates downstream, influencing the processes even in the intact channel segments.
3. Materials and Methods
The hydrology of the Rába River was analysed based on daily stage data measured at Szentgotthárd gauging station, located in the upstream part of the studied reach. Water level (H) data are from 1950–2004, while discharge (Q) data are from 1970–2024. Based on the daily data, the maximum (Hmax, Qmax), average (Hmean, Qmean), and minimum (Hmin, Qmin) values were calculated for each year. Low stages were determined as H≤0 cm, while the bankfull level is 250 cm, equal to 1.1 y return period flood [49]. A flood wave was considered a water level rise by at least 50 cm.
Maps (1951, 1955, 1960) and aerial photographs (1967, 1972, 1983, 1996, 2000, 2005, 2008, 2012, 2015, 2018, 2021, and 2022) were used to analyse the horizontal displacement of the bankline. The maps were processed using QGIS software (3.28/Firenze). The vectorized bank polygons were overlapped in QGIS using the NNjoin module. The new polygon between two subsequent banklines in the direction of channel migration indicates the area affected by bank erosion. To determine bank erosion rate, perpendicular lines were constructed on a digitised bankline in every 2 m all throughout the studied reach (Figure 2A). Along these lines, the lateral channel shift was measured, and the mean annual bank erosion rate (m/y) was calculated. To identify the maximum bank erosion, circles with a diameter of 500 m were placed along the centre line of the meander belt. The circles overlap by 90 m, equal to two channel widths (Figure 2B). The maximum bank erosion within the circles was determined by applying a moving average.
Field measurements were performed along 20 intensively migrating free meanders to evaluate the bank erosion within a year. The survey was performed between April 2022 and April 2024. The bankline was surveyed seven times along the outer curve of the bends using Hi-Target iRTK-4 satellite geodetic GPS (horizontal precision: 0.1–3 cm). The average and bank erosion within the surveyed bends were measured using the perpendicular line method mentioned above. The maximum bank erosion was measured using circles with a diameter (15 m) covering the bends. The maximum displacement within the circles was determined by calculating a moving average.
4. Results
4.1. Hydrological Changes of the Rába River (1950–2024)
Floods with a return period of 1.3-47 y were typical in the first period (1950-1980). The average stage of yearly highest water levels was 272±74 cm (Figure 3a), and their mean discharge was 214.7±71 m3/s in the 1970s (Figure 3b). A record high, overbank flood (H: 408 cm) was recorded in 1965, 158 cm above the bankfull stage. The flood waves typically occurred in March, June, and August. Floodplains were typically covered by overbank floods for 2–3 d/y, although in 1965, there were 8 days of flooding due to two summer floods. The mean level of the annual lowest stages was –71±12 cm (Qmean: 7.3±2.6 m3/s). Low stages (≤0 cm) were common in 65-81% a year (Figure 4).
Between 1981 and 2000, smaller floods (return period: 1.3-26.6 y) became common, so they rarely entered the floodplain (Figure 3 and Figure 4). Although floods in March persisted, the former August floods could appear between August and October. Though the floods in 1987 and 1996 were not the highest, they had higher discharges (454–457 m3/s) than before. The average level of the annual highest stages decreased by 27 cm (Hmax: 226±85 cm). The other characteristic water levels also decreased. The mean annual stage decreased by 31 cm (Hmean: 69±45 cm), and the mean annual lowest stage decreased by 18 cm (Hmin: –88±7 cm). A new, record low stage was measured (1983: –107 cm), which brought the record 11 cm deeper. Overall, low stages characterized 92-92% of the years. At the same time, the typical discharge values increased, although their deviation increased, referring to more extreme flow conditions (Qmax: 244±111 m3/s, Qmean: 126±56 m3/s and Qmin: 8.2±2.1 m3/s).
The weather became even more extreme in the last period (2001-2024). The absolute water level changes between the annual minimum and maximum stages increased. While it was 484 cm in the first period, it became 602 cm. The centurial flood in 2009 reached a new record height (491 cm) and discharge (471 m3/s). However, the mean annual highest stages (Hmax: 181±132 cm) decreased further by 45 cm. The intra-annual pattern of flood waves has also changed, with the March flood waves disappearing, and the flood waves shifted to May–June and August–September. The low water level decreased moderately (Hmin: –96±9cm), though new, record low stage was measured (2012: –111 cm). Thus, it decreased by 4 cm compared to the previous record. As a result of these processes, the frequency of low stages increased to 91–96%.
In terms of discharge, it is worth splitting this period in two. Between 2001 and 2015, water flows decreased considerably and became more extreme than in previous periods (Qmax: 221±140 m3/s; Qmean: 114±71 m3/s; Qmin: 6.7±3 m3/s). However, the annual discharges decreased even more markedly in the last decade (2016-2024) (Qmax: 182±133 m3/s; Qmean: 95±66 m3/s and Qmin: 6.6±3 m3/s). The lowest discharge of the whole studied period was recorded in 2003 (2.6 m3/s).
From the point of view of channel dynamics, the changes in the discharge–stage relationship are important. In the range of small and medium water levels, the same stages were associated with increasingly higher discharges. While the –50 cm water level in 1970 was associated with 13.6 m3/s discharge, in 2021, it increased to 26.7 m3/s. Simultaneously, the 0 cm water level had 24.0 m3/s discharge in 1970, which increased to 52.1 m3/s in 2020. These data indicate the incision of the channel. Similarly, the discharge values increased in the medium and high stage ranges, suggesting that the drainage capacity of the channel is increasing.
4.2. Hydrological Changes of the Rába River (2022–2024) during the Field Surveys
The water regime differed substantially between the four-monthly bankline surveys (Figure 5). Low stages were typical during Periods 1 and 2. Only three small flood waves occurred in late May and early June, but they were far below the bankfull level (H: 4, 55, and 68 cm), these waves developed rapidly, with a maximum rising velocity of 77 cm/day. The flood waves were followed by a prolonged period of low stages. Thus, only very low stages appeared in Period 2, interrupted by a few small water level rises (ΔHmax: 48 cm/day).
The dominant feature of Period 3 was that the small stages were interrupted by small flood waves in January (H: –65 to –13 cm) and mid-April (92 cm). During the latter flood wave, the water level rose (109 cm/day) and recessed (50 cm/day) quickly, but it was far below the bankfull water level. The fourth survey was conducted one week after the flood wave.
Period 4 was very active from the hydrological point of view. Two of the eight flood waves exceeded the bankfull level, so they entered the floodplain. The first overbank flood wave (17 May 2023: 268 cm) had a rapid rising (ΔHmax: 261 cm/day) and falling limbs (ΔHmax: 190 cm/day). The second overbank flood was much higher (05 Aug. 2023: 477 cm); it approached the previous largest stage on record (491 cm). During the rising, the water level changed faster than in previous periods (ΔHmax: 305 cm/day), but it receded much slower (ΔHmax: 60 cm/day) as water slowly drained back to the channel from the floodplain.
Periods 5 and 6 were similar to the first period in hydrology: small flood waves appeared during a low-stage period. The largest of the waves was only 109 cm high. During these flood waves, the water level increased by 135-161 cm/day, and it decreased by 70-101 cm/day.
4.3. Bank Erosion of the Studied Reach of the Rába between 1951 and 2022
The mean lateral bank erosion of the studied Rába reach was high in three distinct periods: in the 1960s (6.9 m/y), in the late 1990s (4.6 m/y), and a third small erosional peak (3.3 m/y) occurred in 2012–2014 (Figure 6). The temporal trends in bank erosion reflect that the bank erosion gradually increased until it reached a maximum value. For example, from the 1950s to the 1960s, the mean bank erosion increased from 4.1 m/y to 6.9 m/y. Similarly, the 20th century started with a low bank erosion rate (mean: 2.0 m/y), gradually increasing until it reached a small peak in 2014 (mean: 3.3 m/y).
Within the intensively eroding periods, the bank erosion rate was very diverse, as reflected by the box plots with many outliers and a wide range between extreme values. In some bends, the bank erosion was over 10 m/y, being the most intensive in the late 1990s, when the bank erosion rate of some meanders was 24–27 m/y.
The periods of intensive bank erosion were always followed by periods (when the erosion declined. It has an increasing trend, as in 1972–1982, the mean bank erosion was 4.1 m/y; in 2000–2004, it dropped to 2.0 m/y, and finally in 2015–2022, to 1.6 m/y. The bank erosion rate has a low standard deviation in these periods, referring to uniform processes along all meanders.
4.4. Bank Erosion of the Selected Meanders of the Rába between 2022 and 2024
Short-term bank erosion was measured along 20 meanders for two years from April 2022 to April 2024. The average bank erosion was 2.8 m/y, which is the same as the long-term average measured in the previous period (2015–2022). However, the multiple measurements within a year help to highlight the seasonal variations in bank erosion and the controlling hydrological processes.
In Periods 1–3 of the survey (April 2022 – April 2023), the mean bank erosion (0.3–0.7 m) was similar in most of the meanders (Figure 7, Table 1). There was only one bend (G) in Period 3, where the mean bank erosion exceeded 1.0 m. The maximum bank erosion at some points reached 1.2–2.2 m in Periods 1 and 3. However, in Period 2, the maximum values were even and never higher than 0.6–0.8 m.
In Period 4 (April – Aug. 2023), the mean bank erosion (2.8 m) increased significantly in all meanders. Only the last meander (U) had a mean bank erosion of less than 1 m. The highest average value (6.9 m) was measured in bend C. However, at certain points in some meanders, the bank eroded to an extreme extent. For example, at the most eroded point in bend A, the bank eroded by 19.8 m.
Then, in Period 5 (Aug.– Dec. 2023), the average amount of bank erosion in all bends was reduced by two-thirds (1.0 m). The bends showed considerable variations, as the mean bank erosion remained high (1.0–3.4 m) in almost a third. Maximum erosion in bend A, previously marked by very fast bank erosion, was strongly reduced (0.9 m). New points of moderate erosion (1.5-4.6 m) appeared in bends F-I.
In Period 6 (Dec. 2023 – April 2024), the mean bank erosion slowed further (0.4 m) to half of the previous period and reached the average values of the first periods. There was only one bend (H) where both mean (4.0 m) and maximum (1.9 m) erosion were significant, although here, the bank erosion was consistently high throughout the last year. The maximum erosion in the other bends was sharply reduced, it was only 0.3-1.0 m at any one point.
Bank erosion showed a characteristic downstream trend only in Period 4. At this time, both the mean and maximum bank erosion decreased downstream, broken only at two locations (F–H and S–T) by more intensively forming meanders. In the other periods, however, this downstream trend was not obvious, and the bank erosion showed higher values at a few locations (C, G, and M), but without any spatial trend.
At the meanders, the locations of the points with the highest bank erosion differed (Figure 8). In most bends (e.g., C, D, G), the highest bank erosion was measured at the downstream third of the meander, and these meanders showed a classic expanding meander development pattern.
In other meanders (e.g., bends A, B, and J), a mid-channel bar or island pushed the thalweg against the bankline at different points of the bend, where extreme bank erosion values were measured. In the studied reach, there are also some confined meanders (A, B, and E) where the high banks decrease the lateral channel shift; thus, they decrease the rate of bank erosion. However, there are also some complex meanders (F, H, L, M, T, and U) that show the fragmentation of a previous, larger meander. Thus, in some places on the original convex bankline, the bank erosion became more intensive, leading to the formation of smaller, secondary bends.
4. Discussion
4.1. Hydrological Alteration of the Rába River Since 1950
Previously, Csoma [45] described two major and one minor flood (March, July, and November) per year on the Rába. Our data from the Szentgotthárd gauging station for the years 1950–1980 verified the existence of floods in March and June, and a late summer flood in August was identified instead of the autumn flood. After the 1980s, the water regime gradually changed. Thus, although the March flood persisted between 1981 and 2000, the early summer flood wave disappeared, and the late summer floods appeared in a longer period (August–October). In the 21st century, a completely different flood pattern has emerged, with the spring flood being replaced by a prolonged flood period in May–June and a marked peak in August–September. The strong inter-annual shift is probably due to climatic reasons [50], and it might indicate heavier and more frequent summer and early autumn rainfalls than in the past. Meanwhile, the heights of flood waves show a declining trend, in good agreement with Blöschl et al. [11], who reported a 5-10% decrease in flood discharge along the Rába River. At the same time, the more intense summer floods could be explained by the slight increase in discharge in smaller catchments in the Eastern Alps [11] and by more frequent extreme rainfall events [18].
The length of the low stages has increased dramatically, from 65–81% of a year between 1950 and 1980 to 91–96% between 2001 and 1924. The dropping of low stages is partly related to the widening and deepening of the channel, as the discharges at the same water levels have almost doubled. However, while the annual minimum discharge averaged 8.2±2 m3/s in the 1981–2000, this gradually decreased to 6.7±3 m3/s (2001–2015) and to 6.5±1.9 m3/s (2016–2024). Moreover, by the end of the 21st century (RCP4.5 and RCP8.5 scenarios), droughts are predicted to become more frequent [43], increasing the length and frequency of low-stage periods. Similar, increasingly extreme flows have been observed in many rivers around the world [5,9,14,23,24,25,37,50,51].
4.2. The Relationship between Hydrology and Bank Erosion
Short-term field measurements of bank erosion have allowed us to investigate the relationship between hydrology and bank erosion at a better temporal resolution (every four months). Bank erosion is associated not only with flood waves at or above bankfull levels, but also any water level, just to different extents. During low-stage periods, when flood waves with 50-150 cm water level increase conveyed in the Rába’s channel, the average rate of bank erosion was below 1 m/4 months. The channel-forming function of small and medium stages is related to their locally high slope and flow velocity due to the roughness of the bottom, which allows for slight sediment transport [3,52]. On the other hand, persistent low flows can proportionally determine the hydrology of a river and thus contribute, albeit in a small way, to the transport of sediment in the channel [28].
Successive and larger (200-400 cm) flood waves can cause significant bank erosion along the entire length of a reach. Thus, on average, the more frequent flood waves on the Rába were associated with an erosion of 2.8 m/4 months (i.e., 8.4 m/y), while on some points of the bank, the erosion rates were as much as 10-19 m/4 months (i.e., 30–58 m/y). This is due to the fact that bankfull levels or overbank floods create the best conditions for intensive bank erosion [14,19,20,21,26,27]. It is related to the high specific stream power during flashy floods and the fast rising and falling limbs of flood waves. Under these circumstances, the formerly collapsed bank material could be removed from the feet of the banks, the bottom of the channel is incising, and the flow could directly erode the banks [17,24,52].
An important element of the hydrological changes is the seasonal change of floods [52,53]. In the case of the Rába River, the early spring floods became absent, but new floods appeared in summer and early autumn. Pastures and plough fields are mainly along the river, and the roots of the herbs can stabilise the banks just during the growing season [17,52]. However, this bank stabilising effect cannot be achieved prior to their development. The seasonal shift in the flooding period is therefore important, since in the second half of the 20th century, during the early spring floods, the banks of the Rába were less stabilised by weak vegetation, and therefore, the bank erosion was greater than now.
Regime changes also affect the spatiality of bank erosional processes. Our short-term study has shown that bank erosion shows a longitudinal trend only during major flood events. Then, with the gradual slope decrease, the bank erosion also gradually decreases. However, this downstream trend does not prevail during low stages, and bank erosion in all meanders becomes more uniform regardless of their longitudinal position.
4.3. Relationship between Hydrology and Bank Erosion: A Conceptual Model
During the first few decades of the study (1951–1971), the gradually increasing bank erosion was driven by stages at or above the bankfull level. These flood waves were frequent and occurred at regular intervals. In addition, a record-high flood occurred in 1965, besides the level of low stages increased. Therefore, the higher stream power facilitated bank erosion. According to our conceptual model, the bankfull water levels created suitable conditions for intense bank erosion [26,27]. As flood waves and low stages followed each other evenly in the second half of the 1950s, the river also experienced a strong lateral erosion, as the channel had to expand to convey the floods. Meanwhile, the low stages allowed the formation of mass movements (e.g., landslides, falls) of the banks. The elevated low water levels, the higher variability of stages, and the higher slope (65 cm/km) allowed for the transport of debris material from the feet of the banks. However, in the last five years (1967–1971), the lower frequency and height of near-bankfull floods no longer justified the high bank erosion rate. This refers to the existence of a delay in the response of the river, as it takes several years for the morphological response of the system to floods or their absence to be completed [4,15,42]. Thus, it could be identified as the end of a longer erosional cycle, initially triggered by frequent flood waves at or above the bankfull level and the extreme flood of 1965. The erosional cycle was closed by a relaxation period (1972–1982) [15,23]. No intensive bank erosion could be detected during this period despite the successive regular bankfull stages. It can be partly explained by the bank stabilisation works carried out at this time (1968–1984), which aimed to mitigate the destruction of overbank floods such as the one in 1965. Alternatively, the reduction in bank erosion might be explained by the fact that during the erosional phase of the cycle, the channel had widened and reached the parameters required to convey large flows. In addition, by the end of the period, large flood waves became rare, and the duration of low stages with low stream power increased, which also reduced bank erosion.
The bank erosional became increasingly intensive at the beginning of the next, second erosional cycle (1983–2004), reaching its maximum between 1996 and 1999. However, this erosional cycle had a smaller magnitude than the first cycle. The channel regulation of the Rába could explain the moderate bank erosion, as the revetments stopped lateral erosion of some meanders and sections. However, in the naturally developing units below them, the locally increased flow velocity might have intensified bank erosion, also facilitated by higher low and medium stages. This erosional cycle was also completed by a relaxation period of limited bank erosion (2000–2004) supported by the almost complete absence of bankfull flood waves.
The bank erosion increased slowly in the third bank erosional cycle (2005–2014) but was not as intense as in the previous cycles. This increased bank erosion might be related to the highest discharge on record in 2009 and the successive floods that typically were just below the bankfull level. These flood waves, similar to those experienced in 1951–1954 and 1996–1999, transported away the previous debris accumulated at the feet of the banks, deepened the channel, and thus increased the lateral channel migration. The mean bank erosion increased slightly, as the flood waves did not last long, and the long-lasting low stages did not support intensive bank erosion.
The last decade (2015-2024) could be evaluated as the end of the third erosion cycle (relaxation time) or the beginning of a completely new development phase. The bank erosional rate gradually decreased due to the absence or shortening of flood waves and bankfull stages and the increasing frequency of low stages (91–96%). Thus, although low stages create good topographic conditions for mass movements of the banks; however, the debris that accumulates at the feet of the banks cannot be transported away due to the absence of flood waves. The new development phase is justified by the fact that field measurements show that the shape of the meanders is also slowly changing. In some of the large, freely developing meanders, a slow fragmentation of the meander into smaller bends and the formation of secondary bends can be observed. These processes can be clearly explained by the increased frequency of low stages [23] as the flow circulation in the channel became altered [13,31]. Similar phenomena have been observed in sections below the construction of reservoirs, where secondary bends developed due to a decrease in discharge [23,54].
4.4. Spatiality of Bank Erosion
In most of the studied meanders, the largest bank erosion was downstream of the apex of the bend. This is consistent with the general course of meander evolution [31,39,55], as centrifugal force pushes the flow against the bank just downstream of the axis due to the water mass’s inertia. Thus, here the water mass can exert the greatest erosion, resulting in a gradual downstream migration of the meanders.
However, there were also meanders where the most intensively eroded points were upstream of the axis. This is partly explained by the development of secondary meanders, which is based on the assumption that the more sinuous thalweg triggers bank erosion at new locations. Kiss and Blanka [23] identified similar pattern of bank erosion on the Hernád River (Hungary) as an effect of water discharge reduction. On the other hand, the Rába River has repeatedly reworked the floodplain. Thus, if some meanders develop in areas that have been reworked a few decades earlier, the bank erosion will accelerate, as loose, barely compacted sediments create favourable conditions for rapid meander migration. Besides, mid-channel bars or islands could also divert the thalweg, initiation bank erosion at new locations.
There is also a difference between the meanders in terms of their confinement. At some points (high banks (related to terraces) are reached by meanders. The erosion of the high banks is slower than at normal banks as the river has to carry much more material. Therefore, the shape of the meanders will be distorted. Similar distorted meanders have been described along Hungary’s high banks of the Dráva and Hernád Rivers [23,24].
5. Conclusions
The changing bank erosion and riverbed development of the studied Rába section provided a classic example of fluvial processes altered by climate change. In our case, the water regime became more extreme with drastically increased duration of low stages. The flood waves, which shift into summer and early autumn, rise rapidly as heavy rainfall in the sub-alpine sub-catchment results in high run-off. At the same time, low stages have become increasingly dominant every year. Although bank erosion shows a cyclical temporal pattern, its amplitude is decreasing. This can be explained partly by the low stream power of the dominant low stages, the decreasing frequency of flood waves, and the increasing role of riparian vegetation.
In the previous decades, the greatest problem along the freely developing meanders of the Rába was bank erosion, as the intensive channel migration threatened the infrastructure in several places. Therefore, the meanders were either artificially cut off, or revetments were built at several points to provide bank protection. However, the study has shown that bank erosion is gradually decreasing, so large-scale interventions are likely unnecessary. Although bank erosion is still present, its moderate rate raises the questions about how it will change the sediment dynamics of the river and how it will affect the future habitat of birds using the banks (e.g., bank swallow and European bee-eater).
Author Contributions
Conceptualization, A.P.-E. and T.K.; methodology, A.P.-E.; formal analysis, A.P.-E.; data curation, A.P.-E.; writing—original draft preparation, A.P.-E.; writing—review and editing, A.P.-E. and T.K.; visualization, T.K. All authors have read and agreed to the published version of the manuscript.
Funding
The research was funded by the Sustainable Development and Technologies National Programme of the Hungarian Academy of Sciences (FFT NP FTA).
Data Availability Statement
The data presented in this study are available on request from the corresponding author.
Acknowledgments
The authors are grateful for the West–Transdanubian Water Directorate (NYUDUVIZIG) for providing the hydrological data, and for the advices of Dr. G. Tóth and Dr. G. Kovács (ELTE Savaria University Centre). We are also grateful for K. Nardai for providing help during the field surveys.
Conflicts of Interest
The authors declare no conflicts of interest.
References
- Flannigan, M.D.; Stocks, B.J.; Wotton, B.M. Climate change and forest fires. Science of the Total Environment 2000, 262, 221–229. [Google Scholar] [CrossRef] [PubMed]
- Munka, C.; Cruz, G.; Caffera, R.M. Long term variation in rainfall erosivity in Uruguay: a preliminary Fournier approach. GeoJournal 2007, 70, 257–262. [Google Scholar] [CrossRef]
- McGregor, G.R. Climate and Rivers. River Res. and Applic. 2019, 35, 1119–1140. [Google Scholar] [CrossRef]
- Werritty, A.; Leys, K.F. The sensitivity of Scottish rivers and upland valley floors to recent environmental change. Catena 2001, 42, 251–273. [Google Scholar] [CrossRef]
- Wyzga, B. A review on channel incision in the Polish Carpathian rivers during the 20th century. Developments in Earth Surf. Proc. 2007, 11, 525–553. [Google Scholar] [CrossRef]
- Rasheed, N.J.; Al-Khafaji, A.S.; Alwan, I.A. Investigation of rivers planform change in a semi-arid region of high vulnerability to climate change: A case study of Tigris River and its tributaries in Iraq. Reg. Stud. in Marine Sci. 2023, 68, 2352–4855. [Google Scholar] [CrossRef]
- Knox, J.C. Large increases in flood magnitude in response to modest changes in climate. Nature 1993, 361, 430–432. [Google Scholar] [CrossRef]
- Knox, J.C. Long-term episodic changes in magnitudes and frequencies of floods in the upper Mississippi River valley. In: Fluvial Processes and Environmental Change. Eds.: Brown, A.G., Quine, T.A., Wiley: Chichester, UK, 1999, pp. 255–282.
- Feng, X.; Zhang, G.; Yin, X. Hydrological responses to climate change in Nenjiang River basin, Northeastern China. Water Res. Manag. [CrossRef]
- Schneider, C.; Laize, C.L.R.; Acreman, M.C.; Floerke, M. How will climate change modify river flow regimes in Europe? Hydrology and Earth Syst. Sci. [CrossRef]
- Blöschl, G.; Hall, J.; Viglione, A.; et al. Changing climate both increases and decreases European river floods. Nature 2019, 573, 108–111. [Google Scholar] [CrossRef] [PubMed]
- Kondolf, G.M.; Piégay, H.; Landon, N. Channel response to increased and decreased bedload supply from land use change: contrasts between two catchments. Geomorphology 2002, 45, 35–51. [Google Scholar] [CrossRef]
- Lane, S.N.; Richards, K.S. Linking river channel form and process: time, space and causality revisited. Earth Surf. Proc. and Landforms 1997, 22, 249–260. [Google Scholar] [CrossRef]
- Gilvear, D.; Winterbottom, S.; Sichingabula, H. Character of channel planform change and meander development: Luangwa River, Zambia. Earth Surf. Proc. Landforms 2000, 25, 421–436. [Google Scholar] [CrossRef]
- Brunsden, D. A critical assessment of the sensitivity concept in geomorphology. Catena 200, 42, 99-123. [CrossRef]
- Radoane, M.; Obreja, F.; Cristea, I.; Mihailă, D. Changes in the channel-bed level of the eastern Carpathian rivers: Climatic vs. human control over the last 50 years. Geomorphology 2013, 193, 91–111. [Google Scholar] [CrossRef]
- Szalai, Z.; Balogh, J.; Jakab, G. Riverbank erosion in Hungary – with an outlook on environmental consequences. Hung. Geo. Bull. 2013, 2, 233–245. [Google Scholar]
- Czigány, Sz.; Pirkhoffer, E.; Balassa, B.; Bugya, T.; Bötkös, T.; Gyenizse, P.; Nagyváradi, L.; Lóczy, D.; Geresdi, I. Flash floods as a natural hazard in Southern Transdanubia. Földrajzi Közlemények 2010, 134, 281–298. [Google Scholar]
- Gutiérrez, F.; Gutiérrez, M.; Sancho, C. Geomorphological and sedimentological analysis of a catastrophic flash flood in the Arás drainage basin. Geomorphology 1998, 22, 265–283. [Google Scholar] [CrossRef]
- Gorczyca, E.; Krzemien, K.; Wronska-Walach, D.; Sobucki, M. Channel changes due to extreme rainfalls int he Polish Carpathians. In: Geomorphological impacts of extreme weather. Ed.: Lóczy D., Springer: Wellington, UK, 2013; pp. 23–37.
- Dixon, S.J.; Smith, G.H.S.; Best, J.L.; Nicholas, A.P.; Bull, J.M.; Vardy, M.E.; Sarker, M.H.; Goodbred, S. The planform mobility of river channel confluences: insights from analysis of remotely sensed imagery Earth-Sci. Rev. 2018, 176, 1–18. [Google Scholar] [CrossRef]
- Lehotsky, M.; Frandofer, M.; Novotny, J.; Rusnak, M.; Szmanda, J.B. Geomorphic/sedimentary responses of rivers to floods: case studies from Slovakia. In: Geomorphological impacts of extreme weather. Ed.: Lóczy D., Springer: Wellington, UK, 2013; pp. 37–53.
- Kiss, T.; Blanka, V. River channel response to climate- and human-induced hydrological changes: Case study on the meandering Hernád River, Hungary. Geomorphology 2012, 175, 115–125. [Google Scholar] [CrossRef]
- Kiss, T.; Blanka, V.; Andrási, G.; Hernesz, P. 2013. Extreme Weather and the Rivers of Hungary: Rates of Bank Retreat. In: Geomorphological Impacts of Extreme Weather: Case studies from central and eastern Europe. Ed.: Lóczy D., Springer: Wellington, UK, 2013; pp. 83–99.
- Ma, F.; Ye, A.; Gong, W.; Mao, Y.; Miao, C.; Di, Z. An estimate of human and natural contributions to flood changes of the Huai River. Global and Planetary Change 2014, 119, 39–50. [Google Scholar] [CrossRef]
- Page, K.; Read, A.; Frazier, P.; Mount, N. The effect of altered flow regime on the frequency and duration of bankfull discharge: Murrumbidgee River, Australia. River Res. Applic. 2005, 21, 567–578. [Google Scholar] [CrossRef]
- Gautier, E.; Brunstein, D.; Vauchel, P.; Roulet, M.; Fuertes, O.; Guyot, J.L.; Darozzes, J.; Bourrel, L. Temporal relations between meander deformation, water discharge and sediment fluxes in the floodplain of the Rio Beni (Bolivian Amazonia). Earth Surf. Proc. and Landforms 2006, 32, 230–248. [Google Scholar] [CrossRef]
- Kiss, T.; Sipos, Gy. Braid-scale geometry changes in a sand-bedded river: Significance of low stages. Geomorphology 2006, 84, 209–221. [Google Scholar] [CrossRef]
- Starkel, L. 2002. Change in the frequency of extreme events as the indicator of climatic change in the Holocene (in fluvial systems). Quat. Internat. 2007; 91, 25–32. [Google Scholar] [CrossRef]
- Gurnell, A.M.; Bertoldi, W.; Corenblit, D. Changing river channels: The roles of hydrological processes, plants and pioneer fluvial landforms in humid temperate, mixed load, gravel bed rivers. Earth-Sci. Rev. [CrossRef]
- Schumm, S.A. The Fluvial System. Wiley: New York, USA, 1977, p.338.
- Pfister, L.; Kwadijk, J.; Musy, A.; Bronstert, A.; Hoffmann, L. Climate cahnge, land use change and runoff prediction in the Rhine-Meuse basins. River Res. and Applic. 2004, 20, 229–241. [Google Scholar] [CrossRef]
- Constantine, J.A.; Pasternack, G.B.; Johnson, M.L. Logging effects on sediment flux observed in a pollen based record of overbank deposition in a northern California catchment. Earth Surf. Proc. Landforms 2005, 30, 813–821. [Google Scholar] [CrossRef]
- Haque, S.E.; Nahar, N.; Chowdhury, N.N.; Sayanno, T.K.; Haque, S. Geomorphological changes of river Surma due to climate change. Int J Energ Water Res, 2024. [Google Scholar]
- Knox, J.C. Historical Valley Floor Sedimentation in the Upper Mississippi Valley. Annals Ass. of Am. Geogr. 1987, 77, 224–244. [Google Scholar] [CrossRef]
- Brooks, A.P.; Brierley, G.J. Geomorphologic responses of lower Bega River to catchment disturbance. Geomorphology 1997, 18, 291–304. [Google Scholar] [CrossRef]
- Madej, M.A. Changes in channel-stored sediment, Redwood Creek, Northwestern California, 1947-1980. USGS Prof. Paper, 1454. [Google Scholar]
- Van De Wiel, M.J.; Coulthard, T.J.; Macklin, M.G.; Lewin, J. Modelling the response of river systems to environmental change: progress, problems and prospects for palaeo-environmental reconstructions. Earth-Sci. Rev. 2011, 104, 167–185. [Google Scholar] [CrossRef]
- Hooke, J.M. Styles of channel change. In: Applied Fluvial Geomorphology for Engineering and Management. Eds.: Thorne, C.R., Hey, R.D., Newson, M.D., Wiley: Chichester, UK, 1997, pp. 237–268.
- Usher, M.B. Landscape sensitivity: from theory to practice. Catena 2001, 42, 375–383. [Google Scholar] [CrossRef]
- Phillips, J.D. Nonlinear dynamical systems in geomorphology: revolution or evolution? Geomorphology 1992, 5, 219–229. [Google Scholar] [CrossRef]
- Thomas, M.F. Landscape sensitivity in time and space, an introduction. Catena 2001, 42, 83–98. [Google Scholar] [CrossRef]
- Kis, A.; Szabó, P.; Pongrácz, R. Spatial and temporal analysis of drought-related climate indices for Hungary for 1971–2100. Hung. Geo. Bull. 2023, 72, 223–238. [Google Scholar] [CrossRef]
- Kocsis, R.; Pongrácz, I.; Hatvani, G.; Magyar, N.; Anda, A.; Kovács-Székely, I. Seasonal trends in the Early Twentieth Century Warming (ETCW) in a centennial instrumental temperature record from Central Europe. Hung. Geo. Bull. 2024, 73, 3–16. [Google Scholar] [CrossRef]
- Csoma, J. Hydrology of the Rába River. [A Rába hidrográfiája]. Vízrajzi Atlasz, 1972; 14, 8–15. [Google Scholar]
- Bergmann, H.; Kollmann, W.; Vasvári, V.; Ambrózy, P.; Domokos, M.; Goda, L.; Laczay, I.; Neppel, F.; Szilágyi, E. Hydrologische Monographie des Einzugsgebietes der Oberen Raab. Series on Water Management, Technischen Universität Graz, Graz, Austria, 1996; p. 257.
- Károlyi, Z. Hydrography of the Little Plain [A Kisalföld vizeinek földrajza]. Földrajzi Közlemények 1962 10, 157-174.
- Laczay, I. Catchment and hydrology of the Rába. Regulation and meanders of the Rába. [A Rába vízgyűjtője és vízrendszere. A Rába szabályozása és kanyarulati viszonyai] Vízrajzi Atlasz 1972, 14, 4–7, 24-30.
- Crowder, D.W.; Knapp, H.V. Effective discharge recurrence intervals of Illinois streams. Geomorphology, 2005; 64, 167–184. [Google Scholar] [CrossRef]
- Zabolotnia, T.; Parajka, J.; Gorbachova, L.; Széles, B.; Blöschl, G.; Aksiuk, O.; Tong, R.; Komma, J. Fluctuations of Winter Floods in Small Austrian and Ukrainian Catchments. Hydrology 2022, 9, 38. [Google Scholar] [CrossRef]
- Nabih, S.; Tzoraki, O.; Zanis, P.; Tsikerdekis, T.; Akritidis, D.; Kontogeorgos, I.; Benaabidate, L. Alteration of the Ecohydrological Status of the Intermittent Flow Rivers and Ephemeral Streams due to the Climate Change Impact (Case Study: Tsiknias River). Hydrology 2021, 8, 43. [Google Scholar] [CrossRef]
- Foerst, M.; Rüther, N. Bank Retreat and Streambank Morphology of a Meandering River during Summer and Single Flood Events in Northern Norway. Hydrology 2018, 5, 68. [Google Scholar] [CrossRef]
- Gkiatas, G.T.; Koutalakis, P.D.; Kasapidis, I.K.; Iakovoglou, V.; Zaimes, G.N. Monitoring and Quantifying the Fluvio-Geomorphological Changes in a Torrent Channel Using Images from Unmanned Aerial Vehicles. Hydrology 2022, 9, 184. [Google Scholar] [CrossRef]
- García-Martínez, B.; Rinaldi, M. Changes in meander geometry over the last 250 years along the lower Guadalquivir River (southern Spain) in response to hydrological and human factors. Geomorphology 2022, 410, 108284. [Google Scholar] [CrossRef]
- Bertalan, L.; Rodrigo-Comino, J.; Surian, N.; Sulc Michalková, M.; Kovács, Z.; Szabó, Sz.; Szabó, G.; Hooke, J. Detailed assessment of spatial and temporal variations in river channel changes and meander evolution as a preliminary work for effective floodplain management. The example of Sajó River, Hungary. J. Envi. Manag, 2019; 248, 109277. [Google Scholar]
Figure 1.
The catchment of the Rába River is located in Central Europe (A). Its middle reach was studied in Hungary (B). The studied reach was divided into 14 units (R1-14) based on the degree of human impacts, and along some meanders (A-U), the bank erosion was measured using an RTK-GSP (C).
Figure 1.
The catchment of the Rába River is located in Central Europe (A). Its middle reach was studied in Hungary (B). The studied reach was divided into 14 units (R1-14) based on the degree of human impacts, and along some meanders (A-U), the bank erosion was measured using an RTK-GSP (C).
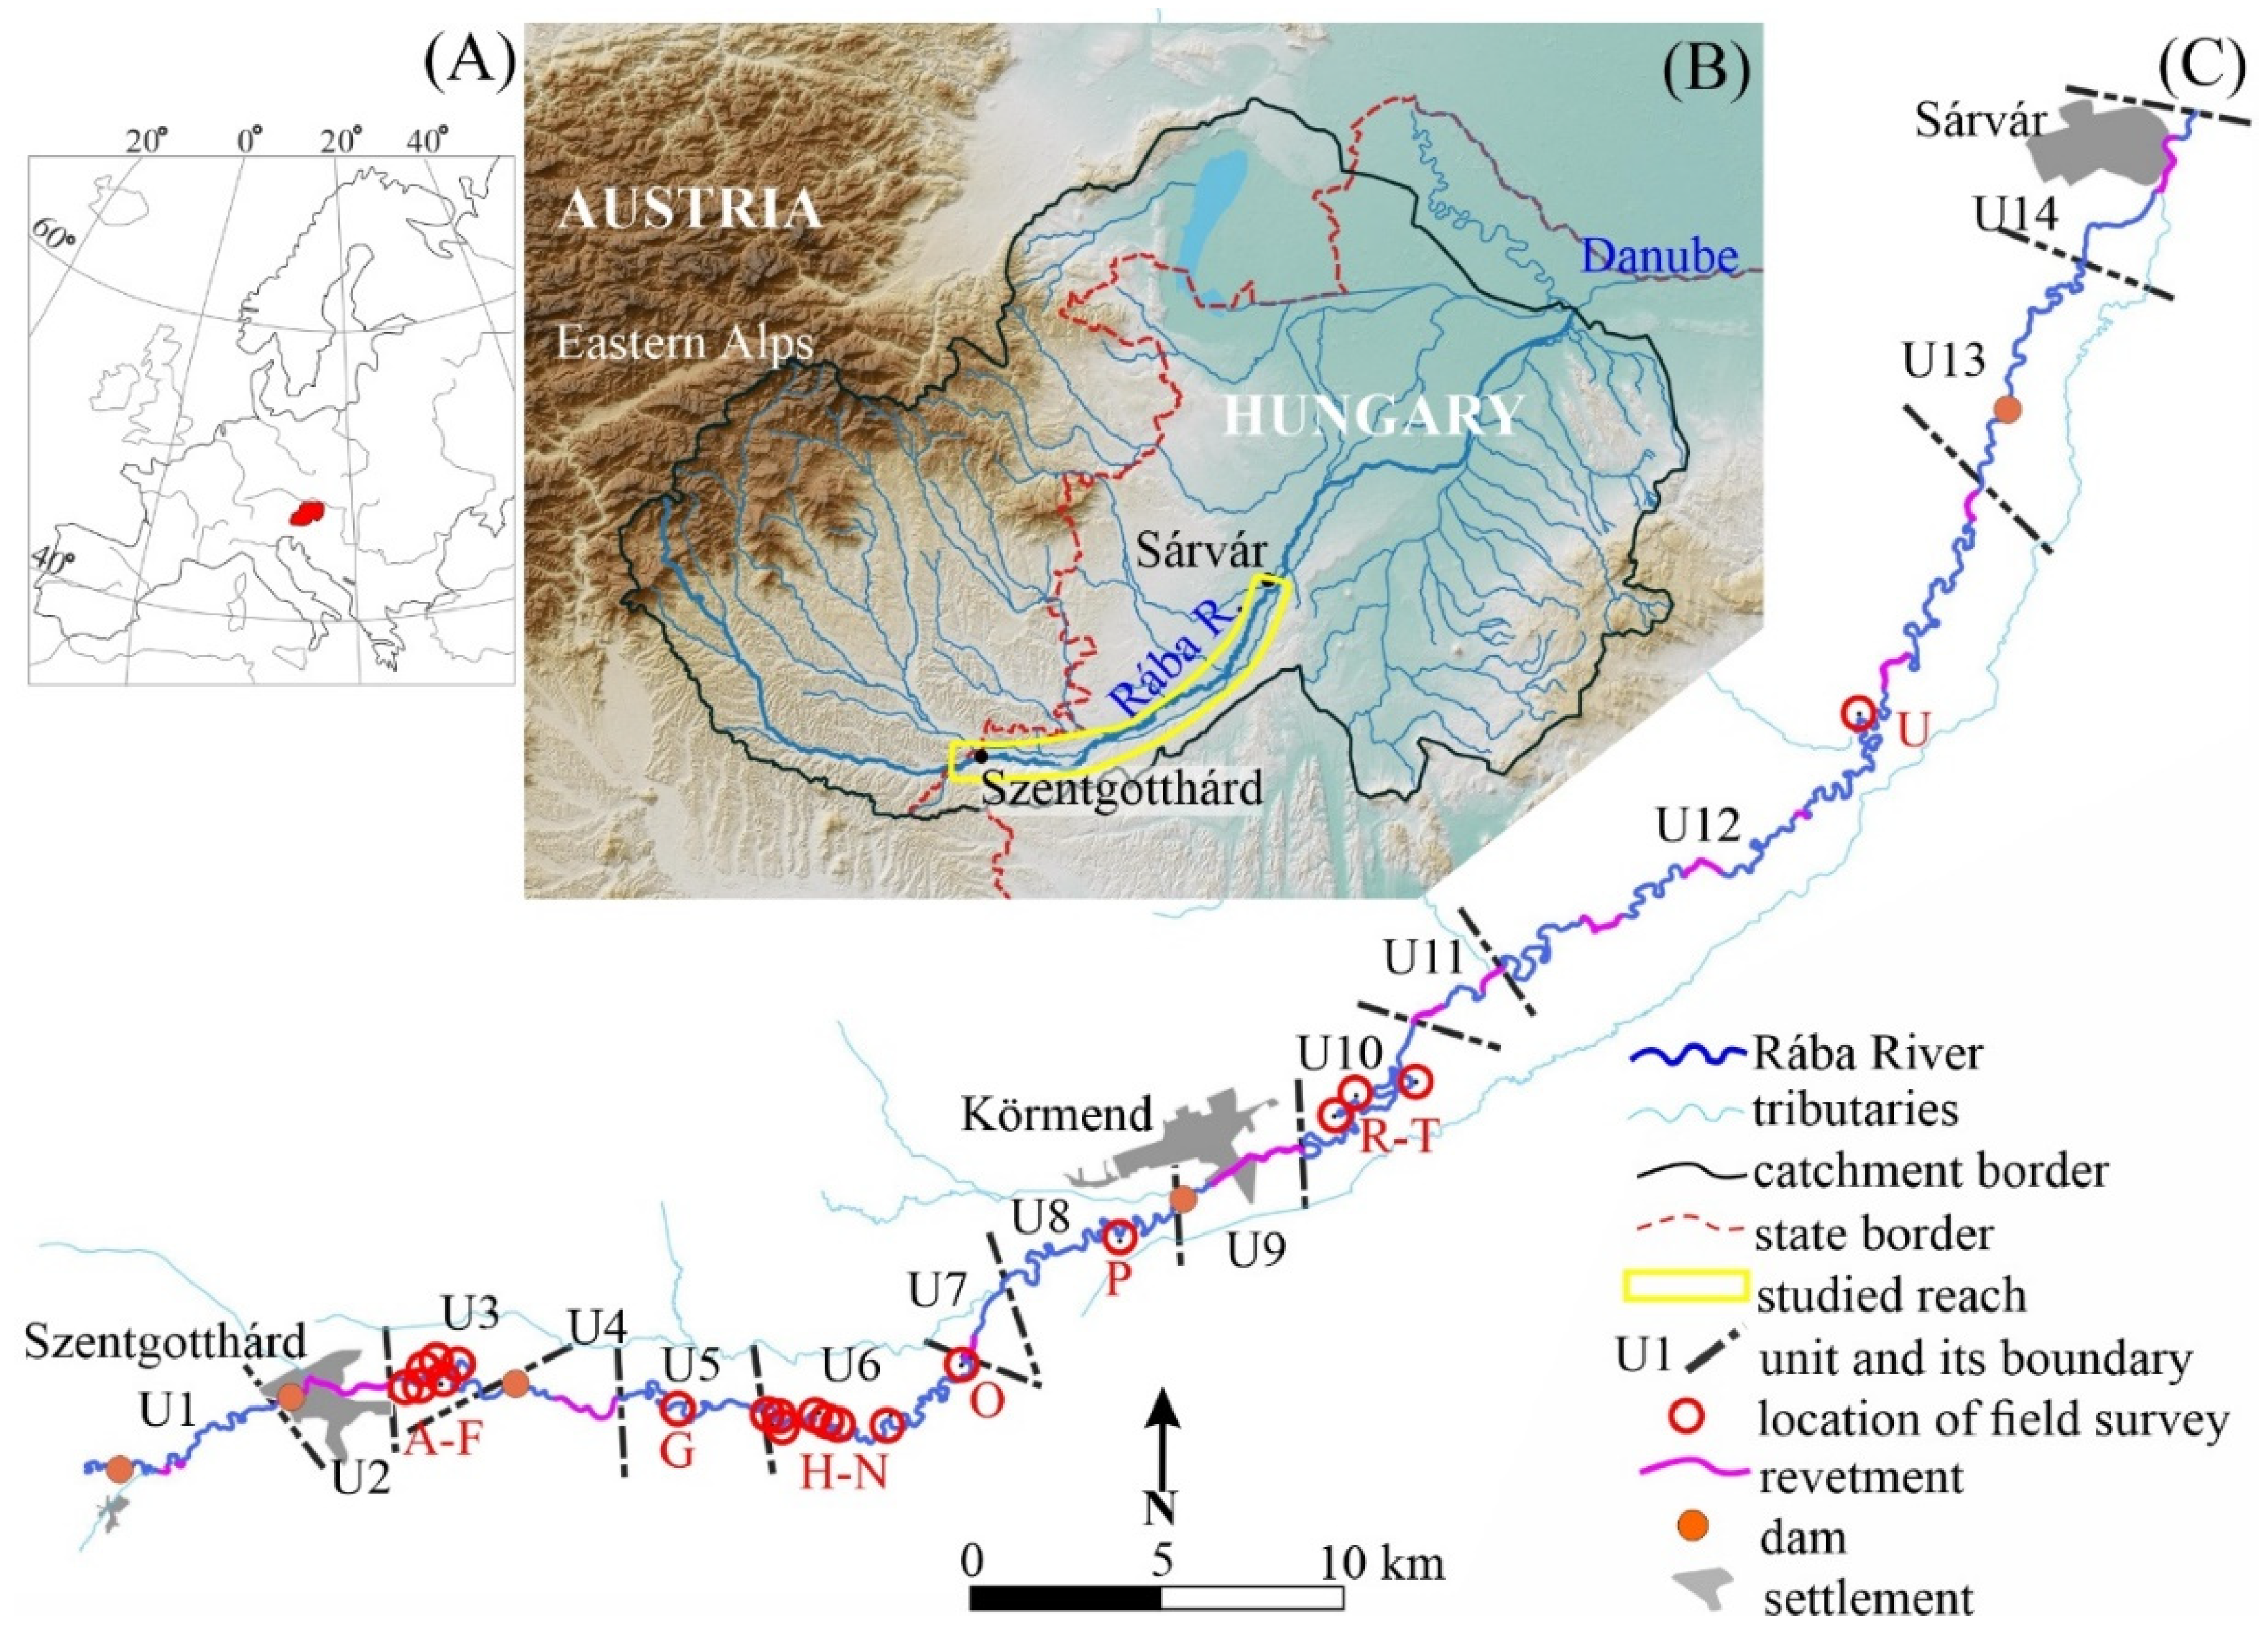
Figure 2.
The mean bank erosion was calculated based on the length of lines perpendicular to a former bankline (A). The maximum bank erosion was calculated within circles (B).
Figure 2.
The mean bank erosion was calculated based on the length of lines perpendicular to a former bankline (A). The maximum bank erosion was calculated within circles (B).
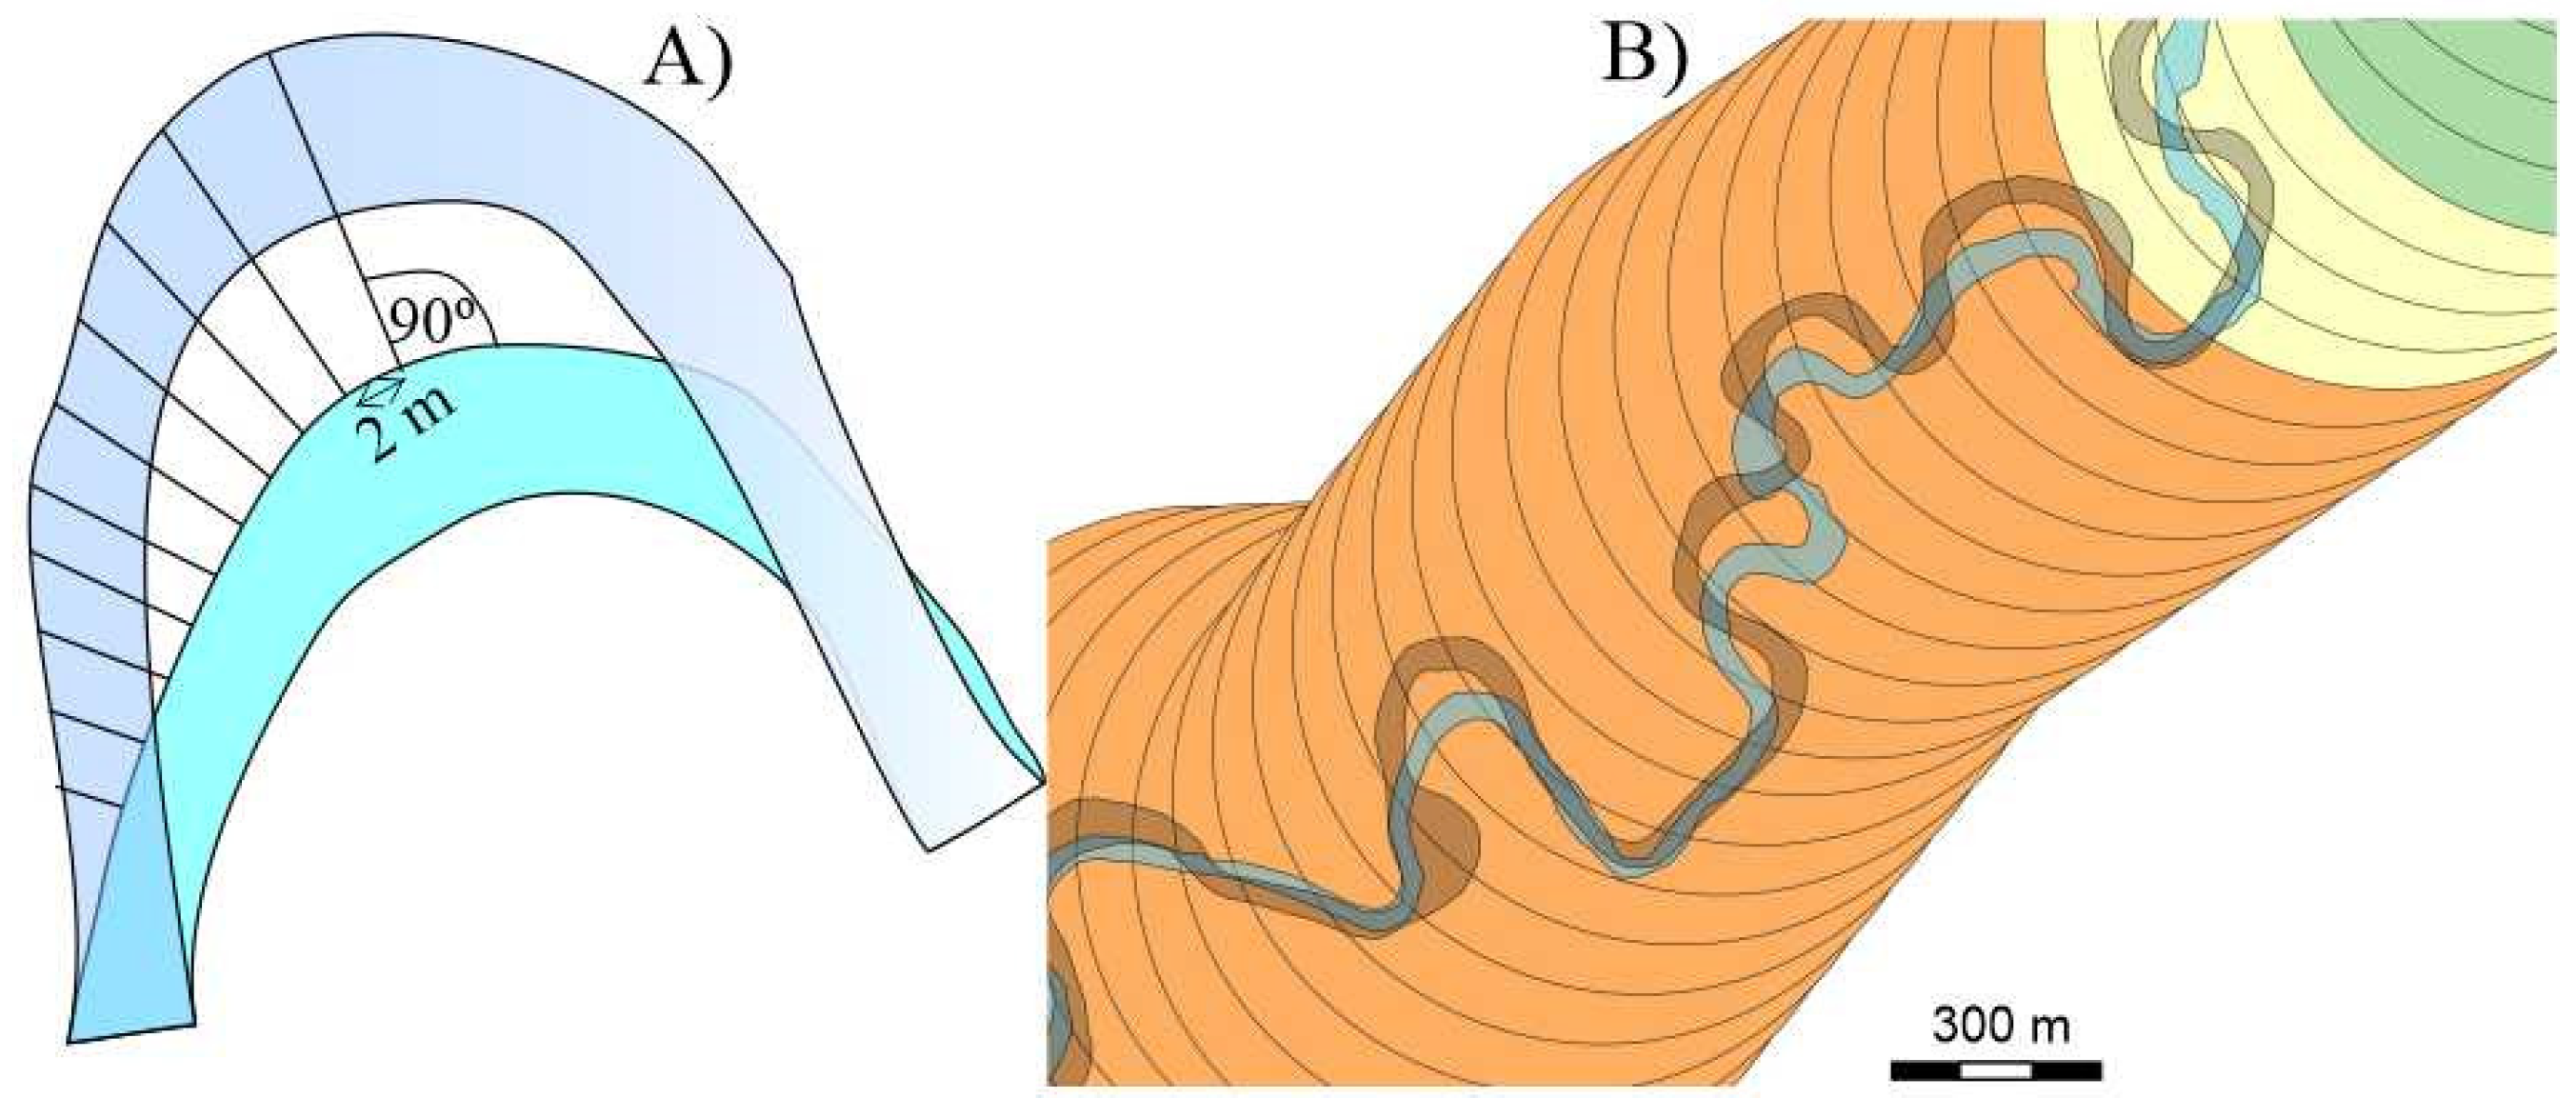
Figure 3.
Annual highest, mean, and minimum water levels (A) and annual highest, mean, and minimum discharges (B) measured at Szentgotthárd gauging station.
Figure 3.
Annual highest, mean, and minimum water levels (A) and annual highest, mean, and minimum discharges (B) measured at Szentgotthárd gauging station.
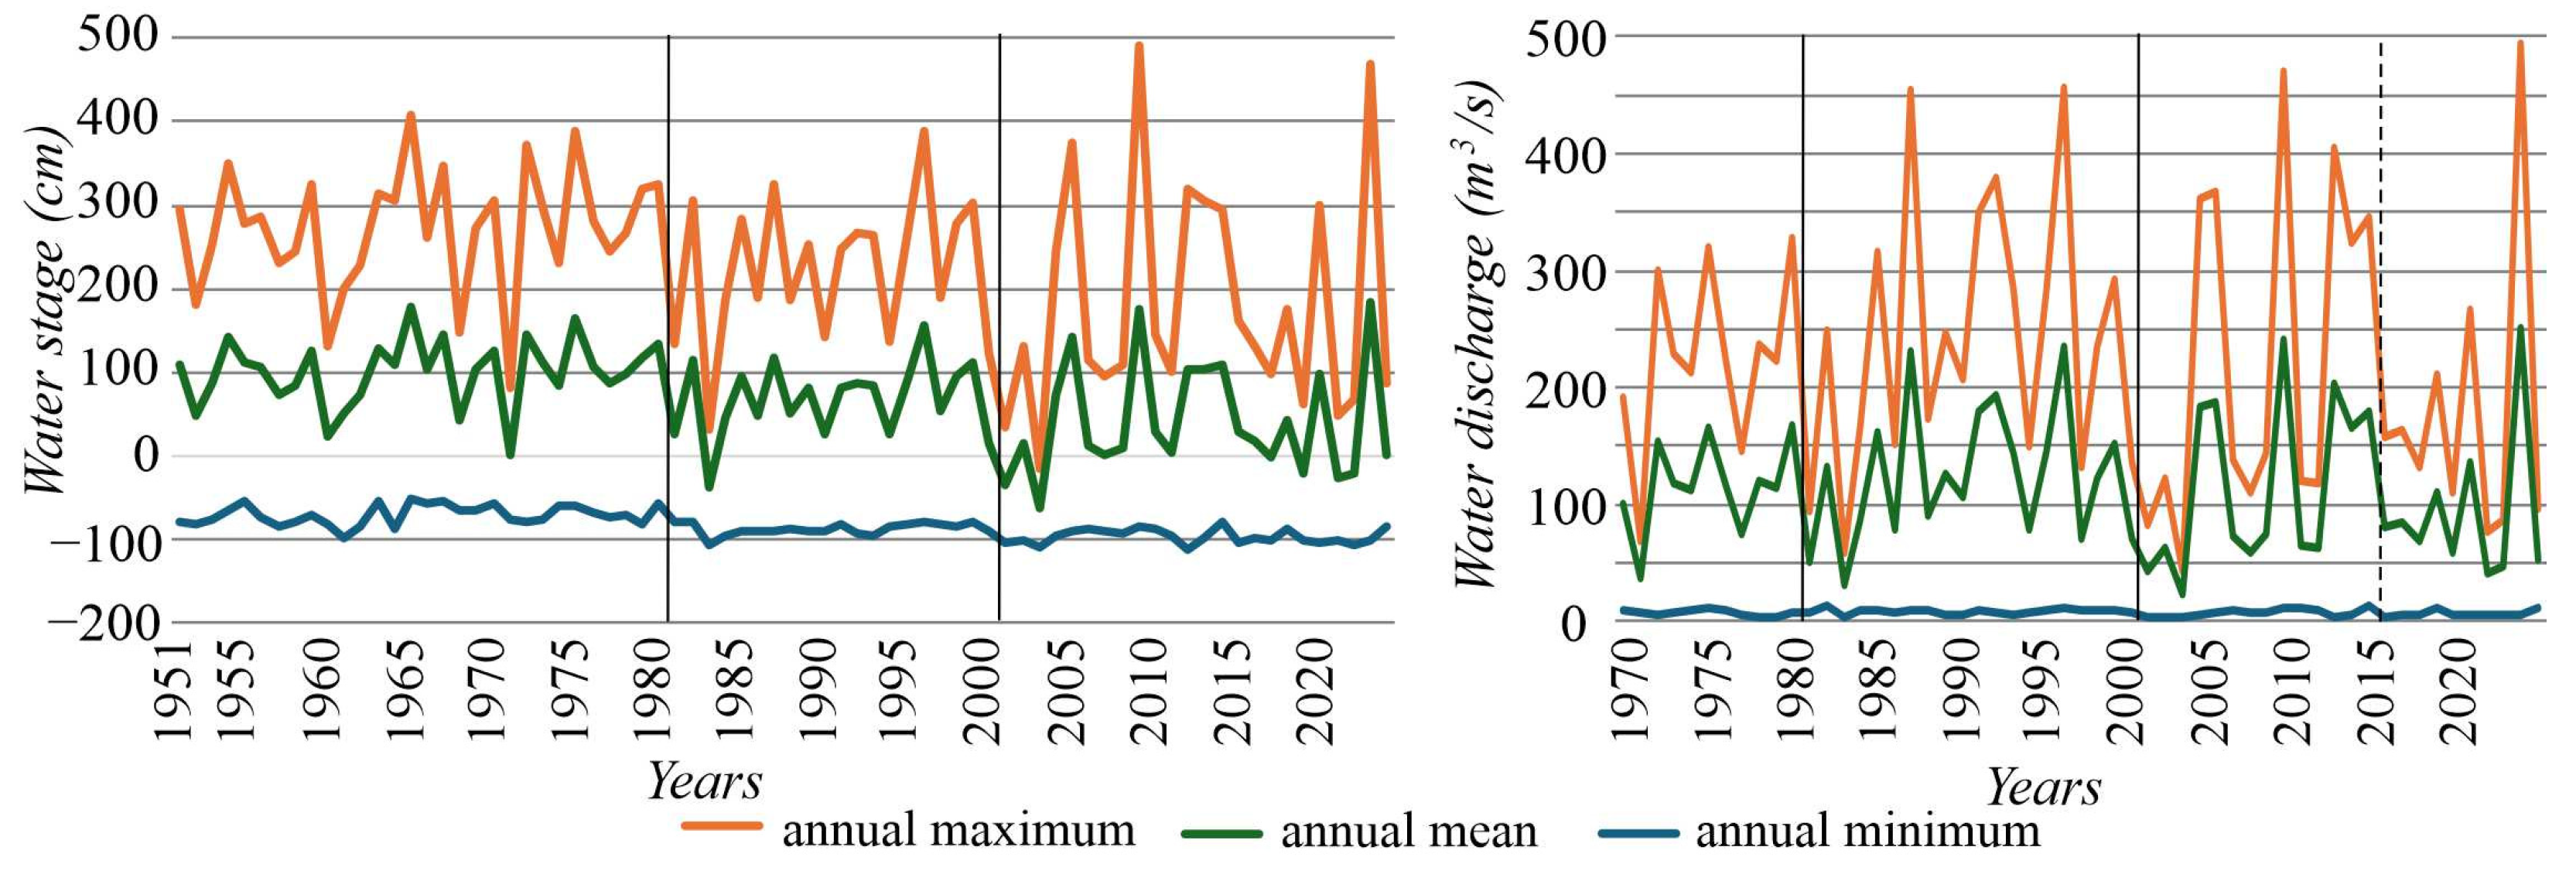
Figure 4.
Mean duration of low stages (≤0 cm) and overbank stages (≥250 cm) at Szentgotthárd.
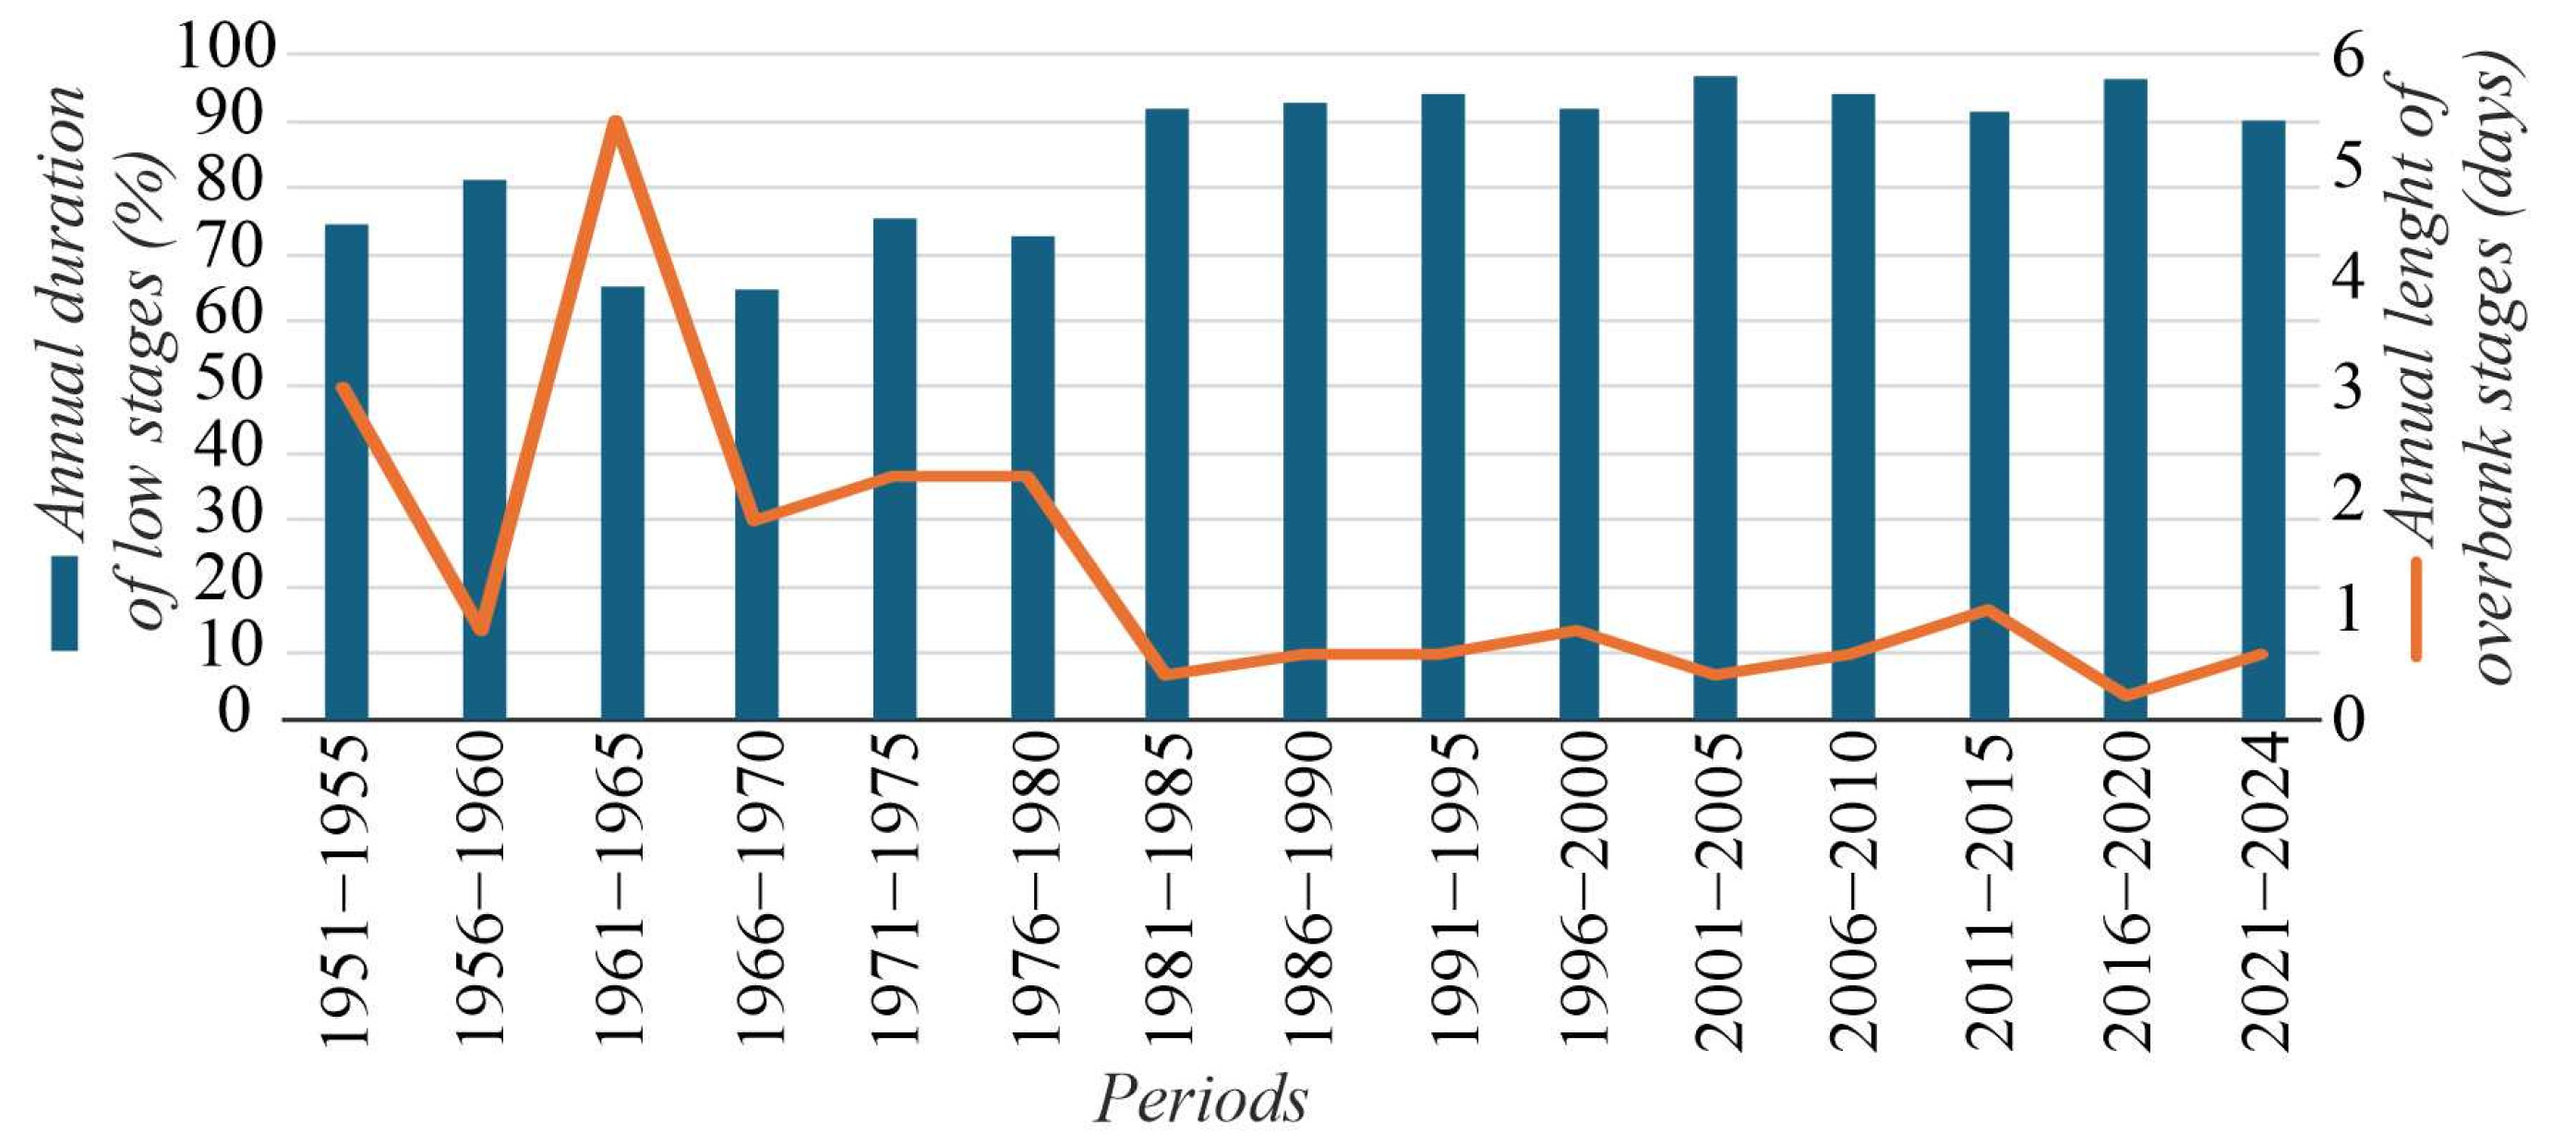
Figure 5.
Daily water level changes of the Rába River at Szentgotthárd measured between the RTK-GPS surveys.
Figure 5.
Daily water level changes of the Rába River at Szentgotthárd measured between the RTK-GPS surveys.
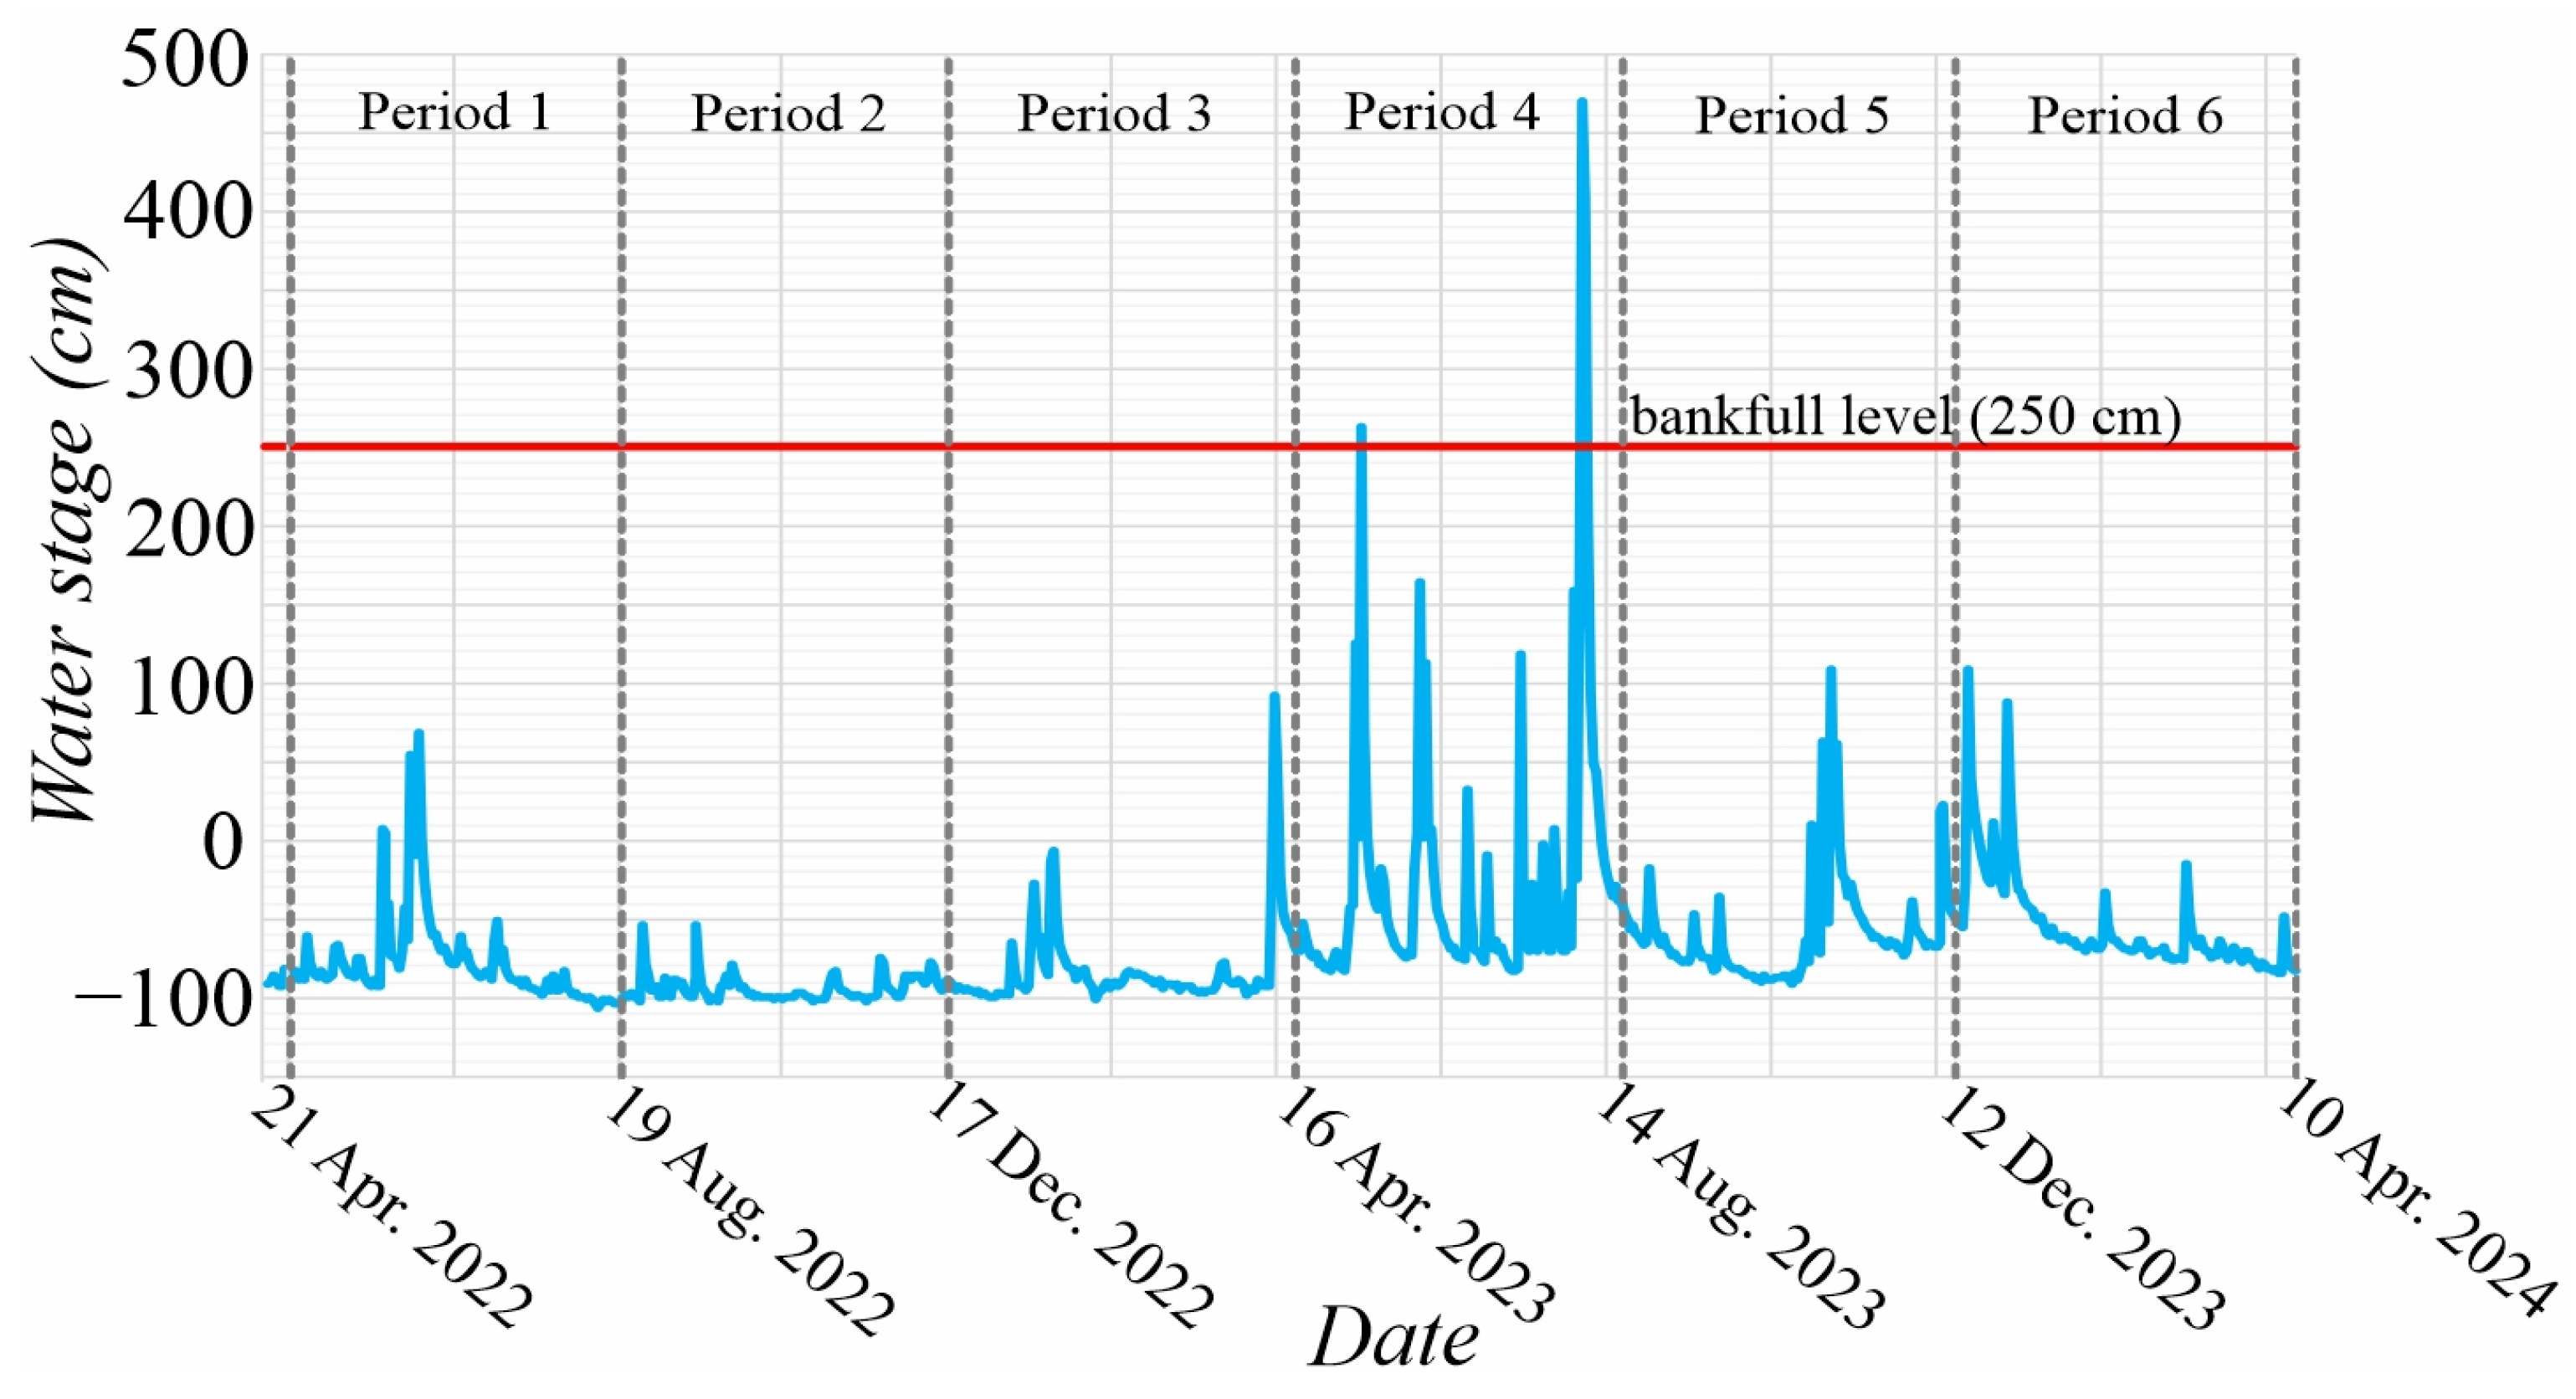
Figure 6.
Bank erosion rate of single bends of the studied reach of the Rába River between the available spatial data (topographical maps and aerial photos).
Figure 6.
Bank erosion rate of single bends of the studied reach of the Rába River between the available spatial data (topographical maps and aerial photos).
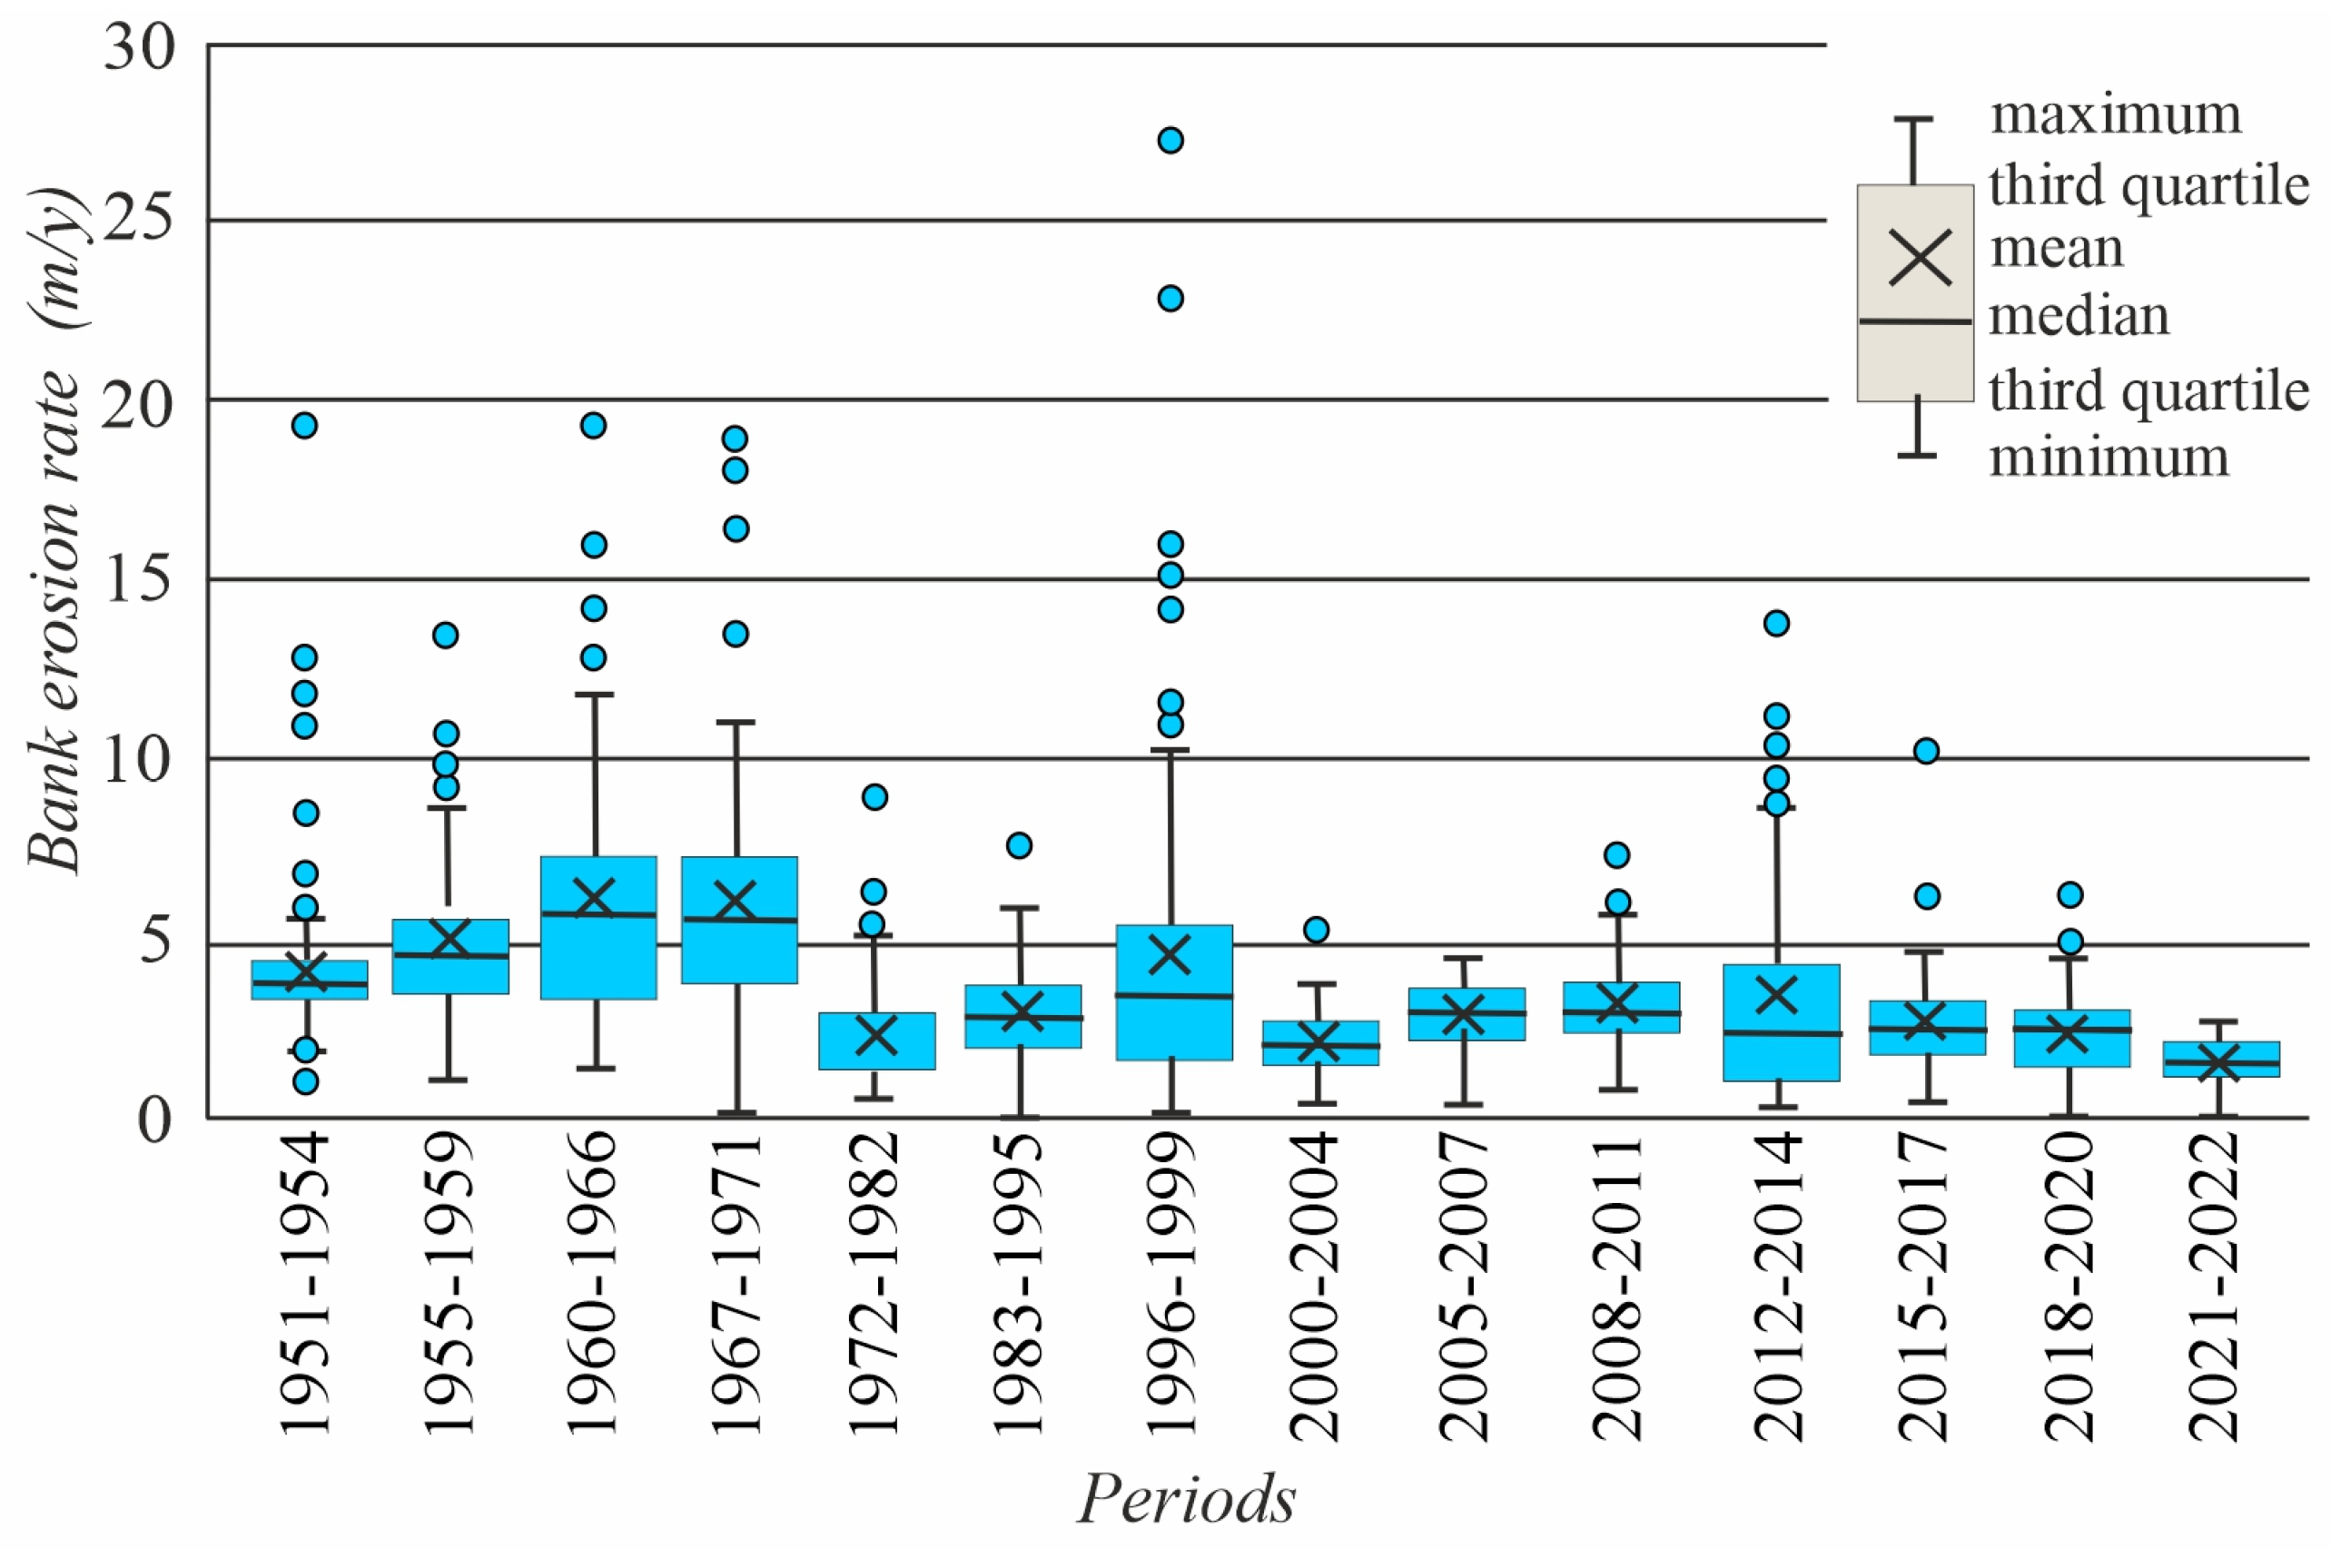
Figure 7.
Mean bank erosion (A) and maximum erosion of some meanders between the RTK-GPS surveys.
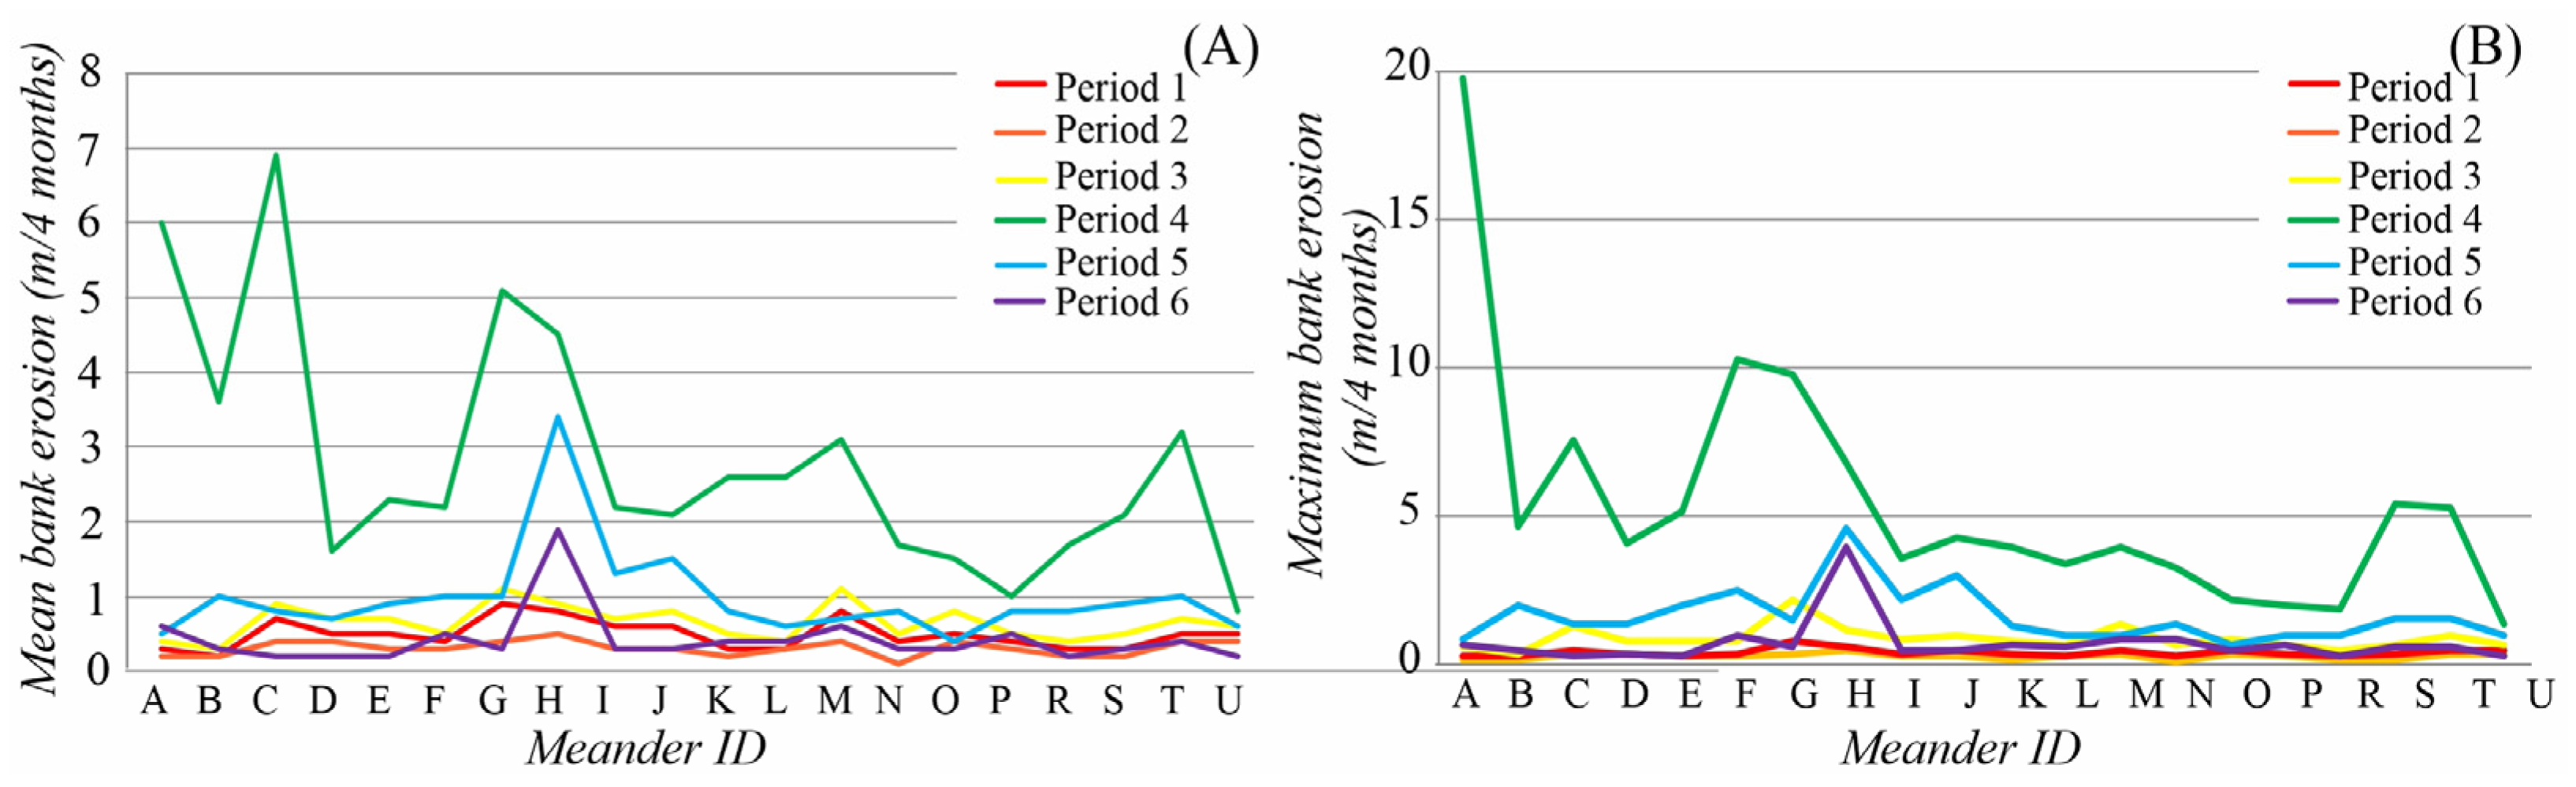
Figure 8.
Short-term (2022–2024) changes in the position of the bankline at selected meanders (A) and its long-term (1951–2022) changes (B). Meander B represents a bend where the location of an island influences the bank erosion. Meander C shows a classical expansion migration pattern. North of Meander E is a terrace rim; thus, the meander development is confined. On Meander H, secondary bends develop.
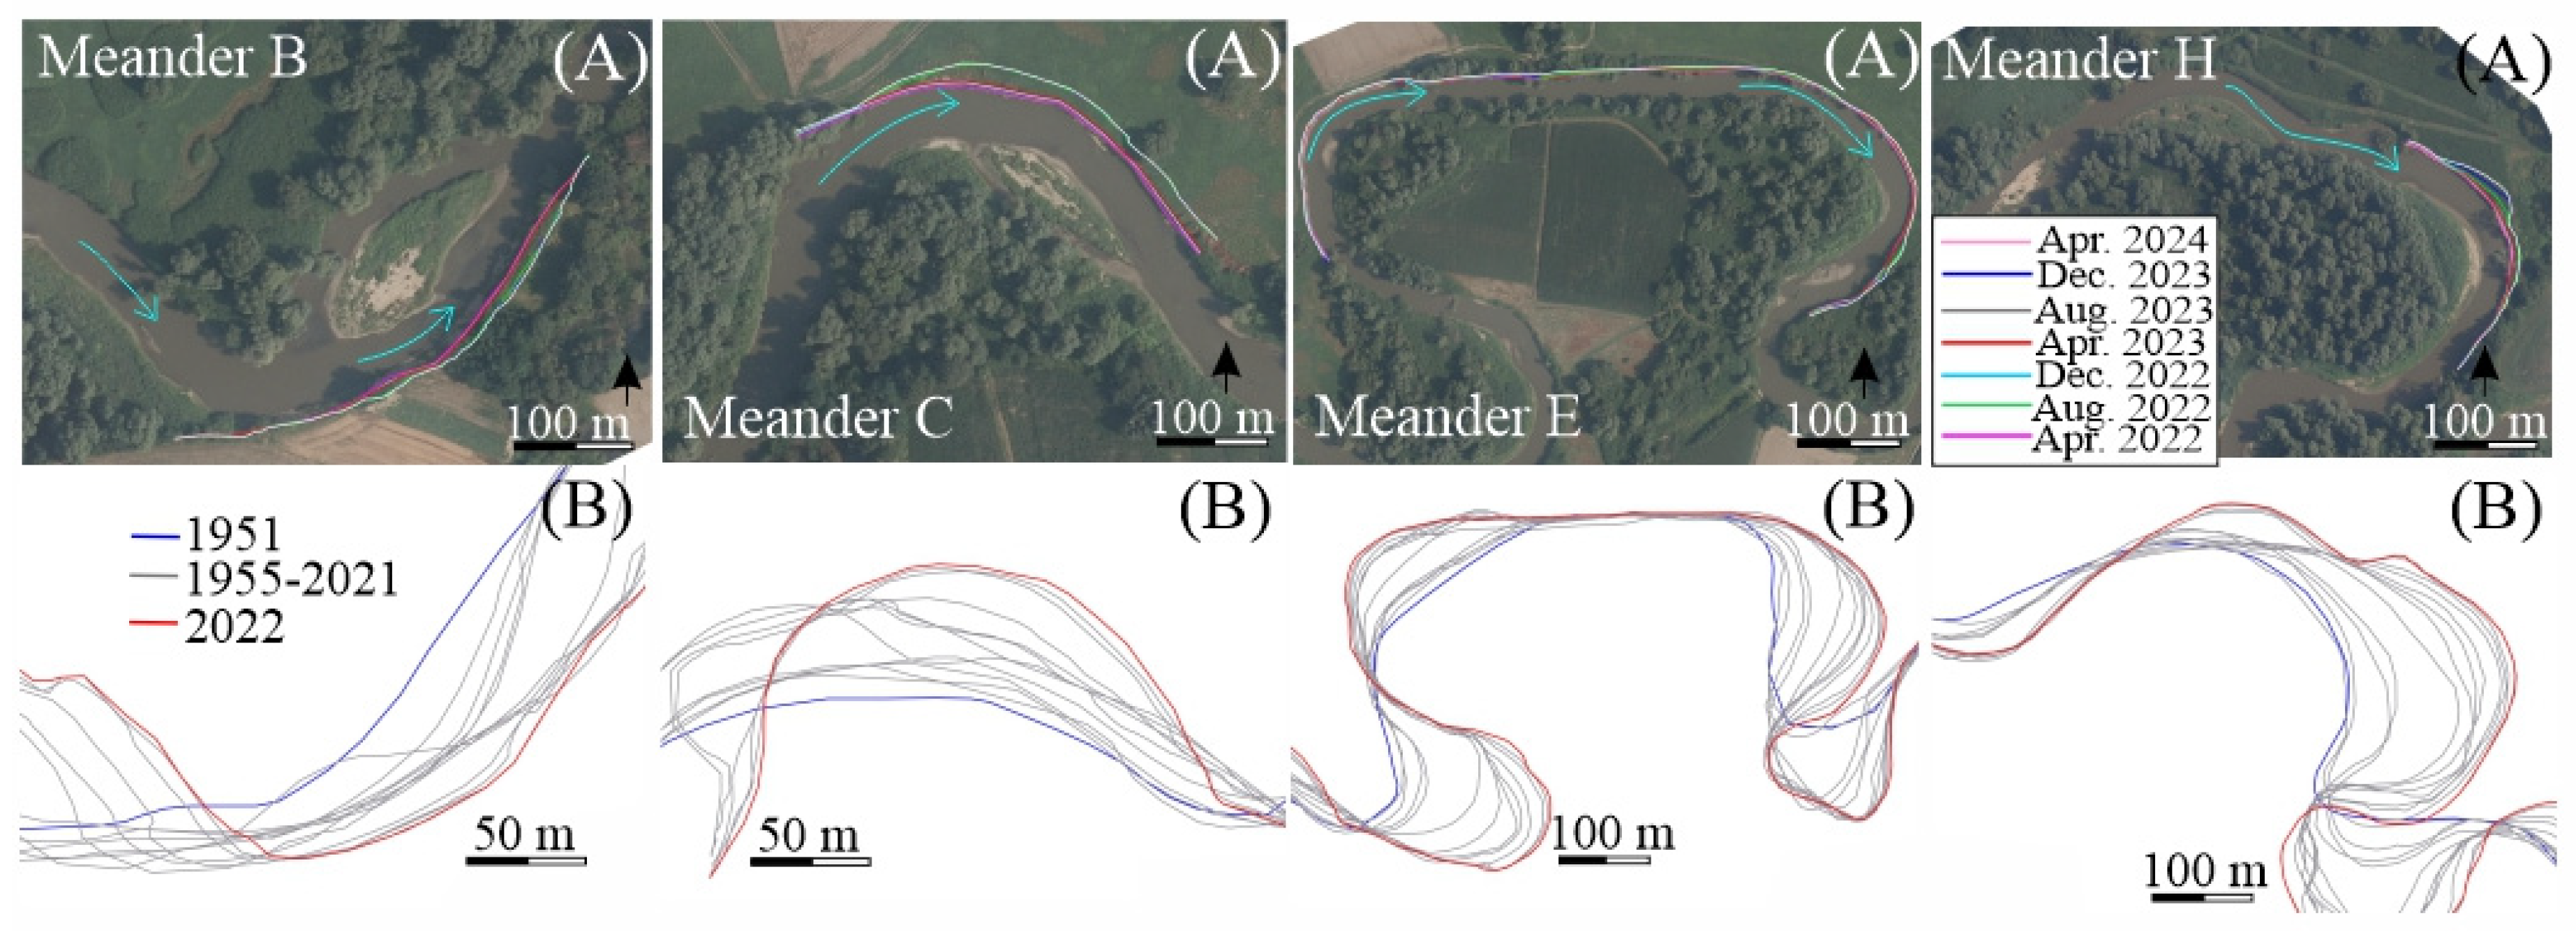

Table 1.
Bank erosion (m/4 months) in some meanders of the studied reach of the Rába based on RTK-GPS surveys of the bankline.
Table 1.
Bank erosion (m/4 months) in some meanders of the studied reach of the Rába based on RTK-GPS surveys of the bankline.
| Survey period | Period 1 | Period 2 | Period 3 | Period 4 | Period 5 | Period 6 |
| Apr. –Aug. 2022 | Aug. – Dec. 2022 | Dec. 2022 – Apr. 2023 | Apr. – Aug. 2023 | Aug. – Dec. 2023. | Dec. 2023. –Apr. 2024 | |
| mean bank erosion | 0.5±0.2 | 0.3±0.1 | 0.7±0.2 | 2.8±1.6 | 1.0±0.6 | 0.4±0.4 |
| greatest mean bank erosion (ID of meander) | 0.9 (G) | 0.5 (H) | 1.1 (G) | 6.9 (C) | 3.4 (H) | 1.9 (6) |
| maximum local bank erosion | 1.6 (G) | 0.8 (G) | 2.2 (G) | 19.8 (A) | 4.6 (H) | 4.0 (H) |
| number of bends with bank erosion higher than 0.8 m | 2 | 0 | 5 | 20 | 14 | 1 |
Disclaimer/Publisher’s Note: The statements, opinions and data contained in all publications are solely those of the individual author(s) and contributor(s) and not of MDPI and/or the editor(s). MDPI and/or the editor(s) disclaim responsibility for any injury to people or property resulting from any ideas, methods, instructions or products referred to in the content. |
© 2024 by the authors. Licensee MDPI, Basel, Switzerland. This article is an open access article distributed under the terms and conditions of the Creative Commons Attribution (CC BY) license (http://creativecommons.org/licenses/by/4.0/).
Copyright: This open access article is published under a Creative Commons CC BY 4.0 license, which permit the free download, distribution, and reuse, provided that the author and preprint are cited in any reuse.


