
Submitted:
23 June 2023
Posted:
26 June 2023
You are already at the latest version
Abstract
This work proposes a methodological approach applied to ephemeral gravel-bed streams to verify the change in the magnitude and frequency of hydrological events affecting the morphological dynamics and sediment budget in this type of channel. For the case study the Azohía Rambla, located in southeastern Spain, was chosen, emphasizing the research on two reference riverbed sections (RCRs): an upper one, with a predominance of erosion, and a middle one, where processes of incision, transport, and deposition converge. First, this approach focuses on relationships between peak discharges and sediment budgets during the period 2018 to 2022. For this purpose, water level measurements from pressure sensors, a One-Dimensional Hydrodynamic model, and findings from comparative analyses of high-resolution differential digital elevation models (HRDEM of Difference - HRDoD) based on SfM-MVS and LiDAR datasets were used. In a second phase the GeoWEPP model was applied to the period 1996-2022 in order to simulate runoff and sediment yield at the event scale for the watersheds draining into both RCRs. During the calibration phase a sensitivity analysis was carried out to detect the most influential parameters in the model and to confirm its capacity to simulate peak flow and sediment delivery in the area described above. Values of NS (Nash-Sutcliffe efficiency) and PBIAS (percent bias) equal to 0.86 and 7.81%, respectively, were found in the calibration period, while these indices were 0.81 and -4.1% in the validation period. Finally, different event class patterns (ECPs) were established for the monitoring period (2018-2022), according to flow stage and morphological channel adjustments (overtopping, bankfull and sub-bankfull, and half-sub-bankfull), and then retrospectively extrapolated to stages of the prior simulated period (1996-2018) from their typical sequences (PECPs). The results revealed a significant increase in the number of events and PECPs leading to lower bed incision rates and higher vertical accretion, which denotes a progressive increase in bed armoring and bank erosion processes.
Keywords:
Retrospective simulation
; ephemeral streams
; sediment budget
; SfM-MVS
; sediment yield
; event class pattern
; climate change
1. Introduction
The ephemeral streams draining steep and metamorphic catchments often experience sporadic and torrential runoff with high sediment loads, which cause important morphological channel changes at the event scale. The geomorphic response of these dry streams varies according to the magnitude and frequency of the flow events, being especially sensitive to short-term climatic changes and human impacts [1,2,3,4,5]. The largest discharges are capable of mobilizing and depositing a greater bedload, while the minor events tend to produce local bedform disturbances and the moderate ones promote scouring and down-cutting phenomena when the deposition does not compensate for the transitory bed erosion [6,7,8,9,10].
For decades, research on morphosedimentary changes in channels was restricted to descriptive observations in situ or interpretations of aerial photographs from different dates; however, this methodology has been largely superseded by techniques that fall into two general categories: direct-measurement field techniques, using erosion and deposition meters, and remote sensing or non-contact techniques such as Structure-from-Motion (SfM) photogrammetry and Terrestrial Laser Scanning (TLS) [11,12]. There is an extensive literature focusing on the use of each of these methods to detect and quantify geomorphic change at a variety of scales and settings [13,14,15,16,17,18,19], including morphological adjustments in dry channels [4,20,21,22,23,24]. The multi-temporal application of high resolution digital terrain models (HRDTMs) (pixel size < 5 cm), generated using SfM-MVS from UAV (unmanned aerial vehicles) and 3D point clouds (3DPC) (< 3 cm per pixel) from TLS, offers higher performance to detect spatial differences in bed elevation and surface bed texture caused by specific events [4,5,25]. In addition, this technology has been used in combination with hydrodynamic models, to address spatially-explicit analysis of stream power and transport efficiency in relation to changes in bed erosion and deposition [4,5,26]. An example of this is the coupled-model approach used by Norman et al. [9] to quantify geomorphic change at ephemeral stream restoration sites by integrating HRDTMs generated from repeat TLS surveys, a one-dimensional kinematic-wave runoff and erosion model, and a two-dimensional unsteady flow-and-sedimentation model. More recently, Conesa-García et al. [5] analyzed the relationships between changes in stream power, net sediment flux, bed stability, and morphological adjustments in ephemeral gravel-bed streams (EGBSs) at the cell scale, comparing HRDTMs of pre- and post-event stages and using a 1D hydrodynamic model calibrated with field information. These are courses with very high morphodynamic activity, generally devoid of gauging records and subjected to sudden variations in bedload.
In this paper we propose a methodological approach to retrospectively simulate channel morphological changes in an EGBS using HRDoDs versus predicted sediment yields at the sub-catchment level and the temporal regime of stream power. To perform the study an EGBS, the Azohía Rambla, located in the coastal area of the Baetic Mountains (southeastern Spain), was chosen. This approach focuses first on relationships between peak discharges and sediment budgets measured at checkpoints for specific events from 2018 to 2020, and then on runoff data and sediment yields obtained using the GeoWEPP model for the same cases after calibration/validation. Water depths and concentrations of suspended sediment recorded during the events of 2018 and 2019 were used for model calibration and validation, respectively. Topographical variations and sediment budgets, verified by combining HRDTMs with orthophotographs and point clouds dated in 2018, 2019, and 2020, and ground-based surveys, were analyzed in relation to changes in discharge in order to determine geomorphic flow thresholds. According to these thresholds, four classes of morphological adjustments were defined: 1. Global changes caused by discharges over the bankfull depth; 2. Large alterations at the bankfull stage driven by noticeable vertical bed accretion and lateral erosion; 3. Moderate adjustments during sub-bankfull flows that are able to modify alluvial bars; and 4. Minor events, in which the accretion of these bars ceases and shallow scouring and washing actions prevail. These geomorphic thresholds were considered in the establishment of event class patterns (ECPs), which could then be applied to the complete series of peak discharges simulated using GeoWEPP over the period 1996-2018. The hydraulic datasets were obtained from the application of a 1D hydrodynamic model fed by theoretical hydrographs, previously calibrated and validated with direct water measurements made during the runoff. The HRDoDs derived from both the SfM-MVS and TLS products for the simulation stages with different ECP led to much more satisfactory comparable results than those provided by lower resolution realistic DoDs. An objective of our study was to demonstrate how the combination of high-resolution topographic change detection, water erosion prediction models, and streamflow modelling can be used to retrospectively simulate changes in bed elevation and sediment budgets along ephemeral stream reaches with different efficiency in transport.
2. Study Area and Environmental Framework
The Azohía Rambla was chosen as the study area since it has been subject to extensive hydraulic and morphological monitoring, and because for this area there is a big field database and series of HRDTMs pre and post-flood events performed during the period 2018-2022 (CCAMICEM Project) [5]. This “rambla” is an EGBS that spreads into an alluvial fan developed at the foot of the Sierra Litoral de Cartagena and flows spasmodically into the Mediterranean Sea. Its waters drain a small coastal mountainous basin (15 km2) in southeastern Spain (Region of Murcia) (Figure 1).
Figure 1.
Location of the study area (Azohía Rambla basin) in southeastern Spain, and indication of the monitored channel reaches (upper and middle RCRs and their respective PBSAs).
Figure 1.
Location of the study area (Azohía Rambla basin) in southeastern Spain, and indication of the monitored channel reaches (upper and middle RCRs and their respective PBSAs).
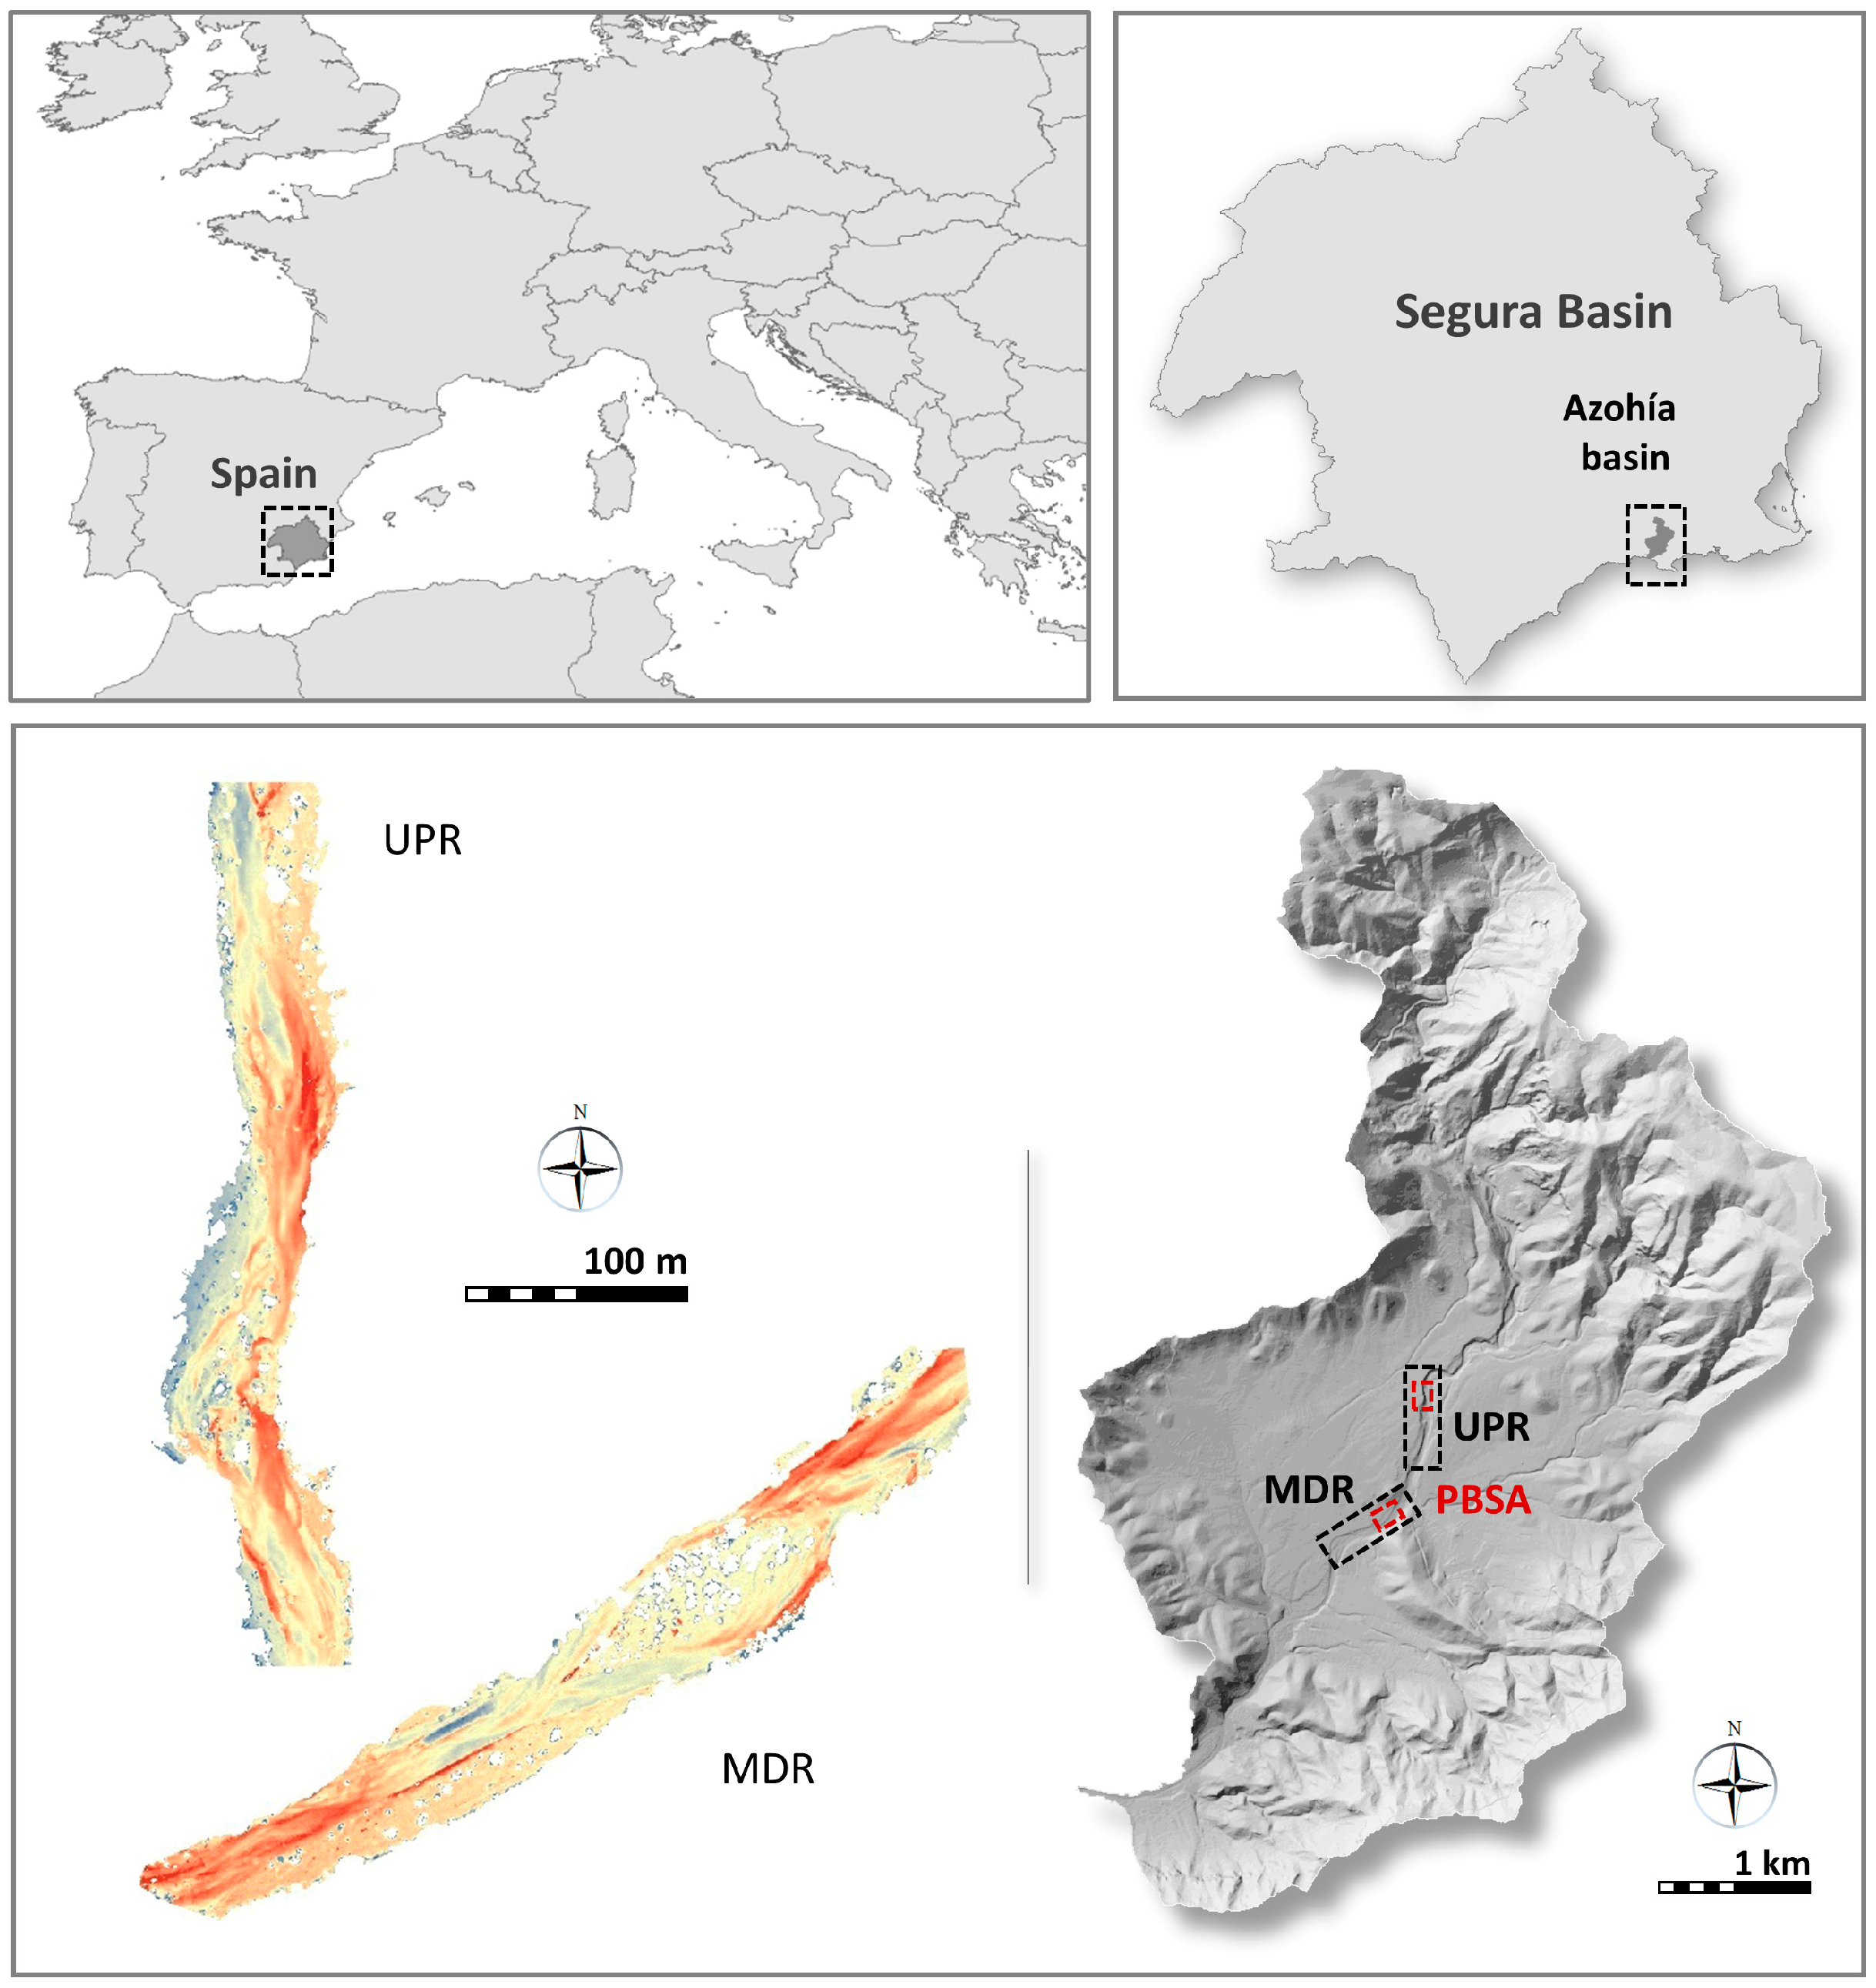
The drainage network is dendritic and elongated to the east and at the mouth, while its main active channel is 5 km long and very steeped in the headwater area (longitudinal bed slope above 0.03 m m-1). The study site is located in the Internal Zones of the eastern Betic Cordillera, where active complex tectonics have given rise to abrupt slopes on the highly fractured and erodible rocks [27,28]. Metamorphic materials (phyllites, schists, and quartzites), of Permian and Triassic age, mainly appear in the marginal mountain areas, while Quaternary detrital sediment and Miocene marls predominate in the alluvial fans and the valley bottom, respectively.
Fragile environmental conditions, associated with a semiarid climate (precipitation of 310 mm/year, maximum 30-minute rainfall intensity above 50 mm h-1, and extreme droughts), scarce vegetation, and steep hillside slopes play a relevant role here in weathering and erosion processes. This often leads to large flash floods [3] and intense fluvial geomorphic activity. A dense network of steep gullies in the headwaters area and detrital channel banks act as highly productive sources of sediment, especially coarse material (gravel and pebbles) [5]. As a result, the Azohía Rambla exhibits an active morphodynamics driven especially by rapid changes in bedform type and channel geometry.
Two reference channel reaches (RCRs) (the upper -UPR- and middle -MDR- RCR), of 160 m in length (Figure 1), were chosen based on their accessibility and the type of geomorphic adjustment in order to monitor and simulate changes in bed elevation using SfM-MVS photogrammetry, and to establish their relationships with the variations in stream power and sediment yield rates. In contrast, according to the criteria applied here to define ECPs, it does not seem appropriate to include the lower reach, since it does not have a well-defined channel at bankfull stage, and the overbank flows are distributed along a complex distributary drainage system, causing overall morphological adjustments (e.g. sediment-laden floodwater spills) and a changing temporary storage of sediment in bars and floodplain sectors [29]. Within each RCR a pilot bed survey area (PBSA), of 150 m2 in UPR and 450 m2 in MDR, was monitored with TLS to detect and quantify precise changes in bed sediment budgets and bed load mobility.
3. Materials and Methods
3.1. Hydrometeorological Records and Field Survey Datasets Collected during the Monitoring Period
During the monitoring period (2018-2022) the morphological and hydraulic effects related to singular extreme hydrological events, which occurred between each pair of field survey campaigns with UAV-SfM and TLS (Table 1), were analyzed. The different combinations of campaigns, consecutive or not, allowed us to establish up to six sequential patterns of events belonging to different morphological adjustment classes. These classes included overall, moderated, and local morphological channel changes and sediment budgets at two spatial scales: RCR and PBSA (Figure 1).
Specifically, changes in bed elevation and bedforms were determinated using SfM for the following stages: (1) September 2018 to September 2019, including the event of 18 November, 2018 and the flash flood on 19–20 April, 2019 (31.3 m3 s−1); (2) September 2019 to June 2020, characterized by one bankfull discharge (12 September, 2019) and other minor peak flows; (3) July 2020 to February 2023, the stage during which only one significant geomorphological impact event occurred (16-17 March, 2022). By integrating the previous stages, two new, somewhat longer periods were considered to define ECPs: (4) September 2018 to February 2023 and (5) September 2019 to February 2023. Finally, between the dates on which the TLS measurements were made (29 November, 2018; 5 September, 2019; and 26 July, 2020), the monitoring of two isolated events in time could be carried out: the peak flows of 12 September, 2019 and 23-24 March, 2020 (Table 1). In the entire period, only the April 2019 event exceeded the bankfull discharge and locally affected the active flood area in non-entrenched cross-sections. A precipitation event of more than 120 mm, with maximum intensities of 37.3 and 46 mm h-1 in one hour and half an hour, respectively, generated a peak discharge of 46.1 m3 s-1 in the lower reach (Table 1).

Table 1.
Dates of occurrence of flow events and field surveys using UAV-SfM and/or TLS techniques, with indication of rainfall data and peak discharges for each channel reach.
Table 1.
Dates of occurrence of flow events and field surveys using UAV-SfM and/or TLS techniques, with indication of rainfall data and peak discharges for each channel reach.
| Event / field survey |
Date | P (mm) |
Rainfall duration (h) | I1h (mm h-1) |
I30’ (mm h-1) |
Qp (m3 s-1) | |||
|---|---|---|---|---|---|---|---|---|---|
| UPR | MDR | LWR | |||||||
| UAV-SfM | 18 September, 2018 | ||||||||
| Peak flow | 18 November, 2018 | 35.6 | 9.3 | 17.6 | 32.4 | 0.1 | 0.1 | 0.2 | |
| TLS | 29 November, 2018 | ||||||||
| Peak flow | 19-20 April, 2019 | 123.2 | 21.2 | 37.3 | 46.0 | 21.9 | 31.3 | 46.1 | |
| UAV-SfM / TLS | 5 September, 2019 | ||||||||
| Peak flow | 12 September, 2019 | 93.9 | 16.9 | 20.2 | 26.4 | 8.4 | 10.9 | 15.1 | |
| Peak flow | 2 December, 2019 | 59.3 | 20.3 | 9.8 | 17.8 | 1.2 | 1.7 | 2.9 | |
| TLS | 16 January, 2020 | ||||||||
| Peak Flow | 20 January, 2020 | 66.3 | 20.8 | 10.6 | 12.8 | 2.7 | 3.6 | 5 | |
| Peak flow | 23-24 March, 2020 | 119.3 | 34.2 | 22.9 | 28.8 | 11.6 | 15.4 | 20.8 | |
| UAV-SfM / TLS | 26 July, 2020 | ||||||||
| Peak flow | 9 January, 2021 | 41.0 | 34.0 | 2.7 | - | 0.3 | 0.4 | 0.8 | |
| Peak flow | 7 March, 2021 | 35.4 | 22.1 | 5.6 | 10.6 | 0.1 | 0.2 | 0.3 | |
| Peak flow | 23 May, 2021 | 36.7 | 14.5 | 7.7 | 14.4 | 0.1 | 0.1 | 0.2 | |
| Peak flow | 16-17 March, 2022 | 92.0 | 28.2 | 29.6 | 34.2 | 12.9 | 16.3 | 22.8 | |
| Peak flow | 4-5 April, 2022 | 55.1 | 39.2 | 5.4 | 5.6 | 0.6 | 0.9 | 1.3 | |
| UAV-SfM | 10 February, 2023 | ||||||||
P = precipitation (mm); Qp = peak discharge (m3 s-1); I1h = rainfall intensity (mm h-1); I30’ = maximum 30-minute rainfall intensity (mm h-1); UPR = upper channel reach; MDR = middle reach; and LWR = lower reach.
3.1.1. Obtaining HRDoDs from HRMDT Datasets in the Monitoring Phase
The Structure-from-Motion Multi-View Stereo (SfM-MVS) and TLS techniques were used to generate orthomosaics and high-resolution digital elevation models (HRMDT with < 3 cm per pixel), to assess detailed changes in ground elevation and sediment budgets during the observation period along each RCR and PBSA.
-SfM-MVS Photogrammetry. The remote information was collected using a Phantom 4 Pro, equipped with a 20-Mp camera and 1-inch sensor, at an average flight height of 50 m, in order to obtain very high resolution aerial images (≈1–2 cm resolution) for a high-accuracy GeoWEPP model. We used the software tool DJI GS Pro© to pre-program the flight track and parameters for all the surveys. The Ground Control Points (GCPs) and Check Points (CPs) were established before the flights in the field, employing coded targets (from Agisoft PhotoScan Pro 1.2.2© software; Agisoft, Russia). Of those points, approximately 66% were assigned to GCPs, for georeferencing purposes, whereas the remaining 34% corresponded to CPs for the validation of the high-resolution digital terrain model (hereafter, HRDTM; Conesa-García et al., 2020, 2022; Puig-Mengual et al., 2021). The topographic survey of all coded marks was made with a GPS-RTK Prexiso G5© station (Leica, Germany), connected via a mobile signal to the regional network of differential corrections, GPS GNSS (Network of Reference Stations in the Region of Murcia “Meristemum”). In addition, FENO survey markers were used to establish some of those points as permanent benchmarks. All GPS data were collected in the WGS84 global reference system. Consistent overlaps of 80 to 90% in consecutive images were applied to ensure the correct definition of homologous points (Seifert et al., 2019). All the collected information -the captured images, the GCPs, and the CPs- was used in the software Agisoft PhotoScan Pro v.1.2.2© (Agisoft, Russia) to perform the structure-from-motion photogrammetry technique. Therefore, we generated the point cloud and continuous textured mesh, and the HRDTM for each of the survey events (pixel size 0.02 m), as well as an orthomosaic [5,24,30]. These final products were geo-referenced in the WGS84 system for further analysis.
-Terrestrial Laser Scanning (TLS). A Leica ScanStation C10 model terrestrial 3D laser scanner was used to perform multiple overlapped scans. The output 3D point clouds (3DPC) were then registered, using HDS targets from the dataset of September 5th, 2019 as the master 3DPC for all the TLS scans. On this date a field survey was carried out jointly with SfM-MVS, using FENO survey marks as the common reference for both techniques, TLS and UAV-derived 3DPC. The scans performed in November 2018, January 2020, and June 2020 were registered at that benchmark, with a mean error of 2 mm, using the iterative closest point (ICP) plugin of CloudCompare software and some stable nearby buildings as reference points.
The high resolution digital terrain models of the topographic difference (HRDoD) between pairs of HRDTM in all the SfM surveys performed, as well as between the TLS-generated HRDTM, were obtained using ArcGis 10.5© (ESRI, USA), by subtraction of the final topography from the previous one in the same area [31]. In all these HRDoDs, the extraction mask for the water sheet -at different peak flows- in each RCR and PBSA was applied; this procedure enabled the precise evaluation of the morphological changes and sediment budgets associated with each flood event.
3.1.2. Discarding other, Lower Resolution DTMs
Lower resolution DTMs were discarded due to the poor geometric and textural definition they offer in the identification of unit bedforms. The degree of sensitivity in grid resolution and the associated uncertainty were tested by comparing morphological sediment budgets estimated from DoD using National Plan of Aerial Orthophotography (NPAO) DEMs and SfM datasets for the RCRs during the monitoring and simulation periods. The DTMs of 2009 and 2016 were produced from point clouds captured by flights with NPAO LiDAR sensors. These are digital files with altimetric information from LiDAR point clouds, distributed in files 2×2 km in size and with a density of 0.5 points m-2. For the monitoring period (2016-2022) the DoDs resulted from the difference between the DTMs derived from the NPAO 2016 LiDAR point cloud (0.5 m per pixel) and those generated with SfM-MVS in 2023 after being converted at the same resolution; and the DoDs used to obtain the morphological sediment budgets in each reach during the period 2009-2016 were extracted from the 2009 NPAO DTMs and the 2018 SfM derivatives with similar resolution. Note that between 2016 and 2018, no event ascribed to the morphological change classes occurred. The substantial loss of spatial and volumetric information led to the NPAO DTMs being discarded.
3.2. Estimation of Changes in Bed Elevation and Sediment Budgets Using HRDoDs
Changes in the bed elevation, areas and volumes of erosion and deposition, and sediment budgets (net, unit, and total values) were calculated for both RCRs (UPR and MDR), and their respective PBSA, by combining the HRDoDs derived from each pair of consecutive HRMDT and high-density 3DPC. In particular, the total net volume difference (TNVD) (m³), average net thickness difference (ANTD) (m) for the monitored area, percent imbalance (PI) (%) (departure from equilibrium), total area of surface lowering (TASL) (m²), total area of surface raising (TASR) (m²), average unit volume of surface lowering (UVSL) (m³ m-2), and average unit volume of surface raising (UVSR) (m³ m-2) were calculated by applying different algebraic algorithms and matrices to the raster elevation images of interest, or simply to the HRDoD in question. The errors associated with these estimates were described and assumed for each comparative survey analysis according to Brasington et al. [32], providing very good accuracy in the assessment of pre- and post-flood-event sediment budgets.
3.3. Using GeoWEPP to Simulate Retrospective Peak Discharges and Sediment Yield Rates
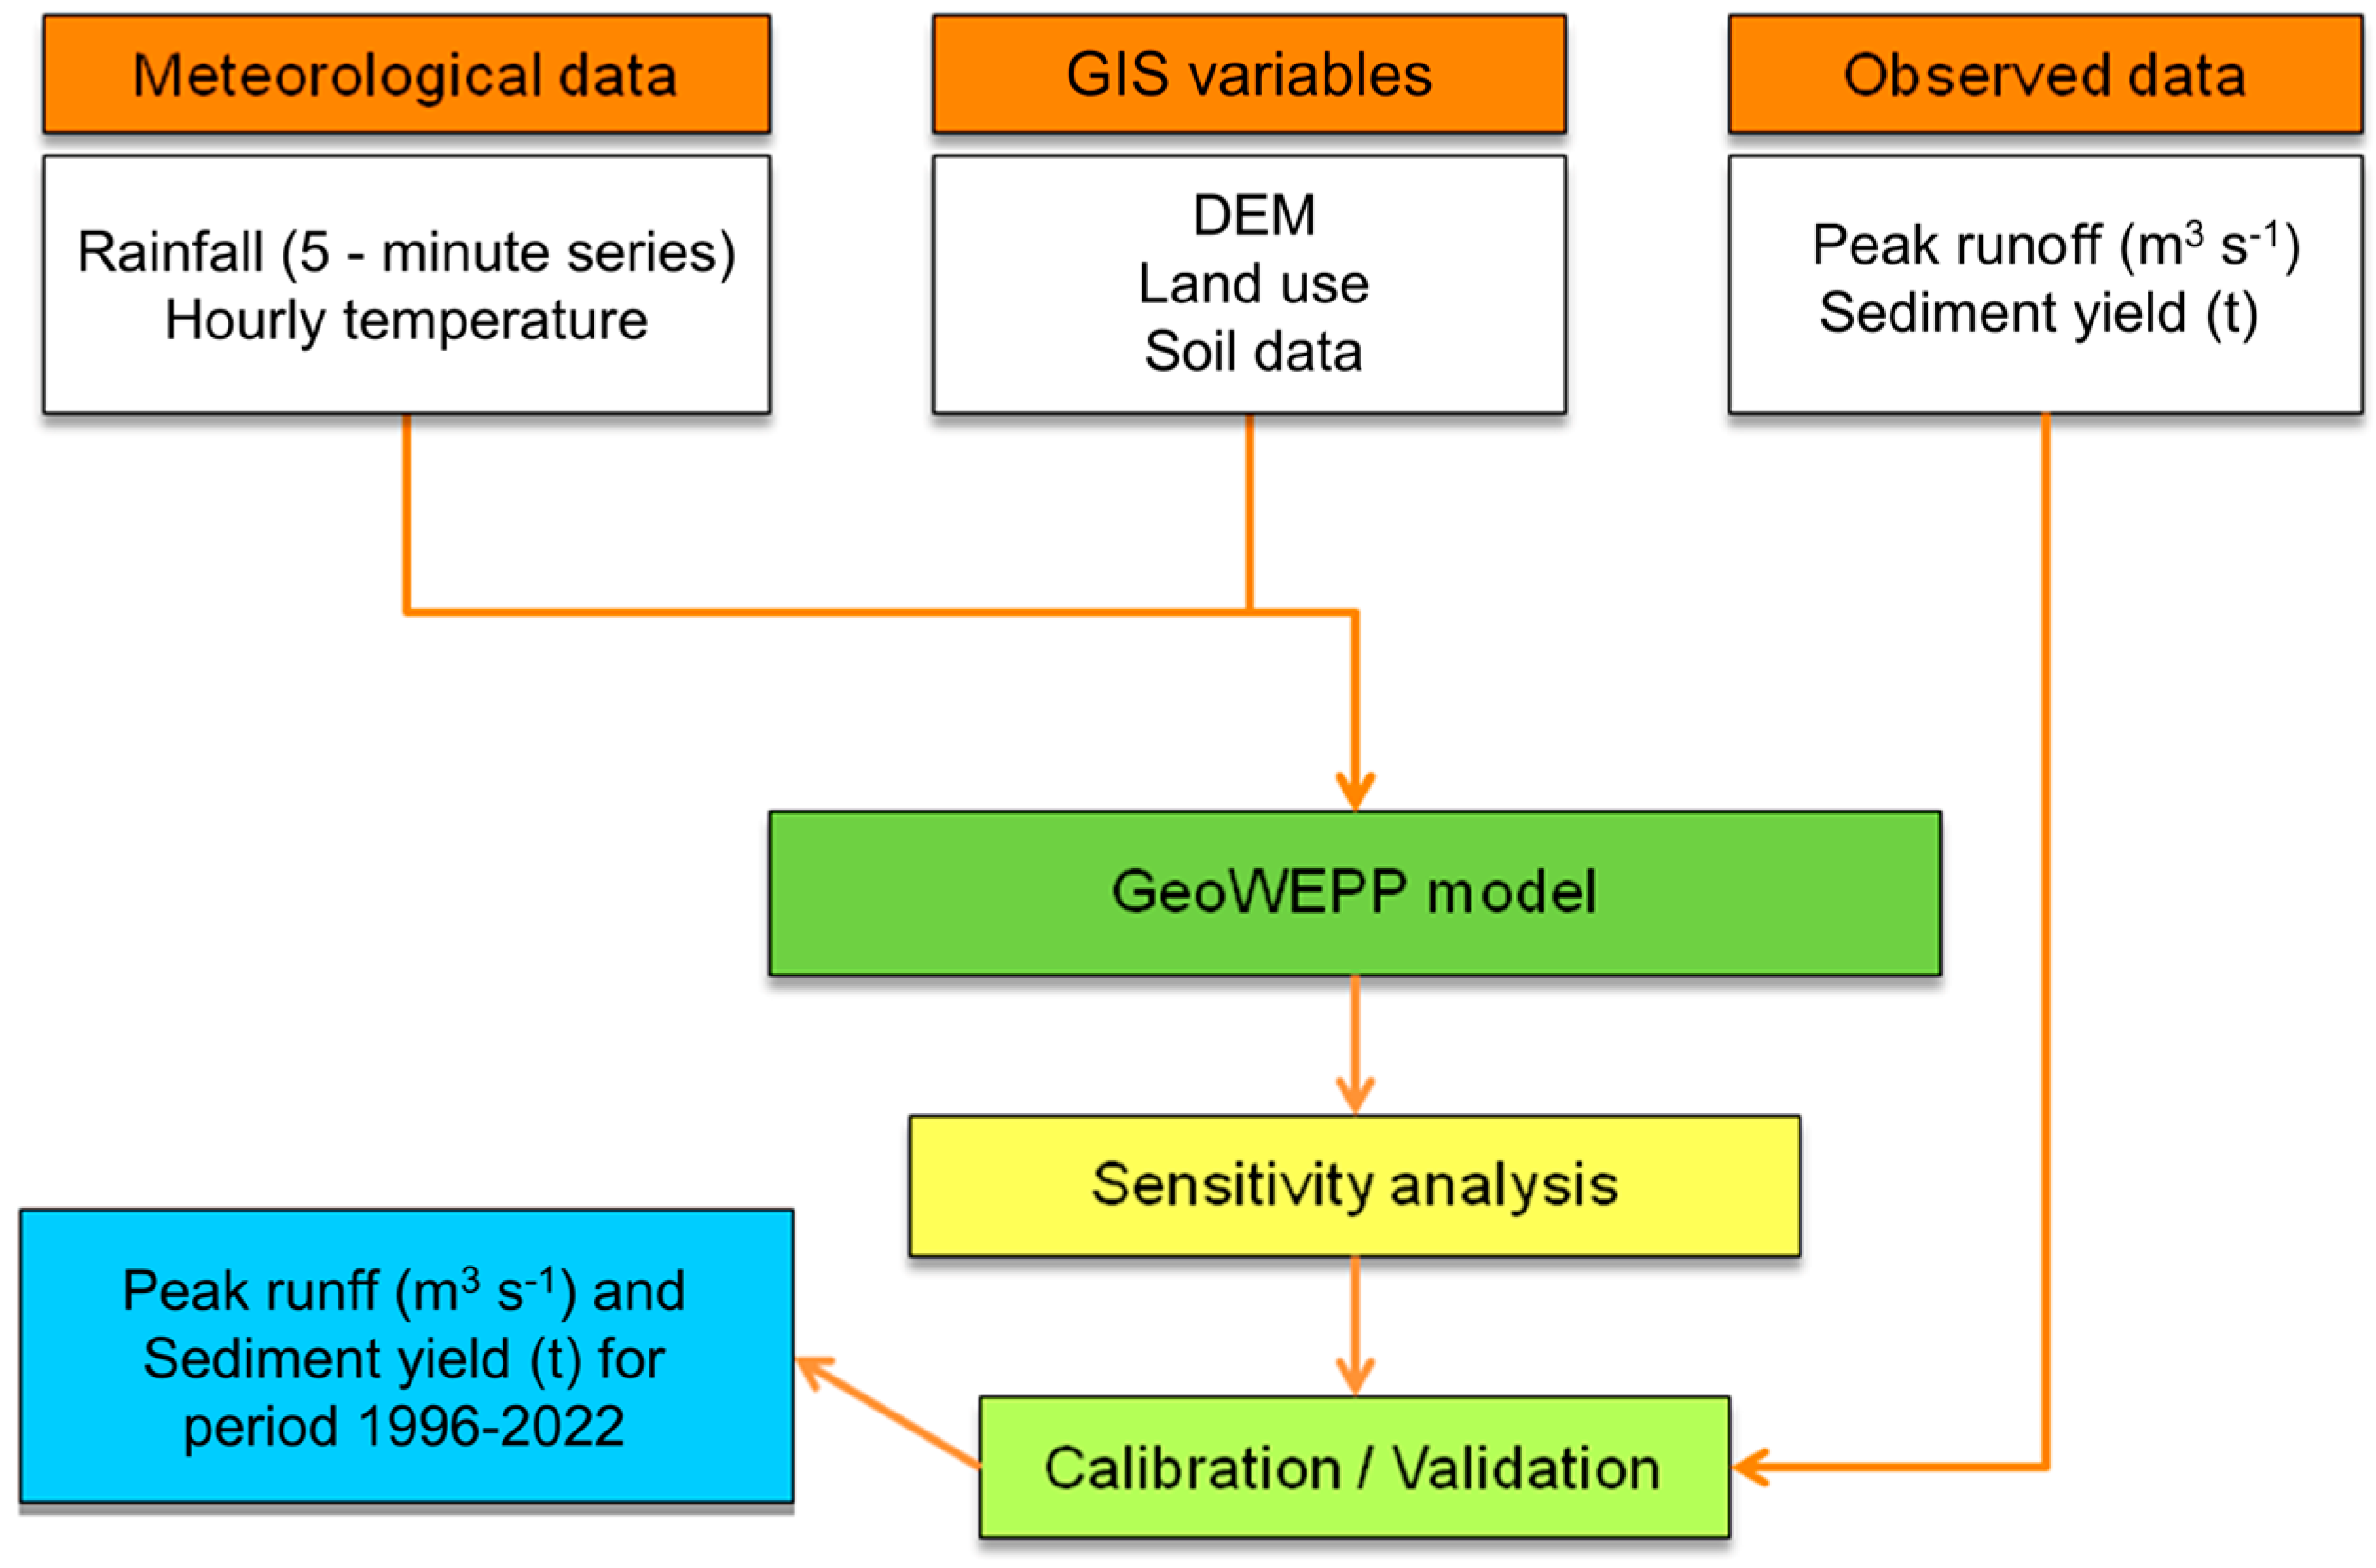
To retrospectively predict runoff and soil erosion, and therefore the potential inputs of water and sediments to each RCR stretch, during the simulation period, the GeoWEPP interface from the WEPP model, v.2012.8 [33], based on meteorological records from stations in the area, CLIGEN v.5.3 climate series generators [33], DTMs, and land use and soil maps (Figure 2), was used. Since this is a continuously simulated, process-based model, it requires a large amount of input data, including stochastically generated physical and environmental data, to assess erosion and sediment production potentials [34,35,36]. Its application to evaluate soil management and conservation options in small catchments and hillslope profiles has been quite widespread in recent years [37,38]. GeoWEPP provides two simulation methods: the offsite watershed method and an onsite flow path approach for sediment yield (SY) and soil loss (SL) assessments, respectively. In our case, soil parameters calibrated during on-site and off-site model simulations were implemented for all sub-catchments and analysis periods (including PECPs), in order to obtain more realistic model outputs for soil loss, sediment yield, and runoff.
Figure 2.
Flowchart displaying the steps in the event-scale GeoWEPP implementation process for the period 1996-2022. Process flow diagram applied to the sub-catchment of each RCR.
Figure 2.
Flowchart displaying the steps in the event-scale GeoWEPP implementation process for the period 1996-2022. Process flow diagram applied to the sub-catchment of each RCR.
3.3.1. Input Data Entered into the Model
In the absence of direct measurements of terrestrial sediment inputs, an erosion prediction model (WEPP -Water Erosion Prediction Project-) was used here to assess runoff and sediment yield. This is a physically based erosion simulation model, which predicts soil loss and sediment deposition from overland flow on hillslopes, concentrated flow in small channels, and sediment deposition in impoundments [39,40]. It is a technological proposal based on stochastic generation of meteorological data, theories of infiltration, hydrology, hydraulics, soil physics, behavior of the vegetation cover, and erosion mechanisms [35,36]. In our case, the WEPP model was applied for estimation, at the event scale, of sediment delivery from the Azohía ephemeral stream into Mazarrón bay. Along with the improvements to the WEPP Windows interface, we used additional modules that allowed us to carry out WEPP simulations based on digital information by linking it with Geographic Information Systems (GIS). As input information, the following data sets and variables were used for the period 2000-2017:
- a)
- Weather data. Daily precipitation data (mm), minimum temperature (°C), and maximum temperature (°C) corresponding to a period of 18 years (2000-2018) were obtained for the meteorological stations of Mazarrón (I.O.E), Mazarrón/Las Torres, Azohía (Cedacero), and Perín.
- b)
- Soil data. Different physical and chemical properties of the soil were considered, using data provided by the project LUCDEME (Fight against Desertification in the Mediterranean), prepared by Alias and Ortiz (1986–2004) for the Region of Murcia. These included the hydraulic conductivity, bulk density, organic matter content, and depth of each soil horizon, as well as the percentages of clay, silt, and sand.
- c)
- Topographic features. The watershed boundaries, including those of sub-catchments, and the drainage network and slope distribution were obtained by applying TOPAZ (a topographic parameterization program developed by the United States Department of Agriculture -USDA-ARS-), using the 5x5 m LIDAR DTM from the National Geographic Institute (IGN).
- d)
- Land uses. The land uses introduced in the WEPP application were obtained from Land Occupation Maps in Spain at a scale of 1:100,000, within the framework of the European project CORINE Land Cover, using the updates of 2000, 2006, 2012, and 2018 (IGN web page).
3.3.2. Simulation Analysis of Runoff and Sediment: the Sensitivity of The Model’s Parameters, Calibration, and Validation
Calibration and validation of the WEPP model: Peak discharges and sediment loads were measured at control points near the upper, middle, and lower RCRs. A total of 11 peak discharges and 17 sediment transport measurements were recorded in the period 2018-2020. Sediment samples collected during the 2018 and 2019 peak flows were used to calibrate the model, and the 2020 events for validation. For the calibration phase, a sensitivity analysis was conducted in order to detect the parameters most influential in the model and, therefore, susceptible to modification. Finally, the results obtained in the calibration and validation stages were evaluated using the Nash-Sutcliffe (NS) efficiency criterion and the percent bias (PBIAS). For the whole catchment, values of NS = 0.86 and PBIAS = 7.81% were obtained in the calibration stage, compared to values of NS = 0.81 and PBIAS = -4.1% for the validation phase. As shown in Table 2, these statistical parameters also turned out to be satisfactory for the two RCRs analyzed: NS = 0.72 and PBIAS = -10.5% at the UPR and 0.94 and -5.54%, respectively, at the MDR.
Table 2.
Nash-Sutcliffe efficiency (NS) and percent bias (PBIAS) estimated for the discharge values obtained in the calibration and validation periods.
Table 2.
Nash-Sutcliffe efficiency (NS) and percent bias (PBIAS) estimated for the discharge values obtained in the calibration and validation periods.
| Upper RCR | Middle RCR | Lower RCR | |||||||||||||
|---|---|---|---|---|---|---|---|---|---|---|---|---|---|---|---|
| EC | Qobs | Qsim | dif. % | PBIAS % | NS | Qobs | Qsim | dif. % | PBIAS % | NS | Qobs | Qsim | dif. % | PBIAS % | NS |
| 2 | 11.6 | 9.84 | -17.93 | -10.495 | 0.724 | 15.4 | 13.95 | -10.37 | -5.536 | 0.944 | 20.8 | 19.75 | -5.32 | 0.030 | 0.997 |
| 1 | 21.9 | 26.63 | 17.75 | 31.3 | 33.45 | 6.44 | 45.1 | 45.54 | 0.97 | ||||||
| 3 | 8.4 | 9.83 | 14.59 | 10.9 | 13.38 | 18.55 | 15.1 | 15.68 | 3.71 | ||||||
3.4. A Retrospective Approach to Map and Detect Previous Morphological Channel Changes and Sediment Budgets
Ephemeral channel morphology depends on the flow regime in the range of competent discharges. According to this criterion, the peak discharges recorded during the observation period (September 2018 to February 2023) were grouped into the following categories:
Class 1. Overbank flows which affect the whole fluvial system. In the case of ramblas, they greatly modify the active floodplain, by causing at the same time both deposition and scour. Floodwater velocities over this surface often vary spatially and, in some locations, may be high enough to produce scour rather than vertical accretion.
Class 2. Bankfull discharges. Typically, these are instantaneous peak flows at which water fills the main channel without overtopping the banks. Under the conditions of an equilibrium channel this flow stage can often be considered as a dominant or formative discharge [41], controlling the main channel form by appreciable net changes in the bed and banks.
Class 3. Sub-bankfull peak flows. This category includes discharges between the bankfull and half-bankfull stages. The upper limit of the reach-average effective discharge is associated with the stage slightly higher than half the bankfull depth [42]. Events of this class generate moderate morphological changes in the channel, especially bedform unit adjustments, bank undercutting, bed degradation, and basal clean-out.
Class 4. Subhalf-bankfull discharges: moderate to low energy flows capable of causing changes in the texture of alluvial bed materials and slight bedform adjustments.
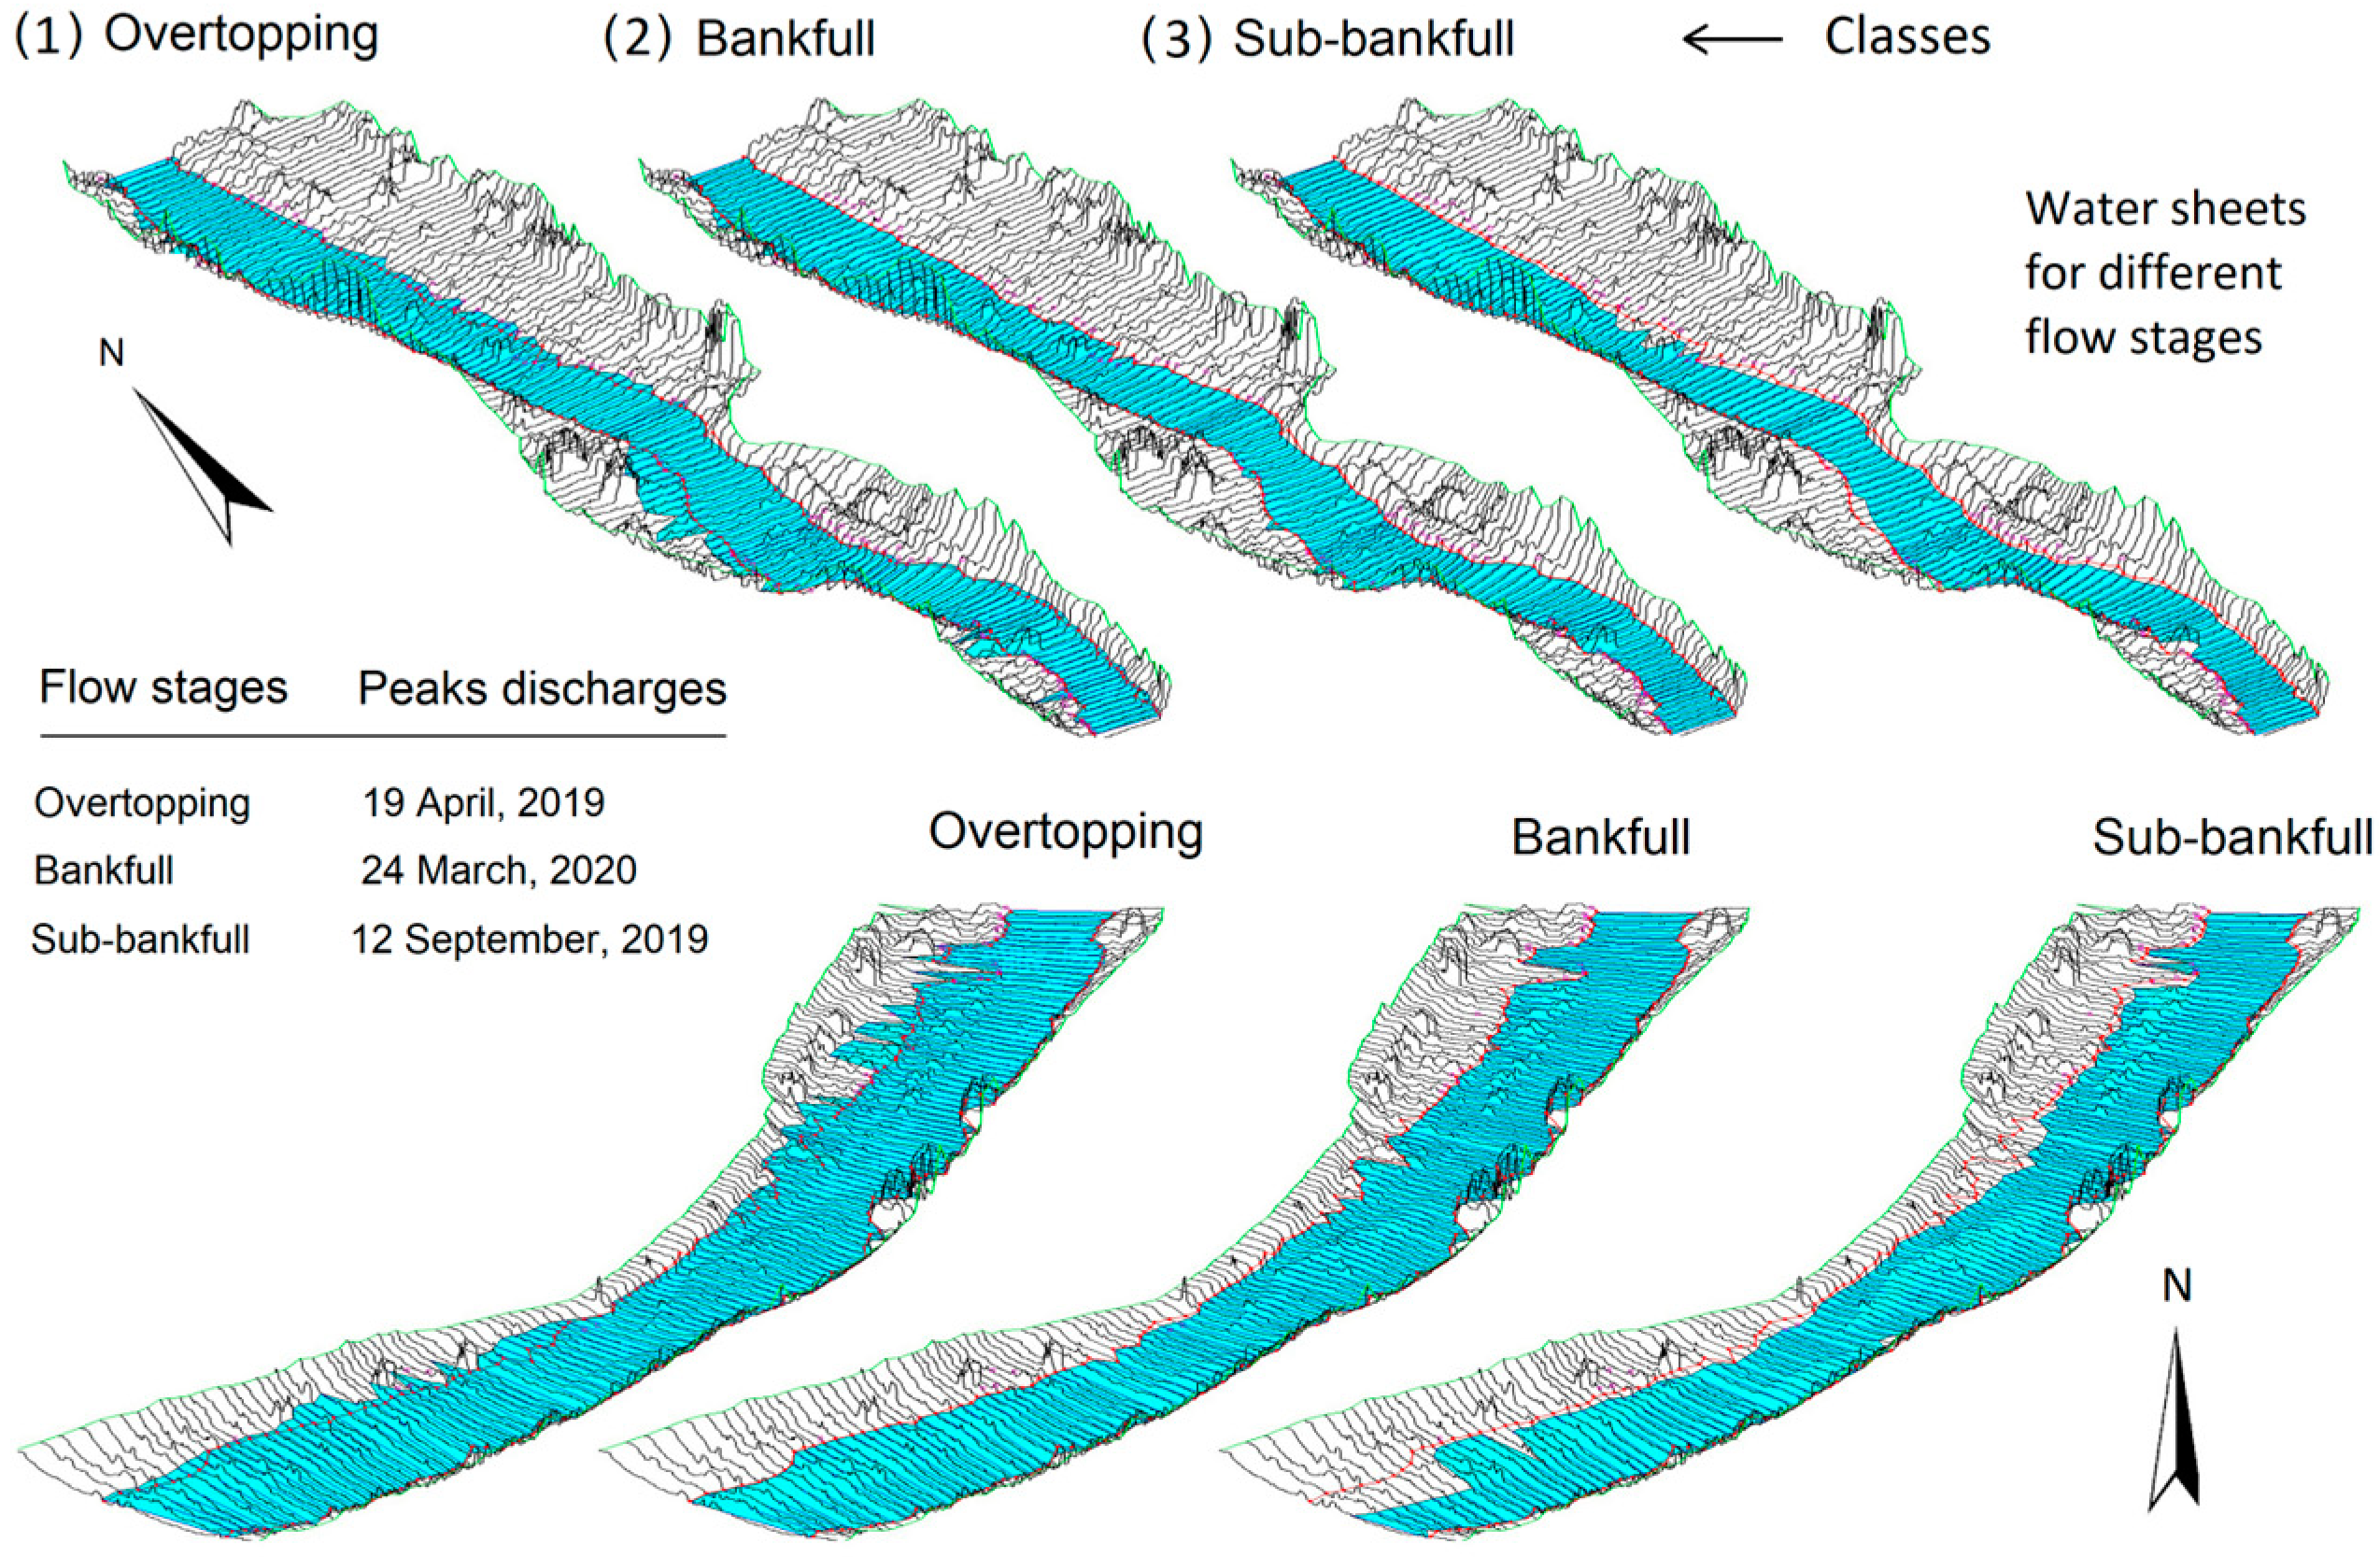
In Figure 3 water sheets for the flow stages defined for classes 1 (overbank flow), 2 (bankfull discharge), and 3 (sub-bankfull discharge) are shown, coinciding with three events that occurred during the monitoring period as obtained by UAV SfM and TLS (2018-2022).
Figure 3.
Water sheets for the flow stages defined for classes 1 (overbank flow), 2 (bankfull discharge), and 3 (sub-bankfull discharge), obtained using HEC-RAS from field survey data.
Figure 3.
Water sheets for the flow stages defined for classes 1 (overbank flow), 2 (bankfull discharge), and 3 (sub-bankfull discharge), obtained using HEC-RAS from field survey data.
Such geomorphic thresholds served to define the event class corresponding to each peak discharge simulated using GeoWEPP at the event scale in the period 1996-2018. The following event frequency for each class threshold was found: Class 1: 4 events (6.1%); Class 2: 10 events (15.2%); Class 3: 13 events (19.7%); Class 4: 39 events (59%) (Table 3). In this Table there are also data on the occurrence, return period (RP), and annual exceedance probability (AEP) of each event class. Note that the largest flash floods, with peak discharge above 30 m3 s-1, have a 6.75-year return period and AEP of 0.12, whereas the events of the minor class 4 have values of 0.69 years and 0.84, respectively.
Table 3.
Peak discharge thresholds and event class frequency.
| EC | Flow stage | Peak discharge (m3 s-1) |
Morphological channel adjustments | Occurrence | Return period (years) | AEP (p.u.) | |
|---|---|---|---|---|---|---|---|
| No. of events | Times/year | ||||||
| 1 | Overflow | >30 | Fluvial system changes | 4 | 0.15 | 6.75 | 0.12 |
| 2 | Bankfull | 15-30 | Changes in channel form | 10 | 0.37 | 2.70 | 0.39 |
| 3 | Sub-bankfull | 7.5-15 | Moderate channel changes | 13 | 0.48 | 2.08 | 0.64 |
| 4 | Sub-half-bankfull | < 7.5 | Minor bedform adjustments | 39 | 1.44 | 0.69 | 0.84 |
EC = Event Class; AEP = Annual Exceedance Probability (per unit)
The morphological channel adjustments maps of the period not monitored with TLS were generated through a retrospective simulation process, based on obtaining HRDoDs according to the level of relationship between predicted and observed peak discharges and the consideration of the geomorphic classes of events involved in each case. For the production of simulated HRDoDs backwards in time from the inter-campaign HRDoDs survey the weighting algorithm was performed, taking into account pre- and post-event stages (see Equation 1).
HRDoD [SEC(i)-EC(i-1)] = HRDEM of difference for each simulated event with peak discharge between events of class i (ECi) and i-1 (ECi-1); % = percentage estimated from the relationship between the magnitude of the simulated event and that of the most similar monitored event.
To formulate the algorithm needed to map retrospective changes in bed elevation and sediment budgets based on SfM surveys, the relative weight of each of the variables referring to peak flow (magnitude, variability, class frequency, position of the greatest event in the sequence of events within each stage monitored), considering both stretches, in relation to the unit volume of total morphological change (UVSC = UVSL+UVSR), was estimated for the time interval between consecutive surveys in each pair of campaigns or set of inter-campaign periods. Among all of them, the magnitude of the peak flows showed the highest correlation (r2 0.78) and level of significance (p-value < 0.04) versus UVSC. These peak discharges were categorized according to the classes of events described above, whose sequences and combinations made it possible to establish six specific ECPs (A to F) (Table 4) valid for both UPR and MDR.
Table 4.
Event class patterns established for the upper and middle reference reaches.
| Monitoring period | ECP | Event sequence | UPR | MDR | ||||
|---|---|---|---|---|---|---|---|---|
| UVL | UVR | UVSC | UVL | UVR | UVSC | |||
| September 2018 to September 2019 | A | 1 | 0.128 | 0.231 | 0.359 | 0.086 | 0.218 | 0.304 |
| September 2019 to July 2020 | B | 3-4-2 | 0.229 | 0.237 | 0.466 | 0.235 | 0.317 | 0.552 |
| September 2018 to July 2020 | C | 1-3-4-2 | 0.087 | 0.110 | 0.197 | 0.124 | 0.186 | 0.310 |
| July 2020 to February 2023 | D | 2 | 0.120 | 0.153 | 0.273 | 0.294 | 0.150 | 0.444 |
| September 2019 to February 2023 | E | 3-4-2-2 | 0.126 | 0.073 | 0.199 | 0.130 | 0.100 | 0.230 |
| September 2018 to February 2023 | F | 1-3-4-2-2 | 0.067 | 0.153 | 0.220 | 0.085 | 0.144 | 0.229 |
ECP = Event Class Pattern; UVSL = Average Unit Volume of Surface Lowering (m³ m-2); UVSR = Average Unit Volume of Surface Raising (m³ m-2); UVSC = Average Unit Volume of Surface Changing (m³ m-2).
The change factor (CF) applicable to the HRDoDs of the monitoring stages, according to the ECPs, and used to obtain the simulated HRDoDs of previous stages meeting a given ECP (Table 5) was calculated from the ratio expressed by Equation 2, where ∑CROb(i) and ∑CRS(i), respectively, are the sums of the observed and simulated change rates for each event within the considered stage. These rates were estimated using Equations 3 and 4 for each of the events, while CF was determined for the previously defined sub-periods based on the sequence of events represented by the different ECPs. Such sub-periods will hereafter be referred to as PECPs, such that the CF applied in these cases is CFPECP.
Where CF = Change factor; EC = Event class; ECP = Event class pattern; PECP = Sub-period based on ECP; QpOB(i) = Observed peak discharge (m3 s-1) for event i; QpS(i) = Predicted peak discharge (m3 s-1) for event i; UCROB(i) = Observed unit change rate (m3 m-2) for event i; UVSC(ECP) = unit volume of cumulative changing surface for a given ECP (m3 m-2); UCRS(i) = Simulated unit change rate (m3 m-2) for event i; DSL = Dissimilarity level between QpS(i) and QpOB(i).
Table 5.
The change factor (CF) obtained from the event class patterns (ECP) applied retrospectively to the HRDoD monitored in the upper and middle reference reaches.
Table 5.
The change factor (CF) obtained from the event class patterns (ECP) applied retrospectively to the HRDoD monitored in the upper and middle reference reaches.
| Date | EC | ECP | UPR | MDR | ||||||||||
|---|---|---|---|---|---|---|---|---|---|---|---|---|---|---|
| QpOB | QpS | DSL | UCROB | UCRS | CF | QpOB | QpS | DSL | UCROB | UCRS | CF | |||
| 18/12/2016 | 4 | B | 2.7 | 2.16 | -0.20 | 0.05 | 0.04 | 1.128 | 3.6 | 4.16 | 0.16 | 0.06 | 0.07 | 1.053 |
| 01/11/2015 | 4 | 2.7 | 4.17 | 0.54 | 0.05 | 0.08 | 3.6 | 4.69 | 0.30 | 0.06 | 0.08 | |||
| 29/09/2014 | 3 | 8.4 | 7.34 | -0.13 | 0.15 | 0.13 | 10.9 | 8.44 | -0.23 | 0.18 | 0.14 | |||
| 06/10/2013 | 2 | 11.6 | 14.97 | 0.29 | 0.21 | 0.27 | 15.4 | 17.97 | 0.17 | 0.25 | 0.30 | |||
| 28/09/2012 | 2 | D | 12.9 | 15.59 | 0.21 | 0.27 | 0.33 | 1.209 | 16.3 | 18.74 | 0.15 | 0.44 | 0.51 | 1.149 |
| 30/08/2012 | 2 | D | 12.9 | 13.89 | 0.08 | 0.27 | 0.29 | 1.077 | 16.3 | 16.60 | 0.02 | 0.44 | 0.45 | 1.018 |
| 15/06/2010 | 2 | D | 12.9 | 12.54 | -0.03 | 0.27 | 0.27 | 0.972 | 16.3 | 15.08 | -0.08 | 0.44 | 0.41 | 0.925 |
| 14/12/2009 | 4 | C | 2.7 | 6.36 | 1.35 | 0.01 | 0.03 | 1.644 | 3.6 | 7.32 | 1.00 | 0.02 | 0.04 | 1.569 |
| 28/09/2009 | 1 | 21.9 | 34.93 | 0.59 | 0.10 | 0.15 | 31.3 | 50.07 | 0.60 | 0.16 | 0.25 | |||
| 27/09/2009 | 2 | 11.6 | 20.32 | 0.75 | 0.05 | 0.09 | 15.4 | 24.67 | 0.60 | 0.08 | 0.12 | |||
| 29/03/2009 | 3 | 8.4 | 11.73 | 0.40 | 0.04 | 0.05 | 10.9 | 14.07 | 0.29 | 0.06 | 0.07 | |||
| 24/11/2007 | 2 | B | 11.6 | 13.52 | 0.17 | 0.27 | 0.32 | 1.256 | 15.4 | 16.24 | 0.05 | 0.32 | 0.34 | 1.151 |
| 19/10/2007 | 3 | 8.4 | 11.59 | 0.38 | 0.20 | 0.27 | 10.9 | 14.04 | 0.29 | 0.23 | 0.29 | |||
| 27/04/2007 | 2 | C | 11.6 | 13.63 | 0.18 | 0.05 | 0.06 | 1.344 | 15.4 | 16.30 | 0.06 | 0.08 | 0.08 | 1.186 |
| 03/11/2006 | 1 | 21.9 | 34.03 | 0.55 | 0.10 | 0.15 | 31.3 | 42.22 | 0.35 | 0.16 | 0.21 | |||
| 14/09/2006 | 3 | 8.4 | 7.87 | -0.06 | 0.04 | 0.03 | 10.9 | 9.07 | -0.17 | 0.06 | 0.05 | |||
| 22/11/2005 | 4 | 2.7 | 4.42 | 0.64 | 0.01 | 0.02 | 3.6 | 4.97 | 0.38 | 0.02 | 0.03 | |||
| 15/11/2005 | 3 | B | 8.4 | 10.27 | 0.22 | 0.17 | 0.21 | 1.334 | 10.9 | 12.28 | 0.13 | 0.20 | 0.23 | 1.266 |
| 29/03/2004 | 4 | 2.7 | 1.93 | -0.29 | 0.06 | 0.04 | 3.6 | 2.02 | -0.44 | 0.07 | 0.04 | |||
| 19/11/2003 | 2 | 11.6 | 18.09 | 0.56 | 0.24 | 0.37 | 15.4 | 23.57 | 0.53 | 0.28 | 0.44 | |||
| 18/11/2003 | 3 | B | 8.4 | 7.56 | -0.10 | 0.17 | 0.16 | 1.408 | 10.9 | 8.71 | -0.20 | 0.20 | 0.16 | 1.271 |
| 06/05/2002 | 2 | 11.6 | 18.52 | 0.60 | 0.24 | 0.38 | 15.4 | 22.53 | 0.46 | 0.28 | 0.42 | |||
| 04/03/2002 | 4 | 2.7 | 5.89 | 1.18 | 0.06 | 0.12 | 3.6 | 6.75 | 0.87 | 0.07 | 0.12 | |||
| 10/10/2001 | 4 | E | 2.7 | 5.79 | 1.14 | 0.01 | 0.03 | 2.067 | 3.6 | 6.57 | 0.82 | 0.01 | 0.03 | 1.597 |
| 25/10/2000 | 4 | 2.7 | 5.65 | 1.09 | 0.01 | 0.03 | 3.6 | 7.02 | 0.95 | 0.01 | 0.03 | |||
| 23/10/2000 | 1 | 21.9 | 62.44 | 1.85 | 0.10 | 0.28 | 31.3 | 81.52 | 1.00 | 0.12 | 0.24 | |||
| 27/02/1999 | 3 | 8.4 | 8.51 | 0.01 | 0.04 | 0.04 | 10.9 | 9.87 | -0.09 | 0.04 | 0.04 | |||
| 02/12/1998 | 3 | 8.4 | 8.78 | 0.04 | 0.04 | 0.04 | 10.9 | 10.21 | -0.06 | 0.04 | 0.04 | |||
| 24/05/1998 | 2 | B | 11.6 | 16.98 | 0.46 | 0.24 | 0.35 | 1.255 | 15.4 | 20.69 | 0.34 | 0.28 | 0.38 | 1.132 |
| 14/05/1998 | 4 | 2.7 | 4.18 | 0.55 | 0.06 | 0.09 | 3.6 | 4.71 | 0.31 | 0.07 | 0.09 | |||
| 07/10/1997 | 3 | 8.4 | 7.32 | -0.13 | 0.17 | 0.15 | 10.9 | 8.45 | -0.22 | 0.20 | 0.16 | |||
| 14/10/1996 | 2 | D | 12.9 | 14.87 | 0.15 | 0.27 | 0.31 | 1.153 | 16.3 | 17.79 | 0.09 | 0.44 | 0.48 | 1.091 |
Notations: EC = Event class; ECP = Event class pattern; QpOB = Observed peak discharge (m3 s-1); QpS = Predicted peak discharge (m3 s-1); DSL = Dissimilarity level; UCROB = Observed unit change rate (m3 m-2); UCRS = Simulated unit change rate (m3 m-2); CF = Change factor.
3.5. Establishment of Spatial Patterns in Stream Power Based on Monitored and Simulated Peak Discharges
The peak discharge data were then transferred to the 1D hydrodynamic model HEC-RAS [43], supported by HRDTM, in order to get the flow cross-sections, channel profiles, water sheet limits, and hydraulic variable datasets. A total of 10 flow cross-sections were drawn in the UPR and 12 in the MDR, with an average separation of 25 m between them, for subcritical flow conditions.
The peak discharges used to calculate the stream power along both RCRs included four monitored events and 32 simulated events. The monitored ones represent three classes of events: a flash flood –Class 1- (19-20 April, 2019), two bankfull events –Class 2- (24 March, 2020 and 4-5 April, 2022), and a sub-bankfull flow –Class 3- (12 September, 2019), all having different geomorphic impacts. A fifth event, categorized as sub-half-bankfull –Class 4-, occurred on January 20, 2020, but caused only insignificant changes and was disregarded. Among the Class 4 simulated events, only peak flows of 4 to 7.5 m3 s-1 were considered, since below this threshold the alluvial bedforms hardly changed.
For each cross-sectional flow area, information was obtained about the mean depth (h), velocity (υ), shear stress (τ), and stream power. The power per unit length of stream (Ω) and mean stream power (ω) at peak flood discharge (Qp) were calculated for the set of cross-sections in each RCR, according to Equations 5 and 6, respectively (Leopold et al., 1964).
where γ is the specific weight of water (N m-3), Q is peak discharge (m3 s-1), Sw is the water surface slope (m m-1), which is used to estimate the energy gradient, and w is the water-surface width (m). Ω represents the energy dissipation per unit channel length (W m-1), and ω the energy expenditure per unit bed area (W m-2). The stream power values extracted by cross-section were averaged for each RCR to compare with the sediment budgets at the same scale.
The mean stream power gradient (∂ω/∂s) was calculated by subtracting ω in cross-sectional flow areas from the average ω in all selected cross-sections downstream and dividing the difference by the distance between the centroid of the extreme parts along the channel centerline. Positive and negative ∂ω/∂s values show downstream increases and decreases in ω, respectively (Lea and Legleiter, 2016). The energy expended beyond the critical mean stream power (ωc) in each cross-sectional flow area was also estimated and averaged along the entire reach to assess the energy available for sediment transport and morphological bed changes during peak flows. The excess energy per unit bed area (ε) expended above ωc in these stages was determined by calculating ω from each peak discharge (Qpf) and comparing the values to those of ωc obtained using Equations (10) and (16) from Parker et al. (2011), which calculate ωc as a function of slope and grain size. The bed slope was extracted from the HRDTMs described in sections 3.2.1 and 3.2.2. As grain size datasets, those obtained by Conesa-García et al. (2020, 2022) during a 2018-2021 monitoring period in representative cross-sections of each RCR were used. For the events in which ω was greater than ωc, the difference between ω and ωc was multiplied by the number of seconds that elapsed while the maximum flow lasted, to get the excess energy accumulated per unit area of the bed (εc), in joules. Finally, all the energy indicators (ω, ωc, ∂ω/∂s, ε, and εc) were averaged for the simulation periods defined according to the ECPs.
4. Results and Discussion
The results revealed a significant increase with time in the number of events that produce lower bed incision and bed aggradation. The number of minor events also increased. However, the frequency of bankfull events, which are responsible for dominant scouring processes, tended to decrease.
4.1. Retrospective Simulation of Peak Flows and Potential Sediment Inputs Using GeoWEPP
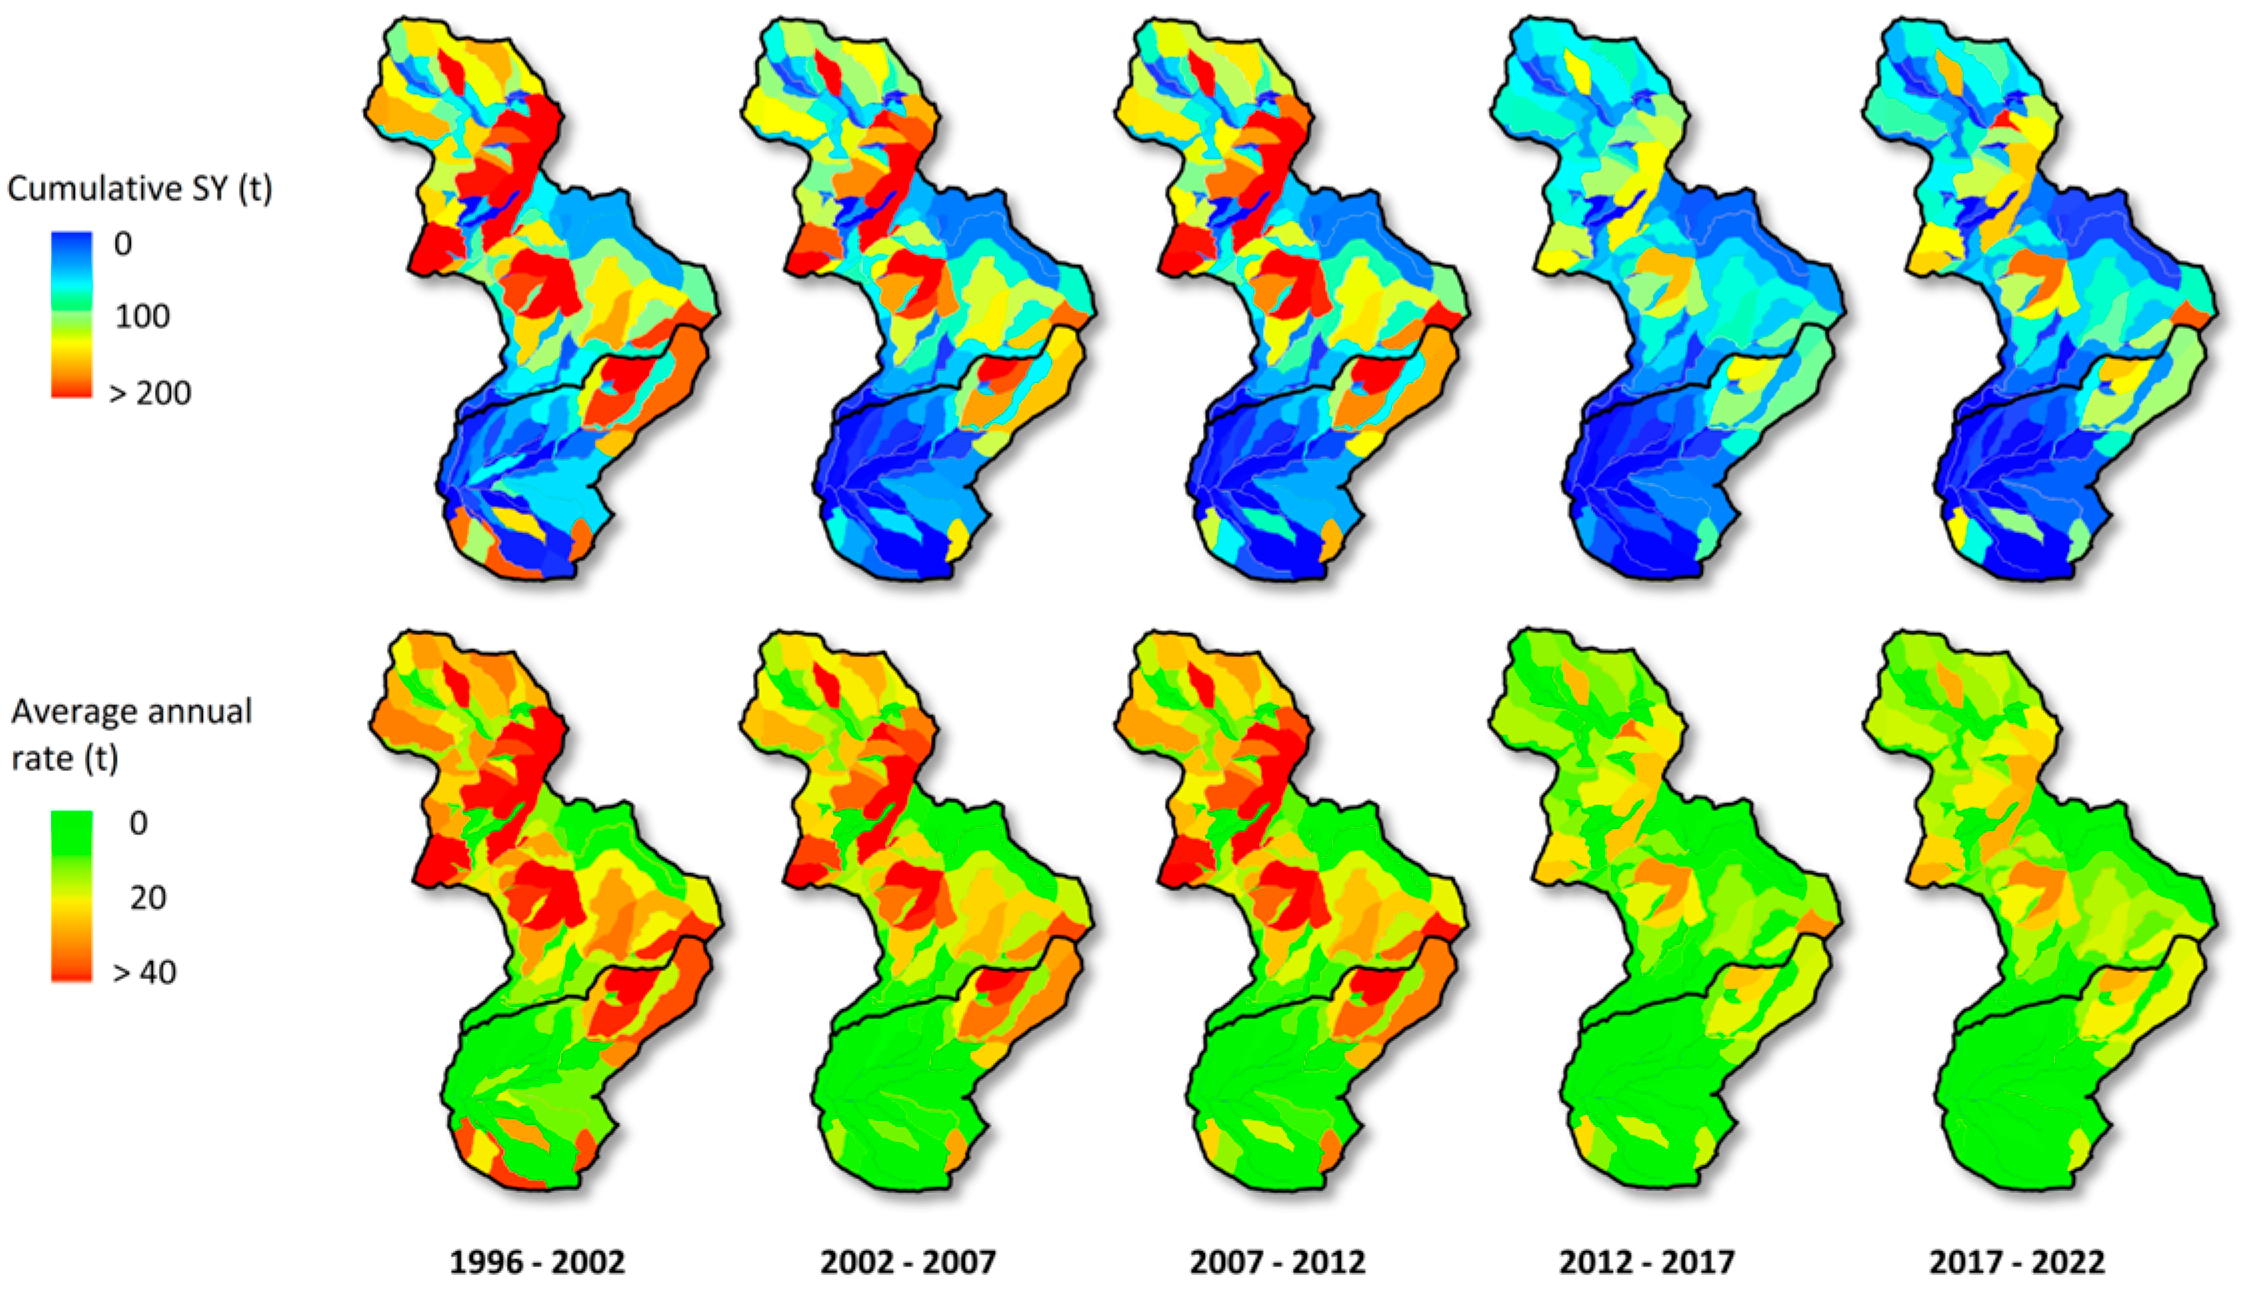
The GeoWEPP model has made it possible to delimit the catchment areas of the two study RCRs and to trace their respective drainage networks. In addition, it has provided information regarding runoff, soil loss, deposition, and sediment production from slopes and stream stretches. Generally, the results of the evaluation are mapped as a measurement relative to a tolerable soil loss or standard value (T), where T = 11.2 t ha-1 year-1. The non-tolerable rates, located above the T threshold, are mainly concentrated in the upper sub-catchment and headwater areas, where steep slopes (>25%) devoid of vegetation concur with the presence of quite fragile metamorphic materials (slates, phyllites, and shales). When comparing the sediment yield maps obtained at the sub-watershed level for five-year periods (Figure 4), two clear phases can be distinguished: a first stage (1996-2012) with high specific soil degradation and intense delivery of sediments, in which the hillslopes with CSY and ASY above 150 and 20 t, respectively, abound; and another (2012-2022), characterized by more moderate and low sediment production rates, coinciding with lower runoff coefficients (Figure 4).
Figure 4.
Spatial distribution of the cumulative (CSY) and average (ASY) sediment yields, estimated using GeoWEPP for retroactive five-year periods in the middle and upper sub-catchments of the Azohía Rambla.
Figure 4.
Spatial distribution of the cumulative (CSY) and average (ASY) sediment yields, estimated using GeoWEPP for retroactive five-year periods in the middle and upper sub-catchments of the Azohía Rambla.
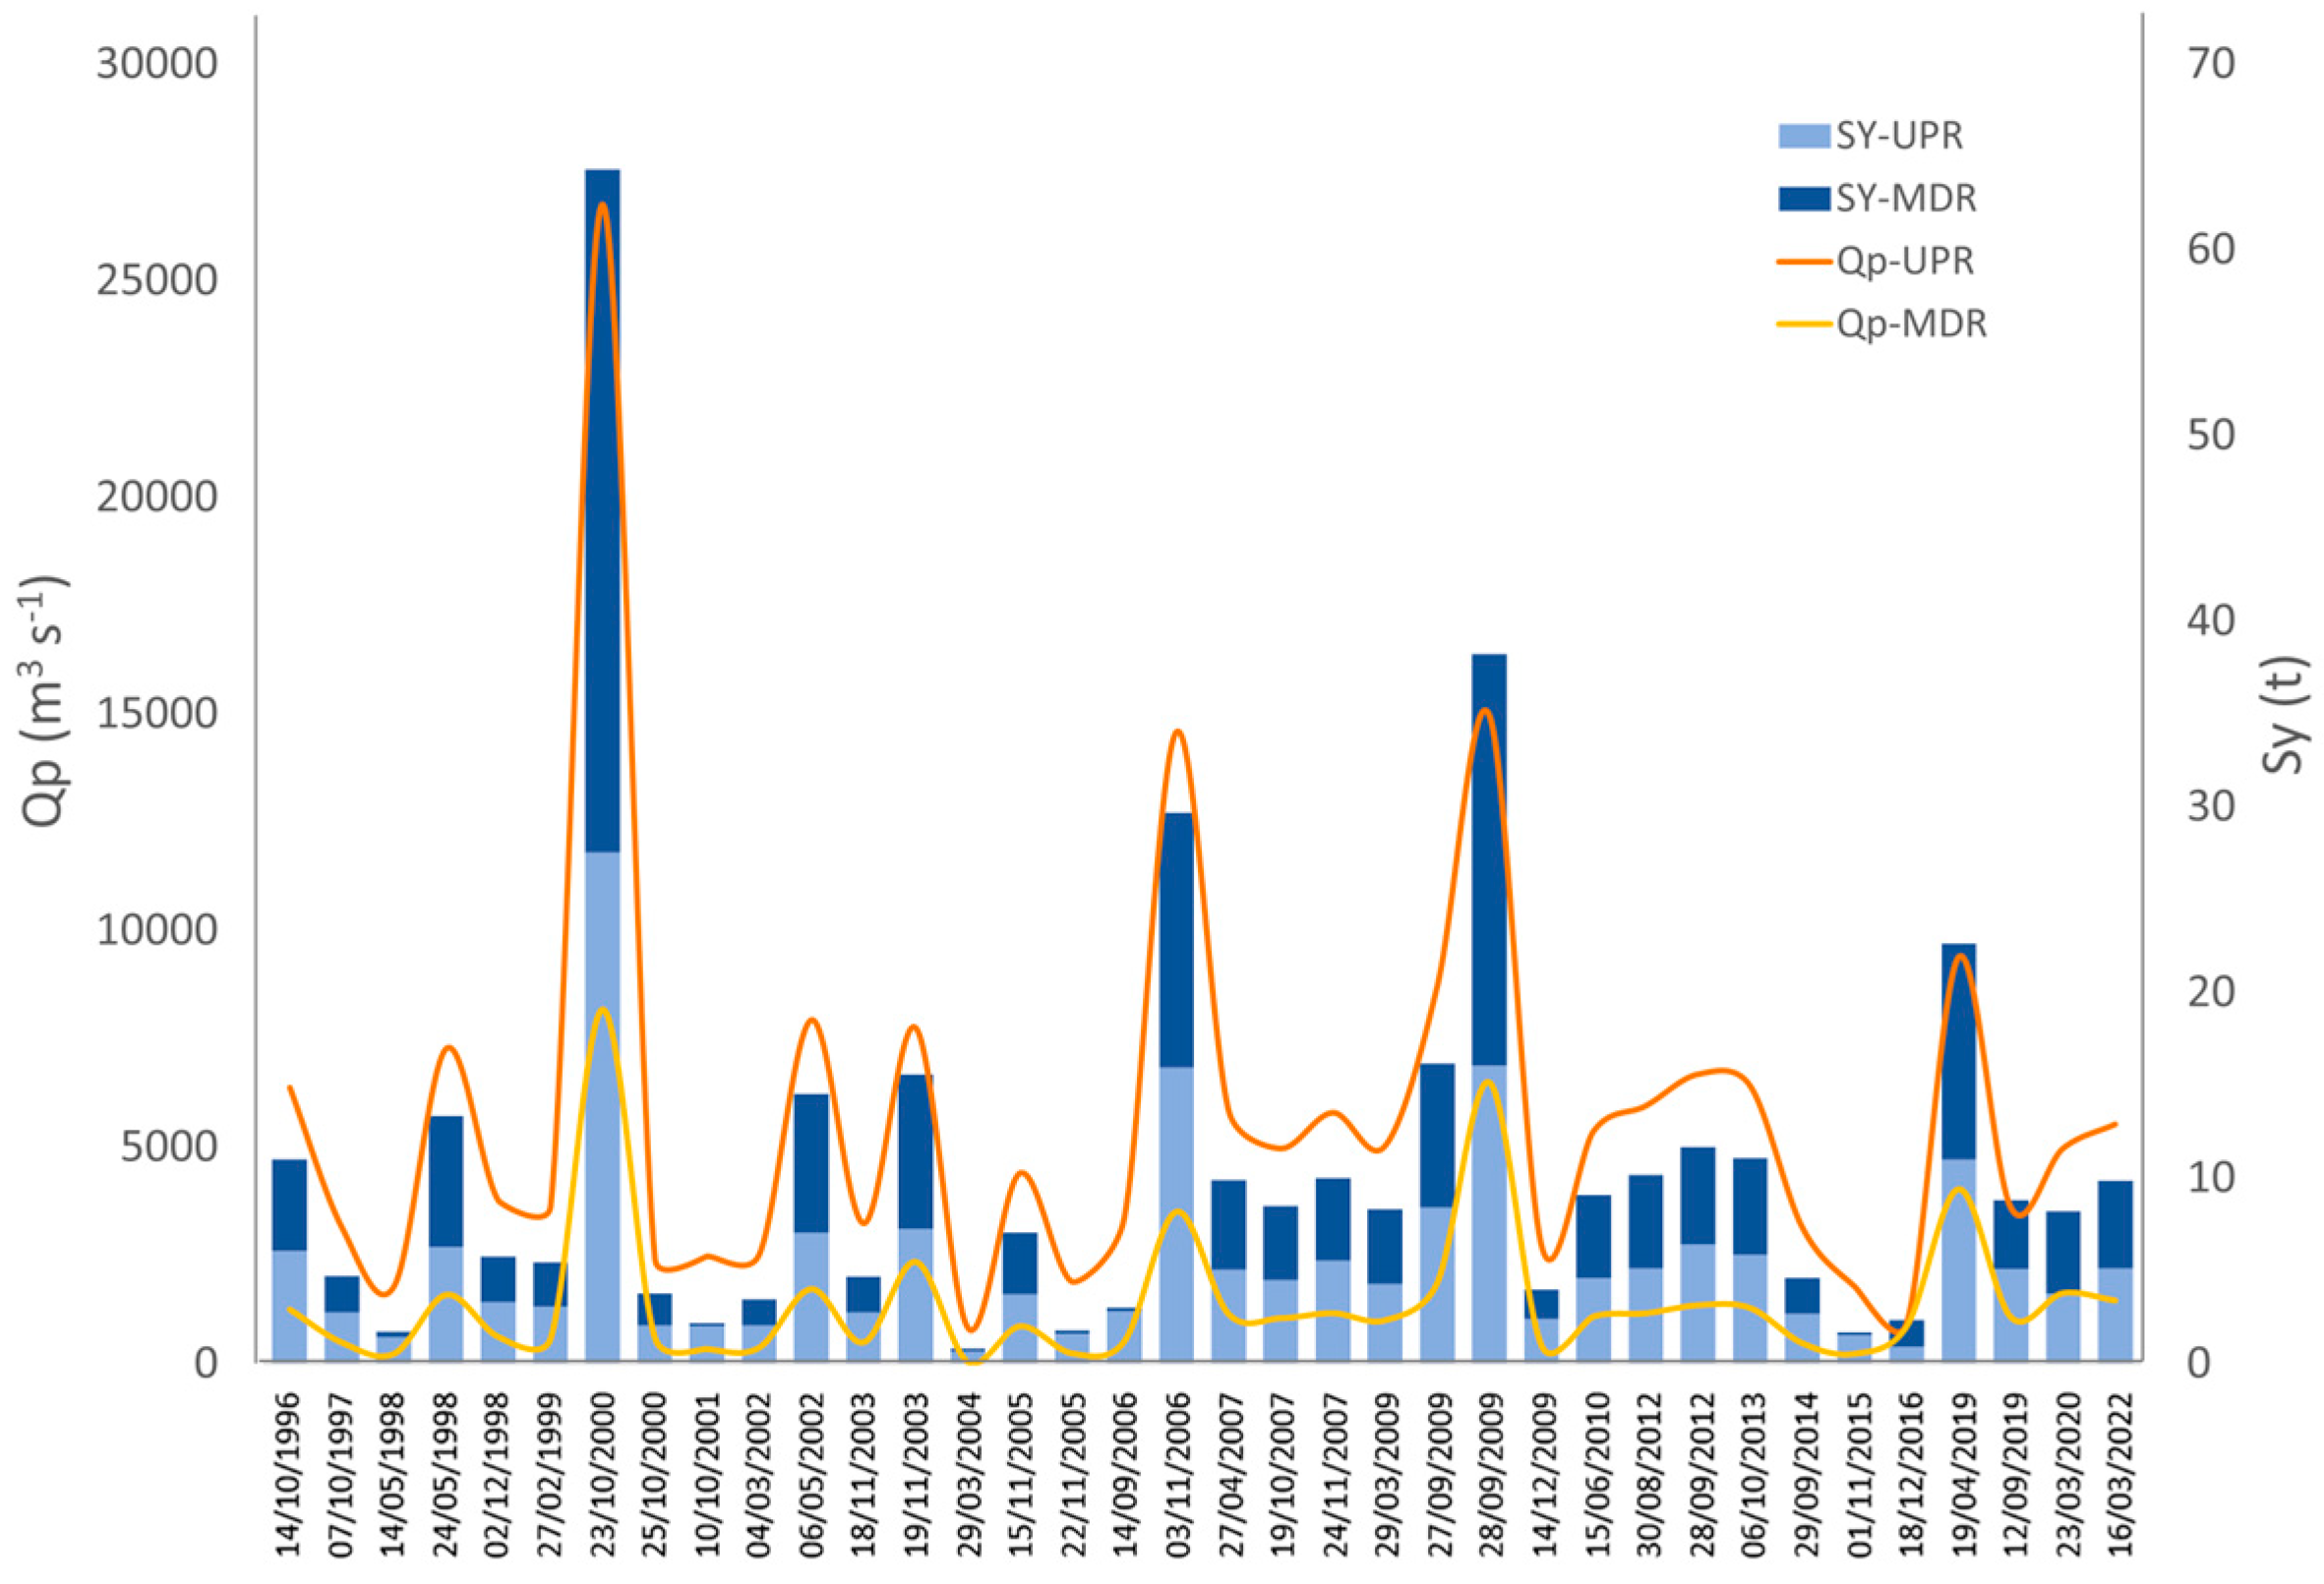
In Figure 5 simulation values of maximum runoff and potential sediment inputs estimated by the watershed and flow paths methods of WEPP are graphically displayed for each RCR at the event scale, while Table 6 shows the mean values predicted for each PECP. The temporal distribution of both the peak discharges and the delivery of sediments for transport follows two clear patterns: 1) one, represented by the period 2010-2022, which is characterized by a high occurrence of class 2 events (0.46 times/year), corresponding to bankfull discharges, and a low presence of class 1, 3, and 4 events (0.08, 0.17, and 0.25 times/year, respectively); and 2) a second pattern, observed in the stage 1996-2009, with higher frequencies of all classes of events: 0.21, 0.50, 0.50, and 0.57 times/year, implying shorter return periods.
The SY values show similar patterns at the event level, in both UPR and MDR. The greatest differences between the two sections occur for class 1 events, during large flash floods, in which the MDR is exposed to potential inputs of 9,000 to 27,000 t of sediments, compared to 4,700-11,800 t generated by erosion in the sub-watersheds draining to UPR. This represents an increase of 90 to 137% in the amount of potentially transportable sediments along the MDR with respect to the UPR. This increase is reduced as the category of events decreases: between 80 and 115% for EC2, and below 80% for EC3 and EC4. It should be noted that, although most of the sediments are transported in suspension after superficial soil washing processes in the sub-watershed areas, one of the major morphodynamic drivers in this type of gravel-bed stream is, instead, the bedload transport [44]. For both RCRs, the relationships between bedload transport and water discharge are dominated by large particles and sudden changes in excess energy during isolated peak discharges in time. This behavior is consistent with the results found by numerous authors [4,5,45], who classified the bankfull or sub-bankfull discharge as effective discharge, in our case characterized by a recurrence interval of one to two years.
Figure 5.
Peak discharges and potential average sediment outputs estimated with GeoWEPP for the flow events that occurred during the period 1996-2022.
Figure 5.
Peak discharges and potential average sediment outputs estimated with GeoWEPP for the flow events that occurred during the period 1996-2022.
In relation to the PECPs, a clear contrast exists between the 1996-2009 and 2010-2022 stages. However, in this case, the patterns of hydrological and morphosedimentary behavior in both RCRs are defined by different associations and frequencies of ECPs. The most recent period (2010-2022) is characterized by a high recurrence of D patterns made up of a single class 2 event and the confirmation of pattern A, also endowed with a single event, this time of the flash flood type and overtopping stage. For its part, the period 1996-2009 shows a different sequential pattern dominated by pattern B, which groups class 2, 3, and 4 events (Table 6).
Table 6.
Simulation with GeoWEPP of the potential sediment inputs entering the UPR and MDR reaches for the periods established, according to event class patterns (ECP).
Table 6.
Simulation with GeoWEPP of the potential sediment inputs entering the UPR and MDR reaches for the periods established, according to event class patterns (ECP).
| PECP | EC | ECP | UPR | MDR | ||
|---|---|---|---|---|---|---|
| ASIP (t) | CSIP (t) | ASIP (t) | CSIP (t) | |||
| July 2020 – Feb. 2023 | 2 | D | 2208.1 | 2208.1 | 4222.0 | 4222.0 |
| Sep. 2019 - July 2020 | 3-4-2 | B | 1907.6 | 3815.1 | 2708.2 | 9694.8 |
| Sep. 2018 - Sep.2019 | 1 | A | 4712.4 | 4712.4 | 9694.8 | 9694.8 |
| Oct. 2013 – Sep. 2018 | 4-4-3-2 | B | 1181.2 | 4724.7 | 2112.8 | 2112.8 |
| Sep. 2012 – Oct. 2013 | 2 | D | 2760.7 | 2760.7 | 5000.6 | 5000.6 |
| Aug. 2012 – Sep. 2012 | 2 | D | 2200.1 | 2200.1 | 4364.0 | 4364.0 |
| June 2010 – Aug. 2012 | 2 | D | 1977.0 | 1977.0 | 3889.2 | 3889.2 |
| March 2009 – June 2010 | 4-1-2-3 | C | 3343.8 | 13375.4 | 7144.4 | 28577.6 |
| Oct. 2007 – March 2009 | 2-3 | B | 2159.9 | 4319.8 | 3963.9 | 7927.9 |
| Nov. 2005 – Oct. 2007 | 2-1-3-4 | C | 3411.1 | 10233.3 | 6082.3 | 18246.8 |
| Nov. 2003 – Nov. 2005 | 3-4-2 | B | 1670.5 | 5011.6 | 3349.8 | 10049.5 |
| March 2002 – Nov. 2003 | 3-2-4 | B | 1706.8 | 5120.5 | 3243.5 | 9730.5 |
| Dec. 1998 - March 2002 | 4-4-1-3-3 | E | 3262.1 | 16310.5 | 6990.3 | 34951.6 |
| Oct. 1997 – Dec. 1998 | 2-4-3 | B | 1500.7 | 4502.1 | 2826.0 | 8478.0 |
| Oct. 1996 – Oct. 1997 | 2 | D | 2612.0 | 2612.0 | 4711.0 | 4711.0 |
PECP = Periods based on Event Class Patterns; EC = Event Class; ECP = Event Class Pattern; ASIP and CSIP = Potential Average and Cumulative Sediment Inputs per PECP period, respectively.
In terms of mean values, the potential inputs of sediments per event do not differ appreciably between the patterns described in UPR, especially between B and D, but in MDR more distinguishing features are observed, particularly when comparing the PECPs with patterns that include class 1 events with those that do not. More pronounced are the differences between the CSIP values of the PECPs represented by patterns A, C, and E and those of type B and D. Without a doubt, the largest potential cumulative sediment inputs registered at the entries into both sections correspond to the PECPs with patterns C (November 2005 – October 2007; March 2009 – June 2010) and E (December 1998 – March 2002), which include overflow and bankfull peak discharges. These caused important overall morphological adjustments that affected both the channel geometry and the bedform units.
4.2. Retrospective Changes in Bed Elevation and Sediment Budgets Derived from SfM-MVS Generated HRDTMs and the Resulting DoDs
The results for other time periods derived from experimental models simulating channel morphology have been found to be weakly dependent on the grid resolution [46,47,48]. We used HRDTMs here because the poor resolution of the other grid models has proven in many cases to be insufficient to quantify net sediment fluxes or unit volumes of bed erosion and deposition, or to represent well the different morphosedimentary features and their changes over time. Lower resolution DTMs were ruled out due to the low geometric and textural definition they offer in unit bedform identification. This is the case of the resulting NPAO DTMs and DoDs (Figure 6), whose loss of precision with respect to the SfM and TLS products would significantly worsen the results of a retrospective morphodynamic simulation. Nicholas et al. (2013) examined the model sensitivity to grid resolution, morphodynamic scaling, inlet boundary conditions, and parameterization of bed roughness and sediment transport, and reached similar conclusions for their simulations.
The main influence of grid resolution is on bar size, because grid resolution sets a limit on the smallest features that can be considered. Consequently, the finest grid (pixel size 0.02 m) used in our retrospective simulation allows the recognition of the smallest bars and detailed monitoring of their structural and geometric changes. Overall, the modeled channel width distributions from NPAO DTMs are consistent with the field data, although there is a trend for secondary channels and the smallest alluvial bars to be underrepresented in the resulting channel morphology relative to those monitored using the HRDoDs.
Clearly, the controls on unit bar frequency and runs in this EGBS are complex and likely include very different morphological responses of the channel to intrinsic fluvial processes, depending on the event class and the class association patterns. The detection of these morphological adjustments requires a combination of high-resolution 3D models and ground-based monitoring on the flow regime and sediment transport mechanics. In principal, unlike channels with a high width-to-depth ratio and extensive development of braided bars, where the results of two-dimensional and three-dimensional model simulations are comparable [49], in our case the HRDoDs do adequately resolve near-bed flow, since they were implemented with very fine spatial resolutions [50].
Figure 6.
DoDs resulting from the difference between the DEMs derived from the NPAO 2009 and 2016 LiDAR point clouds (0.5 m per pixel) and those generated with SfM-MVS in 2018 and 2023 after being converted to the same resolution. Upper and Middle RCRs.
Figure 6.
DoDs resulting from the difference between the DEMs derived from the NPAO 2009 and 2016 LiDAR point clouds (0.5 m per pixel) and those generated with SfM-MVS in 2018 and 2023 after being converted to the same resolution. Upper and Middle RCRs.
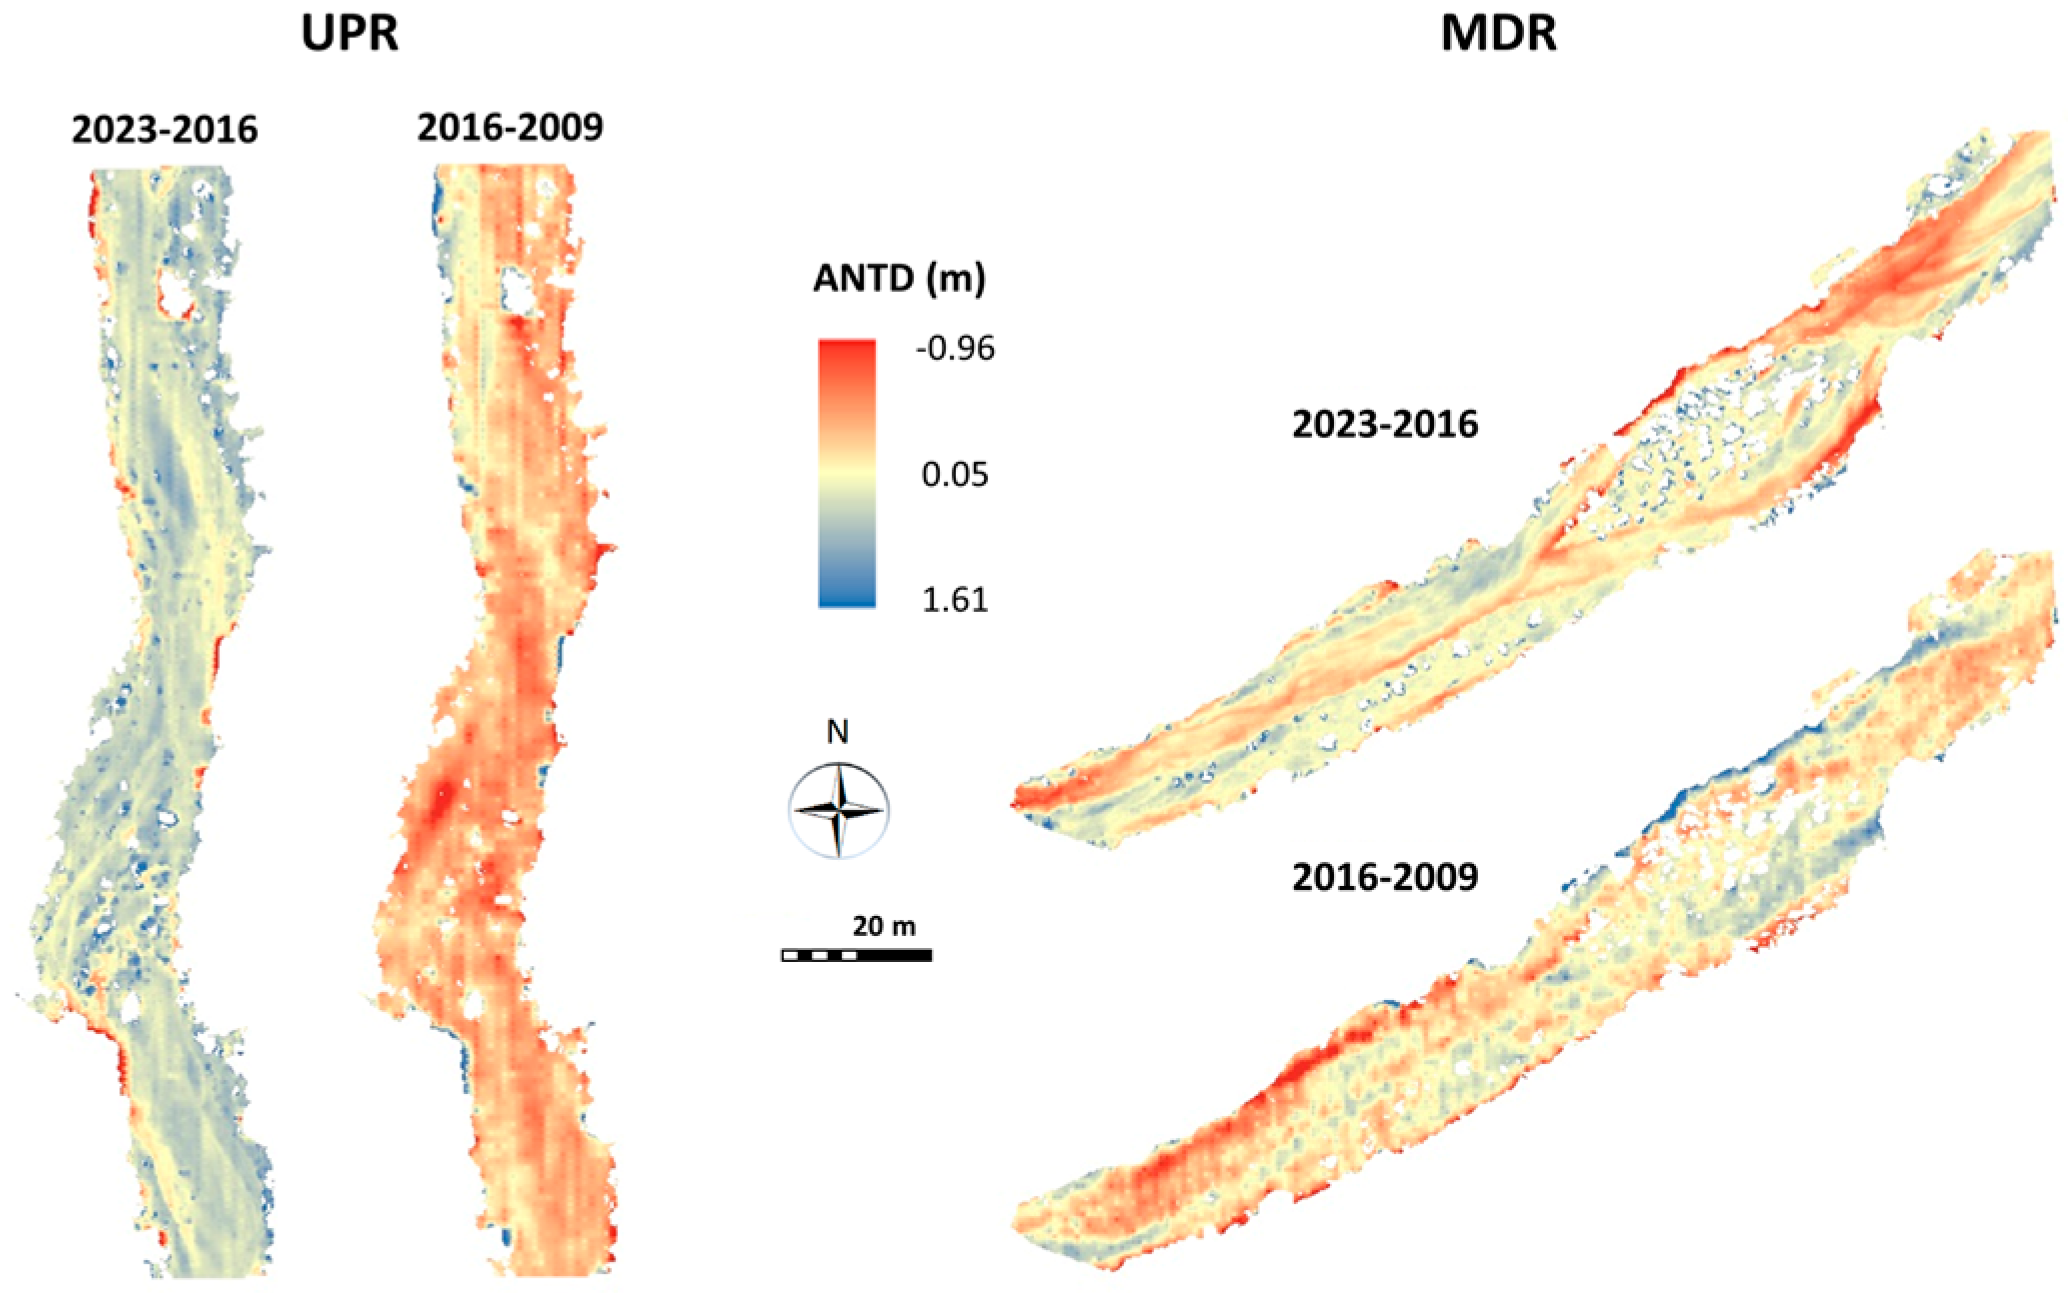
The morphological sediment budget data obtained from DoD with grid resolution of 0.5 m/pixel, using NPAO DEMs and SfM datasets, are much less realistic than those provided solely by SfM-MVS photogrammetry during the monitoring period (2018-2022). For this period the % error attributed to ANTD, UVSL, and UVSR in both RCRs varies between 0.112 and 0.192 for the resolution of 0.5 m per pixel of the NPAO DoDs and between 0.047 and 0.098 (Table 7) when using the HRDoDs of SfM (Table 9).
Table 7.
Statistical descriptors relating to the morphological sediment budgets calculated for the reference channel reaches (RCRs) in the UPR and MDR, for the monitoring (1) and simulation (2) periods (results from DoD generated using NPAO DEMs and SfM datasets).
Table 7.
Statistical descriptors relating to the morphological sediment budgets calculated for the reference channel reaches (RCRs) in the UPR and MDR, for the monitoring (1) and simulation (2) periods (results from DoD generated using NPAO DEMs and SfM datasets).
| TAI | TNVD | ANTD | PI | TASL | TASR | UVSL | UVSR | SD * | ||||||
|---|---|---|---|---|---|---|---|---|---|---|---|---|---|---|
| Period | RCR | m2 | m3 | Error (p.u.) | m | Error (p.u.) | (p.u) | m2 | m2 | m3 m-2 | Error (p.u.) | m3 m-2 | Error (p.u.) | m |
| 2016- 2022 (1) | UPR | 2407 | 440.1 | 0.112 | 0.183 | 0.112 | 0.442 | 155.3 | 2251.4 | 0.185 | 0.169 | 0.208 | 0.192 | 0.188 |
| MDR | 3956 | 692.3 | 0.175 | 0.175 | 0.175 | 0.459 | 364.0 | 3591.9 | 0.085 | 0.115 | 0.201 | 0.189 | 0.106 | |
| 2009 -2016(2) | UPR | 2435 | -366.7 | -0.089 | -0.151 | -0.089 | -0.448 | 2261.2 | 173.7 | 0.172 | 0.196 | 0.122 | 0.174 | 0.156 |
| MDR | 4040 | -501.4 | -0.106 | -0.124 | -0.106 | -0.463 | 3743.6 | 296.8 | 0.139 | 0.206 | 0.067 | 0.156 | 0.116 | |
TAI = Total Area of Interest (m2); TNVD = Total Net Volume Difference (m3); ANTD = Average Net Thickness Difference (m) for the Area of Interest; PI = Percent Imbalance (departure from equilibrium); TASL = Total Area of Surface Lowering (m2); TASR = Total Area of Surface Raising (m2); UVSL = Average Unit Volume of Surface Lowering (m3 m−2); UVSR = Average Unit Volume of Surface Raising (m3 m−2); SD * = Standard Deviation of the Net Thickness Differences (m). p.u. = Per unit.
In addition, the mean, total, and unit values of bed morphological change indicators that were calculated from the NPAO DoDs are quite different from those provided by the SfM HRDoDs in all of the reaches, for both the monitoring and simulation periods. In Table 8 it can be verified that the dissimilarity coefficients between the results extracted from both types of DoDs are mostly above 0.15 or -0.15, which means that the values deduced from the lower resolution model overestimate or underestimate by more than 15%, respectively, those monitored with UAVs. Only the TAI and TASR values in both RCRs, PI in UPR, and UVSL in MDR present dissimilarity coefficients ≤ 0.15.
Table 8.
Dissimilarity coefficients between the DoDs derived from the PNOA DEMs and those obtained using SfM-MVS photogrammetry for the monitoring (1) and simulation (2) periods in UPR and MDR.
Table 8.
Dissimilarity coefficients between the DoDs derived from the PNOA DEMs and those obtained using SfM-MVS photogrammetry for the monitoring (1) and simulation (2) periods in UPR and MDR.
| Period | RCR | TAI | TNVD | ANTD | PI | TASL | TASR | UVSL | UVSR | SD* |
|---|---|---|---|---|---|---|---|---|---|---|
| 2016 – 2022 (1) | UPR | 0.09 | -0.23 | -0.30 | 0.01 | 0.47 | 0.04 | -0.64 | -0.26 | -0.43 |
| MDR | 0.15 | -0.33 | -0.43 | -0.18 | 0.60 | 0.04 | 0.00 | -0.28 | 0.17 | |
| 2009 - 2016 (2) | UPR | 0.04 | -0.16 | -0.22 | 0.09 | -0.64 | 0.69 | -0.12 | 0.16 | -0.37 |
| MDR | 0.04 | -0.88 | -0.32 | -0.51 | -0.53 | 0.79 | 0.11 | 0.66 | 0.34 |
RCR = Reference channel reach; UPR = Upper reach; MDR = Middle reach.
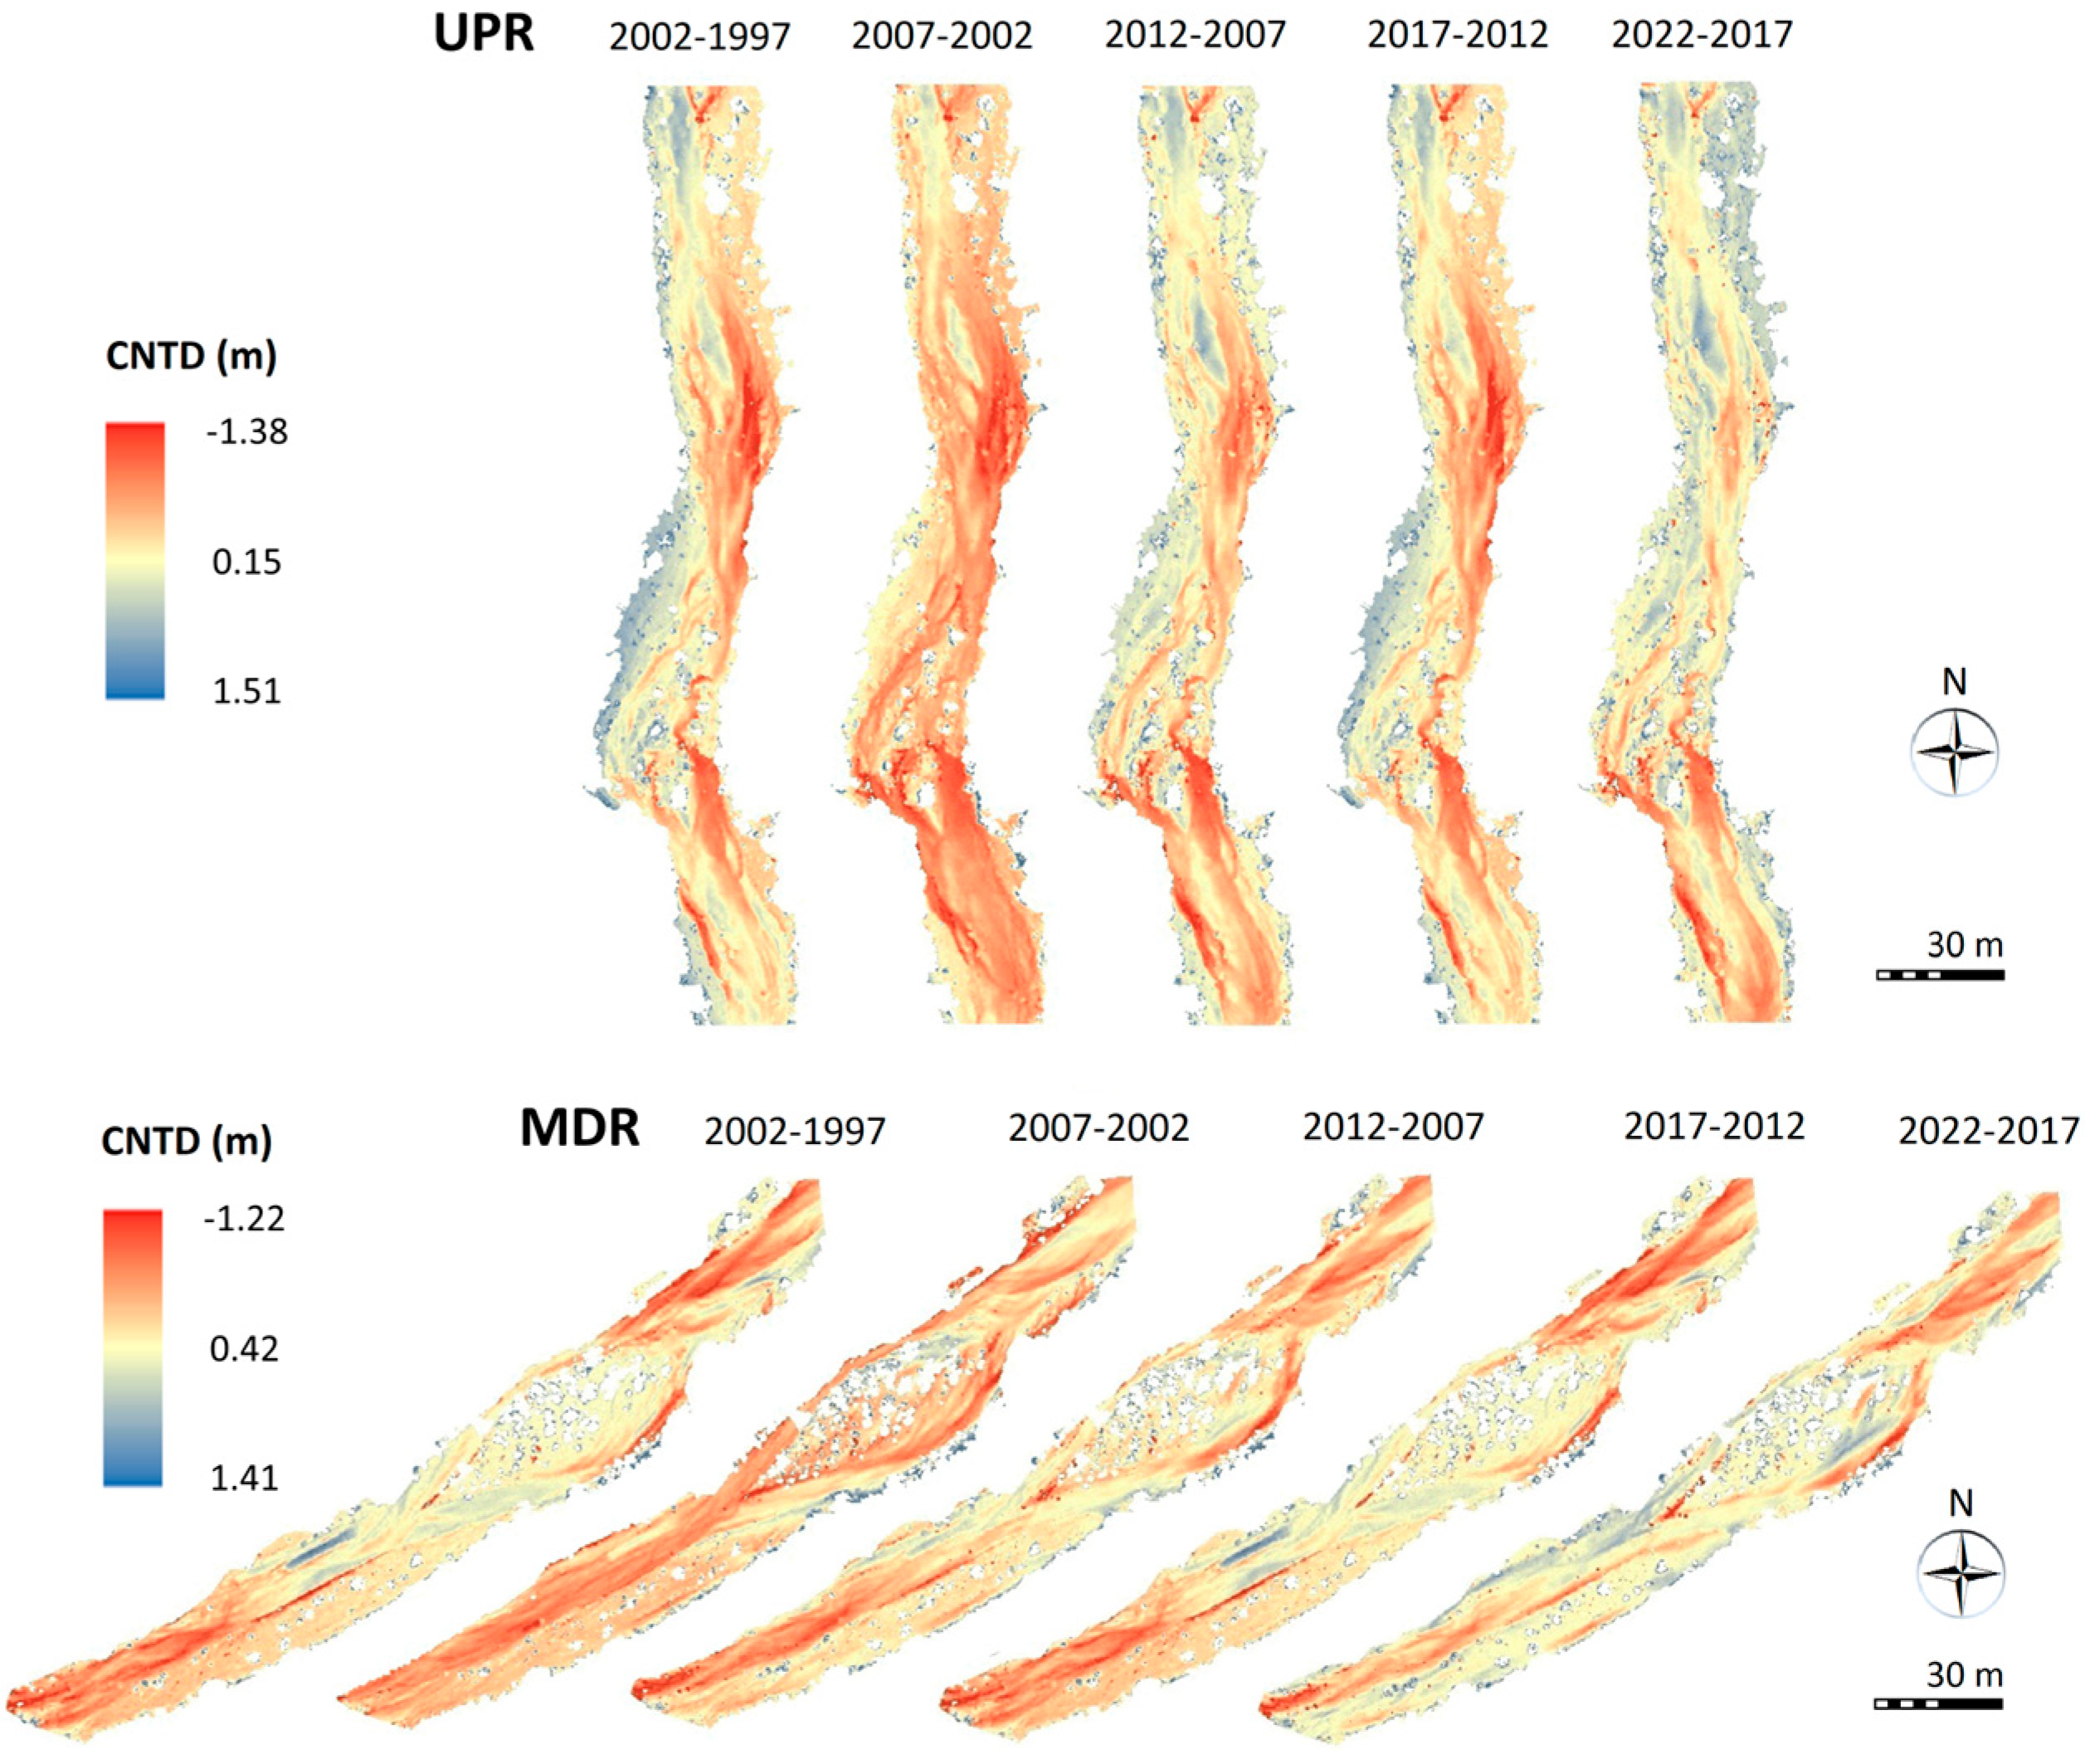
Consequently, for the case study, where the small bed forms within a narrow ephemeral gravel-bed channel play an important role in its general morphological evolution, it is necessary to use HRDoDs to better quantify the changes produced at the event scale and PECPs. Bed adjustments at this temporal level are usually very varied and complex; in some cases, scour and downcutting phenomena predominate, while in others deposition and entrainment processes and superficial washing are prevalent. Using HRDoDs, therefore, it is possible to more precisely detect the current changes produced in this type of stream, including minor adjustments, and to obtain higher quality simulations of short-term retrospective morphodynamic changes. A good indicator of these adjustments is the sediment budget in the reaches with the highest bedload. In particular, in the RCRs analyzed here, the bedload experienced important spatial variations at the event scale, significantly affecting the sediment sources (areas of erosion) and sinks (areas of deposition) in the period 2018-2020[4]. Once the monitoring period has been extended to 2022, it was possible to establish grouping patterns of event classes that allowed us to go back in time looking for their occurrence. Fitted HRDoDs were applied to each of them according to their degree of similarity with the starting ECPs in order to simulate their possible changes in bed elevation and sediment budgets during the period 1996-2018, the results of which are shown in Figure 7 and Table 9.
Figure 7.
Retrospectively simulated HRDoDs for five-year sub-periods from 1997 to 2017, combining ECPs with UAV-SfM-derived DTMs over the monitoring stage (2018-2022).
Figure 7.
Retrospectively simulated HRDoDs for five-year sub-periods from 1997 to 2017, combining ECPs with UAV-SfM-derived DTMs over the monitoring stage (2018-2022).
As already indicated in section 3.5, a total of five events were monitored and classified into four different classes: a flash flood –Class 1- (19-20 April, 2019), two bankfull events –Class 2- (24 March, 2020 and 4-5 April, 2022), a sub-bankfull flow –Class 3- (12 September, 2019), and a minor event, categorized as sub-half-bankfull –Class 4- (20 January, 2020), all having different geomorphic impacts. In the September 2018–September 2019 stage, lateral erosion from steep alluvial banks, active low bars, partially destroyed coarse bar heads, and finer-grained bar tails along the upstream reaches provided a large bedload in the downstream direction. As a result, the greatest deposition thicknesses were recorded in the flanks of the longitudinal and medial alluvial bars, in both RCRs [4]. Previous field observations suggest that during low-water stages, as in the event of November 2018, when the top of the bar emerged, vertical accretion of these bars ceases and new secondary channels form, causing small island bars to migrate. The flash flood of 19–20 April, 2019 resumed the aggradation process, with very widespread increases in bed height. The PECP defined by the pattern of this class 1 event, when it occurs in isolation or is preceded by events of insignificant impact, was classified as a type A PECP.
Table 9.
Statistical descriptors relating to the morphological sediment budgets calculated for the reference channel reaches (RCRs) during the period monitored with SfM data (September 2018 to February 2023) and the periods simulated with ECP (October 1996 to September 2018).
Table 9.
Statistical descriptors relating to the morphological sediment budgets calculated for the reference channel reaches (RCRs) during the period monitored with SfM data (September 2018 to February 2023) and the periods simulated with ECP (October 1996 to September 2018).
| TAI | TNVD | ANTD | PI | TASL | TASR | UVSL | UVSR | *SD | ||||||
|---|---|---|---|---|---|---|---|---|---|---|---|---|---|---|
| PECP | RCR | m2 | m3 | Error (u.p.) | m | Error (u.p.) | p.u. | m2 | m2 | m3 m-2 | Error (p.u.) | m3 m-2 | Error (p.u.) | m |
| JUL20- FEB23 |
UPR | 2730 | 395.2 | 0.063 | 0.145 | 0.063 | 0.477 | 81.2 | 2649.3 | 0.120 | 0.057 | 0.153 | 0.079 | 0.136 |
| MDR | 4532 | 118.7 | 0.054 | 0.026 | 0.054 | 0.069 | 1266.0 | 3266.2 | 0.294 | 0.086 | 0.150 | 0.113 | 0.146 | |
| SEP19- JUL20 |
UPR | 2976 | -575.3 | -0.048 | -0.193 | -0.048 | -0.420 | 2744.1 | 232.2 | 0.229 | 0.043 | 0.237 | 0.040 | 0.162 |
| MDR | 4707 | -742.2 | -0.055 | -0.158 | -0.055 | -0.319 | 4043.8 | 663.4 | 0.235 | 0.042 | 0.317 | 0.030 | 0.243 | |
| SEP18- SEP19 |
UPR | 2763 | 613.2 | 0.044 | 0.222 | 0.044 | 0.486 | 67.3 | 2695.1 | 0.128 | 0.070 | 0.231 | 0.043 | 0.118 |
| MDR | 4885 | 1013.1 | 0.046 | 0.207 | 0.046 | 0.486 | 168.1 | 4717.0 | 0.086 | 0.102 | 0.218 | 0.046 | 0.106 | |
| OCT13- SEP18 |
UPR | 2551 | -680.5 | -0.112 | -0.267 | -0.112 | -0.494 | 2516.7 | 34.7 | 0.272 | 0.198 | 0.127 | 0.109 | 0.105 |
| MDR | 4490 | -716.1 | -0.106 | -0.159 | -0.106 | -0.306 | 3873.6 | 616.9 | 0.243 | 0.206 | 0.368 | 0.185 | 0.186 | |
| SEP12- OCT13 |
UPR | 2543 | 443.8 | 0.089 | 0.174 | 0.089 | 0.485 | 51.9 | 2491.4 | 0.129 | 0.095 | 0.181 | 0.099 | 0.077 |
| MDR | 4155 | 336.3 | 0.093 | 0.081 | 0.093 | 0.272 | 1032.9 | 3122.0 | 0.136 | 0.112 | 0.153 | 0.123 | 0.164 | |
| AUG12- SEP12 |
UPR | 2543 | 395.3 | 0.146 | 0.155 | 0.146 | 0.485 | 51.9 | 2491.4 | 0.115 | 0.122 | 0.161 | 0.148 | 0.069 |
| MDR | 4155 | 298.0 | 0.157 | 0.072 | 0.157 | 0.272 | 1032.9 | 3122.0 | 0.121 | 0.158 | 0.135 | 0.141 | 0.146 | |
| JUN10 – AUG12 |
UPR | 2543 | 356.8 | 0.167 | 0.140 | 0.167 | 0.485 | 51.9 | 2491.4 | 0.104 | 0.186 | 0.145 | 0.109 | 0.062 |
| MDR | 4155 | 270.7 | 0.189 | 0.065 | 0.189 | 0.272 | 1032.9 | 3122.0 | 0.110 | 0.199 | 0.123 | 0.098 | 0.132 | |
| MAR09 JUN10 |
UPR | 2542 | -755.9 | -0.129 | -0.297 | -0.129 | -0.494 | 2508.5 | 33.9 | 0.303 | 0.202 | 0.146 | 0.133 | 0.118 |
| MDR | 4155 | -894.3 | -0.187 | -0.215 | -0.187 | -0.434 | 3746.1 | 408.5 | 0.257 | 0.274 | 0.166 | 0.145 | 0.176 | |
| OCT07- MAR09 |
UPR | 2542 | -78.5 | -0.196 | -0.031 | -0.196 | -0.120 | 1438.2 | 1104.2 | 0.141 | 0.143 | 0.112 | 0.089 | 0.177 |
| MDR | 4155 | 112.4 | -0.213 | 0.027 | -0.213 | 0.074 | 1900.3 | 2254.4 | 0.169 | 0.153 | 0.193 | 0.149 | 0.252 | |
| NOV05- OCT07 |
UPR | 2542 | -802.9 | -0.229 | -0.316 | -0.229 | -0.494 | 2508.5 | 33.9 | 0.322 | 0.224 | 0.156 | 0.144 | 0.125 |
| MDR | 4155 | -983.7 | -0.258 | -0.237 | -0.258 | -0.434 | 3746.1 | 408.5 | 0.282 | 0.239 | 0.182 | 0.175 | 0.194 | |
| NOV03- NOV05 |
UPR | 2542 | -64.2 | -0.216 | -0.025 | -0.216 | -0.120 | 1438.2 | 1104.2 | 0.115 | 0.106 | 0.092 | 0.107 | 0.145 |
| MDR | 4155 | 85.0 | -0.224 | 0.020 | -0.224 | 0.074 | 1900.3 | 2254.4 | 0.128 | 0.125 | 0.146 | 0.127 | 0.191 | |
| MAR02- NOV03 |
UPR | 2533 | -496.9 | -0.285 | -0.196 | -0.285 | -0.407 | 2128.1 | 405.0 | 0.260 | 0.259 | 0.140 | 0.121 | 0.219 |
| MDR | 4153 | -771.8 | -0.297 | -0.186 | -0.297 | -0.455 | 3845.1 | 308.1 | 0.211 | 0.189 | 0.125 | 0.095 | 0.160 | |
| DEC98- MAR02 |
UPR | 2542 | -847.4 | -0.219 | -0.333 | -0.219 | -0.494 | 2508.5 | 33.9 | 0.340 | 0.287 | 0.164 | 0.133 | 0.132 |
| MDR | 4155 | -987.5 | -0.246 | -0.238 | -0.246 | -0.434 | 3746.1 | 408.5 | 0.284 | 0.256 | 0.183 | 0.148 | 0.194 | |
| OCT97- DEC98 |
UPR | 2533 | -754.6 | -0.253 | -0.298 | -0.253 | -0.494 | 2502.2 | 30.9 | 0.303 | 0.288 | 0.142 | 0.185 | 0.116 |
| MDR | 4153 | -879.2 | -0.267 | -0.212 | -0.267 | -0.434 | 3745.1 | 408.0 | 0.253 | 0.249 | 0.163 | 0.149 | 0.173 | |
| OCT96- OCT97 |
UPR | 2533 | 421.5 | 0.267 | 0.166 | 0.267 | 0.486 | 50.0 | 2483.1 | 0.121 | 0.166 | 0.172 | 0.179 | 0.073 |
| MDR | 4153 | 319.2 | 0.288 | 0.077 | 0.288 | 0.272 | 1032.4 | 3120.7 | 0.129 | 0.172 | 0.145 | 0.195 | 0.156 | |
PECP = Periods based on Event Class Patterns; ECP = Event Class Patterns; TAI = Total Area of Interest (m²); TNVD = Total Net Volume Difference (m³); ANTD = Average Net Thickness Difference (m) for the Area of Interest; PI =Percent Imbalance (departure from equilibrium); TASL = Total Area of Surface Lowering (m²); TASR = Total Area of Surface Raising (m²); UVSL = Average Unit Volume of Surface Lowering (m³ m-2); UVSR = Average Unit Volume of Surface Raising (m³ m-2); SD* = Standard Deviation of the Net Thickness Differences (m); RCR = Reference channel reach; UPR = Upper reach; MDR = Middle reach. Error (p.u.) = Error (expressed per unit).
The statistical descriptors of the morphological sediment budgets in Table 9 show significant cumulative changes in ground surface elevation after this monitored A stage. An average net thickness difference of around 22 and 21 cm was found in the upper and middle reaches, respectively. The sedimentary balance was positive in both RCRs, verifying a clear dominance of deposition over erosion. The proximity of both reaches to abundant sources of coarse sediment together with a locally strong connectivity between the channel bed and active alluvial banks and almost similar bed slopes explain the slight differences in the average sediment budget between UPR and MDR [4]. However, the high average deposition unit rate observed in the middle reach (UVSL = 0.22 m3 m−2) was not accompanied by equally significant unit volumes of erosion upstream (UVSR in UPR = 0.13 m3 m−2). In addition, the net unit bed erosion rate found in MDR (UVSL < 0.09 m3 m−2) was lower than for UPR (Table 9). Thus, the bed deposition in a downstream direction could only progress due to bank erosion and bedload mobility along intermediate sections between the two RCRs, where bank breaking phenomena and gravel removal phenomena are quite recurrent. It should be taken into account that the average unit volumes of surface lowering or bed growth are referred to the changing area, so that the highest values of UVSL or UVSR do not always correspond to higher bed material transport rates and larger volumetric change. In fact, if we consider the PECP September 2018 to September 2019 as an example, in which a major class 1 event occurred, UVSR was higher in UPR (0.231 m3 m-2) than in MDR (0.218 m3 m-2). However, since the affected area was much larger in the latter reach (4717 m2 compared to 2695 m2 in UPR) (Table 9), the total volume of vertical bed accretion in MDR (1028 m3) almost doubled that registered upstream along the upper reach (622 m3). When retrospectively analyzing the entire period, two clear phases were distinguished: 1) an older one (1997-2012), characterized by dominant incision processes in both sections that accounted for a total excavated volume of 2,626 and 3,434 m3 in UPR and MDR, respectively; and 2) well-defined channel a more recent one (2012-2022), in which the sedimentation of coarse material and the bed aggradation processes prevailed, causing a total net deposition of 1016 m3.
This initial period of field research was chronologically followed by another type B PECP (September 2019 – July 2020), characterized by a lower entrainment capacity and a higher net bed excavation rate in both RCRs. This is corroborated by the data in Table 9 and Table 10, where the ANTD values vary between -0.16 and -0.19 m, and the net volume difference per 100 m2 (NVD*) is -19.3 m3 in UPR and -15.8 m3 in MDR. The incision experienced in this PECP was quickly counteracted in the following stage (July 2020 – February 2023), during which a class 2 event and a type D pattern caused the opposite effect: bed re-elevation due to a greater accumulation of bedload, which ended up exceeding the rate of transitory erosion. Nevertheless, the mean net deposition was much lower than that recorded in the first monitoring PECP, and the differences between the upper and middle reaches were also more noticeable (ANTD of 0.145 m in UPR and 0.026 m in MDR) (Table 9 and Table 10).
The other 12 PECPs were simulated, resulting in five PECPs with an ECP type B, two with ECP type C, four representing an ECP type D, and one of ECP type E. Retrospective analysis of these stages revealed a change in the trend of the erosion-deposition balance. From 1997 to 2010 a progressive lowering of the bed took place, interrupted only by a slight growth and stabilization along the middle reach during the events of November 19, 2003 and November 24, 2007, both of class 2. Between 2010 and 2013 there were three type D PECPs, each consisting of a single class 2 event, during which vertical bed accretion occurred in both stretches (NVD* of 15.7 m3 per 100 m2 in UPR and 7.3 m3 per 100 m2 in MDR). Finally, the 2013-2018 simulation period began with a PECP type B and ended with two class 4 minor events, which contributed to the generation of incision (NVD* = -26.7 m3 per 100 m2 in UPR and -15.9 m3 per 100 m2 in MDR). However, if we look at the frequency of PECPs with a positive or negative balance and the magnitude of morphological adjustment per stage, it is obvious that from the beginning of the simulated period there is a progressive change in trend, moving from linear erosion in the first nine PECPs (1997 to 2012) to the prevalence of deposition in the last six (2012 to 2022). The comparison of the averaged NDV* values for each interval of three consecutive PECPs confirms this in the two reference stretches, although in UPR the magnitude change is more pronounced. In this section, the average NDV* per 3 years changes from around -17 m3 per 100 m2 in the stage 1997-2007 to -6.3 m3 per 100 m2 in the 2007-2012 stage, and to 2.1 and 5.8 m3 per 100 m2 in the two most recent simulated PECPs triperiods (2012-2018 and 2018-2022, respectively).
Table 10.
Average and cumulative net difference in volume per 100 m2 and thickness difference for the changing surface area along the Upper and Middle RCRs.
Table 10.
Average and cumulative net difference in volume per 100 m2 and thickness difference for the changing surface area along the Upper and Middle RCRs.
| UPR | MDR | |||||||||||
|---|---|---|---|---|---|---|---|---|---|---|---|---|
| PECP | TAI | TNVD | NVD* | CNVD | ANTD | CNTD | TAI | TNVD | NVD* | CNV | ANTD | CNTD |
| July 2020 – Feb. 2023 | 2730 | 395.2 | 14.5 | 14.5 | 0.15 | 0.15 | 4532 | 118.7 | 2.6 | 2.6 | 0.03 | 0.03 |
| Sep. 2019 - July 2020 | 2976 | -575.3 | -19.3 | -4.8 | -0.19 | -0.04 | 4707 | -742.2 | -15.8 | -13.1 | -0.16 | -0.13 |
| Sep. 2018- Sep.2019 | 2763 | 613.2 | 22.2 | 17.4 | 0.22 | 0.18 | 4885 | 1013.1 | 20.7 | 7.6 | 0.21 | 0.08 |
| Oct. 2013 – Sep 2018 | 2551 | -680.5 | -26.7 | -9.3 | -0.27 | -0.09 | 4490 | -716.1 | -15.9 | -8.3 | -0.16 | -0.08 |
| Sep. 2012 – Oct. 2013 | 2543 | 443.8 | 17.5 | 8.2 | 0.17 | 0.08 | 4155 | 336.3 | 8.0 | -0.3 | 0.08 | 0.00 |
| Aug. 2012 – Sep. 2012 | 2543 | 395.3 | 15.5 | 23.7 | 0.16 | 0.24 | 4155 | 298.0 | 7.2 | 6.9 | 0.07 | 0.07 |
| June 2010 – Aug. 2012 | 2543 | 356.8 | 14.0 | 37.7 | 0.14 | 0.38 | 4155 | 270.7 | 6.5 | 13.4 | 0.07 | 0.14 |
| March 2009 – June 2010 | 2542 | -755.9 | -29.7 | 8.0 | -0.30 | 0.08 | 4155 | -894.3 | -21.5 | -8.1 | -0.22 | -0.08 |
| Oct. 2007 – March 2009 | 2542 | -78.5 | -3.1 | 4.9 | -0.03 | 0.05 | 4155 | 112.4 | 2.7 | -5.4 | 0.03 | -0.05 |
| Nov. 2005 – Oct. 2007 | 2542 | -802.9 | -31.6 | -26.7 | -0.32 | -0.27 | 4155 | -983.7 | -23.7 | -29.1 | -0.24 | -0.29 |
| Nov. 2003 – Nov. 2005 | 2542 | -64.2 | -2.5 | -29.2 | -0.03 | -0.30 | 4155 | 85.0 | 2.1 | -27.0 | 0.02 | -0.27 |
| March 2002 – Nov. 2003 | 2533 | -496.9 | -19.6 | -48.8 | -0.20 | -0.50 | 4153 | -771.8 | -18.6 | -45.6 | -0.19 | -0.46 |
| Dec. 1998 – March 2002 | 2542 | -847.4 | -33.3 | -82.1 | -0.33 | -0.83 | 4155 | -987.5 | -23.8 | -69.4 | -0.24 | -0.70 |
| Oct. 1997 – Dec. 1998 | 2533 | -754.6 | -29.9 | -112.0 | -0.30 | -1.13 | 4153 | -879.2 | -21.2 | -90.6 | -0.21 | -0.91 |
| Oct. 1996 – Oct. 1997 | 2533 | 421.5 | 16.6 | -95.4 | 0.17 | -0.96 | 4153 | 319.2 | 7.7 | -82.9 | 0.08 | -0.83 |
PECP = Periods based on Event Class Patterns; TAI = Total Area of Interest (m²); TNVD = Total Net Volume Difference (m³); NVD* = Net Volume Difference per 100 m² (m³); CNVD = Cumulative Net Volume Difference per 100 m² (m³); ANTD = Average Net Thickness Difference (m) for the Area of Interest; CNTD = Cumulative Net Thickness Difference (m).
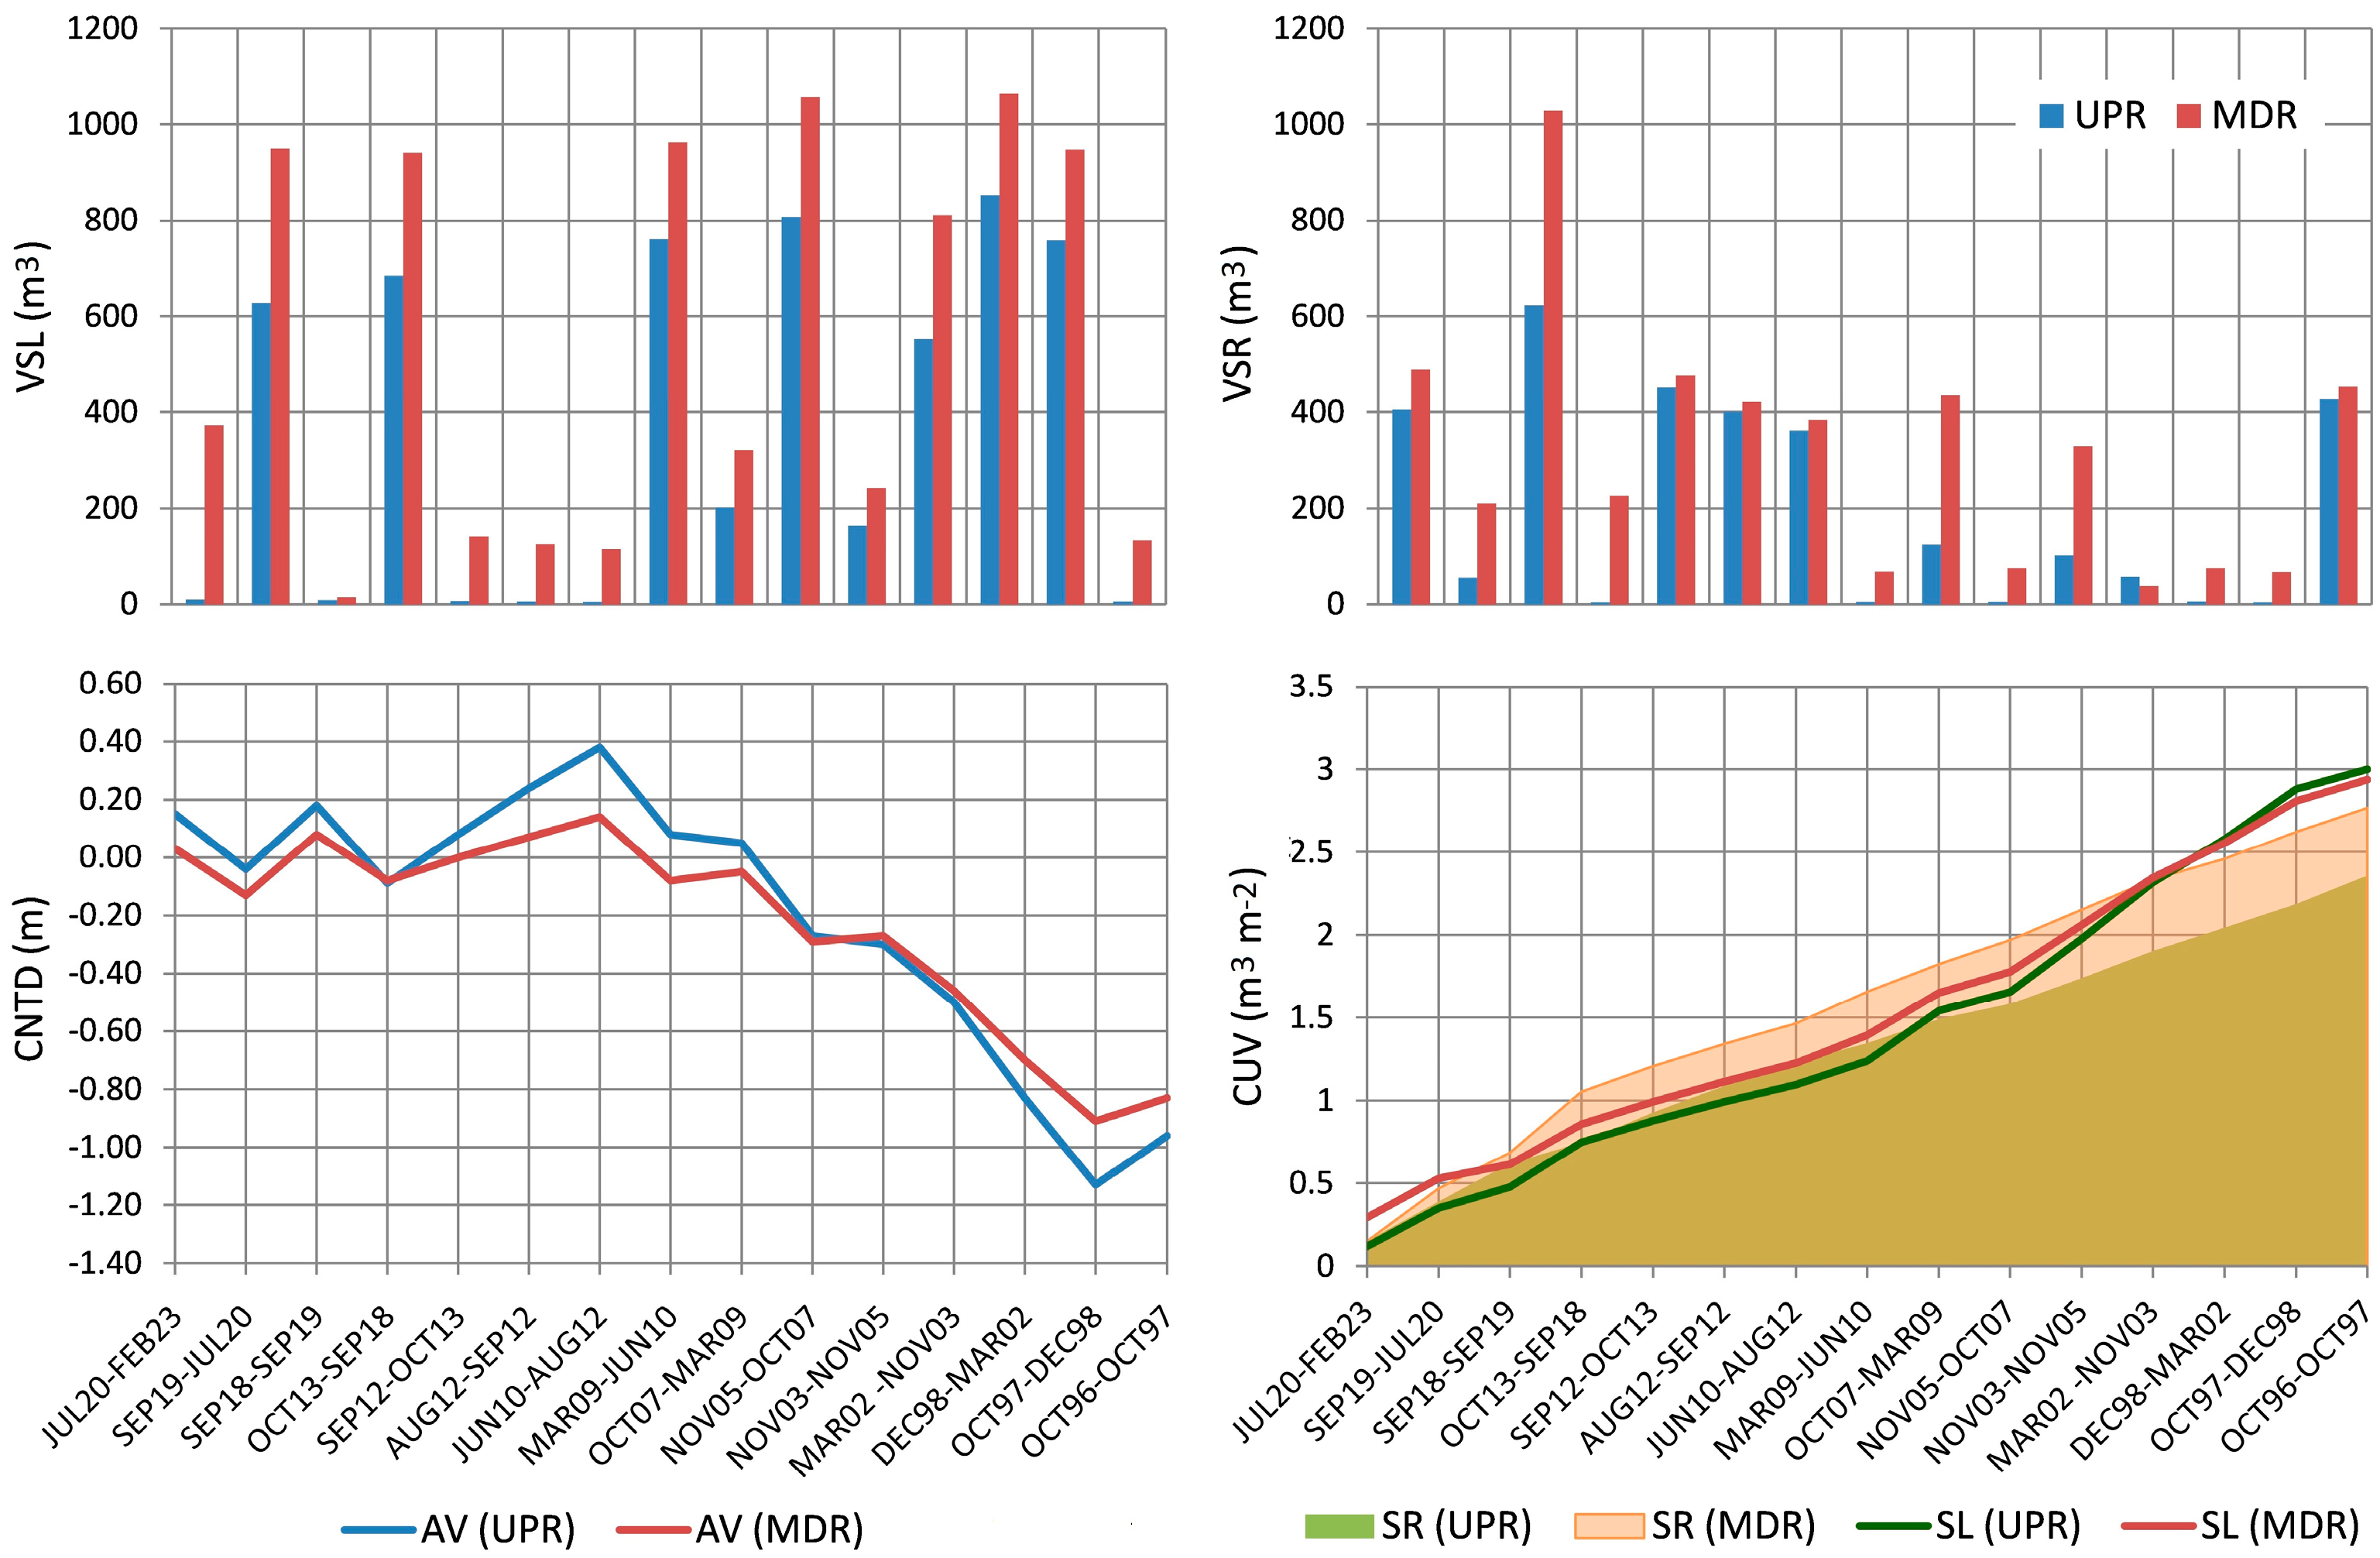
The highest bed lowering rate was recorded in the PECPs from October 1997 to December 1998, December 1998 to March 2002, November 2005 to October 2007, and March 2009 to June 2010, with NVD* values of -29.7 to -33.3 m3 per 100 m2 and ANTD values of -0.30 to -0.33 m for UPR; and somewhat lower for MDR (NVD*: -21.2 to -23.8 m3 per 100 m2; ANTD: -0.21 to -0.24 m). In these stages, intense flash floods caused more incision than deposition. The comparison of the total volumes of surface lowering (VSL) with those of surface raising (VSR) during such sub-periods (Figure 8) also corroborates this. By contrast, from 2012 the PCEPs included more moderate events, interspersed with bankfull and sub-bankfull peak discharges, which had high competence and effectiveness in transport. The bedload deposited during the recess stage of the hydrograph, in these cases, was generally greater than the sediment removal in the phase of transitory erosion. The most notable example corresponds to the PECP September 2018-September 2019, which was represented by a type A pattern and a single bankfull event. In this PECP, the highest vertical accretion rate of the entire analyzed period was recorded (NVD* = 22.2 m3 per 100 m2 and VSR = 613 m3 in UPR; NVD* = 20.7 m3 per 100 m2 and VSR = 1013 m3 in MDR) (Figure 8).
This change in trend can be better appreciated by analyzing the variation in the cumulative net thickness differences (CNTD) and the cumulative unit volume of surface raising and lowering (CUVR and CUVL). The CNTD variation denotes a dominant bed downcutting process from October 1997 to June 2010, going from -1.13 m to 0.08 m in UPR and from -0.91 m to -0.08 m in MDR (Figure 8). From June 2010 to February 2023, the bed experienced slight changes in elevation, maintaining a metastable dynamic equilibrium and a slight increase in net deposition along both stretches. The unit volumes of incision or aggradation do not take into account the bedform size or the affected area, but they do make it possible to detect the rate of morphological adjustment per surface unit and therefore to compare the sediment budgets in sections of different length. The most conclusive result, in this sense, is the verification that the rate of increase of CUVR was regularly uniform (0.8 m3 m-2 year-1), while the rate of incision followed an uneven evolution throughout the entire period, except in the 2010-2013 stage, in which it showed some similarity to the gradual bed elevation.
Figure 8.
The upper histograms represent the total volumes of lowered (VSL) and raised (VSR) surfaces for all PECPs; at the bottom, the left-hand figure shows the cumulative net thickness difference (CNTD), and the right-hand figure shows the profiles depicting the cumulative unit volume (CUV) of surface lowering (SL) and raising (SR) for the same sub-periods and channel reaches. AV = average values for each sub-period.
4.3. Retrospective Changes in Bed Elevation and Sediment Budgets Derived from TLS-Generated HRDEMs and the Resulting DoDs
The retrospective reconstruction of the morphological channel adjustments, performed at the event scale from TLS, provided more detailed information on topographic changes and bedload fluxes. Precise changes in the shape and extent of the bedforms can be seen in Figure 9. Depending on the section and stage in question, such changes reflect different geomorphic dynamics. If we analyze the cumulative differences from 2020 to the past, in both PBSAs, during the three-year period (2017-2020) bed homogenization occurred, slightly prevailing deposition over erosion. As we go back to 2007 the topographic differences between pools and riffles in the upper PBSA increased, leaving bedform units more prominent. Effects accumulated around 2002 showed a quite braided pattern, as a result of the disaggregation of oblique and mid-channel bars and the formation of new active bars, associated with a high bedload. The incision of secondary channels in these older stages extended until 1997, but the longitudinal and median alluvial bars maintained their main features and only suffered small local changes.
Upstream, pool-riffle sequences appeared at all stages as this is either a supply- or transport-limited system with a gravel bed and a slope of around 0.02, which agrees with what was argued by [51], [52], and [53]. Perhaps, the major morphological bed changes corresponded to narrow and non-sinuous channel stretches subject to geological control. Along these stretches such adjustments were promoted by high stream power values concentrated in short distances, as already suggested by Conesa-García et al. [24] for entrenched channel cross-sections, along stretches with sudden changes in bed roughness.
The evolution of the MDR was always closely related to the geomorphic activity of the UPR and the intermediate section. Here again, previous incision features in secondary channels and the lateral edge of a mid-channel bar were blurred by deposits that filled them in the 2012-2016 sub-period. During this stage the bed remained practically stable as a result of an equilibrium in the balance between erosion and deposition. In recent years, it seems to be experiencing some vertical accretion and granular armoring that will most likely hinder the incision processes and favor lateral erosion.
Figure 9.
Cumulative HRDODs retrospectively simulated for the period 1997-2020 in the upper and middle RCRs, combining pre- and post-event ECs with TLS-derived DTMs over the monitoring stage (2018-2020).
Figure 9.
Cumulative HRDODs retrospectively simulated for the period 1997-2020 in the upper and middle RCRs, combining pre- and post-event ECs with TLS-derived DTMs over the monitoring stage (2018-2020).
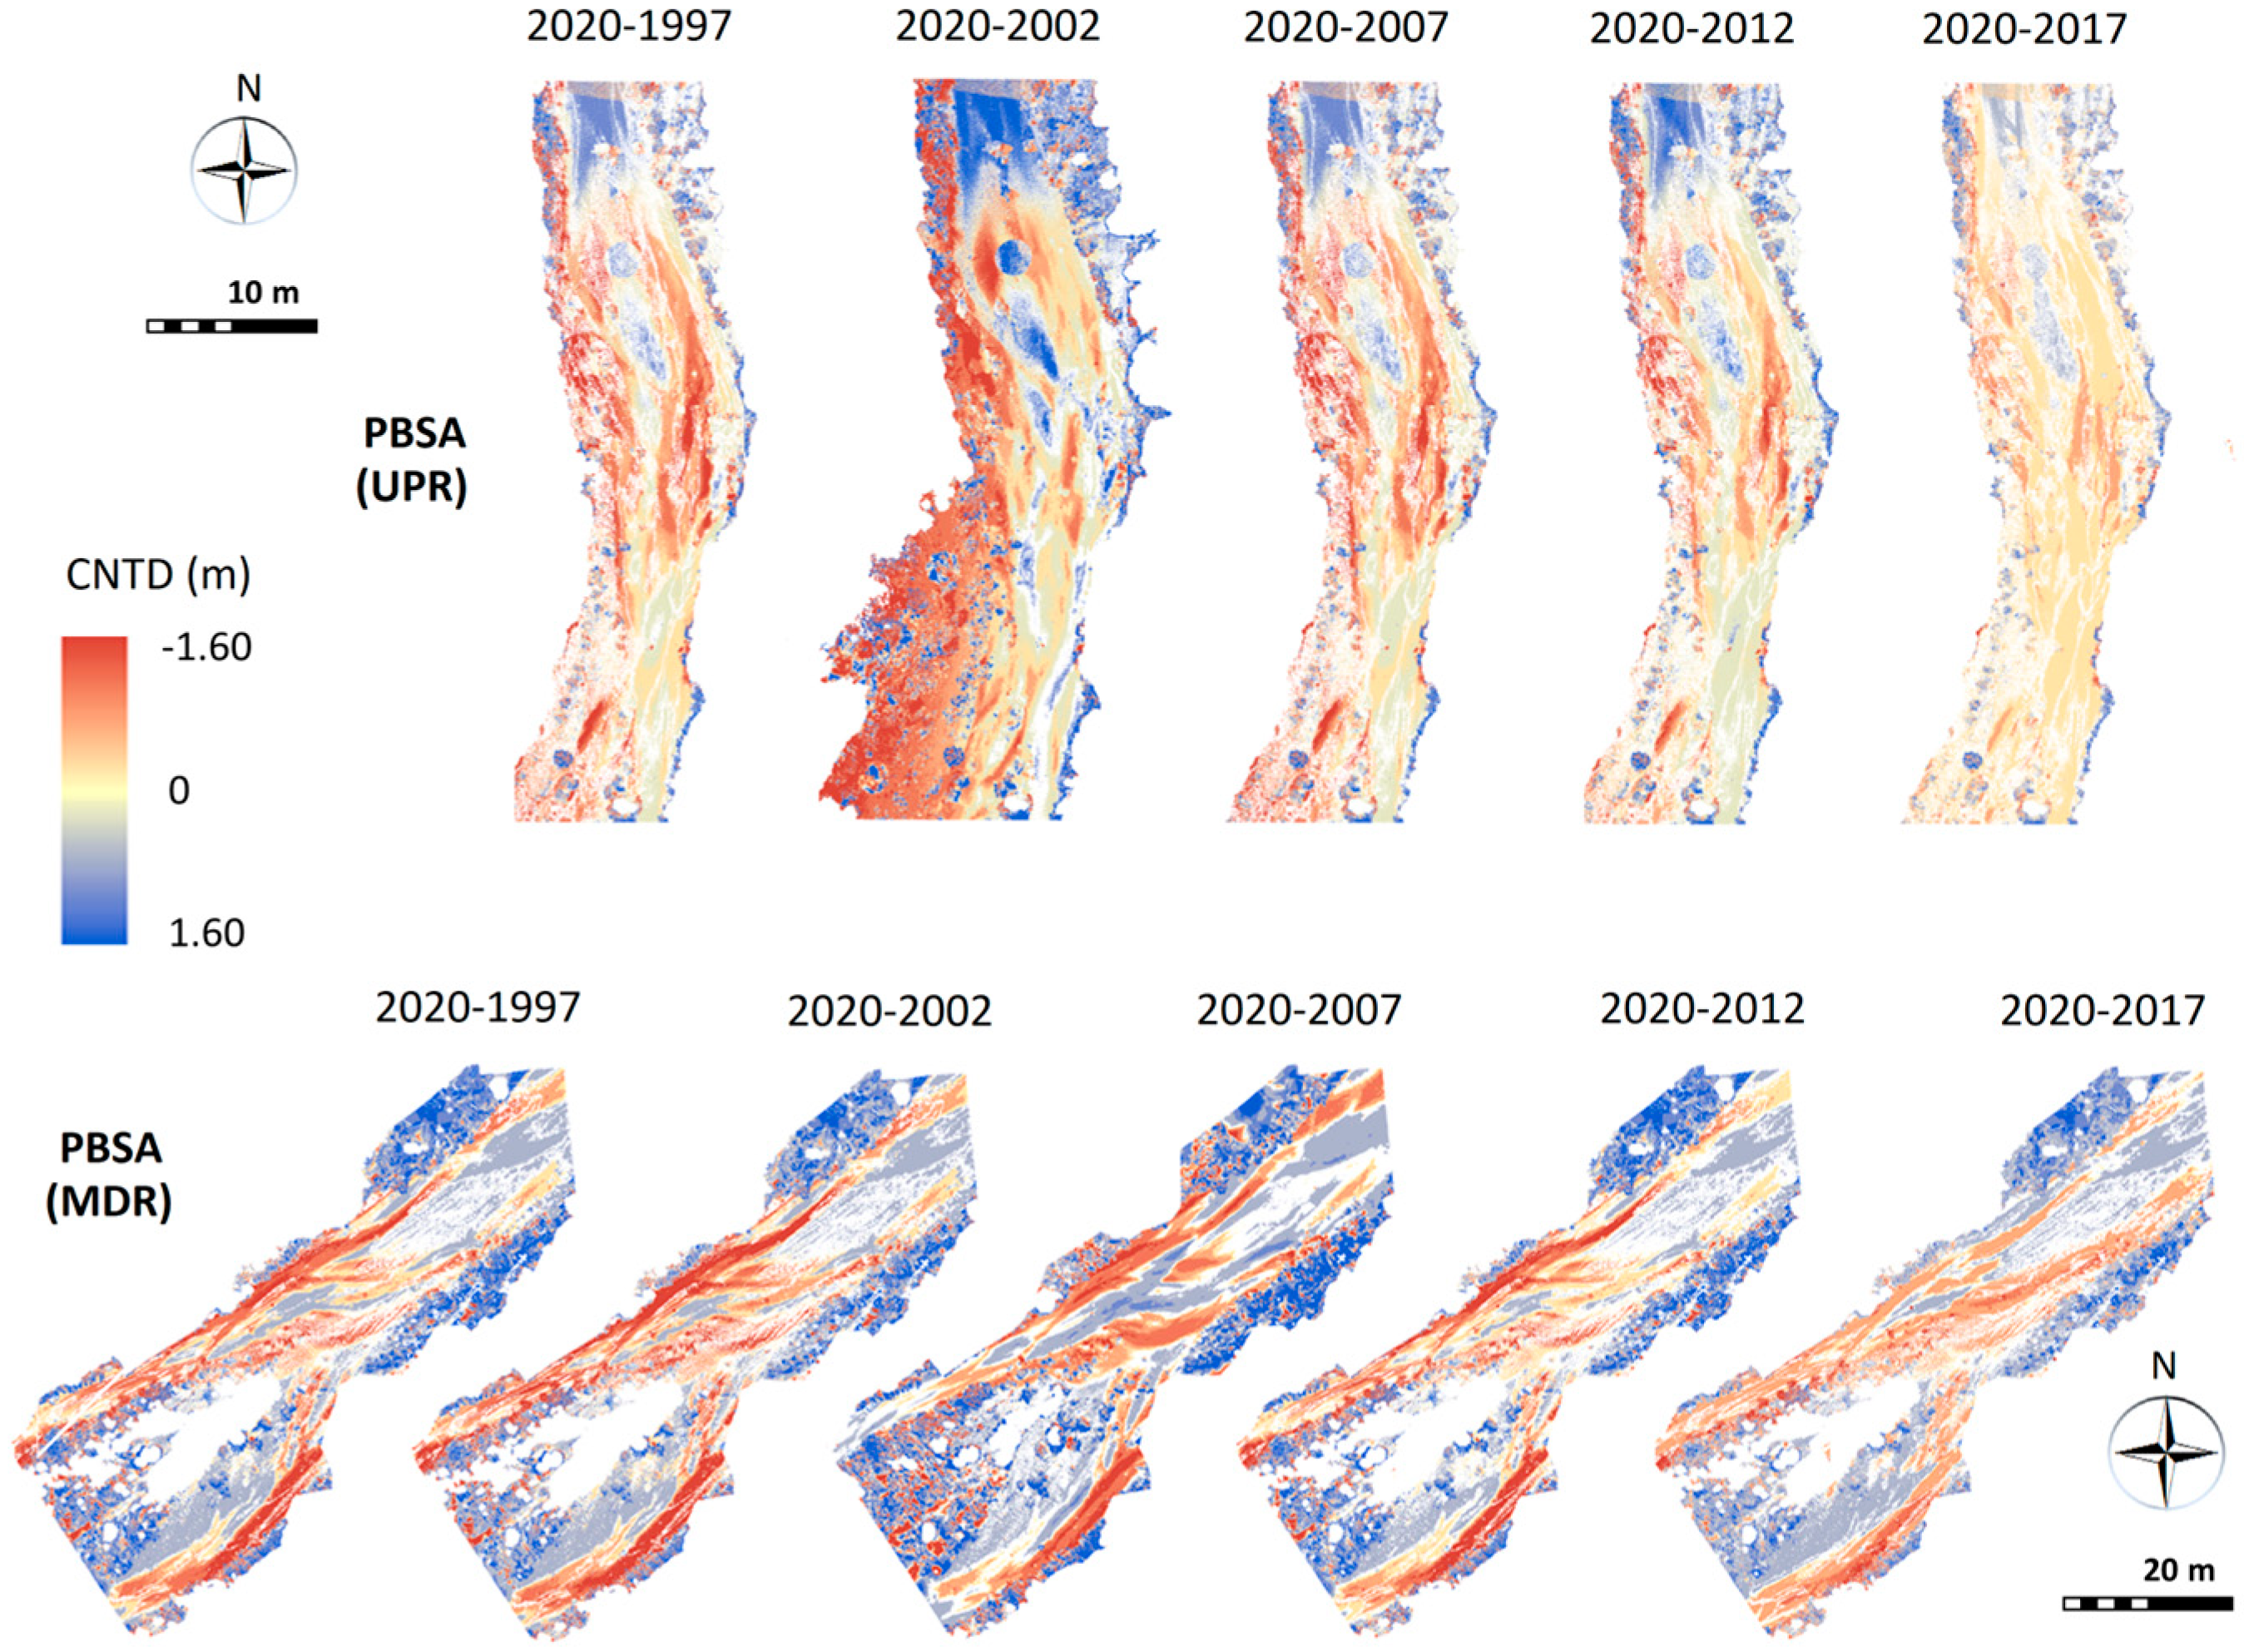
Regarding the variations in bed elevation throughout the study period in UPR, aggradation was quite generalized along this stretch (Table 11), except in the high alluvial bars that presented punctual erosion or are stabilized by large blocks and vegetation. Throughout this period (1996-2020) the pools were filled to a significant extent by sediments, but only locally did they reach the height of the riffles. The most noticeable filling took place in the 2007-2012 stage, with increases in bed elevation above 0.5 m in the deepest pools (Figure 10). At the end of this stage, the bed reached its maximum topographic and morphosedimentary uniformity. In the last ten years, various events of different classes have occurred, causing uneven geomorphological impacts that have returned a certain irregularity to the bed. Several bars have been destroyed or displaced, and new pools have arisen, which denotes great geomorphic activity.
Table 11.
Average and cumulative changes in bed elevation relative to the current surface level (m), calculated by subtracting HRDoDs from TLS over simulated five-year periods.
Table 11.
Average and cumulative changes in bed elevation relative to the current surface level (m), calculated by subtracting HRDoDs from TLS over simulated five-year periods.
| RCR | Upper RCR | Middle RCR | ||||
|---|---|---|---|---|---|---|
| Period | ANTD | CNTD | St. Dev. | ANTD | CNTD | St. Dev. |
| 2016-2020 | 0.06 | 0.06 | 0.04 | 0.04 | 0.04 | 0.06 |
| 2012-2016 | -0.04 | 0.02 | 0.12 | -0.01 | 0.03 | 0.09 |
| 2007-2012 | -0.28 | -0.26 | 0.33 | -0.13 | -0.10 | 0.21 |
| 2002-2007 | -0.22 | -0.48 | 0.58 | -0.12 | -0.22 | 0.37 |
| 1996-2002 | -0.25 | -0.73 | 0.82 | -0.29 | -0.51 | 0.63 |
Figure 10.
Serial profiles based on TLS data, showing the average thickness of the bed elevation differences along the channel center line over five or four-year sub-periods from 1996 to 2020. The area profiles represent the incision and aggradation sites for the entire period.
Figure 10.
Serial profiles based on TLS data, showing the average thickness of the bed elevation differences along the channel center line over five or four-year sub-periods from 1996 to 2020. The area profiles represent the incision and aggradation sites for the entire period.
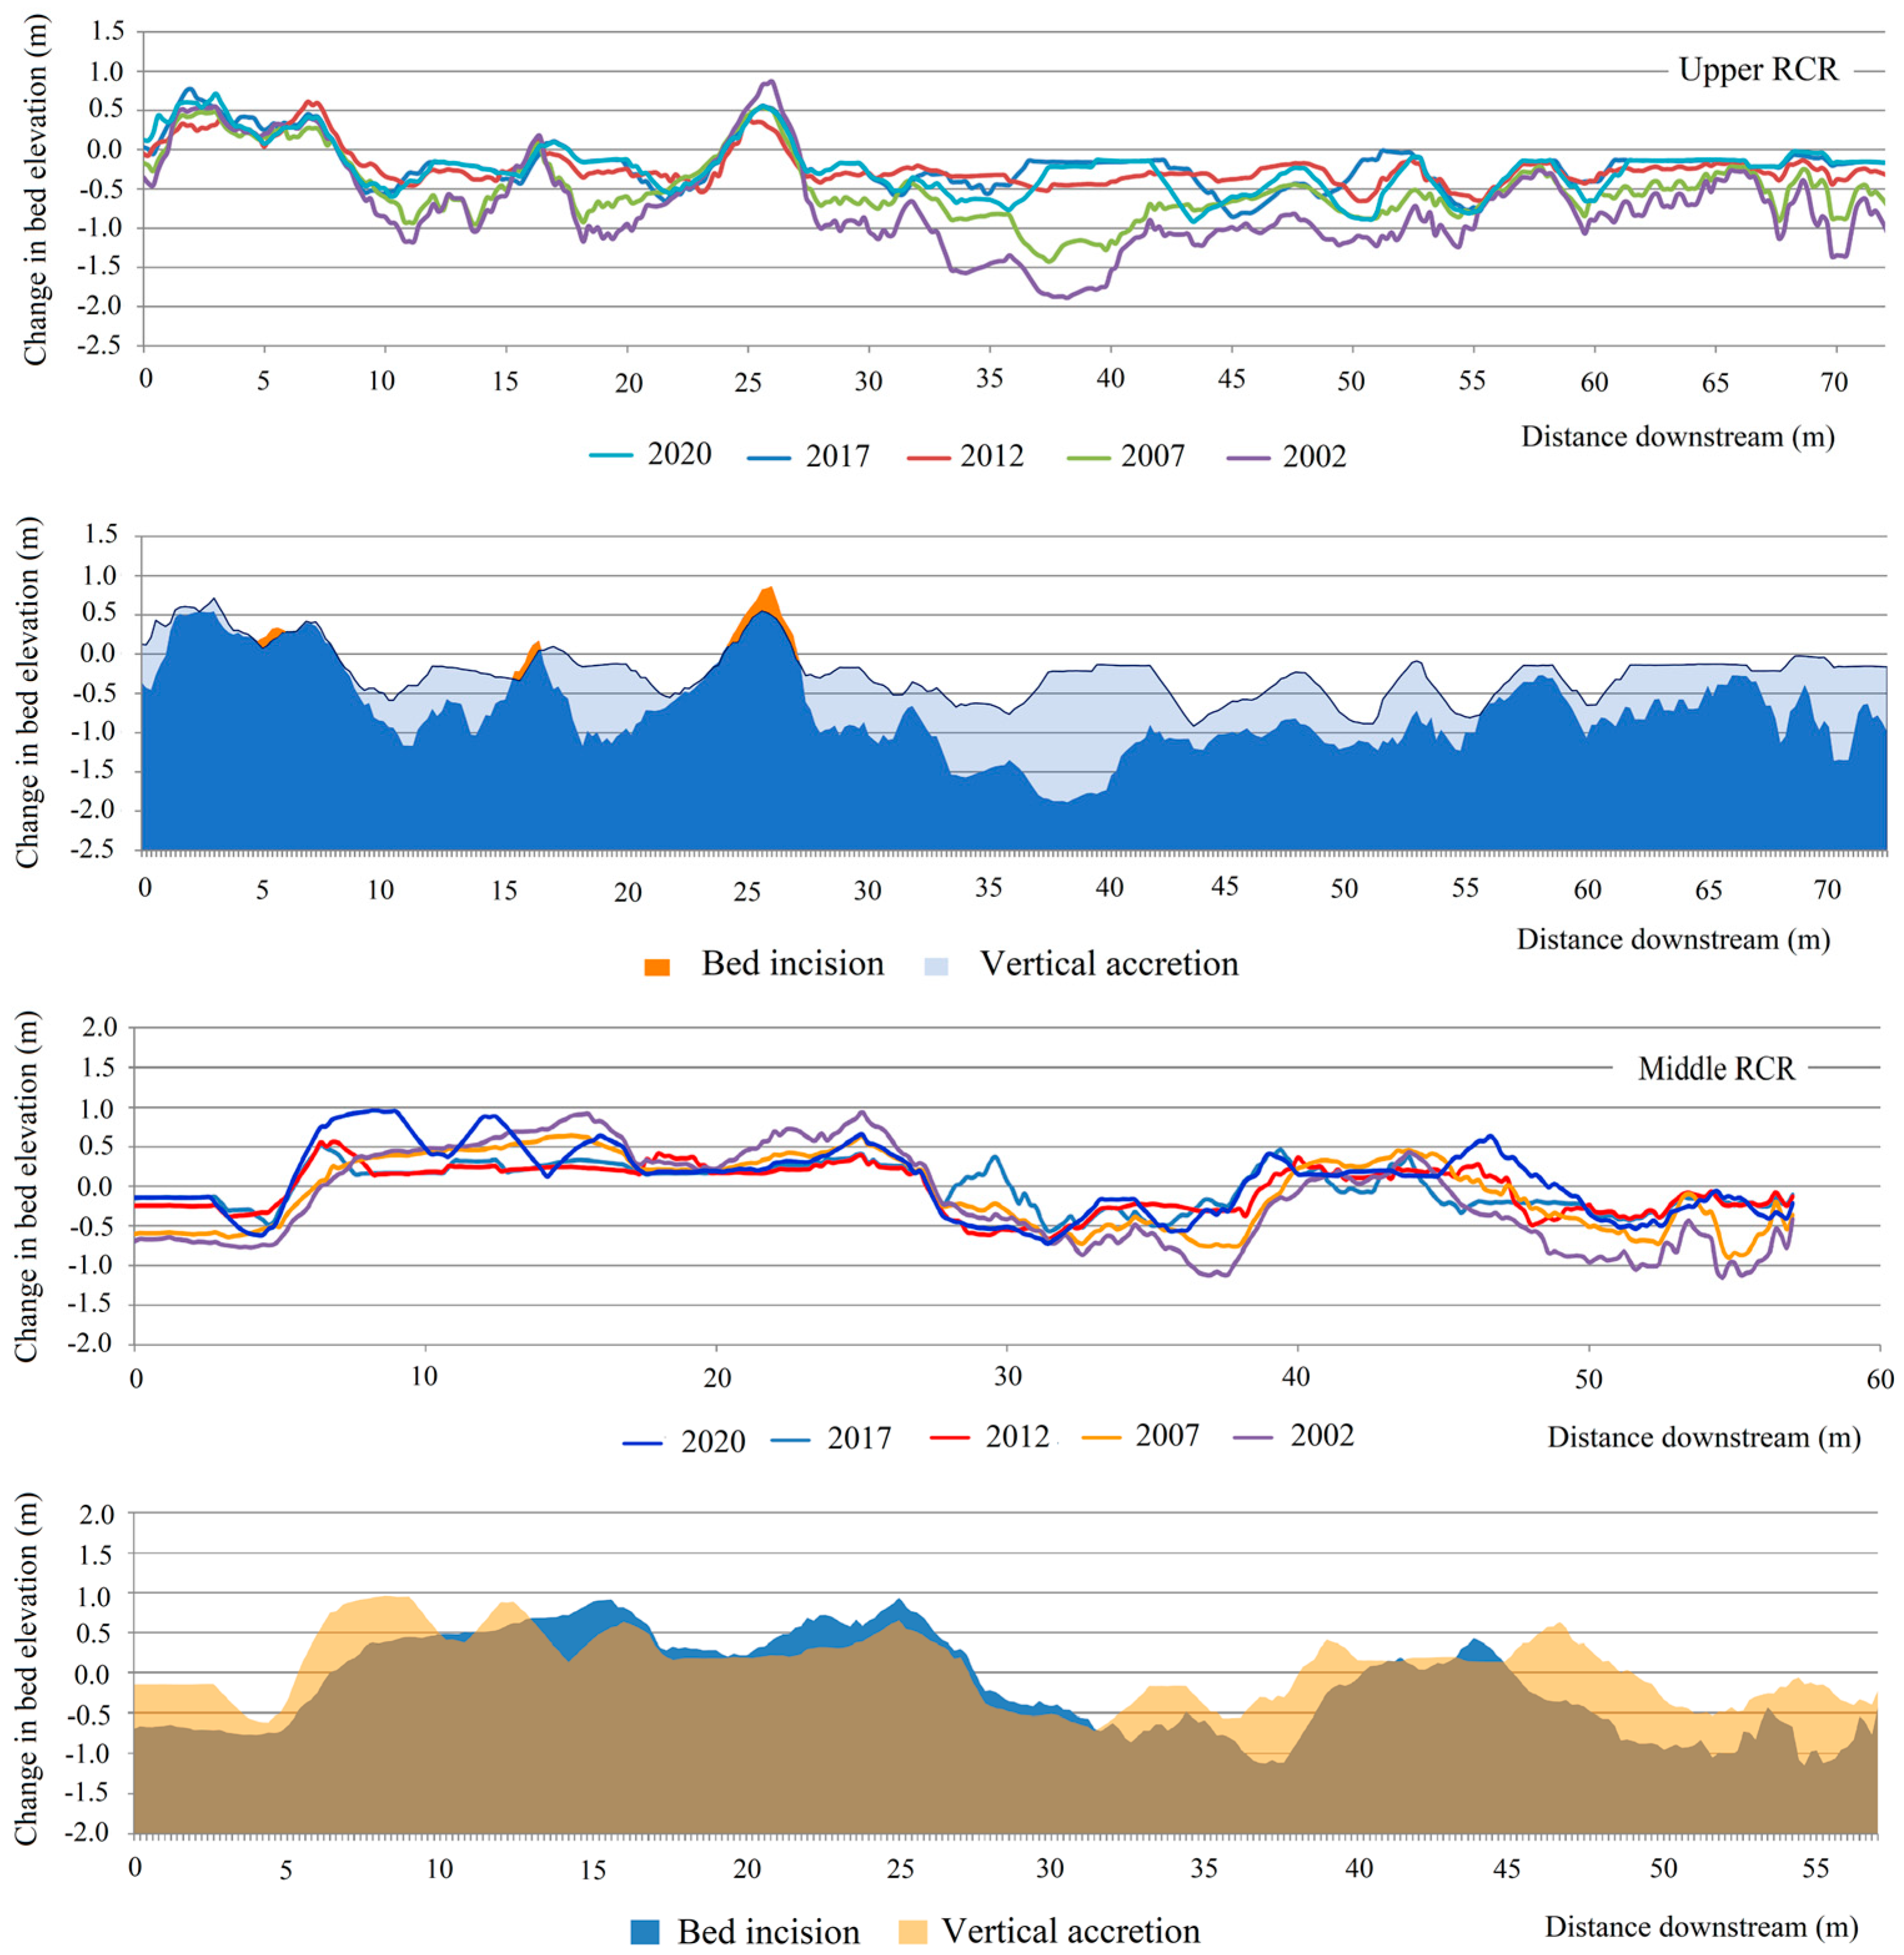
The topographic changes were somewhat more moderate in MDR, although the events of each stage produced different specific effects. In the 2002-2007 stage, the erosion of the bar platforms and the accumulation in the pools and secondary channels were the most recurrent processes. Between 2007 and 2012 the erosion and mobilization of bedload material flattened and lowered the bed in the runs to elevation +0.2 m, while in the pools the surface rose +0.5 m compared to the previous stage. From 2012 to 2016 the bed remained relatively stable, with hardly any variation in its height, while in the most recent stage (2016-2020) vertical accretion at the tails of high bars, in pool sites, and at low bars occurred. Considering the entire period (1996-2020), it is worth noting the aggradation of the pre-existing bars in the growing development phase downstream (net deposition of 0.2 to 0.6 m) and the slight lowering of the supraplatform and head of the highest bars.
4.4. Spatio-Temporal Patterns in Stream Power Derived from Monitored and Simulated Peak Discharges
In Table 12 the average values of the main energy indicators (ω, ωc, ∂ω/∂s, ε, and εc) are shown for each PECP and RCR. As already noted in section 3.5, these averages were estimated from datasets of 10 flow cross-sections in UPR and 12 along MDR, with a separation interval of 25 m. This type of data provides us with a simplified comparative vision of the interannual variation affecting the stream power in both sections, but, nevertheless, it masks its spatial variability. Detailed information on the spatial patterns of stream power in relation to channel changes in gravel-bed streams can be found in the works of Lea & Legleiter (2015) and Conesa-García et al. (2020, 2022). The latter authors found a wide range of ω and ωc values for our study stretches, which justified a large mosaic of spatial changes in bed elevations and sediment budgets attributed to events of different magnitude. Such variations were associated with substantial fluctuations in velocity and critical stress along the reference channel reaches, in accordance with the pattern suggested by [51]. The spatial differences in roughness due to sudden changes in grain size and bedform also strongly influenced the calculated excess energy per unit bed area after specific events. A previous study on changes in stream power and morphological adjustments at the event-scale along these RCRs [5] found larger differences between the standard deviations and the means of ω, ∂ω/∂s, and ε for Class 2 and 3 events than for large flash floods. Also, in MDR residual stream power values were obtained further from the mean than in UPR. All of this leads us to consider with more reserve the averaged values for PECPs that do not include overtopping discharges but do contain bankfull and sub-bankfull type events in their sequence (Pattern B). Taking this into account, Table 12 indicates that the PECPs with the highest mean values of ω occurred between October 1997 and June 2010, highlighting the stages December 1998 – March 2002 and November 2005 – October 2007. In both, the average stream power exceeded 265 and 240 W m-2 in UPR and MDR, respectively.
Table 12.
Average values of stream power variables estimated for each PECP sub-period, for the Upper and Middle RCRs.
Table 12.
Average values of stream power variables estimated for each PECP sub-period, for the Upper and Middle RCRs.
| PECP | ω | δω/δs | ε | εc | ||||
|---|---|---|---|---|---|---|---|---|
| UPR | MDR | UPR | MDR | UPR | MDR | UPR | MDR | |
| JUL20-FEB23 | 204.9 | 122.2 | 1.01 | -0.76 | 89.40 | 73.45 | 1.34 | 0.73 |
| SEP19-JUL20 | 156.6 | 256.1 | 0.38 | -0.79 | 72.35 | 59.42 | 0.84 | 1.19 |
| SEP18-SEP19 | 214.1 | 154.2 | 0.82 | -1.06 | 108.15 | 50.22 | 1.25 | 0.79 |
| OCT13-SEP18 | 212.1 | 129.8 | 1.22 | -1.35 | 98.92 | 39.15 | 1.44 | 0.69 |
| SEP12-OCT13 | 117.1 | 270.4 | 0.64 | -1.01 | 47.91 | 85.33 | 1.05 | 1.37 |
| AUG12-SEP12 | 210.2 | 104.1 | 1.08 | -1.42 | 92.50 | 31.02 | 1.57 | 0.62 |
| JUN10-AUG12 | 184.4 | 113.1 | 0.60 | -0.51 | 91.01 | 33.63 | 1.05 | 0.66 |
| MAR09-JUN10 | 218.4 | 148.3 | 0.78 | -1.62 | 104.01 | 49.31 | 1.20 | 0.76 |
| OCT07-MAR09 | 230.8 | 183.8 | 1.24 | -1.21 | 133.17 | 53.96 | 1.59 | 0.86 |
| NOV05-OCT07 | 265.5 | 240.2 | 1.06 | -1.21 | 126.97 | 82.78 | 1.47 | 1.09 |
| NOV03-NOV05 | 153.6 | 112.9 | 0.38 | -0.37 | 73.31 | 77.56 | 0.85 | 1.03 |
| MAR02 -NOV03 | 143.6 | 102.8 | 0.34 | -0.20 | 66.12 | 69.44 | 0.76 | 0.92 |
| DEC98-MAR02 | 270.7 | 240.4 | 1.34 | -1.52 | 157.30 | 120.86 | 1.82 | 1.12 |
| OCT97-DEC98 | 261.7 | 234.2 | 0.82 | -0.95 | 117.06 | 70.75 | 1.15 | 0.95 |
| OCT96-OCT97 | 144.5 | 97.1 | 0.26 | -0.15 | 64.46 | 48.38 | 0.75 | 0.74 |
PECP = Periods based on Event Class Patterns; ω = mean stream power (Wm−2); δω/δs = mean stream power gradient (Wm-2 m-1); ε = excess energy per unit bed area (Wm−2); εc = accumulated excess energy (MJ).
Regarding the mean stream power gradient (∂ω/∂s), the contrast between the positive values of UPR and the negative values found in MDR is noteworthy. This is consistent with the assumptions described by Dade and Friend [54] and Gartner et al. [55] when analyzing the influence of stream power gradients on downstream sediment flux during floods. Downstream decreases in the average stream power gradient (negative ∂ω/∂s) were normally associated with depositional responses to peak discharges in the recession branch of their hydrograph. It is also of note that, depending on the pattern of event classes, the contrast of the mean values of ∂ω/∂s between the upper and middle reaches was greater or lesser. The greatest negative gradients averaged in MDR (∂ω/∂s < -1.20 W m-2 m-1) did not always correspond to the greatest positive ones obtained in UPR (∂ω/∂s > 1.20 W m-2 m-1). They had a close relationship with the latter in the stages with ECPs of type B and E, devoid of Class 1 events (e.g. October 2007 – March 2009, December 1998 – March 2002), but, on the other hand, they also coincided with lower ∂ω /∂s values in UPR (∂ω/∂s of 0.78 to 1.1 W m-2 m-1) during PECPs of type A, C, and D (e.g. September 2018 – September 2019, March 2009 – June 2010, August 2012 – September 2012).
The average values of ε and εc per PCEP were, as expected, higher in UPR than in MDR, except in three cases (March 2002 – November 2003, November 2003 – November 2005, and September 2012 - October 2013). Although bed roughness and critical stream power had a great influence on both variables in most of the retrospectively simulated periods, both ε and εc followed the ω variation patterns (Figure 11), reaching their maximums in UPR during the PECPs December 1998 – March 2002, November 2005 – October 2007, and October 2007 – March 2009 (ε of 125 to 160 W m-2 and εc of 1.45 to 1.80 MJ).
Figure 11.
ω-ε and ω-εc relationships (left-hand graphs) and ∂ω/∂s-ε and ∂ω/∂s-εc relationships (right-hand graphs), at a significance level (p-value) < 0.05. AVP = average values per PCEP sub-period.
Figure 11.
ω-ε and ω-εc relationships (left-hand graphs) and ∂ω/∂s-ε and ∂ω/∂s-εc relationships (right-hand graphs), at a significance level (p-value) < 0.05. AVP = average values per PCEP sub-period.
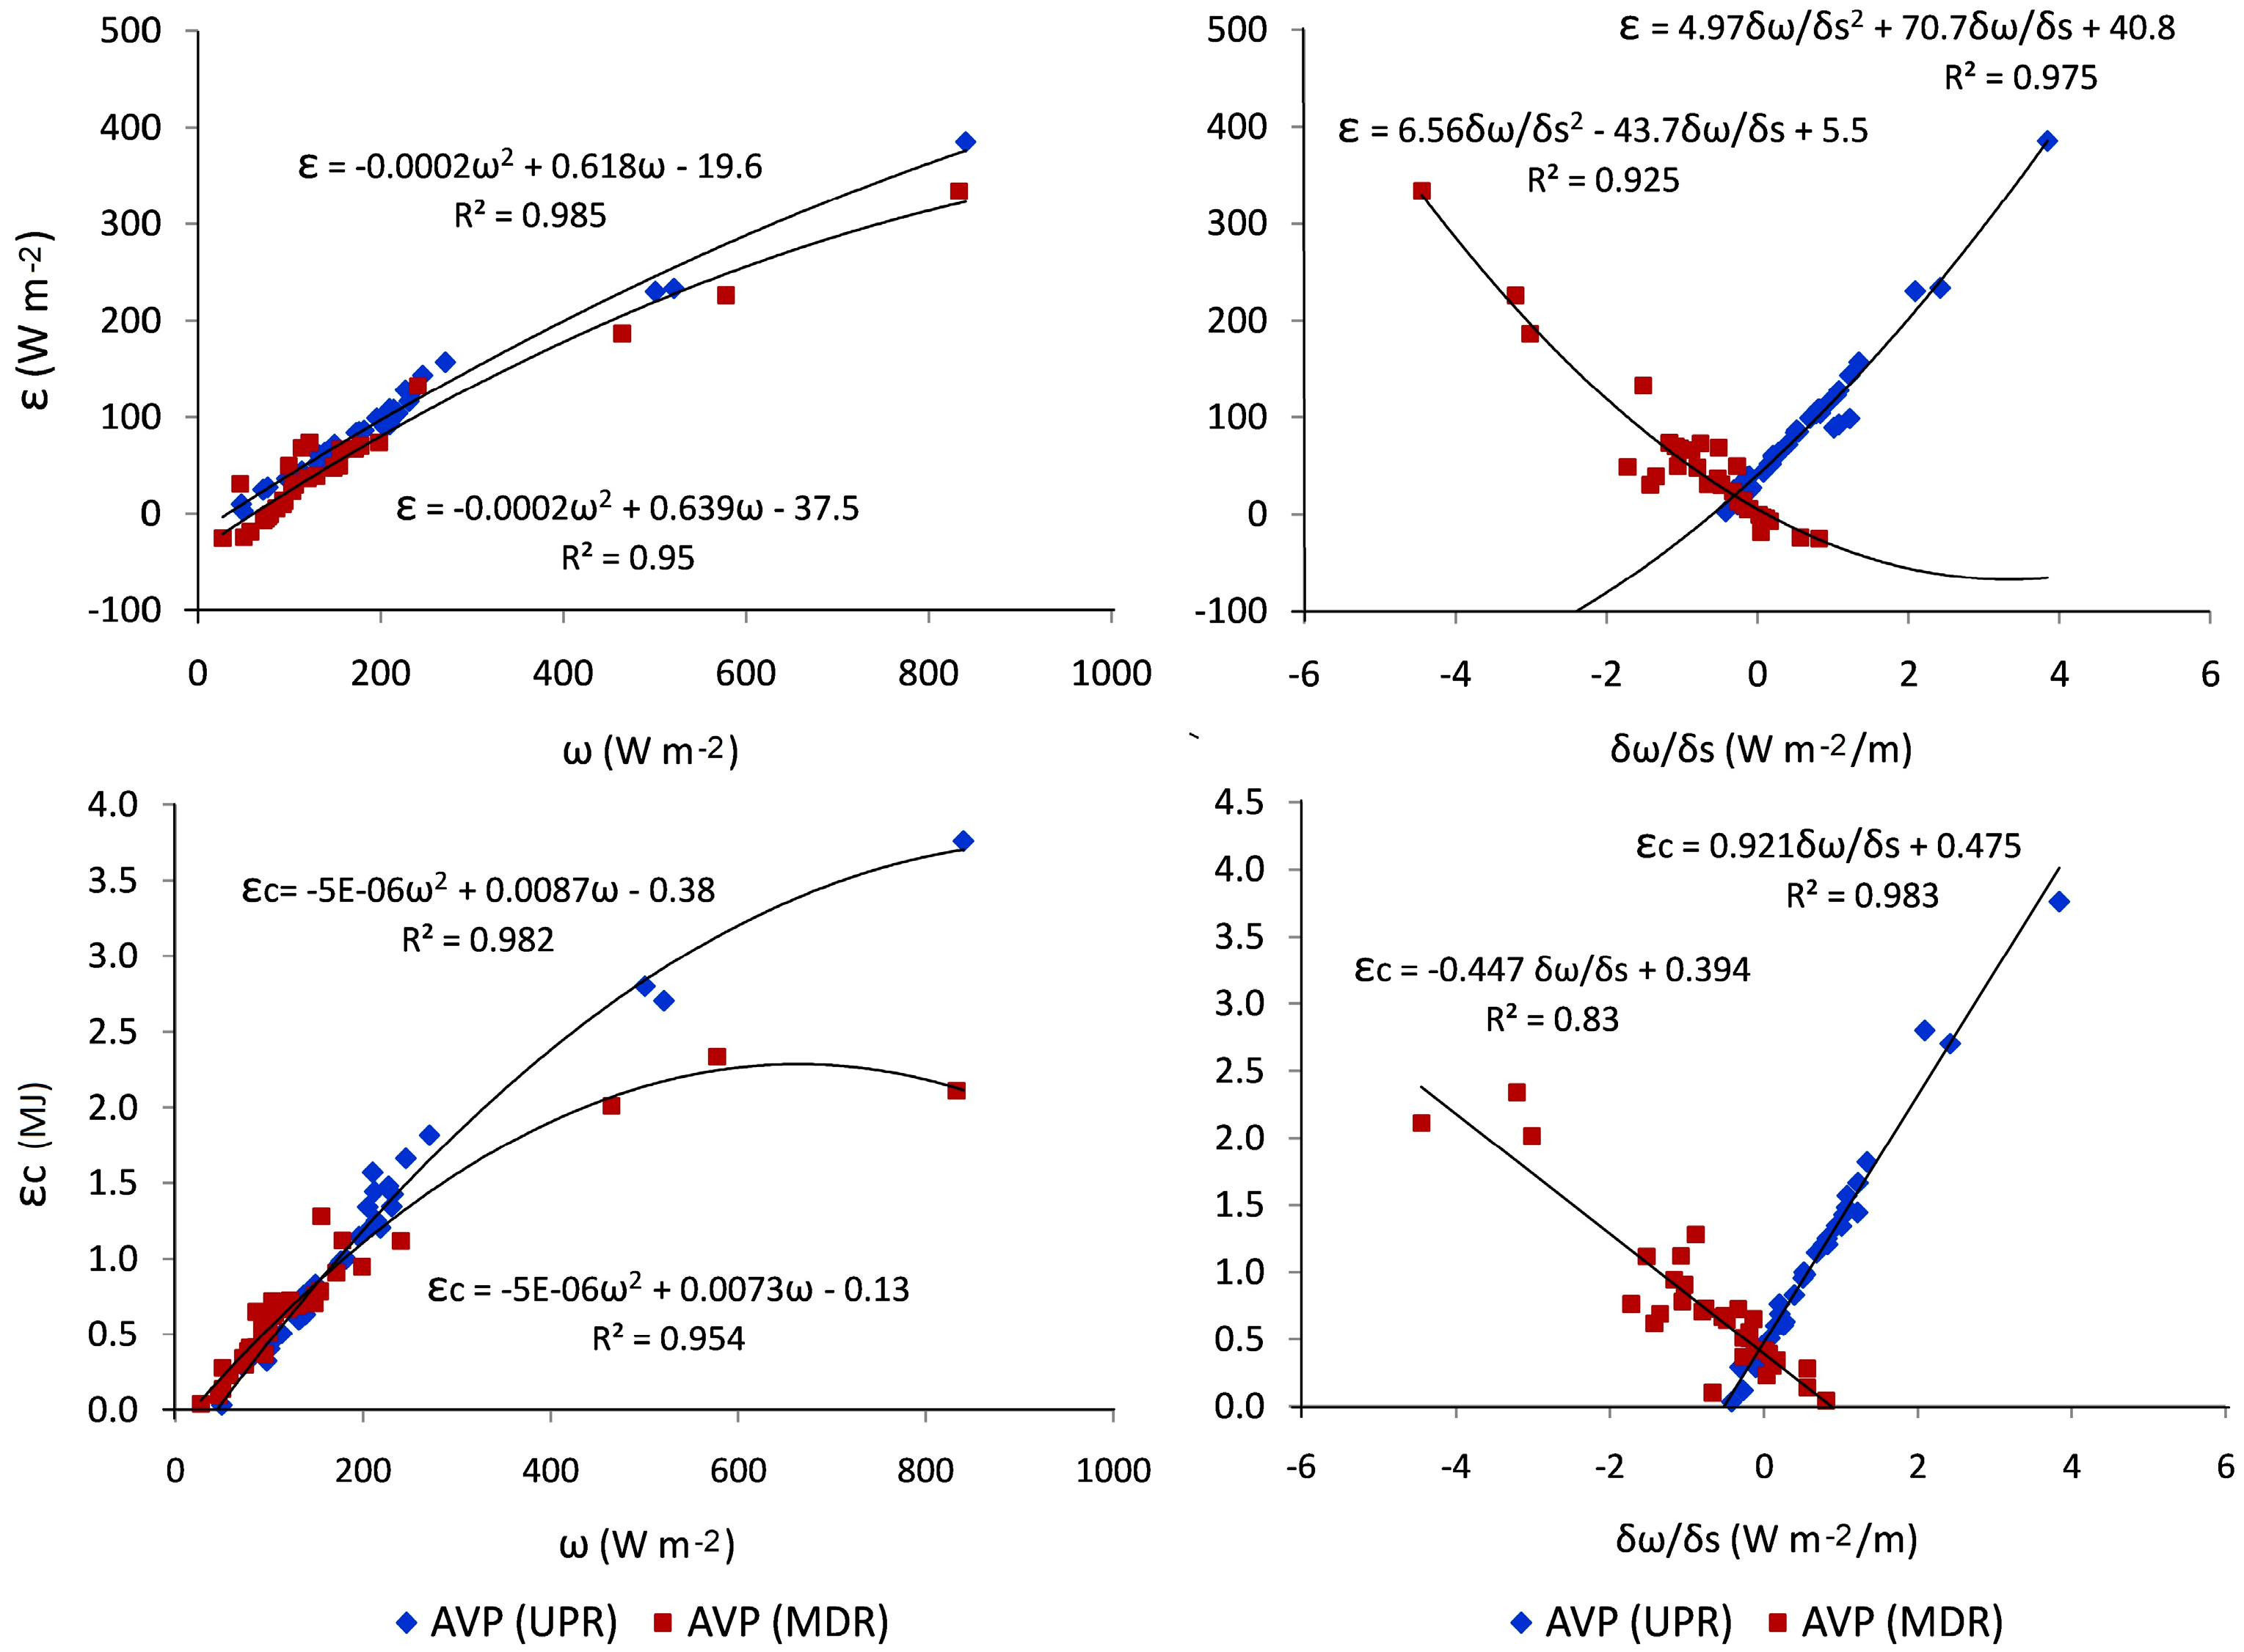
4.5. Relationships between Morphological Bed Adjustments and Temporal Changes in Potential Sediment Inputs and Stream Power
The average (ASYP) and accumulated (CSYP) sediment yield per sub-period were plotted against ANTD, UVSL, and UVSR (Figure 12) to examine the hypothesis that these variables could be correlated. All these scatter plots display point clouds, which represent such types of relationships for the PECPs, including events monitored over the period 2018-2022 and those predicted retrospectively by GeoWEPP up to 1996. In general, the scatter diagrams show a large dispersion of residual values and there appears to be no correlation between morphological bed adjustment classes and sediment production at the basin level. Only in MDR is there a slight fit by polynomial regression of order 2 (r2 ≈ 0.65), that improves significantly at order 4 (r2 ≈ 0.87), when relating the average sediment yield to ANTD and UVSL. The other relationships present scattered and skewed distributions, with groupings of points that, relatively, are somewhat more organized for the cases in which the variable ASYP is considered. In fact, it is clear that ANTD has a chaotic relationship with CSYP, but shows a positive correlation with ASYP. The total lack of relationship between CSYP and ANTD is explained if it is taken into account that the net variations in bed elevation are due more to the effects of specific chronologically consecutive events of different classes than to the cumulative production of sediments in a given period.
Regarding the relationships between the unit volumes of net erosion or deposition and the average or accumulated values of sediment delivery, no clear trends of unique statistical populations are observed, but rather dual behaviors in both sections. Only in the middle reach can a decrease in UVSL as ASYP increases be verified. In the other cases the same pattern seems to be repeated: two groups per RCR with unequal behavior in relation to different contributions of sediments from their respective catchment areas. For both groups of PECPs, bed lowering occurred in UPR with less sediment generated at the basin level than in MDR. The first group identified in UPR includes events that originated a moderate mean sediment production (1000 to 3100 tn) and an average unit scouring volume of 0.22 to 0.35 m3 m-2. This same group of PECPs exhibited somewhat lower bed downcutting rates in MDR (0.23 to 0.28 m3 m-2), associated with slightly higher ASYP values (2000 to 4100 t). The second set of points reflected UVSL growth with ASYP, which generally showed a positive relationship through a gently sloping trend line, representing a low range of bed incision, accompanied by lower average sediment supply in UPR than in MDR.
Figure 12.
Average and cumulative sediment yield per PECP sub-period (ASYP and CSYP, respectively), estimated at the entrance of the upper (UPR) and middle (MDR) channel reaches, versus ANTD, UVSL, and UVSR.
Figure 12.
Average and cumulative sediment yield per PECP sub-period (ASYP and CSYP, respectively), estimated at the entrance of the upper (UPR) and middle (MDR) channel reaches, versus ANTD, UVSL, and UVSR.
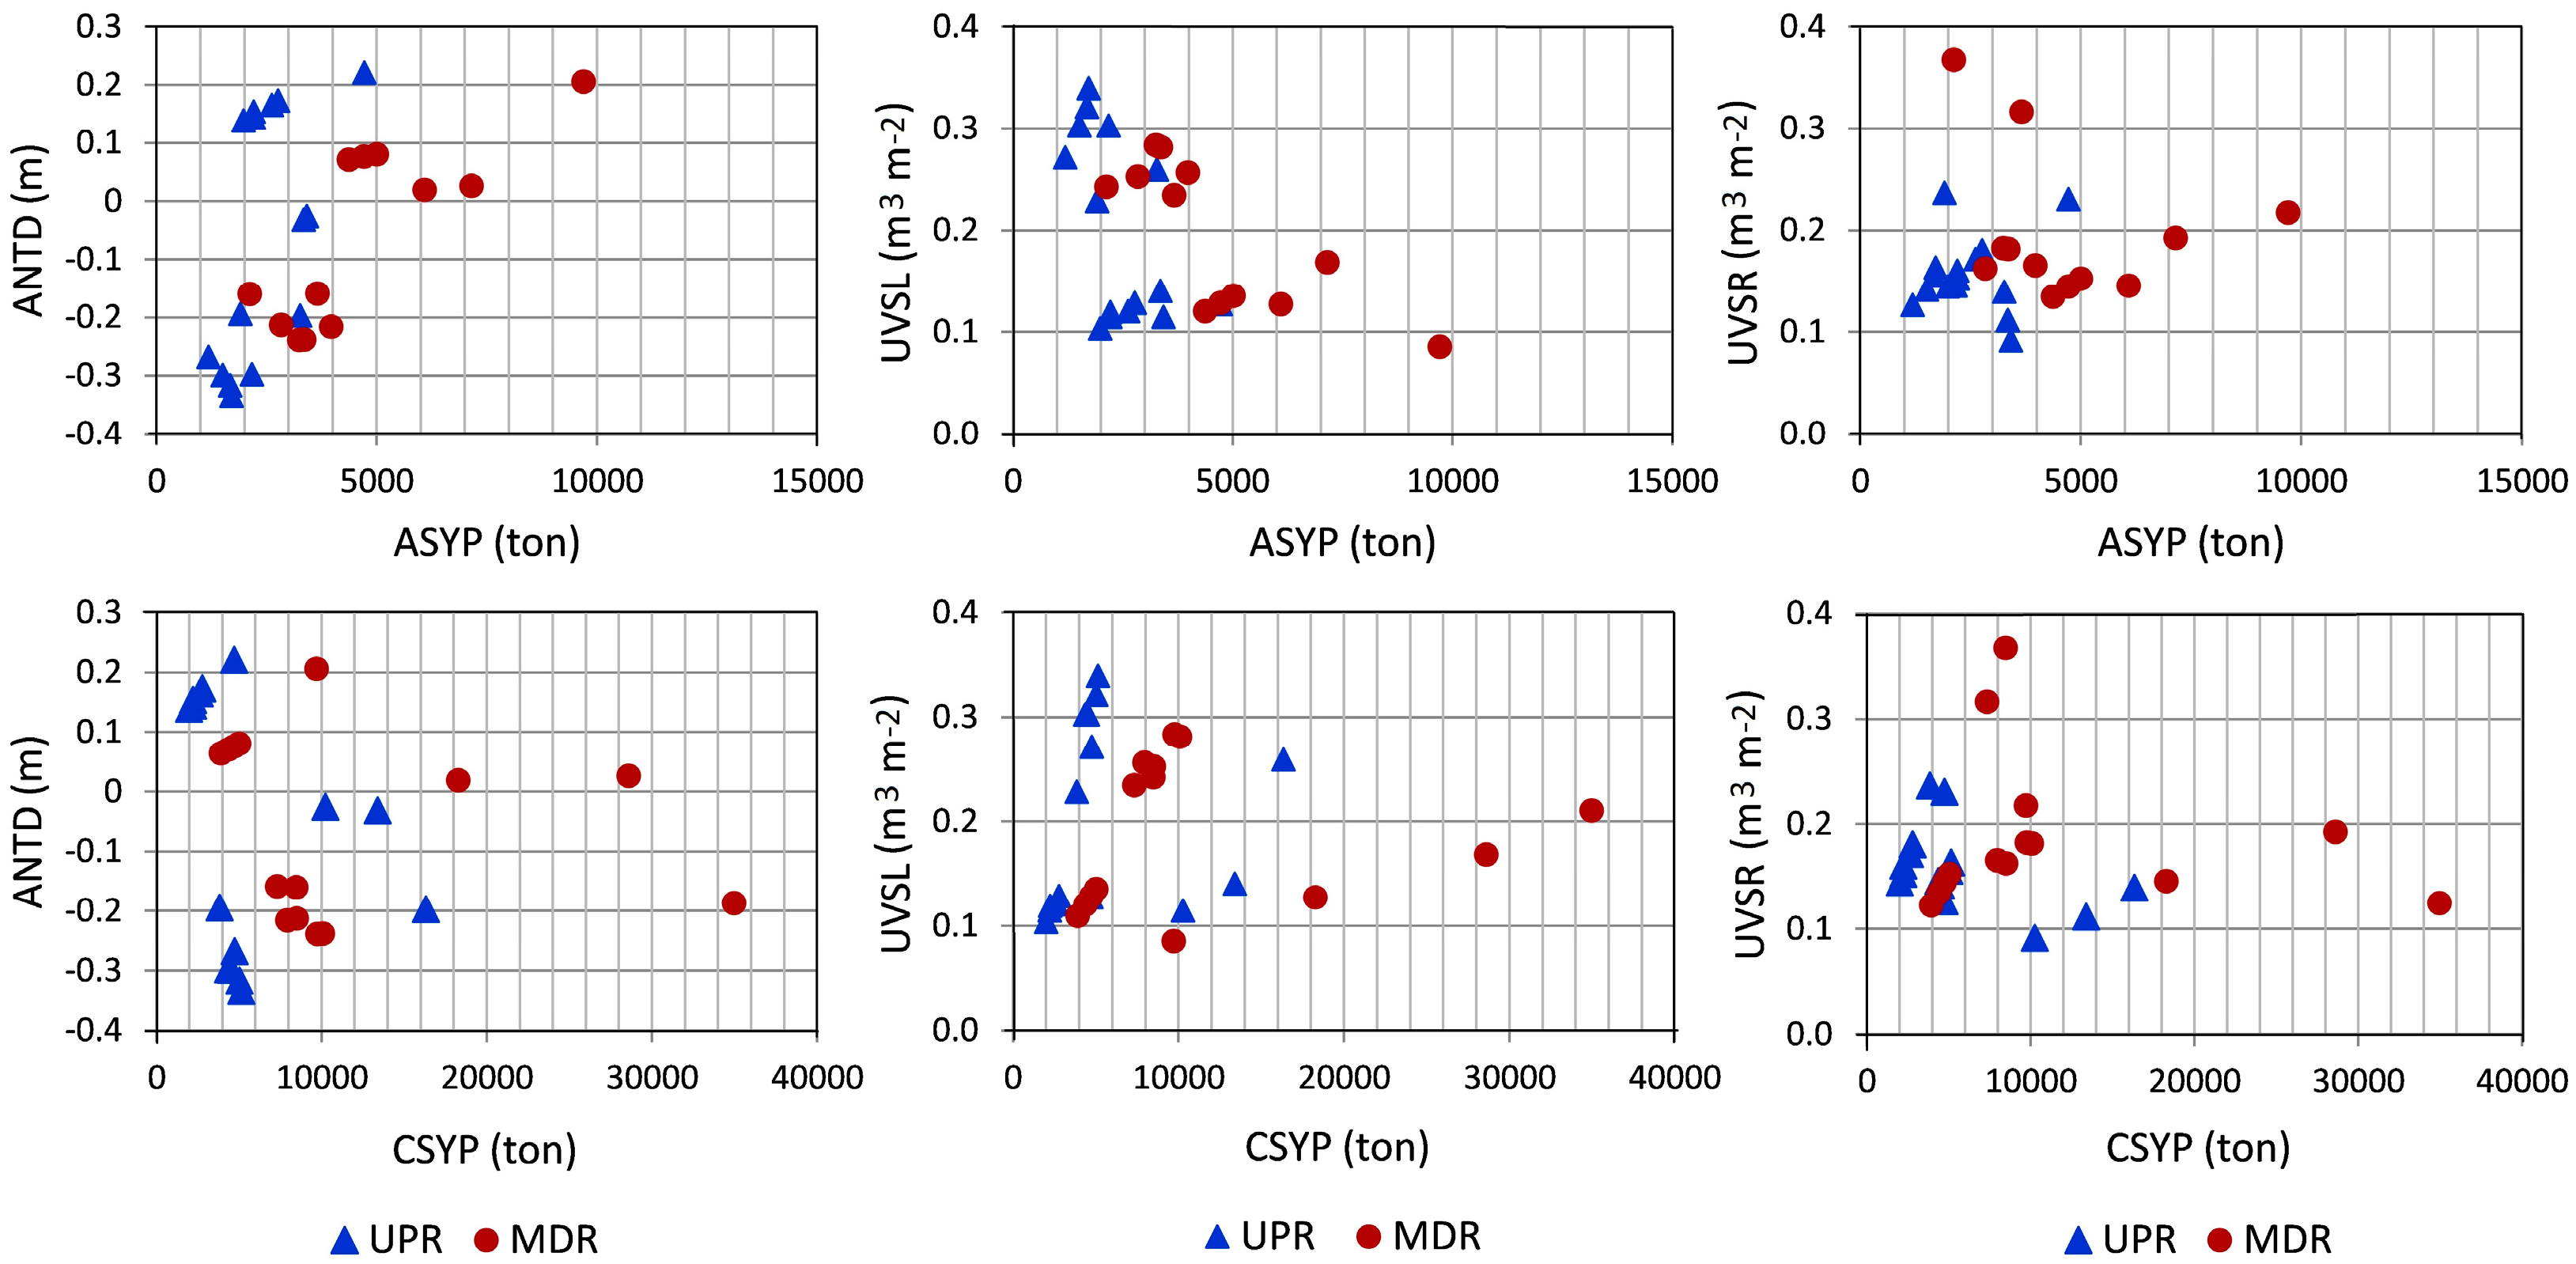
A different pattern is observed when relating the average rates of vertical bed accretion to those of sediment production in the watersheds of each channel reach. In UPR, the points are concentrated in a small cloud in the lower left part of the scatter plot, which translates into a succession of PECPs with low average net deposition (UVSR of 0.1 to 0.23 m), associated with little productive activity in the sediment source areas (ASYP < 3500 t). By contrast, MDR experienced greater variability in the rate of bed rise (UVSR of 0.13 to 0.37 m) and greater availability of sediments for transport and deposition (2100 < ASY < 9800 t). As a result, this RCR frequently acted as a sink for material eroded from the closest upstream reach. This is consistent with the results obtained at a large scale by Wilcock and Crowe [56] and Török et al. [57], using flume experiments with mixed-size bed sediment, in which eroded particles tended to be deposited immediately after the erosion zone. The same relationship patterns described for ASYP are repeated for CSYP, although here the groupings are linear and show a certain positive trend in relation to the lowering and growth of the bed.
The point clouds in Figure 13 show the ANTD values (average, standard deviation, and unit error) in relation to the mean stream power gradient (∂ω/∂s), and to the excess energy per unit bed area (ε) expended above ωc and accumulated (εc), averaged for each of the periods defined by PECPs. In the first column, positive and negative values of ANTD depict surface lowering and raising, respectively. Scatter plots relating ANTD to the mean ∂ω/∂s ratio represent two very different trends in each stretch: a positive relationship in UPR and a negative one in MDR, with a separation threshold at ∂ω/∂s = 0. In both RCRs, the closer the ∂ω/∂s values are to this threshold, the greater the erosion that is observed (ANTD < -0.3 m in UPR and ≈ -0.2 m in MDR); in contrast, extreme values, both negative and positive, correspond to the highest rates of net deposition (ANTD > 0.2 m). The field surveys carried out during the monitoring period already showed morphological adjustments in both directions, deposition and bed scouring, depending on the magnitude of each event and the availability of sediments for transport. After the largest flood in this period (19 April, 2019), the upper reach experienced greater net erosion than the middle reach, most likely especially in the sections where ω increased downstream above the ωc, coinciding with positive ∂ω/∂s values. This specific case was described by Conesa-García et al. [5] when explaining the effect of the energy gradient on the net flux variations immediately downstream.
Figure 13.
Values of stream power variables (∂ω/∂s, ε, and εc) versus parameters related to the net thickness difference (ANTD, SD-NTD, and Er-NTD). AVP = average values per PCEP sub-period; AOV and ASV are, respectively, the observed and simulated mean values for each sub-period. Er-NTD expressed per unit (p.u.).
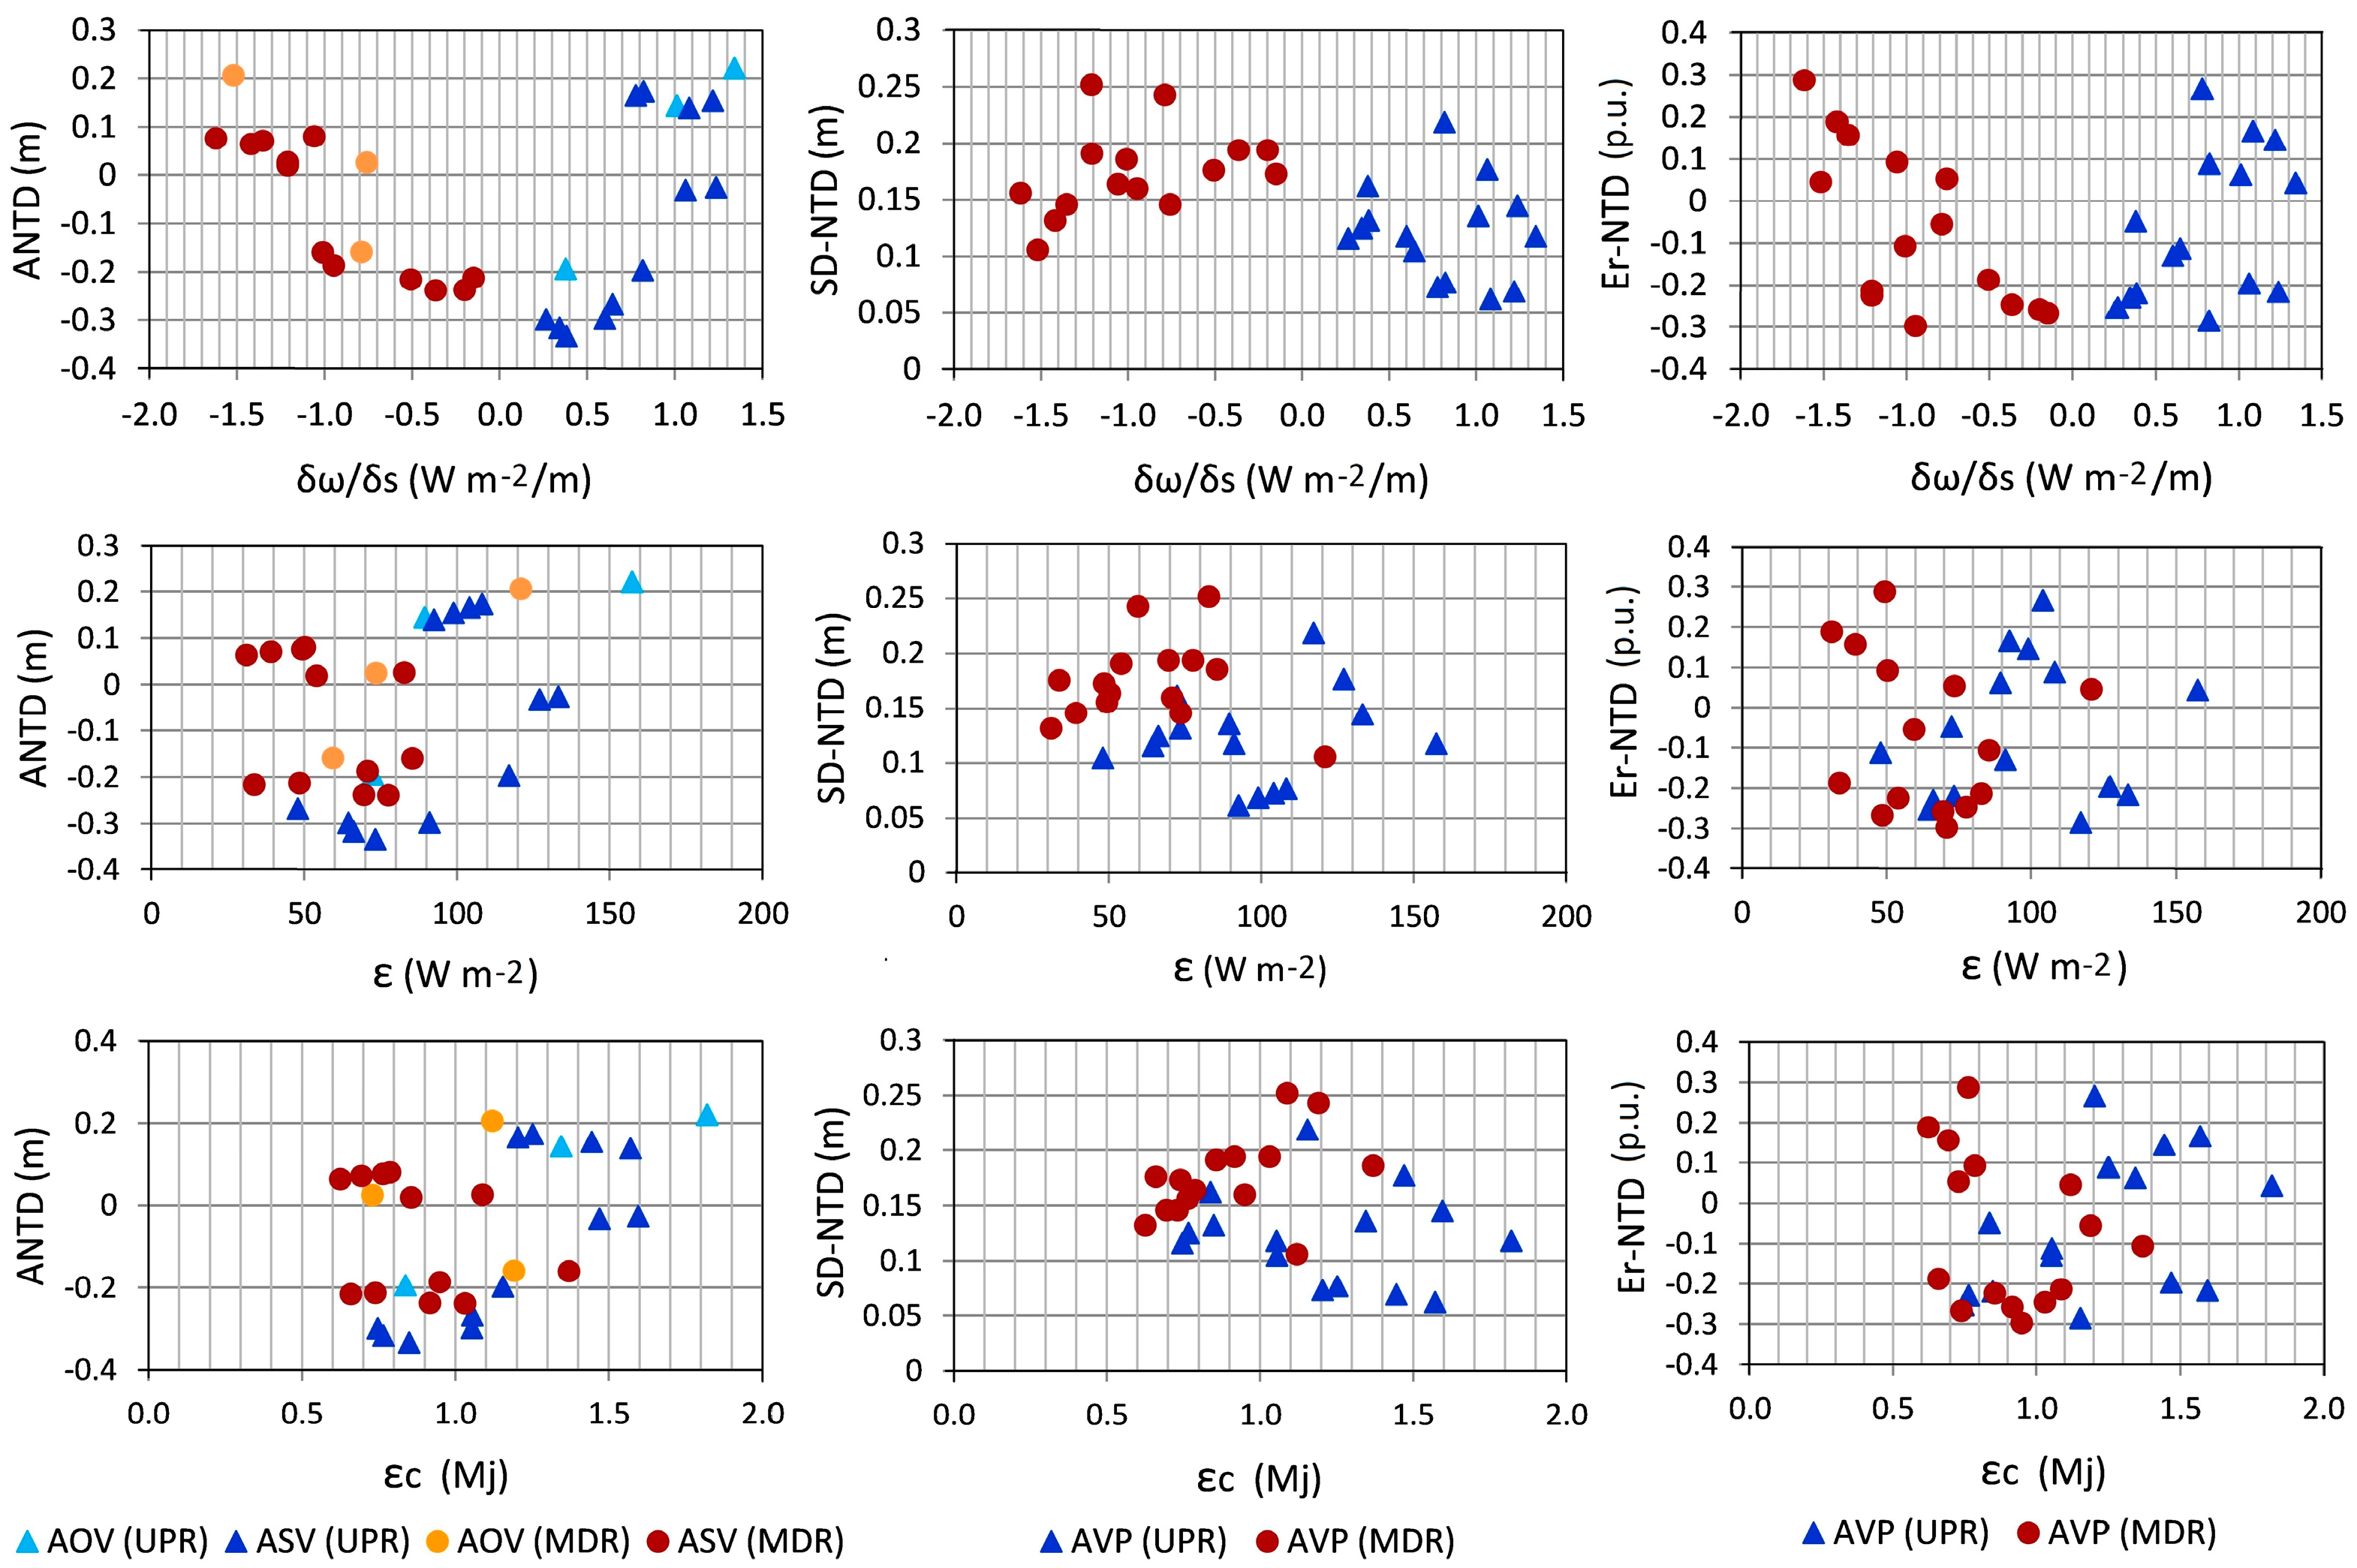
Deposition was slightly greater in the middle stretch than in the upper reach, but the point distributions relating ANTD to ∂ω/∂s, ε, and εc differed considerably between the two channel reaches. Among all the relationship patterns of these variables, the most clearly defined are those relating ANTD to ∂ω/∂s, in both RCRs. In this case, UPR and MDR show different trends supported by linear regressions with good fits (r2 of 0.64 and 0.72, respectively, with a significance level, p-value, < 0.05). For UPR there is a positive correlation between ANTD and εc (r2 = 0.65) (Table 13). The remaining relationships have poorly fitted distributions, although in certain cases they show specific behavior patterns depending on the type of section. Both UPR and MDR present two groups of residual values, one positive and the other negative, with a slightly progressive increasing trend. However, some differences can be noted. For example, in the middle section, sedimentary vertical accretion began to occur at a much lower excess energy than in the upper stretch: in UDR, a mean ε of 90 Wm-2 and an εc of 1.2 MJ were needed for net deposition to occur in a PECP, while in MDR 30 Wm-2 and 0.6 MJ respectively, were enough. Assuming that these relationships follow average behavior patterns for the simulation periods, heterogeneous distributions relating the energy variables to the dispersion (SD-NTD) and unit error (Er-NTD) values of ANTD are found here, which could explain the great variability of the underlying geomorphological processes within each period.
Table 13.
Significant relationships between bed morphological change parameters and stream power variables for the upper and middle RCRs (p-value < 0.05 for the confidence interval of 95%).
Table 13.
Significant relationships between bed morphological change parameters and stream power variables for the upper and middle RCRs (p-value < 0.05 for the confidence interval of 95%).
| RCR | Relationship | Regression equation | Function | r2 |
|---|---|---|---|---|
| UPR | UVSL vs ∂ω/∂s | UVSL = 0.093 ∂ω/∂s2 – 0.363 ∂ω/∂s + 0.419 | Polynomial | 0.73 |
| ANTD vs ∂ω/∂s | ANTD = 0.485 ∂ω/∂s – 0.450 | Linear | 0.64 | |
| ANTD vs εc | ANTD = 0.524 εc – 0.698 | Linear | 0.65 | |
| UVSC vs ∂ω/∂s | UVSC = 0.192 ∂ω/∂s2 - 0.533 ∂ω/∂s + 0.638 | Polynomial | 0.75 | |
| UVSL vs εc | UVSL = 0.178 εc2 – 0.670 εc + 0.732 | Polynomial | 0.75 | |
| UVSC vs εc | UVSC = 0.319 εc2 – 1.027 εc + 1.10 | Polynomial | 0.78 | |
| MDR | ANTD vs ∂ω/∂s | ANTD = -0.269 ∂ω/∂s – 0.309 | Linear | 0.72 |
| ANTD vs ASY | ANTD = -5E-09 ASY2 + 0.0001 ASY – 0.48 | Polynomial | 0.67 | |
| UVSL vs ∂ω/∂s | UVSL = -0.076 ∂ω/∂s2 + 0.003 ∂ω/∂s + 0.282 | Polynomial | 0.81 | |
| UVSR vs εc | UVSR = 0.608 εc2 – 0.905 εc + 0.479 | Polynomial | 0.89 | |
| UVSL vs ASY | UVSL = 121.01 ASY-0.78 | Power | 0.64 |
The variation patterns of the unit rates of lowering (UVSL) and raising (UVSR) and total bed change (UVSC) in relation to the stream power indicators are characterized by a different level of dispersion and grouping, depending on the channel reach (Figure 14). Here again, the best fits are found for the relationships between the bed modification unit volumes and the mean stream power gradient and the variables derived from the energy balance (Table 13). These are polynomial regression fits, indicating a nonlinear relationship between the ∂ω/∂s values and the corresponding conditional means of UVSC (in UPR) and UVSL (in MDR), or between εc and the average UVSC (in UPR) and UVSR (in MDR).
Figure 14.
Values of stream power variables (∂ω/∂s, ε, and εc) versus unit volume of surface lowering (UVSL), raising (UVSR), and changing (UVSC). The values are averaged per PCEP sub-period (AVP).
Figure 14.
Values of stream power variables (∂ω/∂s, ε, and εc) versus unit volume of surface lowering (UVSL), raising (UVSR), and changing (UVSC). The values are averaged per PCEP sub-period (AVP).
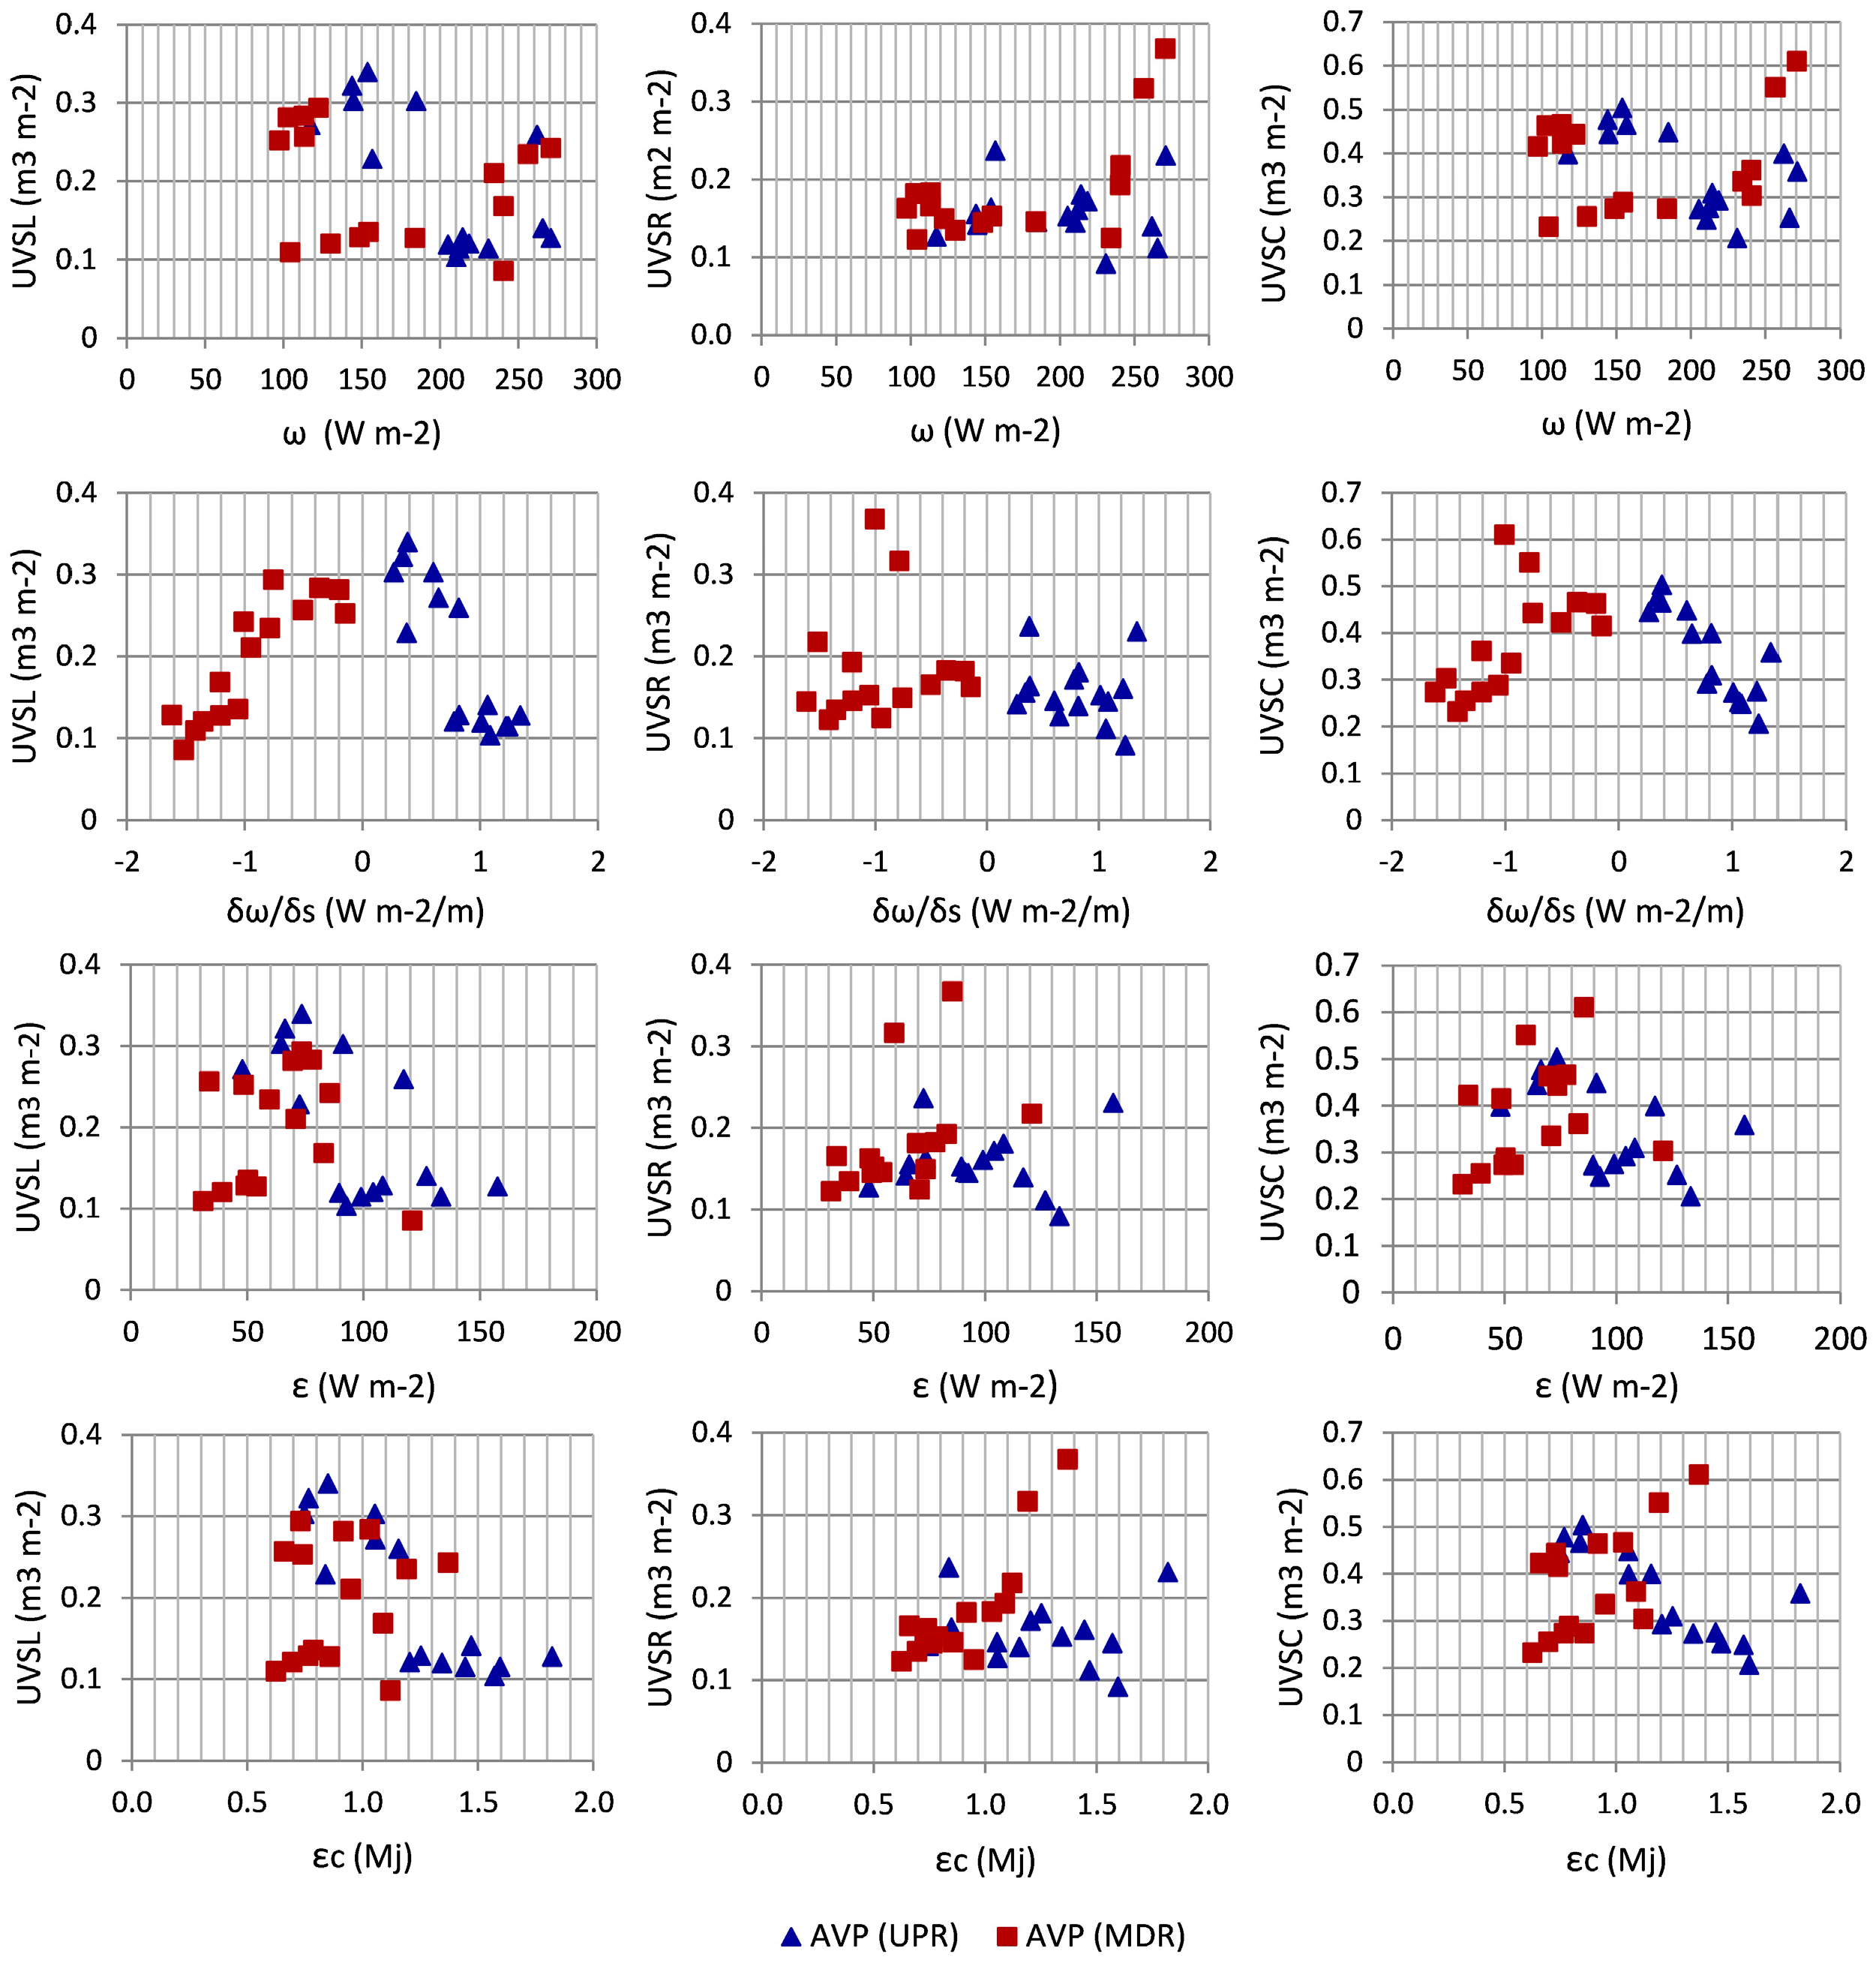
Along the middle RCR, the UVSR values corresponded to negative ∂ω/∂s values, the highest being those closest to zero, a threshold around which the greatest deposition also occurred in UCR, decreasing as the ∂ω/∂s values became more positive. This bears some resemblance to the trend described by Lea and Legleiter [58] for perennial gravel streams and by Conesa-García et al. [5] at the event scale for the RCRs studied here. The worst fits, on the other hand, are those relating the unit morphological bed adjustments to the mean stream power, especially in the case of global changes that seem not to be justified solely by the flow competence, but also require consideration of the critical stress and bed roughness.
An interesting aspect can be appreciated in the scatter plots in Figure 14 showing the relationships between the mean unit volume of surface lowering or raising and the average and accumulated values of excess energy for the PECP periods. The point clouds relating UVSL and UVSR to ε and εc are generally quite dispersed but despite this we can observe some differences. Specifically, two slightly different patterns are distinguished when comparing the trends of these relationships and value groups according to the RCR. In UPR, a progressive increase in εc seems to coincide with a decrease in the unit bed scour rate, while in MDR it implies an increase in UVSR. This has a certain consistency since the floodwaters in the upper reach are usually clearer and tend to cause bed incision.
On the other hand, downstream, in the middle section, the flow energy, which increases with the magnitude of the event, is used to transport a large bedload that ends up deposited when the velocity decreases. If, on the contrary, we consider the average ε values for each of the simulated stages in the last 27 years, dispersion is the most common feature of the distributions in both RCRs, perhaps as a result of discontinuous changes in bedload and channel morphology produced during this period. The scattered and skewed distributions of this variable could be related to nonhomogeneous bedforms or changes in granular texture. Conesa-García et al. [24] associated this lack of relationship in another complex gravel-bed dry channel (upper Mula stream, in southeastern Spain) with the presence of blocks from the bank breaks, pools-riffle sequences, and local transitions from alluvium to substrate outcrop and vice versa. Zapico et al. [59] analyzed this type of relationship in a steep, sand-gravel ephemeral channel and found, by contrast, a clear relationship between changes in bedload flux and morphological channel adjustments.
As a result of analyzing these relationship patterns, it can be stated that rather than linear equations they correspond to polynomial regressions derived from different geomorphological dynamics and processes. These are manifested on a temporal and spatial scale through a wide range of feedback effects involving external environmental factors and are intrinsic to the channel itself. In many of the patterns described, there does not seem to be a clear relationship between sediment production at the basin level and morphological channel adjustments. However, an inverse relationship has been found between CSY in each PECP and εc in the same period (Figure 15).
The higher potential inputs of basin sediments recorded in MDR do not correspond to greater vertical bed accretion in all PECPs or to an increase in εc along this stretch. This is most likely due to a marked decrease in the ω/ωc ratio in the middle section with respect to the upper one, linked to the decrease in downstream slope and increase in bed roughness. However, the largest flood events always coincided with the highest peak flows (30 > Qp < 80 m3 s-1, class 1, overbank), the greatest accumulated amounts of sediment yield at the basin level (12 < CSY < 27 t), the highest values of εc inside the channel (1.8 < εc < 3.7 MJ), and the most notable bedform changes for both channel reaches (20 < NVD* ≈ 22 m3 per 100 m2 on 19 March, 2019; and NVD* of -21 to -33 m3 per 100 m2 after the three most important flash floods during the 2000-2009 period). Moderate and minor events, class 3 and 4, respectively, generated insignificant bed modifications related to low accumulated sediment production and εc values below 0.6 MJ. The upper stretch also showed peculiar behavior during the bankfull stages, when SY did not exceed 3000 t; but, εc was much higher than in MDR, reaching values above 1.3 MJ, and the net volume differences in bedforms were especially significant (NVD* ≈ -20 m3 per 100 m2 in 2003-2003 and 14 and 18 m3 per 100 m2 in 2012-13 and 2022-23, respectively).
Figure 15.
Comparison of the sediment yield and excess accumulated energy estimated for each of the events that occurred in the period 1996-2022 along UPR and MDR.
Figure 15.
Comparison of the sediment yield and excess accumulated energy estimated for each of the events that occurred in the period 1996-2022 along UPR and MDR.
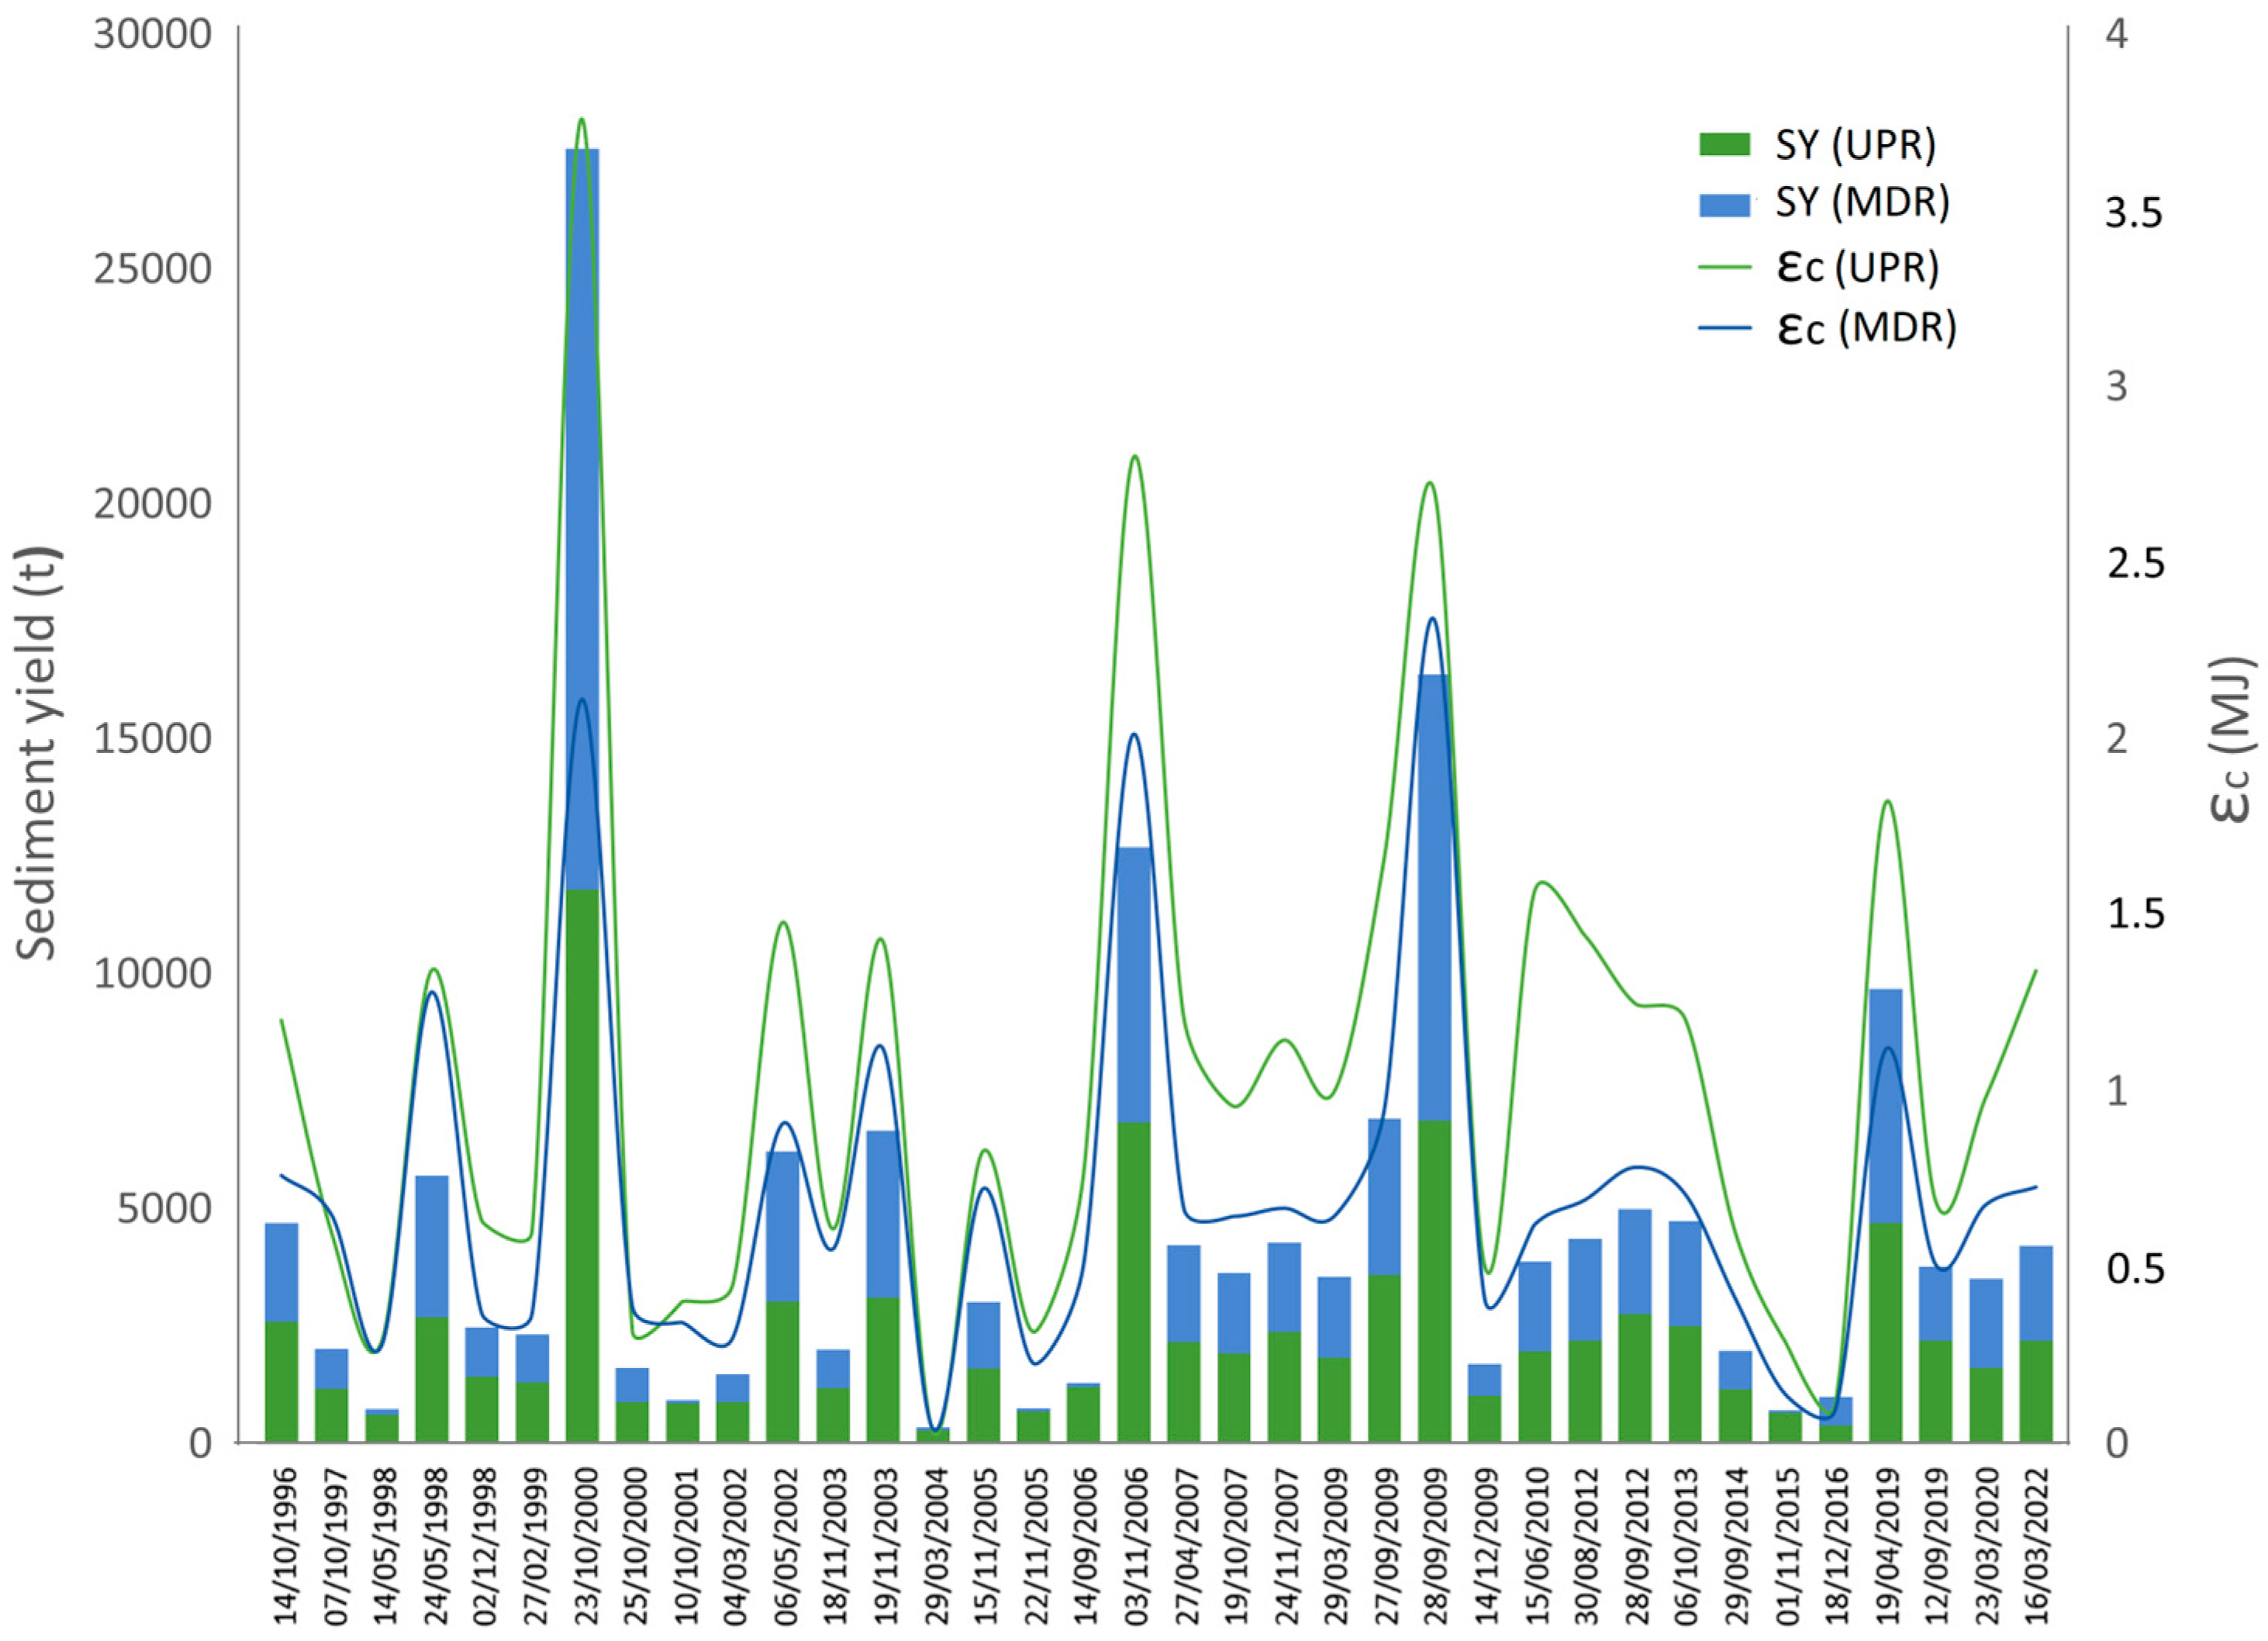
5. Conclusions
In the case of EGBSs, where the morphological adjustments are the product of complex flow dynamics at the event scale, the approach proposed here, based on the combined use of HRDEM of difference from repeat SfM-MVS and TLS over specific intervals, has allowed satisfactory assessment of the channel change. Repeated pre- and post-event topographic surveys have made it possible to accurately quantify the changes in bed elevation and sediment budgets produced by the event itself. However, the event-scale bedload fluxes are not separately identifiable when monitoring campaigns that include two or more events are carried out. In this case, it is more appropriate to adopt another approach, which tries to relate the cumulative geomorphic effects in the channel to the magnitude and frequency of the flows produced during the inter-campaign interval in question. The present study has solved this challenge by categorizing the events into four classes of morphological adjustments based on peak discharge thresholds that have specific implications in the morphodynamic evolution of the channel. The use of different combinations of these classes led to the establishment of sequential patterns in the monitoring period (2018-2022), which were retrospectively extended to the simulation period (1996-2018) by applying a dissimilarity algorithm (DSL) and factor of change (CF). The comparison of different PECPs using simulated data for sediment yield at the sub-catchment level, stream power variables, and net sediment fluxes showed a clear change of trend in the erosion-deposition balance and therefore in the predominant geomorphological processes that have controlled the morphosedimentary adjustments in this EGBS in recent decades. If we look at the frequency of PECPs with a positive or negative balance and the magnitude of morphological adjustment per stage, it is obvious that from the beginning of the simulated period there is a progressive change in trend, going from a dominance of linear erosion in the first nine PECPs (1997 to 2012) to the prevalence of deposition in the last six (2012 to 2022). This change in trend was well signaled by the cumulative net thickness difference (CNTD), indicating dominant bed downcutting from October 1997 to September 2012 (net incision of 1.21 m in UPR and 0.91 m in MDR) and a slight vertical accretion from 2013 to the present along both channel reaches (CNTD of 0.11 to 0.24). The two phases are also distinguished when comparing the predicted sediment yield maps obtained at the sub-watershed level for five-year periods: a first stage (1996-2012) with high specific soil degradation and intense delivery of sediments, in which the hillslopes had CSY and ASY above 150 and 20 t respectively; and another (2012-2022), characterized by more moderate and low sediment production rates, coinciding with lower runoff coefficients.
With climate change, it is very probable that this trend will be accentuated in the short and medium term, resulting in a progressive bed aggregation, accompanied by the increasing inputs of coarse particles from the sediment sources and sinks, thus promoting lateral erosion and widening the channel, as has already occurred in more arid environments. Predicted trend changes in the downcutting and deposition processes, as well as the assessment of their balance and possible loss of equilibrium bedload, could be useful in future ephemeral stream restoration projects.
Author Contributions
Conceptualization, C.C.-G.; methodology, C.C.-G., A.M.-S., C.P.-M, P.P.-C and F.M.-C.; data acquisition, C.C.-G., A.M.-S., C.P.-M., F.M.-C. and P.P.-C..; model validation, A.M.-S.; formal analysis, C.C.-G., A.M.-S., C.P.-M. and P.P.-C.; investigation, C.C.-G, A.M.-S. and P.P.-C.; writing—original draft preparation, C.C.-G.; writing—review and editing, C.C.-G., A.M.-S., C.P.-M, P.P.-C. and F.M.-C.; supervision, C.C.-G. and P.P.-C.; project administration, C.C.-G.; funding acquisition, C.C.-G.. All authors have read and agreed to the published version of the manuscript.
Funding
This research was funded by ERDF / Spanish Ministry of Science, Innovation and Universities - State Research Agency (AEI)/Project CGL2017-84625-C2-1-R. State Program for Research, Development and Innovation focused on the Challenges of Society.
Data Availability Statement
Data support the findings of this study are available from the corresponding author upon reasonable request.
Acknowledgments
We would like to thank AEMET and the Segura River Hydrographic Confederation Center (SHC), Government of Spain, for its collaboration.
Conflicts of Interest
The authors declare no conflict of interest.
Notations
| ∂ω/∂s | Mean stream power gradient [Wm−3] |
| ε | Excess energy per unit bed area (Wm−2) |
| εc | Accumulated excess energy (MJ) |
| γ | Specific weight of water (Nm−3), |
| Ω | Cross-sectional stream power [W m−1] |
| ω | Mean stream power [Wm−2] |
| ωc | Critical mean stream power [W m−2] |
| qp | Peak unit flow (m3s−1) |
| r2 | Determination coefficient |
| Sw | Water surface slope [m m−1] |
| w | Water-surface width (m) |
| AEP | Annual exceedance probability (per unit) |
| ANTD | Average net thickness difference (m) for the area of interest |
| ASYP | Average sediment yield per sub-period (t) |
| AVP | Average values for each PCEP sub-period |
| CNTD | Cumulative net thickness difference (m) |
| CNVD | Cumulative Net Volume Difference per 100 m² (m³) |
| CSYP | Accumulated sediment yield per sub-period (t) |
| CUV | Cumulative unit volume |
| DEM | Digital Elevation Model |
| DoD | DEM of Difference |
| DSL | Dissimilarity level between QpS(i) and QpOB(i) |
| 3DPC | 3D point cloud |
| EC | Event class |
| ECP | Event class pattern |
| EGBS | Ephemeral gravel-bed stream |
| GCPs | Ground Control Points |
| CF | Change factor |
| GNSS | Global Navigation Satellite System |
| HRDEM | High-resolution Digital Elevation Model |
| HRDoD | High-resolution DEM of Difference |
| HRDTM | High-resolution Digital Terrain Model |
| MDR | Middle reach |
| MVS | Multi-View Stereo |
| NPAO | National Plan of Aerial Orthophotography |
| NVD* | Net Volume Difference per 100 m² (m³) |
| PBSA | Pilot bed survey area |
| PECP | Sub-period defined according to the ECP |
| PI | Percent imbalance (departure from equilibrium) |
| QpOB(i) | Observed peak discharge (m3 s-1) for event i |
| QpS(i) | Predicted peak discharge (m3 s-1) for event i |
| RCR | Reference channel reach |
| RP | Return period (years) |
| SD* | Standard deviation of the net thickness differences (m) |
| SfM | Structure from Motion |
| SL | Surface lowering |
| SR | Surface raising |
| TAI | Total area of interest (m2) |
| TASL | Total area of surface lowering (m2) |
| TASR | Total area of surface raising (m2) |
| TLS | Terrestrial Laser Scanner |
| TNVD | Total net volume difference (m3) |
| UAV | Unmanned aerial vehicles |
| UCROB(i) | Observed unit change rate (m3 m-2) for event i |
| UCRS(i) | Simulated unit change rate (m3 m-2) for event i |
| UPR | Upper reach |
| UVSC | Average unit volume of total morphological change (m3m−2) |
| UVSC(ECP) | Unit volume of cumulative changing surface for a given ECP (m3 m-2) |
| UVSL | Average unit volume of surface lowering (m3m−2) |
| UVSR | Average unit volume of surface raising (m3m−2) |
| VSL | Total volume of lowered surfaces |
| VSR | Total volume of raised surfaces |
References
- Hooke, J.M. Human impacts on fluvial systems in the Mediterranean region. Geomorphology 2006;79. [CrossRef]
- Segura-Beltrán, F.; Sanchis-Ibor, C. Assessment of channel changes in a Mediterranean ephemeral stream since the early twentieth century. The Rambla de Cervera, eastern Spain. Geomorphology 2013;201. [CrossRef]
- Ortega, J.A.; Razola, L.; Garzón, G. Recent human impacts and change in dynamics and morphology of ephemeral rivers. Natural Hazards and Earth System Sciences 2014;14. [CrossRef]
- Conesa-García, C.; Puig-mengual, C.; Riquelme, A.; Tomás, R.; Martínez-capel, F.; García-lorenzo, R.; et al. Combining sfm photogrammetry and terrestrial laser scanning to assess event-scale sediment budgets along a gravel-bed ephemeral stream. Remote Sens (Basel) 2020;12. [CrossRef]
- Conesa-García, C.; Puig-Mengual, C.; Riquelme, A.; Tomás, R.; Martínez-Capel, F.; García-Lorenzo, R.; et al. Changes in stream power and morphological adjustments at the event-scale and high spatial resolution along an ephemeral gravel-bed channel. Geomorphology 2022;398. [CrossRef]
- Conesa Garcia, C. Torrential flow frequency and morphological adjustments of ephemeral channels in south-east Spain. River geomorphology 1995, 1995, 169–92. [Google Scholar]
- Benito, G.; Thorndycraft, V.R.; Rico, M.T.; Sánchez-Moya, Y.; Sopeña, A.; Botero, B.A.; et al. Hydrological response of a dryland ephemeral river to southern African climatic variability during the last millennium. Quat Res 2011;75. [CrossRef]
- Pryor, B.S.; Lisle, T.; Montoya, D.S.; Hilton, S. Transport and storage of bed material in a gravel-bed channel during episodes of aggradation and degradation: A field and flume study. Earth Surf Process Landf 2011;36. [CrossRef]
- Norman, L.M.; Sankey, J.B.; Dean, D.; Caster, J.; DeLong, S.; DeLong, W.; et al. Quantifying geomorphic change at ephemeral stream restoration sites using a coupled-model approach. Geomorphology 2017;283. [CrossRef]
- Lotsari, E.S.; Calle, M.; Benito, G.; Kukko, A.; Kaartinen, H.; Hyyppä, J.; et al. Topographical change caused by moderate and small floods in a gravel bed ephemeral river - A depth-averaged morphodynamic simulation approach. Earth Surface Dynamics 2018;6. [CrossRef]
- Moses, C.; Robinson, D.; Barlow, J. Methods for measuring rock surface weathering and erosion: A critical review. Earth Sci Rev 2014;135. [CrossRef]
- Danielle Cullen, N.; Kumar Verma, A.; Clare Bourke, M. A comparison of structure from motion photogrammetry and the traversing micro-erosion meter for measuring erosion on shore platforms. Earth Surface Dynamics 2018;6. [CrossRef]
- Snavely, N. Bundler: SfM for unordered image collections. Domain: Http://Phototour Cs Washington-Edu/Bundler/(1509 10) 2006.
- Westoby, M.J.; Brasington, J.; Glasser, N.F.; Hambrey, M.J.; Reynolds, J.M. “Structure-from-Motion” photogrammetry: A low-cost, effective tool for geoscience applications. Geomorphology 2012, 179, 300–14. [Google Scholar] [CrossRef]
- Gómez-Gutiérrez, Á.; Schnabel, S.; Berenguer-Sempere, F.; Lavado-Contador, F.; Rubio-Delgado, J. Using 3D photo-reconstruction methods to estimate gully headcut erosion. Catena (Amst) 2014;120. [CrossRef]
- Kaiser, A.; Neugirg, F.; Rock, G.; Müller, C.; Haas, F.; Ries, J.; et al. Small-scale surface reconstruction and volume calculation of soil erosion in complex moroccan Gully morphology using structure from motion. Remote Sens (Basel) 2014;6. [CrossRef]
- Kasprak, A.; Wheaton, J.M.; Ashmore, P.E.; Hensleigh, J.W.; Peirce, S. The relationship between particle travel distance and channel morphology: Results fromphysicalmodels of braided rivers. J Geophys Res Earth Surf 2015;120. [CrossRef]
- Smith, M.W.; Carrivick, J.L.; Quincey, D.J. Structure from motion photogrammetry in physical geography. Prog Phys Geogr 2016;40. [CrossRef]
- Wang, Y.; He, W.; Zhang, T.; Zhang, Y.; Cao, L. Adapting the WEPP Hillslope Model and the TLS Technology to Predict Unpaved Road Soil Erosion. Int J Environ Res Public Health 2022;19. [CrossRef]
- Singer, M.B.; Michaelides, K. How is topographic simplicity maintained in ephemeral dryland channels? Geology 2014;42. [CrossRef]
- Flatley, A.; Rutherfurd, I. Using structure from motion (SfM) to capture high resolution geomorphic units within small ephemeral channels. 20th EGU General Assembly. Conference Held 4, Viena: EGU General Assembly; 2018, p. 10896.
- Calle, M.; Alho, P.; Benito, G. Monitoring ephemeral river changes during floods with SfM photogrammetry. Journal of Iberian Geology 2018;44. [CrossRef]
- Borg Galea, A.; Sadler, J.P.; Hannah, D.M.; Datry, T.; Dugdale, S.J. Mediterranean intermittent rivers and ephemeral streams: Challenges in monitoring complexity. Ecohydrology 2019;12. [CrossRef]
- Conesa-García, C.; Pérez-Cutillas, P.; García-Lorenzo, R.; Eekhout, J.; Gómez-Gutiérrez, Á.; Millares-Valenzuela, A.; et al. Dimensionless morphological ratios versus stream power variations at bankfull stage in an ephemeral channel. Geomorphology 2020;361. [CrossRef]
- Notebaert, B.; Verstraeten, G.; Govers, G.; Poesen, J. Qualitative and quantitative applications of LiDAR imagery in fluvial geomorphology. Earth Surf Process Landf 2009;34. [CrossRef]
- Sutfin, N.A.; Shaw, J.; Wohl, E.E.; Cooper, D. A geomorphic classification of ephemeral channels in a mountainous, arid region, southwestern Arizona, USA. Geomorphology 2014;221. [CrossRef]
- Estrella, T.R. Geología de la Región de Murcia. El medio físico de la Región de Murcia, 2006, p. 11–46.
- Castillo, R.A. El patrimonio geológico de la Región de Murcia. Interlibro; 1999.
- Ali, K.F.; De Boer, D.H. Construction of sediment budgets in large-scale drainage basins: the case of the upper Indus River. Erosion prediction in ungauged basins: integrating methods and techniques. Proceedings of an international symposium, Sapporo, Japan, 8-9 July 2003, 2003, p. 206–15. [Google Scholar]
- Puig-Mengual, C.A.; Woodget, A.S.; Muñoz-Mas, R.; Martínez-Capel, F. Spatial validation of submerged fluvial topographic models by mesohabitat units. Int J Remote Sens 2021;42. [CrossRef]
- Wheaton, J.M.; Brasington, J.; Darby, S.E.; Sear, D.A. Accounting for uncertainty in DEMs from repeat topographic surveys: Improved sediment budgets. Earth Surf Process Landf 2010;35. [CrossRef]
- Brasington, J.; Langham, J.; Rumsby, B. Methodological sensitivity of morphometric estimates of coarse fluvial sediment transport. Geomorphology 2003;53. [CrossRef]
- USDA-ARS. CLIGEN v.5.3 Stochastic Weather Generator 2014.
- Flanagan, D.C.; Ascough, J.C.; Nicks, A.D.; Nearing, M.A.; Laflen, J.M. Chapter 01. Overview of the WEPP erosion prediction model. The Water Erosion Prediction Project (WEPP) Technical Documentation 1995.
- Wu, J.Q.; Xu, A.C.; Elliot, W.J. Adapting WEPP (Water Erosion Prediction Project) for Forest Watershed Erosion Modeling. 2000 ASAE Annual International Meeting, Technical Papers: Engineering Solutions for a New Century, vol. 2, 2000.
- Maalim, F.K.; Melesse, A.M.; Belmont, P.; Gran, K.B. Modeling the impact of land use changes on runoff and sediment yield in the le sueur watershed, minnesota using GeoWEPP. Catena (Amst) 2013;107. [CrossRef]
- García-Lorenzo, R.; Conesa-García, C. Erosion and sediment yield estimated by GeoWEPP for check dam watersheds in ephemeral gullies (South-East Spain). Geomorphology and Plate Tectonics, 2009.
- Martínez Salvador, A.; Conesa García, C.; García Lorenzo, R.; Pérez Cutillas, P. Estimación de aportes sedimentarios a embalses de pequeñas cuencas mediterráneas mediante GeoWEPP. Ensayo en la cuenca vertiente del río Mula al embalse de la Cierva (cuenca del río Segura). Limnetica 2015;34. [CrossRef]
- Ascough, J.C.; Baffaut, C.; Nearing, M.A.; Liu, B.Y. The WEPP watershed model: I. Hydrology and erosion. Transactions of the American Society of Agricultural Engineers 1997;40. [CrossRef]
- Flanagan, D.C.; Ascough, J.C.; Nearing, M.A.; Laflen, J.M. The water erosion prediction project (WEPP) model. Landscape Erosion and Evolution Modeling 2001:145–99.
- Leopold, L.B.; Wolman, M.G.; Miller, J.P. Fluvial processes in geomorphology Dover Publications. New York 1964.
- Wyżga, B.; Radecki-Pawlik, A.; Galia, T.; Plesiński, K.; Škarpich, V.; Dušek, R. Use of high-water marks and effective discharge calculation to optimize the height of bank revetments in an incised river channel. Geomorphology 2020, 356, 107098. [Google Scholar] [CrossRef]
- USACE. HEC-RAS 5.0 Hydraulic Reference Manual. User’s Manual, Version 41 2016.
- Vázquez-Tarrío, D.; Borgniet, L.; Liébault, F.; Recking, A. Using UAS optical imagery and SfM photogrammetry to characterize the surface grain size of gravel bars in a braided river (Vénéon River, French Alps). Geomorphology 2017;285. [CrossRef]
- Emmett, W.W.; Wolman, M.G. Effective discharge and gravel-bed rivers. Earth Surf Process Landf 2001;26. [CrossRef]
- Doeschl-Wilson, A.B.; Ashmore, P.E. Assessing a numerical cellular braided-stream model with a physical model. Earth Surf Process Landf 2005;30. [CrossRef]
- Nicholas, A.P.; Quine, T.A. Crossing the divide: Representation of channels and processes in reduced-complexity river models at reach and landscape scales. Geomorphology 2007;90. [CrossRef]
- Nicholas, A.P.; Ashworth, P.J.; Sambrook Smith, G.H.; Sandbach, S.D. Numerical simulation of bar and island morphodynamics in anabranching megarivers. J Geophys Res Earth Surf 2013;118. [CrossRef]
- Schuurman, F.; Kleinhans, M.G. Self-formed braided bar pattern in a numerical model. Proceedings of the 7th IAHR conference on river, estuarine and coastal morphodynamics. Beijing, China, 2011.
- Sloff, K.; Mosselman, E. Bifurcation modelling in a meandering gravel-sand bed river. Earth Surf Process Landf 2012;37. [CrossRef]
- Wohl, E. Mountain rivers revisited. John Wiley & Sons; 2013.
- Robert, A. River processes: An introduction to fluvial dynamics. 2014. [CrossRef]
- Thompson, D.M. Pool–Riffle Sequences. Reference Module in Earth Systems and Environmental Sciences; Elsevier: Amsterdam, The Netherlands 2018. [Google Scholar]
- Dade, W.B.; Friend, P.F. Grain-size, sediment-transport regime, and channel slope in alluvial rivers. Journal of Geology 1998;106. [CrossRef]
- Gartner, J.D.; Dade, W.B.; Renshaw, C.E.; Magilligan, F.J.; Buraas, E.M. Gradients in stream power influence lateral and downstream sediment flux in floods. Geology 2015;43. [CrossRef]
- Wilcock, P.R.; Crowe, J.C. Surface-based Transport Model for Mixed-Size Sediment. Journal of Hydraulic Engineering 2003;129. [CrossRef]
- Török, G.T.; Baranya, S.; Rüther, N. 3D CFD modeling of local scouring, bed armoring and sediment deposition. Water 2017, 9, 56. [Google Scholar] [CrossRef]
- Lea, D.M.; Legleiter, C.J. Mapping spatial patterns of stream power and channel change along a gravel-bed river in northern Yellowstone. Geomorphology. [CrossRef]
- Zapico, I.; Laronne, J.B.; Lucía, A.; Martín-Duque, J.F. Morpho-textural implications to bedload flux and texture in the sand-gravel ephemeral Poveda Gully. Geomorphology 2018, 322, 53–65. [Google Scholar] [CrossRef]
Disclaimer/Publisher’s Note: The statements, opinions and data contained in all publications are solely those of the individual author(s) and contributor(s) and not of MDPI and/or the editor(s). MDPI and/or the editor(s) disclaim responsibility for any injury to people or property resulting from any ideas, methods, instructions or products referred to in the content. |
© 2023 by the authors. Licensee MDPI, Basel, Switzerland. This article is an open access article distributed under the terms and conditions of the Creative Commons Attribution (CC BY) license (http://creativecommons.org/licenses/by/4.0/).
Copyright: This open access article is published under a Creative Commons CC BY 4.0 license, which permit the free download, distribution, and reuse, provided that the author and preprint are cited in any reuse.


