
Submitted:
15 June 2024
Posted:
17 June 2024
You are already at the latest version
Abstract
Subacute rumen acidosis (SARA) is a prevalent issue in intensive livestock farming, particularly associated with high-concentrate diets. This study investigates the prevalence and impact of SARA in Greek dairy sheep farming and explores the use of computerized rumen colorimetry as a management and diagnostic tool for SARA in dairy sheep farms. Forty-two dairy sheep flocks were monitored regularly for rumen pH, milk composition, and milk yield over an approximately 9-month milking period. Computerized Rumen Mucosal Colorimetry was applied to 280 culled, aged ewes from these farms, with rumen wall samples taken for histological examination. SARA cases were identified in 19 farms (45%, n=48). Farms with SARA cases had lower milk fat levels, although milk yield was higher in these farms, while milk protein levels did not differ based on the SARA status of the farms. In culled ewes, rumen color was significantly associated with the farm's SARA status. Additionally, ewes from farms with more SARA cases exhibited increased thickness in the ruminal epithelium layers, particularly in the non-keratinized and total epithelium layers. In conclusion, SARA is a common disorder in the Greek dairy sheep industry, lowering the fat content of milk. The study suggests that computerized rumen epithelium colorimetry in aged culled ewes shows promise as a diagnostic tool for SARA in dairy sheep farms.
Keywords:
subacute rumen acidosis
; rumen mucosa colorimetry
; dairy sheep
; milk fat depression
; epidemiology
; Greece
1. Introduction
In high-yield livestock farming, rumen acidosis (RA) is a common metabolic issue [1,2]. It occurs in two forms: acute (ARA), characterized by a rumen pH below 5.0, and sub-acute (SARA), with a pH consistently lower than 5.8 for at least four hours per day [3,4,5,6,7]. SARA results in economic losses due to reduced milk production and lower milk fat content [6,8,9].
Feeding high-concentrate diets with low percentages of dietary fiber for extended periods increases the risk of subacute rumen acidosis, negatively affecting both milk production and fat concentration [10,11,12]. The subsequent lower rumen pH disrupts fermentation and bacterial synthesis, leading to increased production of long-chain fatty acids (LCFA), which hinders milk fat synthesis in the udder [13,14].
Several hematobiochemical parameters have been suggested as diagnostic markers for SARA in small ruminants, but none have proven entirely accurate [6,15,16,17]. Rumen fluid pH measurement is the gold standard, with a pH between 5.2 and 5.8 for more than four hours per day indicating SARA in intensive small ruminant livestock farming [5,6,7,17].
Rumen acidosis, marked by rumen wall discoloration, especially in subacute rumenitis, manifests as a gray to dark discoloration [18,19,20,21]. Objective color estimation using colorimeters and spectrophotometers, particularly through Red, Green, and Blue (RGB) analysis, has emerged as a precise method for assessing rumen epithelium health [22,23,24,25].
While extensively studied in other livestock, SARA's prevalence and impact on sheep are not well-explored [26]. This study aims to address this critical gap by evaluating the prevalence and impact of SARA in Greek sheep farming. Additionally, it aims to assess the effectiveness of computerized rumen colorimetry as a tool for managing and detecting SARA in dairy sheep farms.
2. Materials and Methods
2.1. Selection of Farms
Forty-two dairy sheep flocks were thoughtfully selected to participate in this study. These farms are situated in Thessaly, a central region of Greece. Inclusion criteria required farms to be within reach of the Department of Clinical Veterinary Medicine, Faculty of Veterinary Science, University of Thessaly, Greece. Farms also needed to have crossbreed ewes of Lacaune with the local Karagouniko breed, maintain a stable ration composition throughout the entire milking period, and be confirmed as free of paratuberculosis and progressive pneumonia, as evidenced by the Department's archives.
2.2. Experimental Design
The selected farms were monitored every two months for rumen pH throughout the entire milking period, spanning approximately 9 months. Five visits were conducted at each farm during the first 10 days of the 1st, 3rd, 5th, 7th, and 9th months post-partum.
At each visit, six ewes were randomly chosen and assessed for rumen pH, ensuring they had not been previously selected for rumen pH measurement to prioritize animal welfare. Rumen fluid sampling took place four hours after the morning administration of concentrated feed. Simultaneously, milk samples were gathered from the bulk milk tank during these visits. Additionally, data on daily milk yield was sourced from the farmers' records.
Furthermore, between July and August 2021, during the culling of aged ewes from the above 42 farms, rumen sampling was performed in slaughterhouses. Due to economic constraints, a total of 280 ewes were included in the sampling, with at least 6 ewes from each farm.
2.3. Sample size justification
According to the existing literature, the prevalence of subacute rumen acidosis (SARA) in dairy sheep is approximately 12% [27]. To ensure a desired level of accuracy with a margin of error (e) of ±0.05 and a 95% confidence interval (Z = 1.96), the estimated sample size (n) was calculated using the formula n = (Z² x P x (1-P)) / e², yielding a value of 162. This study exceeded this calculated sample size requirement during both farm and slaughterhouse sampling phases.
2.4. Ethical approval
The study adhered to established animal welfare regulations (Directive 98/58/EC) and obtained approval from the Ethics Committee of the Faculty of Veterinary Science at the University of Thessaly, Greece (Approval No. 152/16-05-2021). No modifications were made to the animals' diet or treatment for experimental purposes during the entire duration of the study.
2.5. Clinical and laboratory procedures
2.5.1. Rumenocentesis and rumen pH measurement
Rumenocentesis, conducted without sedation, was employed for the collection of rumen fluid samples, following established methodologies from prior studies [28]. The procedure included an external abdominal puncture using a 16G 105-mm needle (Intralune PP, Vygon, France) in the left abdominal region, specifically targeting the ventral sac of the rumen and aspirating the fluid with a 50 mL syringe [6,29]. Subsequently, the obtained rumen fluid underwent immediate pH determination, utilizing a digital portable pH-meter (HI-2002 Edge pH Meter, Hanna instruments).
2.5.2. Milk Analyses
To maintain sample quality, they were refrigerated at 4°C during transportation to the laboratory. On the same day of collection, the milk composition, including fat, protein, lactose, and total solid content, was analyzed using an infrared analysis technique with the assistance of an FTIR interferometer—specifically, the Milkoscan FT6000 Analyzer manufactured by Foss Electric in Denmark. The annual average values for the mentioned milk components were calculated based on the five measurements in each farm, along with the monthly milk yield, following basic arithmetic procedures [30].
2.5.3. Rumen wall Sampling and image acquisition
The sampling procedure for the rumen wall followed a standardized protocol as detailed by Voulgarakis et al. [25]. The incision location was determined based on standard measurements outlined in the same study. A 5x5 cm square from a specific location on the rumen wall was excised for sampling. After excision, the sample underwent thorough washing with water to eliminate any visible remnants of rumen content. Subsequently, a digital gross image was captured once again using the standard procedure described by Voulgarakis et al. [25]. The sample was then placed in a container with a 10% formalin solution for subsequent histological examination.
2.5.4. Rumen Wall Image Color Analysis
The quantification of rumen mucosa color utilized software applications, specifically RGB Colour Detector 3.0.7 [31] and CIELab [32]. We followed a procedure and color component measurement consistent with the method detailed by Voulgarakis et al. [25].
In the RGB application, the analyzed color components included Red, Green, and Blue (RGB), Value (V), Lightness (L), Hue, Saturation, and Value (HSV), and Hue, Saturation, and Lightness (HSL). Additionally, the summary of the Red, Green, and Blue color components was computed and labeled as RGB-SUM [23]. Using the CIELab software, the L (color lightness), a (redness-greenness of the color), and b (yellow-blueness of the color) color components were assessed [32].
For each rumen wall sample, average values of these color components were calculated from nine distinct spot measurements, and the resulting average value was employed for subsequent statistical analysis. It is essential to note that, although the L, a, and b values are technically denoted as L*, a*, and b*, respectively, for simplicity, this text omits the asterisks.
2.5.5. Histological Examination
Hematoxylin-eosin staining was employed on rumen wall sample sections. A microscope-coupled camera captured a randomly selected field with a x10 objective from each sample. ImageJ software was utilized to measure the thickness of the stratum corneum, connective tissue, non-keratinized epithelium, and total epithelium in each photomicrograph (Figure 1).
2.6. Statistical analysis.
The consistency of rumen pH measurements over time in each farm was examined using the Intraclass Correlation Coefficient (ICC). Continuous variables in the dataset, including pH values, milk parameters (such as yield, fat, protein, lactose, and total solids content), color measurements, and characteristics of the rumen epithelium, were checked for normal distribution. When necessary, log transformations were applied to address any observed skewness in the data. To explore potential differences in these variables among farms with low, moderate, and high SARA prevalence, an Analysis of Variance (ANOVA) was conducted. The results were presented using the mean and standard deviation (SD) as measures of central tendency and variability, respectively. The analysis was performed using IBM SPSS Statistics version 29.0.0.0 (241), with a significance level of 0.05 used to determine statistical significance.
3. Results
All animals involved in the study completed the entire monitoring period without any adverse effects on their welfare.
The 42 farms were categorized into three groups based on the number of rumen pH measurements below 5.8 out of 30 measurements conducted in each farm [n= 5 visits (x) 6 ewes each visit= 30 measurements per farm]. The categories and the number of farms in each category are as follows:
Category 1: Farms with a low prevalence of SARA, including 17 farms (41% of the total), with each farm exhibiting only 0-2 cases of pH <5.8 in the 30 measurements.
Category 2: Farms with a moderate prevalence of SARA, comprising 19 farms (45% of the total), with each farm showing 3-9 cases of pH <5.8 in the 30 measurements.
Category 3: Farms with a high prevalence of SARA, consisting of 6 farms (14% of the total), with each farm having 10-14 cases of pH <5.8 in the 30 measurements.
Throughout the farming sampling period, the mean pH values of the participating farms, with six randomly selected ewes each time, ranged from 5.73 to 5.93, yielding a mean pH of 5.83 (Standard Deviation SD=0.06). Specifically, in Category 1 farms, the pH range was between 5.87 and 5.93, with a mean pH of 5.89 (SD=0.01). In Category 2, the pH range was from 5.78 to 5.84, with a mean pH of 5.81 (SD=0.02). Lastly, in Category 3, the pH range was recorded between 5.73 and 5.76, with a mean pH of 5.74 (SD=0.01). The sample size for each category was consistent. Post hoc analysis using Bonferroni adjustment revealed significant differences among all possible pairwise comparisons between the three farm categories (p <0.001) (Table 1).
In the abattoir, post hoc analysis revealed significant differences in the color components among all possible pairwise comparisons of the three farm categories, with the exception of the a* component across all farm categories and the b* component between Category 1 and Category 2 (p < 0.001) (Table 2).
3.1. Milk analysis
During the farming sampling period, milk yield differed across farm categories, with Category 3 having the highest average yield (mean 7399.1, SD= 66.1) and Category 1 the lowest (mean 7160.3, SD= 100.9). Post hoc analysis indicates significant differences between Category 1 and Category 3 and between Category 2 and Category 3 for milk yield (p < 0.05). Conversely, milk fat content varied across farm categories, with Category 1 having the highest average fat content (mean 5.92, SD= 0.13) and Category 3 the lowest (mean 5.65, SD= 0.06). Post hoc analysis indicates significant differences between Category 1 and Category 2, and Category 1 and Category 3 (p < 0.001). The milk protein content also showed variation, ranging from 5.46 to 5.90. Category 1 had the lowest average protein content (mean 5.72, SD= 0.10), while Category 3 had the highest (mean 5.83, SD= 0.05). Milk lactose content ranged from 4.36 to 5.14, with variations across categories. A significant difference was found between Category 1 and Category 3 (p < 0.001). Milk total solid content ranged from 10.54 to 12.21, with Category 3 having the highest average (mean 11.73, SD= 0.40) and Category 1 the lowest (mean 10.87, SD= 0.23). Significant differences were observed between Category 1 and Category 3, as well as between Category 2 and Category 3 (p < 0.001). The milk fat-to-milk protein ratio was 1.01 overall, with Category 1 having the highest ratio (1.04) and Category 3 the lowest (0.96) (Table 1).
3.2. Colour Measurement
Pairwise comparisons of mean L* component values among all categories (1, 2, 3) revealed statistically significant differences (p<0.001). Specifically, Category 1 exhibited the highest mean L* value (mean 39.93, SD=5.24), whereas Category 3 reported the lowest mean L* value (mean 21.98, SD=6.92). Significant differences were also observed in the mean values of the b* component between Category 1 (mean 9.54, SD= 5.80) and Category 3 (mean 4.49, SD= 6.92), as well as between Category 2 (mean 9.53, SD= 4.67) and Category 3 (mean 4.49, SD= 6.92). However, no statistically significant differences were detected in the mean values of the a* component across all possible comparisons (Table 2).
Regarding the color measurement using the RBG Analysis system, the mean values of Red, Green, Blue, and RGB-SUM were found to be significantly higher in Category 1 when compared to the mean values of Category 2 and Category 3 samples. Similarly, Category 2 exhibited significantly higher mean values compared to Category 3. Furthermore, significant differences were observed for the HSV value and HSL value among all possible comparisons, with Category 1 having the highest values compared to Category 2 and Category 3. Lastly, Category 2 revealed significantly higher mean values compared to Category 3 (Table 2).
3.3. Ruminal epithelium histopathology and histomorphometry
Histological analyses revealed no abnormal findings in the rumen epithelium samples, and parakeratosis was not observed. The darkest coloration was confined solely to the keratinized layer in those samples.
According to the statistical analysis, Category 3 exhibited significantly higher thickness in non-keratinized epithelium thickness (mean 166.67, SD=21.41) and total epithelium thickness (mean 356.47, SD=74.08), in contrast to Category 2 (mean 116.47, SD=28.64 and mean 294.53, SD= 61.26, respectively) and Category 1 (mean 80.13 SD=14.46 and mean 217.07, SD=51.69). Additionally, the non-keratinized epithelium thickness and total epithelium thickness were significantly higher in samples of Category 2 compared to samples of Category 1. However, no significant differences were observed in stratum corneum thickness and connective tissue width in any of the possible comparisons (Table 3).
4. Discussion
This research represents the first attempt to investigate the epidemiology of subacute rumen acidosis (SARA) in dairy sheep farms in Greece. The findings provide strong evidence that SARA is a common disorder in the modern Greek dairy sheep industry. These results are not surprising given the prevalent nutritional practices in dairy sheep farming in Greece. Ewes are typically fed a concentrate mixture exceeding 1 kg per day throughout the milking period and are additionally offered cereal hay, usually ad libitum. The concentrate mixture is consumed rapidly, and the limited consumption of hay fails to meet the animals' daily fiber needs. Feeding more than 500 grams of cereals daily increases the risk of ruminal acidosis in sheep [33]. Furthermore, long-term diets high in grain concentration and low in dietary fiber can lead to SARA, resulting in a rumen pH between 5.0 and 5.8 for several hours daily [3,4,5,7].
In this study, farms with a higher number of SARA cases (Categories 2 and 3) produced higher milk yields. A higher incidence of SARA correlates with increased cereal consumption, providing higher energy intake. Energy intake is a primary factor for milk production in dairy ewes [33]. However, these farms also exhibited lower milk fat content, likely due to the high prevalence of SARA. This effect is attributed to alterations in rumen fermentation and changes in fatty acid profiles. Multiple studies, including those by Tao et al. [34], Zhang et al. [35], Li et al. [13], and Kitkas et al. [14], have consistently observed lower milk fat percentages in high-concentrate groups compared to low-concentrate groups in both dairy cows and goats. The reduction in ruminal pH associated with SARA modifies the composition of rumen bacteria and fermentation patterns, leading to increased production of specific long-chain fatty acids (LCFA). These LCFA, once absorbed, can inhibit milk fat synthesis in the udder [13,14]. Therefore, further research is needed to explore optimal feeding strategies for dairy sheep that balance high energy intake with adequate dietary fiber, such as incorporating concentrate mixtures into a total mixed ration (TMR).
This research proposes computerized measurement of rumen epithelium color as a promising method for monitoring SARA status. This technique can be easily applied during the slaughter of aged culled ewes, providing health advisors with reliable data on SARA status in the farm. Currently, rumen pH measurement is considered the gold standard for diagnosing SARA in ruminants [8,36,37]. However, pH measurement can be influenced by various factors, including the method of measurement, sampling location, and timing [38,39]. Beyond pH measurements, diagnostic indicators such as milk fat percentage and the milk fat-to-protein ratio have been proposed for detecting SARA in dairy cows. Rapid weekly drops in milk fat of 0.3-0.5% or a milk fat-to-protein ratio below 1 suggest potential SARA cases [40,41,42,43,44]. However, these indexes have not been established for the dairy sheep industry, partly due to ongoing genetic improvements in dairy sheep breeds. Additionally, chronic diseases such as progressive pneumonia and Johne's disease are associated with drops in milk fat [45,46].
Existing literature indicates that the prevalence of SARA in dairy sheep is approximately 12%, but this study was conducted in Brazil [27]. This study exceeded the calculated sample size requirement based on this figure to account for the lack of extensive data from Greece and other Mediterranean countries.
The mean color values, measured by RGB or CIELab systems, were significantly lower in Category 3 samples compared to Categories 1 and 2, indicating darker ruminal epithelium discoloration. Similar results were reported in feedlot cattle by Voulgarakis et al. [25]. Factors contributing to this darkening include pelleting, fiber particle size, dietary iron levels, and the buffering system. Lambs' epithelium showed lighter color after ration correction, consistent with our findings [47]. Feeding high fermentable TMR is associated with gray to dark color, leading to reduced ruminal pH and increased volatile fatty acid and lactic acid accumulation [18,19,20,21,47,48]. High iron consumption may cause dark color due to black stain formation [47,49]. In conclusion, rumen pH plays a decisive role in the darkening of the keratinized layer in the ruminal epithelium.
Our histological findings showed that the darkening of the rumen epithelium’s color was due to the effect of rumen pH on the keratinized layer rather than parakeratosis. This is a notable finding as previous research attributed rumen epithelium darkening to parakeratosis [41].
Furthermore, our research observed an increase in the thickness of ruminal epithelium layers, particularly non-keratinized and total epithelium, in animals from farms with a high incidence of SARA. Steele et al. [50] observed increased total epithelial thickness and stratum corneum thickness in animals fed a high-grain diet. Bo Trabi et al. [51] found that animals fed a low-grain non-pelleted TMR concentrate had higher total epithelium and stratum corneum thickness compared to those fed high-grain non-pelleted TMR concentrate or high-grain TMR in pelleted form. Wang et al. [52] reported increased total epithelium and stratum corneum thickness in animals fed a ground corn high-grain diet compared to a whole corn high-grain diet. Our study found no significant difference in stratum corneum thickness among the categories, but Category 3 samples had a greater length of the stratum corneum compared to Category 1 samples. Garcia Diaz et al. [53] reported higher total epithelium and stratum corneum thickness, but lower connective tissue width and non-keratinized thickness, in animals fed a grain-based diet compared to those on an additive-supplemented grain-based diet. Lower rumen pH may increase the rate of replacement of keratinized epithelium, stimulating non-keratinized epithelium growth to produce keratinized layers [25].
5. Conclusions
Subacute rumen acidosis (SARA) is a prevalent condition in the modern dairy sheep industry of Greece, significantly affecting farms with higher milk yields. This study demonstrates that SARA not only impacts production metrics but also induces notable changes in the rumen epithelium, detectable through rumen colorimetry concerning the color of the epithelium. The discoloration in the rumen epithelium, observed as a darker hue, is attributed to the acidified rumen content's effect on the upper layers of the epithelium, rather than the presence of parakeratosis as previously suggested.
The use of computerized rumen colorimetry in ewes slaughtered as part of the replacement stock offers a promising management tool for assessing the SARA status of a farm. By implementing this technique, farmers and health advisors can gain reliable insights into the prevalence of SARA and make informed decisions to optimize feeding strategies and overall herd health.
Overall, the findings highlight the need for continued research and the development of comprehensive feeding practices that balance high energy intake with adequate dietary fiber. Incorporating concentrate mixtures into a total mixed ration (TMR) may provide a viable solution, mitigating the risk of SARA while supporting optimal milk production and animal well-being in dairy sheep farms.
Author Contributions
Conceptualization, G.C; methodology, G.C., D.A.G., D.P. and V.G.P.; software, N.V., D.A.G.; validation G.C., D.A.G., D.P., V.G.P., L.V.A.; formal analysis, G.C., D.A.G., N.V., D.P.; investigation, N.V., G.C., D.A.G., D.P., G.I.P., K.K., M.A.T; resources, N.V.; data curation, N.V., D.A.G., G.C., D.P.; writing—original draft preparation, N.V., G.C.; writing—review and editing, G.C., D.A.G., L.V.A., D.P., V.G.P.; visualization, G.C.; supervision, G.C, D.P., D.A.G, V.G.P.; project administration, G.C.; funding acquisition, G.C. All authors have read and agreed to the published version of the manuscript.
Funding
Funding for essential materials, integral to the first author’s PhD studies, was generously provided by the Clinical Veterinary Medicine Department, Faculty of Veterinary Science, University of Thessaly.
Institutional Review Board Statement
The trial protocol received approval by the Institutional Ethical Research Committee (University of Thessaly, approval number: 152, date of approval:16 Mayr 2021).
Informed Consent Statement
Informed written consent was acquired from the farm proprietors.
Data Availability Statement
All data generated for this study are presented within the manuscript.
Acknowledgments
The authors wish to thank the managers of the trial farms for their support
Conflicts of Interest
The authors affirm that there are no financial or personal relationships, nor any other conflicts of interest, that could potentially exert undue influence or bias the content of this paper.
References
- Blanch, M.; Calsamiglia, S.; DiLorenzo, N.; DiCostanzo, A.; Muetzel, S.; Wallace, R.J. Physiological changes in rumen fermentation during acidosis induction and its control using a multivalent polyclonal antibody preparation in heifers. J. Anim. Sci. 2009, 87, 1722–1730. [Google Scholar] [CrossRef] [PubMed]
- Xia, G.; Sun, J.; Fan, Y.; Zhao, F.; Ahmed, G.; Jin, Y.; Zhang, Y.; Wang, H. β-Sitosterol Attenuates High Grain Diet-Induced Inflammatory Stress and Modifies Rumen Fermentation and Microbiota in Sheep. Anim 2020, 10, 171. [Google Scholar] [CrossRef] [PubMed]
- Church, D.C. Livestock Feeds and Feeding, 3rd ed.; Publisher: Prentice-Hall Inc., USA, 1991; p. 349. [Google Scholar]
- Commun, L.; Mialon, M.M.; Martin, C.; Baumont, R.; Veissier, I. Risk of subacute ruminal acidosis in sheep with separate access to forage and concentrate. J. Anim Sci. 2009, 87, 3372–3379. [Google Scholar] [CrossRef] [PubMed]
- Chang, G.; Liu, X.; Ma, N.; Yan, J.; Dai, H.; Roy, A.C.; Shen, X. Dietary Addition of Sodium Butyrate Contributes to Attenuated Feeding-Induced Hepatocyte Apoptosis in Dairy Goats. J Agric Food Chem 2018, 66, 9995–10002. [Google Scholar] [CrossRef] [PubMed]
- Chaudhry, A.S.; Khan, M.A.; Khan, M.S.; Ashraf, K.; Saleem, M.H.; Khan, N.U.; Usman, T.; Ahmad, I. Effect of different level of concentrate feeding on hematobiochemical parameters in an experimentally induced sub-acute ruminal acidosis (SARA) in sheep and its management with different concentration of antacids. J Anim Plant Sci 2018, 28, 1018–7081. [Google Scholar]
- Wang, Y.; Liu, J.; Huang, J.; Chang, G.; Roy, A.C.; Gao, Q.; Cheng, X.; Shen, X. Sodium butyrate attenuated iE-DAP induced inflammatory response in the mammary glands of dairy goats fed high-concentrate diet. J Sci Food Agric. 2020, 101, 1218–1227. [Google Scholar] [CrossRef] [PubMed]
- Krause, K.M.; Oetzel, G.R. Understanding and preventing subacute ruminal acidosis in dairy herds: A review. Anim Feed Sci Technol 2006, 126, 215–236. [Google Scholar] [CrossRef]
- Voulgarakis, N.; Gougoulis, D.; Psalla, D.; Papakonstantinou, G.; Angelidou-Tsifida, M.; Papatsiros, V.; Athanasiou, L.; Christodoulopoulos, G. Ruminal Acidosis Part I: Clinical manifestations, epidemiology and impact of the disease. J Hellenic Vet Med Soc 2023, 74, 5883–5891. [Google Scholar] [CrossRef]
- Desnoyers, M.; Duvaux-Ponter, C.; Rigalma, K.; Roussel, S.; Martin, O.; Giger-Reverdin, S. Effect of concentrate percentage on ruminal pH and time-budget in dairy goats. Anim 2008, 2, 1802–1808. [Google Scholar] [CrossRef] [PubMed]
- Chang, G.; Zhuang, S.; Seyfert, H.M.; Zhang, K.; Xu, T.; Jin, D.; Guo, J.; Shen, X. Hepatic TLR4 signaling is activated by LPS from digestive tract during SARA, and epigenetic mechanisms contribute to enforced TLR4 expression. Oncotarget 2015, 6, 36. [Google Scholar] [CrossRef]
- Xu, T.; Tao, H.; Chang, G.; Zhang, K.; Xu, L.; Shen, X. Lipopolysaccharide derived from the rumen down-regulates stearoyl-CoA desaturase 1 expression and alters fatty acid composition in the liver of dairy cows fed a high-concentrate diet. BMC Vet Res 2015, 11, 52. [Google Scholar] [CrossRef] [PubMed]
- Li, S.; Gozho, G.N.; Gakhar, N.; Khafipour, E.; Krause, D.O.; Plaizier, J.C. Evaluation of diagnostic measures for subacute ruminal acidosis in dairy cows. Can J. Anim. Sci. 2012, 92, 353–364. [Google Scholar] [CrossRef]
- Kitkas, G.; Valergakis, G.; Kritsepi-Konstantinou, M.; Gelasakis, A.; Arsenos, G.; Kalaitzakis, E.; Panousis, N. Effects of ruminal pH and subacute ruminal acidosis on milk yield and composition of Holstein cows in different stages of lactation. J Hellenic Vet Med Soc. 2019, 70, 1551–1560. [Google Scholar] [CrossRef]
- Kirbas, A.; Baydar, E.; Kandemir, F.M.; Dorman, E.; Kizil, O.; Yildirim, B.A. Evaluation of serum cardiac troponin I concentration in sheep with acute ruminal lactic acidosis. Vet Arh 2014, 84, 355–364. [Google Scholar]
- Sabes, A.F.; Girardi, A.M.; Fagliari, J.J.; Oliveira, J, A.; Marques, L.C. Serum proteinogram in sheep with acute ruminal lactic acidosis. Int J Vet Sci Med 2017, 5, 35–40. [Google Scholar] [CrossRef] [PubMed]
- Voulgarakis, N.; Athanasiou, L.; Psalla, D.; Gougoulis, D.; Papatsiros, V.; Christodoulopoulos, G. Ruminal Acidosis Part II: Diagnosis, Prevention and Treatment. J Hellenic Vet Med Soc, 2024, 74, 6329–6336. [CrossRef]
- Enemark, J.M.D. The monitoring, prevention and treatment of sub-acute ruminal acidosis (SARA): A review. Vet. J. 2008, 176, 32–43. [Google Scholar] [CrossRef] [PubMed]
- Lopez-Campos, O.; Bodas, R.; Prieto, N.; Giraldez, F.J.; Perez, V.; Andres, S. Naringin dietary supplementation at 0.15% rates does not provide protection against sub-clinical acidosis and does not affect the responses of fattening lambs to road transportation. Anim 2010, 4, 958–964. [Google Scholar] [CrossRef] [PubMed]
- Andrés, S.; Jaramillo, E.; Bodas, R.; Blanco, C.; Benavides, J.; Fernández, P.; González, E.P.; Frutos, J.; Belenguera, A.; Lópeza, S.; Giráldez, F.J. Grain grinding size of cereals in complete pelleted diets for growing lambs: Effects on ruminal microbiota and fermentation. Small Rumin Res 2018, 159, 38–44. [Google Scholar] [CrossRef]
- Fanning, J.P.; Hynd, P.I.; Cockcroft, P.D. The relative roles of the ruminal fluid and epithelium in the aetiology of ruminal acidosis. Small Rumin. Res. 2018, 162, 57–62. [Google Scholar] [CrossRef]
- Yancey, J.W.S.; Kropf, D.H. Instrumental reflectance values of fresh pork are dependent on aperture size. Meat Sci. 2008, 79, 734–739. [Google Scholar] [CrossRef] [PubMed]
- Chmiel, M.; Slowinski, M.; Dasiewicz, K.; Florowski, T. Application of a computer vision system to classify beef as normal or dark, firm, and dry. J Anim Sci 2012, 90, 4126–4130. [Google Scholar] [CrossRef] [PubMed]
- Silva, E.P.E.; Moraes, E.P.; Anaya, K.; Silva, Y.M.O.; Lopes, H.A.P.; Andrade Neto, J.C.; Oliveira, J.P.F.; Oliveira, J.B.; Rangel, A.H.N. Lactoperoxidase potential in diagnosing subclinical mastitis in cows via image processing. PLoS One. 2022, 17, e0263714. [Google Scholar] [CrossRef] [PubMed]
- Voulgarakis, N.; Gougoulis, D.A.; Psalla, D.; Papakonstantinou, G.I.; Katsoulos, P.D.; Katsoulis, K.; Angelidou-Tsifida, M.; Athanasiou, L.V.; Papatsiros, V.G.; Christodoulopoulos, G. Can Computerized Rumen Mucosal Colorimetry Serve as an Effective Field Test for Managing Subacute Ruminal Acidosis in Feedlot Cattle? Vet Res Commun. 2024, 48, 475–484. [Google Scholar] [CrossRef] [PubMed]
- Li, F.; Cao, Y.; Liu, N.; Yang, X.; Yao, J.; Yan, D. Subacute ruminal acidosis challenge changed in situ degradability of feedstuffs in dairy goats. J Dairy Sci 2014, 97, 5101–5109. [Google Scholar] [CrossRef] [PubMed]
- Lira, M.A.A.; Simões, S.V.D.; Riet-Correa, F.; Pessoa, C.M.R.; Dantas, A.F.M.; Miranda Neto, E.G. Diseases of the digestive system of sheep and goats in the semiarid region of Brazil. Pesqui Vet Bras 2013, 33, 193–198. [Google Scholar] [CrossRef]
- Mialon, M.M.; Deiss, V.; Andanson, S.; Anglard, F.; Doreau, M.; Veissier, I. An assessment of the impact of rumenocentesis on pain and stress in cattle and the effect of local anaesthesia. The Veterinary Journal 2012, 194, 55–59. [Google Scholar] [CrossRef] [PubMed]
- Morgante, M.; Stelletta, C.; Berzaghi, P.; Gianesella, M.; Andrighetto, I. Subacute rumen acidosis in lactating cows: An investigation in intensive Italian dairy herds. J Anim Physiol Anim Nutr 2007, 91, 226–234. [Google Scholar] [CrossRef] [PubMed]
- Johnson, R.R.; Kuby, P.J. (2011) Elementary Statistics 11th (eleventh) Edition, Cengage Learning.
- RGB Color Detector (2022) Available from: com.TheProgrammer.
- CIE. (1986) Colourimetry: Official recommendations of the international commission on illumination. CIE Publ. No. 15.2. CIE Central Bureau, Vienna.
- Povey, G.; Stubbings, L.; Phillips, K. Feeding the ewe A manual for consultants, vets and producers., 2nd ed; AHDB Agriculture and Horticulture Development Board Middlemarch Business Park Siskin Parkway East: Coventry, England, 2018; pp. 1–64. [Google Scholar]
- Tao, H.; Chang, G.; Xu, T.; Zhao, H.; Zhang, K.; Shen, X. Feeding a High Concentrate Diet Down-Regulates Expression of ACACA, LPL and SCD and Modifies Milk Composition in Lactating Goats. PLoS ONE 2015, 10, e0130525. [Google Scholar] [CrossRef] [PubMed]
- Zhang, H.; Peng, A.L.; Zhao, F.F.; Yu, L.H.; Wang, M.Z.; Osorio, J.S.; Wang, H.R. Thiamine ameliorates inflammation of the ruminal epithelium of Saanen goats suffering from subacute ruminal acidosis. J Dairy Sci. 2020, 103, 1931–1943. [Google Scholar] [CrossRef] [PubMed]
- Plaizier, J.C.; Krause, D.O.; Gozho, G.N.; McBride, B.W. Subacute ruminal acidosis in dairy cows: The physiological causes, incidence and consequences. Vet J 2008, 176, 21–31. [Google Scholar] [CrossRef]
- Humer, E.; Aschenbach, J.R.; Neubauer, V.; Kröger, I.; Khiaosa-Ard, R.; Baumgartner, W.; Zebeli, Q. Signals for identifying cows at risk of subacute ruminal acidosis in dairy veterinary practice. J Anim Physiol Anim Nutr (Berl) 2018, 102, 380–392. [Google Scholar] [CrossRef]
- Neubauer, V.; Humer, E.; Kröger, I.; Braid, T.; Wagner, M.; Zebeli, Q. Differences between pH of indwelling sensors and the pH of fluid and solid phase in the rumen of dairy cows fed varying concentrate levels. J Anim Physiol Anim Nutr 2017, 102, 343–349. [Google Scholar] [CrossRef]
- Villot, C.; Meunier, B.; Bodin, J.; Martin, C.; Silberberg, M. Relative reticulo-rumen pH indicators for subacute ruminal acidosis detection in dairy cows. Animal 2017, 12, 481–490. [Google Scholar] [CrossRef]
- Enemark, J.M.D.; Jørgensen, R.J.; Enemark, P. Rumen acidosis with special emphasis on diagnostic aspects of subclinical rumen acidosis: a review. Vet ir Zootech 2002, 20, 16–29. [Google Scholar]
- Kleen, J.L.; Hooijer, G.A.; Rehage, J.; Noordhuizen, J.P. Subacute ruminal acidosis (SARA): A review. J. Vet. Med. A Physiol Pathol Clin Med 2003, 50, 406–414. [Google Scholar] [CrossRef] [PubMed]
- Cook, N.B.; Oetzel, G.R.; Nordlund, K.V. Clinical forum–subacute ruminal acidosis–a problem in UK dairy herds? UK Vet 2005, 10, 40–46. [Google Scholar]
- Lean, I.J.; Annison, F.; Bramley, E.; Browning, G.; Cusack, P.; Farquharson, B.; Little, S.; Nandapi, D. Ruminal Acidosis- aetiopahtogenesis, prevention and treatment: A review for veterinarians and nutritional professionals. Reference Advisory Group on Fermentative Acidosis of Ruminants (RAGFAR) 2007, pp 1-60.
- Giger-Reverdin, S.; Rigalma, K.; Desnoyers, M.; Sauvant, D.; Duvaux-Ponter, C. Effect of concentrate level on feeding behavior and rumen and blood parameters in dairy goats: Relationships between behavioral and physiological parameters and effect of between-animal variability. J Dairy Sci 2014, 97, 4367–4378. [Google Scholar] [CrossRef] [PubMed]
- Christodoulopoulos, G. Maedi–Visna: Clinical review and short reference on the disease status in Mediterranean countries. Small Rumin Res 2006, 62, 47–53. [Google Scholar] [CrossRef]
- McKenna, S.L.; Keefe, G.P.; Tiwari, A.; VanLeeuwen, J.; Barkema, H.W. Johne's disease in Canada part II: disease impacts, risk factors, and control programs for dairy producers. Can Vet J. 2006, 47, 1089–99. [Google Scholar] [PubMed]
- Alhidary, I.; Abdelrahman, M.M.; Alyemni, A.H.; Khan, R.U.; Al-Mubarak, A.H.; Albaadani, H.H. Characteristics of rumen in Naemi lamb: Morphological changes in response to altered feeding regimen. Acta Histochem 2016, 118, 331–7. [Google Scholar] [CrossRef] [PubMed]
- Abdelrahman, M.M.; Alhidary, I.; Alyemni, A.H.; Khan, R.U.; Bello, A.R.; Al-Saiady, M.Y.; Amran, R.A. Effect of alfalfa hay on rumen fermentation patterns and serum biochemical profile of growing Naemi lambs with ad libitum access to total mixed rations. Pak. J. Zool. 2005, 49, 15–19. [Google Scholar] [CrossRef]
- Hamada, T.; Maeda, S.; Kameoka, K. Effects of minerals on formation of colour in the rumen epithelium of kids. J. Dairy Sci. 1969, 53, 588–591. [Google Scholar] [CrossRef] [PubMed]
- Steele, M.A.; Greenwood, S.L.; Croom, J.; McBride, B.W. An increase in dietary non-structural carbohydrates alters the structure and metabolism of the rumen epithelium in lambs. Can. J. Anim. Sci. 2012, 92, 123–130. [Google Scholar] [CrossRef]
- Bo Trabi, E.; Seddik, H.E.; Xie, F.; Wang, X.; Liu, J.; Mao, S. Effect of pelleted high-grain total mixed ration on rumen morphology, epithelium-associated microbiota and gene expression of proinflammatory cytokines and tight junction proteins in Hu sheep. Anim. Feed Sci. Technol. 2020, 263, 114453. [Google Scholar] [CrossRef]
- Wang, L.; Qi, W.; Mao, S.; Zhu, W.; Liu, J. Effects of whole corn high-grain diet feeding on ruminal bacterial community and epithelial gene expression related to VFA absorption and metabolism in fattening lambs. J Anim Sci. 2022, 100, skac056. [Google Scholar] [CrossRef] [PubMed]
- Garcia Diaz, T.; Ferriani Branco, A.; Jacovaci, F.A.; Cabreira Jobim, C.; Bolson, D.C.; Pratti Daniel, J.L. Inclusion of live yeast and mannanoligosaccharides in high grain-based diets for sheep: Ruminal parameters, inflammatory response and rumen morphology. PLoS ONE 2018, 13, e0193313. [Google Scholar]
Figure 1.
Measurements of the ewe rumen papillae: (a) Stratum corneum thick-ness. (b) Width of the connective tissue. (c) Thickness of the non-keratinized epithelium. (d) Total epithelium thickness. (Hematoxylin-eosin staining; magnification x10).
Figure 1.
Measurements of the ewe rumen papillae: (a) Stratum corneum thick-ness. (b) Width of the connective tissue. (c) Thickness of the non-keratinized epithelium. (d) Total epithelium thickness. (Hematoxylin-eosin staining; magnification x10).
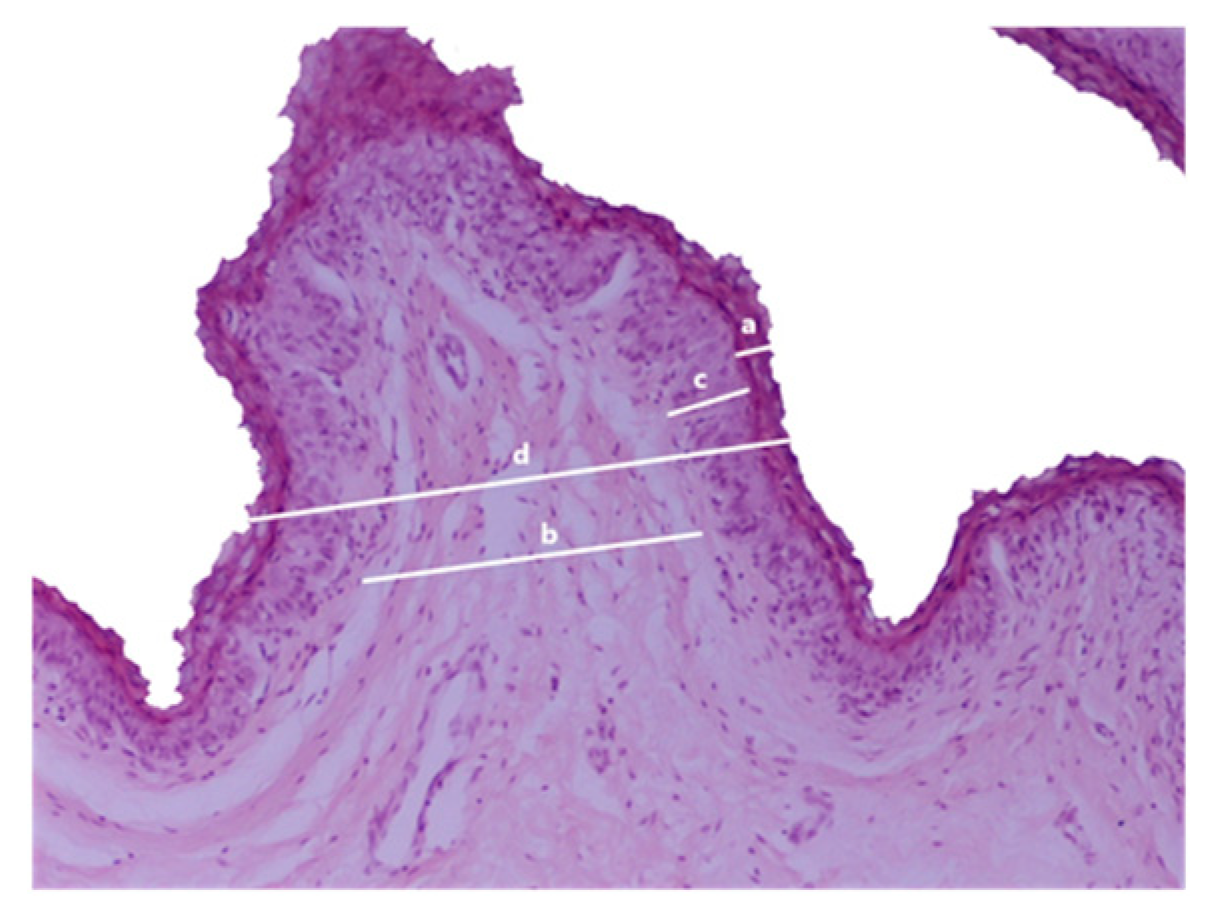

Table 1.
Comparison of pHfarm, and milk components (mean ± SD) between three categories of farms: Category 1 (Farms with a low Prevalence of SARA Farms), Category 2 (Farms with a moderate Prevalence of SARA Farms) and Category 3 (Farms with a high Prevalence of SARA Farms) farms.
Table 1.
Comparison of pHfarm, and milk components (mean ± SD) between three categories of farms: Category 1 (Farms with a low Prevalence of SARA Farms), Category 2 (Farms with a moderate Prevalence of SARA Farms) and Category 3 (Farms with a high Prevalence of SARA Farms) farms.
| Farm sampling period | Category 1 (n=17) |
Category 2 (n=19) |
Category 3 (n=6) |
p-value (Between groups) |
|---|---|---|---|---|
| pHfarm | 5.89 (0.01) | 5.81 (0.02) | 5.74 (0.01) | <0.001*** |
| Milk Yield (Liter) | 7160.3 (100.9) | 7227.4 (104.8) | 7399.1 (66.1) | <0.001*** |
| Milk Fat content (%) | 5.92(0.13) | 5.69(0.11) | 5.65(0.06) | <0.001*** |
| Milk Protein content (%) | 5.72(0.10) | 5.72(0.12) | 5.83(0.05) | 0.064 |
| Milk Lactose content (%) | 4.71(0.09) | 4.81(0.14) | 4.95(0.16) | 0.001* |
| Milk Total Solids content (%) | 10.87(0.23) | 11.06(0.31) | 11.73(0.40) | <0.001*** |
| Milk Fat: Milk Protein ratio | 1.04(0.02) | 0.99(0.02) | 0.96(0.01) | <0.001*** |
*Significant difference at p ≤ 0.05; ***Significant difference at p ≤ 0.001.
Table 2.
Comparison of color components (mean ± SD) between three categories of farms: Category 1 (Farms with a low Prevalence of SARA Farms), Category 2 (Farms with a moderate Prevalence of SARA Farms) and Category 3 (Farms with a high Prevalence of SARA Farms) farms.
Table 2.
Comparison of color components (mean ± SD) between three categories of farms: Category 1 (Farms with a low Prevalence of SARA Farms), Category 2 (Farms with a moderate Prevalence of SARA Farms) and Category 3 (Farms with a high Prevalence of SARA Farms) farms.
| Abattoir sampling period |
Category 1 (n=111 ewes) |
Category 2 (n=124 ewes) |
Category 3 (n=45 ewes) |
p-value (Between groups) |
|---|---|---|---|---|
| L* | 39.93(5.24) | 30.59(4.92) | 21.98(6.92) | <0.001*** |
| a* | 0.66(4.03) | 1.01(4.34) | 2.28(4.04) | 0.091 |
| b* | 9.54(5.80) | 9.53(4.67) | 4.49(6.92) | <0.001*** |
| Red | 100.94(14.33) | 78.38(9.98) | 58.41(12.34) | <0.001*** |
| Green | 93.38(12.69) | 71.16(13.14) | 51.60(16.13) | <0.001*** |
| Blue | 78.92(15.15) | 57.53(14.52) | 46.33(17.81) | <0.001*** |
| RGB -SUM | 273.23(36.99) | 207.08(32.36) | 156.34(43.06) | <0.001*** |
| HSV | 0.40(0.06) | 0.33(0.06) | 0.24(0.05) | <0.001*** |
| HSL | 35.47(4.85) | 26.82(4.08) | 20.44(5.57) | <0.001*** |
***Significant difference at p ≤ 0.001; L*: color lightness; a*: redness-greenness of the color; b*: yellow-blueness of the color; HSV: Hue, Saturation and Value; HSL: Hue, Saturation, and Lightness.
Table 3.
Comparison of histological measurements in the layers of the ruminal epithelium (mean ± SD) among rumen samples from Category 1 (Farms with a low Prevalence of SARA Farms), Category 2 (Farms with a moderate Prevalence of SARA Farms) and Category 3 (Farms with a high Prevalence of SARA Farms) farms.
| Category 1 (n=15 ewes) |
Category 2 (n=15 ewes) |
Category 3 (n=15 ewes) |
p-value (Between groups) |
|
|---|---|---|---|---|
| Stratum corneum (μm) | 33.67(12.83) | 43.07(24.97) | 41.67(16.25) | 0.342 |
| Connective tissue (μm) | 103.27(39.35) | 135.00(61.32) | 148.13(63.83) | 0.090 |
| Non-keratinized epithelium (μm) |
80.13(14.46) | 116.47(28.64) | 166.67(21.41) | <0.001*** |
| Total epithelium (μm) | 217.07(51.69) | 294.53(61.26) | 356.47(74.08) | <0.001*** |
***Significant difference at p ≤ 0.001.
Disclaimer/Publisher’s Note: The statements, opinions and data contained in all publications are solely those of the individual author(s) and contributor(s) and not of MDPI and/or the editor(s). MDPI and/or the editor(s) disclaim responsibility for any injury to people or property resulting from any ideas, methods, instructions or products referred to in the content. |
© 2024 by the authors. Licensee MDPI, Basel, Switzerland. This article is an open access article distributed under the terms and conditions of the Creative Commons Attribution (CC BY) license (http://creativecommons.org/licenses/by/4.0/).
Copyright: This open access article is published under a Creative Commons CC BY 4.0 license, which permit the free download, distribution, and reuse, provided that the author and preprint are cited in any reuse.


