
Submitted:
12 June 2024
Posted:
13 June 2024
You are already at the latest version
Abstract
This study presents PlanteSaine, a novel mobile application powered by Artificial Intelligence (AI) models explicitly designed for maize, tomato, and onion farmers in Burkina Faso. Agriculture in Burkina Faso, like many developing nations, faces substantial challenges from plant pests and diseases, posing threats to both food security and economic stability. PlanteSaine addresses these challenges by offering a comprehensive solution that provides farmers with real-time identification of pests and diseases. Farmers capture images of affected plants with their smartphones, and PlanteSaine's AI system analyzes these images to provide accurate diagnoses. The application's offline functionality ensures accessibility even in remote areas with limited internet connectivity, while its messaging feature facilitates communication with agricultural authorities for guidance and support. Additionally, PlanteSaine includes an emergency alert mechanism to notify farmers about pest and disease outbreaks, enhancing their preparedness to deal with these threats. An AI-driven framework, featuring an image feature extraction phase with EfficientNetB3 and an artificial neural network (ANN) classifier, was developed and integrated into PlanteSaine. The evaluation of PlanteSaine demonstrates its superior performance compared to baseline models, showcasing its effectiveness in accurately detecting diseases and pests across maize, tomato, and onion crops. Overall, this study highlights the potential of PlanteSaine to revolutionize agricultural technology in Burkina Faso and beyond. Leveraging AI and mobile computing, PlanteSaine provides farmers with accessible and reliable pest and disease management tools, ultimately contributing to sustainable farming practices and enhancing food security. The success of PlanteSaine underscores the importance of interdisciplinary approaches in addressing pressing challenges in global agriculture
Keywords:
Artificial Intelligence in Agriculture
; Pest and Disease Detection
; Mobile Application for Farmers
; Burkina Faso Agriculture
; Real-time Plant Diagnosis
; Sustainable Farming Practices
1. Introduction
Agriculture plays a pivotal role in the economies of many developing nations, including Burkina Faso, where a significant portion of the population relies on farming for their livelihood [1]. However, the agricultural sector is constantly under threat from various biotic stressors, such as pests and pathogens, which can lead to severe crop losses [2]. Plant diseases caused by multiple pathogens can significantly impair crops' normal growth and development, disrupting their vital functions and ultimately leading to reduced yields [3]. Similarly, pests like insects and fungi can wreak havoc on agricultural crops, posing a substantial threat to food security [4]. In Burkina Faso, where agriculture forms the backbone of the economy, the challenges posed by plant diseases and pests are particularly acute. Fighting pests and diseases of maize, tomato, and onion crops is vital to the country's food security and economic stability. These crops are susceptible to a range of diseases and pests that can devastate entire harvests, threatening farmers' livelihoods and the availability of food for the population [1].
Addressing these challenges requires efficient and timely intervention to prevent the spread of diseases and pests in agricultural fields. One promising avenue for assisting farmers in this endeavor is utilizing mobile applications empowered by Artificial Intelligence (AI) and remote communication capabilities. These tools provide a new dimension to farming, allowing farmers to access expert knowledge and real-time information, empowering them to make informed decisions.
In response to these challenges, we present PlanteSaine, a mobile application developed for Burkina Faso maize, tomato, and onion farmers. PlanteSaine is a groundbreaking initiative that offers a multifaceted solution to the problems of plant disease and pest management in maize, tomato, and onion crops. Our work contributes significantly to the agricultural landscape by harnessing technology to provide farmers with a tool to safeguard their crops. Users of the app can capture pictures of affected plants with their smartphones, and PlanteSaine's AI algorithms analyze the images and provide diagnoses for the issue. The AI functionality of the app is built by using the top layers of EfficientNetB3 as a deep features selection block and an effective ANN as the classifier. This makes it possible for the app to occupy a smaller amount of memory when compared with the apps developed with EfficientNetB3.
What sets PlanteSaine apart is its offline functionality, a critical feature for regions with limited access to the internet [3]. Farmers in remote areas of Burkina Faso can utilize the app without relying on a continuous internet connection. PlanteSaine stores essential data on user devices, ensuring that users (extension officers, farmers, etc.) can access critical information even in areas with poor network coverage. In addition to diagnosis and offline capabilities, the PlanteSaine messaging option allows users to communicate about diseases and pests with a group of experts made up of pathologists and entomologists at the Ministry of Agriculture. This feature promotes the exchange of insights and best practices, empowering farmers with expertise. Again, PlanteSaine incorporates an emergency alert mechanism that notifies users about pests, disease outbreaks, and other vital information in real-time, enhancing preparedness for dealing with epidemics.
The PlanteSaine mobile app represents a significant step forward in agricultural technology, empowering farmers with tools to protect their crops, enhance productivity, and ensure food security in Burkina Faso. This work underscores the importance of leveraging technology for sustainable agriculture and provides a blueprint for similar initiatives in other regions facing similar agricultural challenges [4]. With PlanteSaine, Burkina Faso is poised to improve its agricultural resilience, ultimately enhancing the well-being of its farming communities and securing the nation's food supply.
The key contributions of this study are as follows:
- PlanteSaine leverages an advanced AI framework combining EfficientNetB3 with an Artificial Neural Network (ANN) classifier, achieving significantly higher accuracy and performance in diagnosing plant diseases and pests for maize, tomato, and onion crops compared to traditional methods.
- Designed to operate without the need for continuous internet access, PlanteSaine ensures that farmers in remote areas of Burkina Faso can utilize the app's diagnostic capabilities and access critical agricultural information, addressing the challenge of limited internet connectivity.
- The app includes a robust messaging feature that connects users with agricultural experts, facilitating real-time advice and knowledge sharing. Additionally, an emergency alert system promptly informs users about pest and disease outbreaks, enhancing preparedness and response.
- With its high accuracy, precision, and recall rates across multiple crops, PlanteSaine presents a scalable and adaptable solution for agricultural disease and pest management. Its successful implementation can serve as a blueprint for similar initiatives in other developing regions, promoting sustainable agriculture and food security.
2. Related Work
The growing interest in using AI techniques to recognize or detect plant diseases has been analysed by researchers (e.g., Singh (2020) [5] and Abade et al. (2021) [6]) in their review works. The works mainly presented a review of the effective use of diverse imaging techniques and computer vision approaches for identifying crop diseases. The use of deep learning (DL), support vector machine (SVM), K-means clustering, and K-nearest neighbours (K-NN) are the major ones used for such task. The works also mention that, with the advent of DL, the shift is moving gradually from the machine learning-based approaches, which mostly employed image processing techniques for feature extractions. It was observed that most image processing techniques used in recognising or identifying plant diseases are mainly employed at the preprocessing stage to help improve the quality of the images (dataset) for the DL model to be trained effectively. Again, the 121 papers reviewed by Abade et al. (2021) [6] concluded that Convolution Neural Network (CNN) has become state-of-the-art technique for identifying and classifying plant diseases. The papers reviewed by Abade et al. (2021) [6] were published between 2011 and 2021, spanning 10 years. Therefore, they can serve as a critical guide to understanding the domain and direction of DL for plant disease and pest classification, especially with approaches related to disease detection, dataset characteristics, crop and pathogens investigation, and so on. According to the various literature reviews, CNN-based architecture is an impressive solution for crop disease detection and can contribute to shaping the future of computer vision in this direction. In this section, we present some of the standard works that have employed Deep Learning (DL) for pests and diseases identification, the use of the DL model for tomato and maize and other crops' diseases and pests’ identification, and we finally explore how deep feature extraction approaches are currently deployed to improve accuracy as well as reduce resource consumption of AI-enabled mobile app.
Identification of plant leaf disease using a nine-layer convolutional neural network was deployed by Geetharamani and Arun Pandian (2019) [7] to identify disease. The Deep CNN model was trained using a publicly available dataset with 39 different classes of plant leaves and background images. To improve the model's performance, the authors employed six image augmentation methods: gamma correction, noise injection, image flipping, PCA colour augmentation, rotation and scaling to have a robust model for disease classification. The proposed model achieved 96.46% accuracy. While the proposed model was robust, the work focused on only plant diseases. Again, the number of classes for each category of plants was small; therefore, new models must be developed to handle higher numbers of diseases per plant category for practical application in real-world scenarios.
Ferentinos (2018) [8] developed a deep learning model for plant disease detection and diagnoses. Specialized deep-learning models were trained to identify diseased or healthy leaves. In the work, several CNN-based models were implemented to determine which one effectively distinguishes healthy leaves from diseased ones. These models (binary classifiers) were designed to identify one out of two possible states (healthy or diseased) of the leave. VGG architecture achieved 99.53% accuracy, toping all the models used in the experiment. Though the results produced by Ferentino are impressive, current datasets warrant a multi-class model for identifying plant diseases.
Agarwal et al. (2020) [9] developed a robust model for identifying diseases in tomato crops. According to Agarwal et al. (2020) [9], pre-trained CNN models perform reasonably well but are computationally expensive (running time and memory demand). Using a dataset from PlantVillage, a publicly available dataset, the proposed lightweight model achieved 98.4% accuracy, performing better than the traditional machine learning techniques relying on handcrafted image feature extraction techniques and some pre-trained models. Interestingly, VGG16, a pre-trained model, achieved 93.5% accuracy, suggesting that lightweight models can deliver the required solution at some point. It must be mentioned that new pre-trained models have recently been developed to help image classification tasks with impressive accuracies. For example, the EfficentNet family of pre-trained models have demonstrated their effectiveness in computational complexity and high accuracy at fewer epochs during the models’ training. Developing solutions using one of the state-of-the-art pre-train models will ensure that such solutions provide acceptable outcomes. However, the generalization of developed models can sometimes be challenging.
The use of hybrid DL-based and ensemble classifier models to improve the classification of diseases in tomato crops has been demonstrated by [10,11]. The concept of the ensembled classifiers is to amalgamate the outcomes of weak and relatively more robust models, thereby creating a new classifier known to yield superior results compared to individual classifiers. These ensemble methods operate faster and more effectively and hold promise for AI models on resource-constrained devices. Given the current emphasis within the research community on rapid and accurate methods for diagnosing and classifying various plant types and their diseases, this development is significant [11]. The models were trained on the publicly available PlantVillage dataset, consisting of tomato images, and subsequently tested using publicly accessible Taiwan tomato leaf data. The most successful ensemble technique achieved an impressive accuracy of 95.98% on the tomato dataset. However, it's worth noting that the dataset used in this study solely comprises images of tomato leaves, indicating a limitation in identifying diseases affecting fruits and pests attacking tomato plants.
The challenge of achieving high accuracy performance for multiclass disease detection influenced the design of a new approach to preprocessing images for Deep Learning models by [12]. In their work, anisotropic filtering was applied to all images during the preprocessing stages to remove unwanted distortions in images. U-net was further used to segment an image into background and foreground, where the foreground pixels were accepted as pixels belonging to regions of interest. An accuracy of 92.4% was recorded for the DbnetAlexnet model on segmented images, which was impressive compared to the unsegmented images. Bacterial spot, healthy, late blight, early blight, leaf mould, tomato mosaic virus, tomato yellow leaf mould, tomato mosaic virus, and tomato yellow leaf curl virus were the classes used to train the model. The classes used to develop the model were only diseases that affect the leaves of the tomato. As much as the work is a significant contribution to the development of DL models for plant pathology, the work did not focus on diseases and pests that affect the tomato fruits. Again, the accuracy obtained is significant, but more can be done to develop a robust model for the identification of tomato diseases and pests.
Sathiya et al. (2022) [13] claimed that the current disease detection methodologies are unsuitable for real-time, field scenarios because they are subject to prediction errors. This may be attributed to the controlled environment set up during the creation of the dataset (image acquisition), which may be different during the usage of the model. The study proposed using soft computing techniques (CDD-H_HSC) to automatically identify diseases, especially at the earlier stages where most of the existing solutions fail. Just like Badiger et al. (2023) [12] and Sathiya et al. (2022) [13] also employed segmentation to separate the diseased area from the input plant leaf image at the preprocessing stage using the Multi-Swarm Coyote Optimization (MSCO) technique. To deal with the curse of dimension in model development, the Improved Chan-Vese Snake Optimization (ICVSO) algorithm is employed to minimize the dimensionality of the features for training. The Fitness-Distance Balance Deep Neural Network (FDB-DNN) classifier model identifies the leaf and its associated disease. The work demonstrates the benefit of segmentation in improving the identification of disease. The stages involved in this work make it a bit complicated to deploy on low-resource devices such as smartphones.
Shewale et al. (2023) [14] proposed a deep learning architecture for early plant leaf disease detection. A significant importance of such architecture or model is its ability to detect disease early, enabling the farmer to take action before he loses all his crops when the disease appears late. The model was developed to identify and classify diseases in tomato leaves. The strength of the proposed model in their work is its ability to generalize well compared to existing models deployed in real-time. The model was, however, not integrated into any device for farmers to use in the field for identification or classification of diseases, as mentioned by the authors. There is, therefore, the need to work on models that can easily be deployed on devices such as mobile phones for adoption by farmers. The work again acknowledged that numerous approaches are available for automatic disease recognition. However, more needs to be done to make tools easy and accessible to farmers all over the world.
Using CNN to classify maize leaf disease has also gained momentum over time. A prominent one was proposed in the work by Priyadharshini et al. (2018) [15]. The work modified the LeNet, a CNN-based architecture, to develop a model that can identify maize disease with an accuracy of 97.89%. The authors claim that CNN models are effective models for classification tasks; therefore, more experiments can be done to develop models that can achieve the perfect level of accuracy. The work demonstrated this by experimenting with various kernel sizes and depths. In the study, the authors inferred that kernels of sizes 3, 9, and 3 are better suited for maize leaf disease classification. A major limitation of the classifier is that the number of diseases used to train the model needs to be bigger to deploy such a model for wide acceptability. A dataset containing a significant number of maize diseases and maize pests can help develop comprehensive AI models that can effectively identify pests and diseases and, therefore, can be deployed for farmer usage.
Esgario et al. (2020) [16] presented a paper on a mobile app that assists farmers in identifying pests and diseases of coffee leaves. The app has an AI model developed using deep learning architecture to make it possible to identify pests and diseases effectively. The authors achieved these remarkable results by designing a Computer Vision pipeline that segments and classifies leaf lesions and estimates the severity of stress caused by biotic agents in coffee leaves. ResNet50 is deployed for this solution and biotic stress classification; the accuracy rates were greater than 97%. A major limitation acknowledged by the researchers is that their proposed framework could only work when the smartphone with the app is connected to the internet. This challenge has been observed with several mobile app solutions, such as Plantix [17]. Indeed, there is a trade-off between accuracy and running time, and therefore, lightweight CNN models that can fit on mobile phones cannot predict perfectly as those that are run on the webserver. Nonetheless, there is the need to develop an app that farmers can use without the need to connect to the internet since many farmers in developing countries such as Burkina Faso will not be able to benefit from the power of AI in transforming the domain of agriculture if internet connectivity is always needed for this task.
Jonathan et al. (2022) [18] presented an innovative in-field plant disease detection solution using a smartphone's deep learning-based trained AI model. Plant Pathology on Palms, as the authors named it, went beyond training models to deploying them on mobile phones. In the work, a lightweight deep learning-based model is developed and integrated into a mobile phone for quick identification of diseases. As mentioned earlier, the reason for developing lightweight models is to mitigate the challenge of effectively running huge CNN models on resource-limited devices. The proposed framework by Jonathan consumes about 1MB and achieved 97%, 97.1%, and 96.4% accuracy on apple, citrus, and tomato leaves datasets respectively. One of their tiny models achieves 93.33% accuracy. The framework was compared with three variants of MobileNetV2 and demonstrated promising performance stability by outperforming most of the settings provided for the MobileNetV2 variants. The work contributes significantly to the discussion of using smartphone and edge computing devices for real-time classification or identification of diseases. However, the solution focused on three crops and some diseases that affect these crops. Expanding the dataset and developing alternative models that will be robust on the expanded dataset will also contribute to pushing machines to assist in the early detection of pests and diseases and, therefore, help farmers take the necessary action before they lose their crops completely.
Kaushik et al. (2023) [19] proposed a deep learning model-based framework for mobile applications (TomFusioNet) to identify and classify tomato diseases and pests. TomFusioNet's pipeline comprises two modules, namely DeepRec and DeepPred. DeepRec provides preliminary disease recognition results, while DeepPred further identifies the type of disease in the crop. A multi-objective optimization-based, non-dominated sorting genetic algorithm was employed for hyperparameter tuning of DeepPred. The proposed models, DeepPred and DeepRec, achieved an average accuracy of 99.93% and 98.32%, respectively. TomFusioNet demonstrates a superior performance with an AUC value of 99.10% and a convergence loss of 0.021. The framework, however, was developed for effectively analyzing leaves of tomato crops for disease identification and classification.
Nag et al. (2023) [20] have also proposed a mobile app-based tomato disease identification using fine-tuned CNNs. The study employed SqueexNet 1.1, VGG19, AlexNet, ResNet-50, and DesneNet-121 on a combined created image and images from PlantVillage. DenseNet-121 leads the pack of CNN architectures with 99.85% accuracy. The work primarily focused on the diseases that affect the leaves. The need for an internet connection to operate the mobile app can sometimes be challenging, especially in regions where internet connectivity is poor.
Using pre-train models for developing models for plant pests and disease detection presents a viable alternative to deploying DL on mobile phones [21]. Wang et al. (2023) [22] adopted EfficientNetB0 to develop a model to classify diseases in tomato plants. The developed model could achieve 91.4% average accuracy, which the authors believe is impressive. Implementing the pretrained model in the mobile application also exhibited satisfactory computational complexities (time and space) compared with other deep learning models implemented on mobile or smartphones. The authors acknowledged the necessity to improve the model’s accuracy and reliability to encourage farmers to accept the app wholeheartedly as a critical tool for productivity. The challenge again is the sharp drop in performance of models developed using laboratory-captured images (images captured under controlled lighting and uniform background conditions) [23-25]. This has led to the recent direction of creating datasets for training models that can effectively classify diseases in the wild. The need to, therefore, have a dataset that largely mimics the field environment is crucial for the adaptability of mobile apps for plant diseases and pest classification [25]. Ngugi et al. (2020) [25] created a dataset using such conditions and deployed a framework with a segmentation mechanism to separate regions of interest from the background. The proposed algorithm records a 94.39% mean F1 score against the rest. Wang (2023) [22] demonstrates the efficacy of the EfficentNet family of models in the classification of diseases. Developing apps that integrate several EfficientNet models for identifying pests and diseases in three or more cropping systems will results in high demand of computational resources by the app. Leveraging on the strength of EfficientNet and other techniques can help improve the development of efficient apps for the detection of diseases and the identification and classification of pests.
The use of deep-feature techniques to extract the critical characteristics of images and train classifier models such as SVM, KNN, and Extreme Learning Machine (ELM) has also gained popularity due to outstanding performances. Türkoğlu et al. (2019) [26] used such an approach for plant disease and pest detection. In their work, FC6 layers of AlexNet, VGG16, and VGG19 models produce better accuracy scores when compared with the others. EfficentNet family of models have proven superior to the model proposed by these authors and, therefore, can be deployed to extract features for the effective performance for plant pests and diseases classification.
In this work, we propose EfficentNetB3 deep feature and an ANN to effectively classify pests and diseases in onion, tomato and maize farms. We are able to reduce computation complexity with this approach, as well as improve performance as compared with the state-of-the-art EfficientNet family model.
3. Materials and Methods
The methodology section of this paper outlines a comprehensive approach for developing and evaluating a novel framework for crop pest and disease classification. Central to this approach is implementing the EfficientNetB3 architecture, characterized by its pre-trained base block and head block for feature extraction and classification, respectively. The model's training parameters, including optimizer, learning rate, and loss function, are meticulously defined to ensure optimal performance. An early stopping mechanism is employed during training to address challenges such as underfitting and overfitting. Furthermore, the methodology involves collecting and annotating diverse dataset collected using mobile phones with high-resolution cameras. Image augmentation techniques are applied to enhance dataset diversity and prepare it for robust machine learning model training. The evaluation process involves comparing the proposed framework with baseline models and assessing the effectiveness of image segmentation techniques. Finally, the PlanteSaine mobile app, integrated with the developed classifiers, facilitates real-time image capture and analysis, offering a user-friendly interface for farmers and extension officers.
3.2. Dataset
3.2.1. Image Capturing
The dataset was gathered using mobile phones as the primary data collection tool. The mobile phones employed for this purpose featured a camera with a resolution of 12 megapixels, a wide-angle lens, a CMOS sensor, with the ability to capture images at a speed of 30 frames per second. It had a storage capacity of 128 GB, offering ample space to store the collected data. The mobile phone was also equipped with connectivity options, including Wi-Fi and Bluetooth, and operated on the Android operating system. It also had GPS capabilities for geotagging the data. The kobotoolbox platform was deployed for this exercise and enabled the automatic transmission of the field photos together with their respective metadata for further processing. Fifteen (15) extension officers from the Ministry of Agriculture were tasked to collect images from the three cropping systems (i.e., tomato, onion, and maize) in three regions (Plateau Central, Centre Ouest and Central Sud) of Burkina Faso.
3.2.2. Image Labelling
Following data collection, the images were obtained from Kobotoolbox and subsequently annotated using the Computer Vision Annotation Tool (CVAT). In all, the extension officers submitted over 29,000 images during the data collection phase. The data collected extended over a total of 12 months in two main seasons (rainy and dry). Before the labelling, we pre-processed the images by deleting blurred images as well as those that were poorly captures.
3.2.3. Data Augmentation
The generator's parameters and formulas define the augmentation methods, which are deliberate choices to enhance the dataset's diversity and prepare it for robust machine learning model training in computer vision applications. Table 1 presents the image augmentation techniques employed in this work, and each parameter serves a specific purpose in addressing the challenges and variations encountered in real-world scenarios.
The rotation range (15 degrees) introduces variability in object orientations, making the model adaptable to objects appearing at different angles. Width and height shift ranges (0.1) allow the model to recognize objects from various perspectives, mimicking shifts in object positions within the frame. Brightness range ([0.5, 1.5]) accounts for changing lighting conditions, a common real-world challenge, while horizontal flipping and the exclusion of vertical flipping (true and false, respectively) simulate different object viewpoints, valuable for orientation-independent object recognition. Shear range (0) is included to handle distorted objects, and zoom range (0.2) trains the model to recognize objects at varying scales, which is relevant in situations where objects are at different distances.
The grayscale image conversion reduces computational complexity when colour is not a distinguishing factor. Applying a mean (7x7) filter smooths the data and reduces noise, enabling the model to focus on critical features while minimizing the impact of irrelevant variations. In combination, these augmentation methods create a diverse dataset, helping the deep learning models to generalize effectively to the complexities of capturing images in farms by different farmers with diverse camera specifications, lighting conditions and orientations.
3.2.4. Description of Dataset
Table 2, Table 3 and Table 4 present the dataset summary used to develop the proposed framework. Sample images of maize, tomato and onions are displayed in Figure 1, Figure 2 and Figure 3 respectively.
In this study, we employed a carefully designed data splitting strategy to effectively train, validate, and test our machine learning models. The dataset was divided into three subsets: a training set, a validation set, and a testing set. The training set, comprising approximately 70% of the total data, was used to train the models' parameters and learn the underlying patterns in the data. The validation set, representing around 15% of the data, played a crucial role in fine-tuning model hyperparameters and evaluating performance during the training process to prevent overfitting. Finally, the testing set, consisting of the remaining 15% of the data, was kept completely separate and used only once to assess the final model's generalization ability on unseen data. This careful partitioning of the data ensured robust model development and reliable evaluation of model performance.
3.3. Baseline Model (EfficientNetB3) Architecture
The EfficientNetB3 model, depicted in Figure 4, comprises two key components: a pre-trained base block featuring convolutional layers for feature extraction and a head block with dense layers for classification. The base block employs a 3x3 kernel for convolution and incorporates a ReLU activation layer, followed by downsampling using a Maxpooling layer. Meanwhile, the head block includes a fully connected layer with a number of neurons representing the target classes. This is succeeded by a dropout layer and a batch normalization layer, enhancing the model's training stability. A SoftMax layer determines the model's output, and training is conducted utilizing the Adamax optimizer with a learning rate set at 0.01, coupled with the categorically cross-entropy loss function. The hyperparameters of the EfficentNetB3 deployed in this work are presented in Table 5.
During the model training, an early stopping mechanism was implemented to prevent underfitting or overfitting. This approach incorporated a 'min_delta' value of 0.001, signifying the minimum level of improvement required to trigger a halt, and a 'patience' value of 5, indicating the number of epochs to wait before interrupting the training process. Furthermore, 'restore_best_weights' was configured to 'true' to ensure the best model weights were retained throughout training.
3.4. Proposed Architecture
The proposed architecture utilizes two sequential steps for the classification of pests and diseases. Figure 5 presents the conceptual framework of the proposed architecture.
The initial step is the extraction of features from the image using deep feature extraction techniques. Images are submitted to the EfficientNetB3 architecture and the vector (size: 1x1x1536) at the GAP (Global Average Pooling) layer is extracted. The feature vector here is a high-level representation of images that serves as the input to the next stage. The second phase, which actually does the classification is a proposed ANN model in the framework. The classifier’s model’s input shape is the same as that of the feature vector generated during the first stage.
3.5.1. Training of EfficientNetB3
The training process of the baseline model (EfficientNetB3) was meticulously designed to ensure optimal performance and generalization. Hyperparameters such as the learning rate, batch size, and optimization algorithm were carefully chosen to facilitate efficient model convergence. The learning rate was set within the range of 0.001 to 0.0001. This range allowed for a balance between rapid convergence and stability during training iterations. A batch size of 16 to 32 was selected, leveraging the scalable architecture of EfficientNetB3 model to process multiple samples per iteration effectively. The optimization algorithm chosen for the experiment was Adam due to its adaptive learning rates and momentum capabilities. Adam's ability to handle sparse gradients and adjust learning rates dynamically contributed to faster convergence and improved training efficiency. To combat overfitting and enhance the model's generalization, several regularization techniques were incorporated. Dropout regularization with a rate of 0.1 to 0.5 was applied to prevent the network from over-relying on specific neurons and encourage robust feature learning. Additionally, L2 regularization, also known as weight decay, was used to penalize large weight magnitudes and promote smoother weight distributions, thereby reducing model complexity and improving generalization.
3.5.2. Training of Classifier of the Proposed Framework
The output of the Global Average Pooling (GAP) of the EfficentNetB3 is saved as descriptors of the images used for training the Artificial Neural Network (ANN) model. The ANN has two hidden layers and ReLU activation functions were meticulously adopted to optimize performance and prevent overfitting. Hyperparameters, including the learning rate (ranging from 0.001 to 0.0001) and batch size (typically set at 16 to 32), were carefully chosen to strike a balance between rapid convergence and stability during training iterations. ReLU activation functions were applied in the hidden layers to introduce non-linearity and facilitate the model's ability to learn complex patterns within the data. Dropout regularization, with rates ranging from 0.1 to 0.5, was incorporated to prevent overfitting by randomly omitting units during training, encouraging the network to learn more robust features. The Adam optimization algorithm was employed due to its adaptive learning rates and momentum capabilities, aiding in faster convergence and improved training efficiency. Overall, these strategies contributed to achieving optimal performance and preventing overfitting during the training phase of the ANN model.
3.6. Evaluation Methods
In the context of this research, we employ two primary evaluation methodologies. The first pertains to assessing our proposed framework with the baseline EfficientNetB3 model. The second method involves evaluating the effectiveness of the image segmentation techniques employed to extract regions of interest, thereby enabling the models to classify instances of pests or diseases effectively.
Evaluating the EfficientNetB3 model and the Proposed Framework on maize, tomato and onion datasets entails using various performance metrics, including Accuracy, Recall, Precision, and F-measure. These statistical measures were chosen due to their widespread use in deep learning research to assess model performance. During the testing phase, these evaluation metrics serve as the evaluative criteria to gauge the efficiency and effectiveness of the generated models when tested with previously unobserved data.
Accuracy (A): Ratio of correctly classified samples to total samples. The accuracy metric measures the proportion of correctly classified instances by a machine learning model, providing a straightforward assessment of its overall performance. The Accuracy formula is presented in Equation (1).
Accuracy = (True Positive + True Negative)/(Total Sample)
Precision: Precision is used to quantify the accuracy of positive predictions made by classification models. It focuses on the proportion of true positive predictions (correctly identified positive cases) relative to all positive predictions made by the model. In other words, precision assesses how many of the positive predictions made by the model were correct. The Precision formula is presented in Equation (2).
Precision = (True Positive) / (True Positive +False Positive)
Recall: This determines the proportion of correctly predicted positive observations made by the proposed models. The Recall formula is presented in Equation (3).
Recall = (True Positive) / (True Positive + False Negative)
F-Measure calculates the arithmetic or harmonic mean of precision and recall. This ensures an equal class distribution of the model performance. The F-Measure formula is presented in Equation (4).
F1-Score= 2×(Precsion×Recall)/(Precision+Recall)
3.7. PlanteSaine Mobile App
The PlanteSaine app enables users to capture images using the device's camera. Camera functionality is implemented to allow real-time image capture for analysis. Additionally, the application supports image segmentation, allowing users to submit the entire image or specific sections for analysis. Image processing techniques are employed to extract and preprocess image segments. This functionality allows the user to preprocess images containing complex backgrounds by selecting sections in images they want the model to diagnose. This unique functionality, unlike bounding boxes or cropping, enables users to submit pieces of sub-images of the captured image in any possible way for the model to identify the problem. This novel approach reduces the chances of submitting noise to the model and enhances the application's performance. The three (3) models (MaizeClassifier, TomatoClassifier and OnionClassifier) developed using the proposed classifier are integrated into the application by converting them into tensorflow lite (.tflite) objects for Android application. The implementation focuses on optimizing the user experience by ensuring fast and responsive model predictions and providing informative feedback. The app was tested by using segmented and non-segmented images to determine which makes it easier for classification by the app.
4. Results and Discussion
The results section presents a detailed examination of the performance evaluation conducted on the EfficientNetB3 model and the Proposed Framework across maize, tomato, and onion crops. The Proposed Framework consistently outperforms EfficientNetB3 across all crop types, demonstrating superior accuracy and reliability in identifying pests and diseases. Additionally, evaluating the PlanteSaine mobile app showcases its innovative features, such as the ability to designate regions of interest within images, contributing to enhanced classification accuracy and user experience. Overall, these results highlight the effectiveness of AI-driven approaches in agricultural pest and disease management, with implications for improved crop yield protection and sustainability.
The evaluation of the EfficientNetB3 model and the Proposed Framework aimed to gauge their efficacy in identifying various pests and diseases across maize, tomato, and onion crops. Table 7, Table 8 and Table 9 showcase the average performance metrics, encompassing precision, recall, and F1 score, attained by each model in detecting the pests and diseases affecting these crops.
4.1. Pest and Disease Detection Model’s Performance
4.1.1. Maize Pest and Diseases Detection Performance
The results in Table 7 illustrate the performance of EfficientNetB3 and the Proposed Framework in detecting pests and diseases affecting maize plants. The Proposed Framework demonstrates superior performance across all evaluated metrics, achieving higher accuracy, precision, recall, and F1 scores when compared with EfficientNetB3. Specifically, the Proposed Framework attained an accuracy of 96.5, precision of 96.71%, recall of 96.39%, and F1 score of 96.54%, indicating its efficacy in accurately identifying maize pests and diseases from imagery data. The training and validation accuracies as well as the confusion matrix for testing the MaizeClassifier are illustrated in Figure 6 and Figure 7 respectively.
The EfficientNetB3 model achieved an accuracy of 89.3%, while the Proposed Framework significantly improved this metric, reaching an accuracy of 96.5% as illustrated in Table 7. This substantial increase underscores the enhanced performance and reliability of the Proposed Framework in classifying maize images. Additionally, the precision of the Proposed Framework (96.71%) far exceeds that of EfficientNetB3 (86.8%), indicating a remarkable reduction in false positives. This higher precision is crucial in pest and disease management to avoid misclassification, ensuring that resources are efficiently allocated to combat actual threats.
Although EfficientNetB3 achieves a relatively high recall rate of 91.9%, the Proposed Framework attains an even higher recall rate of 96.39%, highlighting its ability to identify a greater proportion of actual maize pest and disease instances. This minimizes the risk of overlooking potential threats during monitoring and management activities. The F1 score further supports the superiority of the Proposed Framework, achieving 96.54% compared to EfficientNetB3's 88.3%. This superior F1 score demonstrates that the Proposed Framework not only excels in precision and recall individually but also maintains a strong overall performance, making it a robust and reliable model for maize pest and disease detection tasks.
4.1.2. Tomato Pest and Diseases Detection Performance
Table 8 presents the performance metrics for tomato pest and diseases detection achieved by EfficientNetB3 and the Proposed Framework. Like the maize detection results, the Proposed Framework outperforms EfficientNetB3 regarding precision, recall, and F1 score. With an accuracy of 97.7, precision of 97.68%, recall of 97.72%, and F1 score of 97.69%, the Proposed Framework demonstrates its effectiveness in accurately detecting tomato pests and diseases. The training and validation accuracies as well as the confusion matrix for testing the TomatoClassifier are illustrated in Figure 8 and Figure 9 respectively.
Table 8 compares the accuracy metrics for the Tomato Model using both the EfficientNetB3 model and the Proposed Framework. The EfficientNetB3 model achieved an accuracy of 83.8%, with precision, recall, and F1 scores of 83.3%, 84.4%, and 82%, respectively. In contrast, the Proposed Framework demonstrated remarkable improvements, achieving an accuracy of 97.7%, with precision, recall, and F1 scores all at or above 97.7%. This showcases the superior performance of the Proposed Framework in accurately identifying tomato-related tasks, significantly reducing false positives and enhancing decision-making in pest and disease management.
The Proposed Framework's exceptional recall rate of 97.72% indicates its ability to identify most actual tomato pest and disease instances, ensuring comprehensive threat detection and minimizing the risk of overlooking potential outbreaks. Its high F1 score of 97.69% highlights the robust balance between precision and recall, far surpassing EfficientNetB3's F1 score of 82%. These metrics underscore the Proposed Framework's reliability and effectiveness, making it a compelling choice for managing pests and diseases in tomato cultivation, ultimately preserving tomato yields and quality.
4.1.3. Onion Pest and Diseases Detection Performance
The performance of EfficientNetB3 and the Proposed Framework in onion pest and disease detection is summarized in Table 9. Once again, the Proposed Framework showcases superior performance metrics compared to EfficientNetB3. With an accuracy of 96.3, precision of 96.48%, recall of 96.23%, and F1 score of 96.35%, the Proposed framework exhibits enhanced accuracy in classifying onion pests and diseases. The training and validation accuracies as well as the confusion matrix for testing the OnionClassifier are illustrated in Figure 10 and Figure 11 respectively.
The EfficientNetB3 model achieved an accuracy of 92.8%, with precision, recall, and F1 scores of 93%, 92.7%, and 92.5%, respectively. In contrast, the Proposed Framework demonstrated notable improvements, achieving an accuracy of 96.3%, with precision, recall, and F1 scores all exceeding 96%. This highlights its superior performance in accurately identifying onion-related tasks. The Proposed Framework's precision of 96.48% significantly outperforms EfficientNetB3's 93%, underscoring its exceptional ability to minimize false positives in identifying onion pests and diseases.
The Proposed Framework achieves a remarkable recall rate of 96.23%, ensuring comprehensive threat detection by identifying most actual onion pest and disease instances, which is crucial for effective monitoring and management. Its high recall rate minimizes the risk of overlooking potential outbreaks. Additionally, with an impressive F1 score of 96.35%, the Proposed Framework maintains a strong balance between precision and recall, surpassing EfficientNetB3's F1 score of 92.5%. These metrics underscore the robustness and reliability of the Proposed Framework, making it a compelling choice for pest and disease management in onion cultivation. The exceptional performance of the Proposed Framework across all evaluated crop types highlights its potential to revolutionize pest and disease management in agriculture, offering a reliable solution for accurate pest and disease identification.
4.2. PlanteSaine
Figure 12 illustrates PlanteSaine’s innovative capability to empower users to designate non-continuous sections within an image to create regions of interest (ROI) for submission. This novel feature significantly augments the model's performance by enabling users to focus on specific areas of interest within an image, thereby enhancing the accuracy and relevance of the classification process. This distinctive functionality gives users greater flexibility and control over the input data and optimizes the model's ability to discern key features and characteristics within the designated regions.
An image to be classified by the app is submitted wholly or partly to the AI model. In Figure 12, a tomato fruit is submitted wholly and partly. PlanteSaine classified the wholly submitted image as Tuta absoluta, while the segmented one is a Helicoverpa armigera. The app can consider the variation in both instances good results since the possibility of a fruit being affected with diverse diseases can be seen. The app allows users to pinpoint and prioritize relevant portions of an image. This innovative feature reflects Plantesaine's commitment to user-centric design and its continual pursuit of refining and advancing the capabilities of AI-driven plant classification systems.
Upon rigorous testing and analysis of PlanteSaine, the app demonstrated robust performance across various metrics, showcasing its capability to leverage AI technology for enhanced functionality and user experience. Specifically, the app exhibits commendable accuracy in its predictive capabilities, consistently delivering reliable results in real-time scenarios. Users reported a seamless interaction with the app, highlighting its intuitive interface and responsiveness.
Overall, the results underscore the successful integration of AI technology into the Android mobile app, offering users a powerful tool for diverse applications. The app's performance and user-friendly interface position it as a promising solution with vast potential for widespread adoption.
5. Conclusions
In this study, we proposed a comprehensive framework for classifying pests and diseases affecting crops, specifically maize, tomato, and onion. Our approach integrated state-of-the-art deep learning techniques with innovative mobile application development to create a user-friendly and effective solution for farmers, extension officers, and other agricultural stakeholders.
Using the EfficientNetB3 architecture for deep feature extraction, coupled with a customized ANN classifier, we demonstrated significant improvements in accuracy and performance compared to the baseline model. Through rigorous evaluation using accuracy, precision, recall, and F1-score metrics, our proposed framework consistently outperformed the EfficientNetB3 model across all crop types, showcasing its efficacy in accurately identifying and classifying pests and diseases.
Furthermore, the development of the PlanteSaine mobile application represents a pivotal step toward translating our research findings into practical tools for real-world applications. PlanteSaine offers users a convenient and intuitive platform for capturing, analyzing, and addressing plant health issues in the field by leveraging image segmentation techniques and integrating trained classifiers. The app's innovative features, including the ability to designate regions of interest within images, enhance its usability and effectiveness in plant disease and pest identification. This contributes to the advancement of agricultural technology in Burkina Faso by providing farmers and extension officers with accessible and reliable tools for pest and disease management.
Author Contributions
Obed Appiah: Writing – review & editing, Writing – original draft, Methodology, Investigation, Formal analysis, Conceptualization. Kwame Oppong Hackman: Writing – review & editing, Supervision, Project administration, Methodology, Funding acquisition, Conceptualization. Belko Abdoul-Aziz Diallo: Supervision, Methodology. Kehinde Ogunjobi: Funding acquisition, Supervision, Writing – review & editing. Son Diakalia: Methodology – pest identification. Valentin Ouedraogo: Conceptualization, Methodology. Abdoul-Karim Damoue: Methodology –data collection. Gaston Dabire: Methodology – disease identification.
Funding
The research was conducted as part of the implementation of the Precision Pest and Disease Management System based on Multidimensional Big Data (PPeDMaS) project. The project is one of the AGriDI (Accelerating inclusive green growth through agri-based digital innovation in West Africa) projects. Funded through the ACP Innovation Fund of the Organization of African, Caribbean and Pacific States (OACPS) financed by the European Union, AGriDI is implemented by the International Centre of Insect Physiology and Ecology (ICIPE), under its Coordination Unit of the Regional Scholarship and Innovation Fund (RSIF), in collaboration with the University of Abomey Calavi (Benin), Agropolis Foundation (France) and Gearbox Pan African Network (Kenya).
Data Availability Statement
Data used for the training of models can be found at www.ppedmas.org, Download the app @ www.ppedmas.org or use the Google Play Store.
Acknowledgements
This work benefited from the support of other experts and institutions. Notable among them are the extension officers (particularly those from the Centre-Ouest, Centre-Sud, and Plateau Centrale regions) and experts of the General Directorate of Plant Production (DGPV) under the Ministry of Agriculture. Special thanks also go to the staff of WASCAL including Dr. Jesse Naab, Momo Bebe, Ivan Bessin, Audrey Codjia, Dr. Kisito Gandji, and Melika Vodounhessi who contributed in different ways.
Conflicts of Interest
The authors declare no conflicts of interest.
References
- Ferreira, V. , Almazán-Gómez, M.Á., Nechifor, V., et al. The role of the agricultural sector in Ghanaian development: A multiregional SAM-based analysis. Economic Structures 2022, 11. [Google Scholar] [CrossRef] [PubMed]
- Angon, P.B. , Mondal, S., Jahan, I., Datto, M., Antu, U.B., Ayshi, F.J., & Islam, M.S. Integrated Pest Management (IPM) in agriculture and its role in maintaining ecological balance and biodiversity. Advances in Agriculture. Academic Editor: X. Xiao.
- Stathas, I.G. , Sakellaridis, A.C., Papadelli, M., Kapolos, J., Papadimitriou, K., & Stathas, G.J. The effects of insect infestation on stored agricultural products and the quality of food. Foods 2023, 12, 2046. [Google Scholar] [CrossRef] [PubMed]
- Jiang, T. , & Zhou, T. Unraveling the mechanisms of virus-induced symptom development in plants. Plants 2023, 12, 2830. [Google Scholar] [CrossRef] [PubMed]
- Singh, V. , Sharma, N., & Singh, S. A review of imaging techniques for plant disease detection. Artificial Intelligence in Agriculture, 2020.
- Abade, A. , Ferreira, P.A., & Vidal, F.B. Plant diseases recognition on images using convolutional neural networks: A systematic review. Computers and Electronics in Agriculture, 2021.
- Geetharamani, G. , & Pandian, A.J. Identification of plant leaf diseases using a nine-layer deep convolutional neural network. Computers and Electrical Engineering, 2019.
- Ferentinos, K.P. Deep learning models for plant disease detection and diagnosis. Computers and Electrical Engineering, 2018.
- Agarwal, M. , Gupta, S.K., & Biswas, K.K. Development of Efficient CNN model for Tomato crop disease identification. Journal of Sustainable Computing: Informatics and Systems, 2020.
- Ullah, Z.; Alsubaie, N.; Jamjoom, M.; Alajmani, S.H.; Saleem, F. EffiMob-Net: A Deep Learning-Based Hybrid Model for Detection and Identification of Tomato Diseases Using Leaf Images. Agriculture 2023, 13, 737. [Google Scholar] [CrossRef]
- Astani, M. , Hasheminejad, M., & Vaghefi, M. A diverse ensemble classifier for tomato disease recognition. Journal of Computers and Electronics in Agriculture, 2022.
- Badiger, M. , & Mathew, J.A. Tomato plant leaf disease segmentation and multiclass disease detection using hybrid optimization enabled deep learning. Journal of Biotechnology, 2023.
- Sathiya, V. , Josephine, M.S., & Jeyabalaraja, V. An automatic classification and early disease detection technique for herbs plant. Computers and Electrical Engineering, 2022.
- Shewale, M.V. , & Daruwala, R. (June). High performance deep learning architecture for early detection and classification of plant leaf disease. Journal of Agriculture and Food Research 2023, 14, 100675. [Google Scholar] [CrossRef]
- Ahila Priyadharshini, R. , Arivazhagan, S., Arun, M., & Mirnalini, A. Maize leaf disease classification using deep convolutional neural networks. Neural Computing and Applications, 2018.
- Esgario, J.G.M. , de Castro, P.B.C., Tassis, L.M., & Krohling, R.A. An app to assist farmers in the identification of diseases and pests of coffee leaves using deep learning. Information Processing in Agriculture, 2020.
- https://play.google.com/store/apps/details?id=com.peat.GartenBank&hl=en.
- Janarthan, S. , Thuseethan, S., Rajasegarar, S., & Yearwood, J. P2OP—Plant Pathology on Palms: A deep learning-based mobile solution for in-field plant disease detection. Artificial Intelligence in Agriculture, 2022.
- Kaushik, H. , Khanna, A., Singh, D., Kaur, M., & Lee, H.-N. TomFusioNet: A tomato crop analysis framework for mobile applications using the multi-objective optimization based late fusion of deep models and background elimination. Journal of Applied Soft Computing, 2023.
- Nag, A. , Chanda, P.R., & Nandi, S. Mobile app-based tomato disease identification with fine-tuned convolutional neural networks. Computers and Electrical Engineering, 2023.
- Shin, J. , Chang, Y.K., Heung, B., Nguyen-Quang, T., Price, G., & Al-Mallahi, A. (April). A deep learning approach for RGB image-based powdery mildew disease detection on strawberry leaves. Computers and Electronics in Agriculture 2021, 183, 106042. [Google Scholar] [CrossRef]
- Wang, A.R. , & Shabrina, N.H. A deep learning-based mobile app system for visual identification of tomato plant disease. International Journal of Electrical and Computer Engineering (IJECE), 2023.
- Picona A, Alvarez-Gila A, Seitzc M, d, Amaia Ortiz-Barre-dob, Jone Echazarraa and Alexander Johannes, Deep convolutional neural networks for mobile capture device-based crop disease classification in the wild. Comput Electron Agricult 2019, 161, 280–290. [CrossRef]
- Novtahaning, D. , Shah, H.A., & Kang, J.-M. Deep Learning Ensemble-Based Automated and High-Performing Recognition of Coffee Leaf Disease. Agriculture 2022, 12, 1909. [Google Scholar] [CrossRef]
- Ngugia, L.C. , Abdelwahaba, M., & Abo-Zahhad, M. Tomato leaf segmentation algorithms for mobile phone applications using deep learning. Computers and Electronics in Agriculture, 2020.
- Türkoğlu, M. , & Hanbay, D. Plant disease and pest detection using deep learning-based features. Turkish Journal of Electrical Engineering & Computer Sciences, 2019.
Figure 1.
Sample images from the maize dataset ((a)chenille légionnaire_a, (b)chenille légionnaire_p, (c)curvulariose, (d)feuille saine, (e)helminthosporiose, (f)maladie abiotique, (g)pucerons, (h)rouille, (i)striure).
Figure 1.
Sample images from the maize dataset ((a)chenille légionnaire_a, (b)chenille légionnaire_p, (c)curvulariose, (d)feuille saine, (e)helminthosporiose, (f)maladie abiotique, (g)pucerons, (h)rouille, (i)striure).
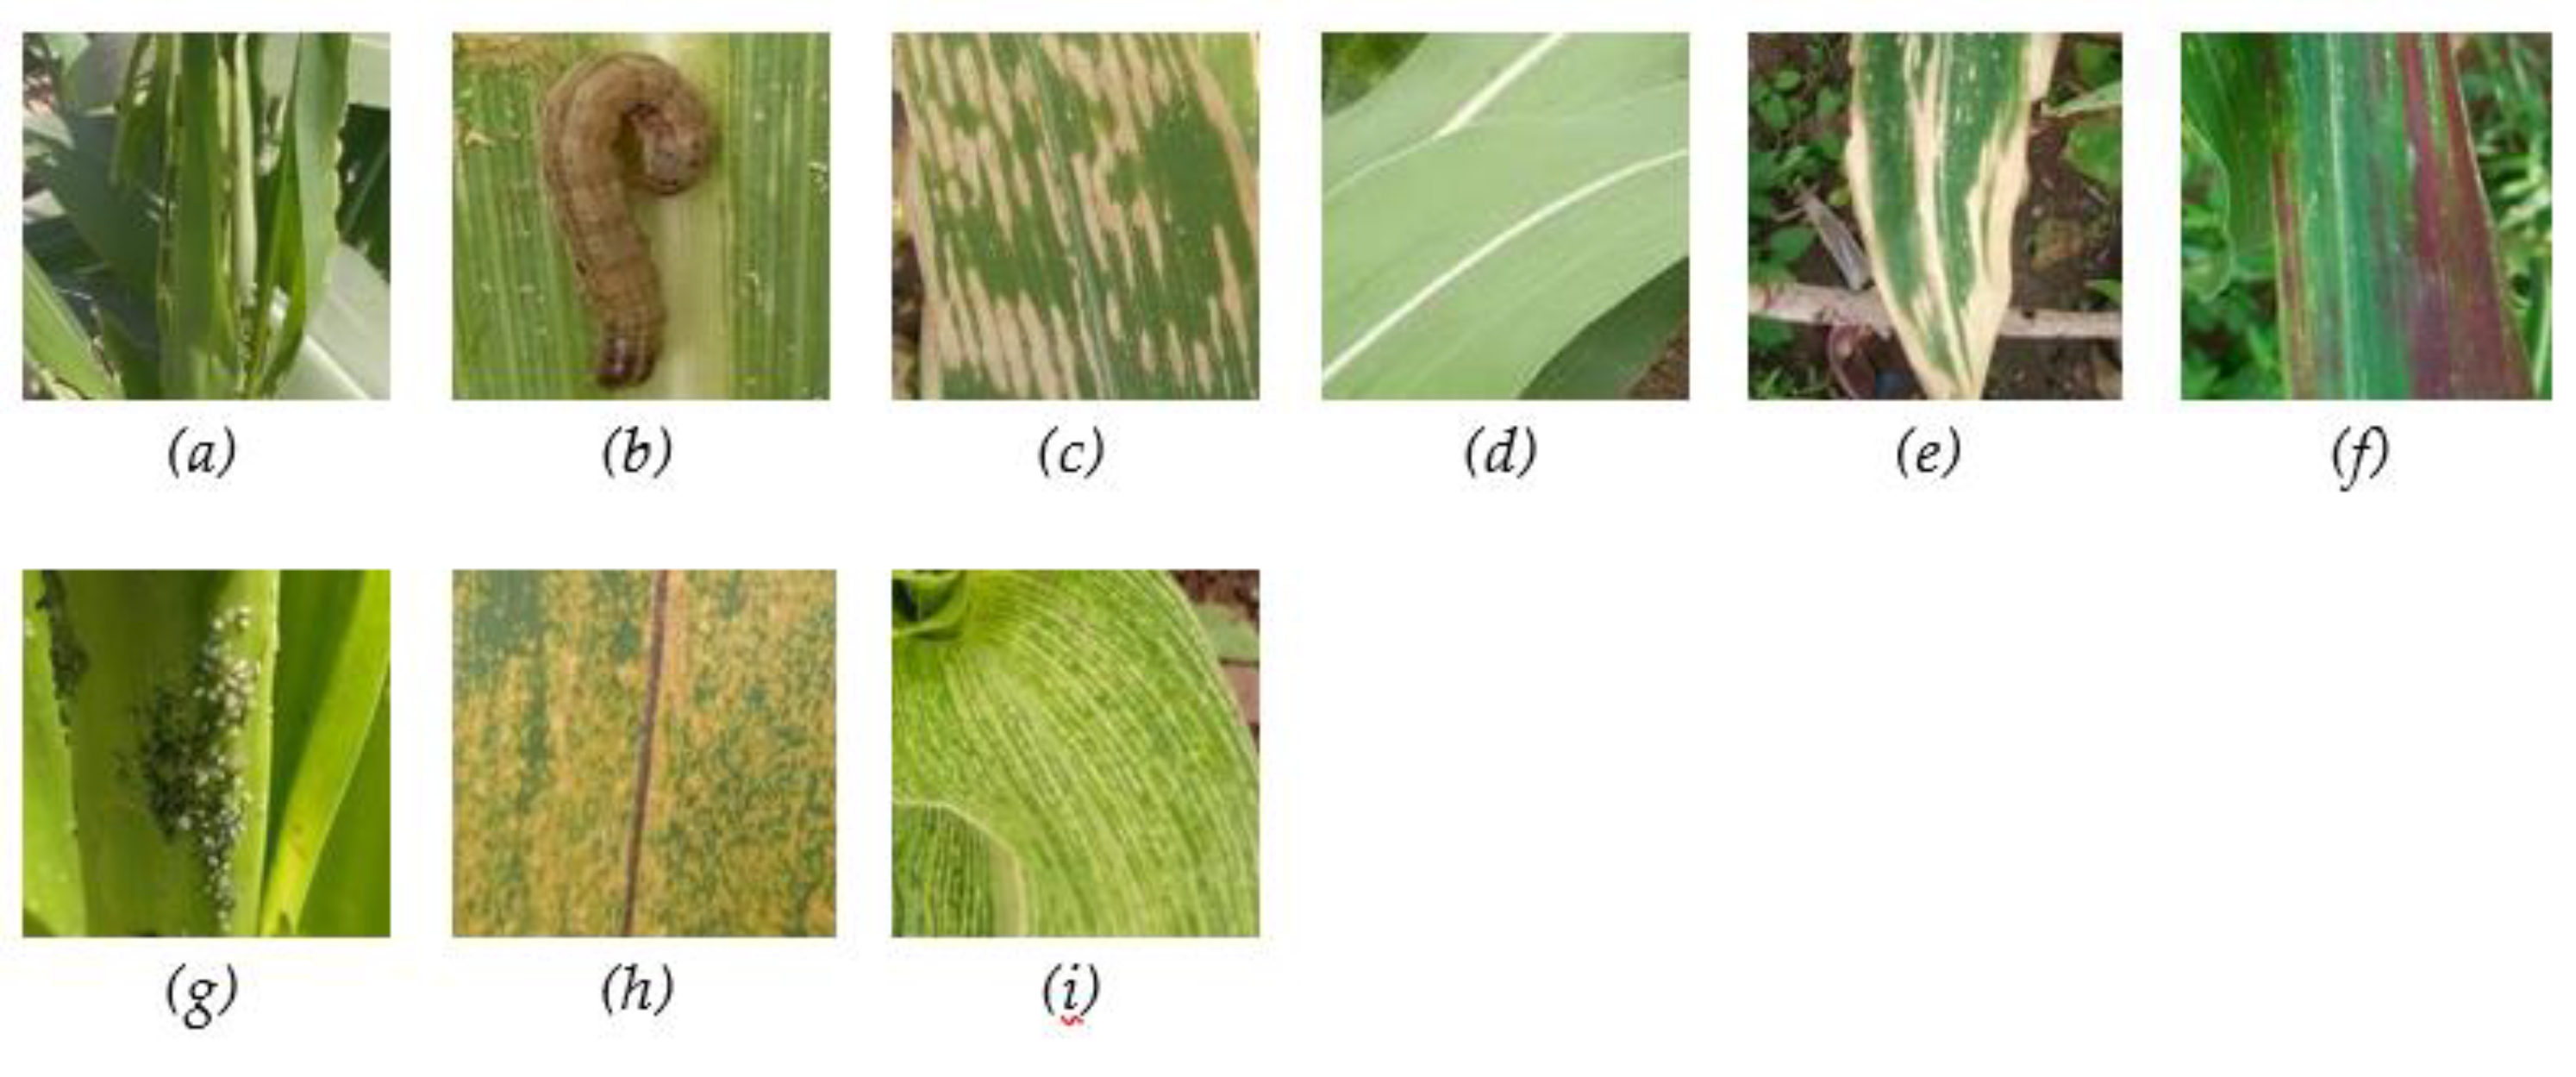
Figure 2.
Sample images from the tomato dataset ((a) acarien, (b) alternariose acarien, (c) alternariose, (d) coup du soleil, (e) exces d'azote, (f) feuille saine, (g) fusariose, (h) helicoverpa armigera, (i) flétrissement bactérien, (j) fruit sain, (k) mildiou de la tomate, (l) pourriture apicale, (m) tuta absoluta, (n) virose).
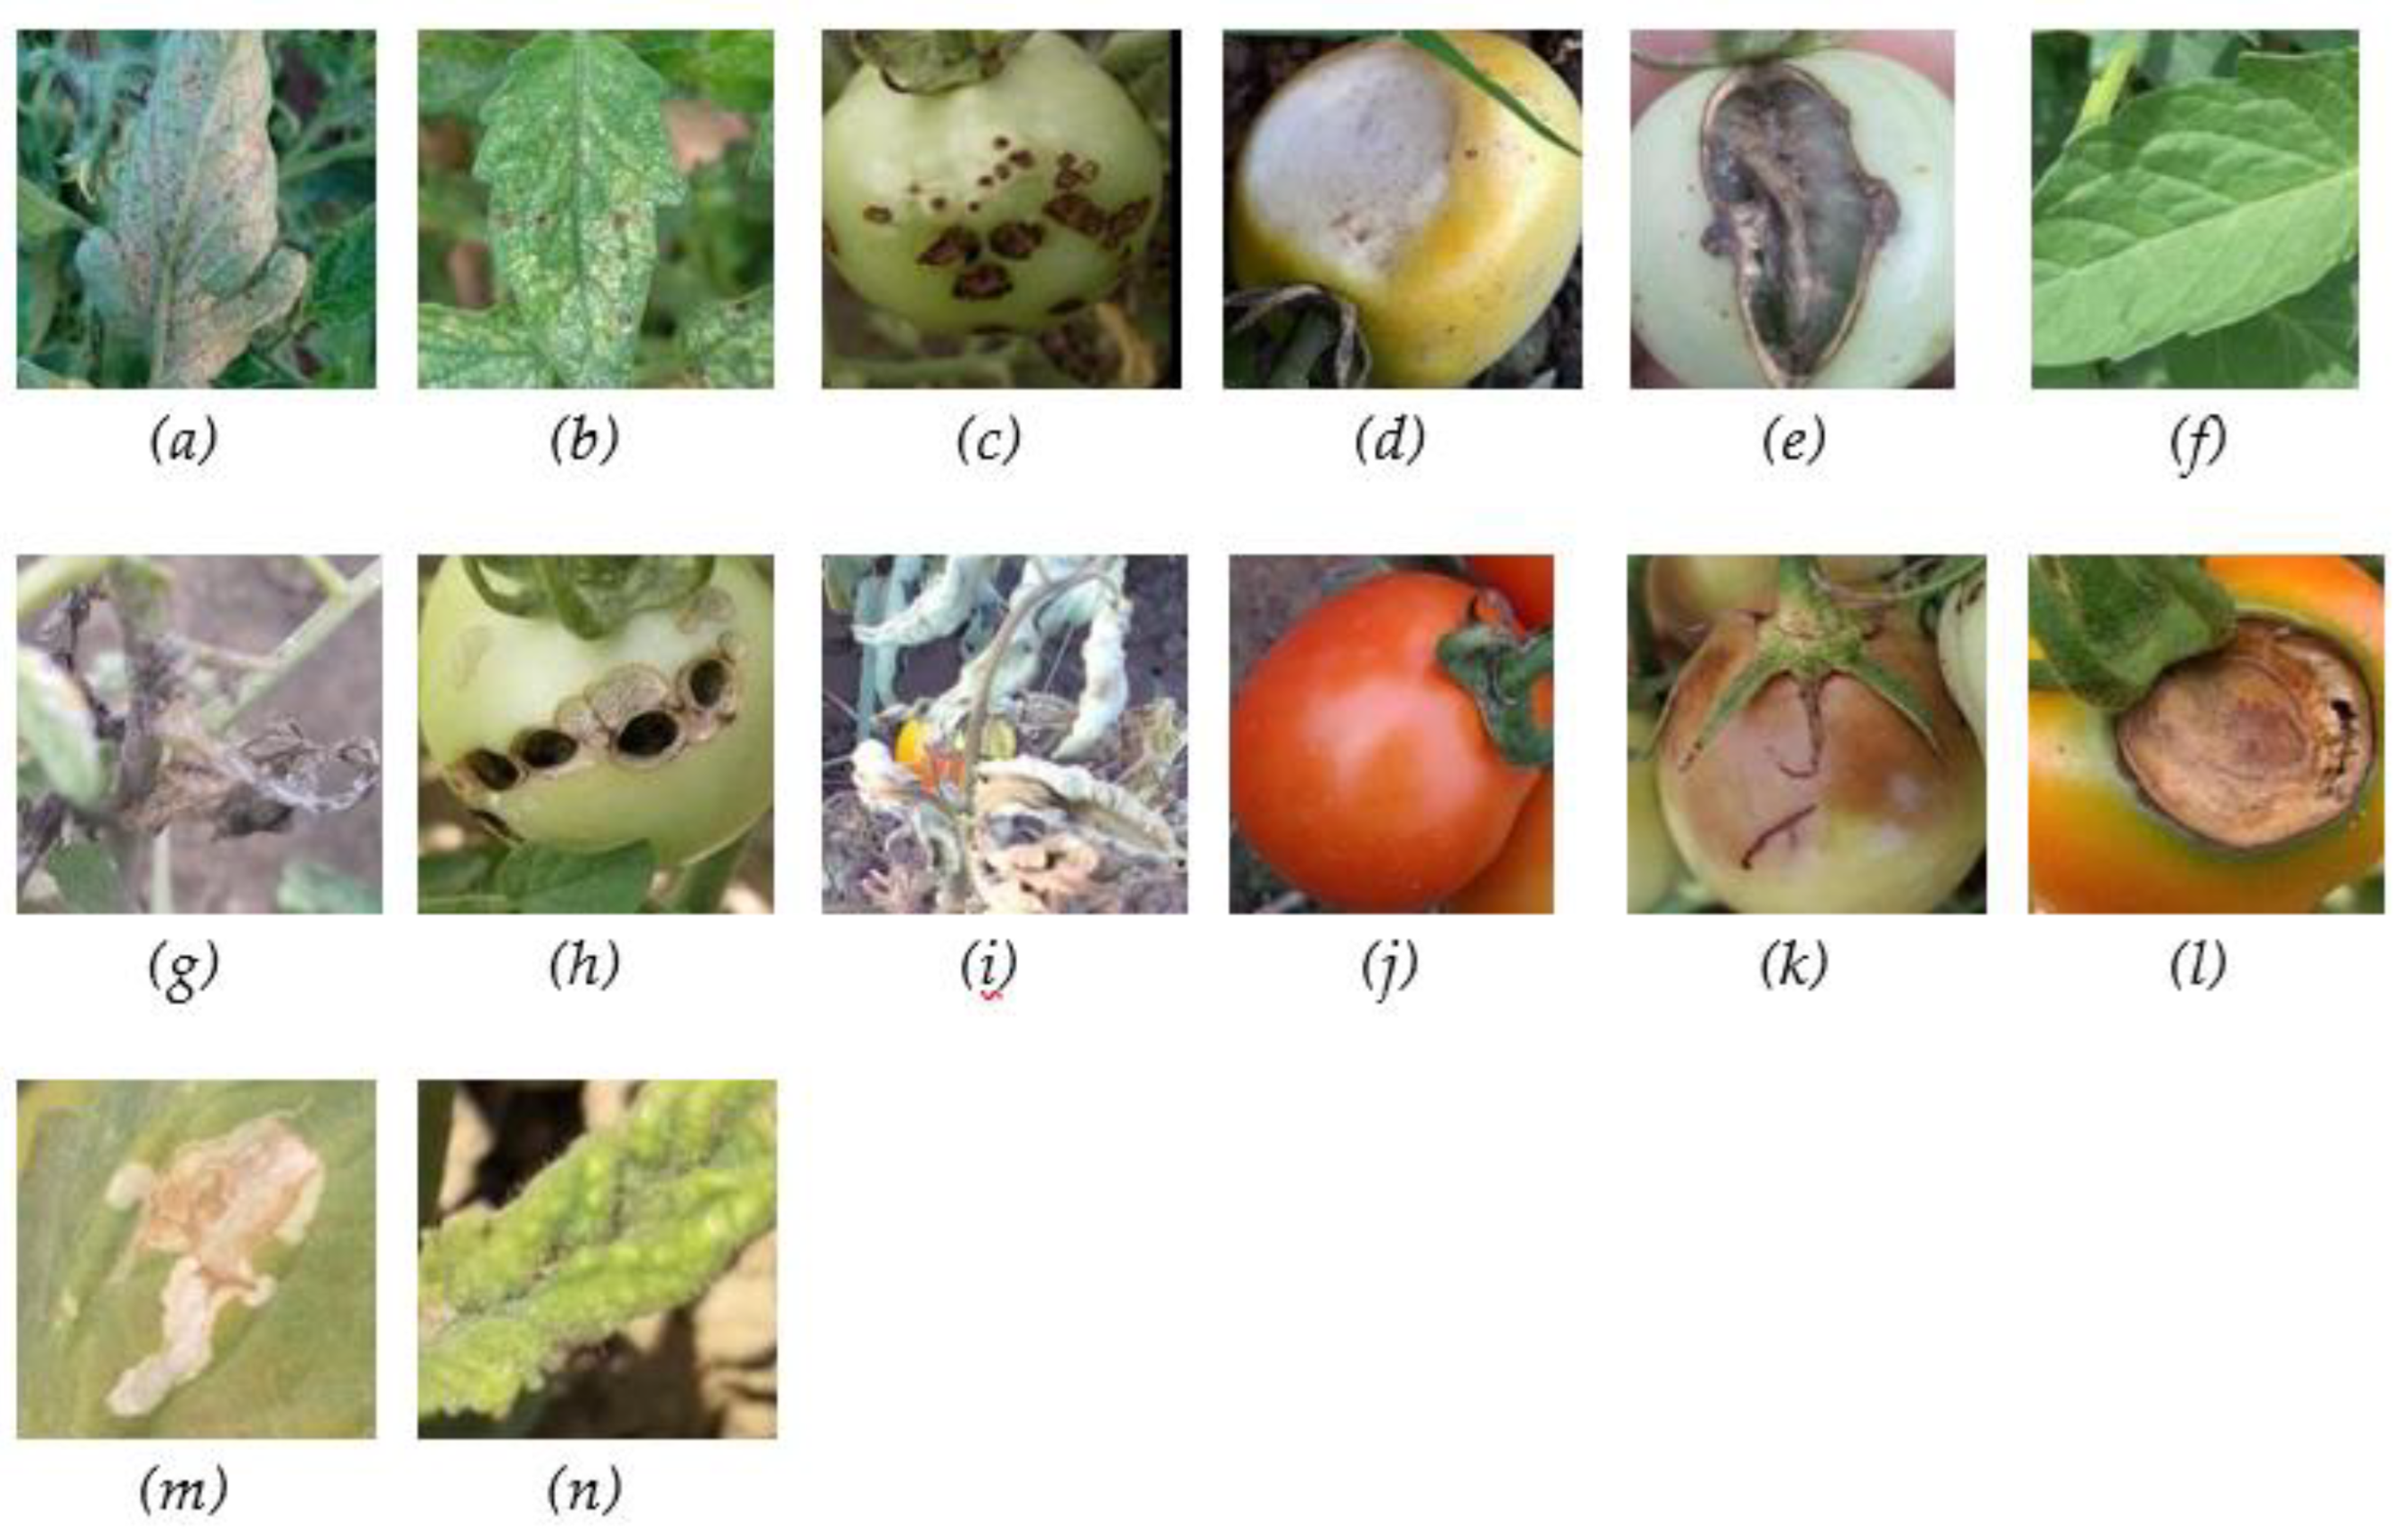
Figure 3.
Sample images from the Onion dataset ((a) alternariose, (b) chenilles, (c) feuille saine, (d) fusariose, (e) pourriture des bulbes, (f) virose).
Figure 3.
Sample images from the Onion dataset ((a) alternariose, (b) chenilles, (c) feuille saine, (d) fusariose, (e) pourriture des bulbes, (f) virose).
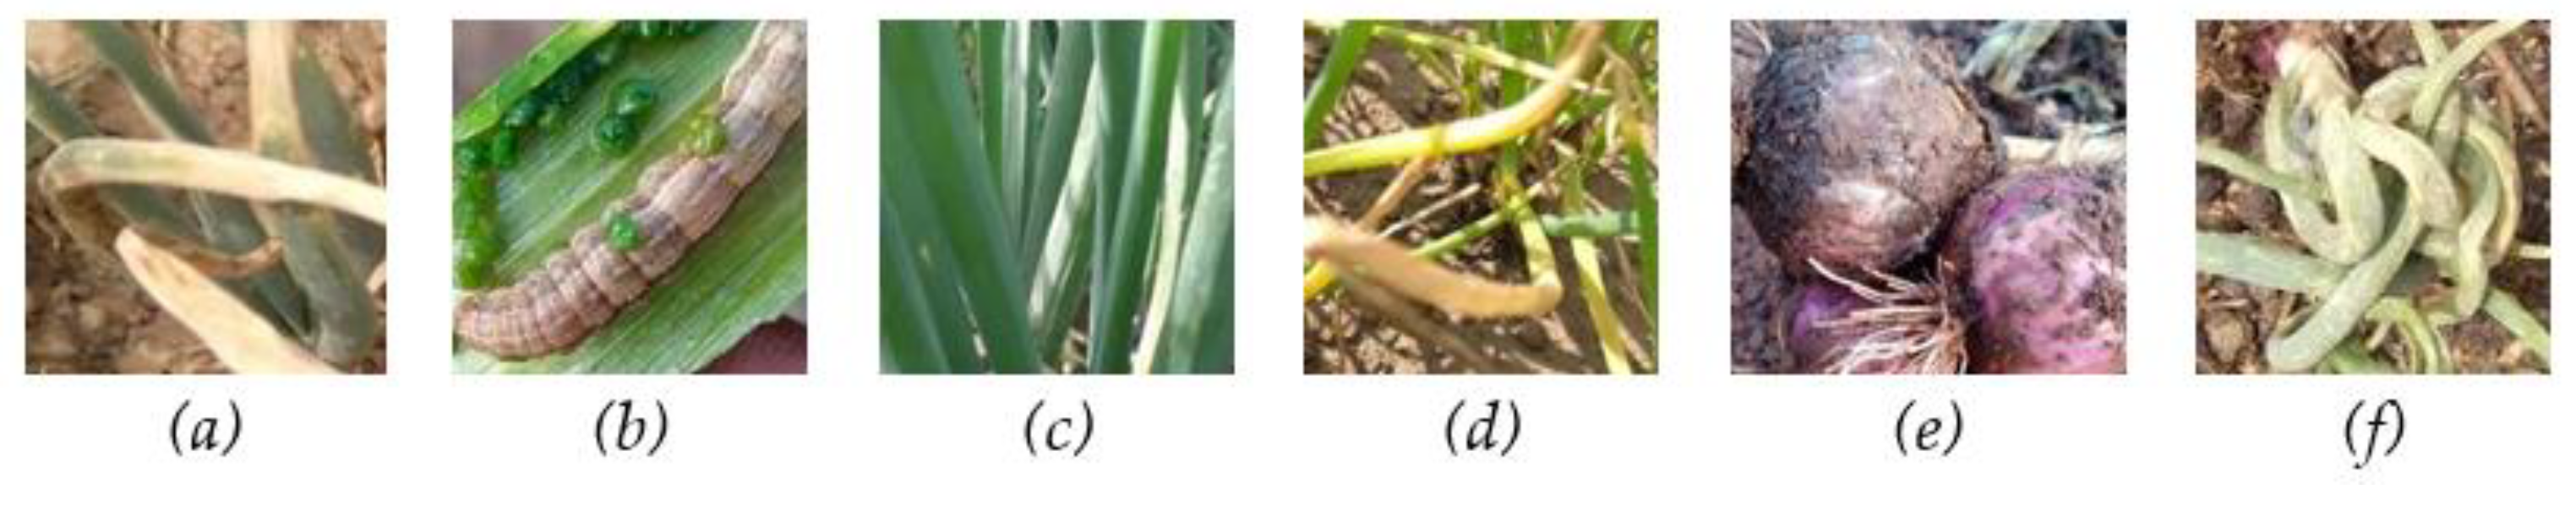
Figure 4.
Baseline Architecture (EfficientNetB3).
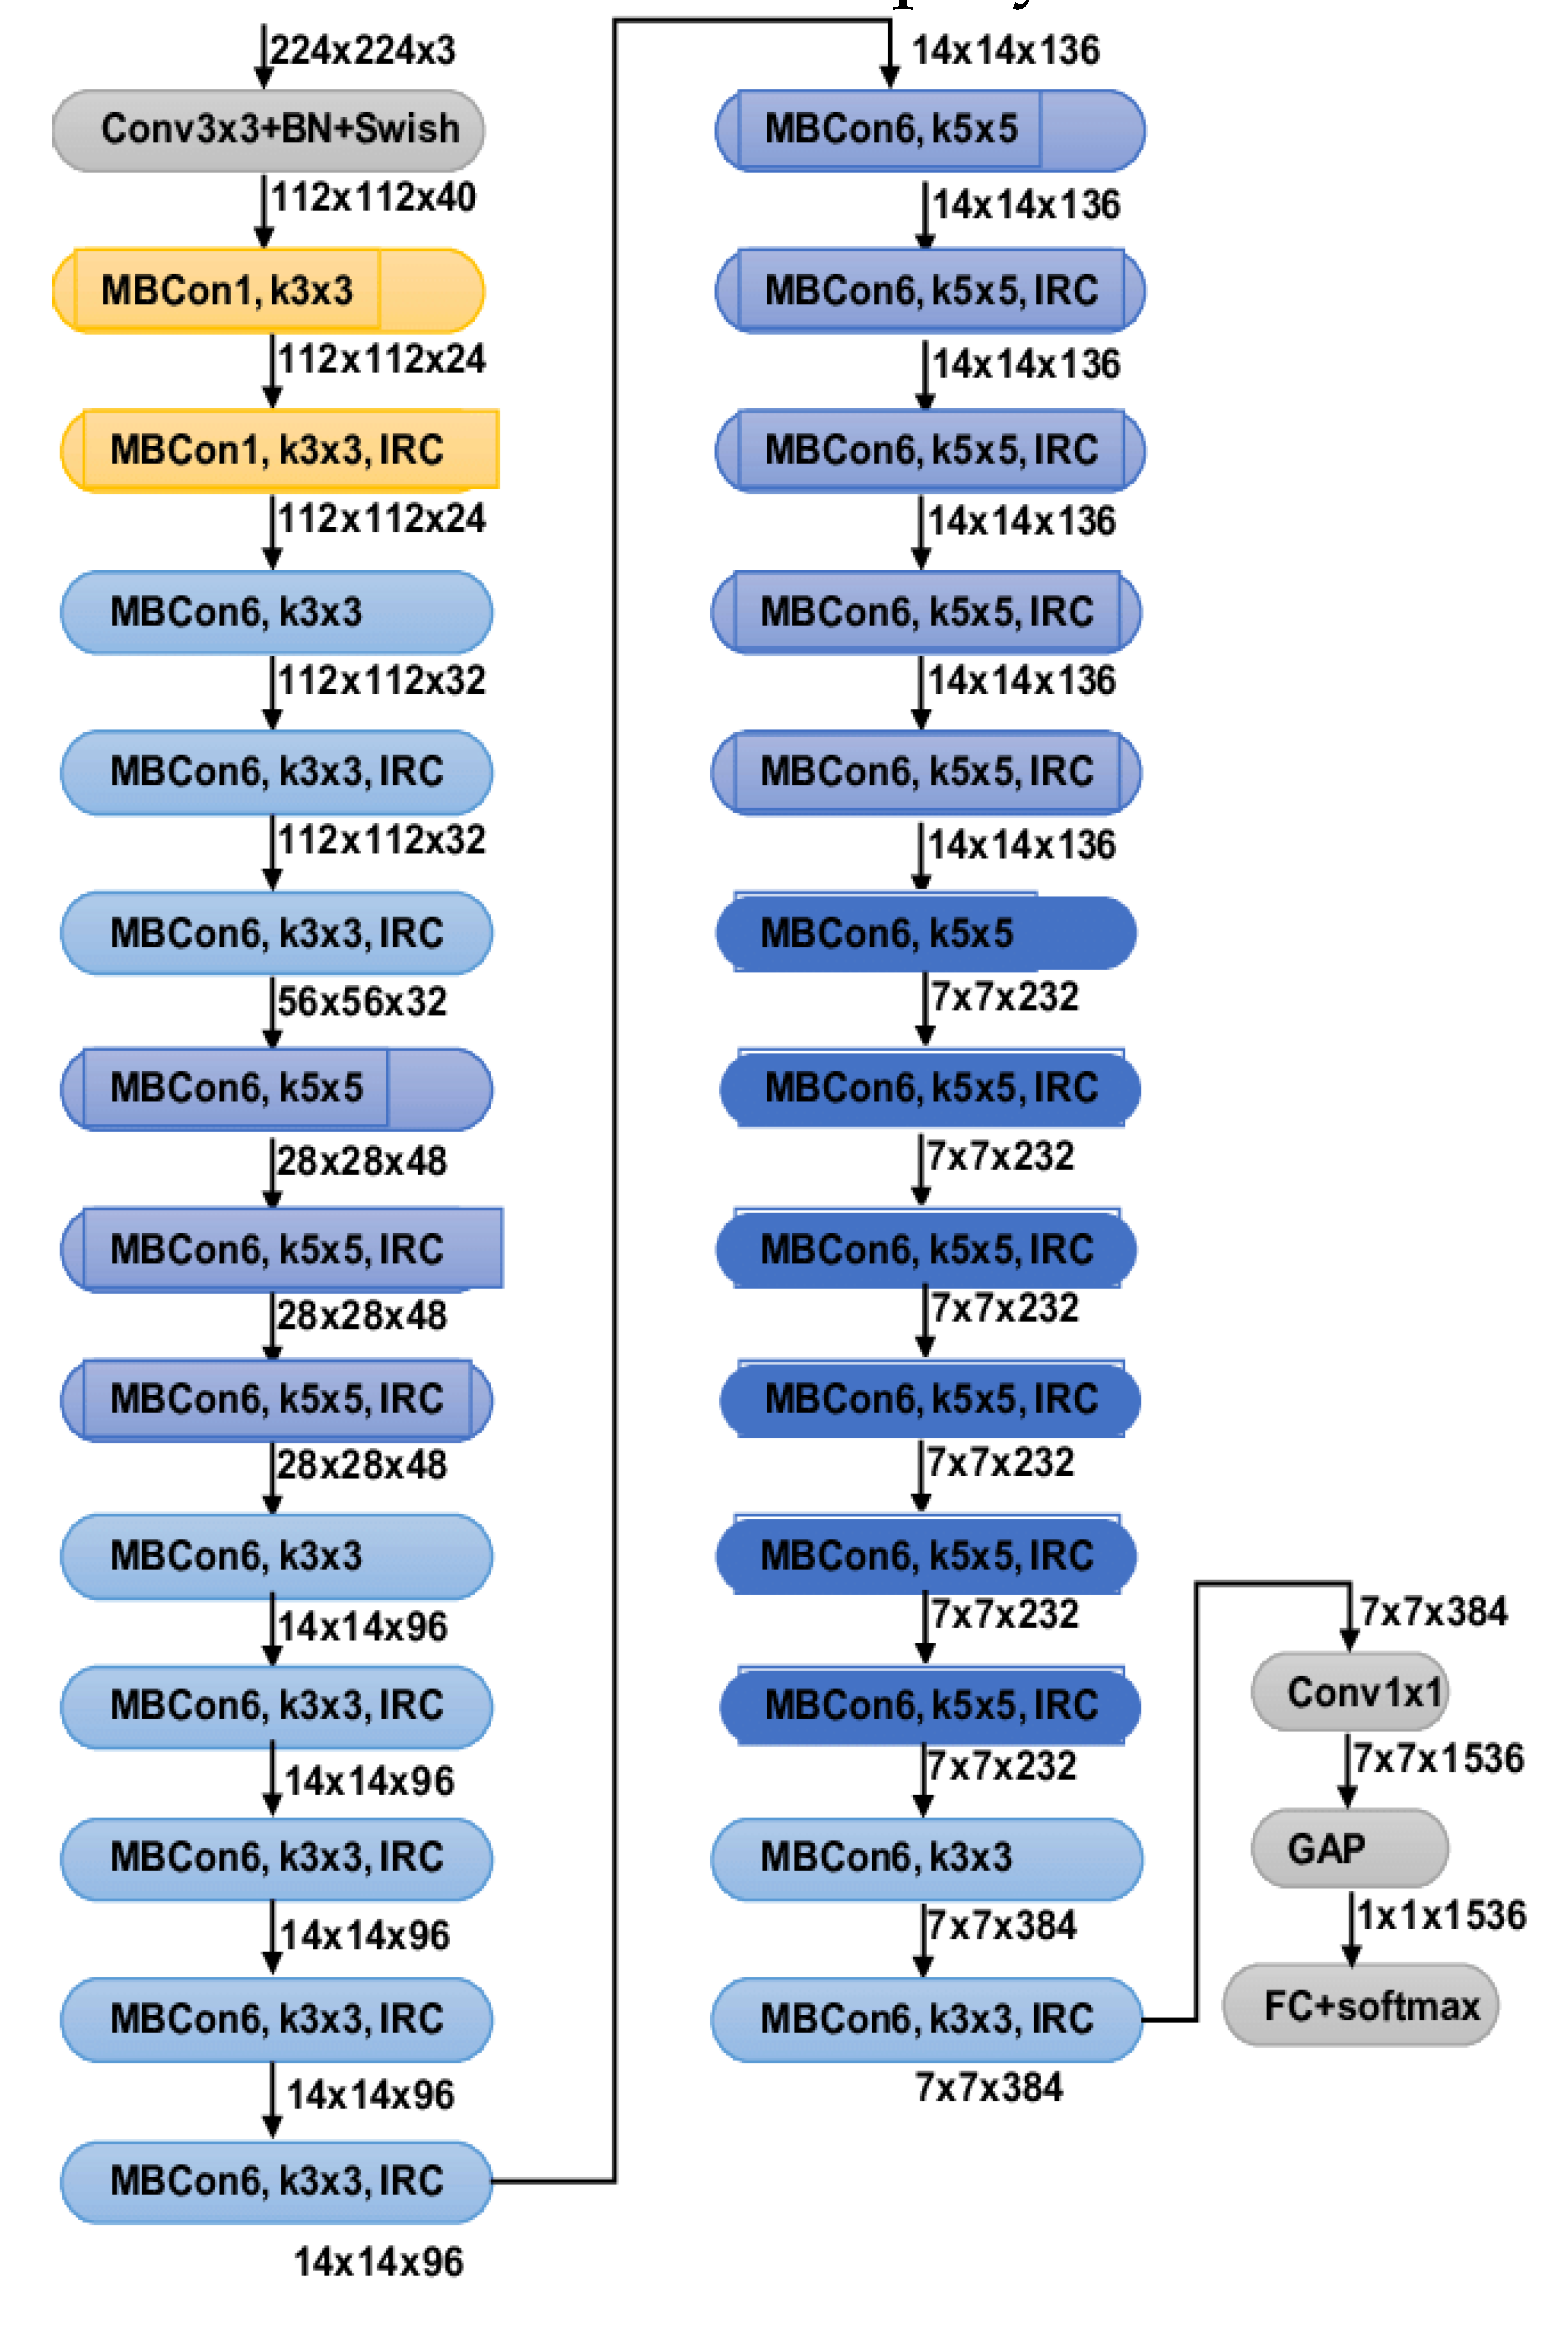
Figure 5.
Proposed Framework.
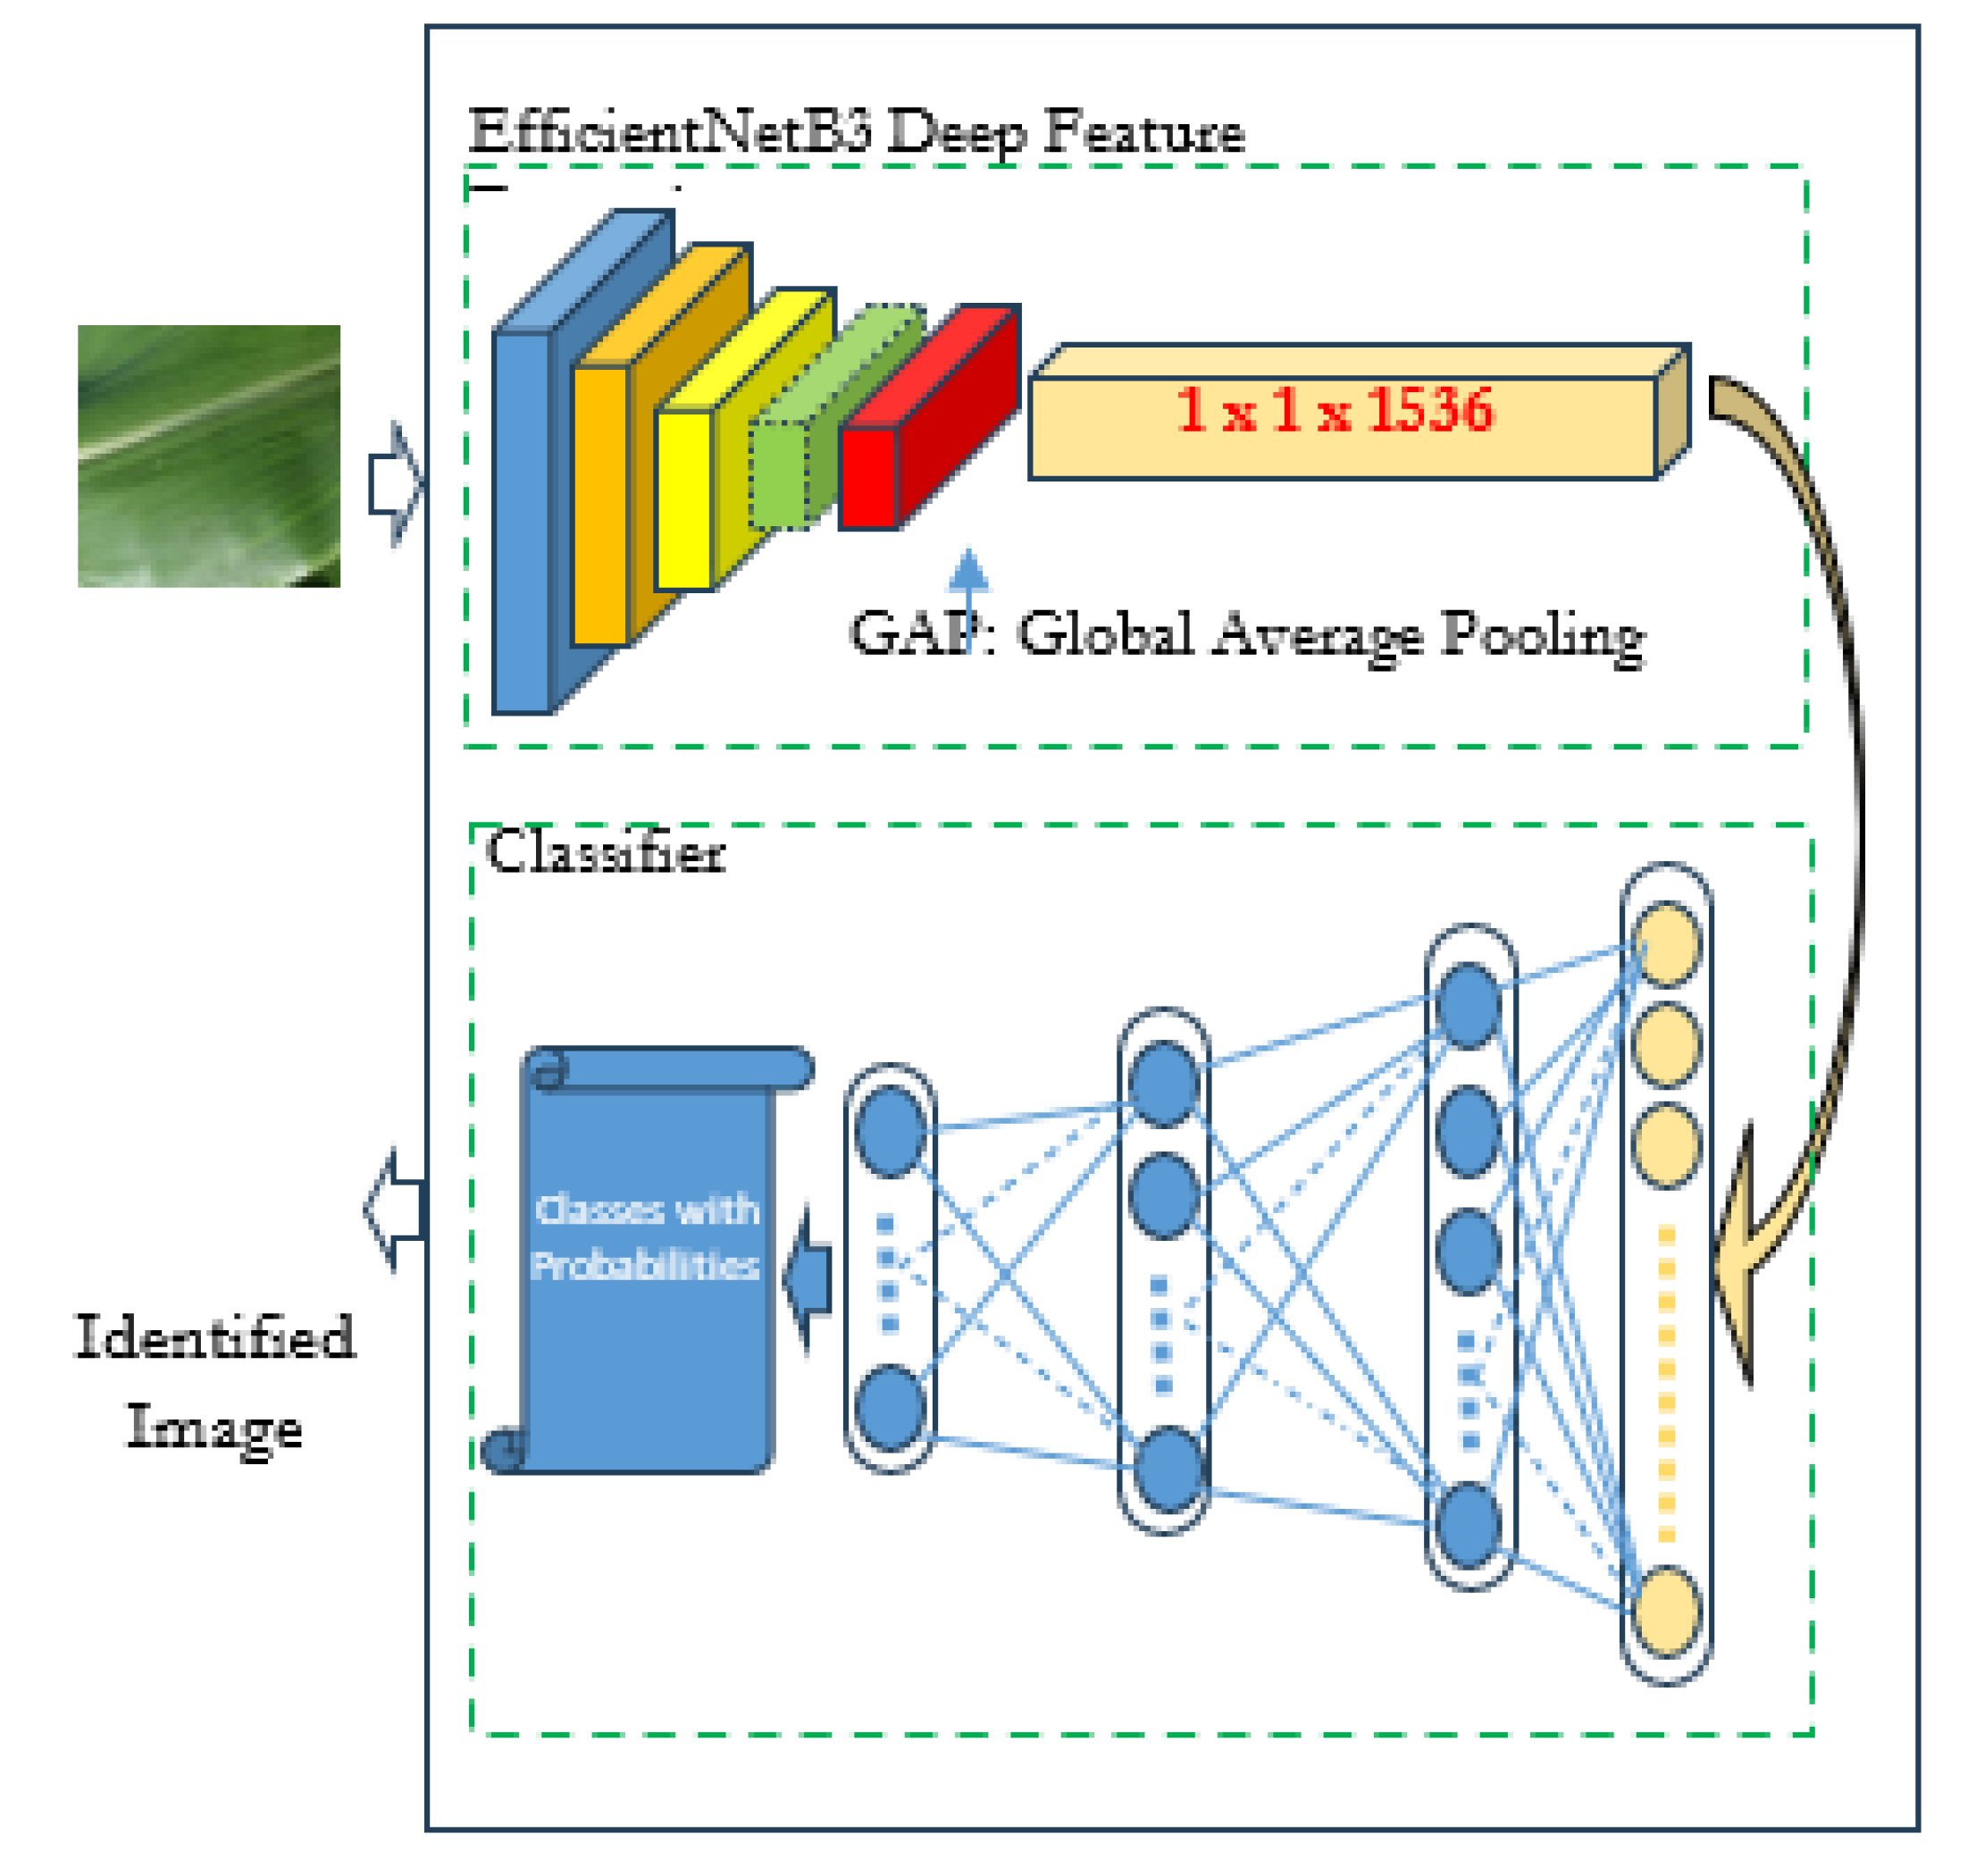
Figure 6.
Training and Validation Accuracy for Maize Classifier.
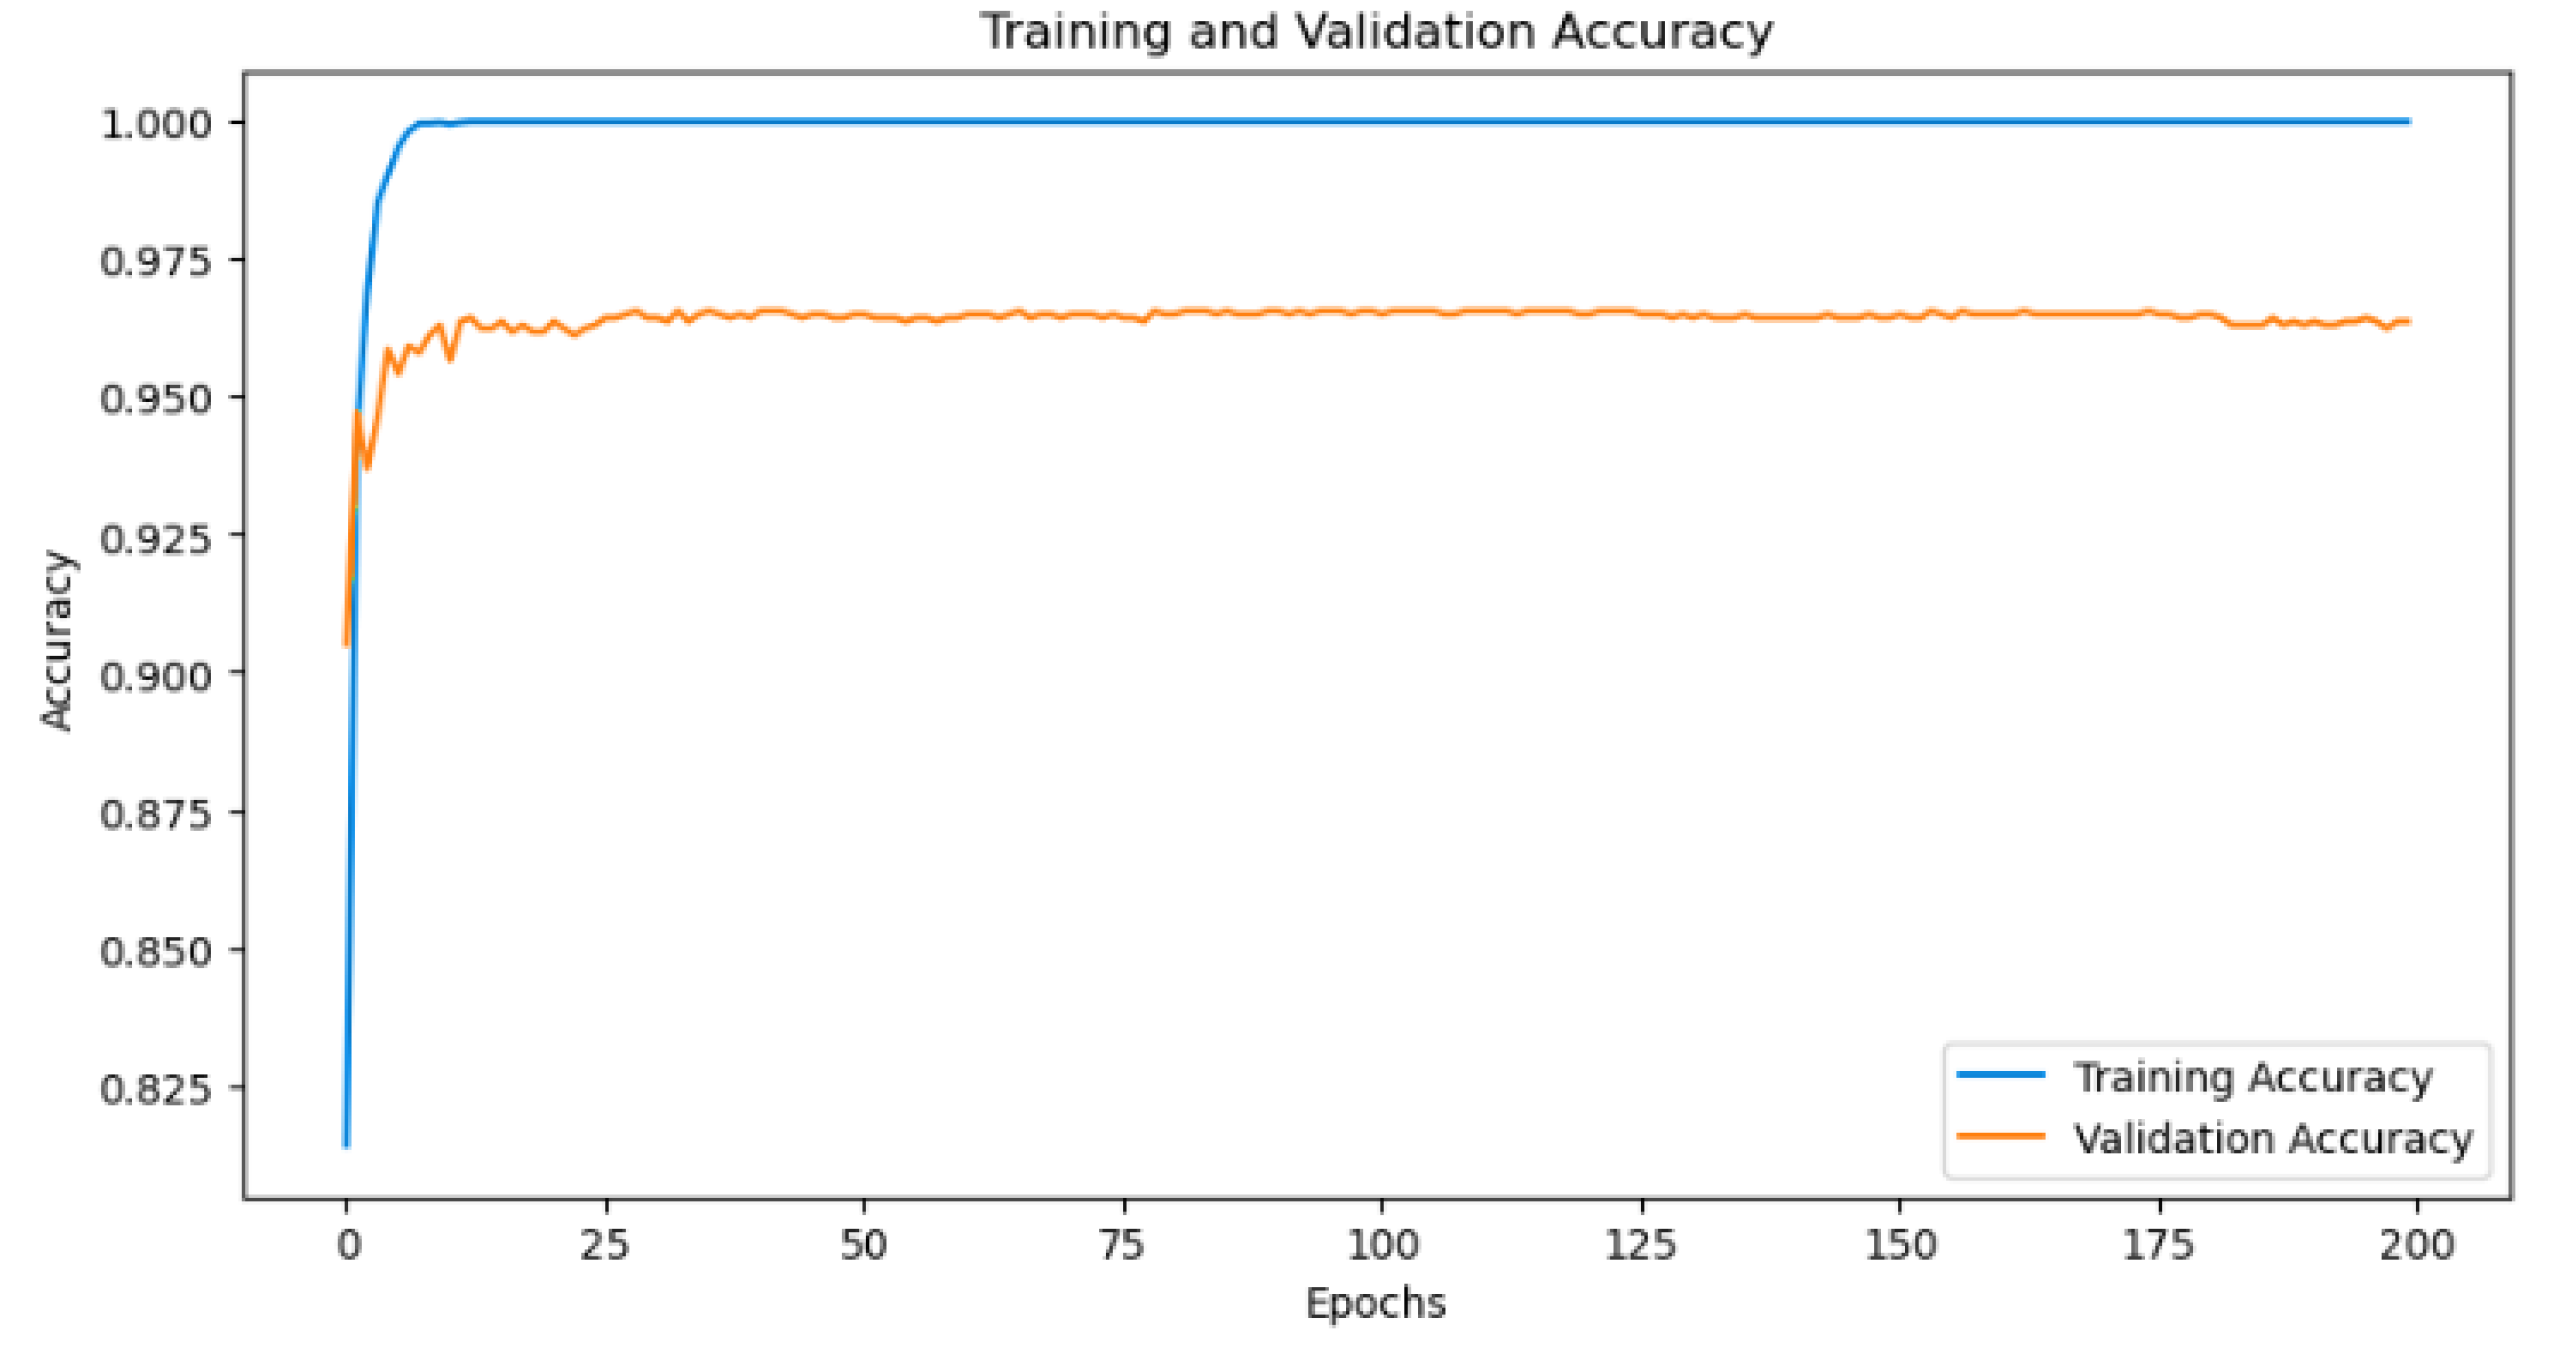
Figure 7.
Testing accuracies for each class in the Maize dataset (Average accuracy = 0.96).
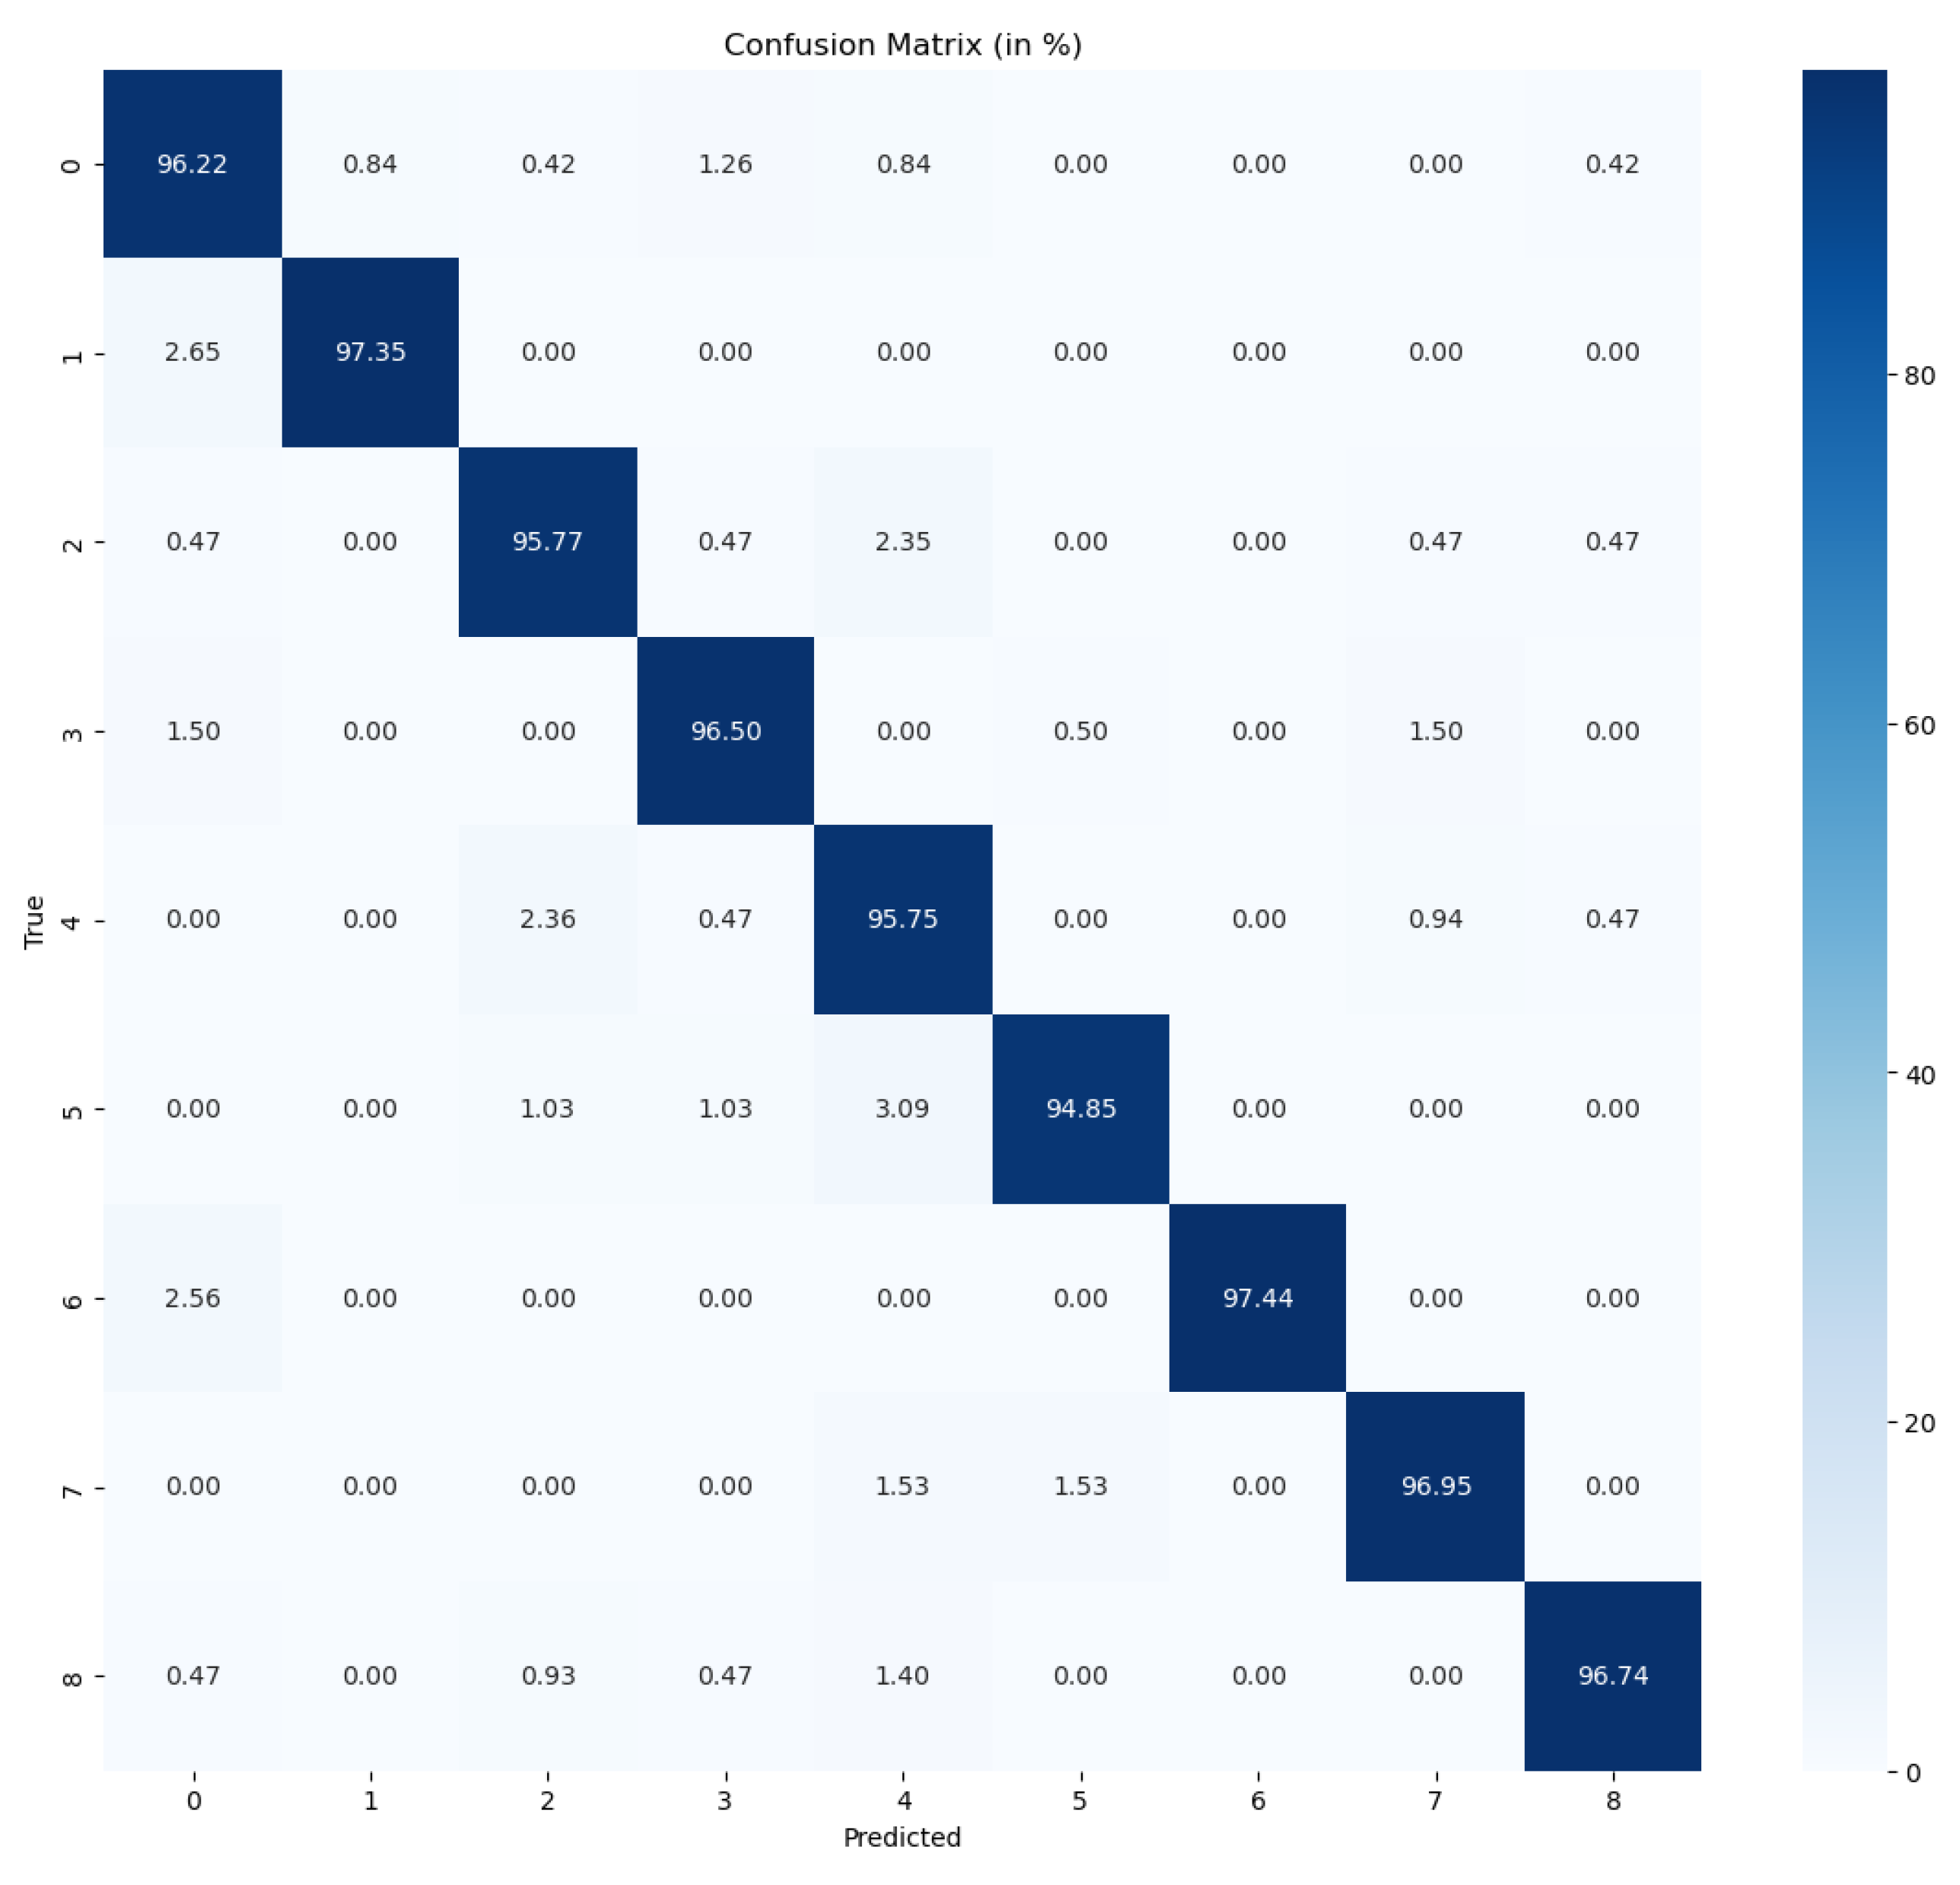
Figure 8.
Training and Validation Accuracy for Tomato Classifier.
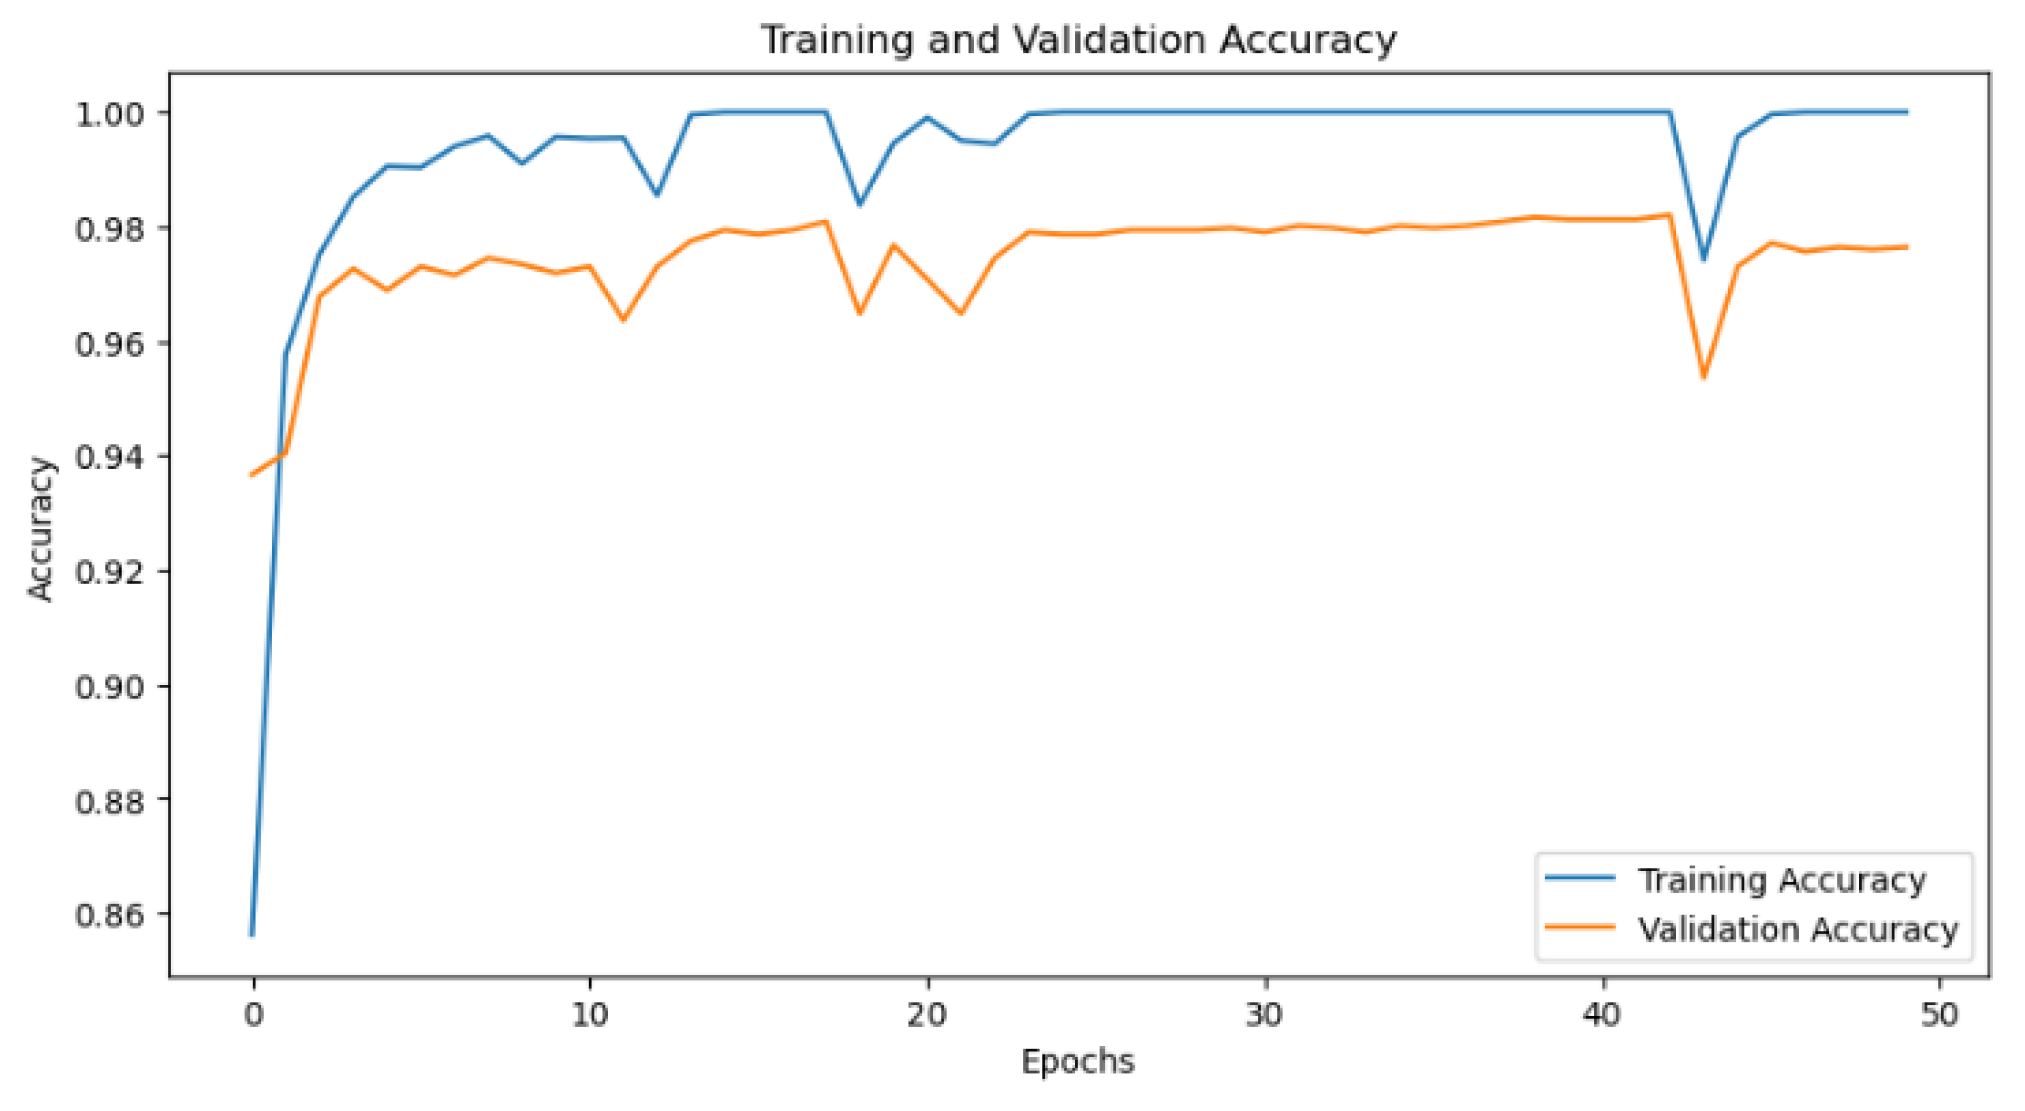
Figure 9.
Testing accuracies for each class in the Tomato dataset (Average accuracy = 0.98).
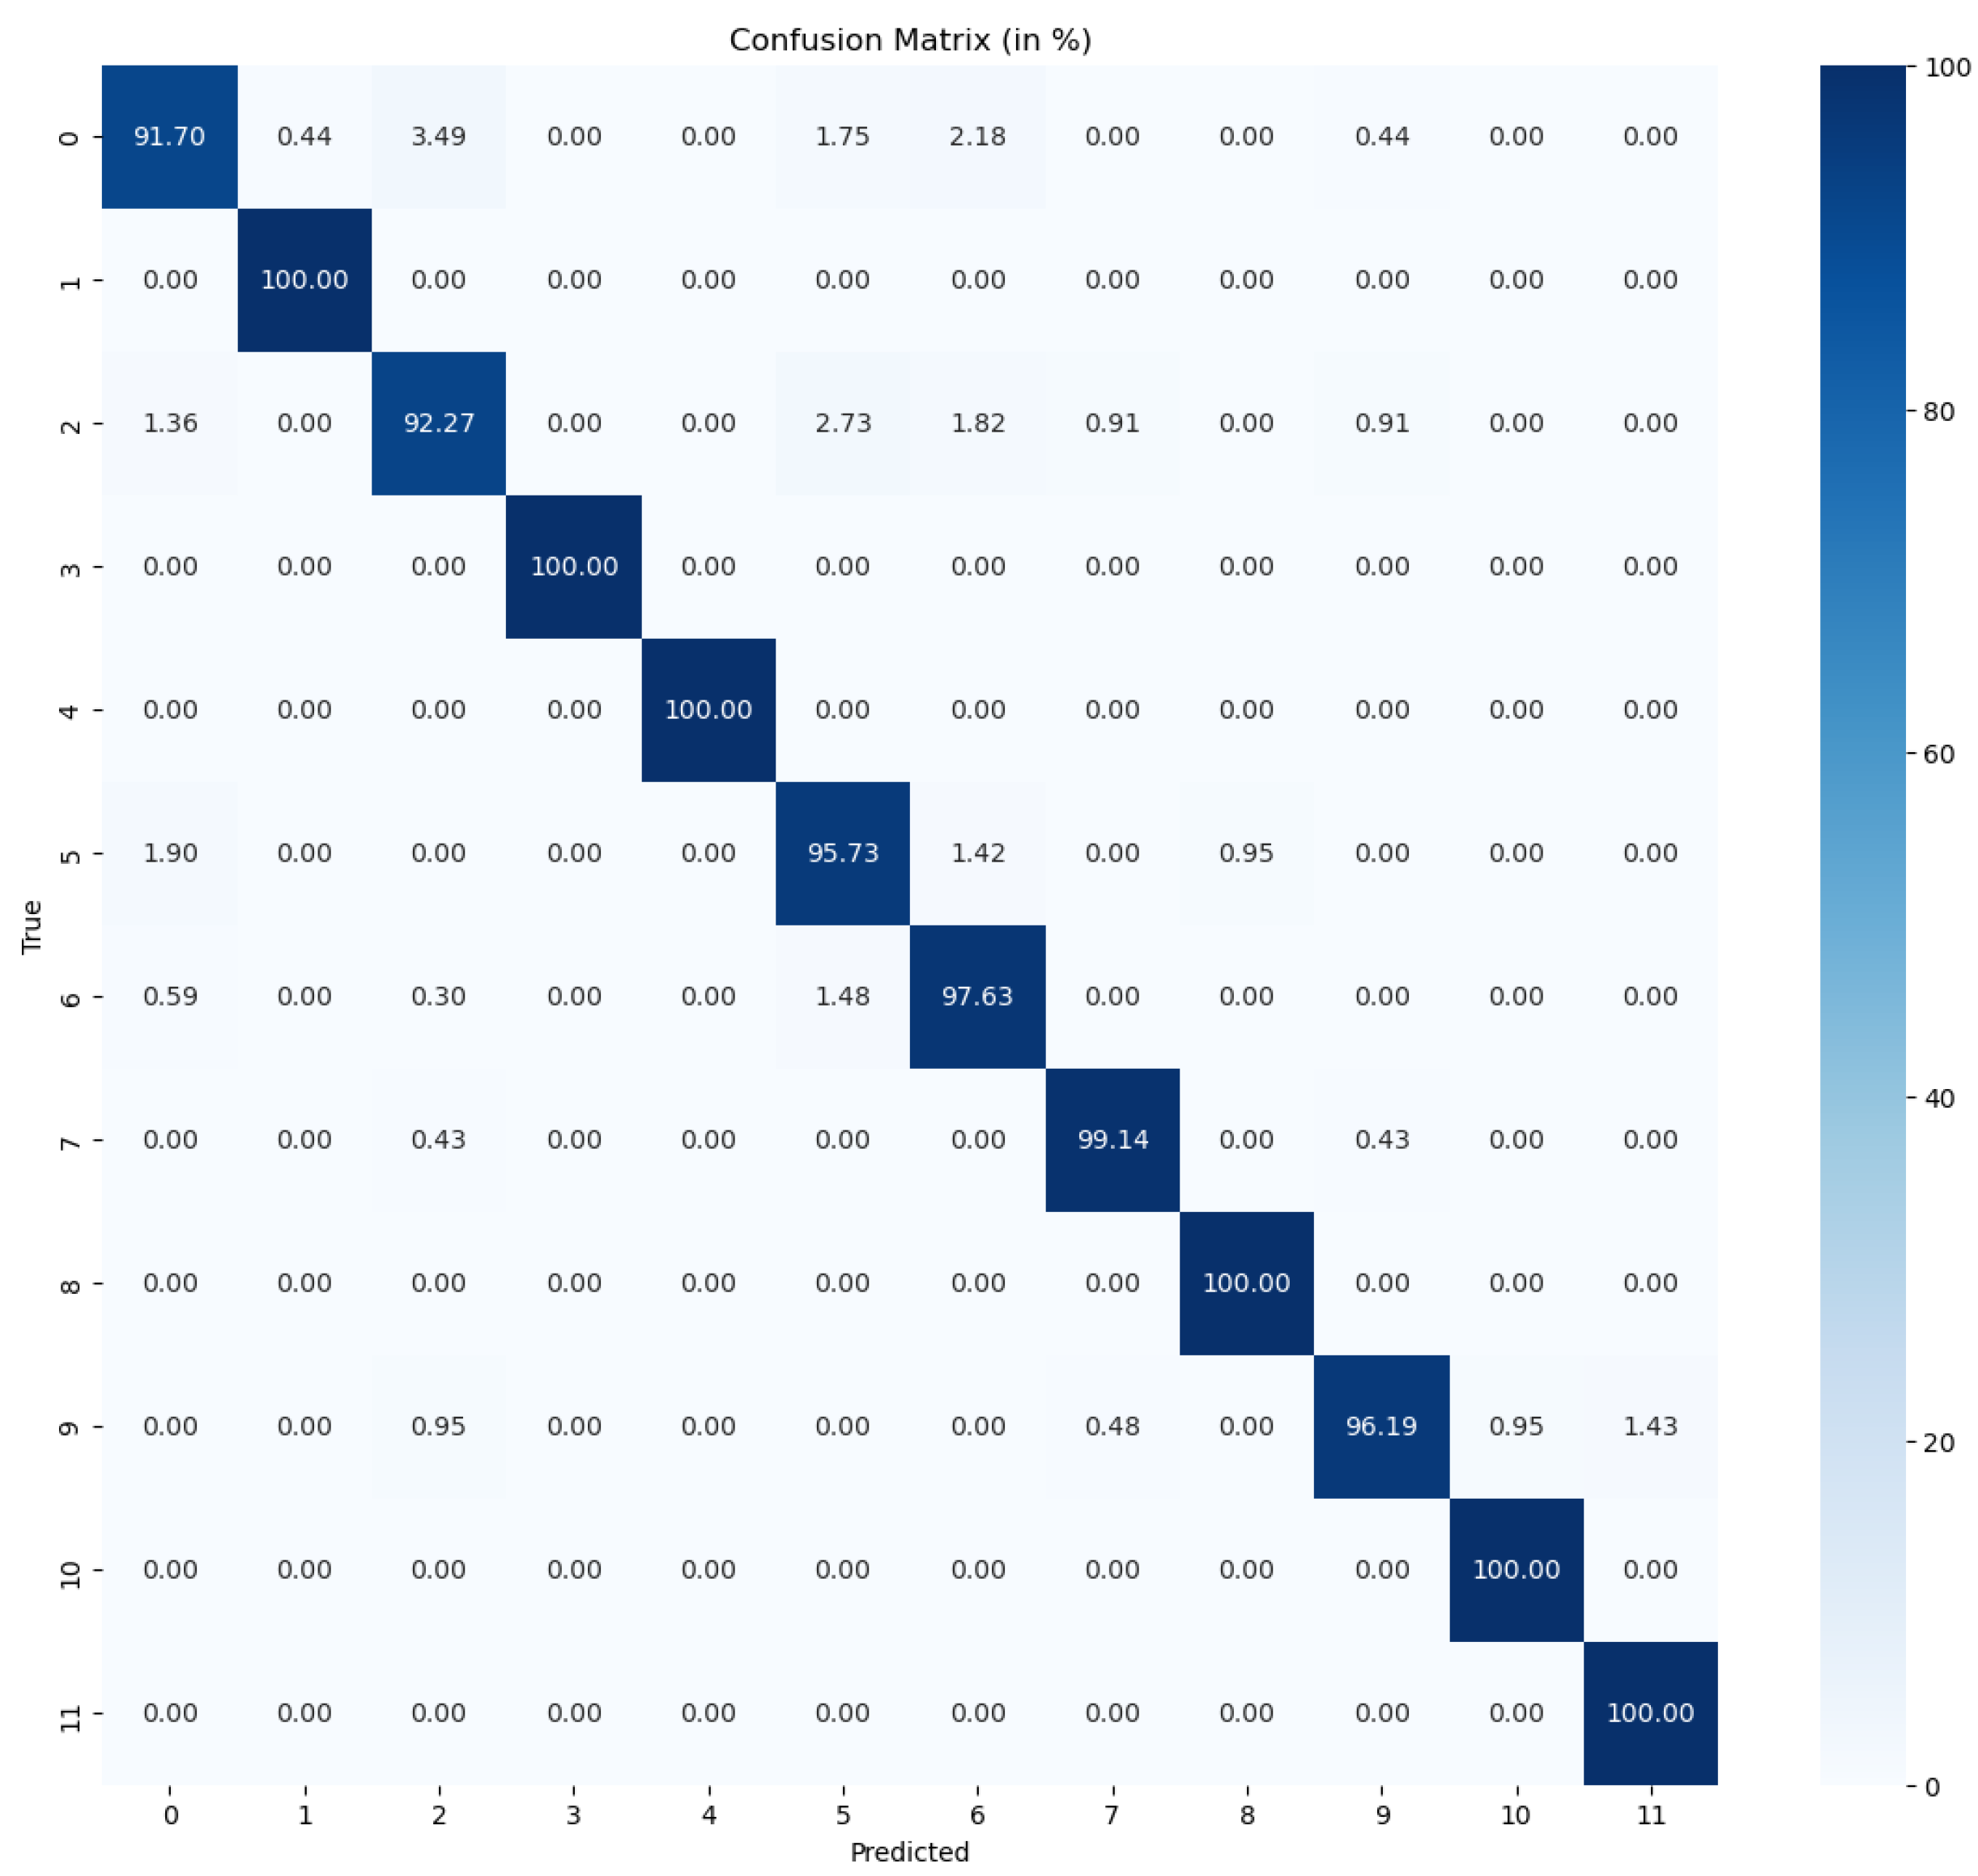
Figure 10.
Training and Validation Accuracy for Tomato Classifier.

Figure 11.
Testing accuracies for each class in the Onion dataset (Average accuracy = 0.96).
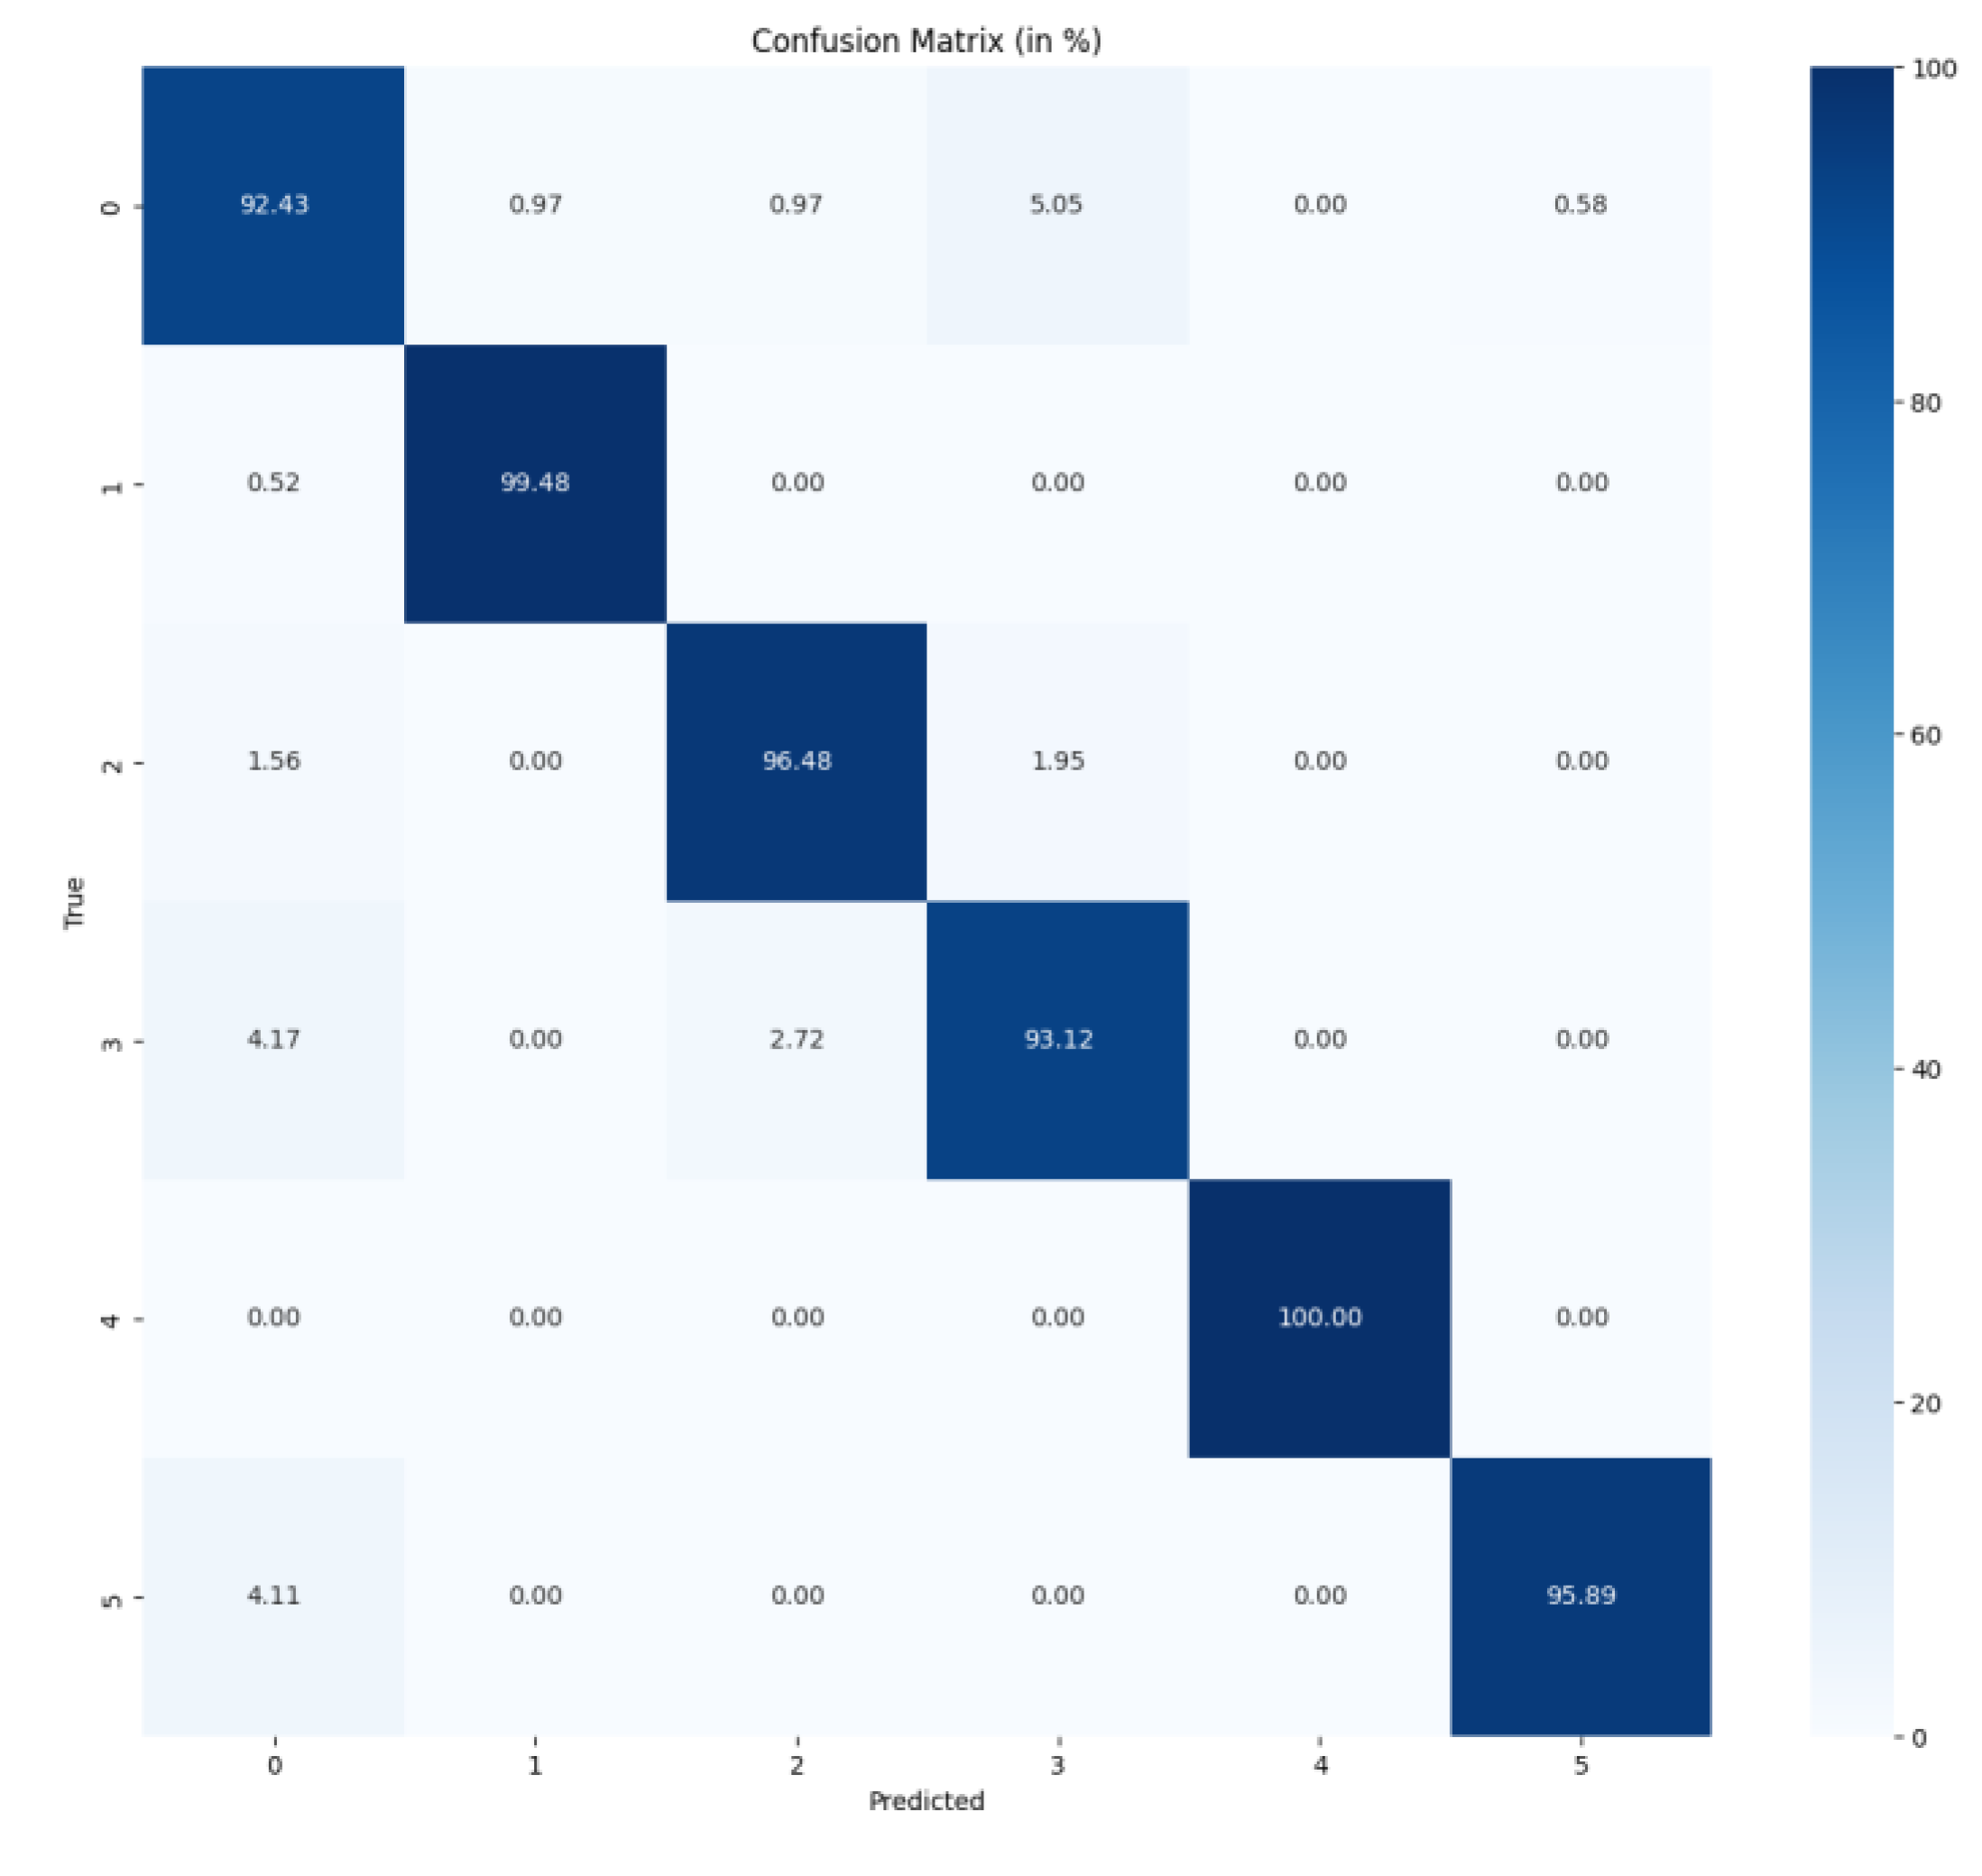
Figure 12.
A demonstration of the two modes of submitting images for. PlanteSaine to classify.
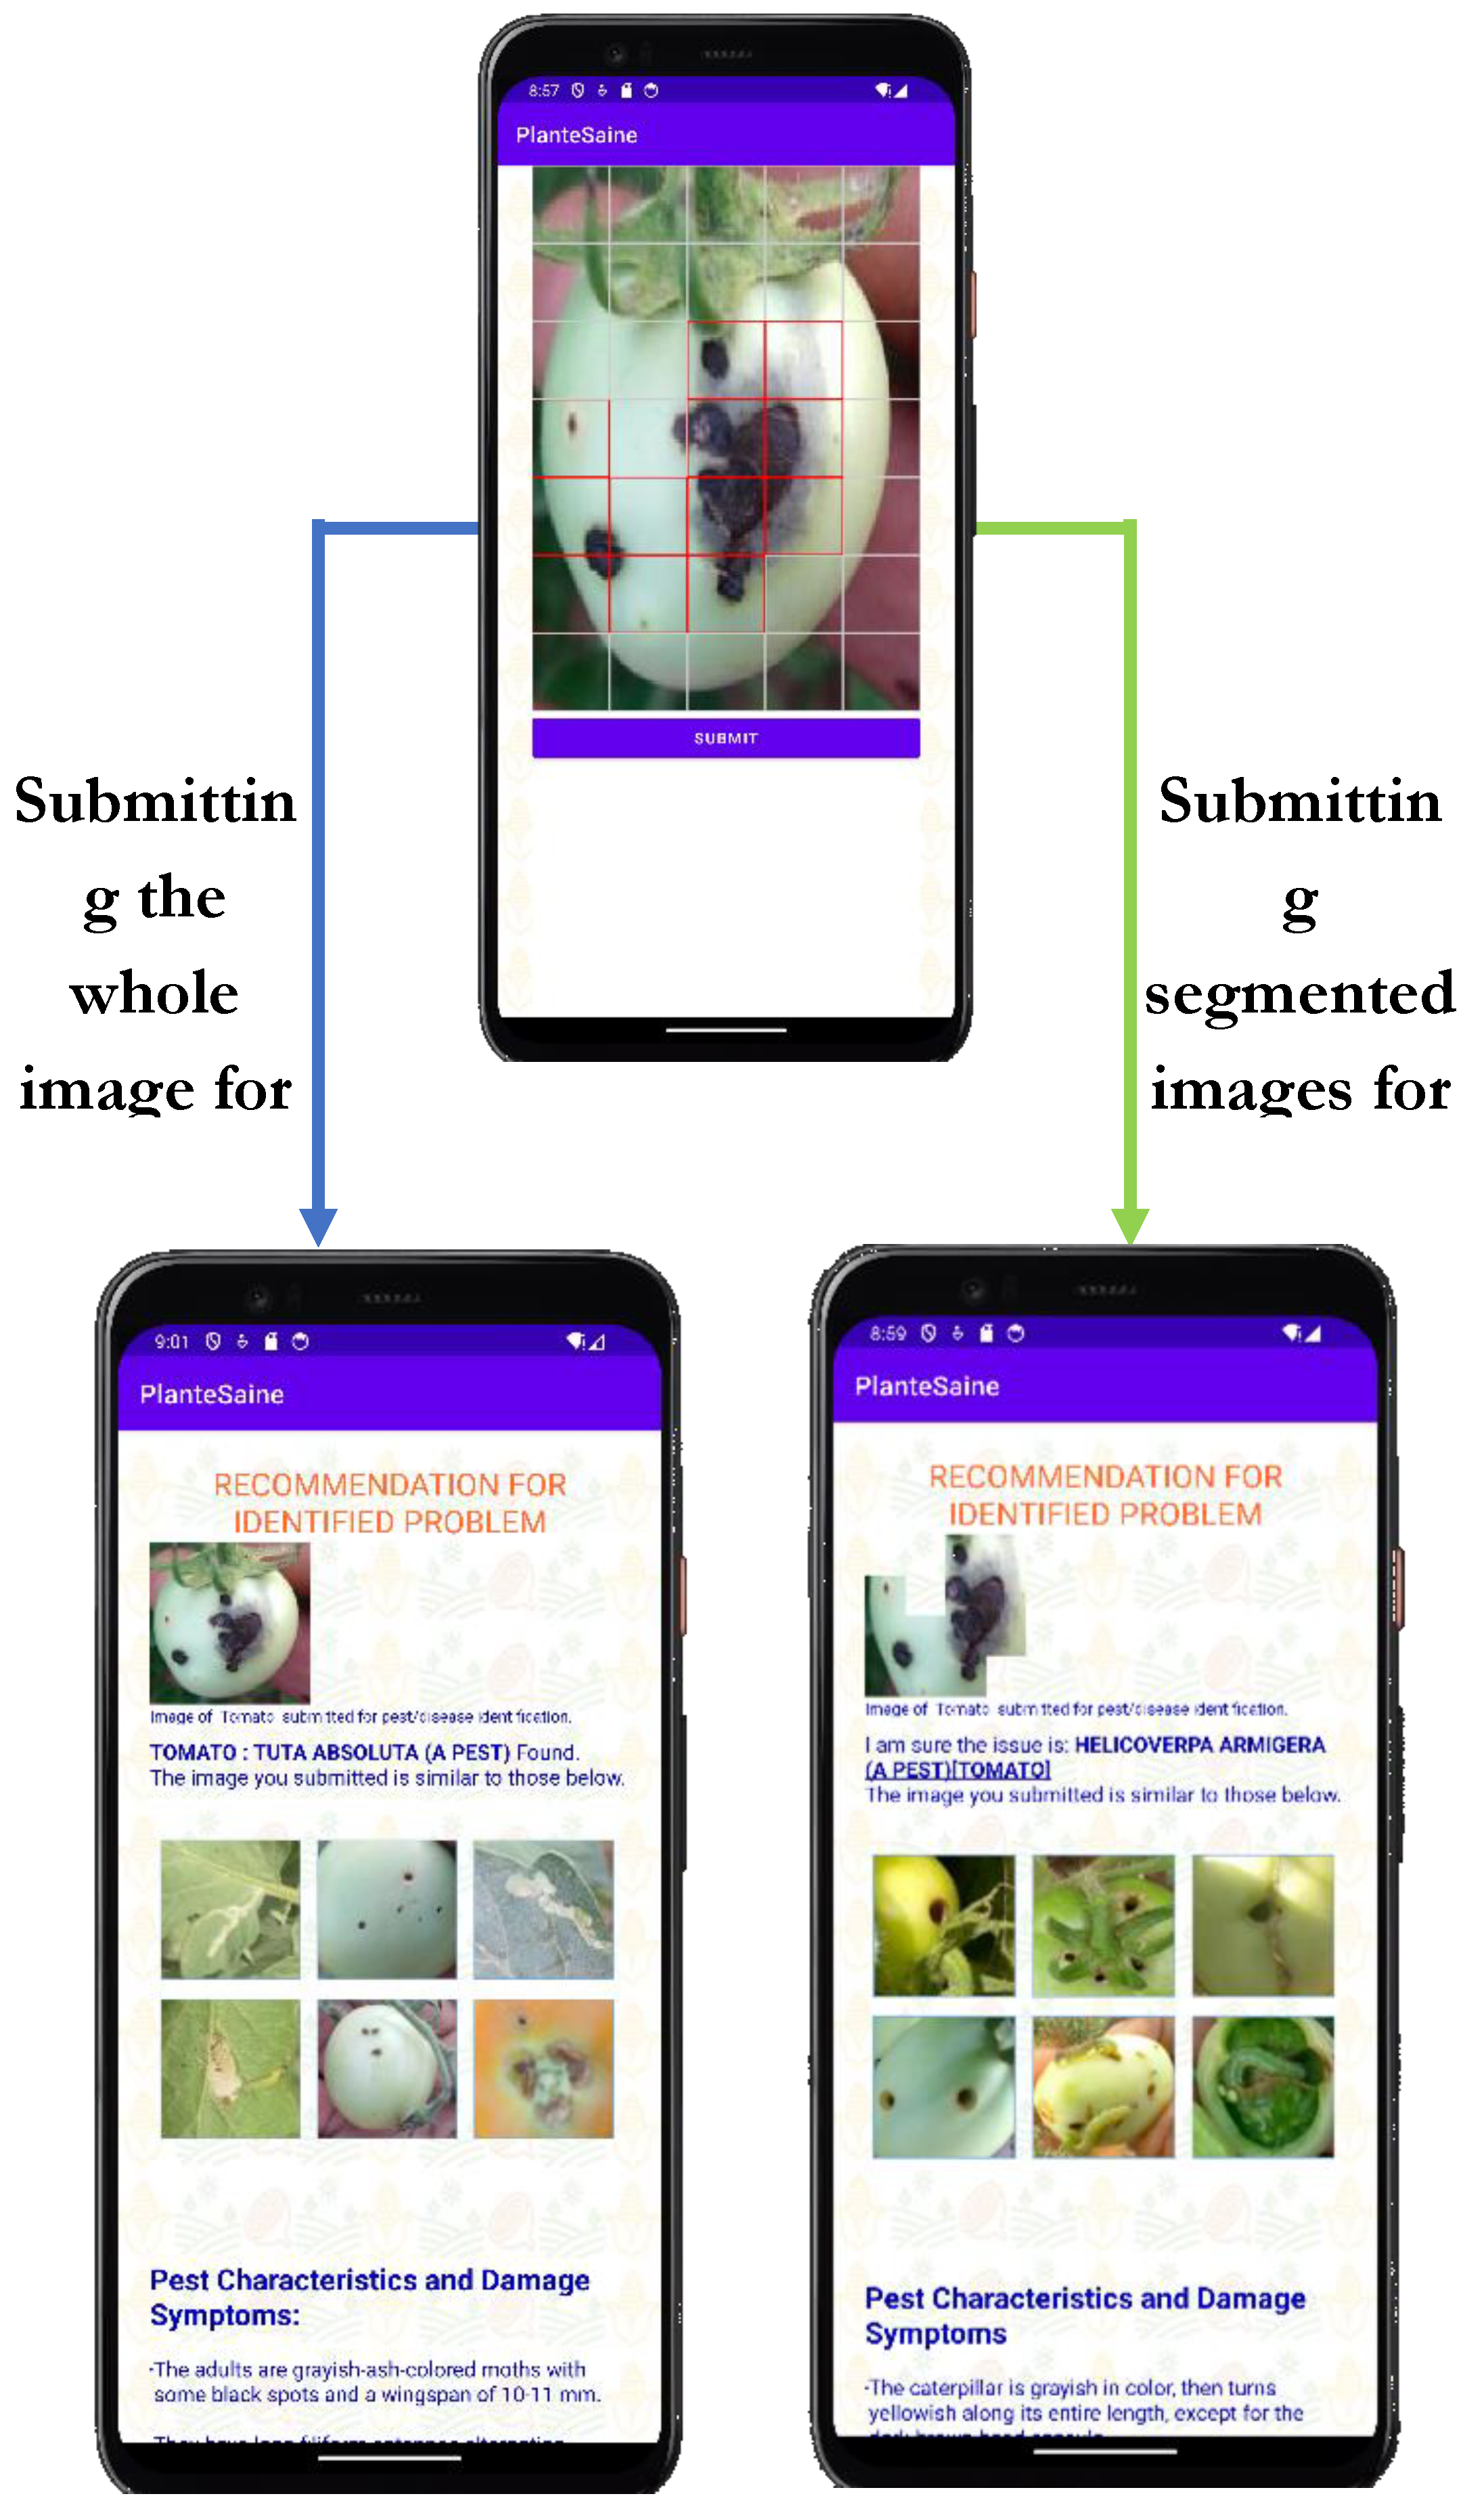

Table 1.
Image Augmentation Techniques.
| Generator | Parameter / Formula |
|---|---|
| Rotation range | 15 |
| Width shift range | 0.1 |
| Height shift range | 0.1 |
| Brightness range | [0.5, 1.5] |
| Horizontal flip | True |
| Vertical flip | True |
| Shear range | 0 |
| Zoom range | 0.2 |
| Grayscale Image | Grayscale = 0.299R + 0.587G + 0.114B |
| Mean Filter | Ifiltered(i,j)=m×n1∑k=−aa∑l=−bbI(i+k,j+l)Window Size: 7 x 7 |
Table 2.
Maize Pest & Diseases.
| Class | Number of Images |
|---|---|
| chenille_légionnaire_a | 1,100 |
| chenille_légionnaire_p | 1,100 |
| curvulariose_d | 1,100 |
| feuille_saine | 1,100 |
| helminthosporiose_d | 1,100 |
| maladie_abiotique_d | 385 |
| pucerons_p | 220 |
| rouille_d | 649 |
| striure_d | 1,100 |
Table 3.
Tomato Pest & Diseases.
| Class | Number of Images |
|---|---|
| acarien_d | 1,100 |
| alternariose_acarien_d | 1,100 |
| alternariose_d | 1,100 |
| coup_du_soleil_d | 1,100 |
| exces_d'azote_d | 1,100 |
| feuille_saine | 1,100 |
| flétrissement_bactérien_d | 1,100 |
| fruit_sain | 1,100 |
| fusariose_d | 1,100 |
| helicoverpa_armigera_p | 1,100 |
| mildiou_de_la_tomate_d | 1,100 |
| pourriture_apicale_d | 1,100 |
| tuta_absoluta_p | 1,100 |
| virose_d | 1,100 |
Table 4.
Onion Pest & Diseases.
| Class | Number of Images |
|---|---|
| alternariose_d | 2,200 |
| chenilles_p | 2,200 |
| feuille_saine | 2,200 |
| fusariose_d | 2,200 |
| pourriture_des_bulbes_d | 505 |
| virose_d | 609 |
Table 5.
Hyperparameter definition for the EfficientNetB3.
| Training Parameters | Parameters Values |
|---|---|
| Loss Function | categorically_crossentropy |
| Optimizer | Adamax |
| Epsilon | 0.001 |
| Learning Rate | 0.01 |
| Batch Size | 32 |
| Epoch | 40 |
Table 7.
Maize Pest and Disease Detection Performance.
| Maize Model | Accuracy | Precision | Recall | F1 |
|---|---|---|---|---|
| EfficientNetB3 | 89.3 | 86.8 | 91.9 | 88.3 |
| Proposed Framework | 96.5 | 96.7 | 96.4 | 96.5 |
Table 8.
Tomato Pest and Diseases Detection Performance.
| Tomato Model | Accuracy | Precision | Recall | F1 |
|---|---|---|---|---|
| EfficientNetB3 | 83.8 | 83.3 | 84.4 | 82 |
| Proposed Framework | 97.7 | 97.7 | 97.7 | 97.6 |
Table 9.
Onion Pest and Disease Detection Performance.
| Onion Model | Accuracy | Precision | Recall | F1 |
|---|---|---|---|---|
| EfficientNetB3 | 92.8 | 93 | 92.7 | 92.5 |
| Proposed Framework | 96.3 | 96.5 | 96.2 | 96.4 |
Disclaimer/Publisher’s Note: The statements, opinions and data contained in all publications are solely those of the individual author(s) and contributor(s) and not of MDPI and/or the editor(s). MDPI and/or the editor(s) disclaim responsibility for any injury to people or property resulting from any ideas, methods, instructions or products referred to in the content. |
© 2024 by the authors. Licensee MDPI, Basel, Switzerland. This article is an open access article distributed under the terms and conditions of the Creative Commons Attribution (CC BY) license (http://creativecommons.org/licenses/by/4.0/).
Copyright: This open access article is published under a Creative Commons CC BY 4.0 license, which permit the free download, distribution, and reuse, provided that the author and preprint are cited in any reuse.


