Submitted:
12 June 2024
Posted:
12 June 2024
Read the latest preprint version here
Abstract
Real time condition monitoring and precision health assessment system is a mandatory need for effective maintenance program in industrial sector. Rapid advancement in the information technology and other engineering technologies have invited more proactive attention from research and development in industrial sectors and particularly in condition monitoring of machines and related Industrial processes. In this work, the drill bit condition monitoring techniques have been developed based on the wavelet analysis and artificial neural network (ANN) as automatic drill bit fault detection and classification. An experimental work has been conducted to capture the vibration signals for analysis. In this experiment, the CNC drill machine is used with high carbon steel drill bit and mild steel material as work piece. The cutting condition parameters are kept constant and the wear level is changed. The Data Acquisition system (DAQ) with Lab VIEW software is used to capture the vibration signals for drill bit with different wear conditions. The captured vibrations data are analyzed using continuous wavelet transform (CWT) with Morlet wavelet and Daubechies wavelet as a prime function. In general, the CWT coefficient is used to generate the inputs features to ANN for automatic tool condition classification, with two outputs (0, 1) for healthy and (1, 0) for faulty. The results show the effectiveness of the combed WT and ANN for automatic classification of tool wear conditions with high success rate.
Keywords:
wavelets transform analysis
; artificial neural network
; turning lathe
; lab view software
1. Introduction
In manufacturing, more productivity with high quality is very important for customers which give high degree of satisfaction to the customers. In this condition monitoring plays a vital role which is connected to a good health of the machine. So, preventive maintenance and condition monitoring is required to give more attention to increase the machinery availability, improve the quality of the manufacturing process, enhance the reliability of the machine, maximize the profit and productivity and reduce the maintenance cost. Normally, an industrial investor will concern more about the profit and also to save cost of production due to heavy competition of the market. To make more productivity, condition monitoring is capable of providing warning based on fault detection in the early stage of production.
In drilling operations, If the condition of the drill tool is not monitored properly, drill tool will stick inside the work piece and possibility of breaks if operation is not stopped. Normally, the condition of the tools are analyzed based on mathematical models, physic-based models and data driven models which use the data using sensors and data acquisition systems. Since the mathematical model analysis is having more complexity and physics-based models require in-depth knowledge of physics involved in the process, there is an increasing trend of applying machine learning model-based analysis to predict the tool conditions more accurately. Drill tool condition monitoring is slightly complex in nature due to production tolerances and asymmetric profile of the drilling tool.
In this work, the predictive or condition-based maintenance is applied based on the wear condition of drill bit. This type is useful to monitor the condition of the drilling tool of a bench type CNC drilling machine which uses a specific technique which is drilling tool’s vibration signal. It can be used to detect the signal of the drill bit faults and analyses by using the time domain statistics and wavelet analysis as feature extraction. The extracted WT analyzed parameter to be fed as inputs features to an artificial neural network (ANN) for fault detection and classification.
The drilling fault detection techniques have been developed based on the wavelet analysis and ANN as automatic drill bit fault detection and classification. An experimental work has been employed to capture the vibration signals for analysis with different measuring intervals. The bench type CNC drill is used with high carbon steel tip drill bit and mild steel material as work piece. The drilling condition has been set to 12mm/min federate and the rpm of 800. The drill bit has drill dia 8 mm, Overall length 92 mm, the angle point is 135. Using accelerometers, vibration data has been collected and analyzed in the life cycle of the drill bit. In this experiment, The direction of sensor is vertical and the wear levels (0.0mm, 0.2mm, 0.4mm and 0.6mm) are changed.
Several methods of drill bit condition monitoring are investigated by researchers which includes both direct and indirect methods. The direct methods like visual inspection, machine vision and infra-red methodology are used to monitor the drill bit which will give less accuracy compared to indirect methods. (Mammar Al Tubi et al, 2022). Indirect methods include use of signals like force, vibrations, acoustic emission etc., in which the signal features have a relationship with wear condition / paramaters. (Deshpande et al. 2021). Acoustic Emission (AE) and vibration based drill bit monitoring are the most popular indirect methods which are used for assessing the condition with more accuracy for micro level measurements. Acoustic emission is a phenomenon which occurs when, for different reasons, a small surface displacement of a material surface is produced. This occurs due to stress waves generated when there is a rapid release of energy in a material, or on its surface which has frequency range from 10 to 70 kHz with non-linear frequency response (Maamar Al Tubi et al, 2022). In some advanced testing, we can use 200 kHz sensor for tool wear and the 800 kHz sensor for tool breakage detection which will come under the broad band acoustic sensor. AE has been widely used for monitoring wear in the laboratory as well as at the industrial level for monitoring failures like scuffing, fretting, rolling contact fatigue etc., (Deshpande et al., 2021).
Furthermore, indirect methods are widely used in drill bit condition monitoring and as fault detection. They are used in different techniques such as cutting forces, acoustic emission, temperature, vibration, motor current and torque (kuntoglu,M et al, 2020). However, vibration measurement for machinery condition monitoring is easy, less costly and yields a great deal of information that can be used to monitor the relative motion between the tool tip and the work piece for precision of the cutting operation (Qiao Sun, 2005). Waleed Abdulkarem et al (2014) have reported that vibration analysis is widely accepted as a tool to monitor the operating conditions of a machine as it is nondestructive, reliable and permits continuous monitoring without intervening with the process. This study has demonstrated drill bit condition monitoring approach in drilling operation based on the vibration signal collected using sensor and data acquisition system. The background of this approach is because of the availability, low cost, large information data, nondestructive, reliable and permits continuous monitoring for on-line monitoring. This method is easily replaceable by an another sensor(Eg Acoustic sensor) or very cost-effective accelerometer.
2. Literature Review
AI algorithms such as ANN, fuzzy based techniques, Genetic Algorithms, Support Vector Machines etc are highly useful in fault diagnosis. So, AI is the future of condition monitoring to have affective preventive maintenance (Yasir Hasan Ali ,2018). Internet of Things and AI have many advantages in the prediction of the healthiness of the machine which improve the productivity and profit of an industry (Lior Kitain,2018).In the research paper by Miho Klaic et al (2014), decision tree algorithm has been applied to predict the tool wear. The research paper concluded that the methodology assured that 90% success rate and more reliable. The researcher has not compared the decision tree with deep learning algorithms which is a big research gap in this paper. Rui Zhao et al (2015) surveyed related to deep learning and its application for machine health monitoring. He has concluded in this way in their research article as “It is believed that deep learning will have a more and more prospective future impacting machine health monitoring, especially in the age of big machinery data”. So, this paper reveals that deep learning can be used in a precise way to monitor tool wear and also the research concluded that deep learning is a promising technique to assess any kind of tool wear. P.Krishnakumar et al. (2018) used acoustic emission signal for tool condition monitoring during high-speed milling of Ti-6Al-4V. Discrete wavelet transform (DWT) was used to extract coefficients from vibration and acoustic emission signals. Machine learning algorithms like decision tree, Naïve Bayes, SVM, and ANN are used to predict the tool condition. The authors concluded that SVM based vibration analysis predicts tool condition effectively and assure that prediction accuracy is more than 99%. Yaochen Shi (2020) identified the wear in the drill bit based on the Local Mean Decomposition (LMD) and Back Propagation (BP) neural network. The research team used a multi-signal platform to acquire different parameters from the drilling machine. Then the feature parameter is predicted by the combination of noise-assisted LMD method and BP neural network. The accuracy of monitoring drill bit wear with multi-signal fusion is 95.8%. Lang Dai (2020) developed a new Deep Learning Model for Online Tool Condition Monitoring Using Output Power Signals. The output power from the sensor which is mounted on the cutting tool holder during its operation is used for further analysis. The date were analyzed using wider first-layer kernels (WCONV), and long short-term memory (LSTM) which is available in the deep learning algorithms. This paper concerns about the output power signals and its analysis on deep learning algorithms. Qun wang et al., (2021) have done a survey on tool Wear Monitoring Methods Based on Convolutional Neural Networks. Qun wang et al concluded that application convolution neural networks in tool wear and condition monitoring is more reliable. They added that the convolution neural network can improve accuracy, which is a great significance of the CNN. Chacon et al. (2021) used multi-threshold count-based feature extraction at multi-resolution level based on wavelet packet transform for extracting a redundant and non-optimal feature map from the AE signal. Recursive feature elimination is used to reduce and optimize the number of features and the random forest regression is used to estimate the tool wear; The performance is compared with other ML techniques like RF, SVM, ANN, KNN, and DT, to obtain the lowest RMSE for predicting tool flank wear.
3. Wavelet Analysis
A wavelet is a wave like short oscillating function which begins at zero and will increase or decrease and then returns to zero one or more times. Wavelets are applied to transform the signal under examination into another representation which presents the signal information in a more amenable form. This type of transformation is known as Wavelet Transform (WT) which is converting the function or signal into another form to make certain features of the original signal to more useful signal to investigate. There are five categories of wavelet transform in condition monitoring
- time–frequency analysis of machining signal,
- feature extraction,
- signals denoising,
- singularity analysis for tool state
- density estimation for tool wear classification according to its multi-resolution, sparsity and localization properties
The wavelet method overcomes the limitation of Fourier Transform, by using a multi-resolution technique (time & frequency). Hence, it has the ability to examine the signal simultaneously in time and frequency with a flexible mathematical foundation. Time information is obtained by shifting the wavelet over the signal. The frequencies are changed by contraction and dilatation of the wavelet function. The wavelet analysis is more sensitive and trustable than the Fourier analysis for recognizing the tool wear states in turning (Maamar al Tobi et al., 2022). The wavelets were first mentioned by Alfred Haar in 1909. It can be moved at various locations on the signal and also it can be squeezed to different scales.
There are some requirements for the wavelet, which are: it must have finite energy, based on Fourier transform, the wavelet must have zero mean and for complex wavelets the Fourier transform must be both real and vanish for negative frequencies. To make the wavelet of chosen mother wavelet more flexible, two basic manipulations are applied which are stretch or squeeze it (dilation) and move it (translation). The dilation of the wavelet is governed by the dilation parameter a. The movement of the wavelet along the time axis is governed by the translation parameter b. These shifted and dilated versions of the mother wavelet Ψ (t) are denoted by Ψ [(t – b)/a]. The wavelet represented by (Maamar al Tobi et al., 2022):
Where, the factor is used to ensure energy preservation.
The sum over all time of the signal multiplied by scaled and shifted versions of the wavelet function Ψ is called the continuous wavelet transform (CWT). Continuous wavelet transforms are recognized as effective tools for both stationary and non-stationary signals. Based on the equation (3 – 9) the CWT given as:
Where, is the continuous wavelet transform (CWT), X (t) is the signal and the superscript asterisk '*' stands for the complex conjugate.
It can be expressed in more compact form as an inner product:
The windowing techniques with variable-size regions in wavelet analysis can be overcome the limitations of the Short-Term Fourier Transform (STFT). Wavelet analysis allows the use of shorter time intervals where more precise high frequency information is desirable and long regions for low frequency information. Sometimes the wavelet is irregular and asymmetric waveform of effectively limited duration (average value zero), so the varieties of wavelets (Wavelet Families) are exist, and an analyst can choose from the wavelet families that suits his application best.
This project focuses on Daubechies wavelets (db10) and Morlet wavelet (morl) as basis function based on the role of features extraction, because they are more similar characteristics to the extracted signals. The morl wavelet is known by the following Equation(Eqn4) . Figure 1 shows the morl wavelet.
The names of Daubechies family wavelets are signed db N (N is the order) as Figure 2 shows the db 10 wavelet. The Daubechies wavelet is defined as given in equation (5) .
Where, Φ(t) is scaling function and = (-1) k α – k +1 , If N= 1, then α0= α = 1
4. Modelling of Condition-Based Maintenance Approach Using Artificial Intelligence
Traditional type monitoring involves a measurement system that contains sensors and then the sensor data will undergo signal condition to process the signal. The processed signal will be converted from analog to digital and then the feature extraction will happen. Then the classification or identification of machine status will be decided by analyzing the feature extraction. The traditional type of machine condition monitoring integrating with AI is given in Figure 3.
The idea of Artificial Neural Network (ANN) is creating a computing system that simulates the biological neural systems of the human brain. The artificial neural network is particularly useful in the modeling of nonlinear mapping, and also in the recognition of distinctive features from chaotic input data even if it is not complete. The behavior of ANN modifies in response to its environment. The inputs will self-adjust while a set of them are given to the network to produce consistent responses through a process called learning. The learning process can change the weights systematically in order to achieve some desired results for a given set of inputs. The types of learning are, supervised and unsupervised; the supervised has been selected based on the environment knowing. The popular algorithm related to the supervised learning is known as the Back-Propagation. The construction of ANN involves the determination of the network properties depending on the network topology (connectivity), the type of connections, the order of connections, and the weight range. Moreover, it determines the node properties like the activation range and the activation function. Also, in dynamic system the ANN determines weight initialization scheme, the activation calculating formula and the learning rule.
A large number of researchers presented application of neural network models in Tool Condition Monitoring (TCM) and classification of tool wear. Artificial neural network (ANN) is useful as online prediction of tool wear based on back propagation network (R R Srikant, 2011). The multi-layer feed-forward neural network with a back propagation (FFBP) training algorithm is successful in TCM as tool fault detection and classification (Issam Abu-Mahfouz, 2003). In this project the ANN is used as fault detection and wear condition classification based on Multi-layer feed-forward with back propagation.
Artificial neural network contains many connected neurons, which work as receiver for the impulses from input or other neurons. These neurons transform the input by giving the outcome to the output or other neurons. Also, ANN consists of different layers of connected neurons, which receive the input from the previous layer and transfer the output to the succeeding layer. Figure 4 shows the model of a neuron, where the inputs are forwarded to the neuron and multiplied by their synaptic weights. Then, the outcome is forwarded to sum in summing junction and it is activated by the activation function. The inputs of the activation function are affected by the bias (bi), so it will increase if positive and decrease in the case of negative. Finally, the output will be given. The learning and storing of the knowledge will be possible by this model of the ANN.
Typically, in neural network architectures two types of layers are organized in the shape of a layered neural network. There are the signal-layer feed-forward perceptron (SLP) neural network and the feed-forward multilayer perceptron (MLP) ANN. The arrangement of neurons in each of the layers is entirely dependent on the user, hence they have the ability to represent a large range of output and input patterns. The Figure 5 shows the limitations in the range of functions or processes that they can represent in signal-layer feed-forward (SLP) neural network. However, the feed-forward multilayer perceptron (MLP) neural network is selected in this study; because it has a wide range of processes and more powerful representation capacity which can be achieved by using more than one layer, as shown in Figure 4.
5. Experiment Setup
This experimental work has a small preparation which can create the wear levels at the tip of carbide inserts. In this experiment first, the drill bit is fixed on the tool holder and the other cutting conditions are as follows:
Then, the drill machine has to be adjusted to make wear at the drill bit using the grinding wheel with speed of 450 rpm. When the drill bit is adjusted to a depth of drill 0.2 mm the wear is created about 0.2mm wear level. Finally, the wear at carbide insert tips is measured using the microscope. The same procedure is used to create the 0.4mm and 0.6 wear level. Figure 6 shows an example of the process of creating wear levels.
This experimental work with same procedure and parameters of the cutting conditions, which are speed the drilling condition has been set to 12mm/min feed rate and the rpm of 800. The drill bit has drill dia 8 mm, Overall length 92 mm, the angle point is 135. Using accelerometers, vibration data has been collected and analyzed in the life cycle of the drill bit. In this experiment, the direction of sensor is vertical and the wear levels (0.0mm, 0.2mm, 0.4mm and 0.6mm) are changed. vibration signals are captured by data acquisition card from National Instruments (DAQ Card) with LABVIEW software. It is directly connected to a PC with a data acquisition card (DAQ card- NI C DAQ- 9174) and LABVIEW software and this experimental works with 16000 sampling rate. The signal conditioning device used for the signal processing is Type NI - 9234 In this experiment the workpiece and drill bit is fixed at the drilling machine and the distance between the work piece and the drill bit is adjusted. The drill bit with different wear is employed with the work piece and the direction of the accelerometer sensor (coated by aluminum coil for safety) is vertical as shown in the Figure 7.
In this experiment the vibration signals of the drill bit with different wear conditions (healthy, 0.2mm, 0.4mm and 0.6mm) are captured by the accelerometer sensor to shift and convert these signals from analogue to digital form using a PC with data acquisition card from National Instruments (DAQ Card) and LABVIEW software. Figure 8 shows the experiment setup.
Finally, the LABVIEW shows the features of the vibration signals as time domain and frequency domain. Also, for further analyzing the suitable vibration signals the MATLAB is used to analyses the signals based on Wavelet analysis and ANN as automatic drill bit fault detection and classification.
6. The Experimental Results and Discussions
This section presents the results of applying the Continuous Wavelet Transform (CWT) for drill bit with different wear condition. The CWT is used also as features extraction method for generate the inputs feature to ANN. Morlet wavelet (morl) and Daubechies Wavelets (db 10) has been used as a mother wavelet function while obtains the CWT coefficients.
Continuous Wavelet Transform (CWT)Analysis
In Figure 9 the results are demonstrated comparative graphs of kurtosis factor of 20 wavelet coefficients for healthy tool and (0.2, 0.4, 0.6) mm wear, respectively. These graphs present the effectiveness of kurtosis factor in wavelet scale, and then compare it to histograms of healthy tool and each different wears. This technique shows the ability to recognize between the healthy condition and faulty condition.
The Kurtosis distribution of wavelet transform scales Figure 9 presents that the kurtosis of healthy tool is higher than the fault condition. As the sharp tool produces a signal with less randomness and as the wear progress the randomness of the signal is increased that produce a flat signal distribution as a result the kurtosis value will decrease. This clear in the histograms for healthy tool and (0.2, 0.4, 0.6) mm wears shown in Figure 10 (a-e).
To change the wavelet scale to frequency (Hz), this equation is applied:
Fa = Fc / a . ∆ Where, a is a scale, ∆ is the sampling period (0.1), Fc is the center frequency of a wavelet in Hz and Fa is the pseudo-frequency corresponding to the scale a in Hz. In the selected signals were in 280 rpm, so the frequency equal to (280/60) 4.6 Hz. Figure 11 shows the kurtosis distributions of wavelet transform at frequency (Hz) for healthy tool and (0.2, 0.4, 0.6) mm wear, respectively.
The wavelet kurtosis decrease when tool wear increase as shown in above Figure 11 this is corresponding to frequency in hertz (. That is referring to the damping of the drill bit increase as result of increasing in the wear. When the wear increase the contact area of the cutting tool with the workpiece also increase. That makes the friction increase, so the damping increase and the machine frequency decrease for lately the peak at 4.06 Hz for healthy tool and shifted to 1.35 Hz for 0.2 mm wear, again decreased for 0.4 and 0.6 mm wear. All that is presented in this equation: where, ωd is damped frequency, ωn is the undamped angular frequency and ζ is damping ratio which increase by increase tool wear.
7. Automatic Fault Detection and Classification of Drill Bit Using ANN
Automatic fault detection and classification of drill bit condition using the features of wavelet and Artificial Neural Network (ANN) model is proposed for this project. By using The Artificial Neural Network (ANN) to classify the tool wear conditions the model of ANN is created based on feed-forward Multi-Layer Perceptron (MLP) and Back Propagation. The result features (peak, RMS, crest factor, kurtosis, shape factor and impulse factor) healthy condition and wear condition are feed to ANN to classify the wear condition. The signal consists of 38400 data for each condition (wear & healthy) and then 10 coefficients are taken for each of these wear conditions. To build the ANN model six features are extracted from 10 coefficients for each condition, then the values divided into 30 (5x6) values for training and 30 values (5x6) for testing. Also, the healthy condition is normalized as (0 1) and wear condition as (1 0) for training targets. The ANN model is created using input layer with six nodes (extracted features), two hidden layers consist five nodes for each and output layer as shown in Figure 12. Back Propagation is applied to minimize the Mean Square Error (MSE) between the ANN outputs and the desired target values.
In this model two stages are applied which are training stage and testing stage. It is trained with 10E-10 training goal (MSE), 0.52044 training rate, with six attribute (features) and the maximum No. of iteration (epochs) of 1000 are selected. Figure 13 shows the result of training process, in which it reached the desired goal stopping criteria after 27 epochs.
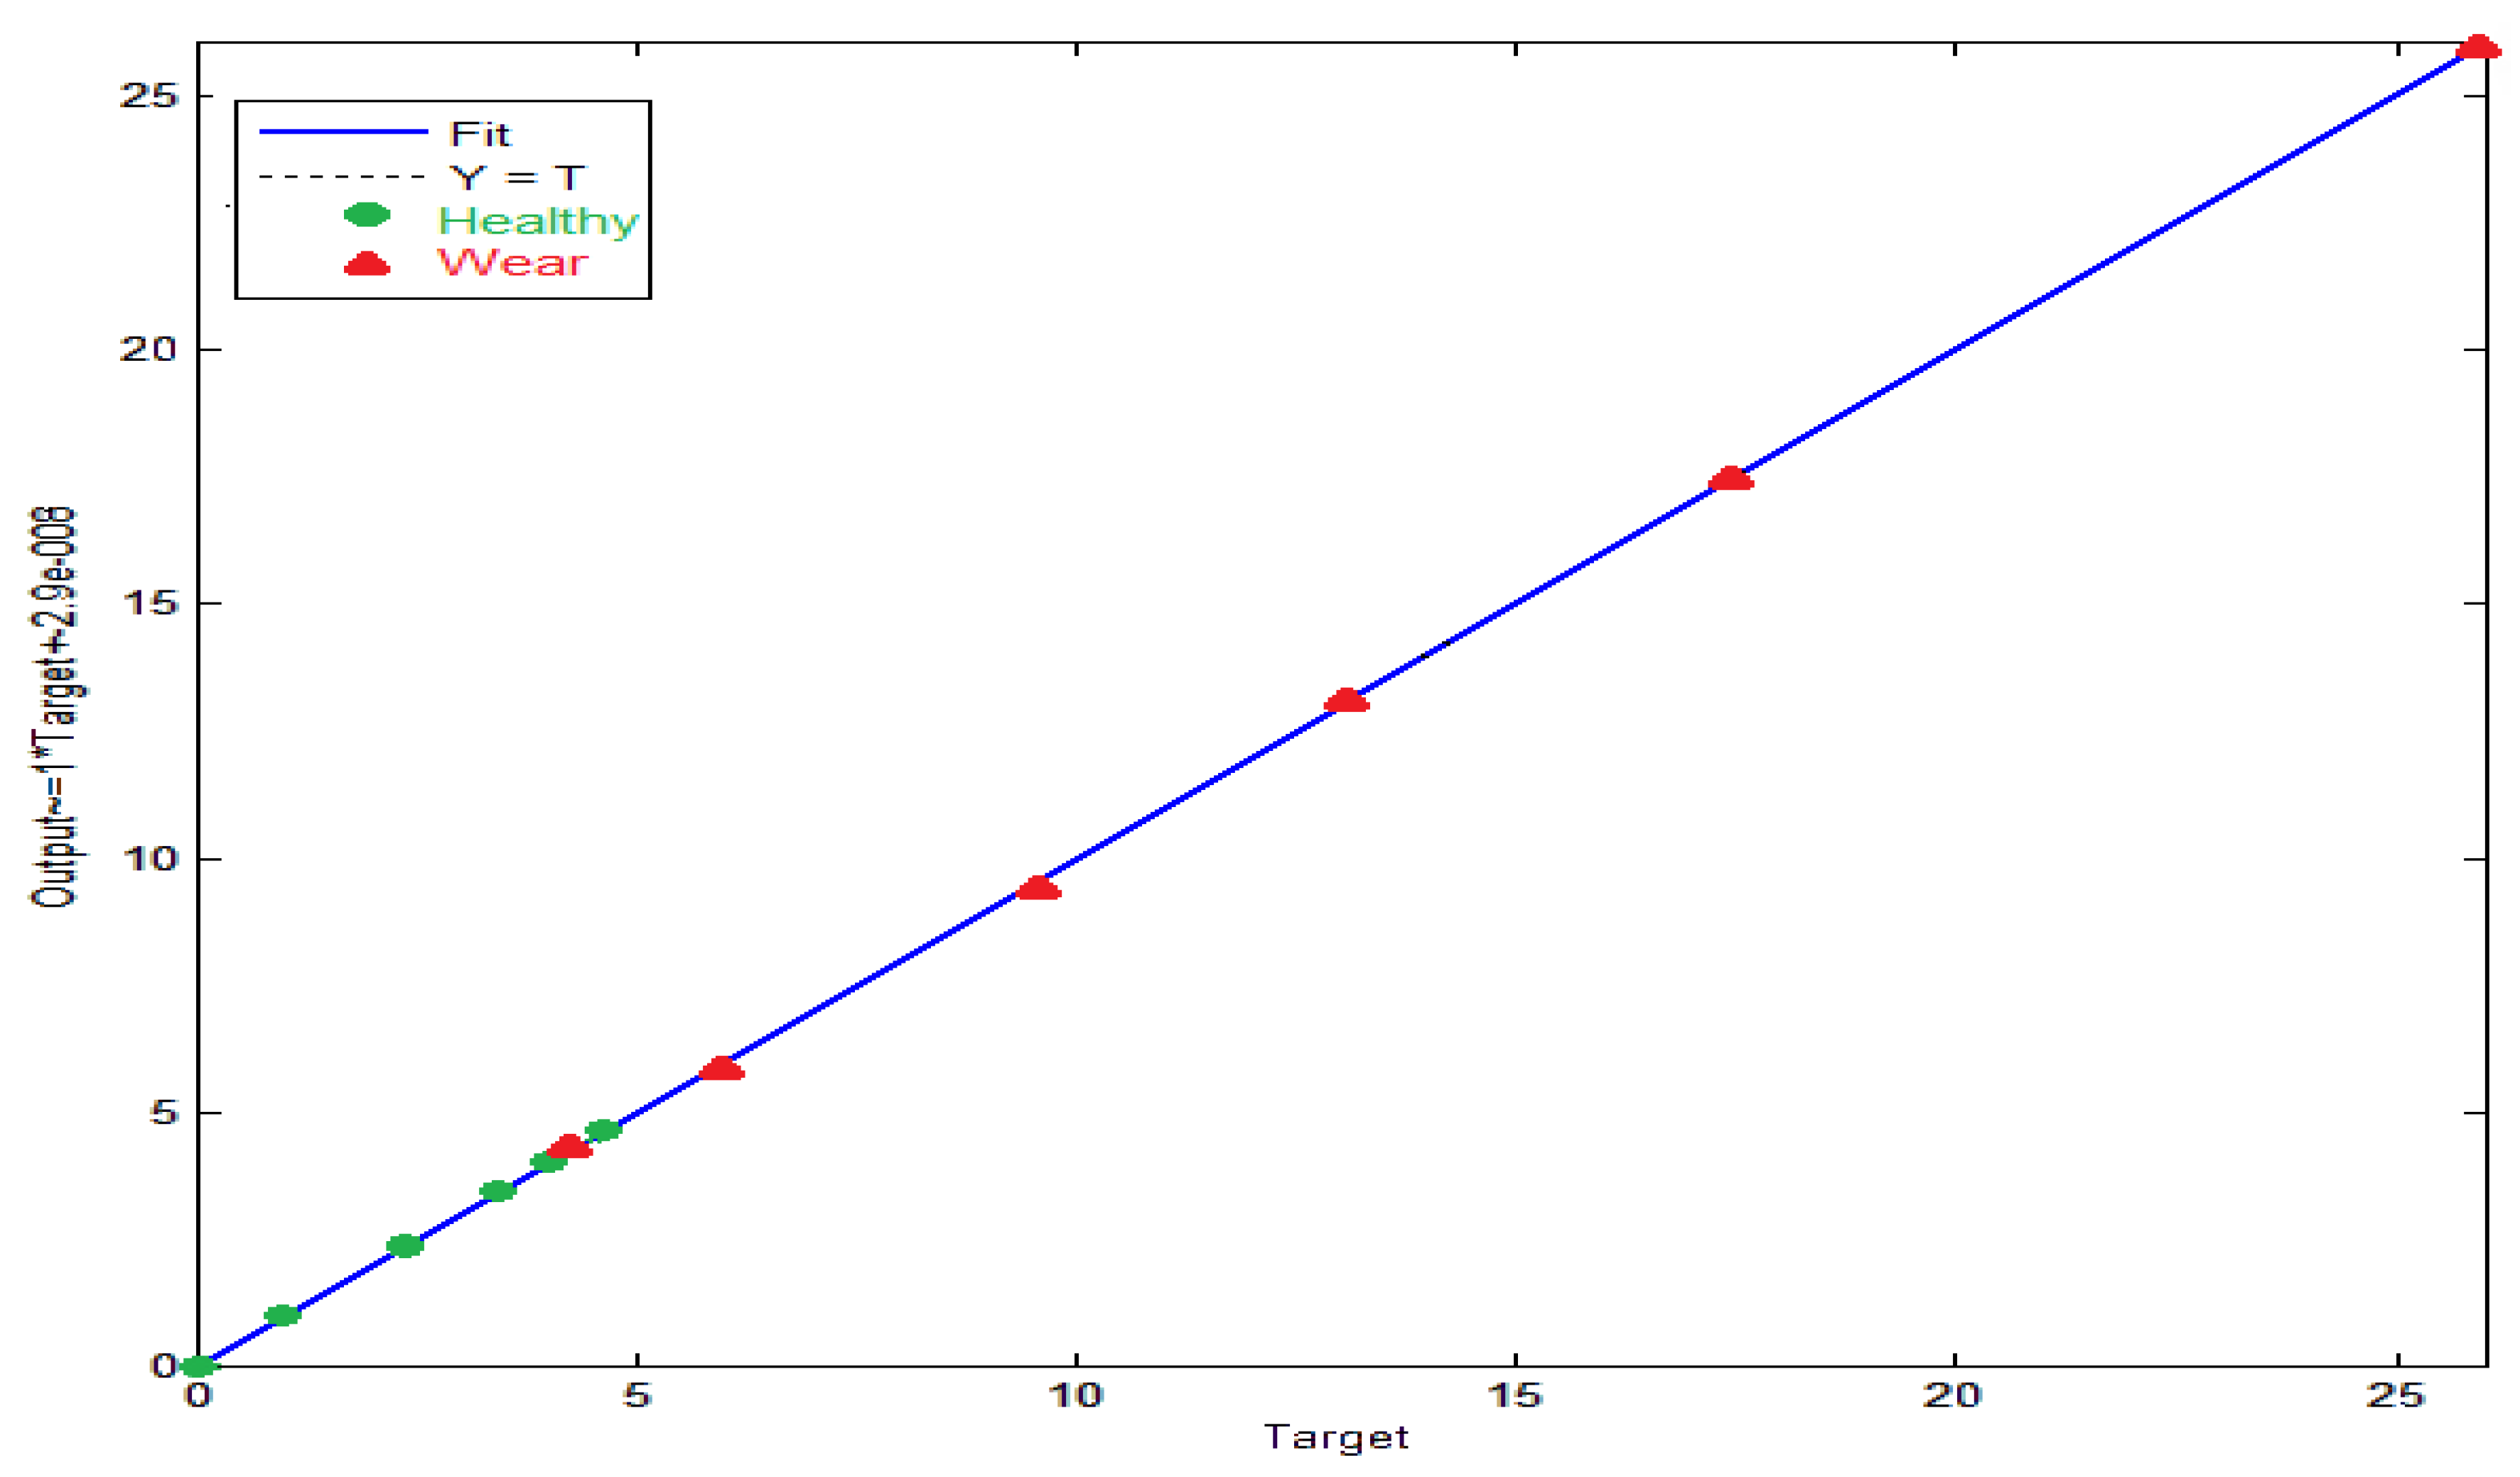
The regression curve for both training targets and the ANN output is shown in Figure 14, a good correlation between the both can be concluded. The results for ANN classification for tool wear condition shown success rate based on the given six features.
8. Conclusions
Based on the obtained results the overall conclusion can be summarized as follow:
For more accurate fault detection of the drill bit, An ANN based techniques has been developed, which are wavelet kurtosis factor and the histograms throughout using Morlet wavelet and Daubechies Wavelets as a mother wavelet function (similarity with the extracted fault pulses shape). This technique shows the ability to recognize between the healthy and wear conditions. The wavelet analysis is selected for drill bit vibration signal features extraction. The advantage of wavelet analysis is proven as a multi resolution, scaling and shifting of the wavelet through the vibrational signal. For high performance of the extracted wavelet features; the features are normalized between 0 and 1 in order to be the inputs in ANN. The ANN model based on supervised learning capability of Multi-Layer Perceptron (MLP) and Back Propagation has shown effectiveness to be as automatic drill bit fault detection and classification, as proven that the training process has been reached the desired goal stopping criteria after 27 epochs. And the ANN performance is shown as 98% success rate. This project is proved the successful correlation between the wavelet transform (WT) and the drill bit wear condition based on the obtained results.
Funding
This research was funded by MOHERI, OMAN, grant number BFP/RGP/EI/22/433.
Data Availability Statement
The original contributions presented in the study are included in the article/supplementary material, further inquiries can be directed to the corresponding author/s.
References
- Camuñas-Mesa LA, Linares-Barranco B, Serrano-Gotarredona T. Neuromorphic Spiking Neural Networks and Their Memristor-CMOS Hardware Implementations. Materials (Basel). 2019, 12, 2745. [CrossRef] [PubMed]
- Chacón, F.; Luis, J.; de Barrena, F.; Telmo, G.A. A Novel Machine Learning-Based Methodology for Tool Wear Prediction Using Acoustic Emission Signals. Sensors 2021, 21, 5984.
- Issam Abu-Mahfouz. Drilling wear detection and classification using vibration signals and artificial neural network, International Journal of Machine Tools & Manufacture 2003, 43, 707–720.
- Krishnakumar. P, K. Rameshkumar and K I Ramachandran,( Machine learning based tool condition classification using acoustic emission and vibration data in high speed milling process using wavelet features, Intelligent Decision Technologies, pp.1-18; 2018).
- Kuntoğlu M, Aslan A, Pimenov DY, Usca ÜA, Salur E, Gupta MK, Mikolajczyk T, Giasin K, Kapłonek W, Sharma S. A Review of Indirect Tool Condition Monitoring Systems and Decision-Making Methods in Turning: Critical Analysis and Trends. Sensors (Basel). 2020 Dec 26;21(1):108. [CrossRef] [PubMed]
- Lang Dai,Tianyu Liu,Zhongyong Liu,Lisa Jackson,Paul Goodall,Changqing Shen,and Lei Mao ;An Improved Deep Learning Model for Online Tool Condition Monitoring Using Output Power Signals, Journal of Shock and Vibration, Hindawi, Volume 2020, Article ID 8843314, 12 pages. [CrossRef]
- Lior kitain, (2018): Condition Monitoring in the Oil and Gas Industry, Article: Available at: https://medium.com/@lior.kitain/condition-monitoring-in-the-oil-and-gas-industry-991805ea9335.
- Maamar Ali Saud Al Tobi, Ramachandran K P, Saleh Al-Araimi, Rene Pacturan, Amuthakkannan Rajakannu, Geetha Achuthan: Machinery Fault Diagnosis using Continuous Wavelet Transform and Artificial Intelligence based classification; In: Proceedings of the 2022 3rd International Conference on Robotics Systems and Vehicle Technology July 2022; pp 51–59. [CrossRef]
- Maamar Ali Saud AL Tobi, Ramachandran.KP., Saleh AL-Araimi., Rene Pacturan., Amuthakannan Rajakannu., Chetha Achuthan: Machinery Faults Diagnosis using Support Vector Machine (SVM) and Naïve Bayes classifiers; International Journal of Engineering Trends and Technology;70(12);PP26-34;(2022).
- Miho Klaic, Tomislav Staroveski, Toma Udiljak;, Tool Wear Classification using Decision Treesin Stone Drilling Applications: a Preliminary Study, 24th DAAAM International Symposium on Intelligent Manufacturing and Automation, 2013, Procedia Engineering, 69(2014), 1326-1336, Elsevier, Scence Direct; (2014).
- 11. Qiao Sun, Ying Tang, Wei Yang Lu and Yuan Ji (2005): Feature Extraction with Discrete Wavelet Transform for Drill Wear Monitoring, Journal of Vibration and Control, vol. 11, pp. 1375–1396.
- R. R. Srikant, P. Vamsi Krishna and N. D. Rao (2011): Online tool wear prediction in wet machining using modified back propagation neural network, Journal of Engineering Manufacture, Part B, vol.225, pp.1009- 1018.
- Rui Zhao, Ruqiang Yan, Zhenghua Chen, Kezhi Mao, Peng Wang, and Robert X. Gao, Deep Learning and Its Applications to Machine Health Monitoring: A Survey IEEE Transactions on Neural Networks and Learning Systems vol. 14, no. 8, august 2015; (2015).
- Waleed Abdulkarem, Rajakannu Amuthakkannan, Khalid F Al-Raheem: Centrifugal pump impeller crack detection using vibration analysis. In: 2nd International Conference on Research in Science, Engineering and Technology, pp206-211, (2014).
- Wang, Q.; Wang, H.; Hou, L.; Yi, S. Overview of Tool Wear Monitoring Methods Based on Convolutional Neural Network. Appl. Sci. 2021, 11, 12041.
- Yasir Hassan Ali,: Artiicial Intelligence Application in Machine Condition Monitoring and Fault ; Artificial Intelligence - Emerging Trends and Applications,Chapter: 14; 275-291,(2018).
Figure 1.
Morlet wavelet.
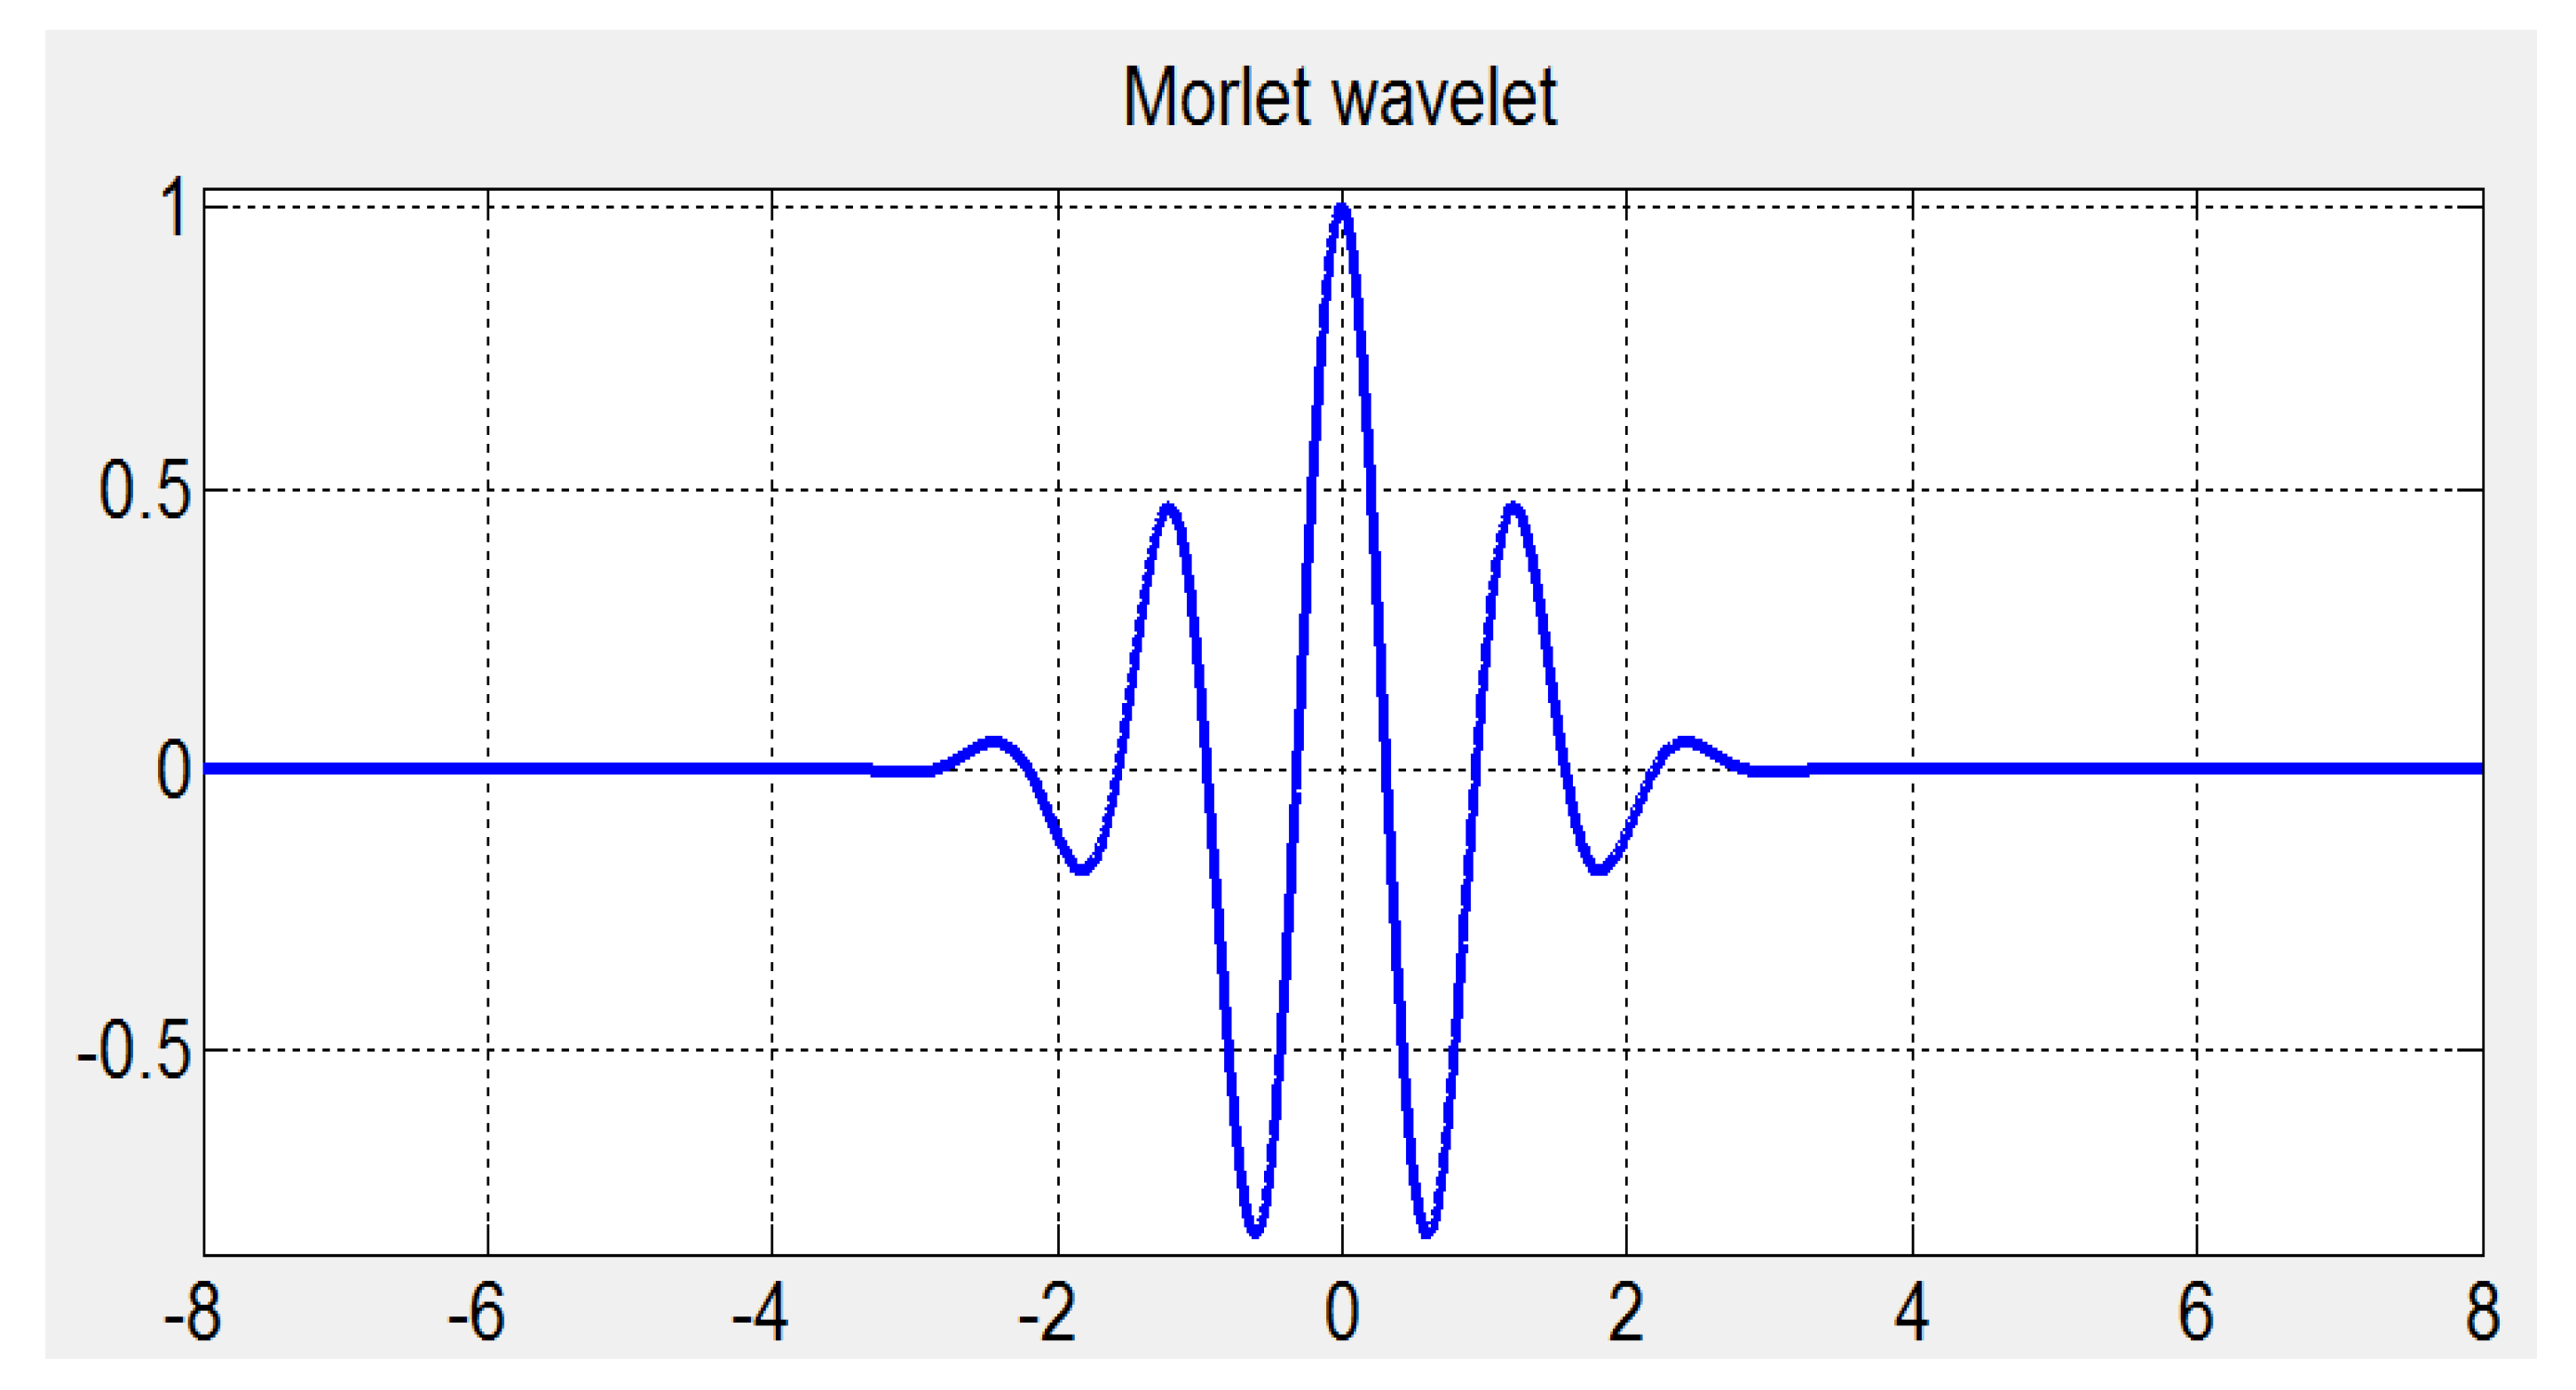
Figure 2.
Daubechies wavelet db 10.
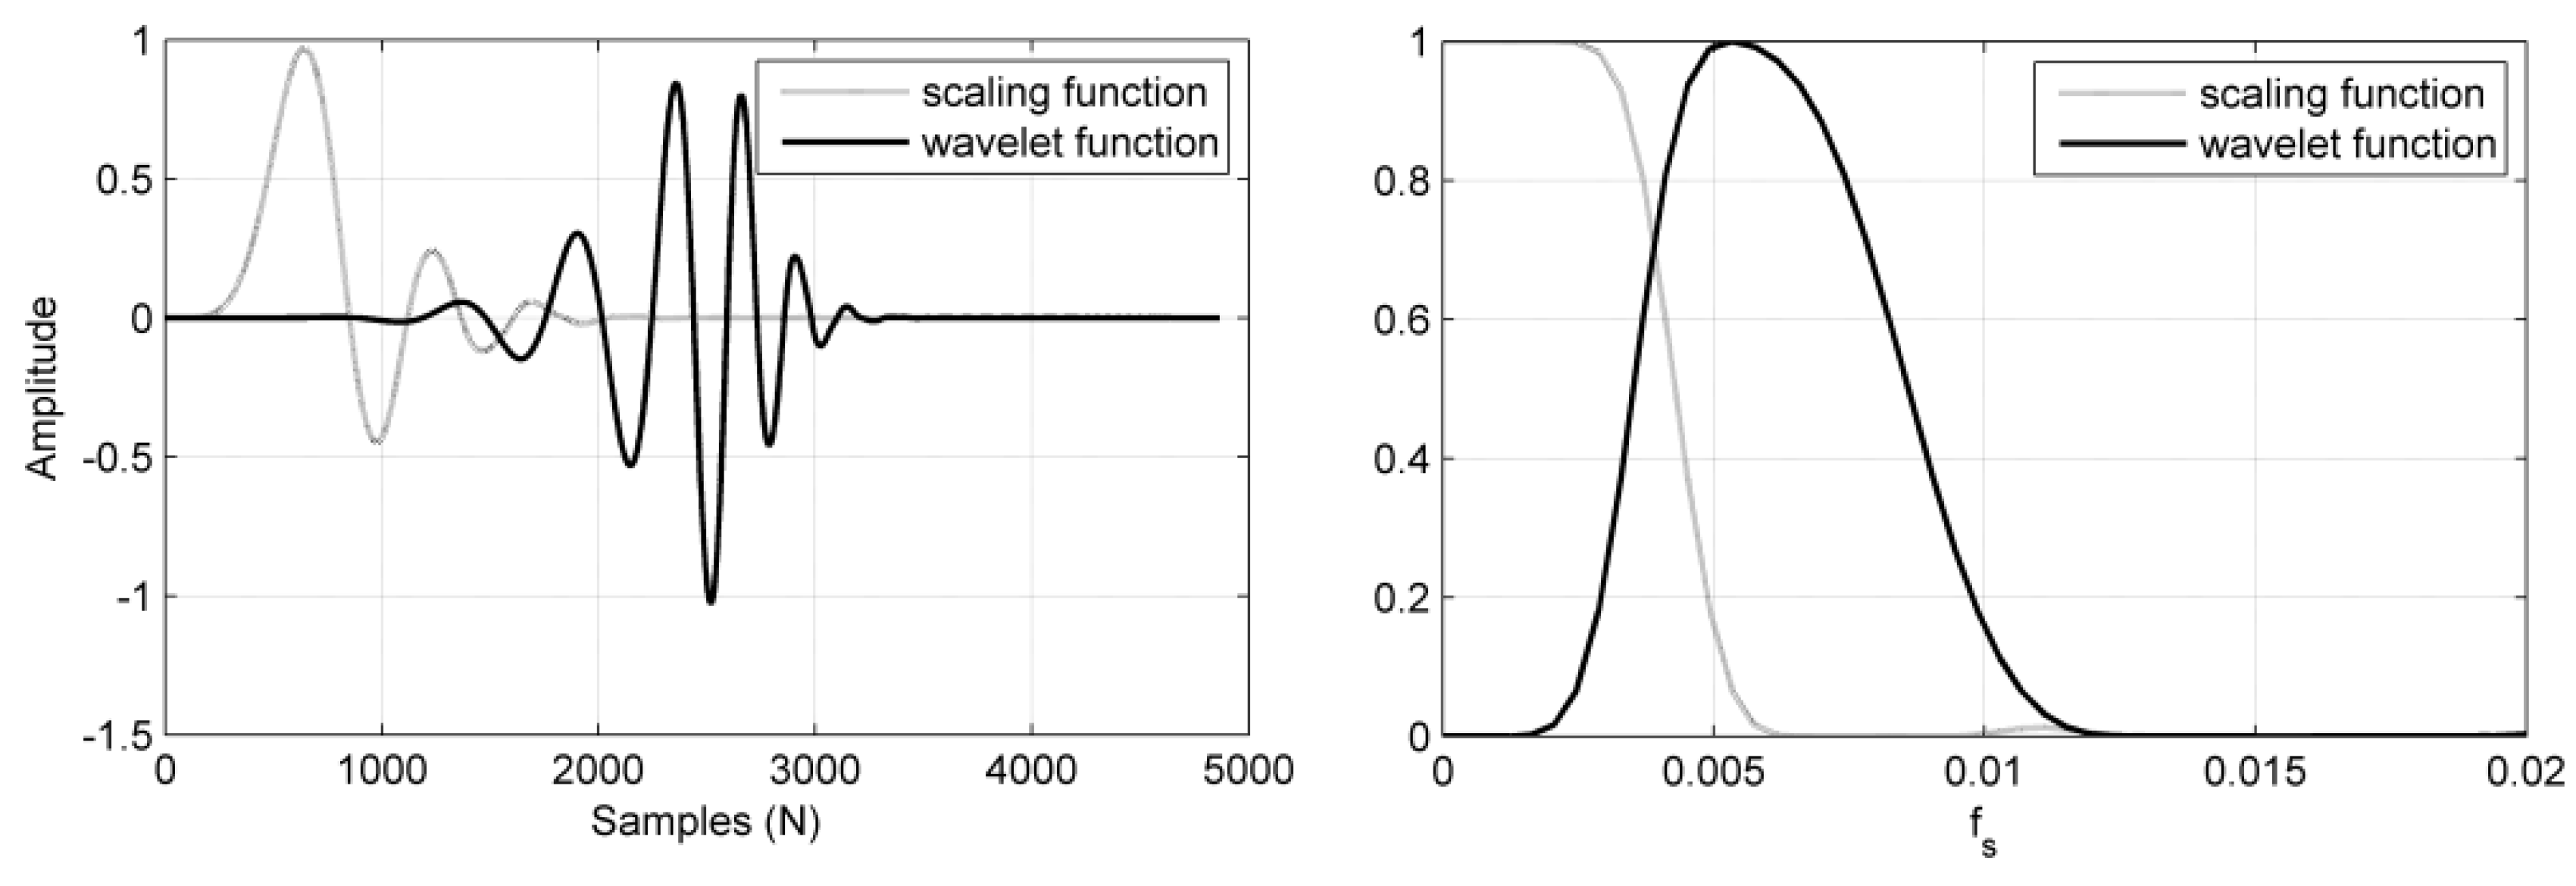
Figure 3.
Machine condition monitoring model integrating with AI techniques.
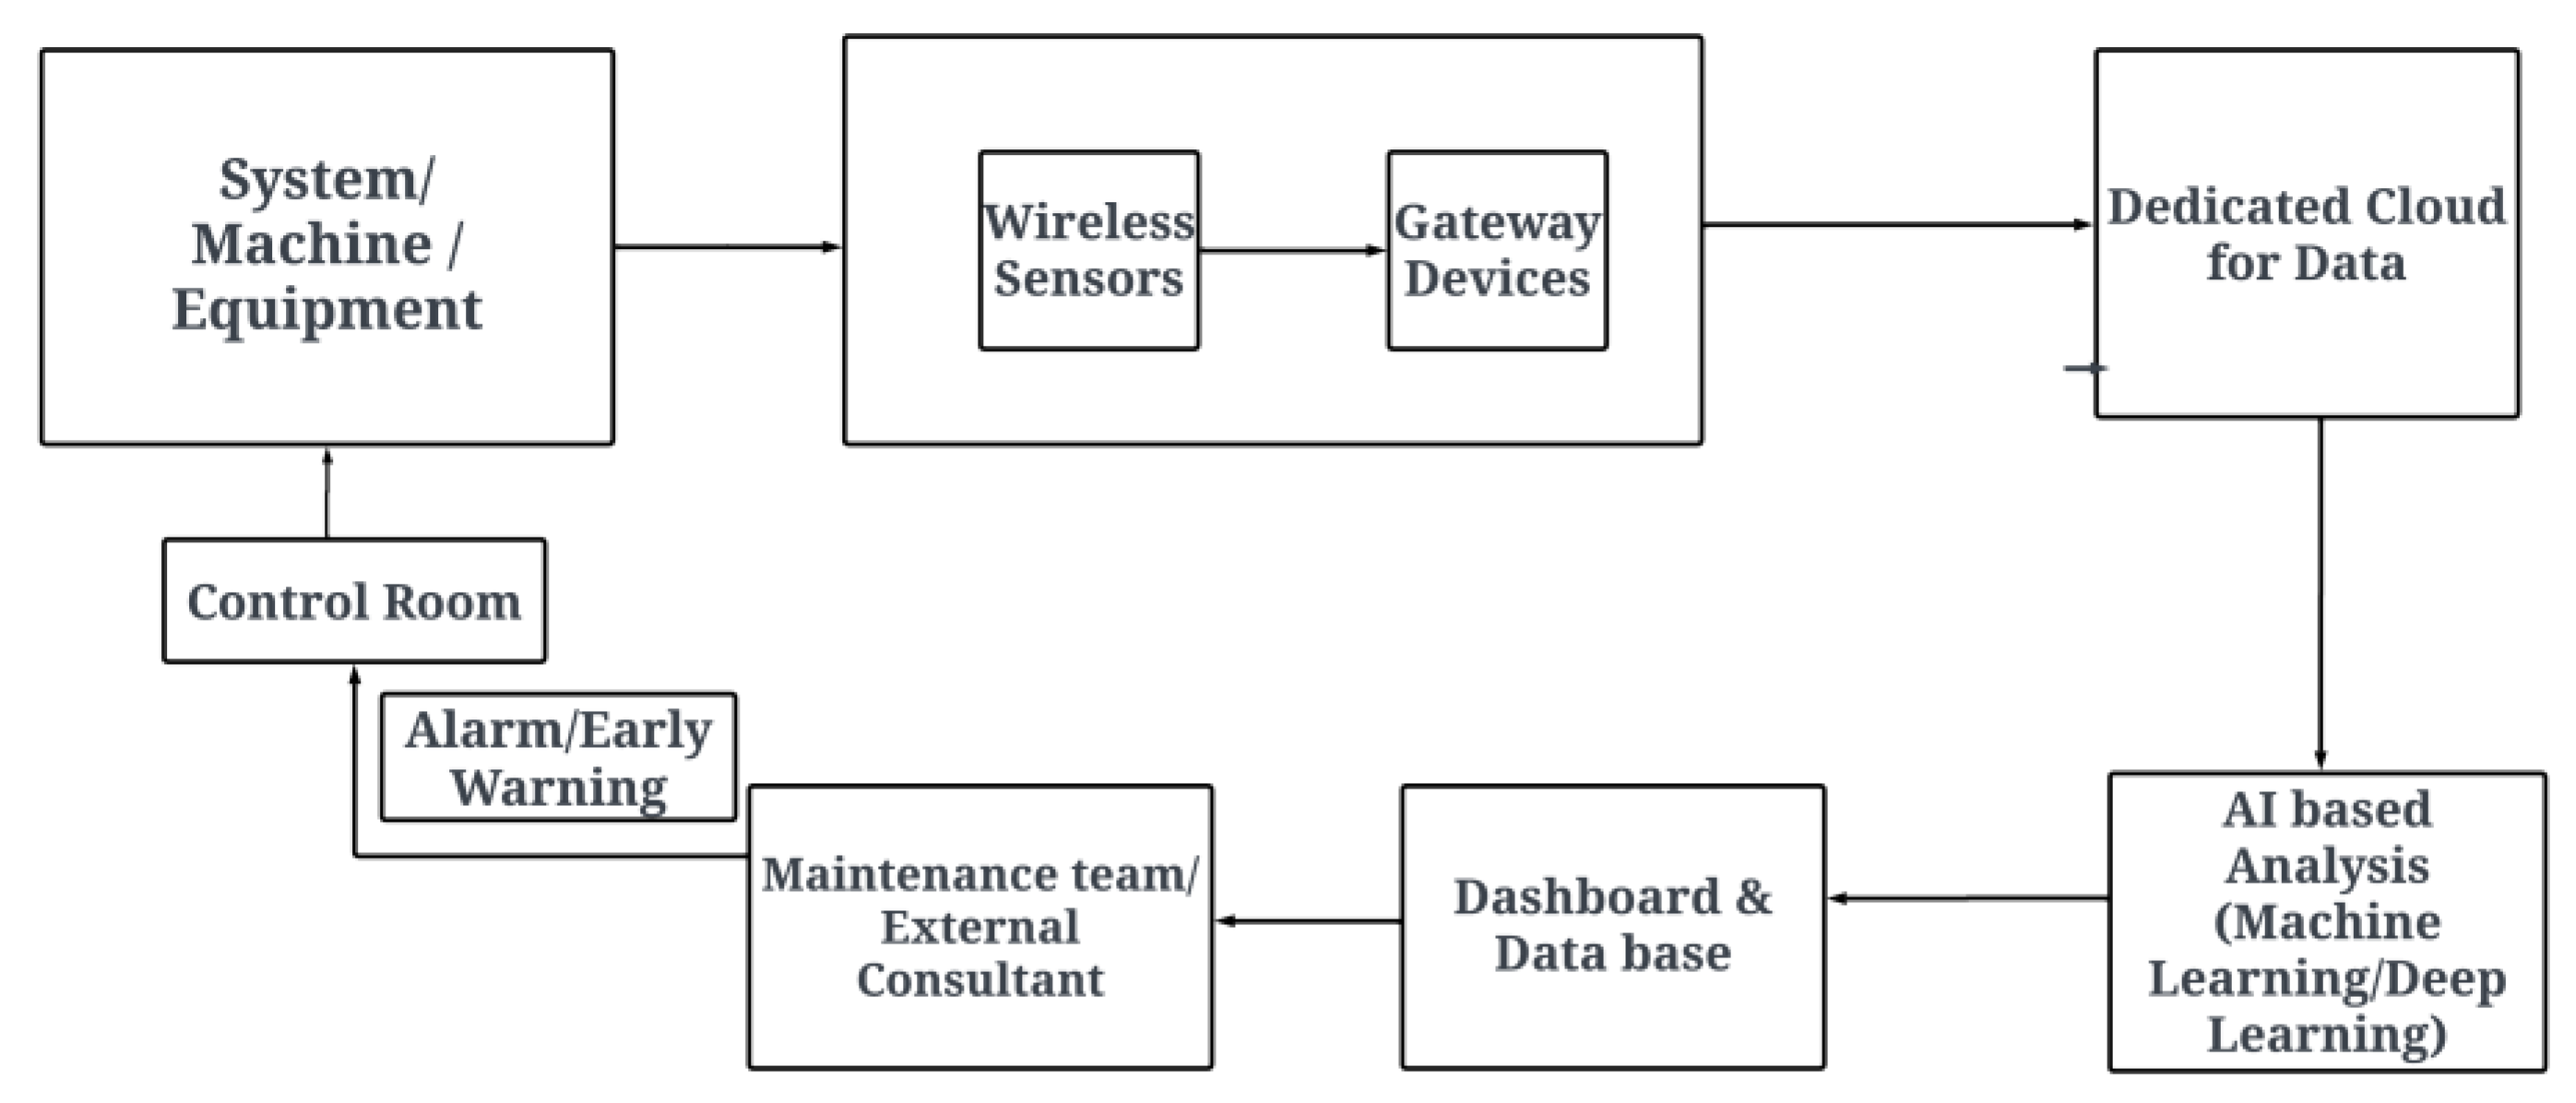
Figure 4.
The model of a neuron.
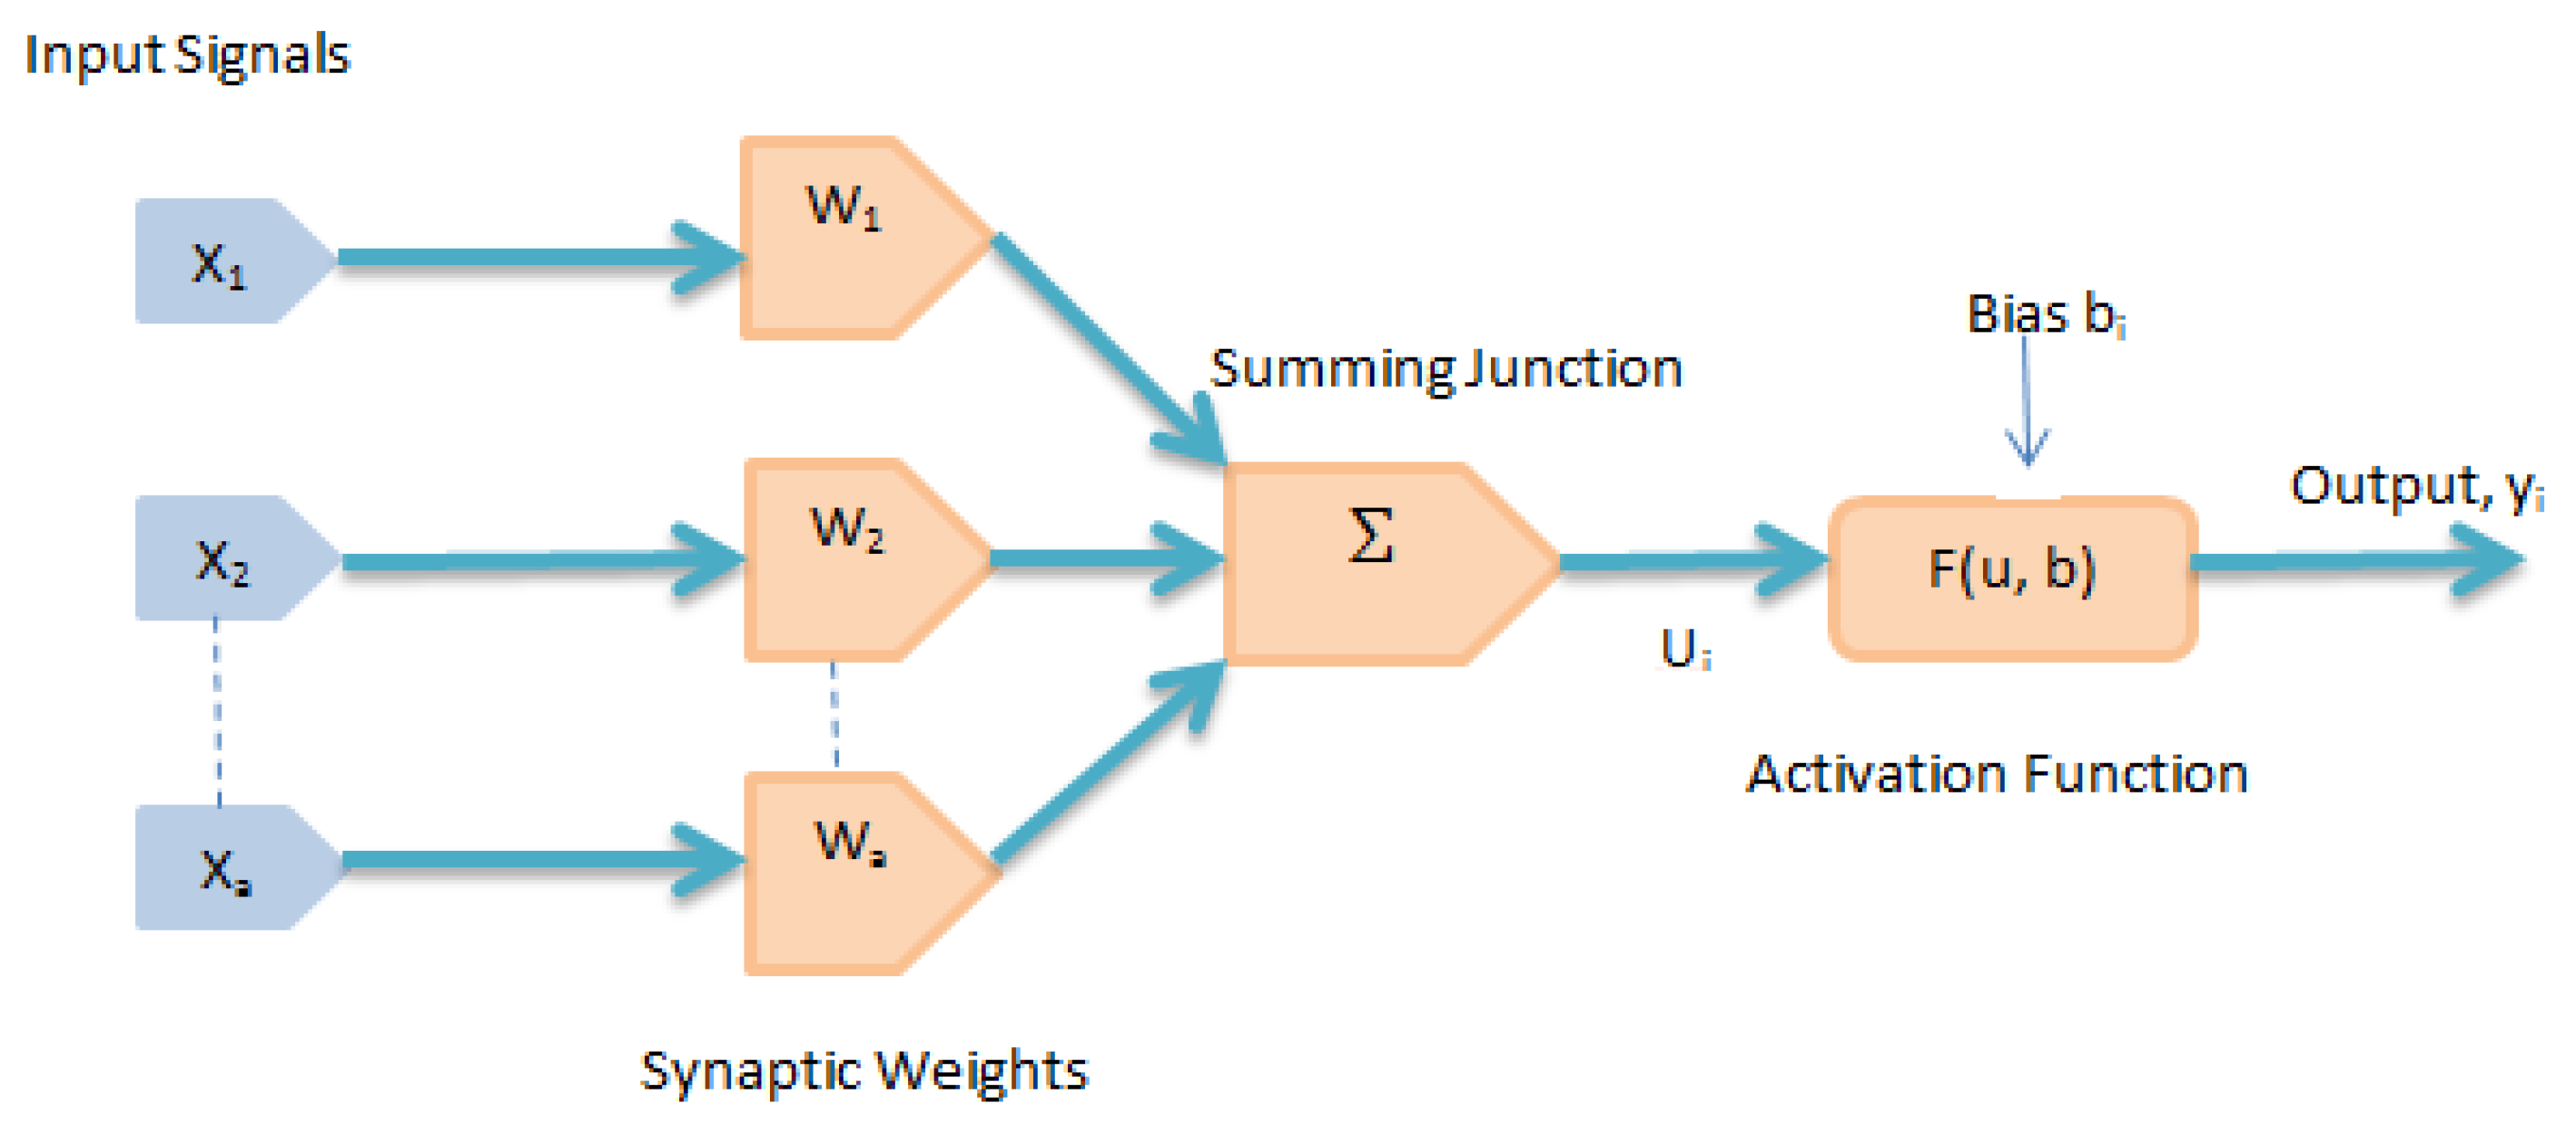
Figure 5.
Typical diagram of a single-layer perceptron and multi-layered feed-forward ANN. (Luis A Camuñas-Mesa et al., 2019) .
Figure 5.
Typical diagram of a single-layer perceptron and multi-layered feed-forward ANN. (Luis A Camuñas-Mesa et al., 2019) .
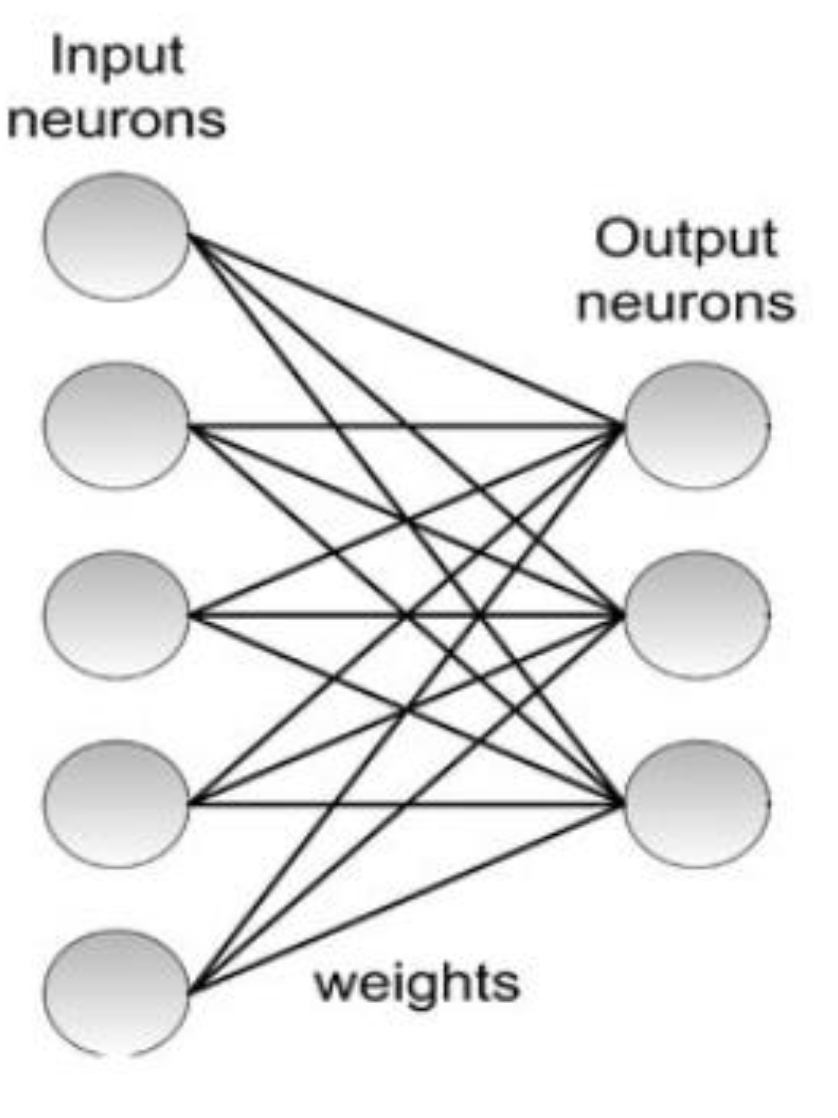
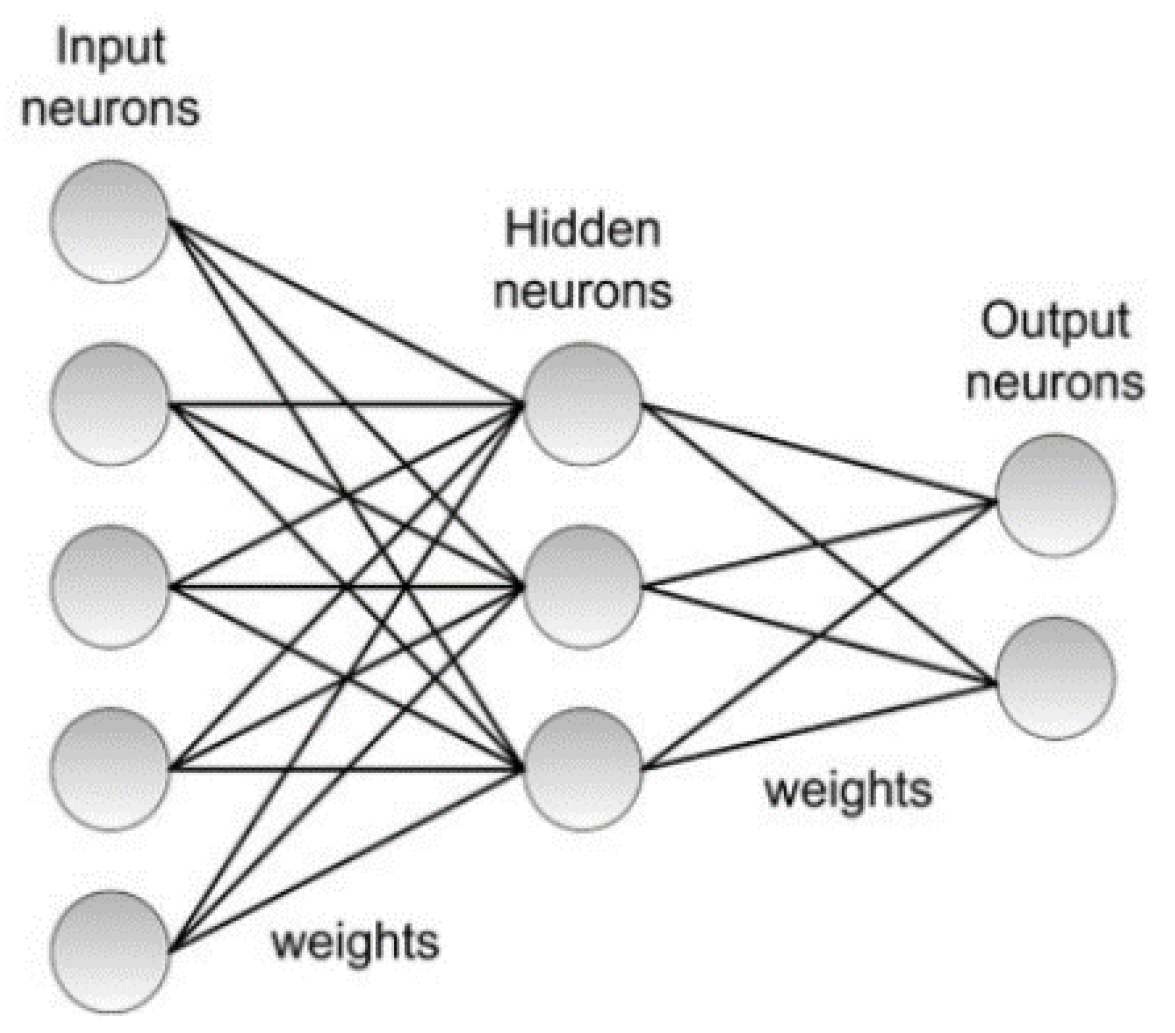
Figure 6.
An example of the process of creating wear levels, (a) use of drill bit in a bench CNC (b) the wear created in the tip of drill bit (b) the microscope.
Figure 6.
An example of the process of creating wear levels, (a) use of drill bit in a bench CNC (b) the wear created in the tip of drill bit (b) the microscope.
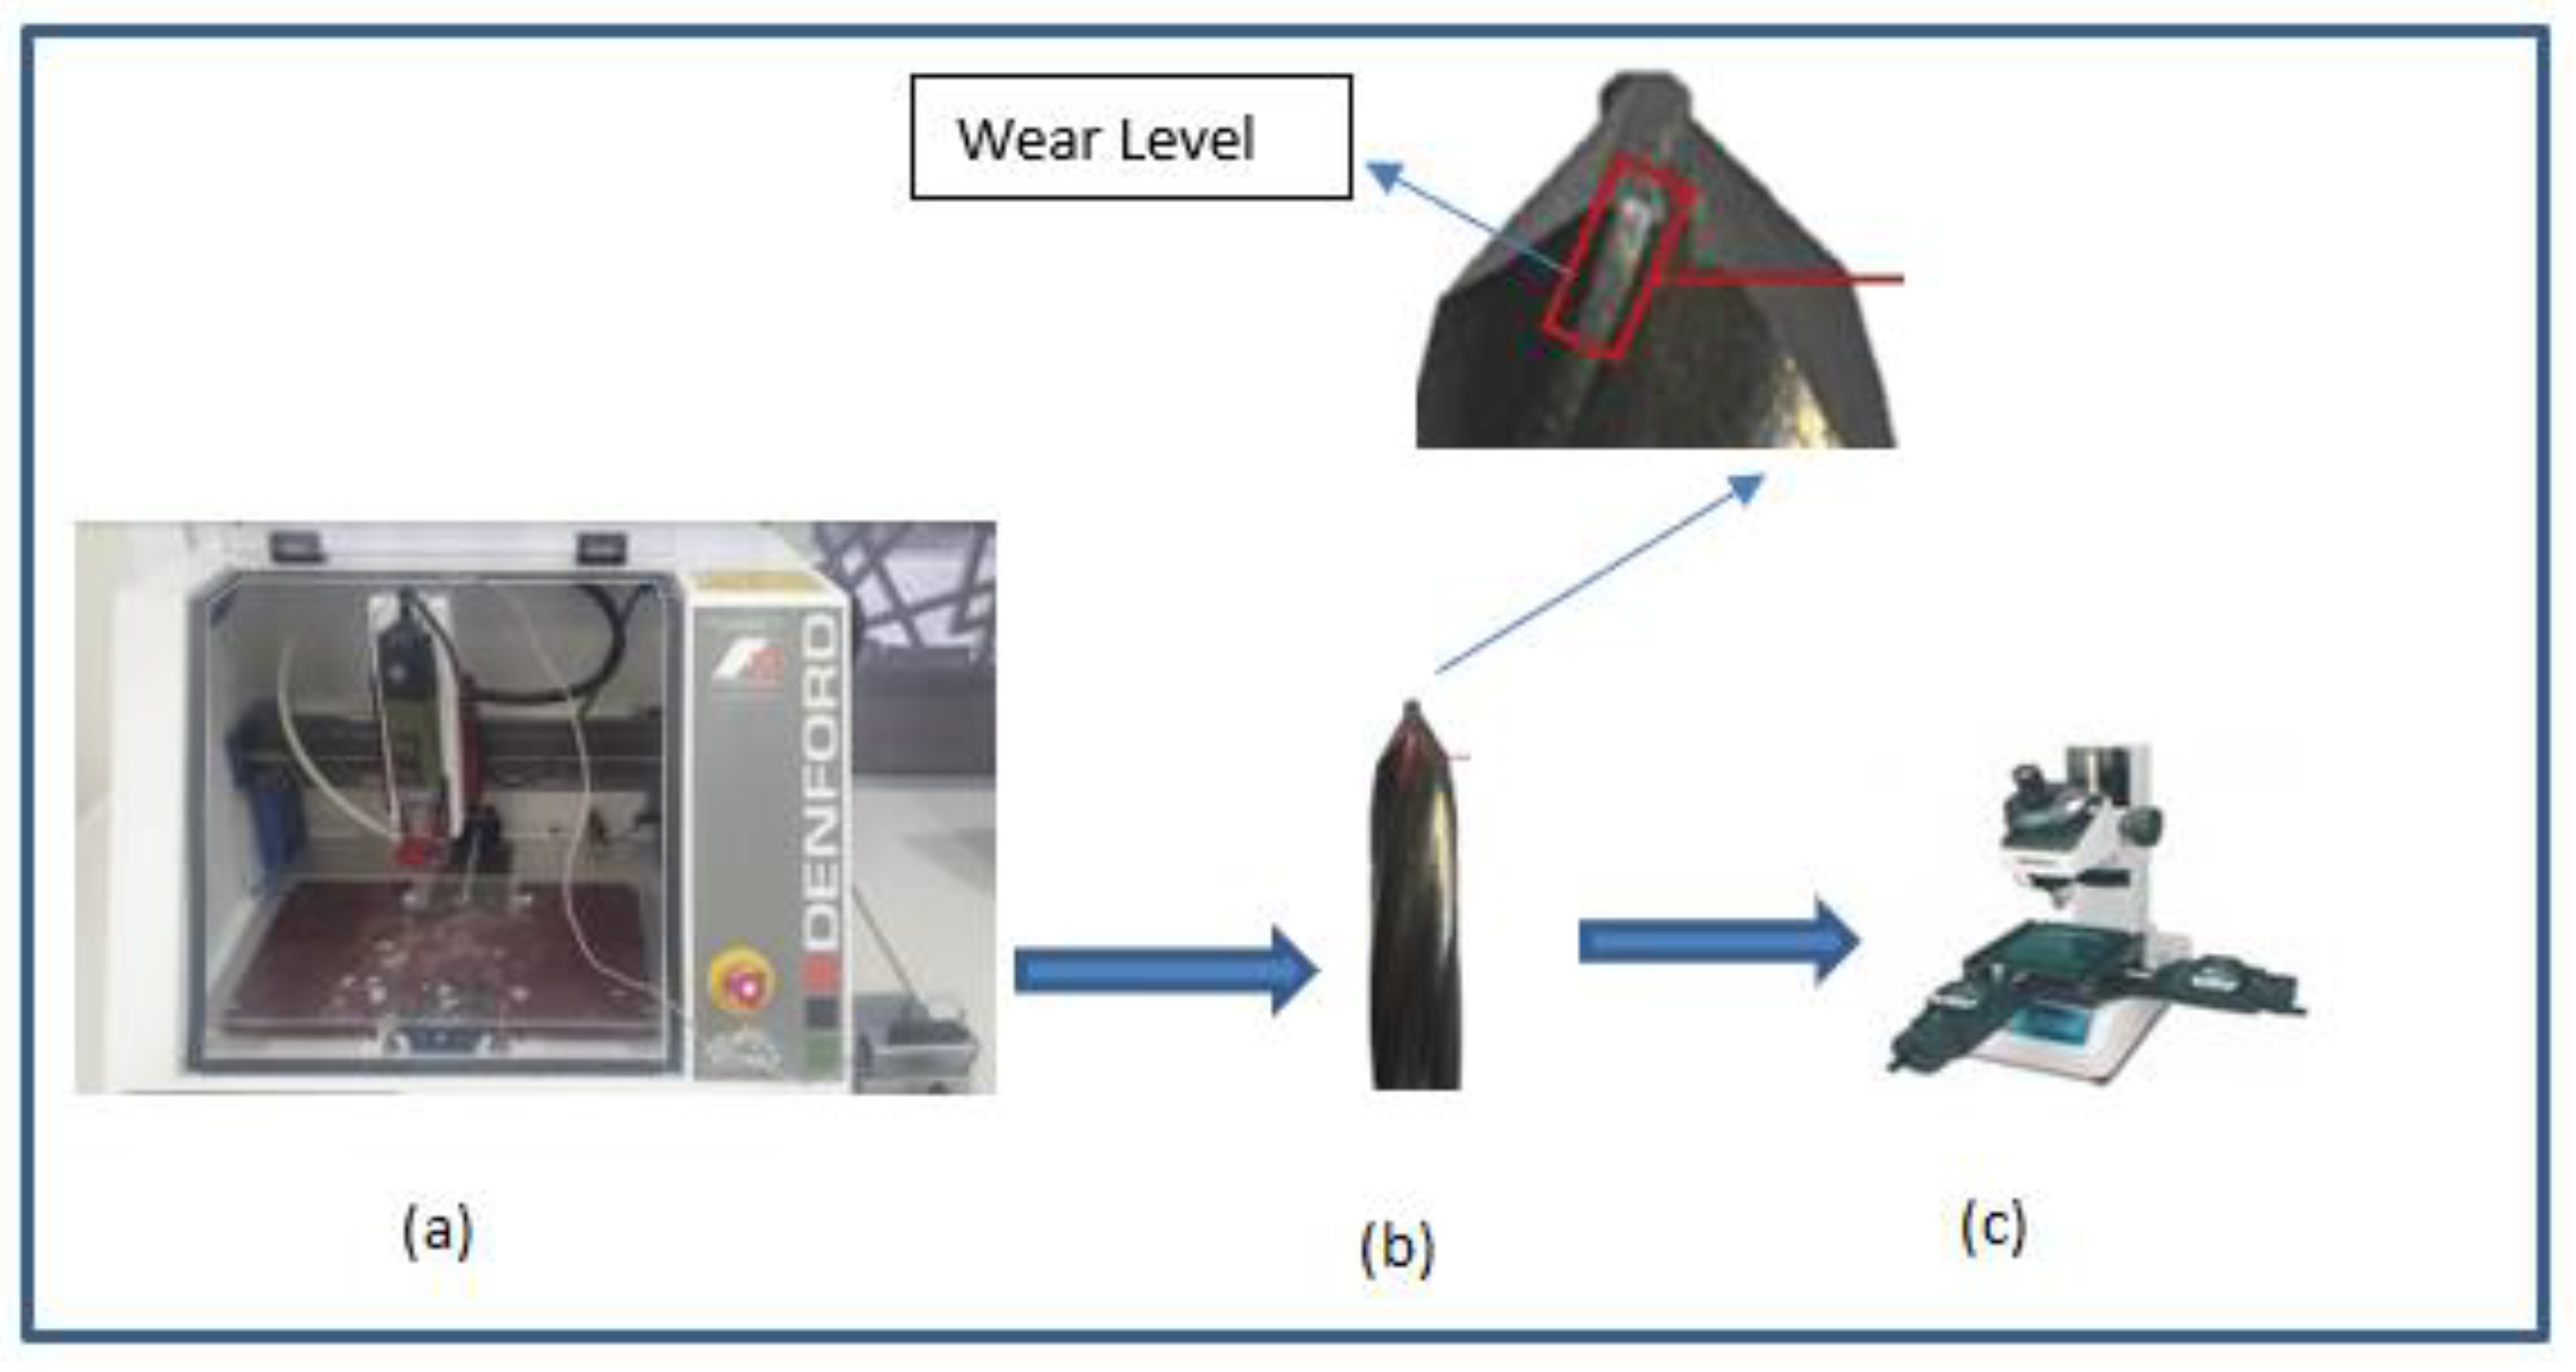
Figure 7.
The adjusting work piece and drill bit at the drilling machine.
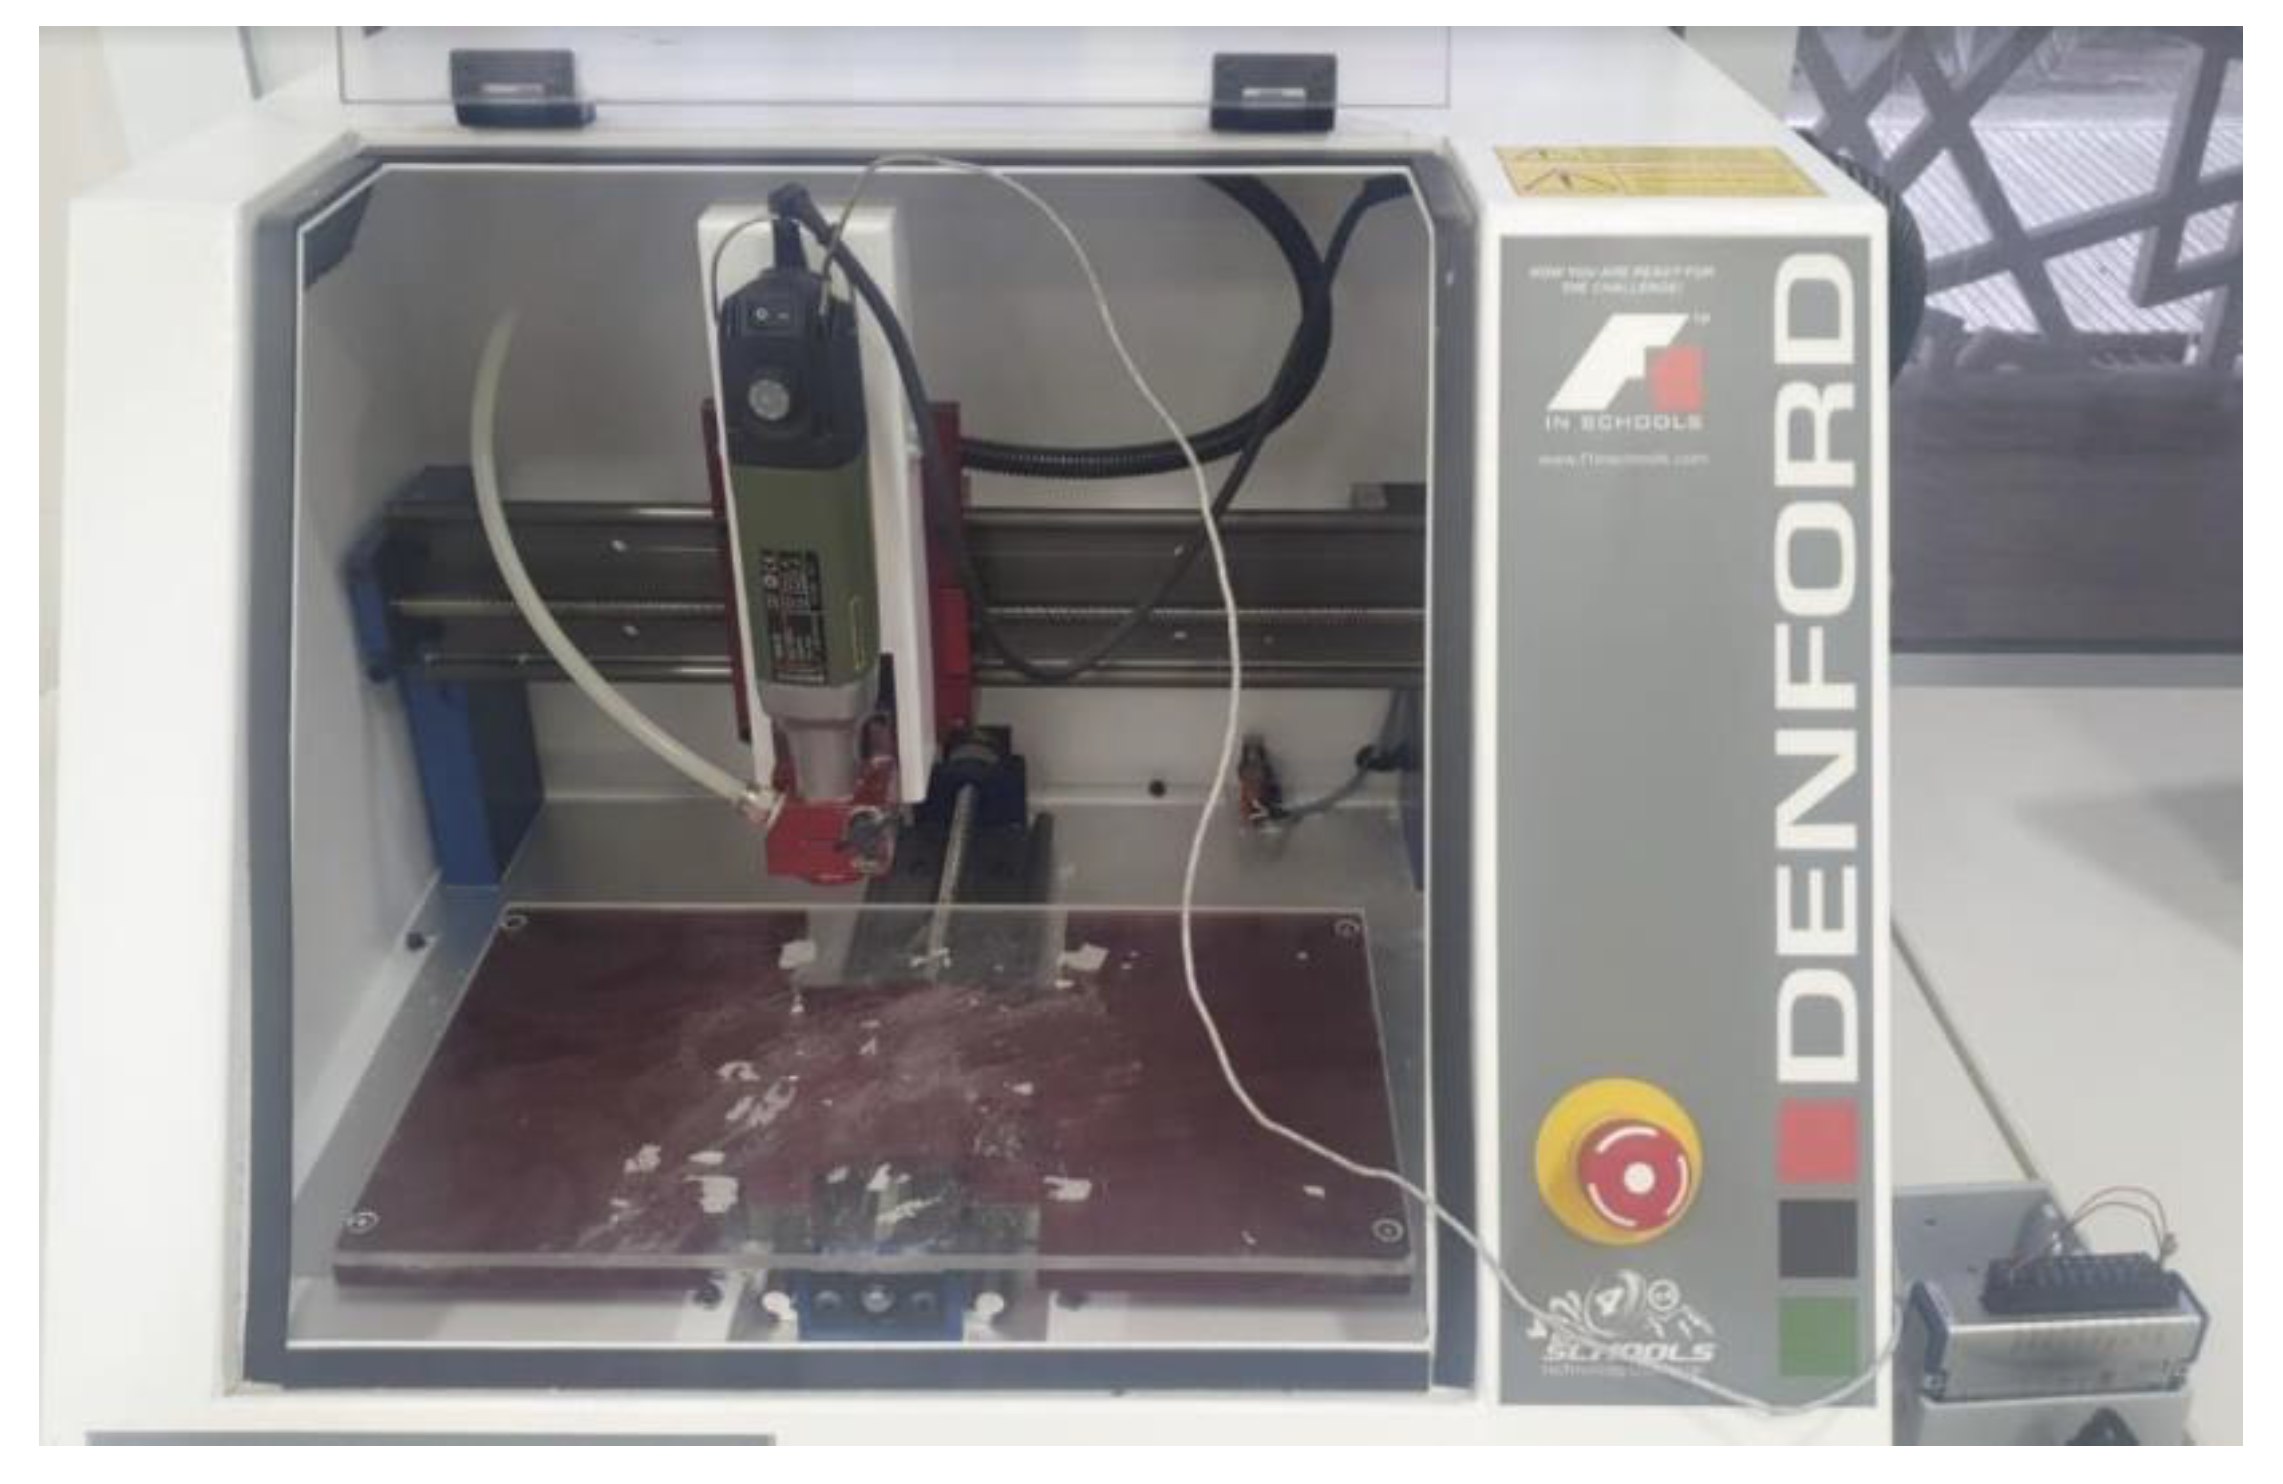
Figure 8.
the experiment setup.
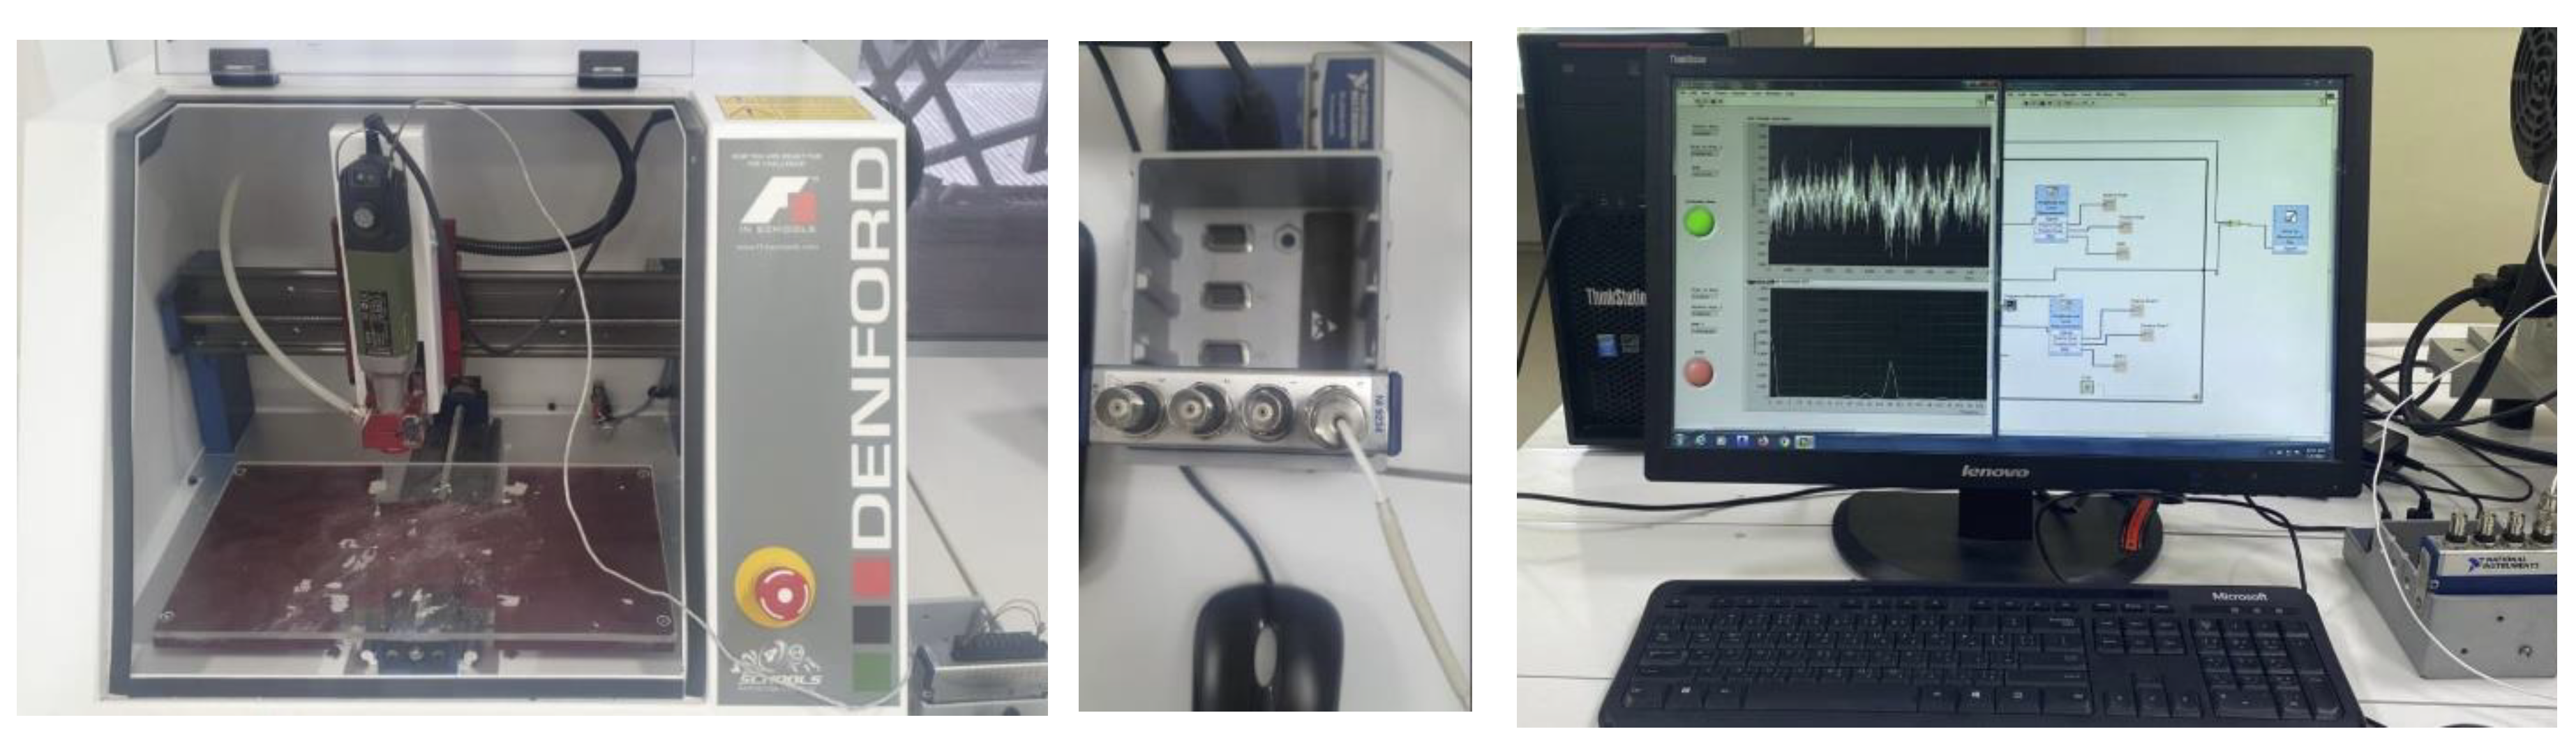
Figure 9.
The Kurtosis distribution for wavelet transform scales [healthy tool and (0.2, 0.4, 0.6) mm wear].
Figure 9.
The Kurtosis distribution for wavelet transform scales [healthy tool and (0.2, 0.4, 0.6) mm wear].
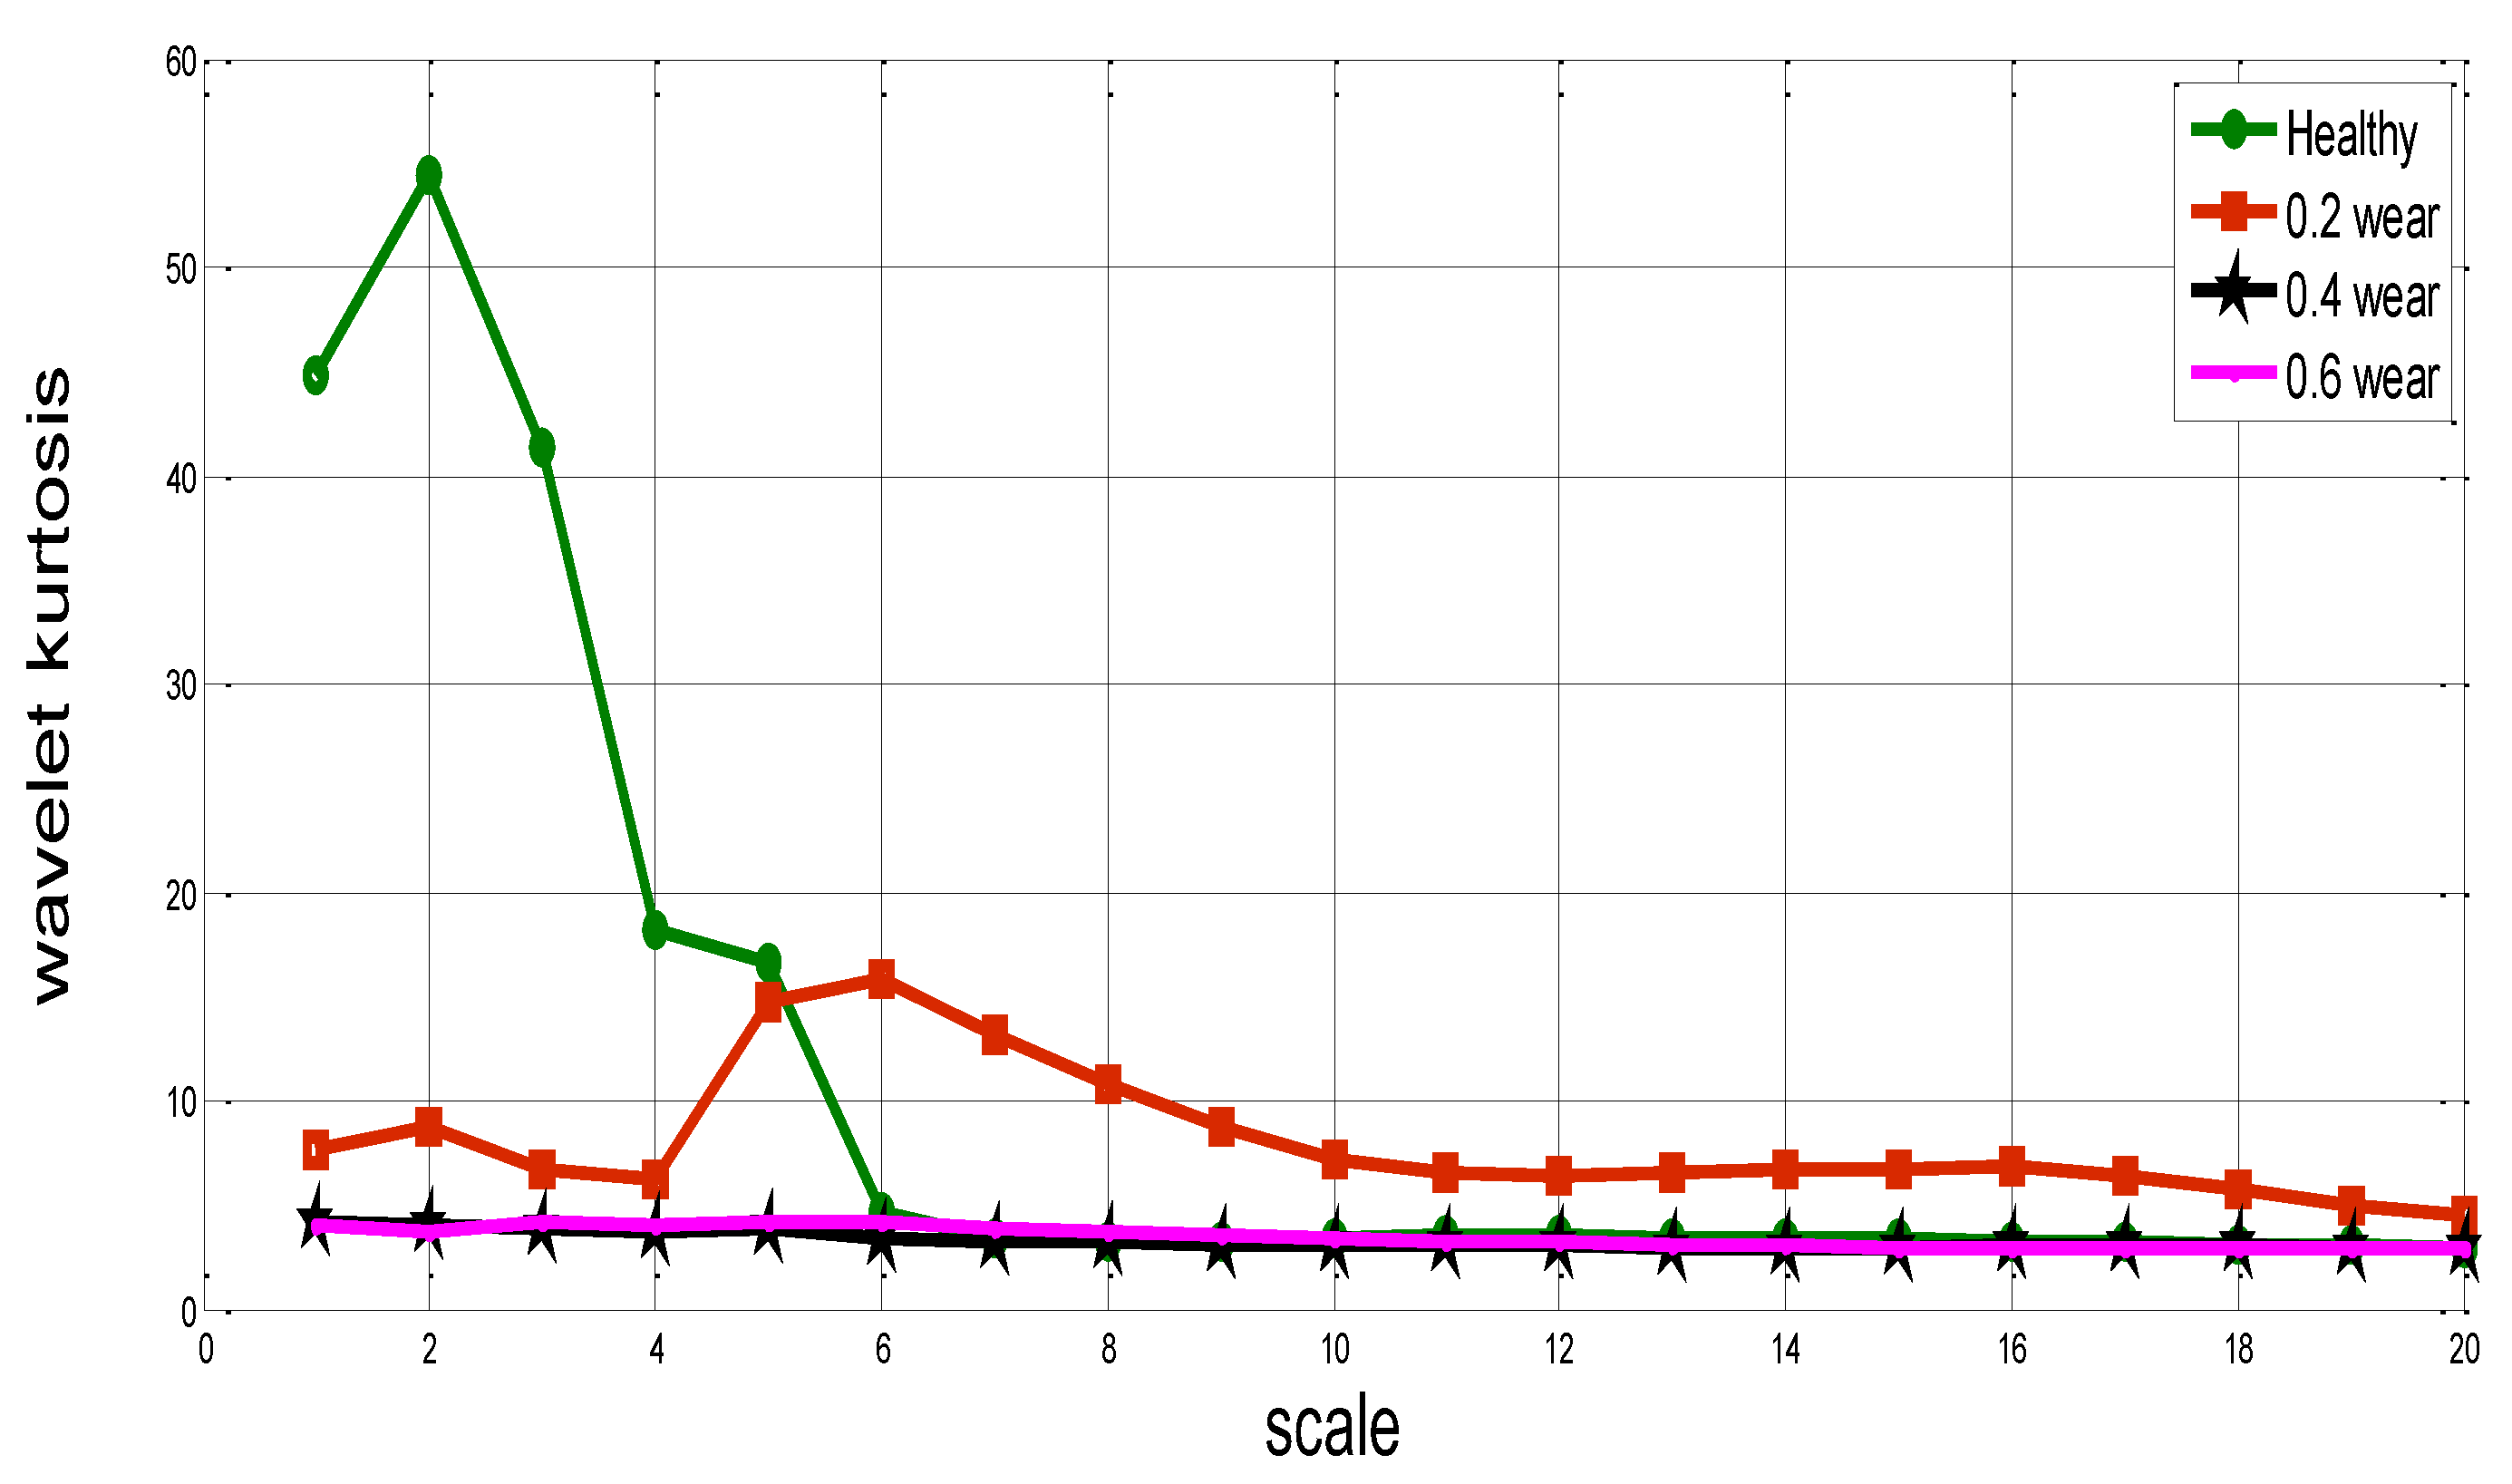
Figure 10.
(a) The average values wavelet kurtosis by the wear condition and (b-e) the histograms of healthy tool and (0.2, 0.4, 0.6) mm wear.
Figure 10.
(a) The average values wavelet kurtosis by the wear condition and (b-e) the histograms of healthy tool and (0.2, 0.4, 0.6) mm wear.
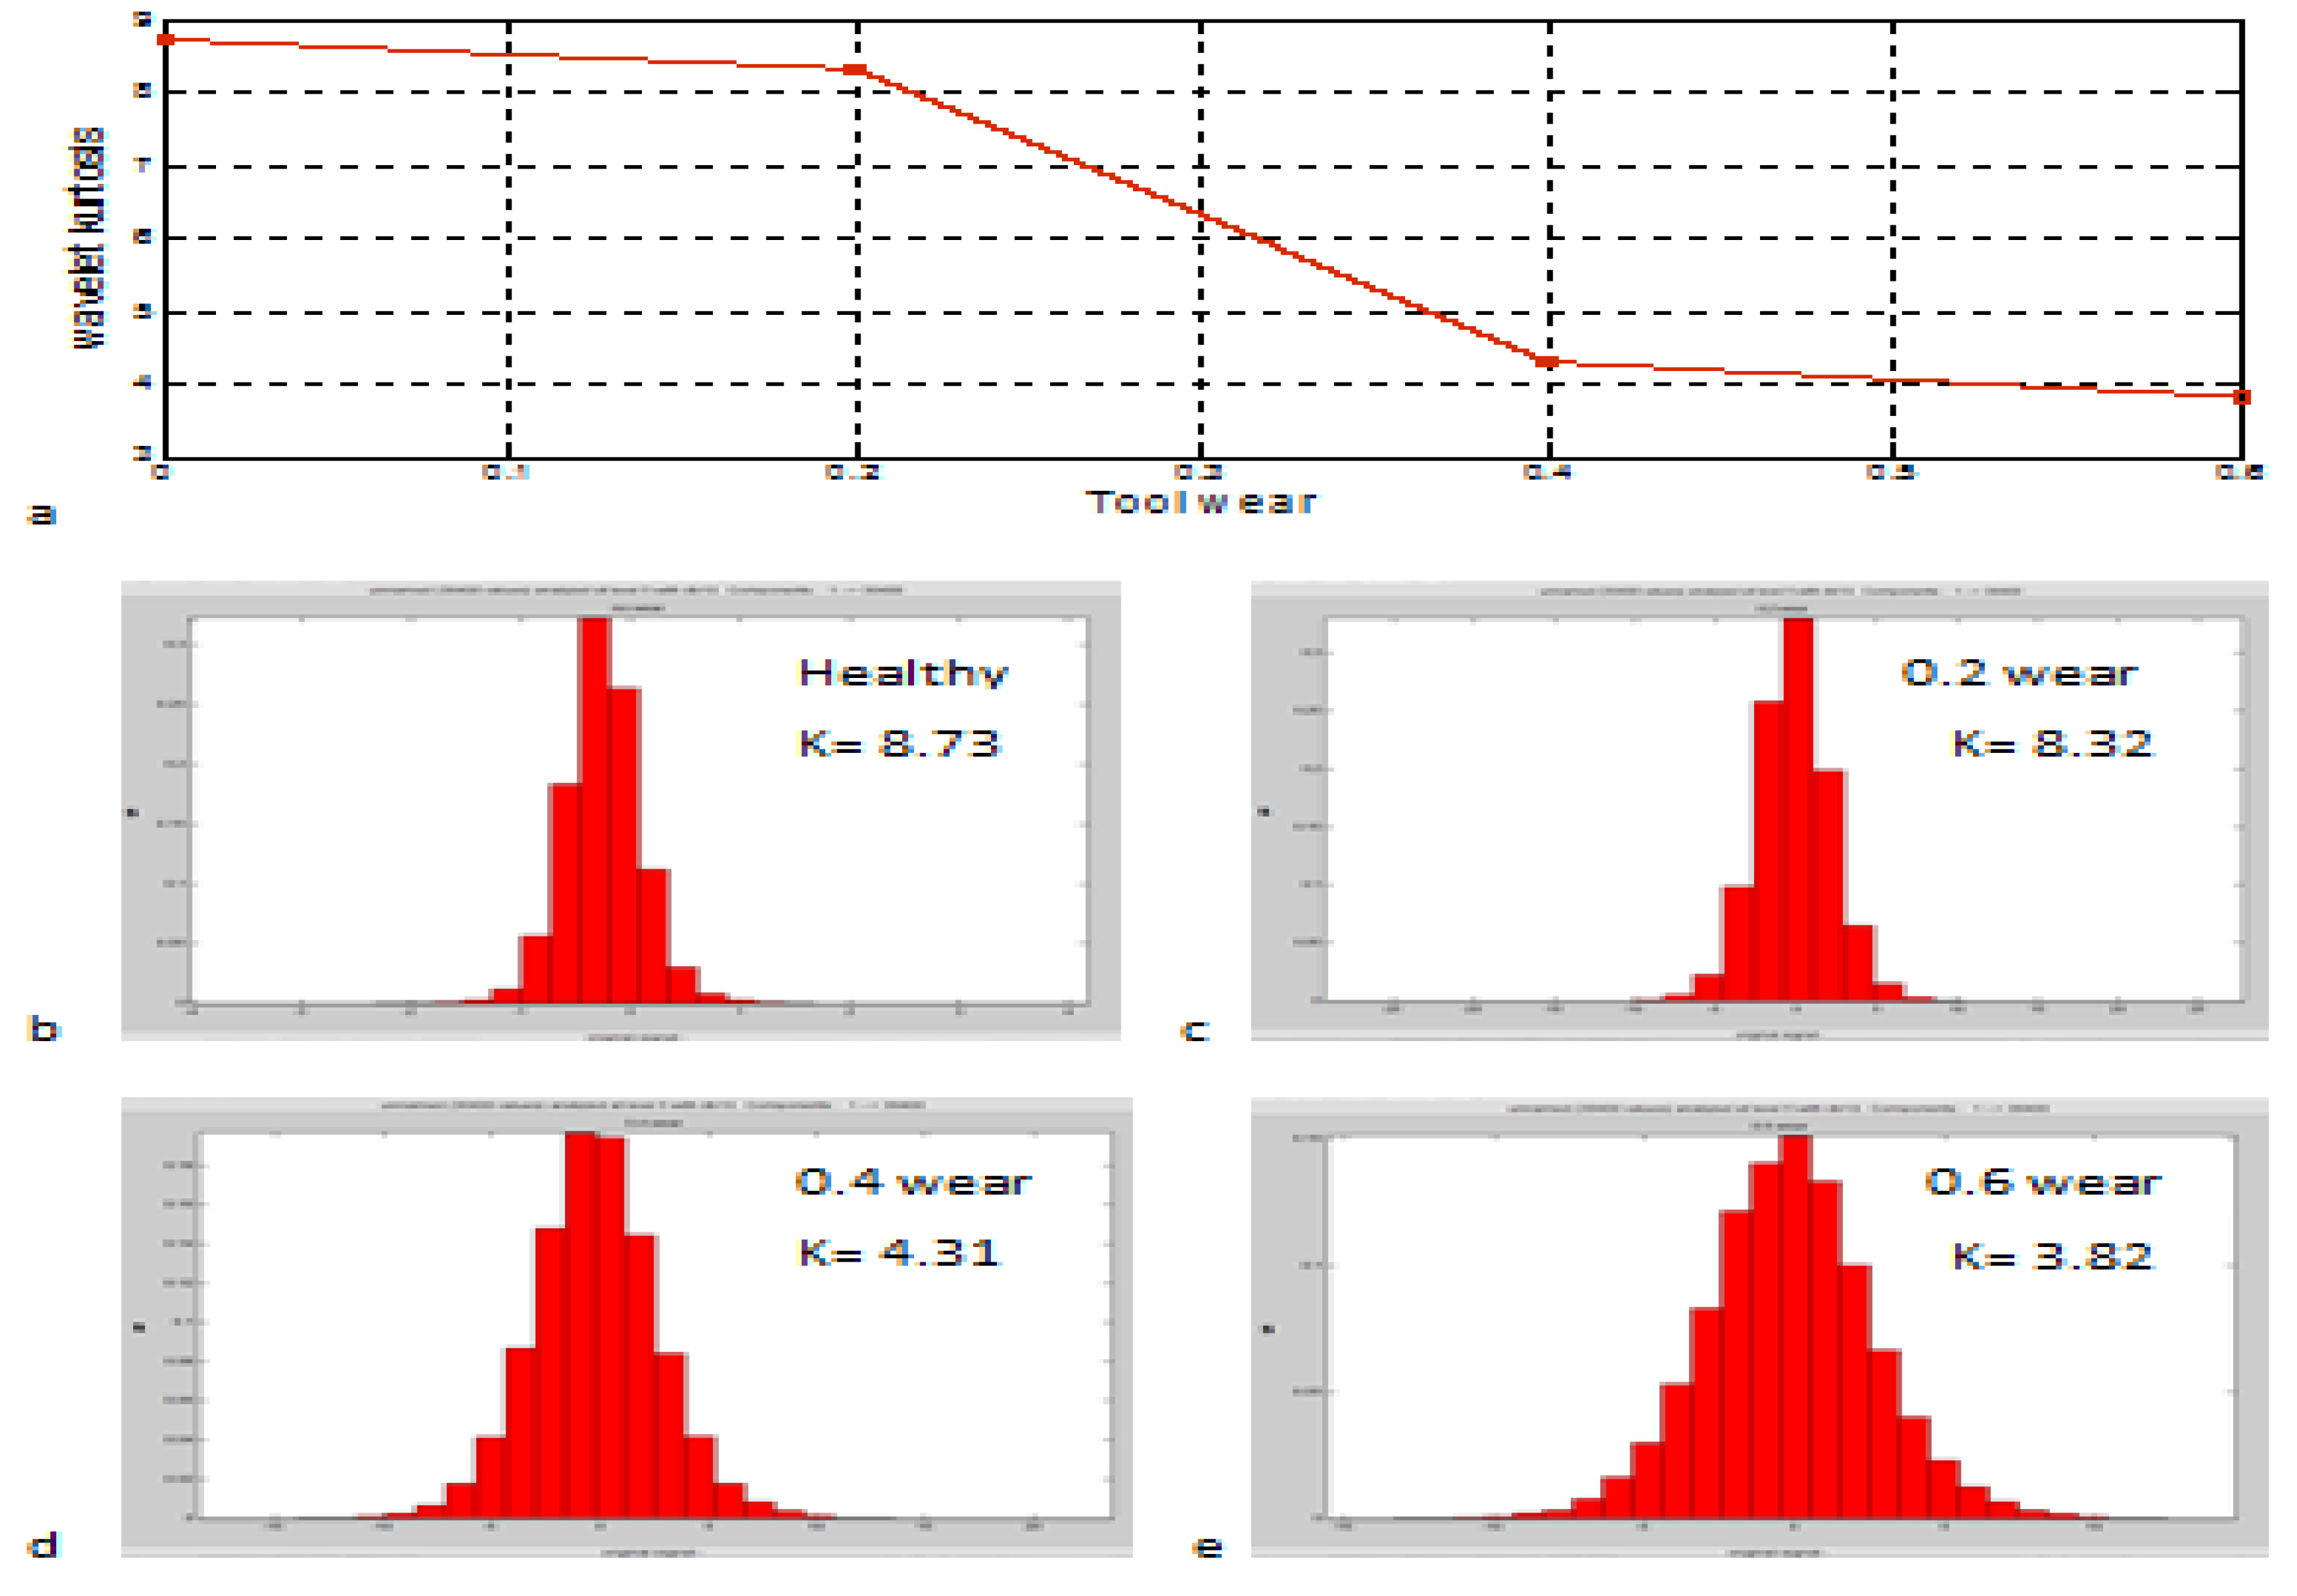
Figure 11.
The Kurtosis distribution for wavelet transform at frequency (Hz) [healthy tool and (0.2, 0.4, 0.6) mm wear].
Figure 11.
The Kurtosis distribution for wavelet transform at frequency (Hz) [healthy tool and (0.2, 0.4, 0.6) mm wear].
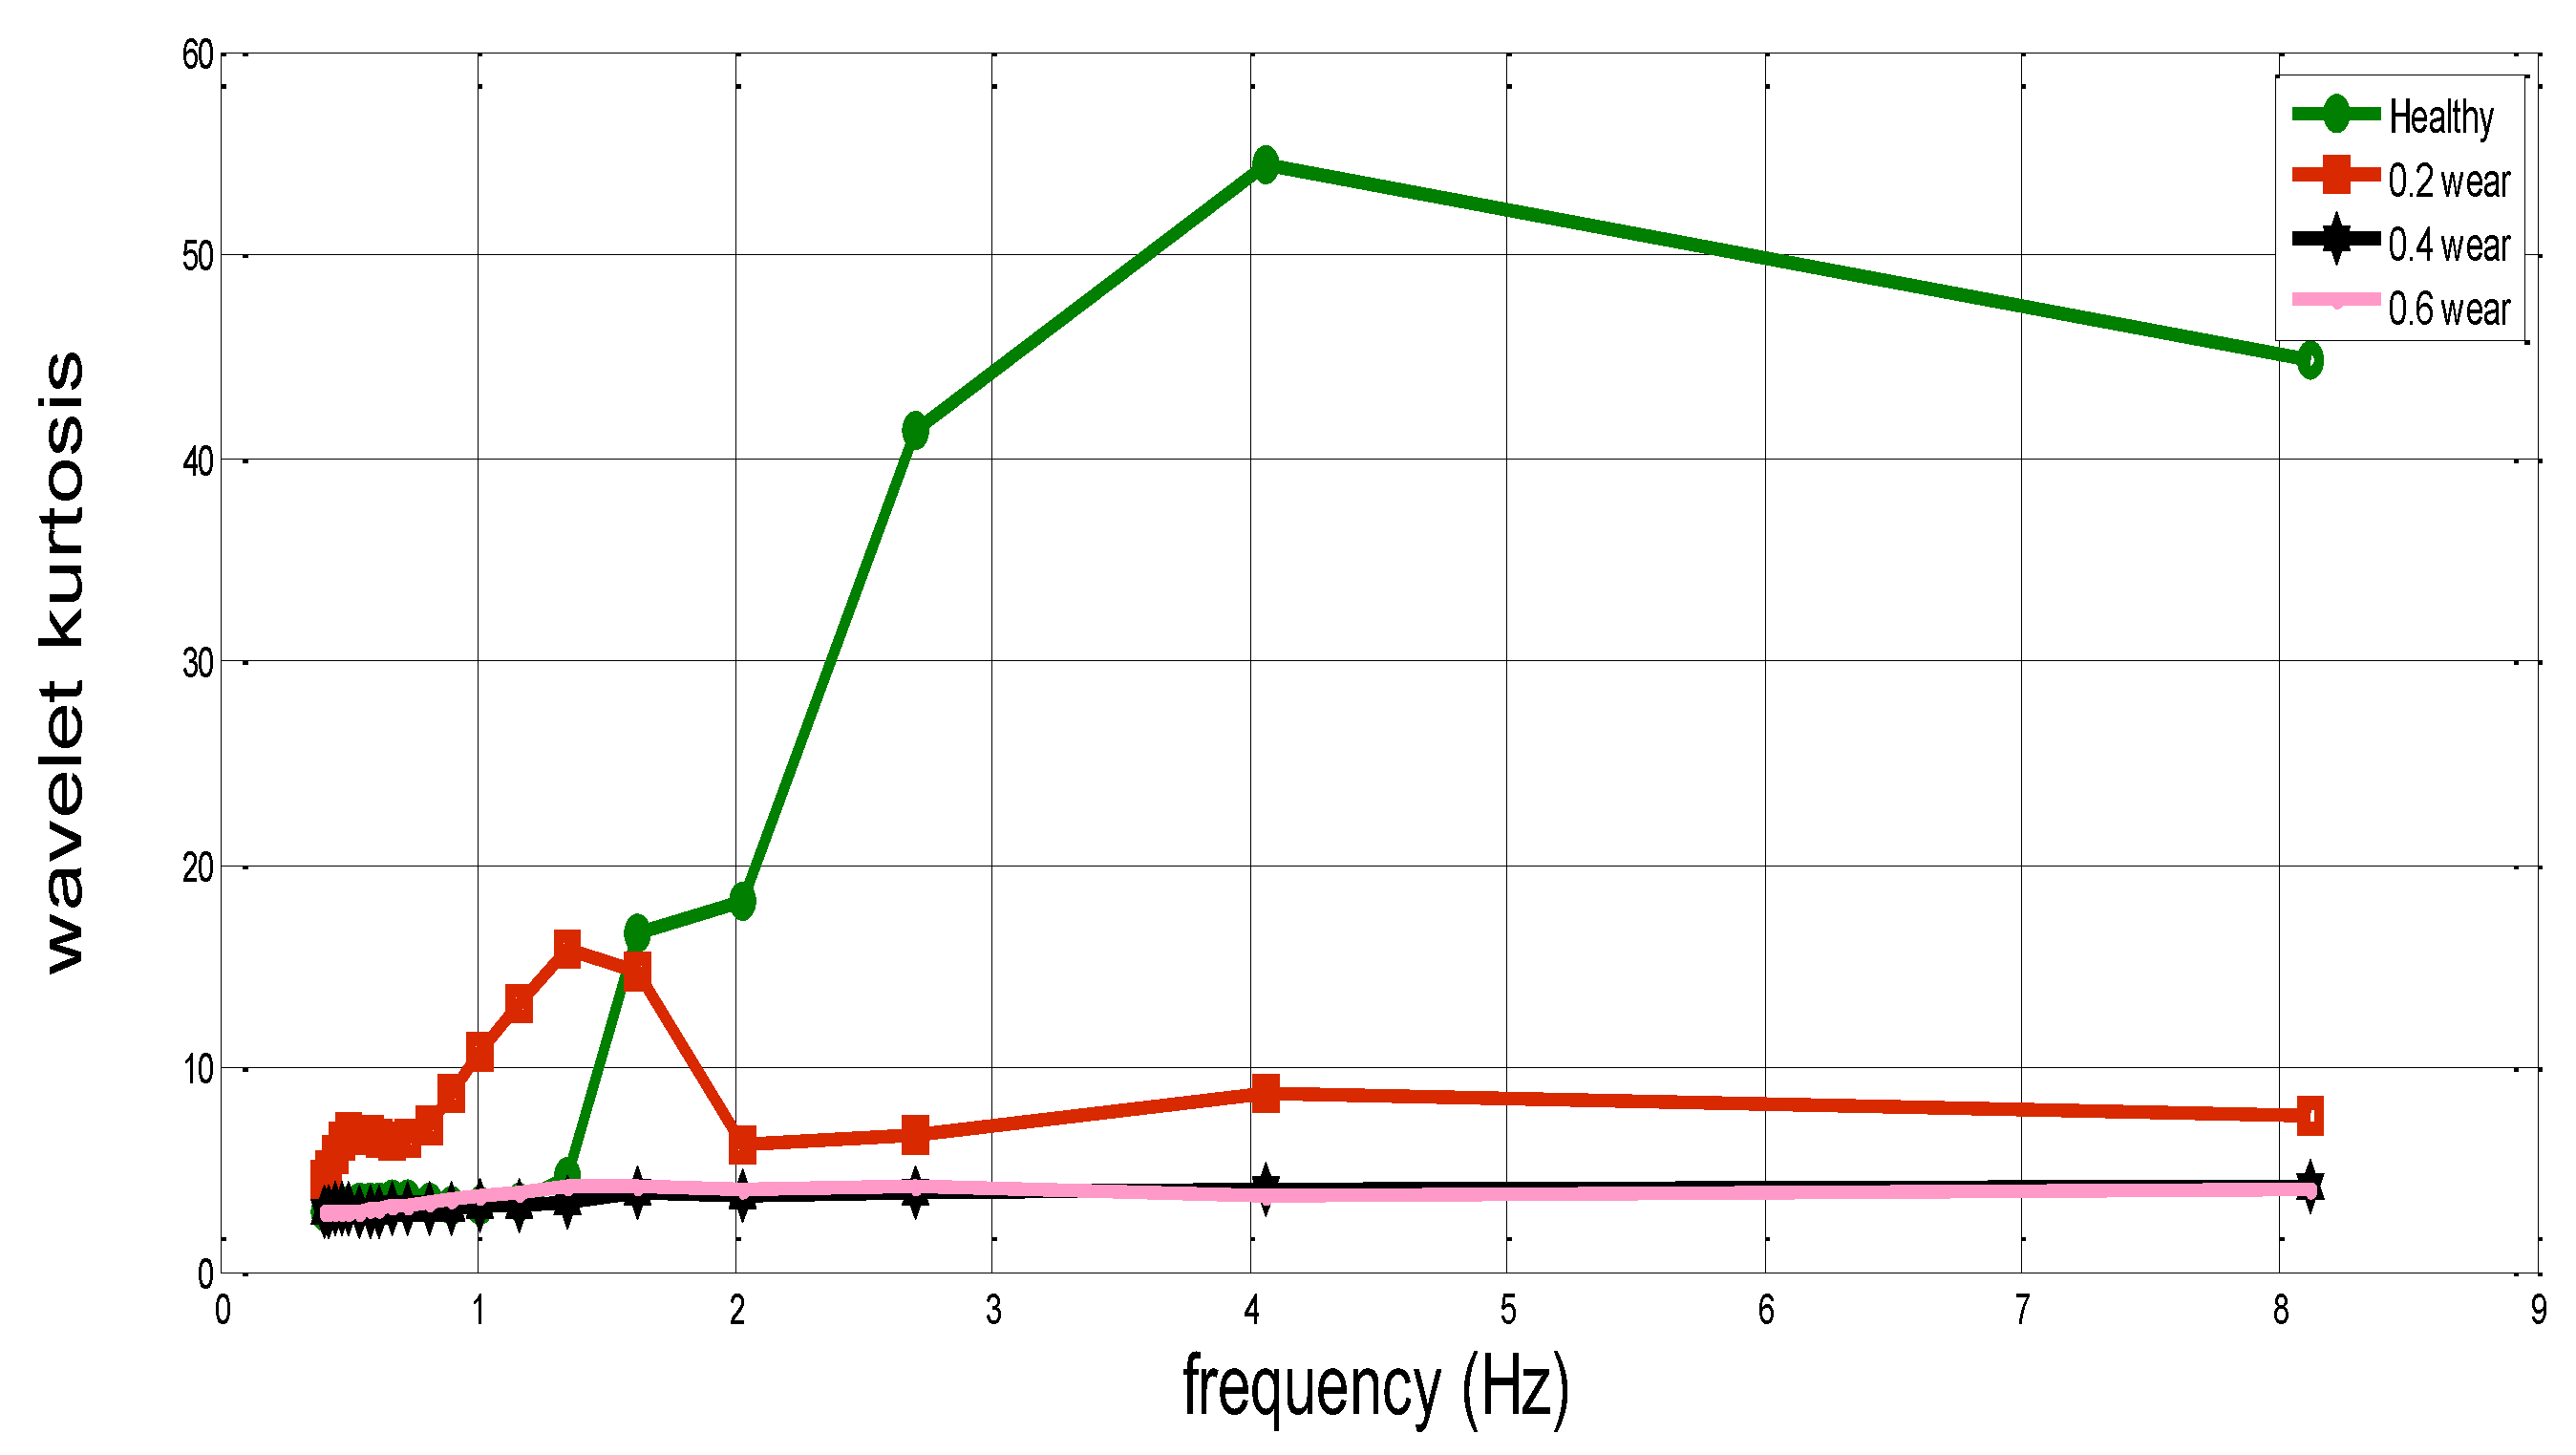
Figure 12.
The model of ANN.
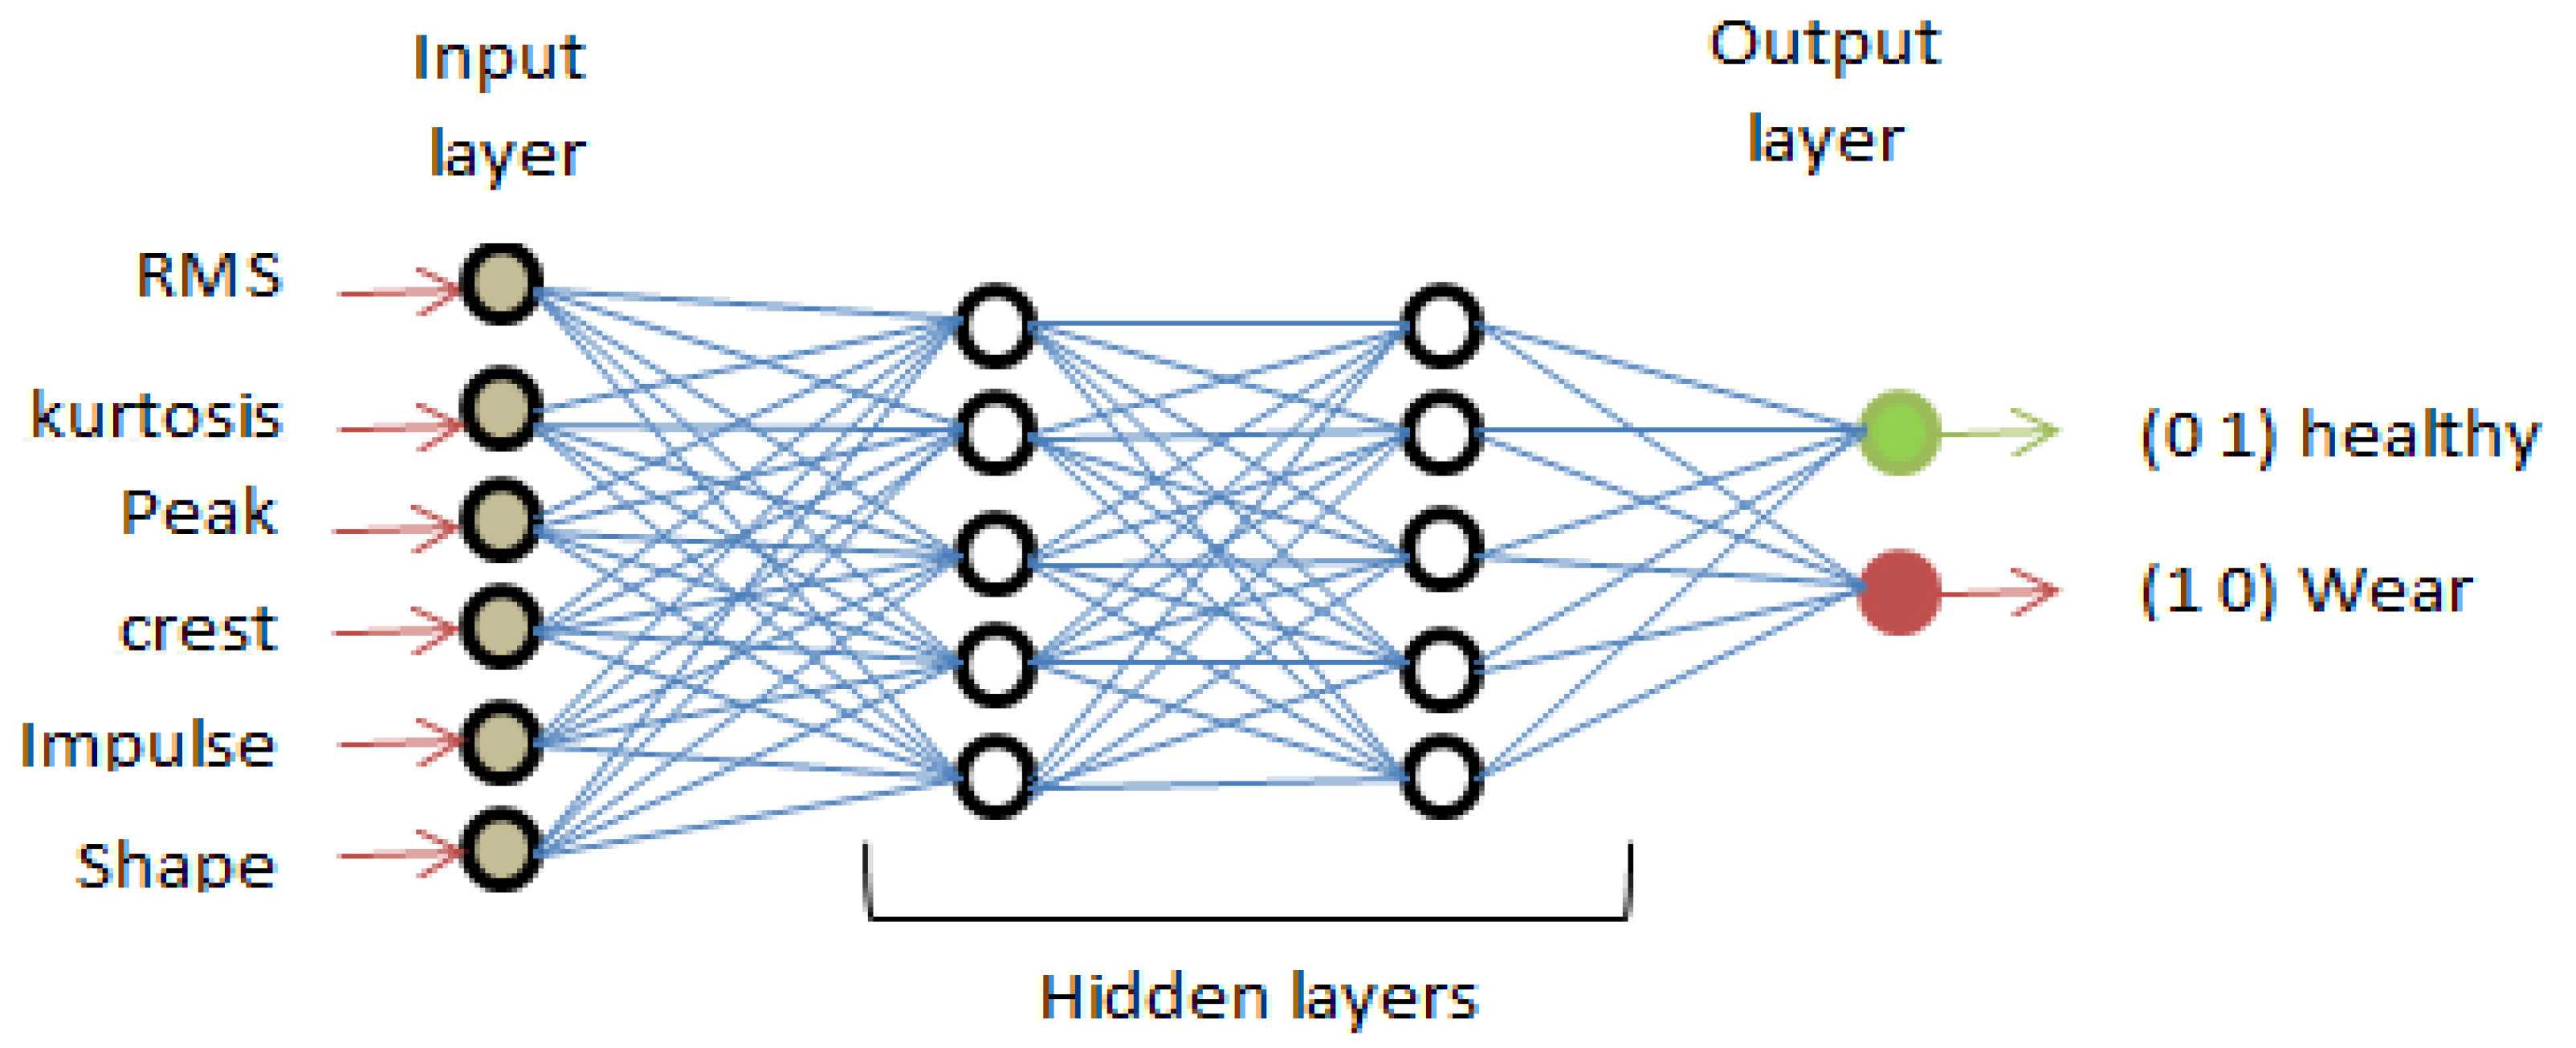
Figure 13.
Training process of ANN.
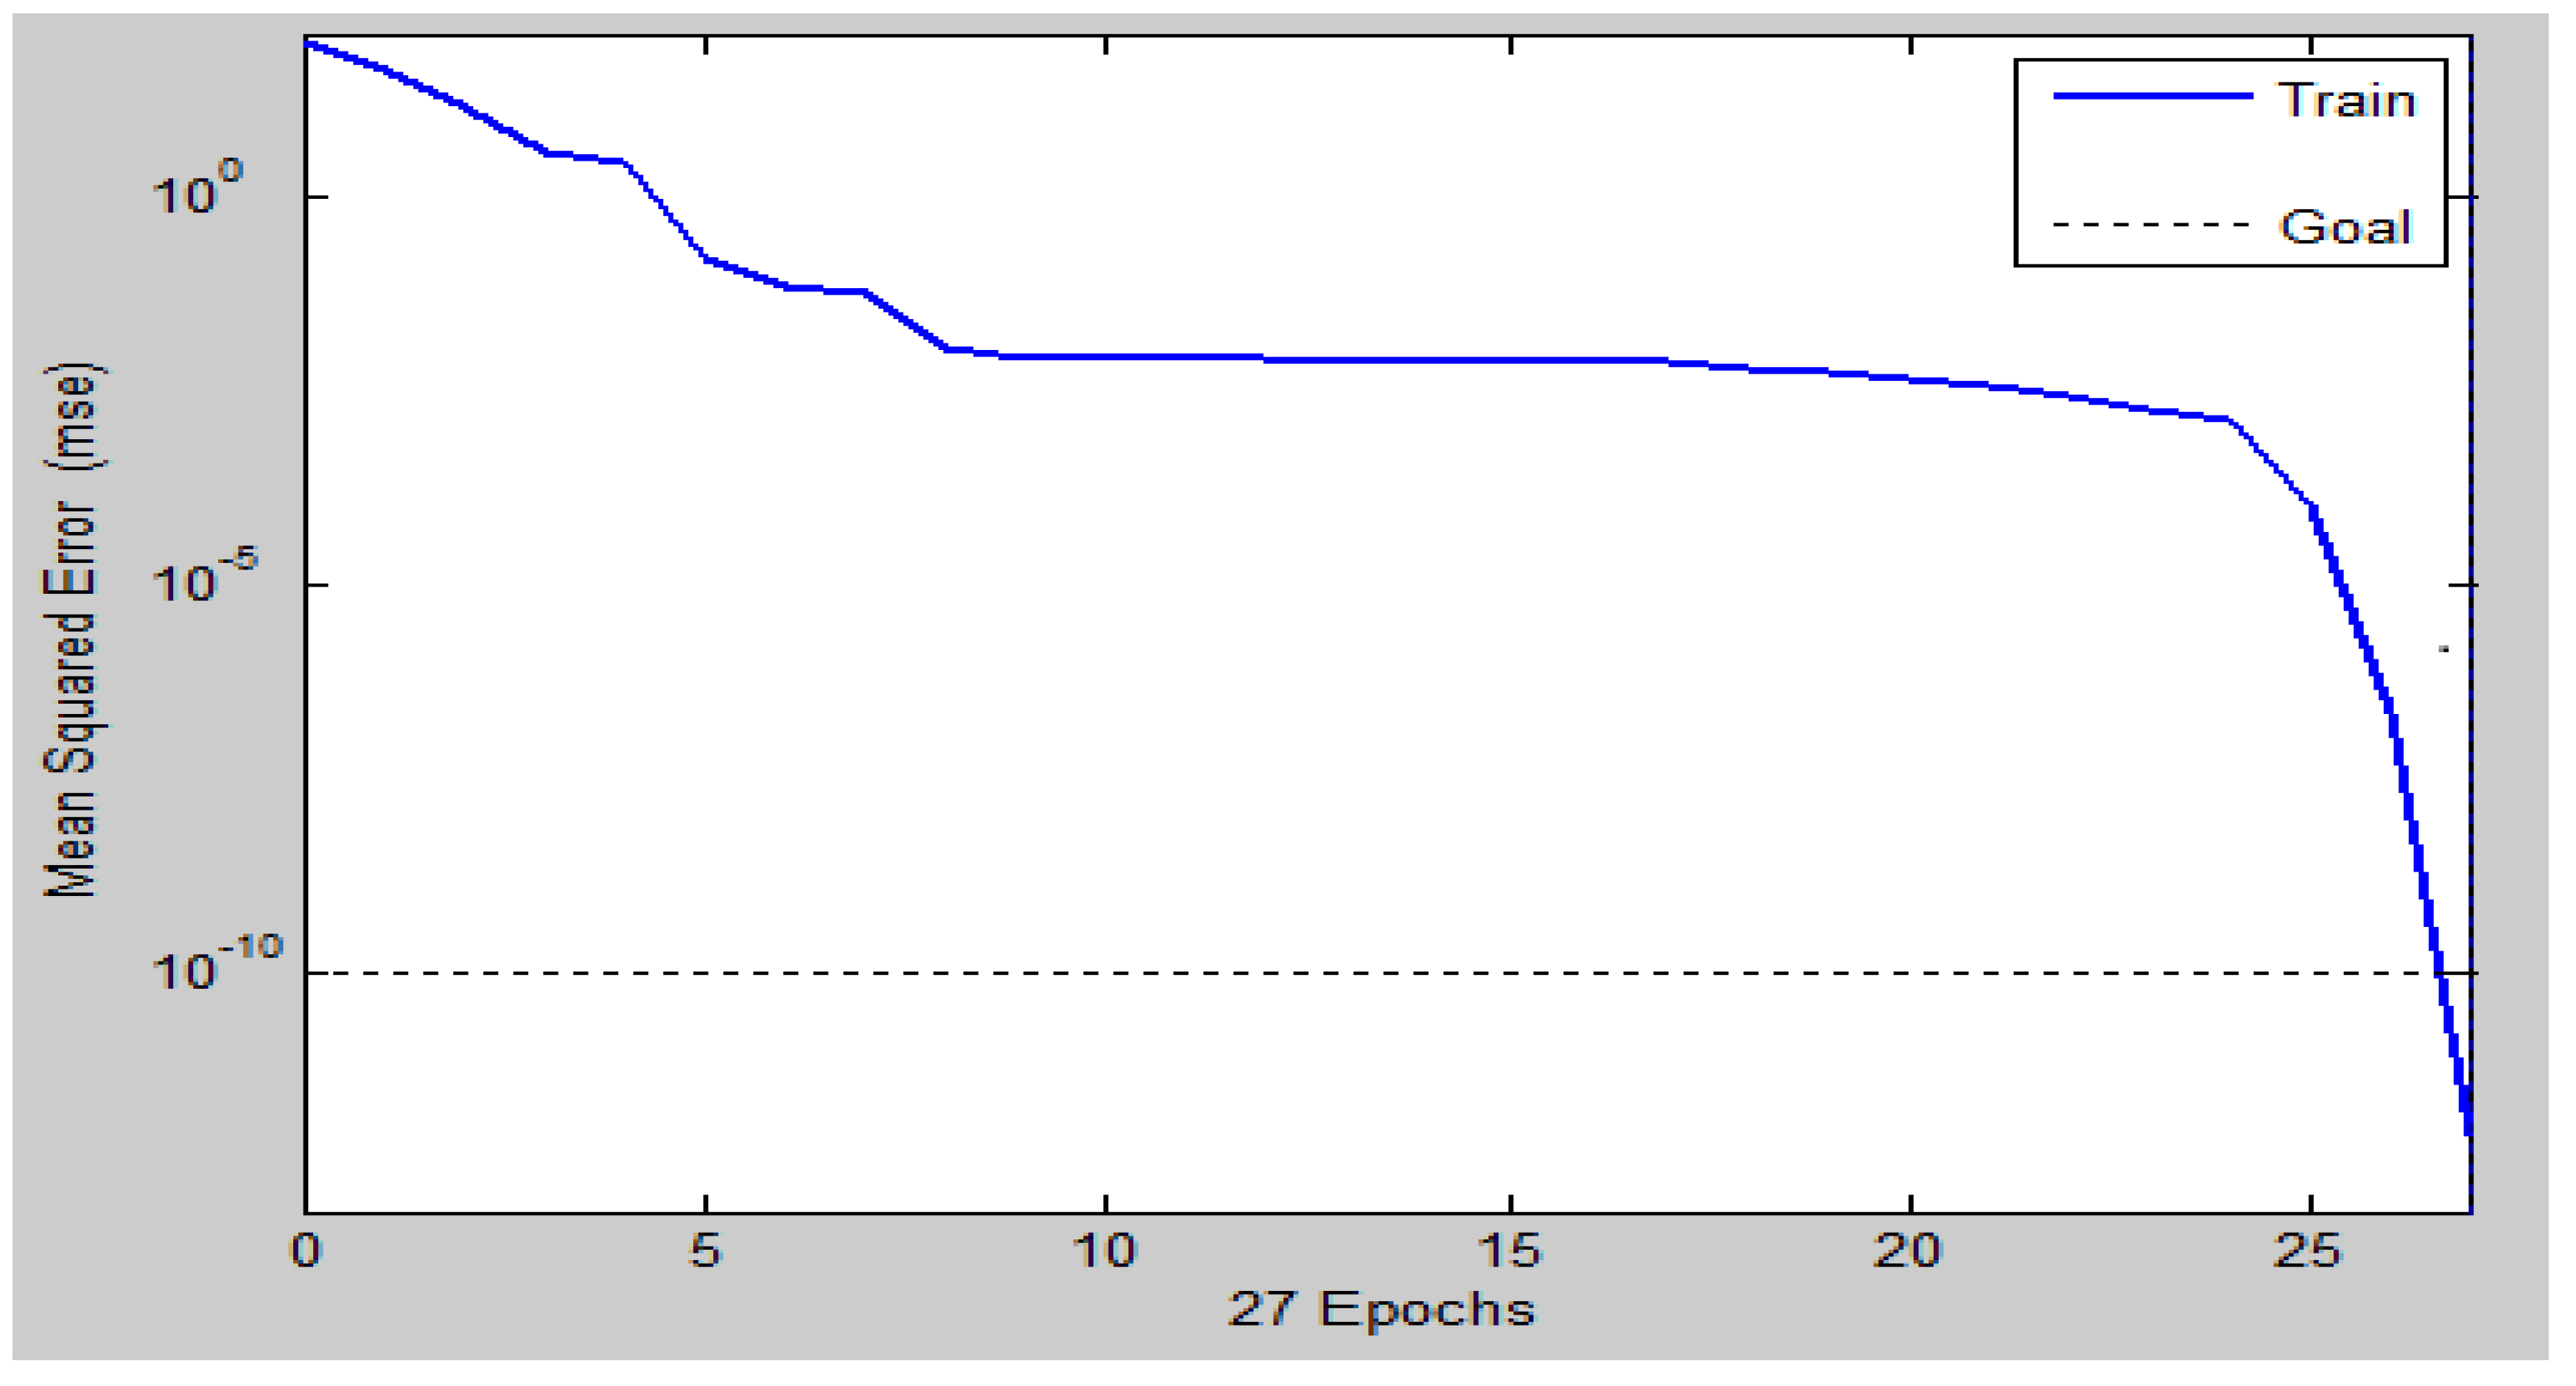
Figure 14.
The regression curve for both training targets and the ANN output.
Disclaimer/Publisher’s Note: The statements, opinions and data contained in all publications are solely those of the individual author(s) and contributor(s) and not of MDPI and/or the editor(s). MDPI and/or the editor(s) disclaim responsibility for any injury to people or property resulting from any ideas, methods, instructions or products referred to in the content. |
© 2024 by the authors. Licensee MDPI, Basel, Switzerland. This article is an open access article distributed under the terms and conditions of the Creative Commons Attribution (CC BY) license (http://creativecommons.org/licenses/by/4.0/).
Copyright: This open access article is published under a Creative Commons CC BY 4.0 license, which permit the free download, distribution, and reuse, provided that the author and preprint are cited in any reuse.


