
Submitted:
09 June 2024
Posted:
12 June 2024
You are already at the latest version
Abstract
Objective: To employ Latent Class Analysis (LCA) to investigate dietary intake patterns among Sudanese children aged 0 to 2 years and to examine the association of these patterns with sociodemographic factors.
Methods: This study leveraged the Sudan Multiple Indicator Cluster Survey (MICS) 2014 data to uncover dietary intake patterns among 7,362 children using latent class analysis (LCA). We investigated class memberships concerning demographic and socioeconomic factors. The model's adequacy was determined using several fit indices, including BIC, AIC, entropy, CAIC, and SABIC, providing a holistic evaluation of the model's accuracy in capturing dietary behaviors.
Results: Three latent classes were identified: Class 1 (55%) with an average nutrition composition, Class 2 (28%) with limited nutrition composition, and Class 3 (17%) with good nutrition composition. Significant associations were found between latent class membership and sociodemographic factors, particularly mother's education level and household wealth. The three-class solution provided the best balance between model fit and class distinction.
Conclusions: The LCA revealed distinct dietary intake patterns and underscored the influence of sociodemographic factors on child nutrition. The findings suggest that targeted nutritional interventions should be developed according to the specific needs of different latent classes. The study also highlights the utility of LCA as a robust statistical and machine learning tool in public health research, capable of informing tailored interventions and policies for improving child nutrition.
Implications: The study emphasizes the importance of maternal education and socio-economic status in shaping dietary behaviors of children in Sudan. It implies the need for policies that address educational disparities, food security, and economic development as part of comprehensive nutritional interventions.
Keywords:
Latent Class Analysis
; BIC
; AIC
; CAIC
; SABIC
; Machine Learning
; dietary patterns
; Sociodemographic Factors
; Public Health
1. Introduction
Child undernutrition remains a formidable global challenge with profound repercussions for health, growth, and cognitive development. In 2022, the World Health Organization reported an alarming 149 million children under the age of five being stunted and 45 million wasted [1]. Studies have documented the persistent adverse effects of undernutrition on the cognitive and physical development of children, emphasizing the critical nature of early intervention [2,3,4].
In Sudan, the situation is exacerbated by the combination of economic challenges, political instability, and conflict. Such factors significantly compound the difficulties in addressing child health, nutrition, and education, making the study of these areas all the more crucial [5]. The Sudan Multiple Indicator Cluster Survey (MICS) 2014 highlighted that approximately 33% of children under five were underweight, 38.2% were stunted, and 16.3% were wasted, illustrating the urgency of targeted nutritional interventions [6,7].
This study employs latent class analysis (LCA) to dissect and understand the dietary intake patterns among Sudanese children aged 0 to 2 years. LCA, as a person-centered statistical and machine learning methodology, is adept at identifying subgroups within a population based on dietary behaviors, offering a pathway to recognizing children at greater risk of undernutrition. It facilitates a granular understanding of dietary patterns, which is pivotal for the development of tailored public health policies and interventions.
The intricate nature of dietary data and the multifaceted determinants of nutritional status warrant the use of sophisticated analytical tools like LCA. This study not only advances academic knowledge on early childhood nutritional patterns in Sudan but also serves as a methodological model for applying advanced statistical and machine learning methods in the domain of public health research.
Child undernutrition, manifesting as stunting, wasting, and being underweight, presents a persistent and pervasive challenge to global health, disproportionately affecting low- and middle-income countries (LMICs). The World Health Organization (WHO) estimates that in 2022, nearly 149 million children under five were stunted, and 45 million were wasted, highlighting the extensive scale of this public health crisis [1].
Sudan, as an LMIC, mirrors this global concern, with the Sudan Multiple Indicator Cluster Survey (MICS) 2014 report revealing alarming rates of child malnutrition. It found that one-third of children under five were underweight, nearly two in five were stunted, and one in six were wasted, illustrating the severity of the nutritional challenges faced by the youngest members of the population [6,7].
The early years of life, particularly the first 1000 days from conception to a child's second birthday, are critically important for growth and development. Nutritional intake during this period lays the foundation for long-term health, cognitive development, and well-being, making the investigation of dietary patterns in this age group essential [8].
Latent Class Analysis (LCA) emerges as a powerful tool in nutritional epidemiology, allowing for the identification of homogeneous, latent subgroups within heterogeneous populations based on their dietary intake patterns. LCA's person-centered approach provides a sophisticated means to examine complex, multidimensional dietary data, revealing distinct patterns that might be obscured by traditional variable-centered approaches [9].
The incorporation of LCA in the analysis of dietary patterns among Sudanese children is particularly beneficial due to the country's diverse cultural and socio-economic landscape, which likely contributes to varying dietary behaviors. By identifying latent classes of dietary intake, researchers can pinpoint groups at greater risk for undernutrition and inform culturally appropriate, targeted interventions [10].
Furthermore, understanding the dietary patterns of children in Sudan is crucial for addressing the multifaceted drivers of undernutrition, which include not only food insecurity but also factors such as household income, maternal education, and access to healthcare services. Effective interventions must be multifarious, addressing not just the immediate provision of food but also the underlying socio-economic determinants that contribute to dietary inadequacies [11].
Objective: The objective of this study is to comprehensively investigate the dietary intake patterns among children aged 0 to 2 years in Sudan. This investigation aims to delve into dietary composition including breast feeding, liquid, and soft and solid food. By meticulously examining these dietary intake patterns, the study seeks to gain deeper insights into the nutritional status and dietary habits of infants and toddlers during this critical period of growth and development.
2. Methods:
2.1. Data
This study is grounded in data drawn from the Multiple Indicator Cluster Survey (MICS) [2], conducted in Sudan in 2014. MICS is an international household survey initiative spearheaded by UNICEF to support countries in collecting internationally comparable data on a wide range of indicators regarding the situation of children and women. The Sudan MICS 2014 data set is particularly invaluable, providing insights into the dietary behaviors and nutritional status of Sudanese children aged 0 to 2 years. This cross-sectional survey is nationally representative, ensuring that the findings are reflective of the population at large.
For the purpose of this analysis, the data set focused on a subset of the population comprising 7362 children aged 0 to 35 months. Detailed dietary intake information was collected through interviews with mothers or caretakers, who were asked about the children's consumption of various food and liquid items within the 24-hour period preceding the survey. This included breastfeeding status, intake of other milk or milk products, consumption of solid, semi-solid, or soft foods, and use of vitamin or mineral supplements among other dietary components.
The data set provided a comprehensive account of various dietary items, each denoted with a unique code, allowing for the systematic categorization and analysis of the children's dietary intake. These items ranged from basic liquids such as plain water, juices, and milk to solid foods like grains, vegetables, fruits, meats, and other protein sources. The inclusion of these diverse dietary components facilitates a thorough investigation into the children's nutritional intake patterns.
The extensive nature of the data allows for the identification of potential areas of dietary deficiency and excess, which may contribute to the overall nutritional status and health outcomes of the children. By leveraging these data, this study aims to uncover latent dietary intake patterns that may have significant implications for public health interventions and policy-making efforts aimed at improving child nutrition in Sudan.
The information presented in Table 1 displays relevant variables for analysis, including demographic characteristics, food consumption patterns, micronutrient availability, and other pertinent factors affecting children's nutrition in Sudan. By examining these data, researchers can identify trends and potential areas of intervention to improve overall child health and well-being in the country.
2.2. Latent Class Analysis:
Latent Class Analysis (LCA) is a subset of structural equation modeling used to identify unobservable subgroups within a population. This technique is particularly useful in research where the populations are heterogeneous, and the goal is to discover underlying patterns or segments that are not immediately apparent [12].
Mathematically, LCA models the probability of observing a pattern of responses as a mixture of probabilities from each latent class. The probability of an individual's response pattern can be expressed as:
[ P(X) = \sum{k=1}^{K} P(C_k) \prod{j=1}^{J} P(X_j | C_k) ]
where ( P(X) ) is the probability of a certain response pattern, ( K ) is the number of latent classes, ( C_k ) is the ( k )-th latent class, ( P(C_k) ) is the probability of membership in ( C_k ), ( J ) is the number of observed variables, and ( P(X_j | C_k) ) is the conditional probability of responding ( X_j ) given membership in ( C_k ).
The model parameters are estimated using maximum likelihood estimation, and the expectation-maximization (EM) algorithm is often employed to iteratively estimate the class membership probabilities and conditional probabilities that best fit the data [13].
In the context of dietary intake research, LCA is applied to categorize individuals into distinct classes based on their responses to dietary behavior-related questions. The key advantage of LCA is its ability to handle categorical data and its flexibility in modeling complex relationships between observed variables and the latent construct—dietary patterns in this case [10].
The method begins by positing a certain number of classes and then estimating the model parameters through maximum likelihood estimation. These parameters include the probabilities of class membership (i.e., the proportion of the population likely to belong to each class) and the item-response probabilities (i.e., the likelihood of observing specific dietary behaviors within each class) [14]. To determine the optimal number of latent classes, various statistical criteria are used, such as the Bayesian Information Criterion (BIC), Akaike's Information Criterion (AIC), the Consistent Akaike's Information Criterion (CAIC), and the Sample-Size Adjusted Bayesian Information Criterion (SABIC). A lower value in these criteria typically suggests a better model fit [15]. Additionally, entropy, a measure of classification accuracy, is utilized to assess the clarity of the class distinctions, with values closer to 1 indicating a more definitive classification [16].
In the present study, LCA allows for the nuanced exploration of children's dietary intake patterns in Sudan. By identifying latent classes, the study aims to understand the variations in dietary behaviors and to pinpoint specific nutritional risks among different subgroups. This deep dive into the data is pivotal for developing interventions that are tailored to the unique needs of each identified class, thereby enhancing their efficacy and impact.
3. results:
The study's analysis of the dietary intake dataset from the Sudan Multiple Indicator Cluster Survey (MICS) 2014 yielded a comprehensive view of the sample characteristics, model fit criteria, latent class membership probabilities, conditional probabilities of dietary intake, and class size distribution across sociodemographic and household characteristics.
As delineated in Table 2. Sample Characteristics, there was a parity in gender representation amongst the subjects, with male participation slightly higher at 50.9% compared to 49.1% female. An increased prevalence of subjects was observed within critical developmental stages of 12-23 months and 24-35 months, encapsulating the key transitional phase from exclusive breastfeeding to the incorporation of supplementary foods. The maternal education level depicted a significant variation; notably, 40.4% were without any formal education while a mere 7.3% attained higher education, possibly indicating disparities in nutritional awareness and related behaviors. Furthermore, the assessment underscored an overwhelming rural representation at 72.7%, alongside a heterogeneous distribution across different wealth index quintiles, illuminating the socioeconomic strata within the sample.
Table 3. represent the model Fit Criteria and Assessment guided the selection of the optimal number of latent classes. In the assessment of model fit for latent class analysis (LCA) conducted in this study, a range of criteria were considered, as shown in Table 3. These included the Bayesian Information Criterion (BIC), Akaike's Information Criterion (AIC), Consistent Akaike's Information Criterion (CAIC), and the Sample-Size Adjusted Bayesian Information Criterion (SABIC). As the number of classes increased from one to ten, a general improvement in model fit was observed, with decreasing values across BIC, AIC, CAIC, and SABIC. However, entropy, a key criterion reflecting the precision of classification into latent classes, indicated that a three-class solution was most appropriate. With an entropy value of 82%, it surpassed the acceptable threshold of 80%, suggesting a satisfactory level of class separation. This balance between model fit and clear class distinction underscores the importance of entropy in the selection process, ensuring that the final model is not only statistically sound but also practically interpretable.
The Elbow Plot shown in Figure 1 clearly demonstrates that choosing a three-class model was prudent, as evidenced by the onset of diminishing returns in model enhancement when additional classes are introduced.
Within the studied group, three distinct patterns of diet were identified, as shown in Table 4. The majority of the population, making up 55%, fell into Class 1 with a moderately varied diet consisting of an average nutrition composition. Class 2, which comprised 28% of the participants, was characterized by a more restrictive dietary intake, mainly limited to breastfeeding and plain water. The remaining 17% belonged to Class3, which was associated with a richer nutritional profile that included a broad spectrum of both liquids and solids.
Class 2 is characterized by a high likelihood of continued breastfeeding practices, while Class 3 is distinguished by increased probabilities of consuming a varied array of food items, suggesting a more diverse and nutritious diet. These findings are detailed in Table 5, which presents the conditional probabilities of dietary behaviors, highlighting the distinct dietary habits across the identified latent classes."
Mother's education level and wealth index quintile show a significant association with class membership, with higher education and wealth correlating with a more nutritious dietary composition. These variations in dietary patterns across different sociodemographic subgroups are comprehensively illustrated in Table 6, which outlines the class size distribution according to sociodemographic and household characteristics.
The dietary profiles of the identified latent classes, which offer a comprehensive view of the distinct dietary intake patterns among the children in the study, are visually represented in Figure 2. This figure illustrates the varying nutritional compositions and intake trends characteristic of each class.
Overall, the results from the LCA provided compelling evidence of diverse dietary intake patterns among Sudanese children aged 0 to 2 years. The findings underscore the importance of considering sociodemographic factors when designing nutritional interventions and policies tailored to different subgroups within the population. The variation in dietary patterns highlights the need for targeted strategies that address the specific nutritional requirements and challenges faced by each latent class to improve the overall nutritional status of children in Sudan.
4. Discussion and Implications:
The utilization of Latent Class Analysis (LCA) in the assessment of dietary intake patterns among Sudanese children has revealed distinct subgroups with different nutritional profiles. This method has crucial implications for the design and implementation of health policies and nutritional interventions.
Firstly, the findings imply that interventions should be tailored to the specific needs of each latent class identified. For Class 2, which demonstrates a limited nutrition composition, there is a clear implication for initiatives that promote a more diverse diet beyond breastfeeding and water. This could include community-based programs to improve knowledge and practices around complementary feeding.
Secondly, the association between maternal education and dietary patterns implies that improving women's access to education could be an impactful strategy for enhancing child nutrition. Educational programs focused on nutrition could be integrated into existing maternal and child health services to reach mothers at an early stage.
Moreover, the urban-rural divide and wealth disparities suggest that socio-economic factors play a significant role in nutritional outcomes. Therefore, there is an implication for policies aimed at reducing poverty, improving food security, and enhancing the overall socio-economic status of households.
On a broader scale, the success of LCA in this study implies that similar statistical and machine learning tools could be leveraged to analyze other dimensions of healthcare and social issues. LCA and related methodologies could be used to understand patient behaviors in healthcare settings, adherence to treatment regimens, and to identify at-risk populations for various diseases. In social science research, these tools can help develop interventions that address the needs of specific subgroups within larger populations, such as adolescents at risk of substance abuse or communities with particular vulnerabilities.
5. Conclusion:
This study's application of Latent Class Analysis has significant implications for both public health practice and policy. The differentiated approach suggested by the study's results can lead to more effective and efficient use of resources by targeting specific needs rather than a one-size-fits-all approach. The role of LCA in this research initiative demonstrates the potential for such analytical tools to provide deeper insights into complex health and social issues, enabling the development of tailored strategies to improve outcomes.
As the fields of healthcare and social sciences continue to evolve, the integration of advanced statistical and machine learning tools like LCA will likely become increasingly important. These methodologies can help stakeholders understand the multifaceted nature of human behavior, informing interventions that are not only evidence-based but also finely tuned to the socio-demographic realities of target populations.
References
- World Health Organization. (2022). Malnutrition Fact Sheet. https://www.who.int/news-room/fact-sheets/detail/malnutrition.
- Georgiadis, A. , & Penny, M. E. (2017). Child undernutrition: opportunities beyond the first 1000 days. The Lancet Public Health. The Lancet Public Health.
- Kesari, K. K. , & Handa, R. (2010). Effect of undernutrition on cognitive development of children. ResearchGate.
- Morley, R. , & Lucas, A. (1997). Nutrition and cognitive development. Academia.edu.
- Abu-Fatima, O. , Abbas, A. A. G., Racalbuto, V., & Babiker, Z. (2021). Child undernutrition in Sudan: the social and economic impact and future perspectives. The American Journal of Tropical Medicine and Hygiene. NCBI.
- UNICEF. (2014). Multiple Indicator Cluster Survey (MICS) 2014, [Data set]. UNICEF.
- UNICEF. (2014). Sudan Multiple Indicator Cluster Survey (MICS) 2014 Report.
- Bhutta, Z. A. , et al. (2013). Evidence-based interventions for improvement of maternal and child nutrition: what can be done and at what cost? The Lancet, 382(9890), 452-477. [CrossRef]
- Collins, L. M. , & Lanza, S. T. (2010). Latent Class and Latent Transition Analysis: With Applications in the Social, Behavioral, and Health Sciences. Wiley.
- Muthén, B. , & Muthén, L. K. (2000). Integrating person-centered and variable-centered analyses: Growth mixture modeling with latent trajectory classes. Alcoholism: Clinical and Experimental Research, 24(6), 882-891. [CrossRef]
- Black, R. E. , et al. (2013). Maternal and child undernutrition and overweight in low-income and middle-income countries. The Lancet, 382(9890), 427-451. [CrossRef]
- McCutcheon, A. L. (1987). Latent Class Analysis. Sage Publications. ISBN 9780803927520.
- Dempster, A. P. , Laird, N. M., & Rubin, D. B. (1977). Maximum Likelihood from Incomplete Data via the EM Algorithm. Journal of the Royal Statistical Society, 39(1), 1-38.
- Hagenaars, J. A. , & McCutcheon, A. L. (Eds.). (2002). Applied Latent Class Analysis. Cambridge University Press.
- Nylund, K. L. , Asparouhov, T., & Muthén, B. O. (2007). Deciding on the number of classes in latent class analysis and growth mixture modeling: A Monte Carlo simulation study. Structural Equation Modeling, 14(4), 535-569. [CrossRef]
- Celeux, G. , & Soromenho, G. (1996). An entropy criterion for assessing the number of clusters in a mixture model. Journal of Classification, 13(2), 195-212. [CrossRef]
Figure 1.
Elbow plot for model fit criteria.
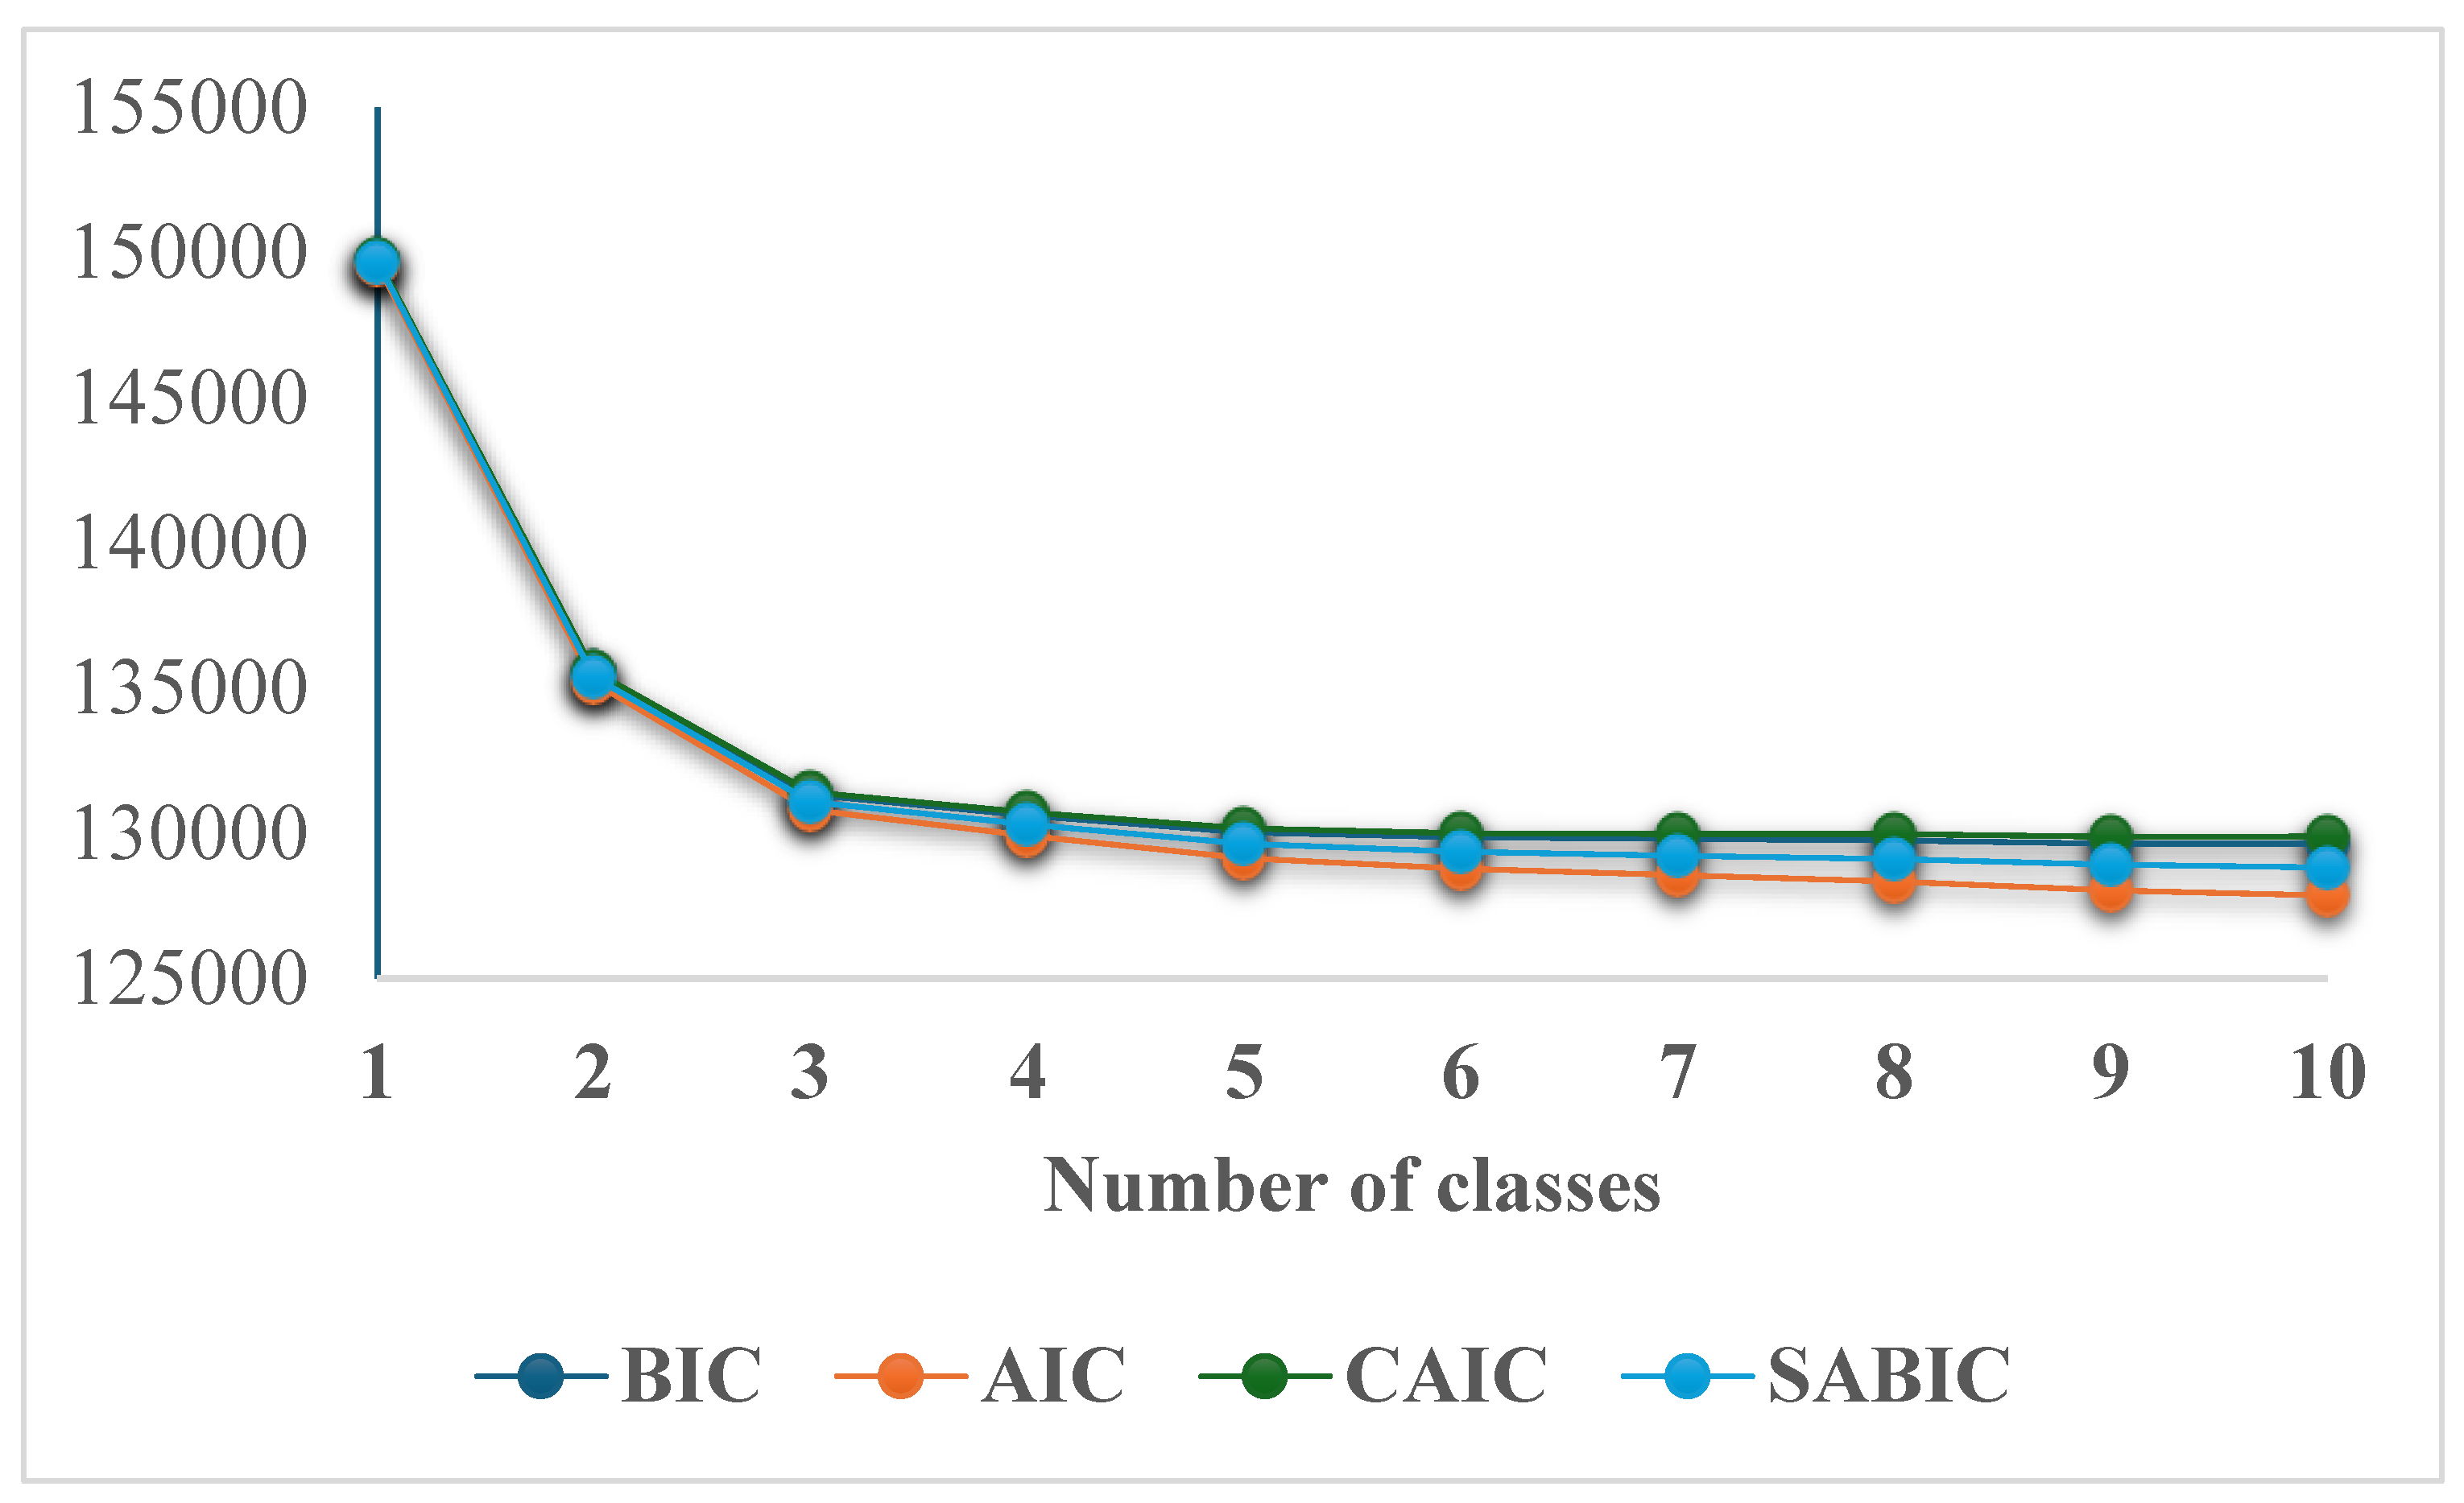
Figure 2.
Dietary Profile analysis.
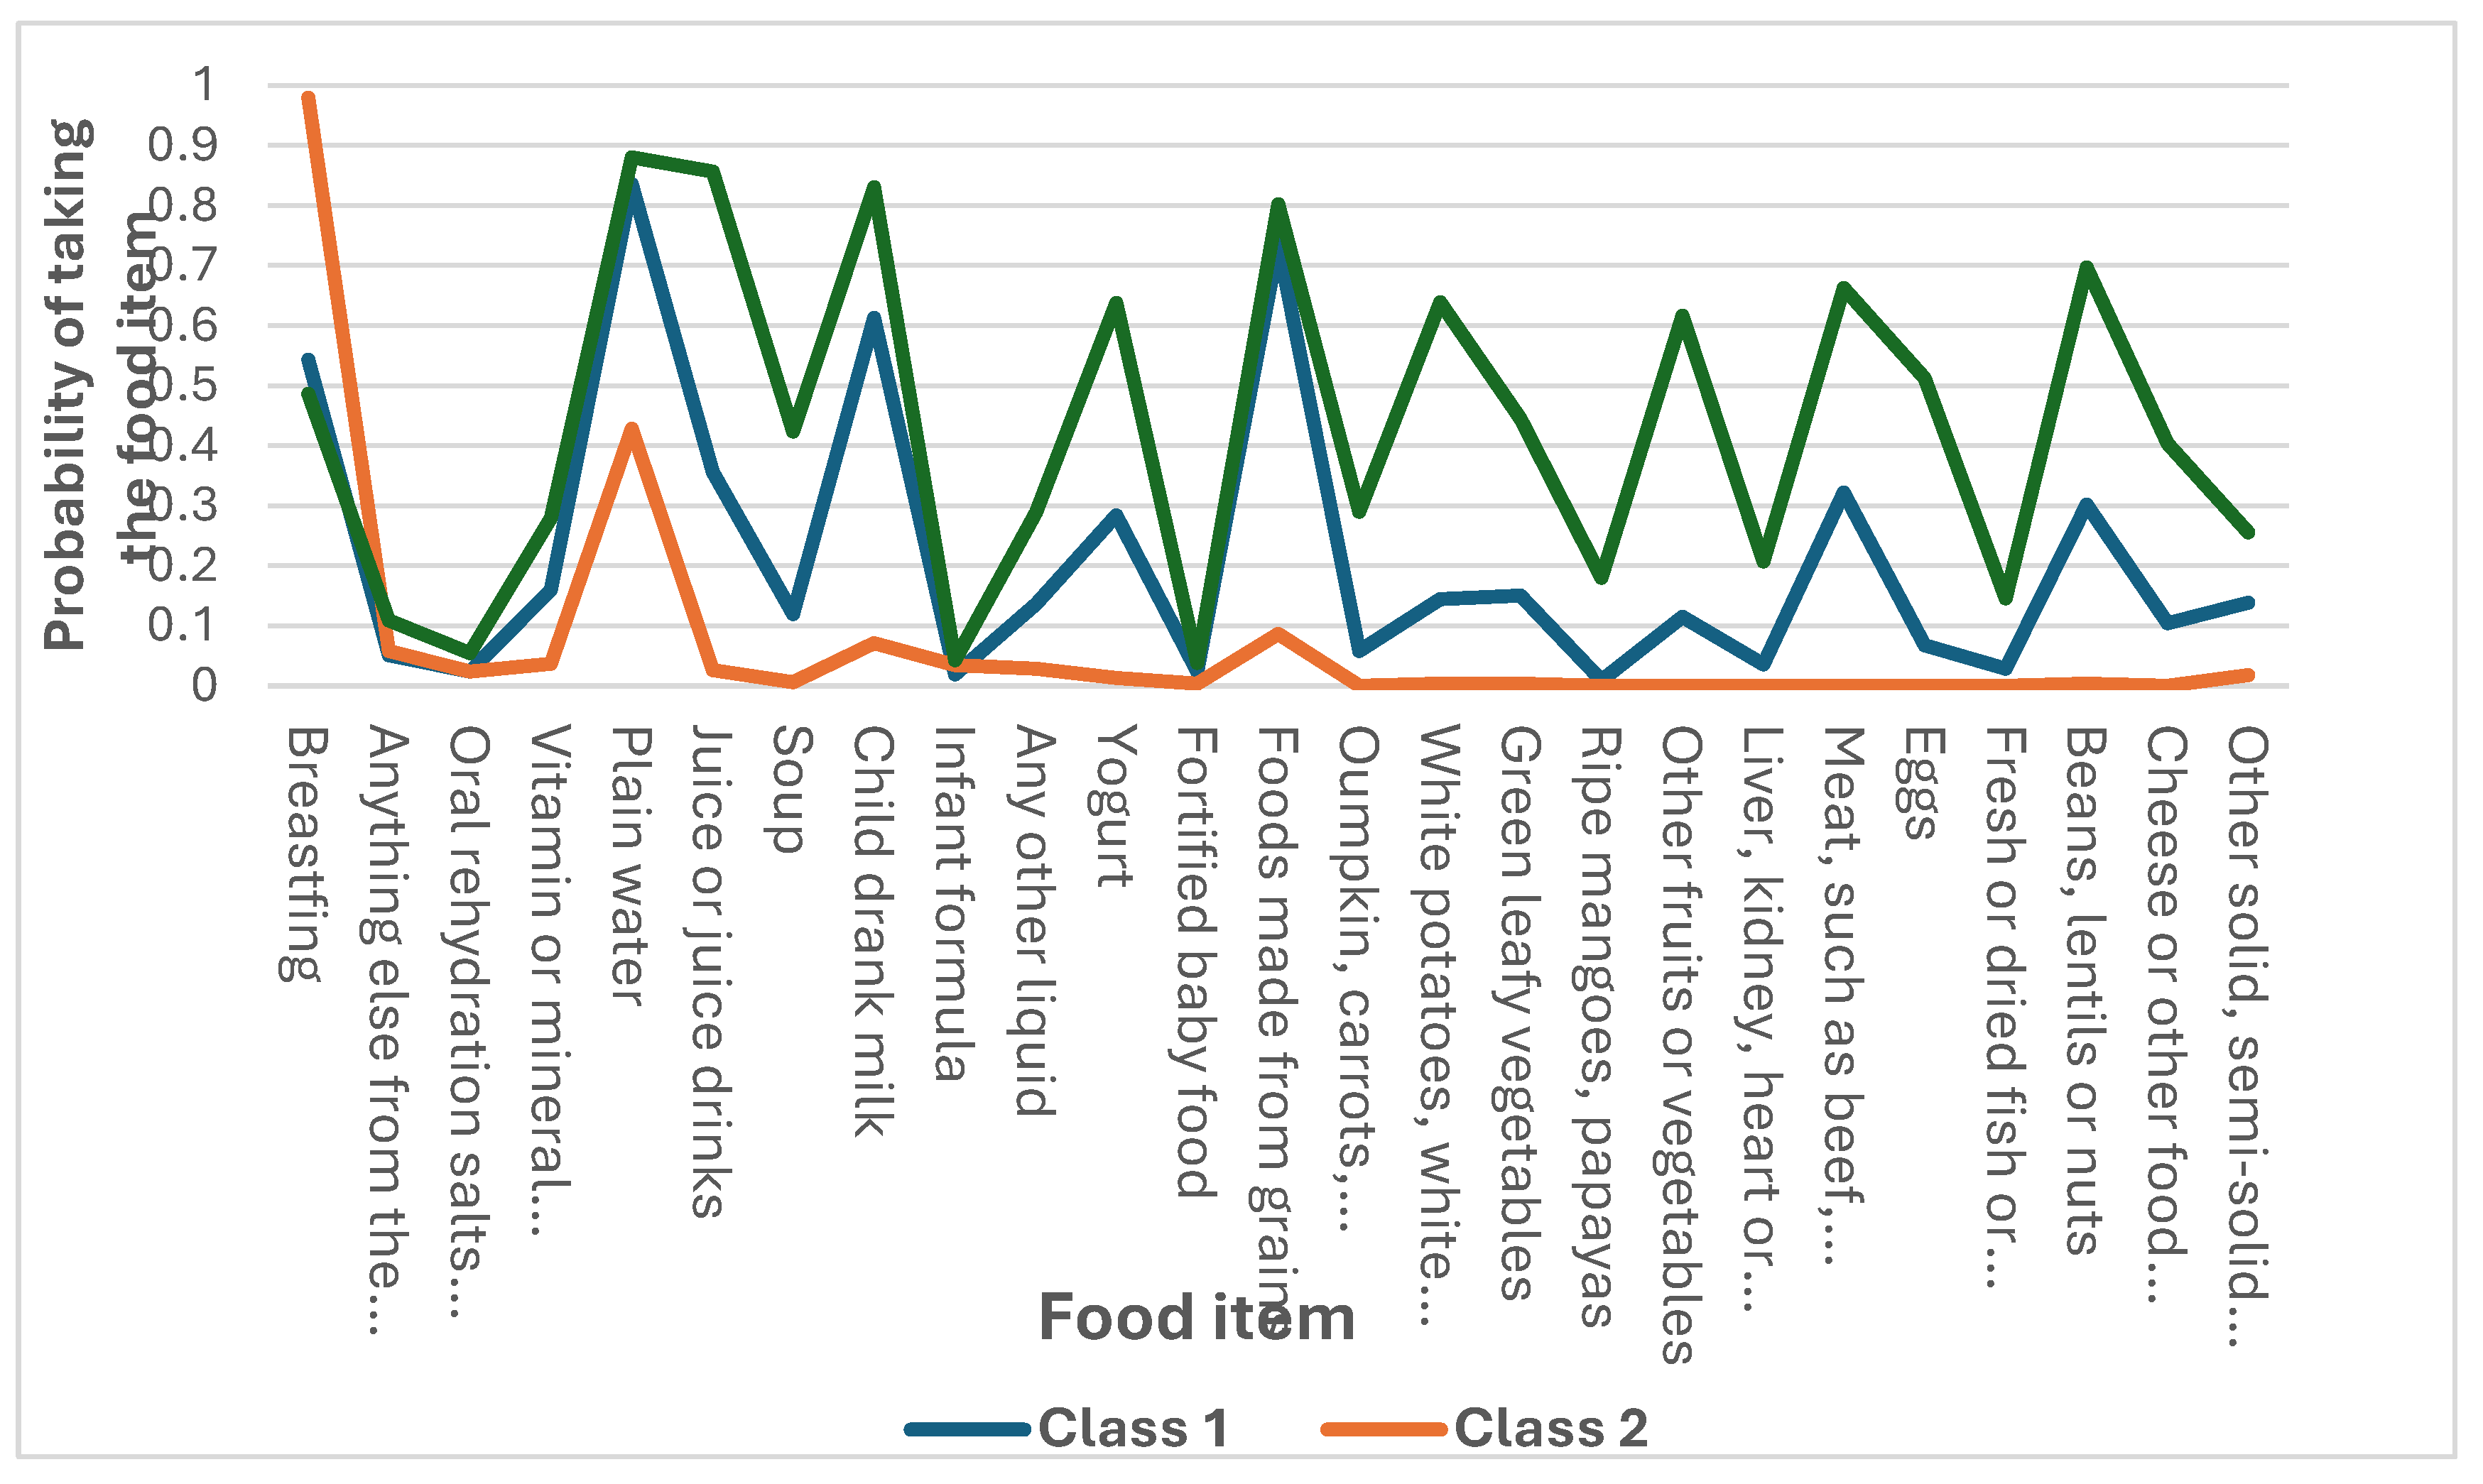

Table 1.
.
| variable | Description | Value |
| BD2 | Child ever been breastfed | 1=Yes 2=No |
| BD3 | Child still being breastfed | 1=Yes 2=No |
| BD4 | Child drank anything else from the bottle with a nipple yesterday | 1=Yes 2=No |
| BD5 | Child drank oral rehydration salt | 1=Yes 2=No |
| BD6 | Child drank or ate vitamin or mineral supplements yesterday | 1=Yes 2=No |
| BD7A | Child drank plain water yesterday | 1=Yes 2=No |
| BD7B | Child drank juice or juice drinks yesterday | 1=Yes 2=No |
| BD7C | Child drank soup yesterday | 1=Yes 2=No |
| BD7D | Child drank milk yesterday | 1=Yes 2=No |
| BD7E | Child drank infant formula yesterday | 1=Yes 2=No |
| BD7F | Child drank any other liquid yesterday | 1=Yes 2=No |
| BD8A | Child drank or ate yogurt yesterday | 1=Yes 2=No |
| BD8B | Child ate fortified baby food (cerelac etc.) | 1=Yes 2=No |
| BD8C | Child ate foods made from grains | 1=Yes 2=No |
| BD8D | Child ate pumpkin, carrots, squash etc. | 1=Yes 2=No |
| BD8E | Child ate white potatoes, white yams, manioc etc. | 1=Yes 2=No |
| BD8F | Child ate green leafy vegetables | 1=Yes 2=No |
| BD8G | Child ate ripe mangoes, papayas | 1=Yes 2=No |
| BD8H | Child ate other fruits or vegetables | 1=Yes 2=No |
| BD8I | Child ate liver, kidney, heart or other organ meat | 1=Yes 2=No |
| BD8J | Child ate meat, such as beef, pork, lamb, goat, chicken, duck | 1=Yes 2=No |
| BD8K | Child ate eggs | 1=Yes 2=No |
| BD8L | Child ate fresh or dried fish or shellfish | 1=Yes 2=No |
| BD8M | Child ate beans, lentils or nuts | 1=Yes 2=No |
| BD8N | Child ate cheese or other food made from milk | 1=Yes 2=No |
| BD8O | Child ate other solid, semi-solid or soft food yesterday | 1=Yes 2=No |
Table 2.
Sample characteristics.
| Variable | Level | Count | % |
|---|---|---|---|
| Sex | Male | 3748 | 50.90% |
| Female | 3613 | 49.10% | |
| Total | 7362 | 100.00% | |
| Age | 0-5 | 1457 | 19.80% |
| 11-Jun | 1326 | 18.00% | |
| 23-Dec | 2382 | 32.40% | |
| 24-35 | 2197 | 29.80% | |
| Total | 7362 | 100.00% | |
| Mother's education | None | 2974 | 40.40% |
| Primary | 2657 | 36.10% | |
| Secondary | 1187 | 16.10% | |
| Higher | 536 | 7.30% | |
| Total | 7355 | 100.00% | |
| Area | Urban | 2009 | 27.30% |
| Rural | 5353 | 72.70% | |
| Total | 7362 | 100.00% | |
| Wealth index quintile | Poorest | 1611 | 21.90% |
| Second | 1553 | 21.10% | |
| Middle | 1609 | 21.90% | |
| Fourth | 1444 | 19.60% | |
| Richest | 1145 | 15.50% | |
| Total | 7362 | 100.00% |
Table 3.
Model fit criteria and assessment.
| Number of classes | BIC | AIC | CAIC | SABIC | Entropy |
|---|---|---|---|---|---|
| 1 | 149769.7 | 149597.1 | 149794.7 | 149690.3 | 100% |
| 2 | 135540.4 | 135188.3 | 135591.4 | 135378.3 | 81% |
| 3 | 131336.2 | 130804.6 | 131413.2 | 131091.5 | 82% |
| 4 | 130624.4 | 129913.3 | 130727.4 | 130297.1 | 77% |
| 5 | 130040.8 | 129150.1 | 130169.8 | 129630.8 | 73% |
| 6 | 129855.7 | 128785.6 | 130010.7 | 129363.2 | 72% |
| 7 | 129807.2 | 128557.6 | 129988.2 | 129232 | 70% |
| 8 | 129759.6 | 128330.4 | 129966.6 | 129101.8 | 70% |
| 9 | 129648 | 128039.3 | 129881 | 128907.5 | 69% |
| 10 | 129645.2 | 127857 | 129904.2 | 128822.1 | 68% |
Table 4.
Detected latent classes and their membership probability.
| Latent class | Class size (Probability of latent class membership) |
Interpretation |
|---|---|---|
| Class 1 | 55% | Average nutrition composition: breastfeeding, water, milk, food made from grains and limited access to other liquid or solid food |
| Class 2 | 28% | Limited nutrition composition: breastfeeding plus plain water with very limited access to other liquid or solid food |
| Class 3 | 17% | Good nutrition composition: breastfeeding, water, milk and access to other liquid or solid food |
Table 5.
The conditional probability of taking dietary item given that a participant belongs to a class.
Table 5.
The conditional probability of taking dietary item given that a participant belongs to a class.
| Dietary item | Probability of taking dietary item | |||
|---|---|---|---|---|
| Code | Label | Class 1 | Class 2 | Class 3 |
| BD3 | Child still being breastfed | 0.5434 | 0.9798 | 0.486 |
| BD4 | Child drank anything else from the bottle with a nipple yesterday | 0.0507 | 0.0577 | 0.1088 |
| BD5 | Child drank ORS yesterday | 0.0233 | 0.0235 | 0.0544 |
| BD6 | Child drank or ate vitamin or mineral supplements yesterday | 0.1604 | 0.0374 | 0.2795 |
| BD7A | Child drank plain water yesterday | 0.8355 | 0.428 | 0.8805 |
| BD7B | Child drank juice or juice drinks yesterday | 0.3566 | 0.0267 | 0.8572 |
| BD7C | Child drank soup yesterday | 0.1198 | 0.0058 | 0.4241 |
| BD7D | Child drank milk yesterday | 0.6132 | 0.0707 | 0.8305 |
| BD7E | Child drank infant formula yesterday | 0.0188 | 0.0342 | 0.0423 |
| BD7F | Child drank any other liquid yesterday | 0.1357 | 0.0289 | 0.2891 |
| BD8A | Child drank or ate yogurt yesterday | 0.2839 | 0.0127 | 0.6383 |
| BD8B | Child ate fortified baby food (cerelac etc.) | 0.0234 | 0.0037 | 0.0382 |
| BD8C | Child ate foods made from grains | 0.7346 | 0.0862 | 0.8024 |
| BD8D | Child ate pumpkin, carrots, squash etc. | 0.0577 | 0.0007 | 0.2902 |
| BD8E | Child ate white potatoes, white yams, manioc etc. | 0.1446 | 0.0036 | 0.639 |
| BD8F | Child ate green leafy vegetables | 0.1508 | 0.0032 | 0.4451 |
| BD8G | Child ate ripe mangoes, papayas | 0.0092 | 0.0003 | 0.1806 |
| BD8H | Child ate other fruits or vegetables | 0.1144 | 0.0001 | 0.6171 |
| BD8I | Child ate liver, kidney, heart or other organ meat | 0.0354 | 0.0004 | 0.2068 |
| BD8J | Child ate meat, such as beef, pork, lamb, goat, chicken, duck | 0.3224 | 0.0001 | 0.663 |
| BD8K | Child ate eggs | 0.0675 | 0.0003 | 0.5119 |
| BD8L | Child ate fresh or dried fish or shellfish | 0.0283 | 0.0005 | 0.1453 |
| BD8M | Child ate beans, lentils or nuts | 0.302 | 0.0034 | 0.6972 |
| BD8N | Child ate cheese or other food made from milk | 0.1043 | 0.0002 | 0.4031 |
| BD8O | Child ate other solid, semi-solid or soft food yesterday | 0.1389 | 0.018 | 0.2558 |
Table 6.
.
| Variable | Level | Class 1 | Class 2 | Class 3 |
|---|---|---|---|---|
| Sex | Male | 55.8% | 27.1% | 17.1% |
| Female | 54.6% | 28.6% | 16.8% | |
| Total | 55.3% | 27.8% | 16.9% | |
| Age | 0-5 | 7.9% | 90.6% | 1.5% |
| 6-11 | 48.5% | 39.7% | 11.8% | |
| 12-23 | 73.0% | 4.3% | 22.7% | |
| 24-35 | 71.2% | 0.3% | 28.5% | |
| Total | 55.3% | 27.8% | 16.9% | |
| Mother's education | None | 59.5% | 32.3% | 8.2% |
| Primary | 55.1% | 27.8% | 17.1% | |
| Secondary | 46.2% | 21.5% | 32.3% | |
| Higher | 33.3% | 14.4% | 52.3% | |
| Total | 55.3% | 27.8% | 16.9% | |
| Area | Urban | 43.1% | 23.7% | 33.2% |
| Rural | 58.5% | 29.3% | 12.2% | |
| Total | 55.3% | 27.8% | 16.9% | |
| Wealth index quintile | Poorest | 62.2% | 34.3% | 3.5% |
| Second | 60.3% | 32.0% | 7.7% | |
| Middle | 55.8% | 28.3% | 15.9% | |
| Fourth | 46.9% | 22.9% | 30.2% | |
| Richest | 34.3% | 16.0% | 49.7% | |
| Total | 55.3% | 27.8% | 16.9% |
Disclaimer/Publisher’s Note: The statements, opinions and data contained in all publications are solely those of the individual author(s) and contributor(s) and not of MDPI and/or the editor(s). MDPI and/or the editor(s) disclaim responsibility for any injury to people or property resulting from any ideas, methods, instructions or products referred to in the content. |
© 2024 by the authors. Licensee MDPI, Basel, Switzerland. This article is an open access article distributed under the terms and conditions of the Creative Commons Attribution (CC BY) license (https://creativecommons.org/licenses/by/4.0/).
Copyright: This open access article is published under a Creative Commons CC BY 4.0 license, which permit the free download, distribution, and reuse, provided that the author and preprint are cited in any reuse.


