Submitted:
11 June 2024
Posted:
12 June 2024
You are already at the latest version
Abstract
In these days of information overload and high-throughput analysis, it is easy to lose focus on the study of individual proteins. It is our conjecture that such investigations are still crucially important and offer uniquely penetrative insights. We thus present a discussion of biophysical methods to allow readers to get to know their protein of interest better. Although this perspective is not written with the expert in mind, we hope that for interdisciplinary scientists, or researchers who do not routinely perform biophysical analyses, the content will be helpful and inspiring.
Keywords:
Protein structure
; protein folding
; methods
; experimental design
Protein biochemistry remains the meat and potatoes of biological and medicinal research, and indeed, any disciplines that harness purified proteins to understand interactions at the molecular level. With increased power of resolution and detection, similar experiments are now also routinely used on partially-purified protein mixtures isolated from cells or tissues. Regardless of the origin of the samples to be analyzed, or the goals of the experiment, biophysical methods have their own inherent limits, and pros and cons that need to be considered both during planning of experiments and subsequent interpretation of results.
In this mini-review, we briefly discuss techniques we and others use to understand structure, binding, and activity/function of purified proteins (either recombinantly expressed or native entities isolated from cells). We focus on key scenarios that these methods can address, and where they may be limited in delivering a holistic picture. We hope such discussions will aid researchers—particularly interdisciplinary scientists and chemical biologists alike, not specialized in structural biology/biophysics research, but nonetheless wishing to exploit these tools—in deciding which methods could best match their specific research questions. Indeed, biophysical techniques are particularly useful to get up close and personal with proteins in which one has specific interest. Such an interest in these proteins could come from high throughput screens, literature searches, or through less formal means such as interactions during scientific symposia. Nonetheless, it is likely that once we start to hone in on studying a specific protein, some of our publications and key conclusions will hinge on correct biophysical characterization! Thus, this opinion piece, also set to a menu for a 3-course dinner to spur the broader readership, is written with the spirit that it could help make that happen for researchers if and where applicable.
Protein structure – first orders
As our article focuses on methods to assess protein structure or structure-dependent function, for amuse bouche, we present an overview on protein structure. Protein structure is a complex, multifactorial problem that cannot be described by a single parameter. This complexity inherent to protein structure can be reflected by breaking it down into four categories (Figure 1a):
1) primary structure, the specific sequence of amino acids that make up the protein;
2) secondary structure, local structure including β-sheets and helices (the most common of which is α-, but others such as p and 310 exist);
3) tertiary structure, the overall fold of a single polypeptide chain, incorporating all secondary structural elements; and
4) quaternary structure, the convergence of multiple tertiary structures (e.g., oligomerization) as well as cofactor incorporation.
Unsurprisingly, different biophysical methods are applicable to measure specific structural aspects; some go a stage further and focus on specific regions within a protein. We will discuss this aspect in each section.
1. Mass Spectrometry – for Starters, Something Exciting and Impactful to Raise Your Spirits?
Mass spectrometry (MS) is a physical method used to measure mass of particles. It does so through volatilizing samples, then ionizing them, and subsequently detecting them. The actual output of MS is the mass divided by the charge (m/z), although this is typically converted to mass. Because the nuts and bolts of this process are particularly complex, depending on volatility, ionization properties and stability of the ions, all of which are highly sensitive to molecular structure and particular experimental conditions, MS is inherently unable to give absolute levels of specific components in mixtures, or even compare individual peaks between samples. Several methods have been used to circumvent these issues that we will briefly discuss below. Nevertheless, because it can accurately measure particle mass, MS is one of the most useful methods to identify unknown proteins involved in specific process or pathways one is interested in. As outlined below, MS is also applicable to other questions worthwhile posing early on in proceedings.
1.1. Digest Mass Spectrometry – Biting off What You Can Chew
Applicability: (semi)-purified protein, complex mixtures
Main structural aspect investigated: primary structure
Others general applications: protein modification/truncation (with caveats)
Is it quantitative? relative amounts are readily quantifiable; absolute amounts not particularly reliable.
1.1.1. Protein Identification – Guess Who?
Digest MS involves treating protein samples with a protease, separating the fragments using liquid chromatography, and then analyzing individual fragments by tandem MS. (Note: tandem MS is a variant of MS where each ion is analyzed for total mass, then fragmented into constituent components). The fragmentation patterns give precise sequence information that allows identification of each fragment within a specific protein; hence, this method is ideal for assigning primary sequence. For this reason, it is crucial that fragmentation patterns are contiguous, and that the digest fragments are consistent with the protease used for digestion (Figure 1b). Fragmentation derived from standard collision induced dissociation (CID) occurs at the amide C–N bond, giving rise to y or b ions, where the charge resides on the primary ammonium, or an acylium ion, respectively (Figure 1c: top panel). As MS depends on volatility and ionization, it should be remembered when planning a digestion experiment that short (<4 amino acid) and very long peptides (often, >~24 amino acids) are not readily applicable to this method. Bearing this in mind, proteases apposite for covering specific stretches of the primary sequence of one’s target protein can be chosen.
For proteomics studies, it is often desired to compare enriched proteomes following different treatment conditions. Unfortunately, the issues of MS quantitation historically rendered such comparisons prone to error. Several methods have been developed to improve relative quantitation. These include the use of stable amino acid isotopomers, which allow quantitative comparison between samples because isotopomers have identical physical properties (volatility and ionization, for instance), but are significantly different in molecular mass to be resolved in MS. Post-lysis and post-digest isotope labeling, e.g., tandem-mass tagging (TMT), can also be used. The TMT approach has some limitations, principally associated with labeling occurring at peptide stage. However, TMT can nowadays be carried out in 11 or more multiplex, whereas, for instance, in-cell/in-vivo mass tagging through stable isotope labeling of amino acids in cell culture (SILAC), can only be used in triplicate. For readers interested to delve deeper into MS proteomics capabilities and for chemical biological or biochemical investigations, we refer them to our recent mini-review [1]. With the improvement of modern MS methods, it is now quite common to use label free quantification (LFQ) MS, which compares ion signatures per run in native digest samples. Although this has no internal control, with multiple replicates, and careful processing using either data-dependent or data-independent acquisition (DDA/DIA), and taking advantage of the fact that enriched samples often contain large amounts of noise, numerous researchers been able to identify specific associations and relevant functional targets using this method. For instance, we have deployed many of the above techniques in concert with digest proteomics to uncover specific electrophile-sensor proteins.
1.1.2. Protein Modifications – Change and Chop
As posttranslational modifications (PTMs) change a protein’s molecular weight, MS can be used to identify PTMs. This method usually requires a relatively large amount of sample protein, as the aim is to cover as much of a specific protein’s sequence as possible (only a few, ideally unique, peptides are necessary to identify a protein). Using tandem MS, specific PTMs can be assigned to specific fragments, and then to specific residues. As above, to assign specific modified residues, a contiguous fragmentation pattern that allows loss of the specific PTM at the specific residue should be observed (Figure 1c: bottom panel). Alternatively, specific PTM-associated proteins/peptides can be enriched from samples/crude extracts. Enrichment can be achieved using affinity resins; for instance, anti-R-ε-GG antibodies for ubiquitin modifications. Subsequently the proteins or peptides harboring specific PTMs can be analyzed by MS. In our investigations into electrophile PTMs within specific proteins, we have frequently deployed MS to identify modified residues. This has been performed in in vitro purified samples, as well as proteins derived from cells in which the proteins are either overexpressed or expressed at endogenous levels [2], often with an epitope tag. Just as all other MS methods, we point out that detection of modified peptides can only be as good as those peptides are volatile, ionizable, and stable. Moreover, many modifications involve stable bond formation, such as isopeptides, or monophosphates, and are relatively easy to detect by MS. However, many of the PTMs we and others work with are labile. These include cysteine modifications by Michael-acceptor-derived electrophiles and related electrophilic drugs. These often need specific mild volatilization and ionization conditions. Indeed, not observing an expected modification does not mean that no modification has occurred. Conversely, observing a modification gives little indication of stoichiometry and biological relevance. Thus, in terms of residue modification identification, the PTM-mapping MS data should always be independently investigated by orthogonal approaches including functional mutagenesis in relevant systems.
1.1.3. Protein Truncations – Things Are Getting Interesting, Not Worth Cutting It Short?
MS can also be used to assign cleavage position of specific proteins. This often uses a technique called digest sequencing. As with PTM-mapping, this experiment uses purified protein, with the aim of achieving very high coverage, to allow assignment of the total sequence of the protein present. In this instance, having a control, full-length protein, as well as good coverage, are particularly important. Nonetheless, it can be difficult to be totally confident of cleavage site. Indeed, it is often worth attempting several proteases to try to ensure that correct terminal coverage has been achieved.
1.2. Intact Mass Spectrometry - Taking the Whole Weight
Intact MS measures molecular weight of whole proteins, potentially with PTM or bound ligand. It can be performed on native, or denatured proteins. Fragmentation of ions by tandem MS is possible, allowing primary sequence to be identified. There are two principal methods of ionization currently used in intact MS: electrospray ionization (ESI); and matrix assisted laser desorption ionization (MALDI). ESI is compatible with HPLC, and so it is used almost exclusively in digest proteomics and other automated procedures. ESI is also believed to favor fragmentation relative to MALDI, aiding sequence assignment. MALDI requires the use of a matrix and hence is not so readily applicable to automated procedures. However, MALDI is often used to measure total protein mass, and validate in vitro protein synthesis/modification procedures as it is less prone to ion fragmentation.
Intact MS has some other interesting applications beyond simple mass measurements. MALDI has been adapted to MS imaging, where the intensities of ions for a specific protein are measured across a suitably prepared biological sample. This method has relatively high resolution (~10 µM), which is on the order of the size of a nucleus [3]. It can measure both small molecules and proteins Other interesting avenues are the measurement of conformational changes [4], native complexes and dynamical associations. Intact MS is also commonly used in C-terminal MS sequencing, where exocarboxypeptidases are used to winnow the C-terminus one amino acid at a time to allow sequencing (Figure 1d).
2. Other Methods to Determine Primary Structure – An Interesting Side Dish
2.1. Edman Degradation – Chemical N-Terminal Sequencing
Applicability: purified protein
Main structural aspect investigated: N-terminus
Others general applications: few
Is it quantitative? no
N-terminal processing of proteins is relatively common, due to N-terminal methionine cleavage, and signal peptide cleavage. Although N-termini can be sequenced by digest MS sequencing, there are always potential worries about how complete coverage is, potentially leading to aberrant assignment of termini. An alternative to this approach is Edman degradation, a chemical method to directly determine the N-terminus of proteins. Although it requires a relatively large amount of sample, it is particularly precise and can give reads of up to ca. 20 amino acids, which is typically of sufficient length to assign positions of truncation, for example. Edman degradation is certainly a good option if a large quantity of the purified protein is accessible, and a new N-terminus is expected within the cleavage fragment. It is worth noting however that Edman degradation is blocked by N-terminal modification, such as formylation/acetylation, although this is not common for cleaved peptides.
3. Methods to Determine Three-Dimensional Structure – Returning to the Fold for the Main Course
Having negotiated “the first course”, and identified a protein, its modifications, and truncations, it is now important to start asking some more specific questions. Indeed, although primary structure information is hugely important, in the end, protein folding, i.e., secondary structure and beyond, are key to open a window into the soul of one’s favorite protein. There are several methods applicable to answer these questions.
3.1. Crystallography – Peering into Infinity
Applicability: purified protein
Main structural aspect investigated: all structural elements and ligand associations
Other notes: little limit in size or other parameters
Is it quantitative? N/A
Crystallography is a venerable structural method that has its roots in the genesis of structural biology and structure-guided enzymology. Indeed, since the structure of lysozyme was solved by David Chilton Phillips in 1965, revealing several important aspects of how enzymes function, protein structure has been considered to give crucial insights into the inner workings of proteins. This has extended to ligand interactions, and inhibitor mode of action. With almost 60 years of work behind it, there is now a huge inventory of structures available in the Protein Data Bank (PDB). This is a very useful resource for rationalizing interactions, and predicting mutants. For instance, when we identify an electrophile-sensitive cysteine, we typically investigate its surface availability, and surrounding residues by perusing the crystal structure. Of course, not all proteins have been crystallized, and even less so have been crystallized with specific ligands bound. New additions to the structural armory, particularly α-fold (2) that can predict protein structure from primary sequence have helped broaden the remit of our structural understanding. Of course, care should be exercised when interpreting computed structures and common pitfalls underpinning modern structural prediction tools have been nicely reviewed elsewhere. In our case, we often use Swissmodel to perform homology modeling, for instance of zebrafish proteins, for which there are rarely structures available [5].
In the context of empirical crystallographic data, conditions under which specific crystal structures were obtained (pH, ionic strength, reducing agents, etc.), the presence or absence of ligands, and also the overall resolution, as well as the B-factors across the crystal structure, are worth closer attention. The B-factor—often referred to as the temperature factor—reflects precision within the structure. This should be relatively low for well-defined atoms, but can become large for atoms whose precise structure is not defined. A similar logic applies to overall resolution: as resolution increases, the B-factor should diminish [6]. We illustrate this point by putting side by side crystal structures of glutathione-S-transferase with 3.00 Å and 1.97 Å resolution, respectively (Figure 2a). It is clear that the B-factors for some atoms are much larger in the former. Emerging frontiers of this method include observing chemical/enzymatic processes within crystal structures [7], although the rigid packing in the crystals may limit the scope of such efforts [8].
3.2. Electron Microscopy (EM) – Is the Atmosphere Getting Electric?
Applicability: purified protein, or potentially mixtures
Main structural aspect investigated: all structural elements and ligand associations
Other notes: little limit in size or other parameters
Is it quantitative? specific particles in a sample can be classified and quantified
EM is becoming one of the most powerful structural methods. This method is applicable to answer questions pertaining to gross structural arrangements, principally by negative stain EM. But it is also able to give high resolution information (up to ~1.5Å) in the form of cryo-electron microscopy.
Negative stain EM – It’s OK to focus on the negative
Negative stain EM is a technique that is robust and can give gross structural information, particularly of large proteins, complexes and aggregates. It has relatively low resolution, ~10-20 Å, and hence is not particularly useful for small proteins < ~80 kDa, although some reports claim that smaller proteins than this can be visualized [9]. Negative stain EM is applicable to homogeneous, as well as relatively non-homogeneous samples, and indeed, for the latter case, negative stain EM is preferred to cryo-EM. In this way negative stain EM can give information on conformational heterogeneity, for instance, during enzymatic activation and associated changes in conformational dynamics. We have used this method to classify specific conformationally-distinct hexamers of the enzyme ribonucleotide reductase subunit-α (RNR-α, monomer weight, ~90 kDa) induced by different approved nucleotide therapeutics that target RNR-α (Figure 2b). We further backed up the negative-stain-EM-derived conformationally distinct states of the resulting hexamers, by demonstrating that different hexamers shaped by different drugs were differentially susceptible to protease digestion.
Cryo-EM – Putting things on ice to get a better perspective
Cryo-EM is a high-resolution method that can give sufficient resolution to allow “complete” structural resolution. Such outputs are possible because at very low temperatures damage caused by electron beams (that is high at room temperature) is limited. Cryo-EM typically requires relatively high structural homogeneity, although strategies to deal with heterogeneity are available [10].
3.3. NMR – Take Advantage of the Rough and Tumble
Applicability: purified proteins & either small-molecule or biomolecule-based ligands
Main structural aspect investigated: all structural elements and ligand associations
Other notes: large proteins are not amenable to this method
Is it quantitative? capable of providing a large amount of quantitative information
Solution NMR is a structural method that investigates specific spin-active nuclei, for instance, hydrogen or nitrogen, in a sample. As the method is particularly sensitive to nuclear environment, in an NMR spectrum, non-equivalent nuclei within a sample show up as specific peaks, each of which have a defined value, referred to as a chemical shift. In standard protein NMR measurements, 1H and 15N are used in a two-dimensional experiment, to separate out peaks that would otherwise be occluded in one-dimensional experiment. In this experiment broadly known as heteronuclear single quantum coefficient (HSQC), N–H bonds show up as specific peaks in a two-dimensional grid. Thus, the technique focuses specifically on peptide N–H bonds, as well as tryptophan aromatic N–H and asparagine/glutamine NH2 (Figure 2c); typical spectra run from 6-11 ppm for 1H, and 105-140 ppm for 15N. Several of these residues, as well as specific peptide N–H bonds have relatively characteristic chemical shifts that can aid rapid analysis of spectral quality (e.g., glycine typically has relatively low 15N chemical shifts (~110 ppm); glutamine/asparginine NH2 usually have low 1H (~7.5 ppm) and 15N (~110 ppm) chemical shifts and have two protons on same nitrogen; tryptophan aromatic NH, usually has high 1H (10.5 ppm) and 15N (130 ppm) chemical shifts). It should be noted that the natural isotope of nitrogen contains an even number of protons and neutrons within its nucleus, and is silent in NMR. It is thus necessary to feed bacteria for protein preparation with heavy nitrogen (15N, typically in the form of heavy ammonia), in minimal media in order to prepare proteins for NMR.
One of the standard limitations of NMR was classically the size of molecule that can be measured. This limitation traces its roots back to the fact that NMR relies on molecular tumbling, that leads to the line breadth of samples increasing as the size of the molecule increases. This effect is prohibitive for molecules of several kDa’s in size. With the advent of highly powerful spectrometers and transverse relaxation-optimized spectroscopy (TROSY) pulse sequences, that seek to limit the effect of line broadening due to size, it is now quite feasible to measure NMR of proteins in excess of 50 kDa, although, very large proteins are still problematic.
NMR can give a large amount of both qualitative and quantitative structural information. In general, NMR spectra can inform on protein folding. Spectra manifesting well-dispersed peaks are often indicative of a complex, heterogeneous environment provided by a protein structure. Folding states of different mutants can be compared by investigating changes in peaks upon mutation – in general, residues spatially close to the mutated site will change, as NMR is particularly sensitive to chemical environment. However, residues distal from the mutated site should be unchanged. This can be defined by parameters such as minimal chemical shift perturbations, i.e., the difference in chemical shift between each residue. A similar argument applies to ligand binding, where chemical shift perturbations will occur only when an interaction occurs. There are indeed a huge range of programs designed specifically for NMR analysis, peak assignment, and the like [11].
Determination of whether a protein is folded or not by NMR is more or less independent of the assignment of peaks within the NMR spectrum of the protein [12]. However, to assign protein structure by NMR requires more detained information both in terms of peak assignment and spatial distribution of the peaks. Oftentimes, further dimensions are needed to separate out peaks better (usually 13C is used). Although NMR usually provides information on through-bond interactions (i.e., unaffected by spatial distribution), it can also provide information on proximity by measuring through-space effects, using the nuclear Overhauser effect (nOe) [13]. Thus, NMR has all the necessary properties to solve protein structures. Aside from requiring a large amount of computational analysis, such pursuits often require complex protein preparation procedures, which can be technically difficult. Of course, numerous proteins have already had their NMR structures solved, including peak assignments, which simplifies matters considerably. One aspect that is particularly striking when viewing NMR structures of proteins versus X-ray crystallographic data, especially, is that the former show many conformations of the protein (Figure 2d). This is because in solution the protein structure can “breathe”, whereas in the restricted environment of a crystal mostly the protein is fixed in a (small number of) conformations.
NMR indeed is a uniquely versatile method that lends itself to numerous specialized procedures that we cannot completely cover here. Aside from using heavy isotopes to allow NMR visualization, the incorporation of atoms not present endogenously, particularly fluorine (19F) open means to simplify spectra, and potentially improve responsivity. There are also numerous NMR experimental approaches that are ideally suited to answer specific biological questions. Protein ligand interactions and screening can be studied by several techniques, including saturation-transfer difference (STD) NMR [14], a technique based on nOe. Moreover, proteins can show a gamut of different motions, associated with simple bond rotations, and larger conformational changes. NMR is equipped to study many, if not most of these dynamical changes [15].
3.4. Circular Dichroism – the Right Time to Split?
Applicability: purified protein
Main structural aspect investigated: secondary structure, stability, and ligand association
Other notes: no real limit in size, but high analyte concentration can affect low wavelength absorbance, limiting data acquisition
Is it quantitative? can give percentage of secondary structure, but this is a rough guide
Residue-specific information is typically critical for understanding, for instance, how mutations affect protein structure, or potentially how ligand binding occurs. However, in many instances, a more global view of protein structure is sufficient, or perhaps even preferred. In this case, CD can be particularly useful. This technique informs on protein secondary structure. Characteristic CD spectra for α-helices and β-sheets are established, and are significantly different from each other and unfolded polypeptide chains. Based on these behaviors, there are several programs that can assign structural composition based on CD spectra, although these likely should be interpreted carefully. One simple test is to use analogy to published crystal (or more ideally NMR) structures to see if the secondary structural characteristics are sensible.
We have regularly used CD spectra to compare gross structural similarities across recombinantly expressed mutants. We have also used CD to show that there are gross structural changes in specific proteins when they are treated with reactive electrophilic ligands. Other uses of CD include measuring thermal stability of proteins. This technique can also be applied to assessing mutant proteins, which ideally should be similarly stable the wt-protein. Ligand binding can also be measured. In general, ligand binding should stabilize bound proteins, typically with a change in temperature related to the Gibbs free energy of binding-the higher the affinity, the larger the thermal stabilization [12]. Assays that use fluorescent-dye binding to assess protein stability can give similar information, and are amenable to high-throughput experimentation [16]. However, CD remains a preferred method if relatively few mutants or conditions are to be investigated.
3.5. Small Angle X-ray Scattering (SAXS)
Applicability: purified protein (ideally free of aggregates, and contaminants)
Main structural aspect investigated: protein aggregation, size, shape, and ligand binding (relatively low resolution)
Other notes: no real limit in size
Is it quantitative? can provide kinetics of information on structural changes
SAXS is a solution method that can inform on relatively large structural perturbations/transitions/polydispersity in macromolecules. In many ways it is thus complementary to crystallography and other similar methods that offer more profound structural information. In several instances it has been used in conjunction with those methods. SAXS can provide several parameters that correlate with important physical parameters in solution. These include the radius of gyration, Rg, which relates to the overall size of the molecule in solution, molecular weight and maximum dimension (Dmax). These parameters can be compared to those calculated for specific proteins, to understand specific aspects of a protein such as folding and flexibility. Improvements in data collection, and analysis have allowed for several improvements in rapidity of SAXS experiments, and uses available [17,18]. Nonetheless, SAXS requires a strong X-ray beam source and is usually performed at a specialist facility using synchrotron sources.
4. Methods Investigating Function – Just a Taster for Dessert, but who Knows where It Go?
In the end, protein structure, modification, and the like are mainly methods to gain deeper comprehension of protein function. We thus end our tasting menu with a dessert trolley presenting some methods that we commonly deploy to detect enzyme activity and protein functional associations. This section, like the above, is by no means exhaustive, but it should inform on choice of assay.
4.1. Enzyme kinetics – Hooking Up again, or Making a Quick Exit?
Applicability: purified protein, lysates, or potentially cells
Main structural aspect investigated: all aspects of protein structure as these are all linked to activity
Other notes: no real limit in size
Is it quantitative? highly quantitative and sensitive; can be used to quantify absolute amounts of protein.
For purified enzymes, or enzymes in complex mixtures, particularly those overexpressed, enzyme kinetics constitutes a diagnostic, quantitative, and accurate means to assess protein expression and folding. These assays can be readily extended to inhibition, and activation. Indeed, to assess concentration of enzymes, active-site titrations, are considered the most accurate. Numerous methods exist for measuring enzymatic activity. In general, a continuous assay that can be measured by absorbance, fluorescence, etc., in real time gives the simplest protocol. Several fluorescent assays can now be deployed in live cells, or even live model organisms. This offers good flexibility and offers new possibilities after initial discovery phases. However, for proteins that are not particularly active, or whose chemistry is not amenable to such assays, numerous radioactive, western blot, and bead-based assays exist. In the case of RNR-α despite there being several reported activity assays for this enzyme, we have typically opted to measure conversion of radio-labelled [5-3H]-CDP as it is highly sensitive, and with sufficient practice, progress curves and time-dependent inhibition can be efficiently measured.
4.2. Analytical Chromatography – (Hydrodynamic) Size Can Matter
Applicability: purified protein, specific mixtures, or lysates
Main structural aspect investigated: protein quaternary associations
Other notes: no real limit in size
Is it quantitative? highly quantitative and sensitive, size resolution depends on column properties.
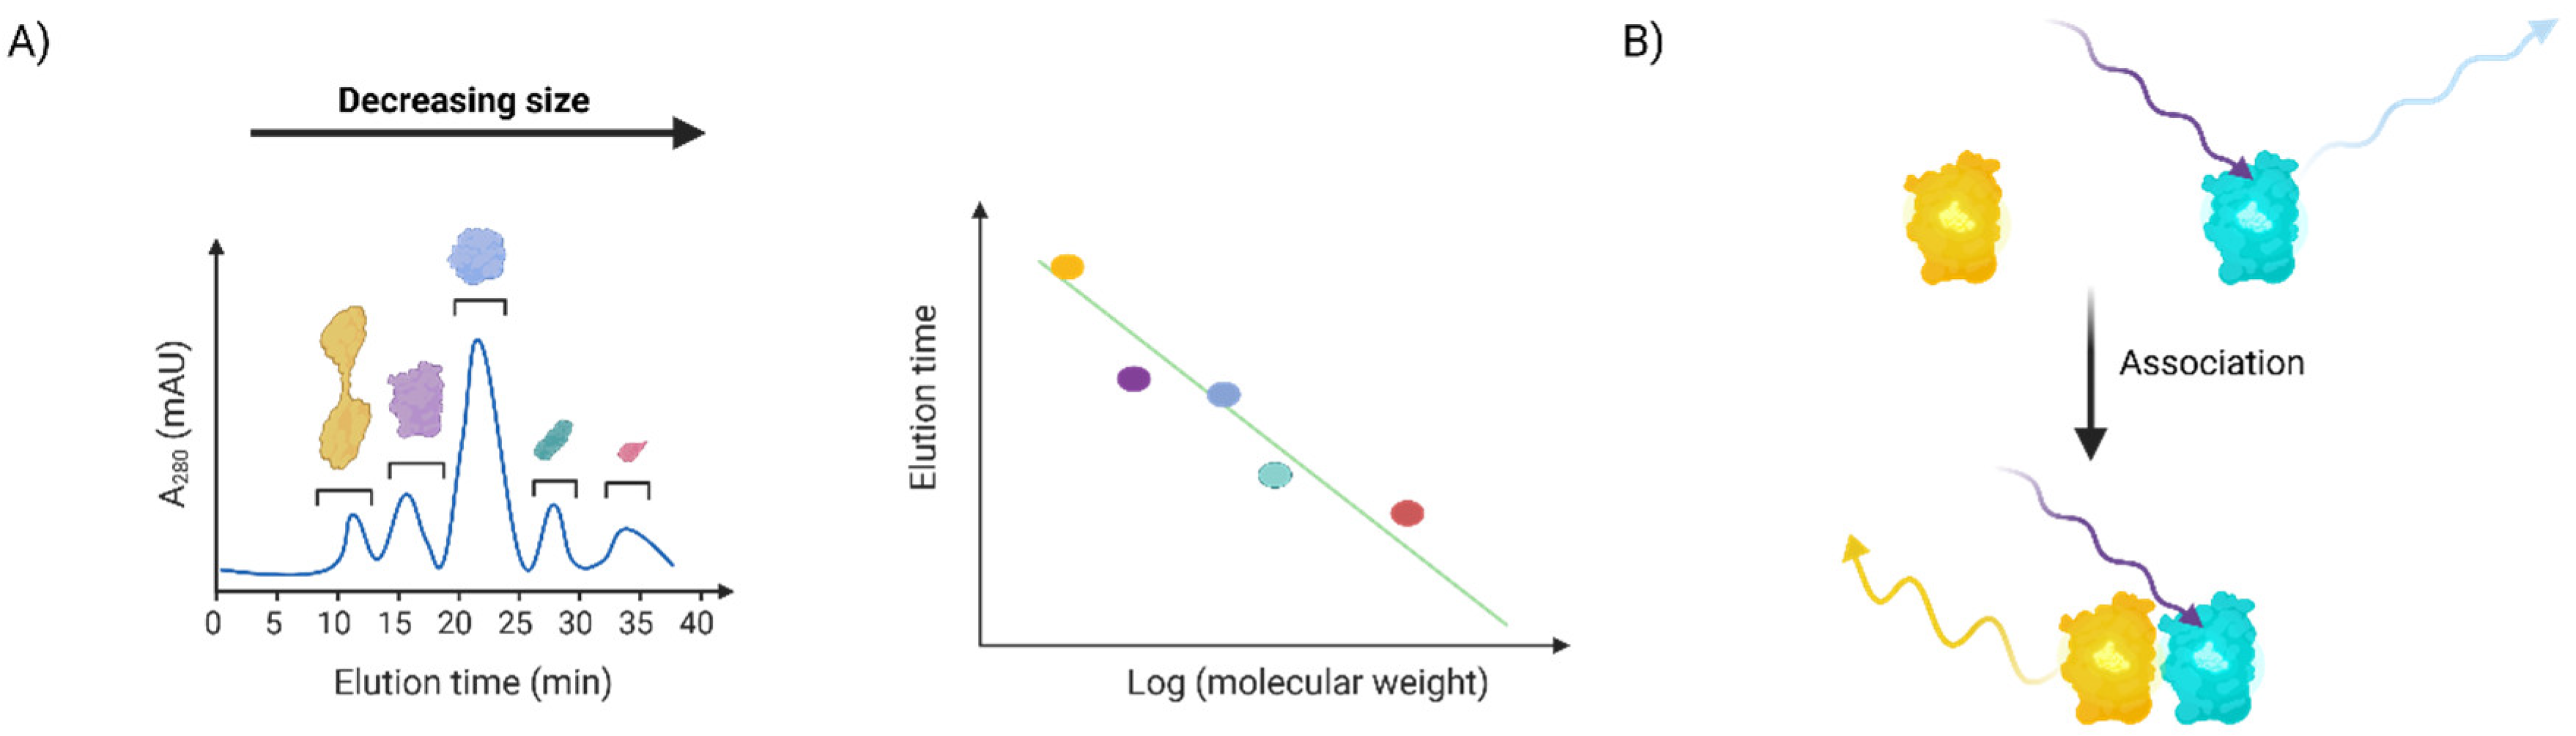
This is a method to separate proteins by size, with the largest proteins eluting first. Several different columns with different optimal size resolution parameters are available for assay optimization. This method is often deployed to separate different oligomeric states of proteins (for instance for X-ray crystallography, or when a specific oligomer of a protein is active [19]), to assess association, or to fractionate protein mixtures. Of course, in order to be suitable for analysis by analytical chromatography complexes must be relatively stable (certainly on the order of ~1h, the time needed for a typical run). We have deployed this method to study the effect of RNR-α binding drugs on protein oligomeric state both with purified proteins and proteins isolated from cells (Figure 3a). In both instances, we showed that these inhibitors—either by direct treatment of purified protein or following drug treatment of cells—all caused RNR-α to shift to a higher molecular weight, hexameric form.
4.2. FRET-Based Association Assays – Changing Colors
Applicability: purified protein, specific mixtures, lysates or cells
Main structural aspect investigated: protein quaternary associations
Other notes: no real limit in size
Is it quantitative? highly quantitative and distance sensitive.
Fluorescence resonance energy transfer, FRET (and the closely related bioluminescence resonance energy transfer, BRET) occurs when two fluorophores with matching wavelengths (one a donor, with higher wavelength of excitation, the other an accepter with lower wavelength of excitation) are brought into proximity. Under these conditions, excitation of the acceptor fluorophore leads to excitation of the donor fluorophore through energy transfer. Thus, the emission of the acceptor decreases, while the emission of the acceptor increases. Because FRET/BRET are very sensitive to distance between the fluorophores, this method can give accurate indication of distances between differently fluorescently-labeled proteins. We used this method to create a FRET reporter assay for RNR-α hexamerization (Figure 3b) that does not rely on the relatively arduous radioactive activity/inhibition assay. In this case, we used non-site-specifically-fluorophore labeled recombinant RNR-α monomers that were mixed together. FRET is possible with fluorescent proteins, typically CFP and YFP are used. We have used several FRET-based reporters, developed by the Zhang laboratory, to report on activity of kinase AKT in live zebrafish larvae beyond cultured cells, for instance. Co-expression of differentially fluorescently labeled receptors that undergo clustering during signaling has also been used [20].
Conclusion – got a taste for biophysics?
Biophysical methods present a varied and rich fleet of methods that are complementary to other biological and chemical-biological investigations, and can provide unique insights in of themselves. Their deployment often requires specific experimental equipment or techniques, although these are often available at core facilities or through collaboration. We hope that this piece has whetted your appetites for biophysical experiments.
Conflict of Interest
The authors have no conflicts to declare.
Acknowledgements
Postdoctoral Fellowship from the Novartis Foundation for Medical-Biomedical Research (M.J.C.L.). EPFL (Y.A.).
References
- Long, M. J. C., Liu, J. & Aye, Y. Finding a vocation for validation: taking proteomics beyond association and location. RSC Chemical Biology 4, 110-120, (2023). [CrossRef]
- Zhao, Y. et al. Function-guided proximity mapping unveils electrophilic-metabolite sensing by proteins not present in their canonical locales. Proceedings of the National Academy of Sciences 119, e2120687119, (2022). [CrossRef]
- Good, C. J. et al. High Spatial Resolution MALDI Imaging Mass Spectrometry of Fresh-Frozen Bone. Analytical Chemistry 94, 3165-3172, (2022). [CrossRef]
- Dixit, S. M., Polasky, D. A. & Ruotolo, B. T. Collision induced unfolding of isolated proteins in the gas phase: past, present, and future. Current Opinion in Chemical Biology 42, 93-100, (2018). [CrossRef]
- Surya, S. L. et al. Cardiovascular Small Heat Shock Protein HSPB7 Is a Kinetically Privileged Reactive Electrophilic Species (RES) Sensor. ACS Chem Biol 13, 1824-1831, (2018). [CrossRef]
- Carugo, O. How large B-factors can be in protein crystal structures. BMC Bioinformatics 19, 61, (2018). [CrossRef]
- Schotte, F., Soman, J., Olson, J. S., Wulff, M. & Anfinrud, P. A. Picosecond time-resolved X-ray crystallography: probing protein function in real time. J Struct Biol 147, 235-246, (2004). [CrossRef]
- Butryn, A. et al. An on-demand, drop-on-drop method for studying enzyme catalysis by serial crystallography. Nature Communications 12, 4461, (2021). [CrossRef]
- Ohi, M., Li, Y., Cheng, Y. & Walz, T. Negative staining and image classification — powerful tools in modern electron microscopy. Biological Procedures Online 6, 23-34, (2004). [CrossRef]
- Milne, J. L. S. et al. Cryo-electron microscopy – a primer for the non-microscopist. The FEBS Journal 280, 28-45, (2013). [CrossRef]
- Lee, W., Rahimi, M., Lee, Y. & Chiu, A. POKY: a software suite for multidimensional NMR and 3D structure calculation of biomolecules. Bioinformatics 37, 3041-3042, (2021). [CrossRef]
- Shi, Y. et al. Boc(3)Arg-Linked Ligands Induce Degradation by Localizing Target Proteins to the 20S Proteasome. ACS Chem Biol 11, 3328-3337, (2016). [CrossRef]
- (1999).
- Aretz, J. & Rademacher, C. Ranking Hits From Saturation Transfer Difference Nuclear Magnetic Resonance–Based Fragment Screening. Frontiers in Chemistry 7, (2019). [CrossRef]
- Henzler-Wildman, K. & Kern, D. Dynamic personalities of proteins. Nature 450, 964-972, (2007). [CrossRef]
- Elgert, C., Rühle, A., Sandner, P. & Behrends, S. Thermal shift assay: Strengths and weaknesses of the method to investigate the ligand-induced thermostabilization of soluble guanylyl cyclase. Journal of Pharmaceutical and Biomedical Analysis 181, 113065,(2020). [CrossRef]
- Josts, I. et al. Structural Kinetics of MsbA Investigated by Stopped-Flow Time-Resolved Small-Angle X-Ray Scattering. Structure 28, 348-354.e343, (2020). [CrossRef]
- Kikhney, A. G. & Svergun, D. I. A practical guide to small angle X-ray scattering (SAXS) of flexible and intrinsically disordered proteins. FEBS Letters 589, 2570-2577, (2015). [CrossRef]
- Cho, J. K. et al. Geranylated flavonoids displaying SARS-CoV papain-like protease inhibition from the fruits of Paulownia tomentosa. Bioorganic & Medicinal Chemistry 21, 3051-3057, (2013). [CrossRef]
- Block, V. et al. CVID-Associated B Cell Activating Factor Receptor Variants Change Receptor Oligomerization, Ligand Binding, and Signaling Responses. Journal of Clinical Immunology 43, 391-405, (2023). [CrossRef]
Figure 1.
Protein structure and mass spectrometry. (a) Depictions of protein primary (i), secondary (ii), tertiary (iii), and quaternary (iv) structures. (b) Different proteases used in digest MS experiments. Inset (cricle) on right shows a representative tryptic peptide, wherein the last residue must be either arginine (as in this example) or lysine. (c) y and b ions resulting from collision-induced dissociation in tandem MS identification, examplified using a resulting 12-mer peptide post digestion. Top row: inset on right shows a representative fragmented ammonium and acylium ions, respectively, arbitrarily shown for y10 and b3 ions. Lower row: modification site identification, exemplified using phosphorylation (yellow sphere) at the 3rd residue of a 12-mer peptide post digestion: consecutive fragments flanking a modified residue (here, b2, b3, and b4 ions, see inset on right) are needed to confidently assign position of a modification. (d) C-terminal sequencing by exocarboxypeptidase and intact MS. Biorender software is used for illustrations.
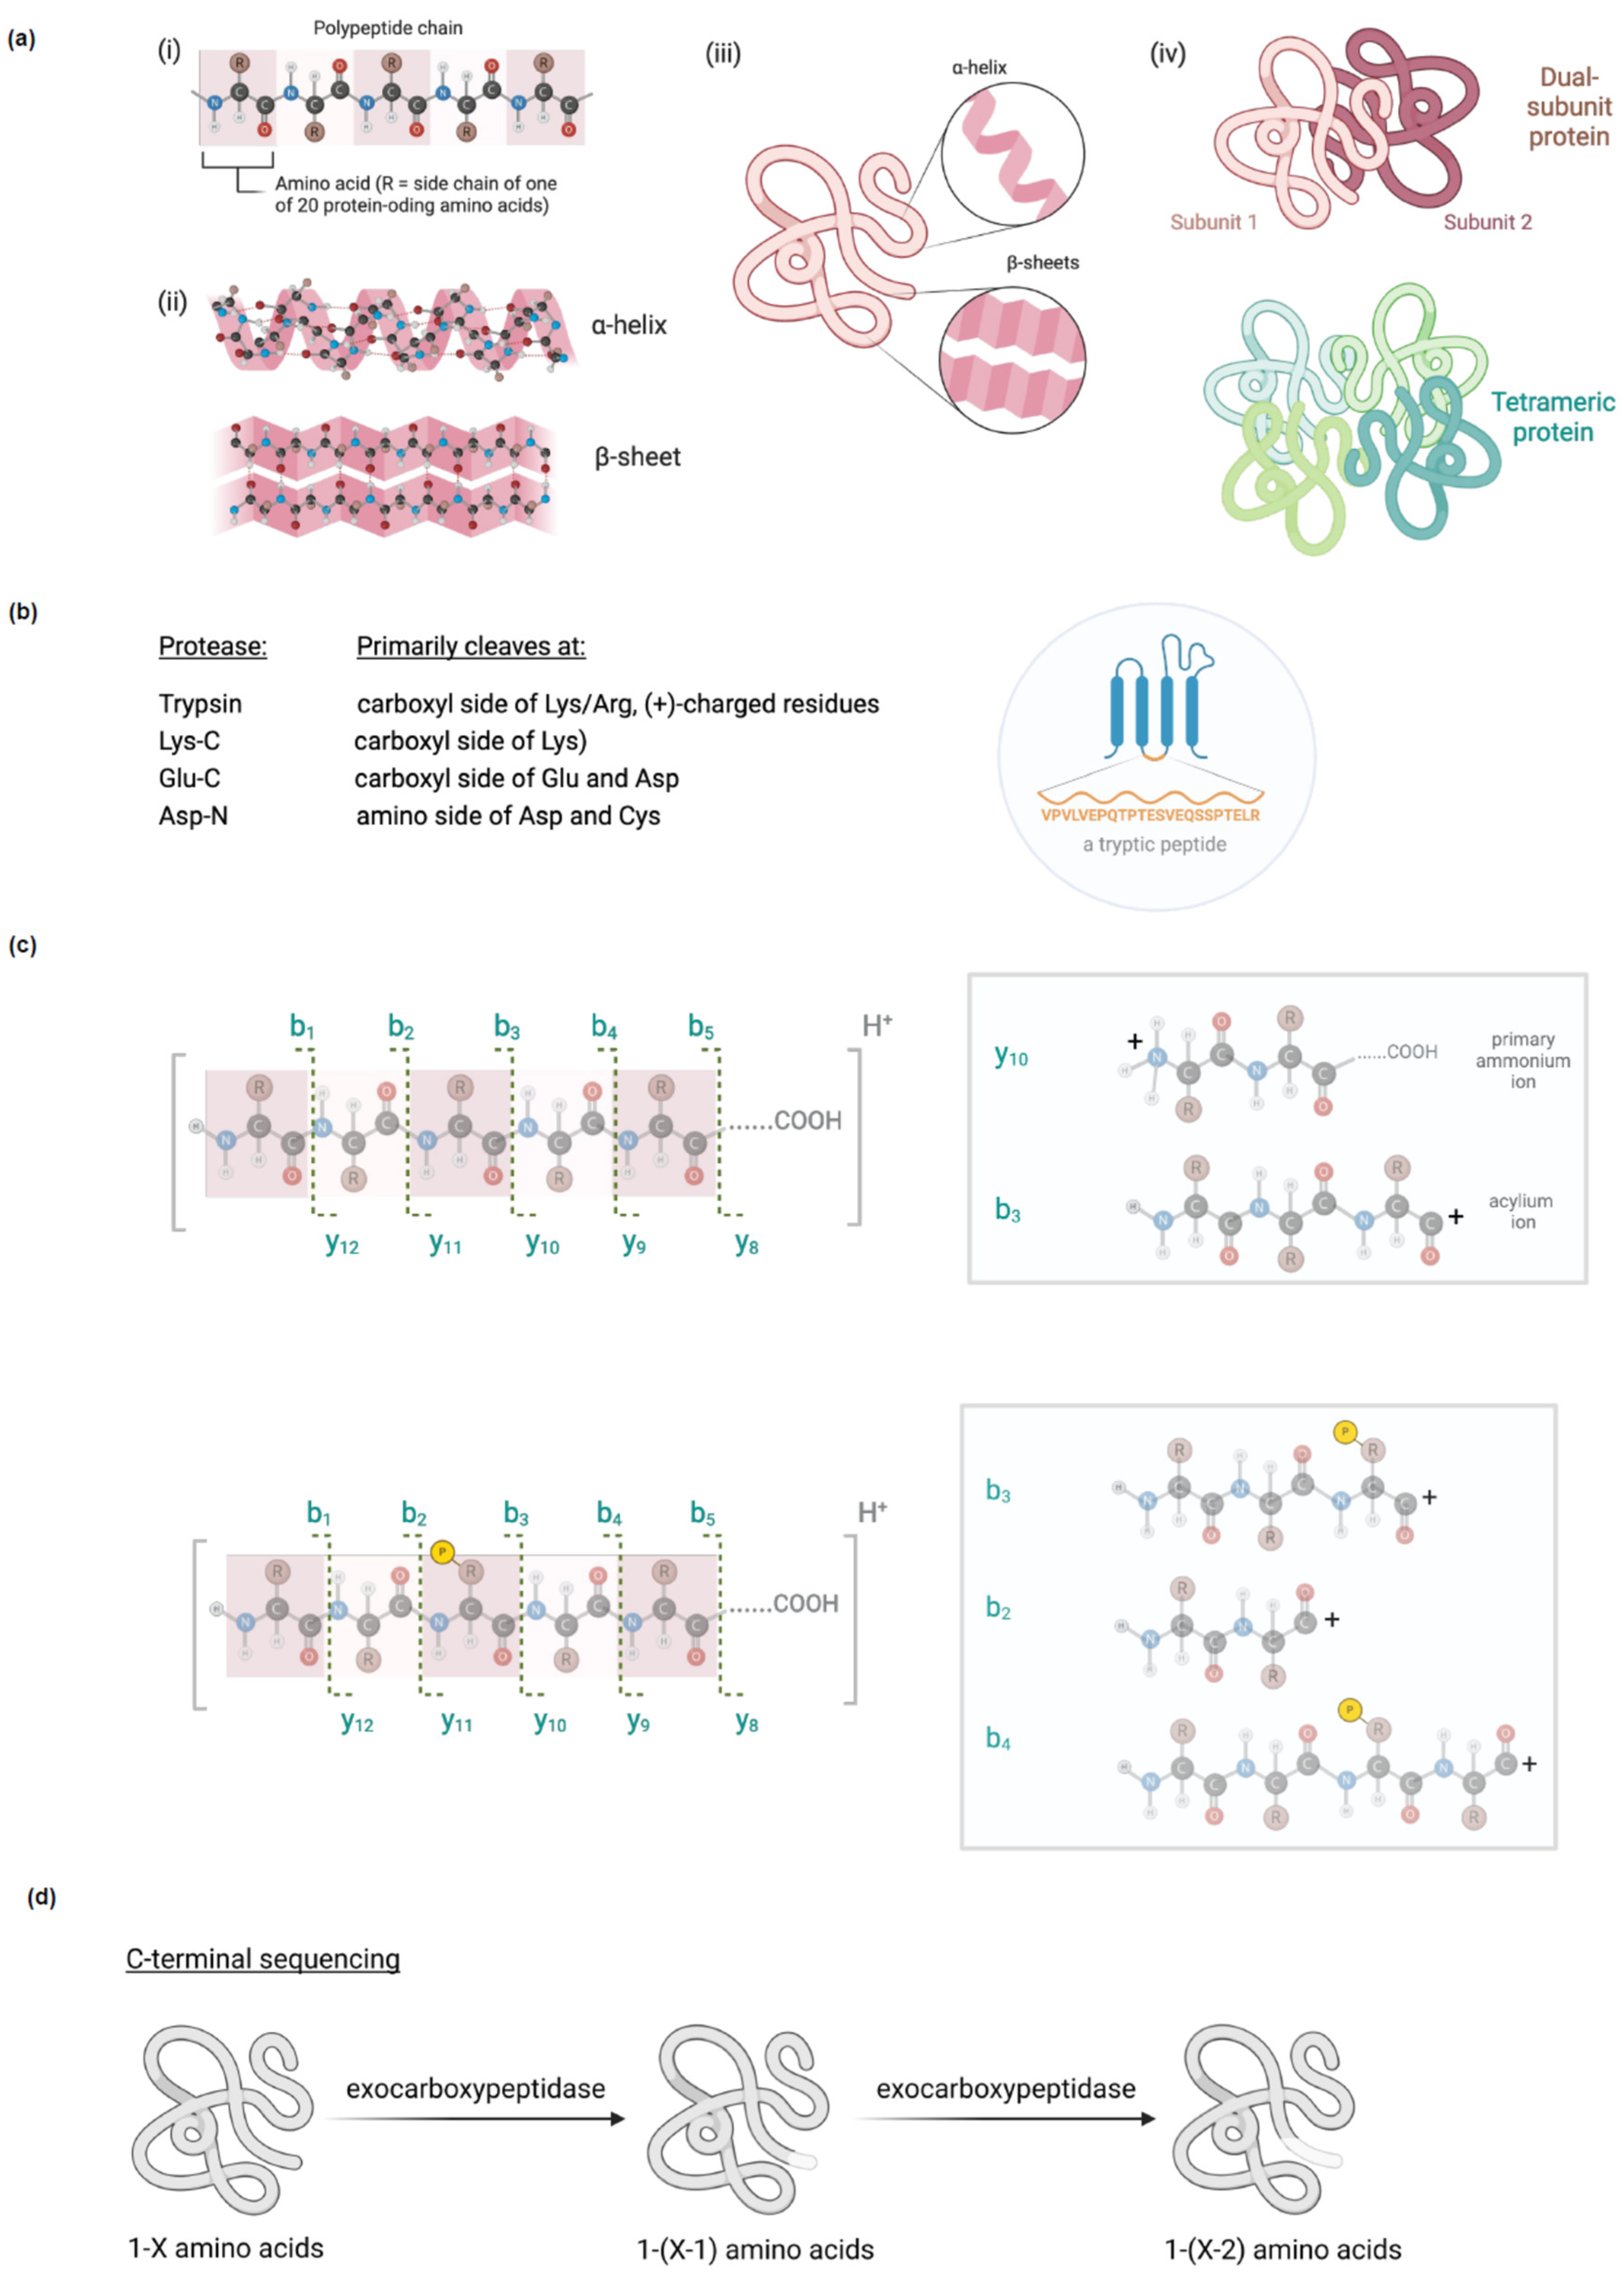
Figure 2.
Different structural techniques discussed in the main text. (a) Two different structures of human GST-α4.4 dimers at low (PDB: 1GUM) and high (PDB: 3IK7) resolution. The left hand side of each dimer is colored by surface hydrophobicity; the right hand side is colored by B-factor, blue lowest to red highest. (b) Representative pictures of different conformations of RNR-α hexamers detected by treatment with different drugs. Figures reproduced from Fu et al. Nat Chem Biol 2018 14 943. Image copyright belongs to the authors of this perspective. (c) Schematic 15N/1H HSQC NMR spectrum, with some rough guidelines about characteristic peaks. See manuscript text for details. (d) Human dihydrofolate reductase shown as both an NMR (PDB: IYHO) (top panel) and a crystal structure (PDB: 3NZD) (bottom panel) in ribbon form.
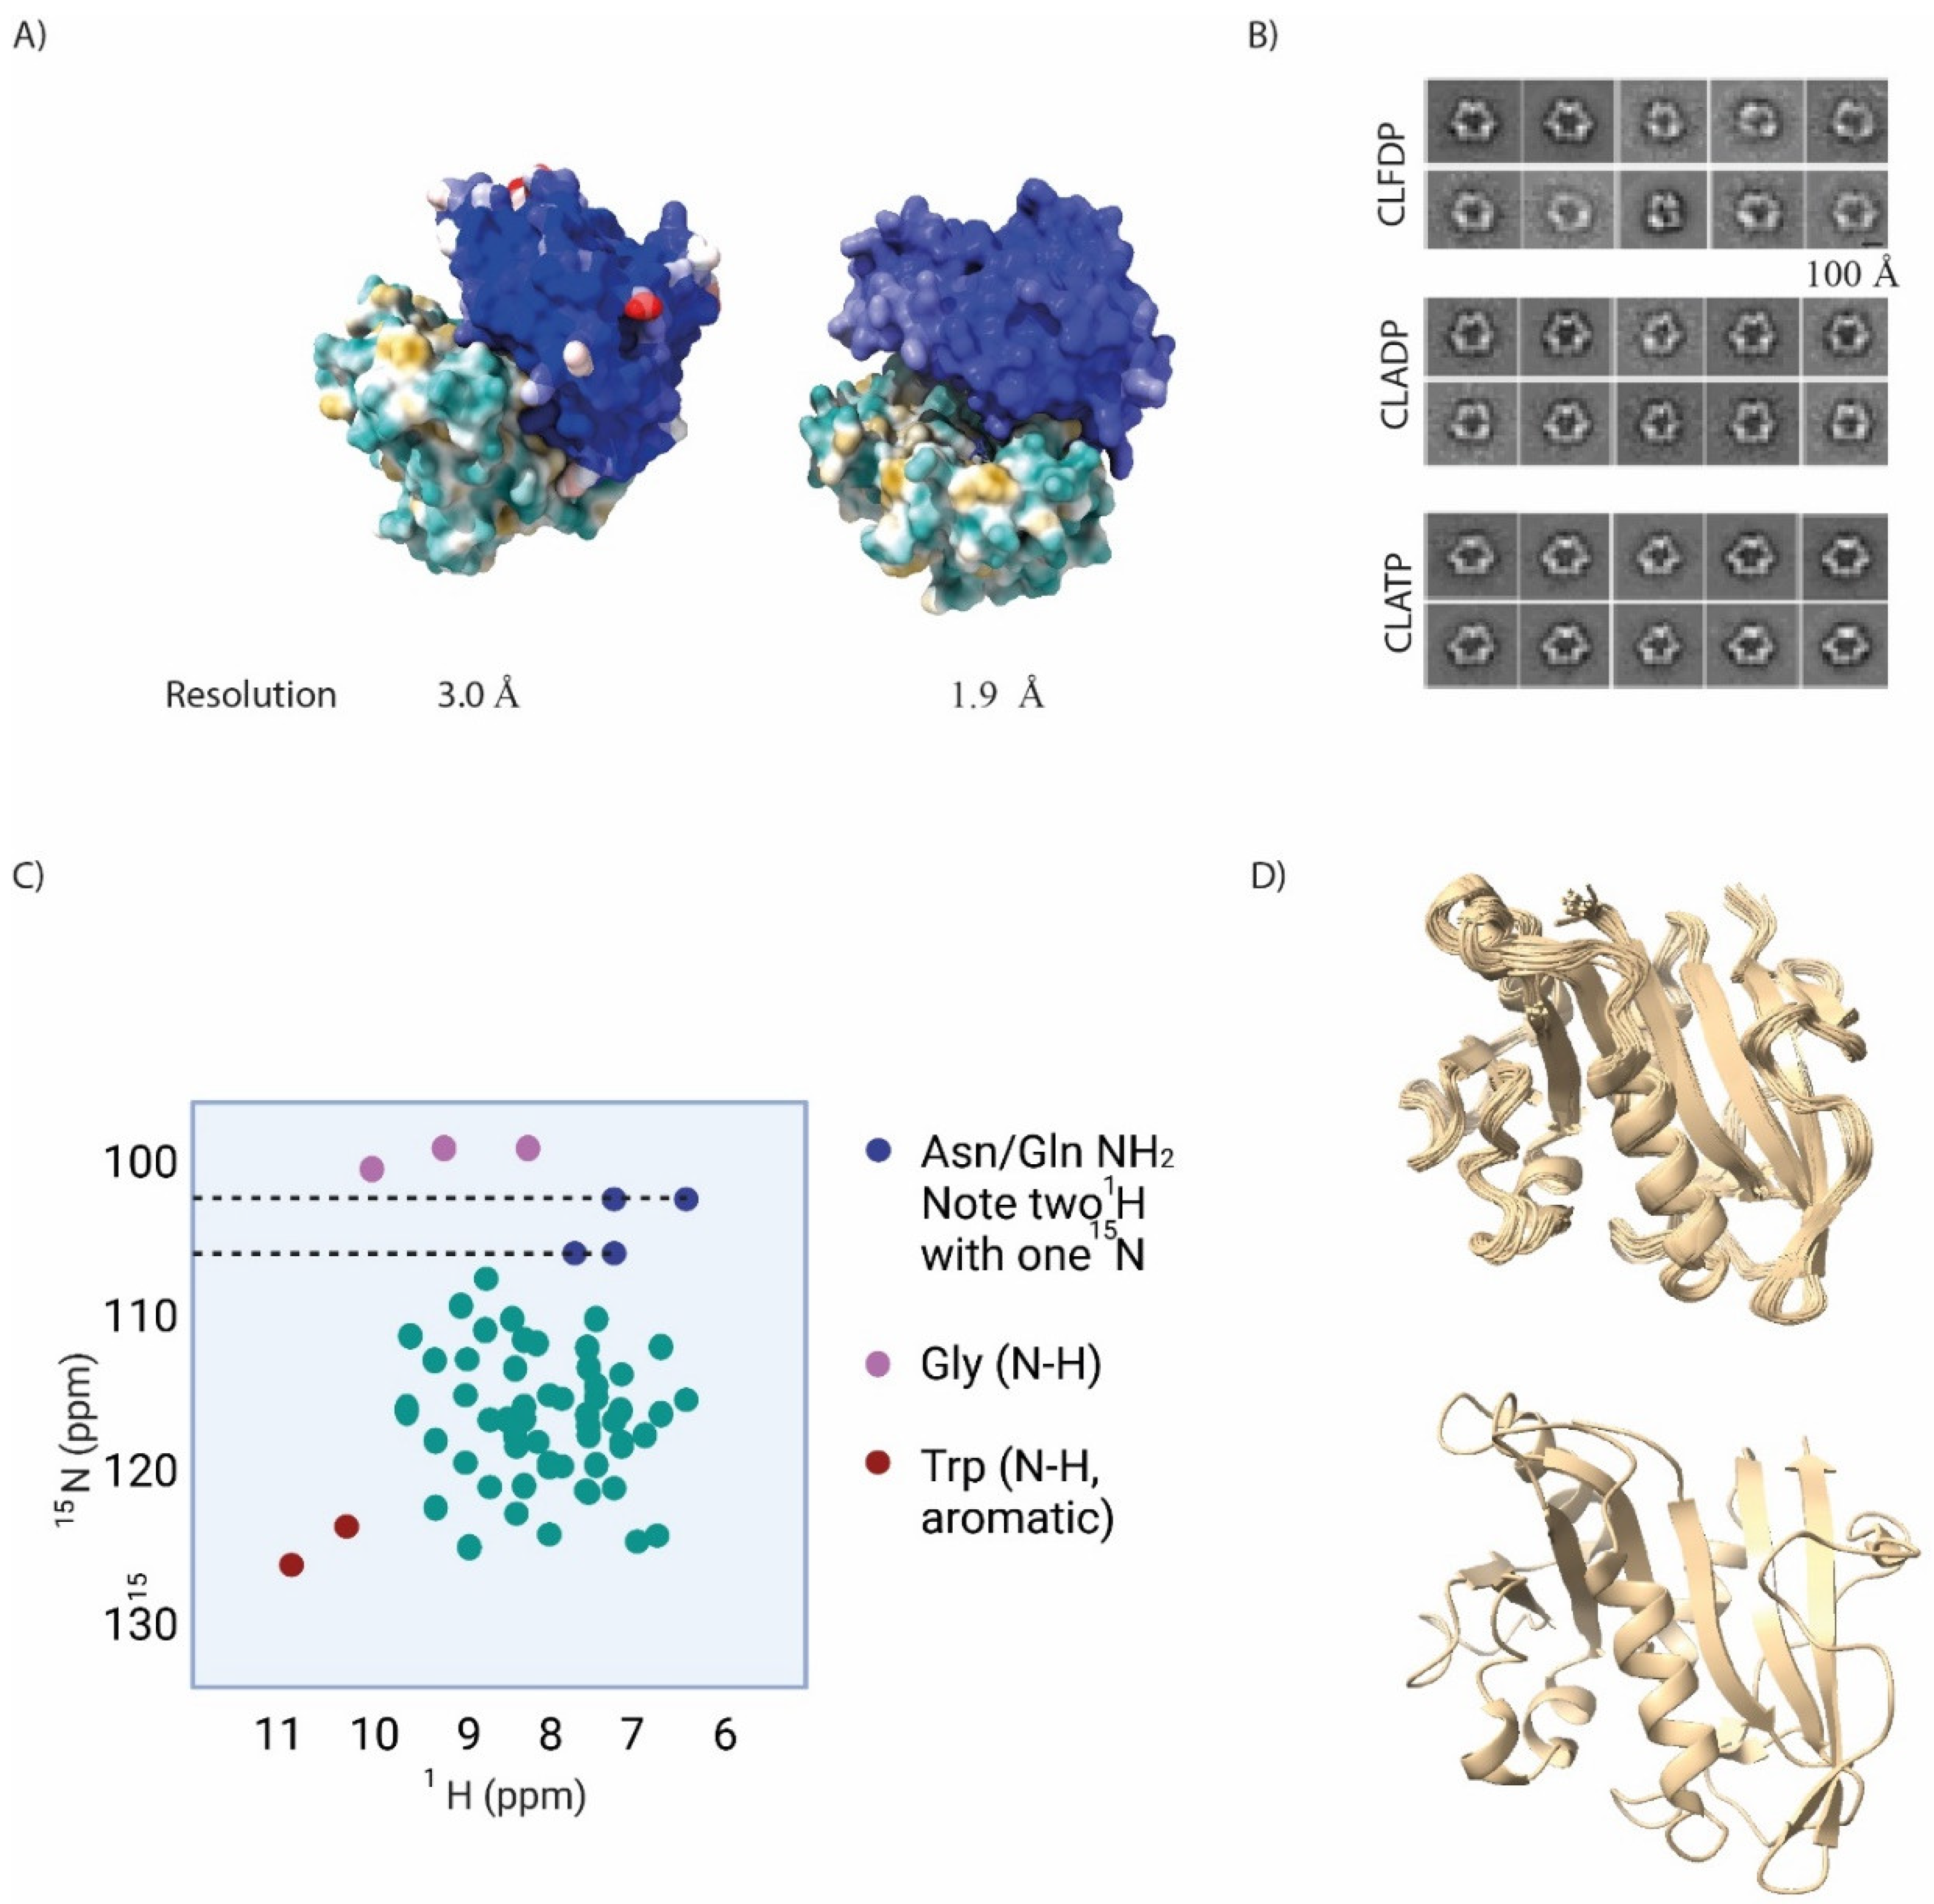
Figure 3.
Schematic illustrations for some of the general biophysical techniques measuring proteins’ functional properties. (a) Size exclusion chromatography separates proteins from size from largest to smallest (left panel: elution spectrum). Right panel: the logarythm of the molecular weight should be negatively correlated with elution time. (b) FRET between a CFP (blue) and YFP (yellow) reporting protein protein association of two designated proteins of interest (omitted in figure for clarity) genetically fused to CFP and YFP, providing also the resulting fusion constructs do not alter native (untagged) proteins’ function/activity.
Disclaimer/Publisher’s Note: The statements, opinions and data contained in all publications are solely those of the individual author(s) and contributor(s) and not of MDPI and/or the editor(s). MDPI and/or the editor(s) disclaim responsibility for any injury to people or property resulting from any ideas, methods, instructions or products referred to in the content. |
© 2024 by the authors. Licensee MDPI, Basel, Switzerland. This article is an open access article distributed under the terms and conditions of the Creative Commons Attribution (CC BY) license (http://creativecommons.org/licenses/by/4.0/).
Copyright: This open access article is published under a Creative Commons CC BY 4.0 license, which permit the free download, distribution, and reuse, provided that the author and preprint are cited in any reuse.


