Submitted:
10 June 2024
Posted:
12 June 2024
You are already at the latest version
Abstract
The structure and physicochemical properties of polyvinyl alcohol (PVA) and PVA/glycerol films have been investigated by Fourier-transform infrared spectroscopy (FT-IR), X-ray Diffraction (XRD), thermogravimetry/differential thermal analysis (TG/DTA), and advanced scanning probe microscopy (SPM). In the pure PVA films, SPM allowed us to observe ribbon-shaped domains with a different frictional and elastic contrast, which apparently originated from a correlated growth or assembly of PVA crystalline nuclei located within individual PVA clusters. The incorporation of 1.0 wt.% glycerol led to modification in shape of those domains from ribbon-like in pure PVA to rounded in PVA/glycerol 1.0 wt.% films; changes in the relative intensities of the XRD peaks and a decrease of the amorphous halo in the XRD pattern were also detected, while the DTA peak corresponding to the melting point remained at almost the same temperature. For higher glycerol content, FT-IR revealed additional glycerol-characteristic peaks presumably related to the formation of glycerol aggregates, and XRD, FT-IR, and DTA all indicated a reduction in crystallinity. For more than 2.0 wt.% glycerol, the plasticization of the films complicated the acquisition of SPM images without tip-induced surface modification. Our study contributes to the understanding of crystallinity in PVA and how it is altered by a plasticizer such as glycerol.
Keywords:
polyvinyl alcohol films pva/glycerol blends
; crystallinity
; infrared spectroscopy
; x-ray diffraction
; thermogravimetry
; differential thermal analysis
; atomic force microscopy
; lateral force microscopy
; ultrasonic force microscopy
1. Introduction
Nowadays, the development of materials with film forming capacity is of growing interest. Polyvinyl alcohol (PVA) is one of the most popular synthetic polymers due to its biodegradability, biocompatibility, high elasticity, hydrophilicity, and acceptable thermal properties. PVA has excellent film forming properties, and is widely used in the development of sensor materials, drug delivery systems, wound dressings, artificial cartilages, implants, for packaging applications, recovery of organic and inorganic pollutants, etc. [1,2,3,4].
However, due to its poor ductility, in practical applications PVA is often used with addition of plasticizers which influence its mechanical and thermodynamic properties [5,6,7]. Plasticizers such as glycerol, sorbitol, sucrose and some organic acids are well-known as low molecular weight compounds that reduce polymer-polymer chain bonding [8]. The breaking of hydrogen bonds increases the molecular mobility of the polymer, which results in increased flexibility of the polymer films. Being nontoxic to humans at low concentrations, glycerol is a widespread plasticizer incorporated in PVA films [10,11,12,13,14,15,16,17,18], as well as in its nanocomposites and blends
PVA is a semicrystalline polymer composed of both amorphous and crystalline phases, with the percentage of crystallinity playing a crucial role in determining its performance. Understanding and controlling the crystallinity of PVA is essential for applications such as drug delivery and wound dressings, as the amount of the crystalline phase will affect the release of active compounds and the material's mechanical properties. Higher crystallinity may enhance the durability and structural integrity of films for biomedical applications. Additionally, in films used as membranes for water treatment and the recovery of organic and inorganic pollutants, crystalline regions can improve mechanical strength and chemical resistance, leading to better performance and longer service life. For adhesives and coatings, the crystallinity of PVA affects adhesion properties, flexibility, and resistance to solvents and environmental factors. In packaging, it influences the film’s strength, barrier properties, and stability. Controlling crystallinity can help optimize these films for specific industrial purposes.
In this work, we have conducted a comprehensive analysis of the crystallinity in pure PVA and PVA/glycerol films through a correlative study of data from Fast Fourier Transform Infrared Spectroscopy (FTIR), X-Ray Diffraction (XRD), and Thermogravimetry (TG) / Differential Thermal Analysis (TDA) and Advanced Scanning Probe Microscopy (SPM). We have been able to identify nanoscale phases with distinct elastic and frictional properties, likely related to the presence of crystalline domains. The incorporation of glycerol led to changes in the thermal properties and crystallinity of the films. For low glycerol contents, SPM revealed morphological modifications of the observed nanoscale domains. For glycerol contents exceeding 2.0 wt.%, the softness and deformability significantly heightened, complicating the acquisition of SPM images without altering the films. Our study provides valuable insights into how plasticizers, such as glycerol, impact the PVA nanostructure, thereby offering avenues for tailoring PVA properties to achieve optimal performance.
2. Materials and Methods
2.1. Materials and Sample Preparation
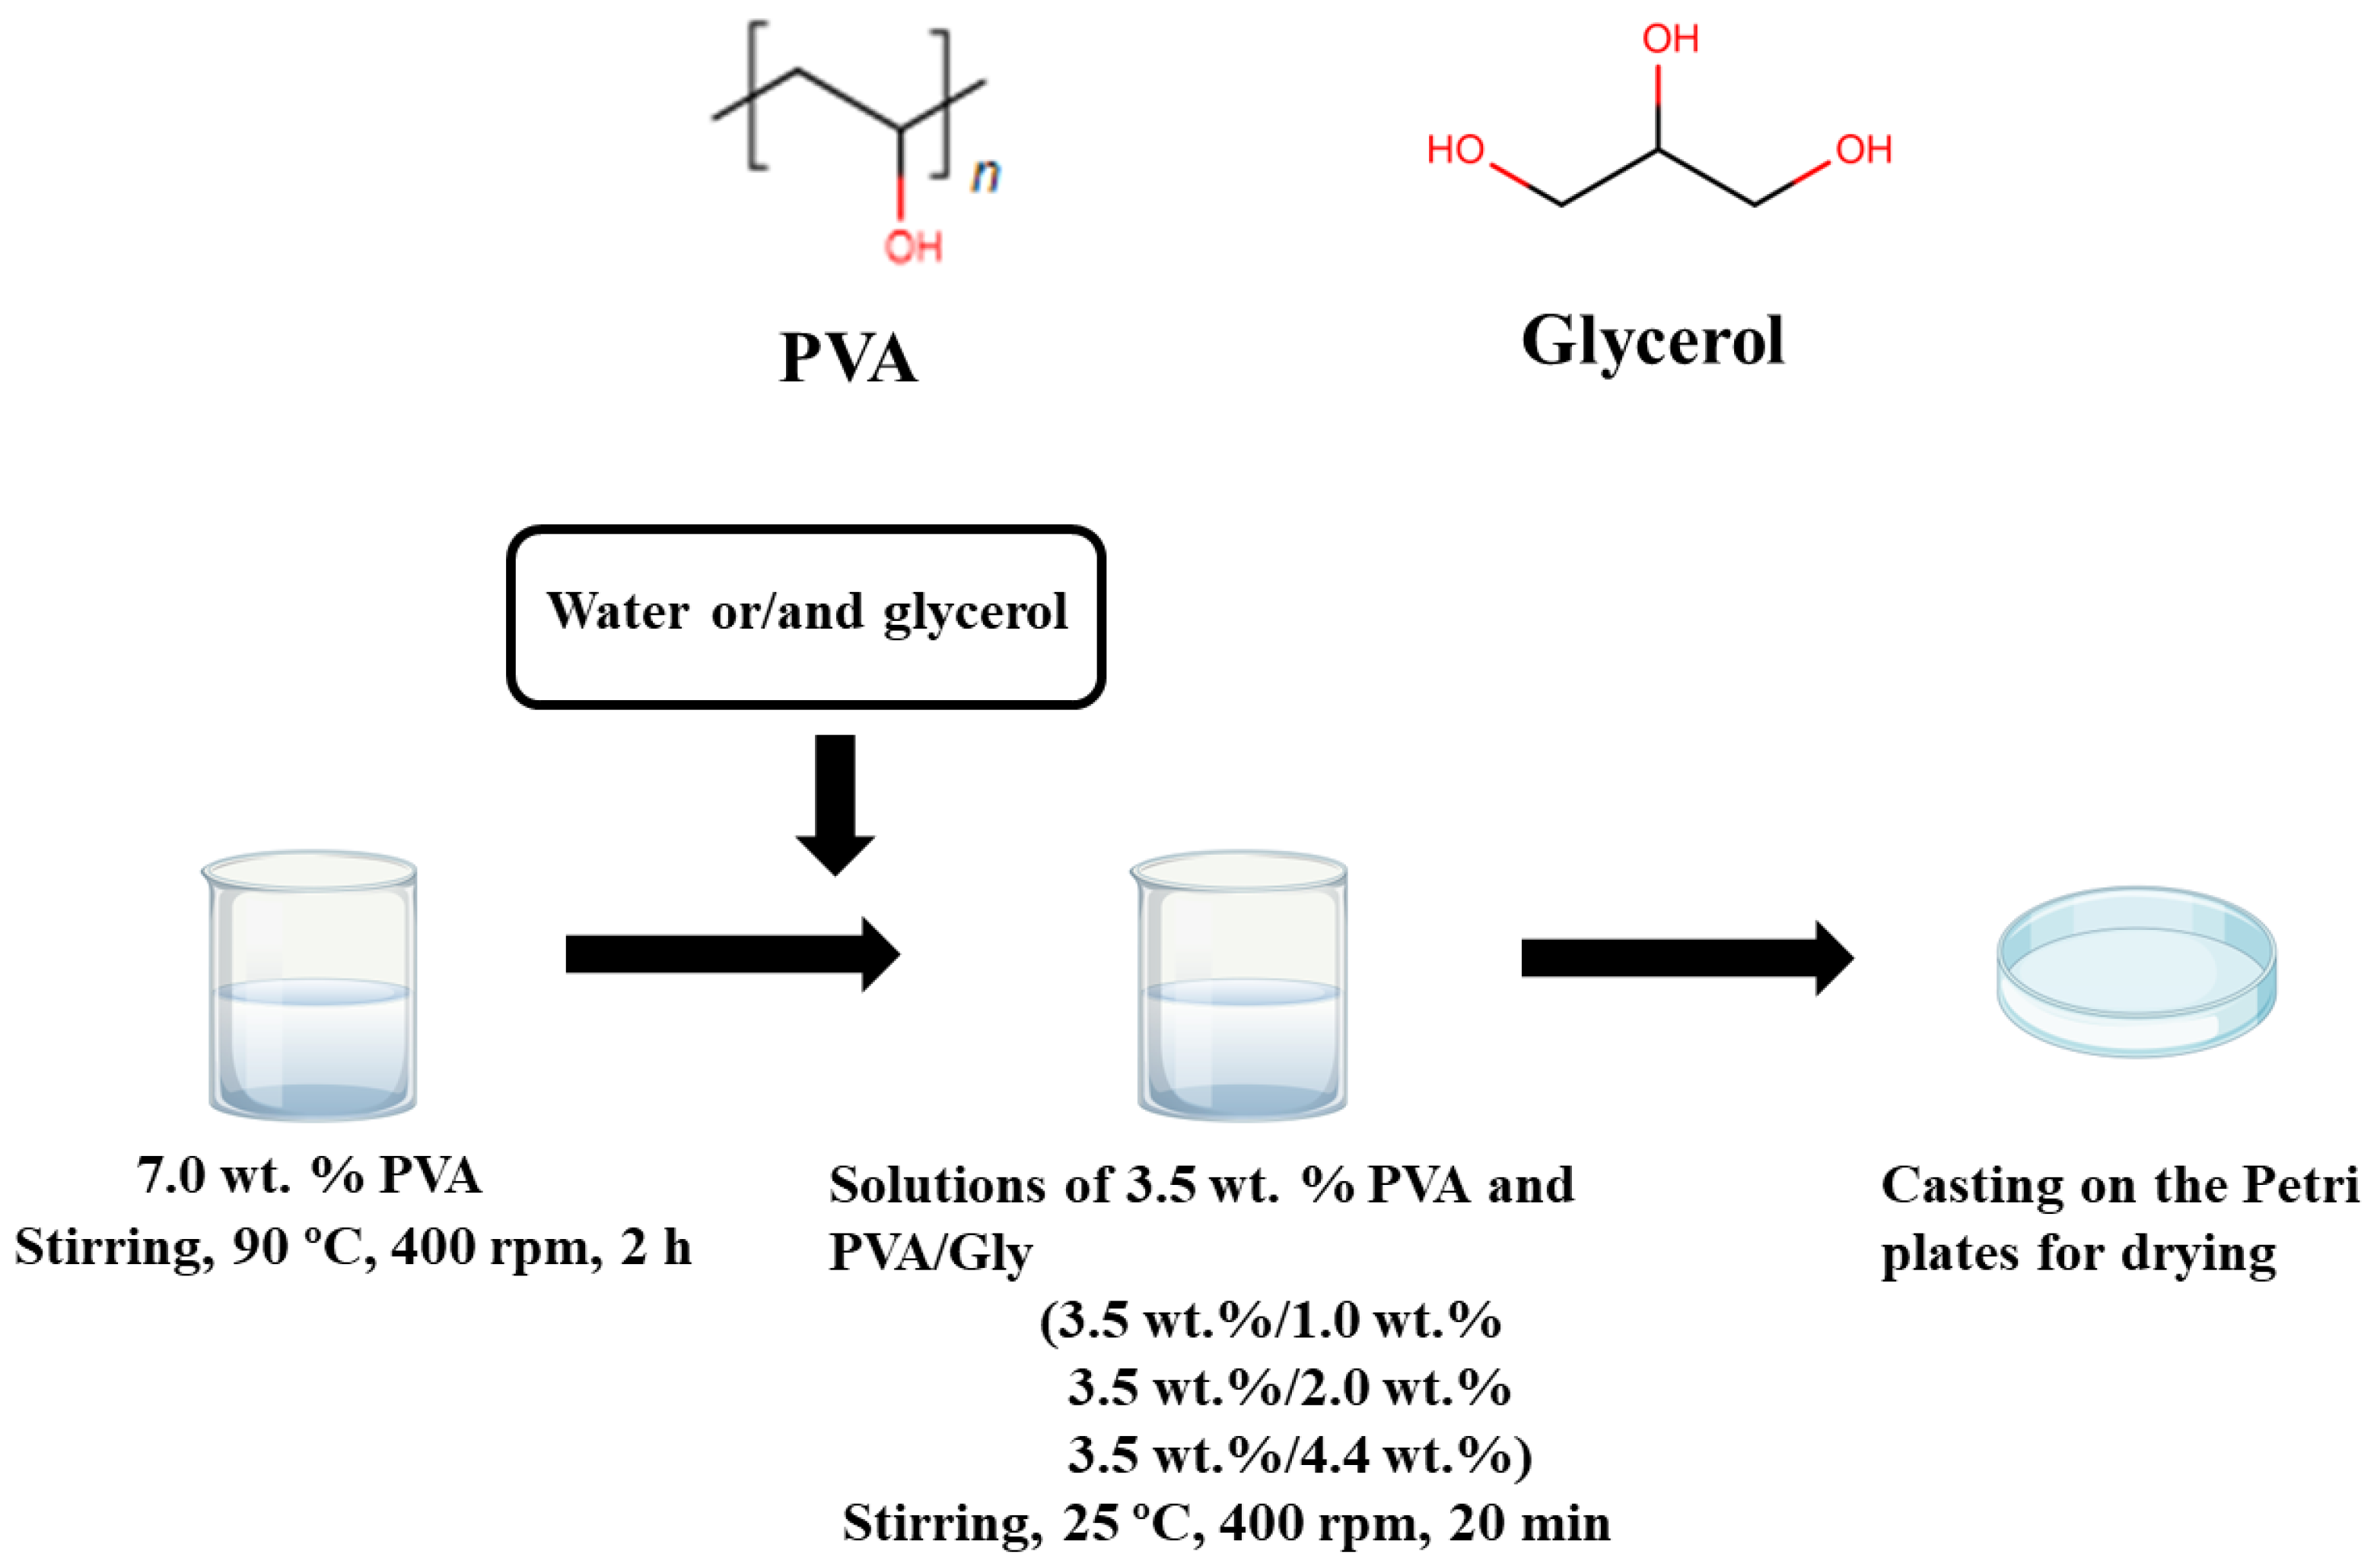
PVA (Mw 31 000-50 000 g/mol, 98-99% hydrolyzed) and glycerol (≥99.0%) were supplied by Merck, Darmstadt, Germany. The PVA was dissolved in distilled water with stirring at 90 °С, 400 rpm, when heated in a water bath for 2 hours, to prepare a 7.0 wt.% stock solution. Solutions of PVA with 3.5 wt.% concentration, and mixed PVA/glycerol solutions containing 3.5 wt.% PVA and 1.0 wt.%, 2.0 wt.%, 4.4 wt.% glycerol, were prepared from the 7.0 wt.% PVA stock solution, glycerol and distilled water, stirred at 25 ºC, 400 rpm, 20 min, poured on polystyrene Petri dishes and evaporated at room temperature (20-25°С) and ambient humidity ~ 50% R.H. Films ~ 200 µm thick were obtained by this method (solution casting). The film preparation procedure is illustrated in Figure 1.
2.2. Fourier-Transformed Infrared Spectroscopy (FT-IR)
FTIR spectra (4 cm−1 resolution, wavenumber range 500–4000 cm−1) were recorded with a Shimadzu IRPrestige-21 spectrometer (Tokio, Japan), using the ATR method. Small pieces of the PVA and PVA/glycerol films were cut and placed in the instrument sample holder. The data were acquired d using the software Shimadzu IR solution 1.21 (Tokio, Japan) and analyzed using Originpro 2024 (Northampton, MA, USA) software.
2.3. X-ray Diffraction (XRD)
XRD measurements were performed in an equipment Philips X’Pert MPD (Eindhoven, Holland), using CuK α radiation (1.54056 Å) with 40 KV and 40 mA. It incorporates 0.04 rad soller slits for both incident and diffracted beams, an automatic 12.5 mm programmable divergence slit, and a Xe gas sealed proportional detector. Data were collected in an angular range between 1° and 50° (2θ) with a step size of 0.02° and a counting time of 0.70 s per step, and analyzed using Originpro 2024 (Northampton, MA, USA) software.
2.4. Thermogravimetric Analysis (TGA) and Differential Thermal Analysis (DTA)
The thermal behavior of the samples was examined with a Setaram model TG/DTA92 equipment (Caluire-et-Cuire, France), using a Pt crucible. Typically, thermograms were recorded in air atmosphere, within a temperature range from 20°C to 500 °C, with a heating rate of 5 ºC/min. For some of the samples, rates of 25ºC/min were also used. One experiment in pure PVA was additionally performed in argon atmosphere with a heating rate of 5 ºC/min. The data were analyzed using Originpro 2024 (Northampton, MA, USA) software. Derivative thermogravimetric (DTG) analysis was performed to identify the thermal transformation peaks.
2.5. Scanning Probe Microscopy
Contact-mode atomic force microscopy (AFM), lateral force microscopy (LFM) and ultrasonic force microscopy (UFM) were performed using a NANOTEC (Madrid, Spain) instrument. The modification of the AFM equipment for the incorporation of UFM facilities is described in [19]. For UFM, ultrasonic frequencies of ~3.8 MHz and modulation frequencies of 2.4 KHz were applied from a piezoelectric element placed under the sample. Typically, Olympus Silicon Nitride cantilevers with a nominal spring constant of 0.06 N/m and a nominal tip radius of 20 nm were used. The measurements were performed in air, at ambient conditions (20-25°С, ~ 50% R.H.). Data were analyzed using the WSxM software (Madrid, Spain) [20].
Figure 1.
Structural formulas of PVA and glycerol; film preparation scheme.
3. Results and Discussion
3.1. FTIR Analysis
FTIR spectra for the pure PVA and PVA/glycerol blended films with different glycerol content, 1.0, 2.0, 4.4 wt%, are displayed in Figure 2a.
For the pure PVA film, the band at 3273 cm–1 corresponds to (O-H) stretching vibration from the intermolecular and intramolecular hydrogen bonds [17]. The two bands at 2939 and 2907 cm–1 correspond to the asymmetric and symmetric stretching vibrations of methylene (–CH2–), respectively [21]. The peaks at 1709 cm−1, 1655 cm−1, and 1560 cm–1 have been related to the stretching vibrations of the (C=O) and (C–O) bonds present in the remaining acetate units [22], which in our case must be very few, as we are using highly hydrolyzed PVA. The 1655 cm-1 band has also been assigned to absorbed water [23,24]. The peaks at 1417 cm–1 and 1327 cm–1 have been attributed to bending vibrations of hydroxyl (–OH) and wagging of (C‒H), respectively [25]. The peak at 1141 cm–1 has been assigned to (C–O) stretching vibrations in C–OH groups of the crystalline polymer phase [26] ] and also to (C–C) stretching vibrations of the carbon framework of the polymer chain in the crystalline phase [27]. The peak at 1088 cm–1 corresponds to the (C–O) stretching vibrations [24], the band at 916 cm-1 to CH2 rocking vibration, and this at 836 cm-1 to (C–C) stretching and (C–H) out-of-plane vibrations.
For the PVA-glycerol films, (Figure 2a) a shift of the (O–H) stretching vibration band from 3273 cm–1 to higher wavenumbers is observed when increasing the glycerol content (up to 3283 cm–1 for 4.4 wt.% of glycerol). A possible reason for this effect is the dissociation of hydrogen bonds between the PVA chains and the formation of new hydrogen bonds between the PVA and glycerol molecules [17,28]. Similar results were obtained for films of PVA/chitosan with addition of glycerol [28] and films of wheat starch with glycerol [9].
For the PVA/glycerol 4.4 wt.% film, the band at 2939 cm-1 experiences a slight increase compared to the 2907 cm-1 band. For pure glycerol, the aliphatic (C–H) group bands appear at 2931 cm-1 and 2879 cm-1. Hence, the aggregation of glycerol molecules within the PVA matrix might possibly account for this effect [29,30].
The peak at 1655 cm-1 increases with increasing glycerol concentration (see Figure 2b). A similar effect is noticeable from the FTIR spectra for PVA/glycerol films in [12], although the origin of this effect was not discussed in this reference. According to [29] an FTIR band at ~1653 cm-1 appears for commercial glycerol. This band may be assigned to (H−O−H) bending vibrations of water. Hence, the observed increase of the peak at ~ 1653 cm-1 with increasing glycerol content (see Figure 2b) may be indicative of an increase of the amount of water in the film.
The most noticeable change in the glycerol modified PVA films is the appearance of a new peak at 1039 cm−1 (see Figure 2a, c). In the FT-IR spectrum of pure glycerol, five characteristic bands have been observed, located at 800 up to 1150 cm-1 corresponding to vibrations of (C–C) and (C–O) linkages: three broad bands at 850, 925, and 995 cm−1 that have been attributed to the vibration of the skeleton (C–C); a peak at 1045 cm−1 associated to the stretching of the (C–O) linkage in the primary alcohol groups, and a band at 1117 cm−1 that corresponds to the stretching of (C–O) in the secondary alcohol group [30,31,32]. In Figure 2c, a peak at 1045 cm-1 appears for the film with 1% glycerol content (red curve), and increases in intensity while slightly displacing to lower wavelengths up to 1039 cm-1 as the amount of glycerol incorporated into PVA is increased (blue and green curves). Such peak corresponds to (C–O) stretching of the primary alcohol groups of glycerol, and its shifting to lower wavelengths is indicative of increased glycerol-PVA interactions -presumably of the hydrogen bonding type- for higher glycerol contents. For PVA films with 2.0 and 4.4 wt.% glycerol (blue and green curves in Figure 2c, d), the PVA band at 1088 cm-1 shows a clear modification of its shape due to increase in intensity at ~ 1117 cm−1 (corresponding to stretching of (C–O) in the secondary alcohol group of glycerol), and slightly displaces to higher wavelengths (1091 and 1093 cm–1 for 2.0 and 4.4 wt.% glycerol respectively). These results suggest that for 1.0 wt.% glycerol, so far the characteristic peak of glycerol for primary alcohol group appears at 1045 cm-1, as in pure glycerol, it is the secondary alcohol group that preferentially forms hydrogen bonds with the PVA molecules. As the amount of glycerol is increased, additional types of glycerol interactions within the PVA matrix may take place, and the peak corresponding to the primary alcohol group displaces to lower wavelenghts up to 1039 cm-1. For the 2.0 wt.% glycerol films the emergence of a band at ~ 995 cm-1 is also apparent, indicative of the excitation of vibrations of the glycerol (C–C) skeleton. For the film with 4.4 wt.% glycerol, the four glycerol bands are apparent in the covered wavelength range in Figure 2c. In addition to bands at 1039 and 995 cm-1, the intensity of the band at 921 cm-1 increases, and a clear peak at 850 cm-1 appears, while for pure PVA a relatively broad band at 836 cm-1 is observed (Figure 2c).
According to the literature [24,33] the crystallinity of various PVA films can be calculated from the FT-IR data by quantitative correlation between the intensities of the bands corresponding to the crystalline and amorphous phases. The positions of the PVA crystallinity absorption maximum given in the literature vary in the range 1141–1145 cm–1. We have used the value 1141 cm–1 that corresponds to absorption maximum obtained in our experiments to calculate the crystallinity α of our PVA and PVA/glycerol films, and considered the peak at 1088 cm-1 attributed to (C–O) stretching vibration as representative of the amorphous phase, according to the equation [24]:
where A1141 and A1088 are the intensities of the absorption peaks in the crystalline and amorphous phases, respectively.
The detailed procedure for constructing the baseline relative to which the intensities of the peaks A1141 and A1088 are to be measured is described in [24] and it is illustrated in Figure 2d. The baseline must pass through the minima in the absorption spectrum located at the edges of the examined spectral range, as depicted in Figure 2d. The position of the (C–O) band maximum at 1088 cm–1 varied slightly with increasing glycerol concentration, 1091 and 1093 cm–1 for PVA/glycerol 2.0 and 4.4 wt.% respectively (for the sake clarity, we refer to it as the band at 1088 cm–1 in all cases). The crystallinity band maximum is almost at the same position for the different films: 1141 cm-1 for the pure PVA film and 1142 cm-1 for PVA/glycerol 4.4 wt.%.
The crystallinity of the PVA films with different glycerol content calculated by FTIR is shown in table 1. It is apparent that the crystallinity first increases with addition of glycerol and then decreases to a level below that of the pure PVA film. Possibly, a small amount of glycerol, with their secondary alcohol groups linked by hydrogen bonding to the PVA chains may even locally enhance their regular arrangements, resulting in an increase of PVA crystallinity. As the glycerol content increases, more glycerol molecules are available to interact with the PVA or with each other, destabilizing the interactions between the PVA chains and thus reducing the crystallinity.
3.2. XRD Analysis
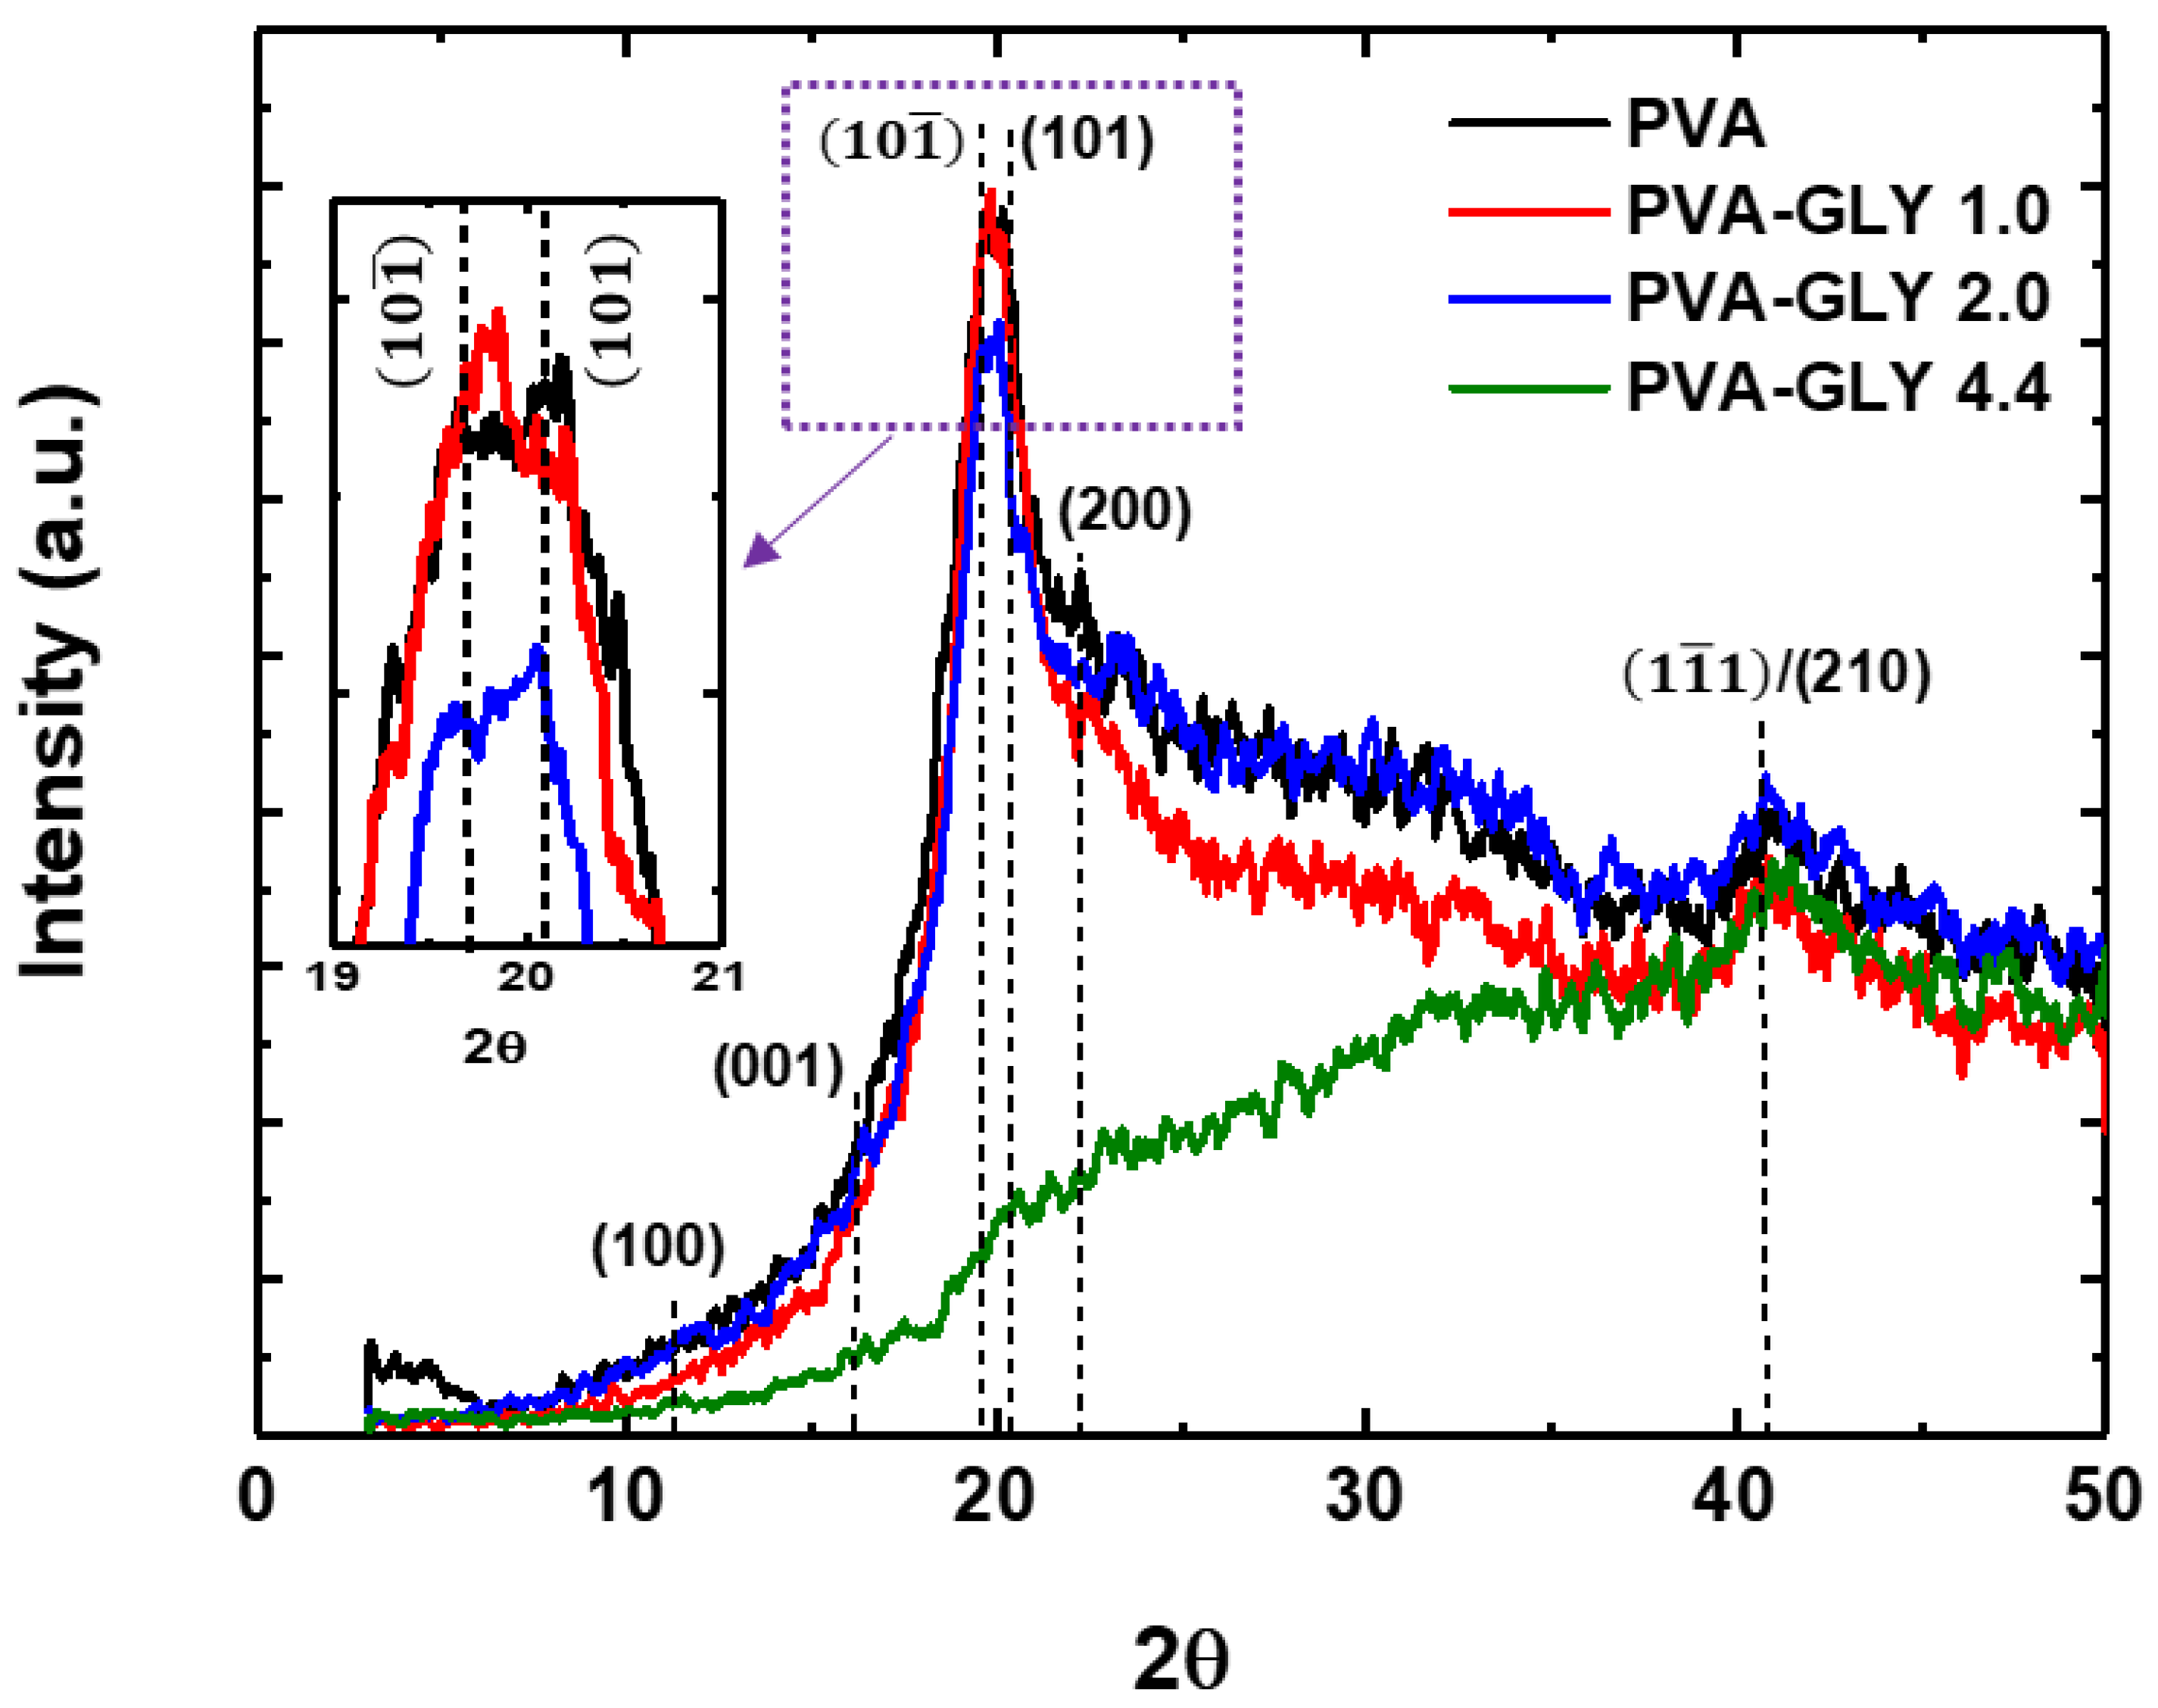
The influence of glycerol on the crystalline structure of PVA films prepared via solution casting was also investigated by means of XRD. According to [34,35], the XRD diffractogram of pure PVA presents characteristic peaks at 2θ ~11.2° (100), 16.1° (001), 19.4° and 20.1° / (101), and 22.5° (200). A crystalline peak at ~ 40-42° related to diffraction from / (210) planes has also been reported [35,36,37].
Figure 3 shows the XRD diffractograms of the pure PVA and PVA/glycerol films with different glycerol content. The expected positions for the (100), (001), / (101) and (200) diffraction peaks are indicated by dashed lines. For the films of pure PVA, and those with 1.0 wt.% and 2.0 wt.% glycerol content a diffraction peak about 2θ = 19.7° is clearly distinguished, as well as a small hump at a ~ 40.7°. The obtained XRD patterns are typical for a semicrystalline polymer, with a broad amorphous halo originating from disordered (noncrystalline) regions. From Figure 3 it can be seen that, as a result of the addition of 1.0 wt.% glycerol (red curve in the Fig), the diffuse scattering associated with the amorphous phase is reduced, which may be due to a structural rearrangement of the polymer chains. According to the FTIR data, the crystallinity of this film experiences a slight increase (see table 1). For a glycerol concentration of 2.0 wt.% (blue curve), the XRD diffractogram shows a contribution of the amorphous phase similar to that of the pure PVA film, although the intensity of the peak at 2θ = 19.7° is lower. For films with 4.4 wt.% glycerol (red curve), this peak does not appear in the diffractogram. The small peak at 22.5° decreases for films with glycerol compared to pure PVA. Interestingly, the peak at 2θ = 40.7° does not change substantially for the different samples studied.
It is worth noticing that for the diffraction peak at 2θ = 19.7° in Figure 3, apparently, the ratio between the intensities corresponding to the difraction of / (101) planes changes with addition of glycerol (see the inset in Figure 3). For the film with 1.0 wt.% glycerol the diffraction from planes slightly increases compared to that of the pure PVA films. A similar effect was reported in [34] [37] for pure PVA films with different water content. The incorporation of water molecules in the PVA matrix induced an increase in the diffraction signal of the planes compared to that of the (101) planes. As this could be an effect of water plasticisation, it is understandable that the incorporation of a small amount of glycerol also induces a similar effect. Besides, the incorporation of glycerol is expected to increase the water content in the PVA film. As more glycerol is incorporated into the film (2.0 wt%), the effect is reversed. The ratio of the / (101) signals and the shape of the amorphous halo in the difractogram of the PVA/glycerol 2.0 wt.% film become similar to those of the pure PVA film.
Figure 3.
XRD patterns of pure PVA and PVA/glycerol films with different glycerol content: 1.0, 2.0, 4.4 wt.%. The inset displays an enlarged region of the peak at approximately 20°. The inset displays an enlarged region of the peak at ~20°.
Figure 3.
XRD patterns of pure PVA and PVA/glycerol films with different glycerol content: 1.0, 2.0, 4.4 wt.%. The inset displays an enlarged region of the peak at approximately 20°. The inset displays an enlarged region of the peak at ~20°.
The crystallinity of the PVA films can be calculated from the XRD data using following formula [36]:
where Ac and Aa are the areas of the crystalline and amorphous phases respectively. The diffraction scattering peaks in Figure 3 were deconvoluted into fundamental Gaussian curves and the degree of crystallinity was calculated using this formula. The results obtained for the different films are indicated in Table 1. As it is noticeable from Table 1, the results derived from analysis of the XRD data support those obtained from the FTIR spectra.
In order to further study the relation between XRD pattern and the crystallite size the well-known Debye-Scherrer formula was used:
where D is the mean crystallite size, λ is the X-ray wavelength, β is the full width at half maximum (FWHM) of the peak, K is Scherrer constant with a value of about 0.9, θ is the diffraction angle corresponding to the maximum intensity peak in XRD pattern. The values for D estimated from the peak at 2θ = 19.7° are displayed in Table 1.
D=Kλ /βcosθ
From Table 1, it is also observed that both degree of crystallinity and the crystallite size are slightly higher for the film of PVA with 1.0 wt.% glycerol than for this of pure PVA., For 2.0 wt.% glycerol, the degree of crystallinity is smaller, even though the size of the existing crystals does not experience significant modifications. For 4.4 wt.% the 19.7º diffration peak cannot be resolved from the XRD spectrum, even though the peak at 40.7º is consistent with the prevalence of a similar ordering along this direction.
A decrease in crystallinity as a result of the addition of glycerol in PVA and PVA/starch films has been previously reported [38]. Also, an increase of crystallinity in PVA for low glycerol concentrations was observed by XRD [39].
The effect of glycerol on PVA crystallinity may be explained in terms of its influence on the interactions between the PVA chains. A little amount of pasticizer may increase the ability of the molecular chains to adopt different conformations and promote their ordering [40]. In order to prepare the PVA/glycerol films, we first prepare a 7.0 wt.% PVA stock solution by dissolving the purchased PVA granules in distilled water at 90°C, and then cooling to room temperature (see section 2.1). Crystalline PVA nuclei are expected to form at this stage. Subsequently, distilled water and glycerol are added in different concentrations to prepare the final solutions which are poured into Petry dishes and dried at room temperature. Increasing the amount of water may facilitate the ordering and assembly of existing PVA nuclei, and the presence of a small amount of glycerol in the solution may play a similar role. If glycerol is incorporated in higher quantities, glycerol aggregates may form, the glycerol molecules may selectively interact with the PVA molecular chains at the crystalline interface, and even penetrate even penetrate into the crystals, disrupting the molecular order [7,17].
3.3. TGA/DTA
Thermogravimetric analysis was performed to determine the degradation stages, moisture content, and thermal stability of the pure PVA and PVA/glycerol films. Figure 4 shows the thermogravimetric curves (mass loss versus temperature) (TG), their derivatives (DTG) and DTA curves for the PVA and PVA/glycerol films. Thermal analysis was carried out in static air atmosphere at 5°C/min heating rate (Figure 4 a-d), and then repeated for films containing (0 – 2.0 wt.%) glycerol at higher heating rate – 25°C/min (Figure 4e-g). The DTA curves of the various samples studied are also depicted in Figure 5 (a)-(d), which additionally includes a curve for pure PVA recorded in argon atmosphere at 5ºC/min (Figure 5(a)), and where areas of special interest have been enlarged (Figure 5b,d).
In Figure 4, each peak of the DTG curves represents a separate event, and corresponds to the maximum rate of mass loss (TG curve) [41]. The different DTG peaks have been labeled in Figure 4 by a capital T with subscripts in capital Roman numerals. As it is apparent from Figure 4a-e, the thermal transformations of the pure PVA film occur in 4 main stages (highlighted in different colors in Figure 4a-e), each associated with a DTG peak event [42,43]. The first stage of mass loss is related to the loss of physically absorbed water. The second stage refers to the partial dehydration of PVA which is accompanied by polyene formation. The third stage is related to polyene decomposition to form macroradicals, acetaldehyde, benzaldehyde, acrolein, and polyconjugated aromatic structures as a result of intramolecular cyclization and condensation. The fourth stage consists in the thermo-oxidation of carbonized residues [42,43].
Figure 4.
TG, DTG and DTA curves of PVA (a, e) and PVA/glycerol films with 1.0 wt.% (b, f), 2.0 wt.% (c, g), 4.4 wt.% (d) glycerol measured at 5 ºC/min heating rate (a-d) and 25 ºC/min heating rate (e-f).
Figure 4.
TG, DTG and DTA curves of PVA (a, e) and PVA/glycerol films with 1.0 wt.% (b, f), 2.0 wt.% (c, g), 4.4 wt.% (d) glycerol measured at 5 ºC/min heating rate (a-d) and 25 ºC/min heating rate (e-f).
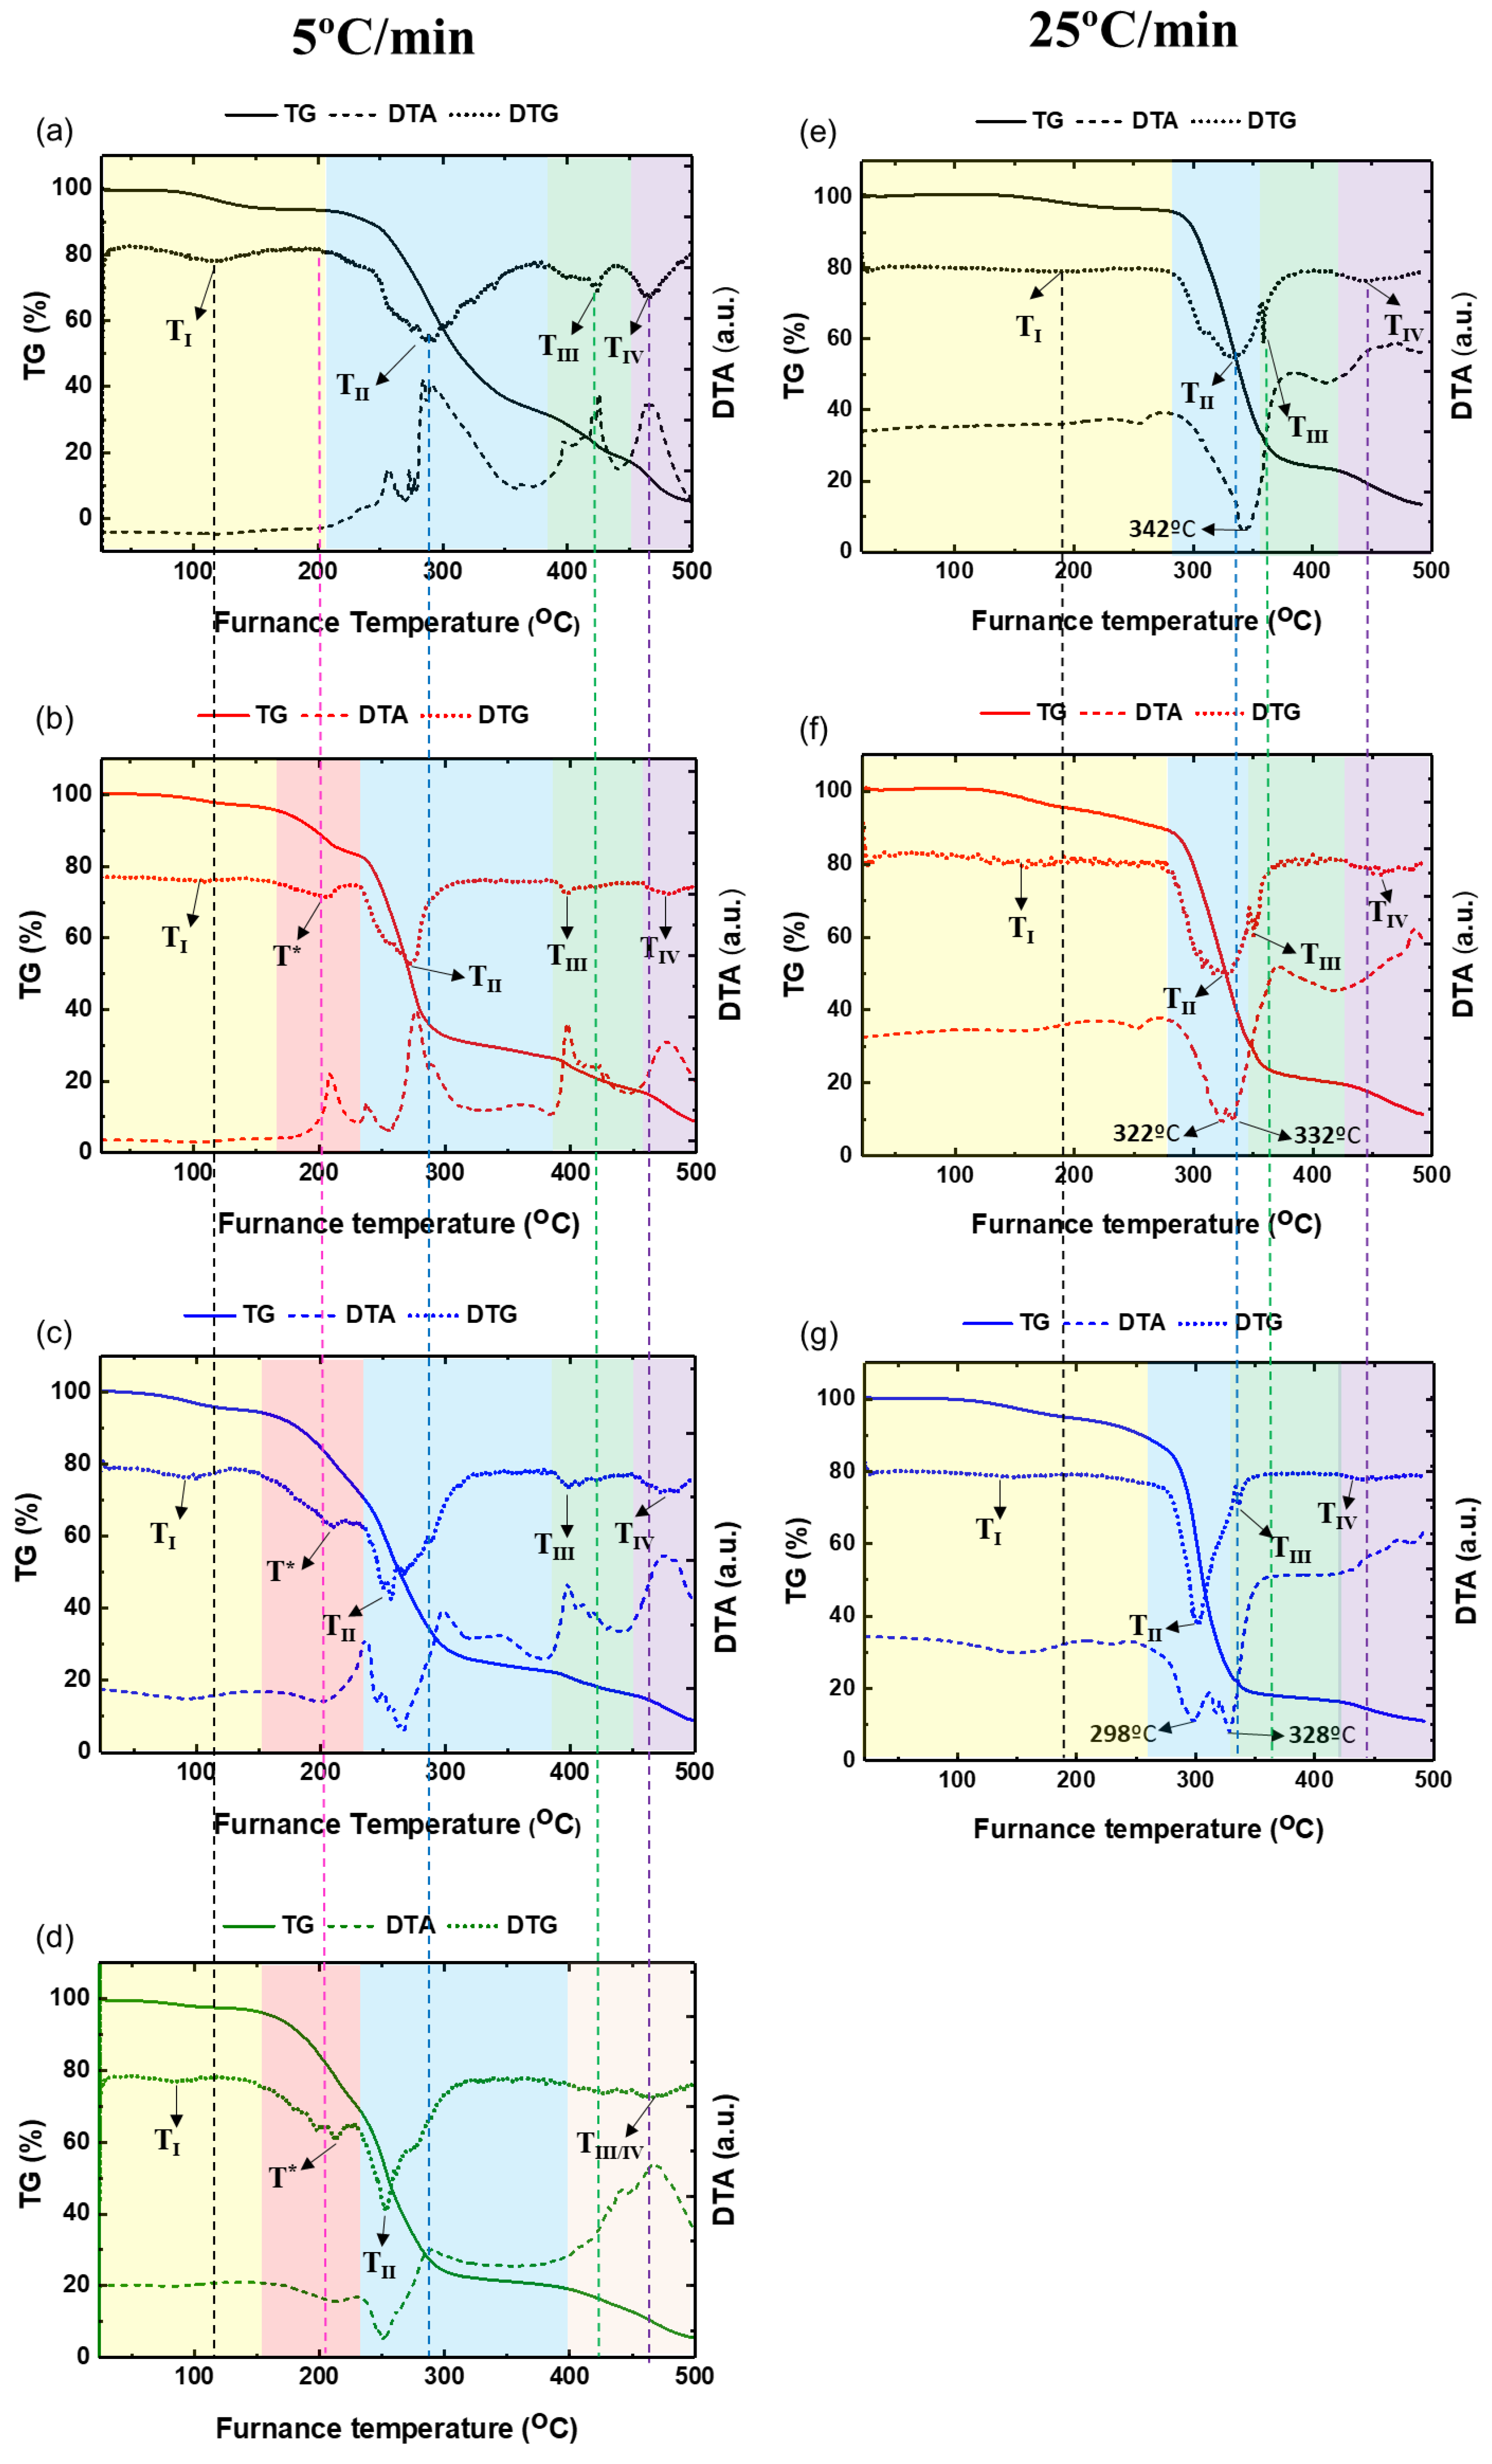
Figure 5.
DTA curves of PVA and PVA/glycerol films with 1.0 wt.%, 2.0 wt.%, 4.4 wt.% glycerol. (a), (b) – heating rate 5 ºC/min; (c), (d) – heating rate 25 ºC/min. (b) and (d) – enlarged images of the corresponding regions in (a) and (c) respectively.
Figure 5.
DTA curves of PVA and PVA/glycerol films with 1.0 wt.%, 2.0 wt.%, 4.4 wt.% glycerol. (a), (b) – heating rate 5 ºC/min; (c), (d) – heating rate 25 ºC/min. (b) and (d) – enlarged images of the corresponding regions in (a) and (c) respectively.
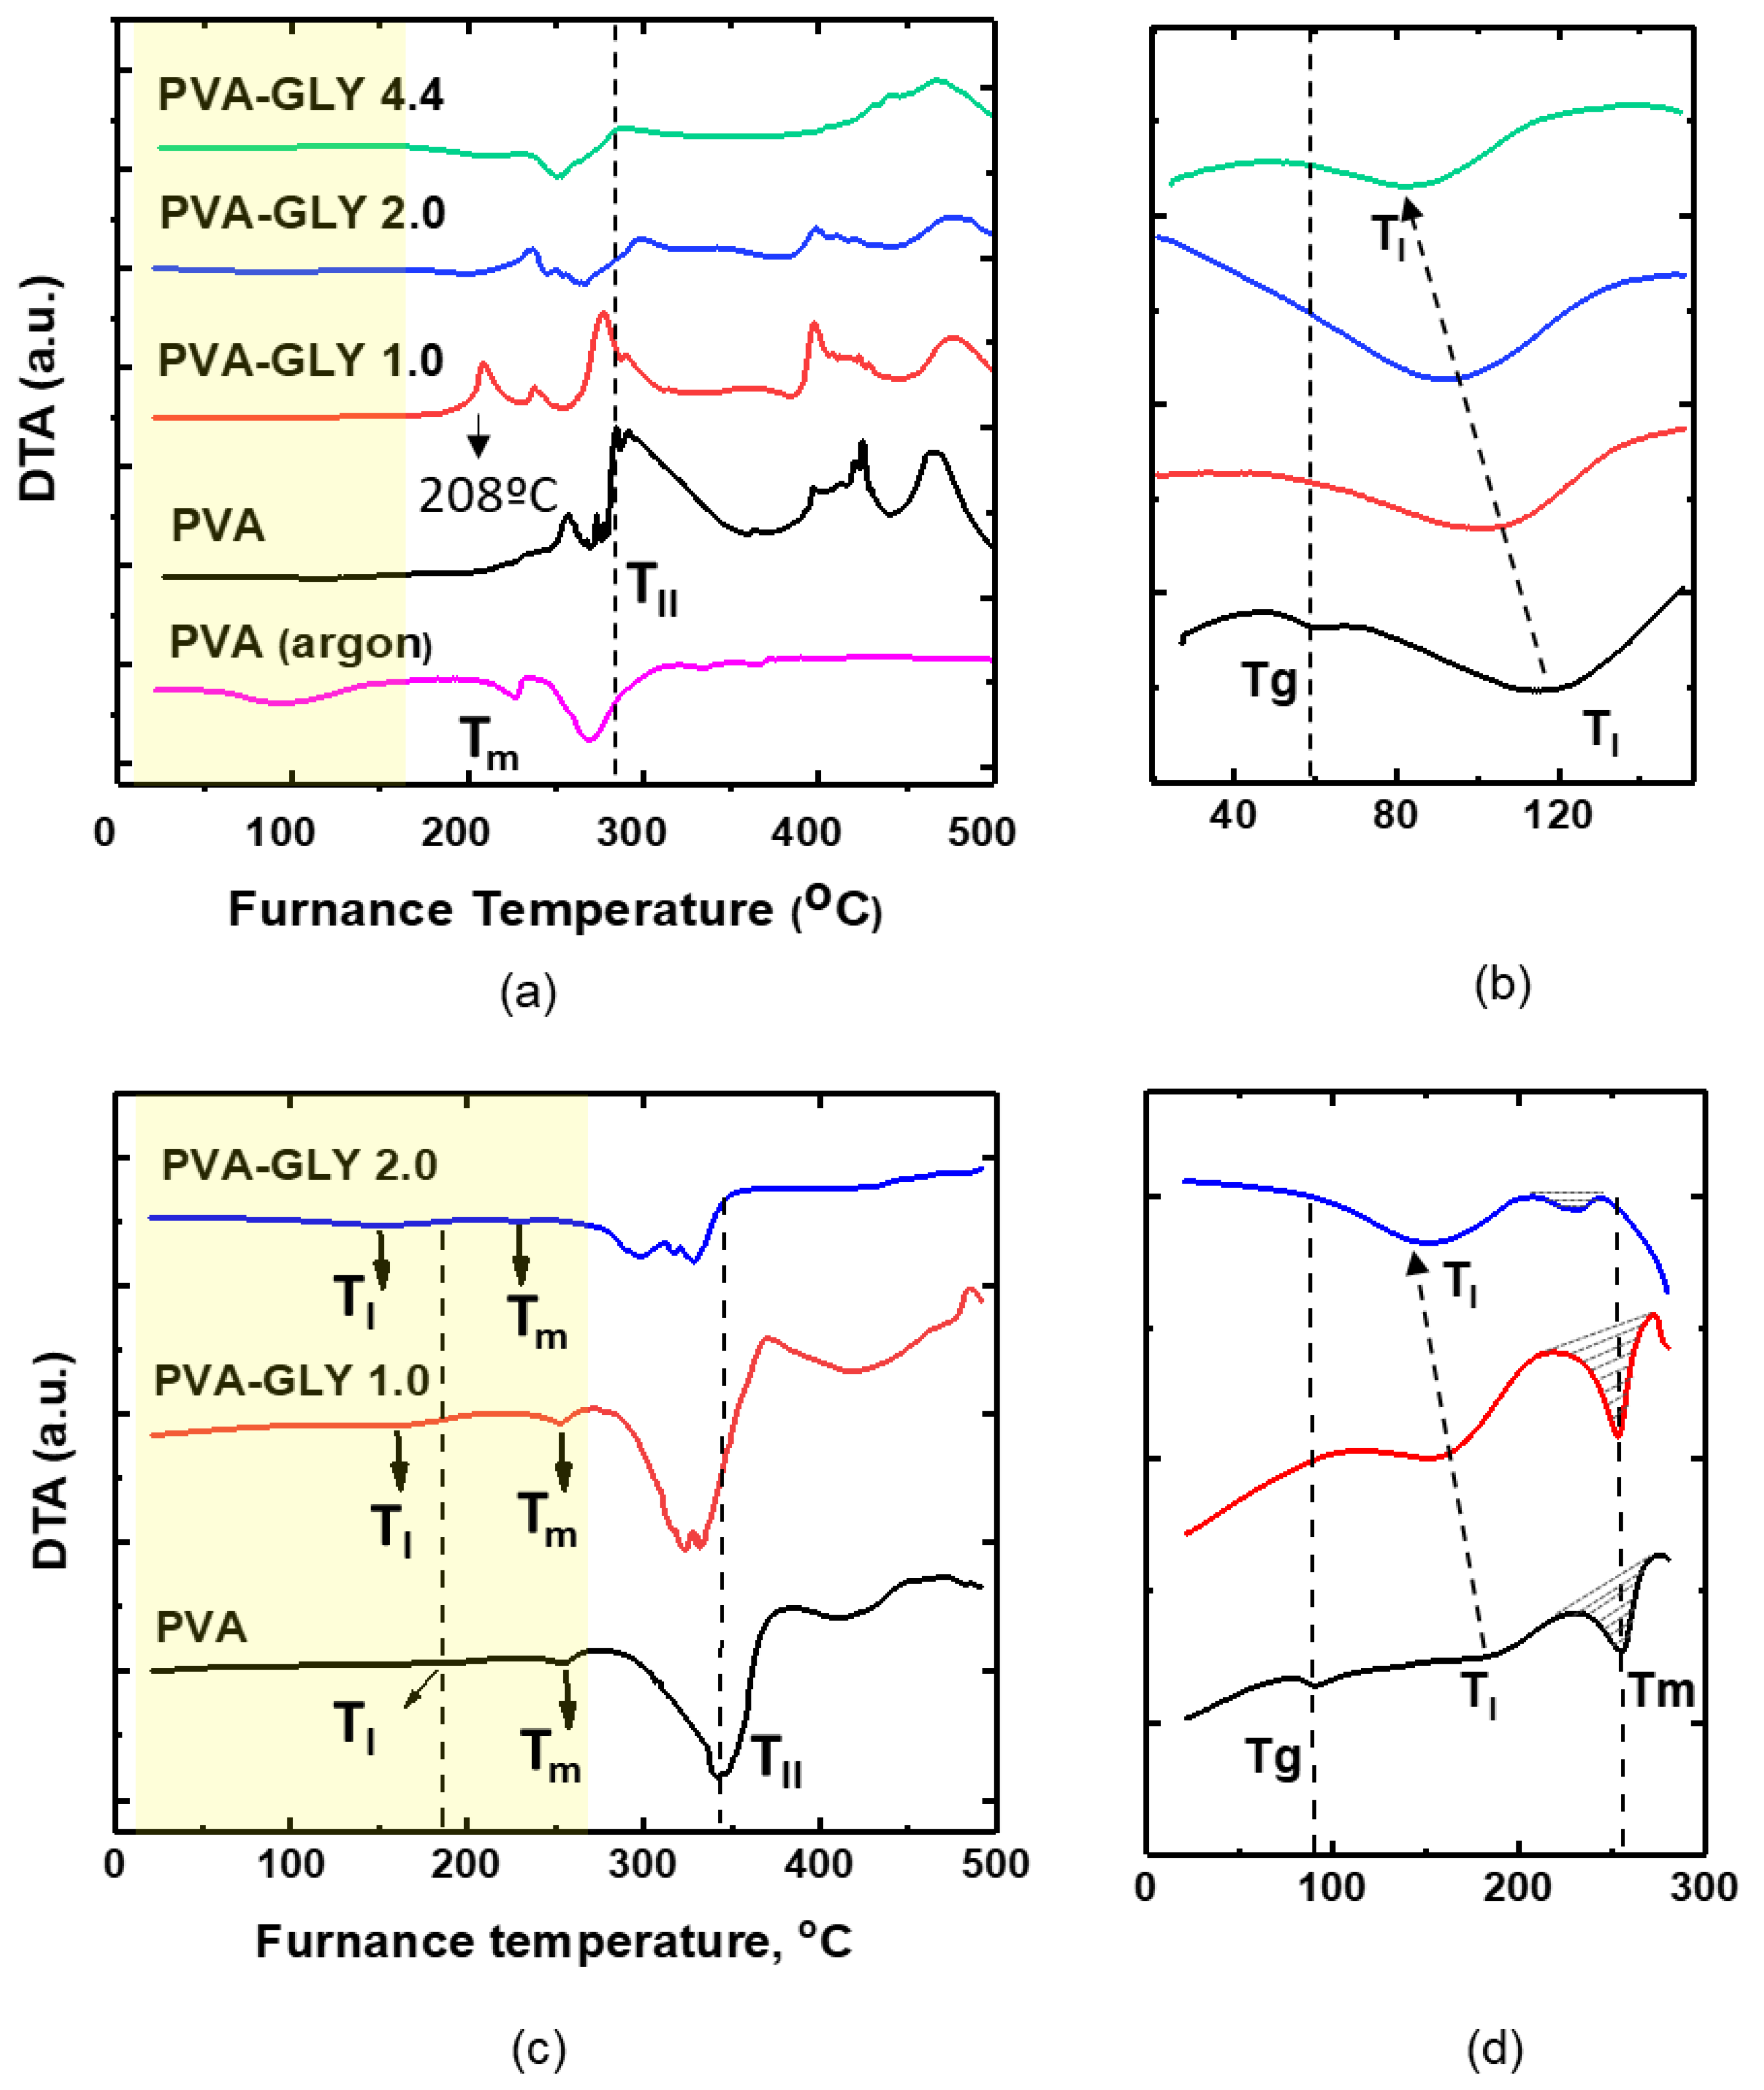
Table 2 and Table 3 list the weight loss percentage and temperatures of the DTG peaks for the different stages, as derived from Figure 4 for each sample. A glance at Figure 4 and a comparison of the data in Table 2 and Table 3 evidences that these parameters are dependent on the heating rate [44]. The DTG peaks for the 1st and 2nd stages are shifted to higher temperatures for the higher heating rate.
Considering the trend for the various samples in Figure 4, the temperatures of the DTG peaks shift to lower temperatures when the glycerol concentration increases, indicating that the increase of glycerol decreases the thermal stability of the PVA/glycerol films

Table 2.
Weight loss and temperatures corresponding to maximum rate of weight loss at each stage (determined at Figure 4a-d) for heating rate 5 °C/min.
Table 2.
Weight loss and temperatures corresponding to maximum rate of weight loss at each stage (determined at Figure 4a-d) for heating rate 5 °C/min.
| Sample | Degradation Step | Weight Loss, % | TDTG peak, °C |
|---|---|---|---|
| PVA | I II III IV |
5.2 60.0 16.1 10.3 |
118 277 406 476 |
| PVA-GLY 1.0 | I * II III IV |
3.1 13.6 56.9 9.5 8.9 |
105 207 272 397 478 |
| PVA-GLY 2.0 | I * II III IV |
4.3 21.4 50.9 6.8 7.6 |
96 209 256 398 480 |
| PVA-GLY 4.4 | I * II III/IV |
2.6 29.3 47.4 15.6 |
84 212 254 467 |
Table 3.
Weight loss and temperatures corresponding to maximum rate of weight loss at each stage (determined at Figure 4e-g) for heating rate 25 °C/min.
Table 3.
Weight loss and temperatures corresponding to maximum rate of weight loss at each stage (determined at Figure 4e-g) for heating rate 25 °C/min.
| Sample | Degradation Step | Weight Loss, % | TDTG peak, °C |
|---|---|---|---|
| PVA | I II III IV |
3.6 63.1 7.8 12.1 |
186 332 358 446 |
| PVA-GLY 1.0 | I II III IV |
8.6 60.9 10.4 8.8 |
159 326 350 457 |
| PVA-GLY 2.0 | I II III IV |
10.9 66.6 5.7 6.1 |
148 301 337 440 |
Regarding the first degradation stage (highlighted in yellow in Figure 4), it is characterized by a weight loss of about 2.6 – 11 % (Table 2, Table 3) presumably related to the removal of adsorbed water. TI corresponds to an endothermic minimum in the DTA curves, and its position shifts to lower temperatures when increasing the glycerol concentration (Figure 4b-d, f-g), Table 2, Table 3, Figure 5b-d).
For the heating rate of 5 °C/min, the pure PVA film experienced a slightly higher weight loss than the plasticised films. This can be explained by the lower amount of free/loosely absorbed water in the films in the presence of glycerol. A similar result was observed in [45] for glycerol-containing starch biopolymer films studied at a heating rate of 10 °C/min.
For the heating rate of 25 °C/min, the first stage is extended up to 280 °С, already above the degradation temperature of glycerol, which corresponds to 194-246 °С at a heating rate of 10 °C/min [46]. Interestingly, now, a higher weight loss is observed for the PVA/glycerol films compared to the pure PVA film in the first stage. We attribute this effect to the weight loss of the PVA/glycerol films here being not solely due to water loss but also due to the degradation (or initial degradation) of glycerol. As per the studies in [45,46,47,48], the weight loss observed in the temperature range of 125 – 290 °C for glycerol plasticized polymer films can be attributed to the degradation of glycerol and the loss of chemisorbed water.
Remarkably, for the PVA/glycerol films, an additional thermal process corresponding to the DTG peak labeled T* can be distinguished when heating in the range of 207-214 °С at the rate of 5 °C/min (Figure 4b-d, Table 2) (regions highlighted in rose in Figure 4b-d). This peak does not appear in the DTG curves of the pure PVA films, and shifts to higher temperatures, and is related to a higher mass loss, as the glycerol content is increased. According to [46], the thermal degradation of pure glycerol in air is characterized by a single event that takes place at 194-246 °С for a heating rate of 10 °C/min. Therefore, we relate the T* peak taking place at 207-214 °С on DTG curves of the PVA/glycerol films to the degradation of glycerol (or PVA-glycerol complexes) in the PVA matrix.
The second degradation stage for the pure PVA film (highlighed in blue in Figure 4a) is characterized by the highest weight loss. It is noticeable from Figure 4 that for the PVA/glycerol films TII shifts to lower temperatures as the glycerol concentration is increased.
For the heating rate of 5 °C/min, TII corresponds to an exothermic maximum at aproximately the same temperature in the DTA curves of the pure PVA and 1.0 wt.% glycerol films, and turns into an endothermic minima with further increase of glycerol (Figure 4c-d) (Figure 5a). We will refer to these results in more detail below, when discussing all the data displayed in Figure 5.
For the heating rate of 25 °C/min, TII corresponds to endothermic minima for the pure PVA and PVA/glycerol films (Figure 4e, Figure 5c). For glycerol containing films this peak splits into two peaks which become more distinct for 2.0 wt.% glycerol (298 °С and 328 °С, Figure 4f-g, Figure 5c). This may be related to the degradation of a glycerol-based phase in the PVA matrix, possibly consisting of glycerol-PVA complexes, which degrades at a different temperature than pure PVA in this degradation stage.
The third and fourth degradation stages for the pure PVAfilm (highlighted in green and purple respectively) are characterized by 7.8-16.1% and 10.3-12.1% weight loss respectively. For the heating rate of 5 °C/min the weight loss on the third stage is higher than on the fourth, while for the heating rate of 25 °C/min the dependence is inverse (Table 2, Table 3). PVA/glycerol films are characterized by lower weight loss on these stages in comparison with pure PVA, mainly because of higher weight losses on previous stages. The positions of DTG peaks are slightly displaced to lower temperatures or of the same order as for pure PVA films (Figure 5, Table 2, Table 3). For the film with 4.4 wt.% glycerol instead of two peaks, only one was observed in this temperature range, that may be caused by change in degradation of PVA in presence of high amount of glycerol.
Focusing now our attention in Figure 5, on DTA curves for pure PVA (Figure 5, black curves) a minimum at 56.5 °С can be observed for 5 °C/min heating rate (Figure 5b), which appears at 90 °С for 25 °C/min heating rate (Figure 5d), and is not accompanied by mass losses or changes in the DTG curves in either case. We attribute this peak, labelled Tg in Figure 5b, to the PVA glass transition temperature, [49,50] which could not be observed in the DTA curves of the PVA/glycerol films, perhaps because of being displaced to temperatures lower than the studied range for both considered heating rates.
At temperatures of about 254.8 – 231 °С, endothermic peaks can be observed on the DTA curves of the pure PVA and PVA/glycerol films recorded at 25 °С/min heating rate (Figure 5d), which can be related to the melting point of the pure PVA and PVA/glycerol films, labelled Tm in Figure 5d [12,51,52]. This peak shifts to lower temperatures as the glycerol content in the film is increased to 2.0 wt.% [49,51]. Interestingly, in our case, the incorporation of a glycerol content of 1.0 wt.% did not lead to a significant reduction of the PVA melting point. The area under the curve corresponding to the melting peak (Figure 5d) increases slightly (by ~1.6 times) for 1.0 wt.% of glycerol and decreases (by ~3.5 times) for 2.0 wt.%, which provides further evidence of the decrease in crystallinity in the latter sample.
As mentioned above when discussing the events taking place in the pure PVA sample during the second degradation stage, for the heating rate of 5 °C/min, TII correlated with a broad exothermic peak in the DTA curves at about 300 °C, which complicates the determination of the melting point (see Fig 4(a) and 5(a)). To the best of our knowledge, this exothermic peak for pure PVA has not been previously reported in the literature. The peak also appears for the film with 1.0 wt.% glycerol, but disappears for higher glycerol concentration (2.0 and 4.4 wt.%). To find clues about the origin of this thermal event we carried out thermal degradation measurements at the same heating rate of 5 °С/min but in an argon atmosphere (Figure 5a, pink curve). As noticeable from Figure 5a, the exothermic peaks were absent from the resulting DTA curve, being it similar to the curve obtained at the higher heating rate under an air atmosphere; both the melting peak at 227 °С and the degradation peak at 270 °С could now be observed. Hence, we attribute the exothermic peak at ~300 °С observed for pure PVA and PVA/glycerol 1.0 wt.% in the DTA curves obtained at a heating rate of 5 °C/min to a process related to PVA oxidation. Considering that the effect is mostly in the films in which the PVA crystallinity percentage is significant, it might also be related to the presence of PVA crystals in the film, e.g. preferential oxidation at the amorphous/crystalline interface. The new exothermic peak appearing on the DTA curve for PVA/glycerol 1.0 wt.% at ~208 °С (red curve in Figure 5a) may be due to PVA crystallization. The disappearance of the exothermic peak at ~300º C for higher glycerol contents may be related to the increase of mobility of PVA chains and an increased rate of degradation compared to oxidation. At higher heating rate, the absence of exothermic peaks can be explained by lower rate of oxidation compared to thermal decomposition.
Eventually, it is worth noting that , the thermal stability of PVA in the presence of glycerol decreases. The reduction of the melting temperature for higher glycerol content and changes in the area under the melting peak (increase for 1.0 wt.% and decrease for 2.0 wt.% glycerol, Figure 5d) indicate that the ordered association of the PVA molecules decreases at higher amounts of glycerol. It can be interpreted that glycerol increases the mobility of PVA chains and reduces the crystallinity. These results are in agreement with results of FTIR and XRD studies.
3.4. Scanning Probe Microscopy
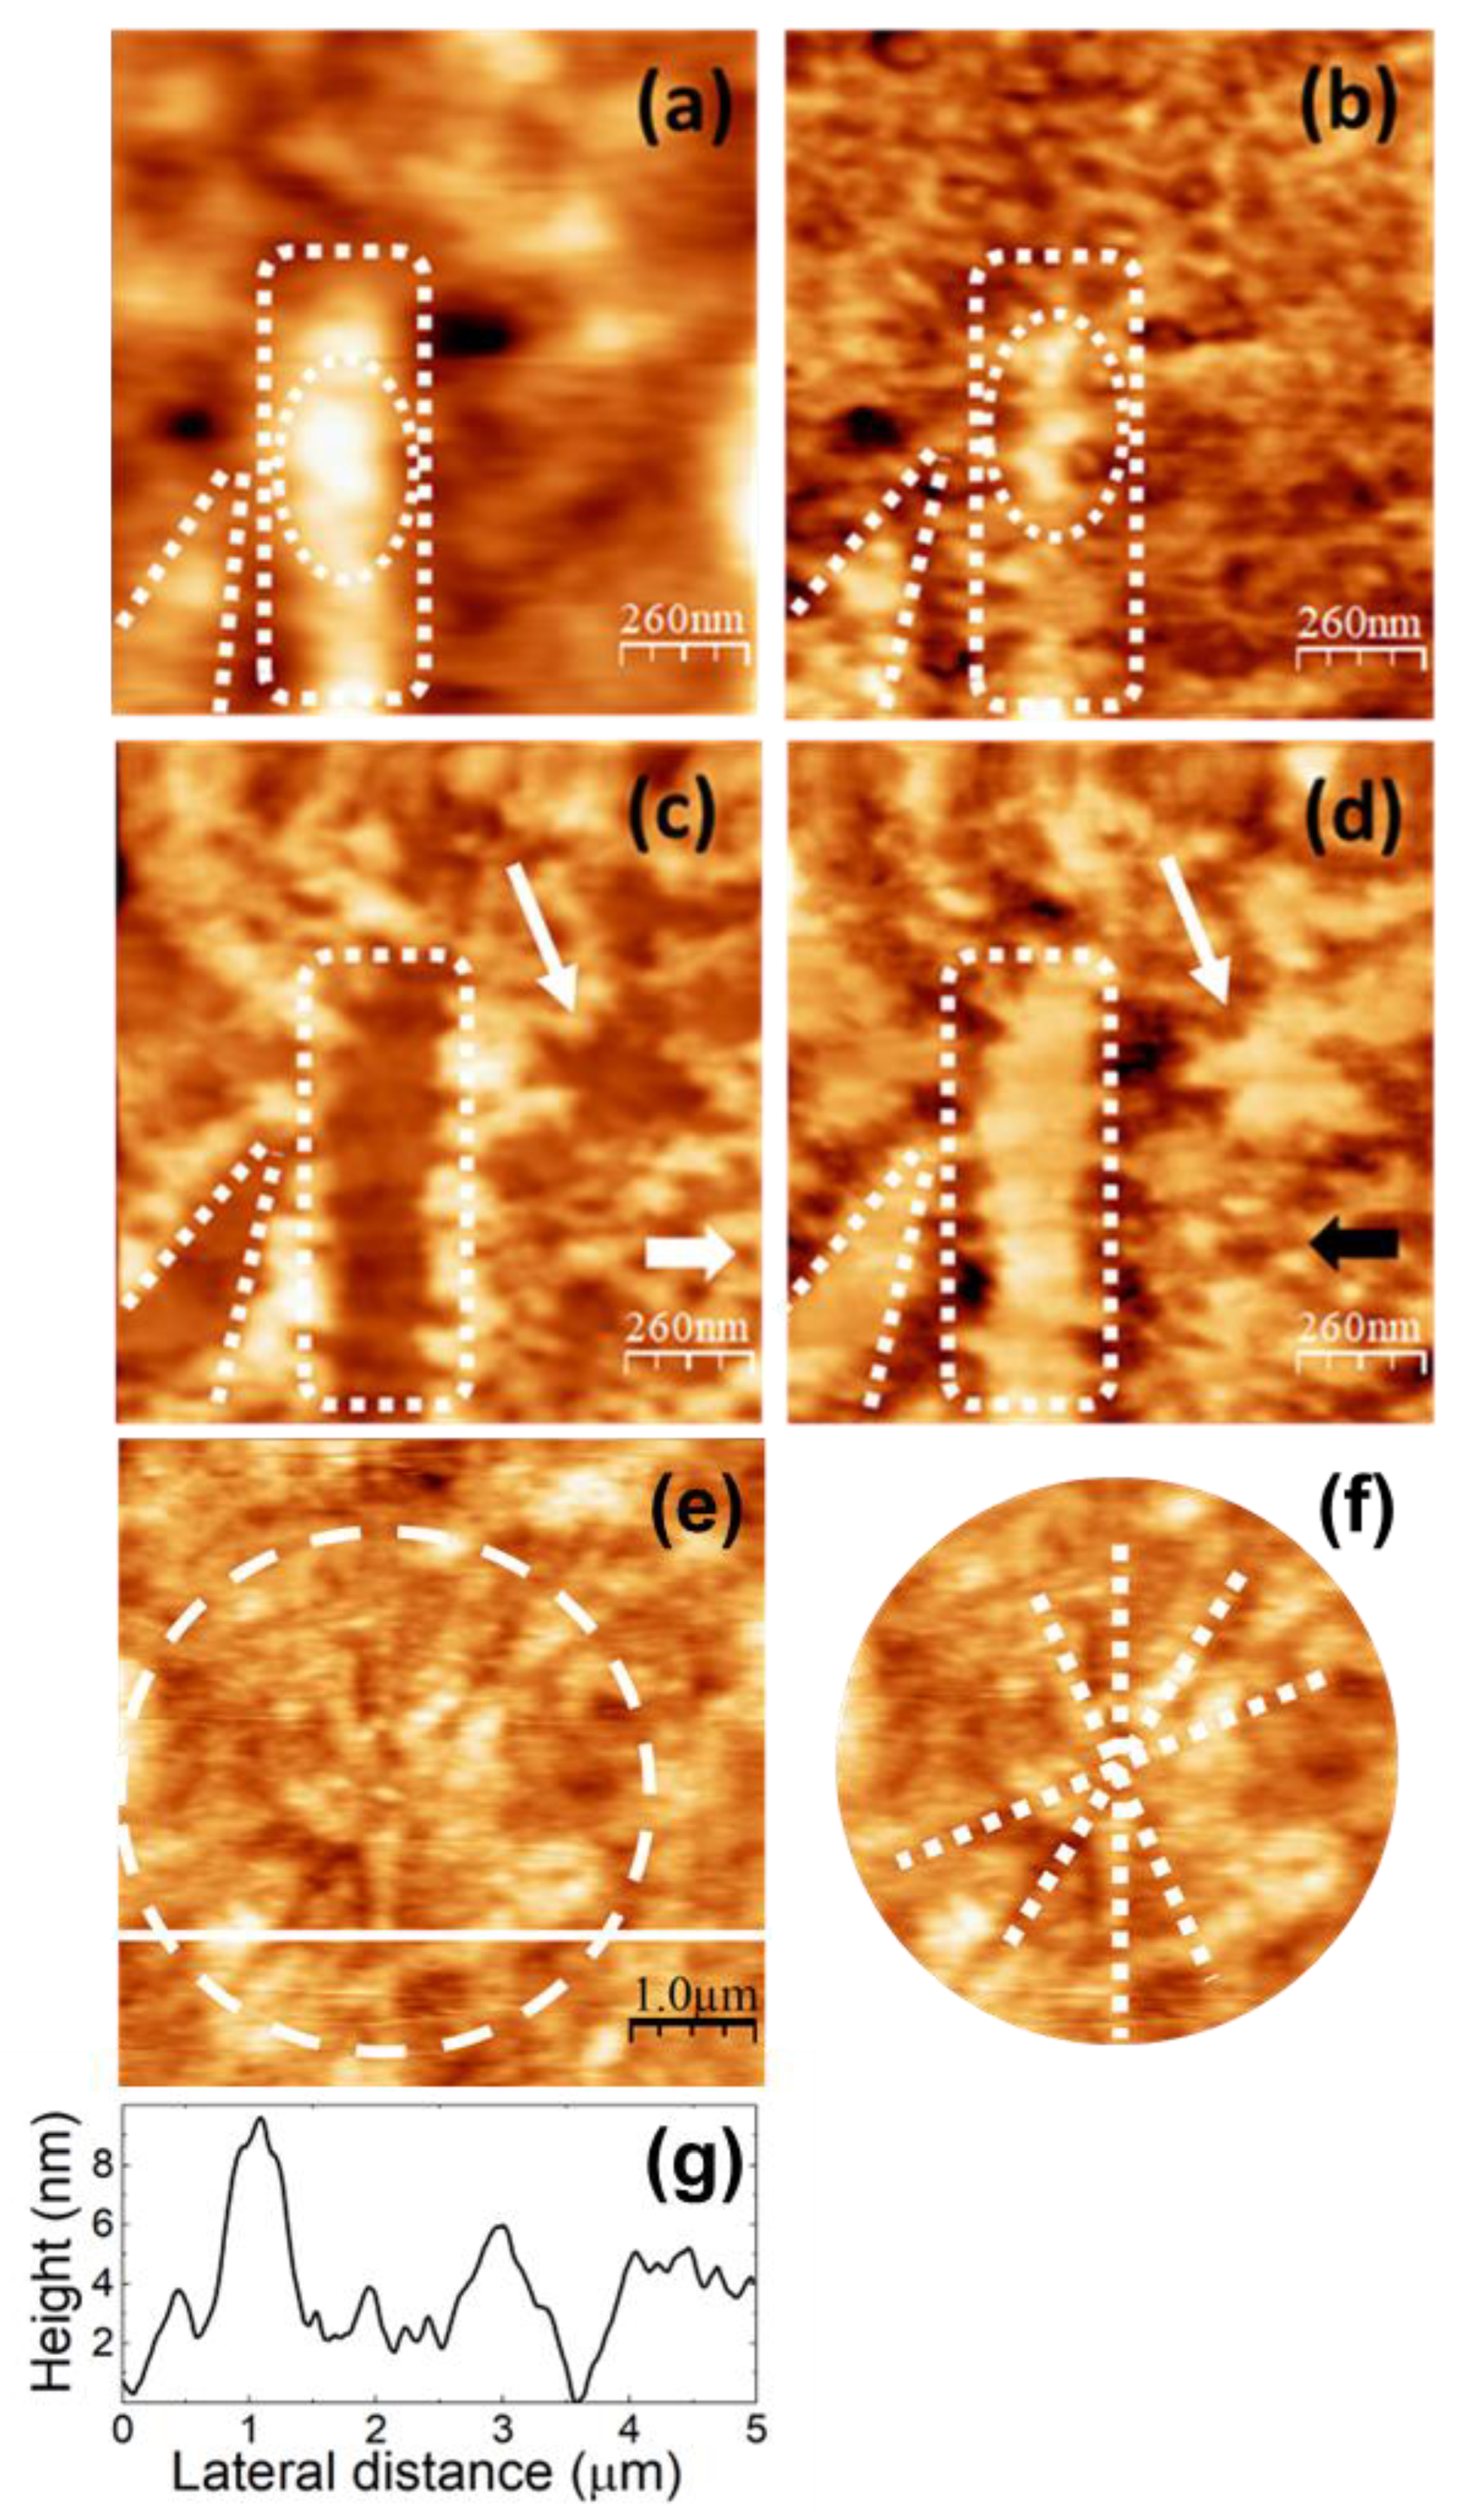
SPM images of the pure PVA films are displayed in Figure 6. The topography (Figure 6a) is characterized by clusters aggregates, some of which appear aligned along a well-defined direction, like those enclosed within the white dashed lines in Figure 6a. In UFM (Figure 6b), the contrast originates from nanoscale differences in sample stiffness and adhesive properties [53]. As it is apparent from Figure 6a,b, in the UFM image the shape of the clusters that form the topographic aggregates is much better resolved. A close look into the area outlined by the white dashed ellipse in Figure 6b reveals presence of clusters ~45 nm in diameter which yield a higher (stiffer) UFM contrast, forming a zig-zag chain. In the topographic image (Figure 6a), the cluster size appears to be ~80-100 nm, which may be due to UFM detecting the stiffer zones within the individual clusters. Most of the clusters within the white dashed lines Figure 6b exhibit a stiffer contrast. In LFM (Figure 6c,d), aggregates within those dashed lines are imaged with a lower frictional contrast. Notice that in Figure 6c,d other areas, like for instance this pointed by the white slanted arrows, give rise to a similar lower frictional contrast, which now do not directly correlate with any particular features of the topographic and/or the UFM contrast.
We conjecture that the observed alignment of PVA clusters along well-defined orientations originates from a correlated growth or assembly of PVA crystallites within the amorphous PVA matrix. Semicrystalline polymers typically crystallize into lamellar structures, where molecular chains fold into layers. Spherulitic crystal growth begins with a primary nucleus at the center, from which radial fibrils consisting of individual lamellar structures separated by amorphous material radiate outwards [54]. The stiffer contrast observed in UFM for the aligned clusters is consistent with crystalline order leading to a locally higher density in those regions. Previous studies of crystallite nucleation in PVA films with sodium montmorillonite fillers by AFM techniques support this interpretation [55]. The crystalline areas of polymer films are expected to yield a lower friction contrast, as in the case of the aligned clusters in Figure 6c,d [55]. A higher amount of water is actually expected at the PVA amorphous/crystalline interface regions [56], which may act as a lubricant, reducing friction. The areas with a similar lower frictional contrast in Figure 6c,d not correlated to specific features in the topographic or UFM image (e.g. area pointed by the white slanted arrow) may be due to an inhomogeneous distribution of water at the surface or near surface area of the polymer films.
Figure 6d shows a larger topographic image of the PVA surface. Intersecting rows of PVA cluster aggregates are noticeable in this image. At the area within the white dashed circle in the image, some of the rows appear to stem from a primary nucleus at the center. In Figure 6c white dotted straight lines have been drawn following the paths of some of the intersecting aligned-aggregates rows in this region to facilitate their visualization. Figure 6f corresponds to a height contour profile along the white continous line, showing that the surface features are maintained at about 8 nm in height. The observed radial structures in the surface morphology strongly suggest incipient dendritic or spherulitic crystal growth.
Figure 6.
SPM images recorded on pure PVA. (a) Contact-mode AFM topography. Color-scale range: 8 nm. (b) UFM image recorded simultaneously with (a). (b) (c) LFM images recorded over the same surface region than (a) scanning from left to right (b) and from right to left (c). (e) Contact-mode topographic image. Color-scale range: 16 nm. (f) Region enclosed by the dashed white circle in (e). (g) Height-contour profile over the continuous white line in (e).
On other surface areas of the pure PVA films, such as this in Figure 7, the surface topography (Figure 7a,e) exhibits higher terraces consisting of straight ribbons ~ 40 nm wide, presumably formed by aligned clusters, similar to the “ribbons” enclosed within the white dashed lines in Figure 6a. Figure 7a,e strongly resembles the images reported in [55,57,58], from which we confidently infer that the ribbon-like regions correspond to PVA crystallites. According to [57,58], the longer sides of the parallelogrammic platelets in Figure 7a should correspond to (101) planes and the shorter sides to (100) planes, being the acute angle measured from Figure 7a indeed consistent with the reported value of 55°.
Figure 7c,d correspond to LFM images recorded over the same surface area than Fig7a scanning from left to right (Figure 7c) and from right to left (Figure 7d). LFM (Figure 7c,d) indicates that the ribbon-like areas yield lower frictional contrast, as expected for crystalline regions [55]. Figure 7e,f correspond to contact-mode topography and UFM images simultaneously recorded over a region similar to that of Figure 7a-c. The topography in Figure 7e shows higher ribbon-like features similar to those in Figure 7a. Nevertheless, in contrast with the results in Figure 6a,b, UFM now yields a lower (softer) contrast at the ribbon areas, and individual PVA clusters cannot be resolved.
The topographical differences between the PVA surfaces in Figure 6 and Figure 7 might be explained by a slightly different water content in the two regions. According to the XRD data, the size of the PVA crystallites is expected to be of ~5 nm. Hence, in the clusters observed in Figure 6a,b, several small crystalline nuclei might coexist. In view of our results, we understand the evolution of the observed surface PVA crystalline structures resulting from the assembly of those crystalline nuclei. A reorganization of the surface clusters to facilitate their assembly would be favored by the presence of water. Hence, the formation of better defined ribbon-like structures, presumably related to PVA crystalline domains, in the regions where Figure 7 was recorded, can be explained if the local content of water in this region is slightly higher. In PVA solutions, water may be bonded to the PVA molecular chains through hydrogen bonds at hydroxyl sites (bound water) or remain as free water within the polymer matrix [59]. As PVA crystallization evolves, it is expected that bound water remains at the amorphous/crystalline interface. This may exert a plasticizing effect and lead to a softer (lower) UFM contrast at the PVA crystalline ribbons, as well as hinder the identification of individual PVA clusters at those sites.
Figure 7b depicts a height-contour profile along the line in Figure 7a, which is consistent with a multilayer structure of the surface topography with steps of ~ 2 nm defining the different height levels. In both Figure 6a,d and Figure 7a,e pores are apparent. These pores, with a diameter similar to the width of the ribbons, might result from the reorganization of surface clusters during the assembly of the ribbon-like structures.
Figure 7.
SPM images recorded on pure PVA. (a) Contact-mode AFM topography. Color-scale range: 17 nm. (b) Height-contour profile over the continuous white line in (a). (c) (d) LFM images recorded over the same surface region than (a) scanning from left to right (c) and from right to left (d). (e) Contact-mode AFM topographic image. Color-scale range: 17 nm. (f) UFM image recorded simultaneously with (e) over the same surface region.
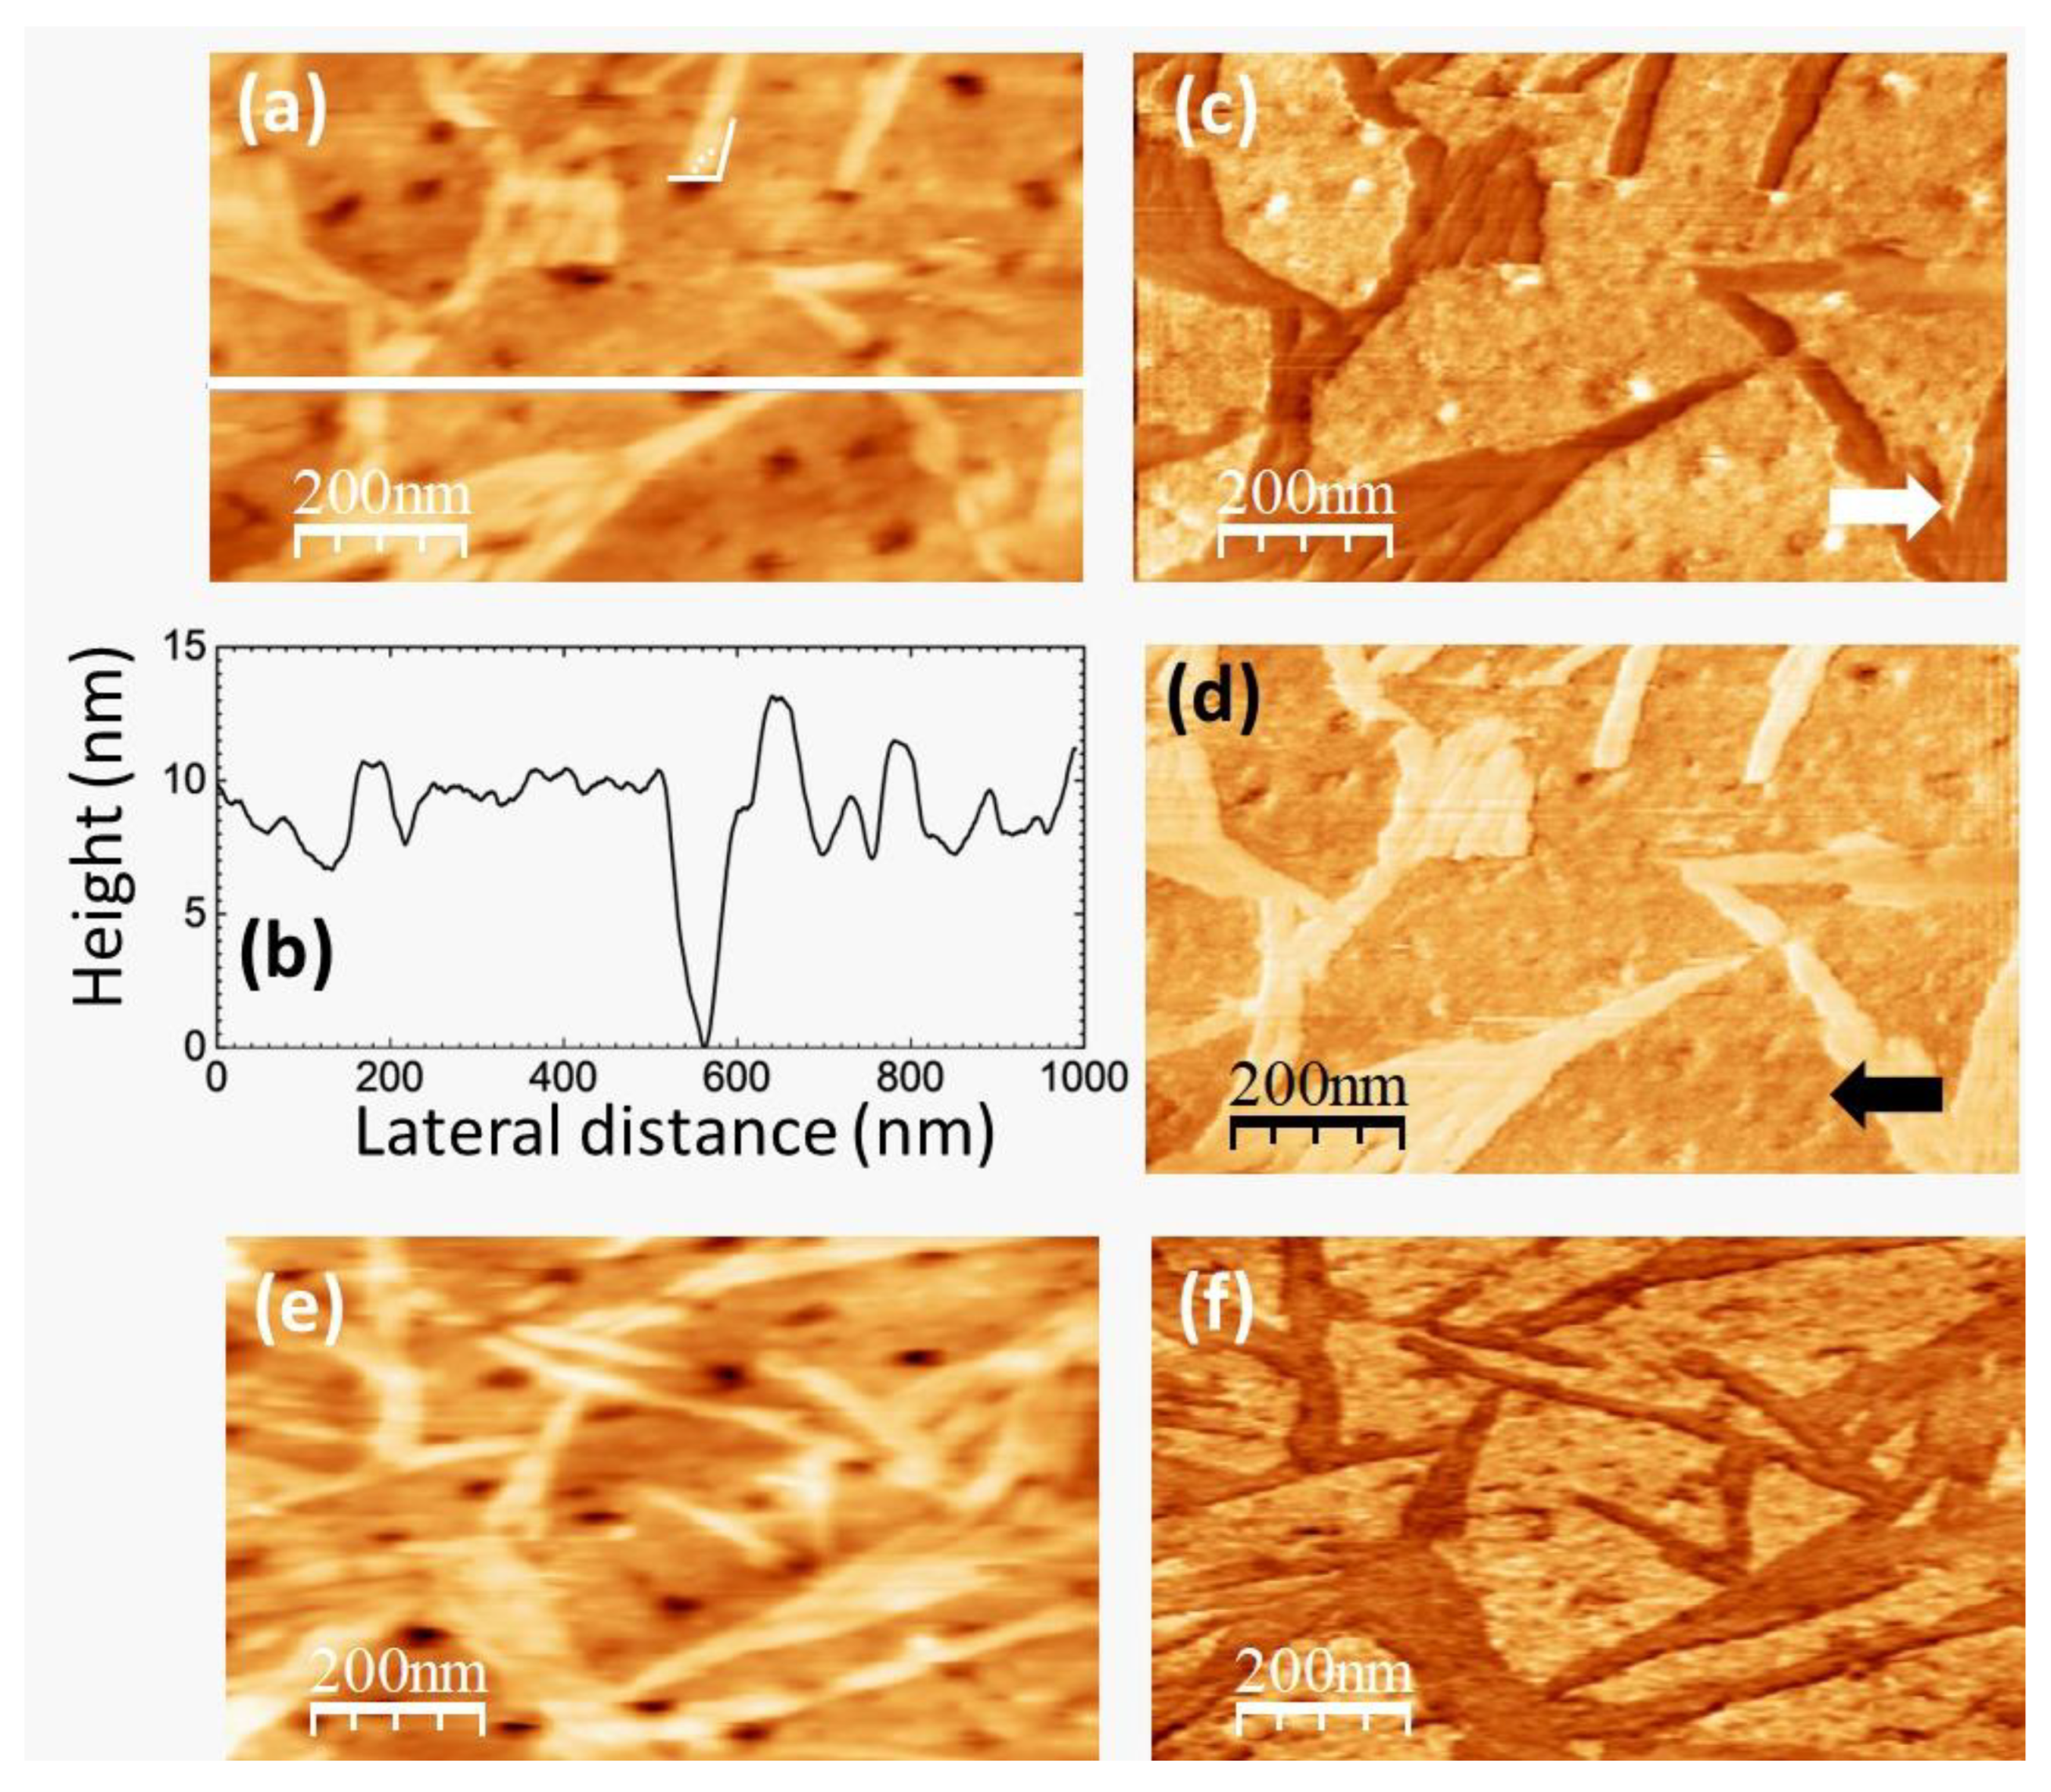
Figure 8 shows SPM images of the PVA/glycerol 1.0 wt.% film. Figure 8a corresponds to a contact-mode AFM topographic image, recorded over an area of the same size as Figure 6e. In Figure 8a, the topography is also characterized by cluster aggregates, with a size similar to those on the pure PVA film surface (~100 nm as measured in the contact-mode AFM topographic image). Also, in this image some of the clusters are aligned (e.g. those beside the dashed line on the image), even though the length of the clusters row is considerably shorter.
Figure 8b,c correspond to lateral force microscopy images scanning from left to right (Figure 8b) and from right to left (Figure 8c) recorded simultaneously with (Figure 8a) over the same surface region. As it is clearly seen in Figure 8b,c we now find areas with a lower frictional contrast, similar to those in Figure 6c,d and Figure 7c,d although now these areas do not appear to be ribbon-like or parellogrammic in shape, but rather rounded. Those areas do not appear straightforwardly correlated to specific topographic features.
Figure 8.
SPM images recorded on PVA/glycerol 1.0 wt.%. (a) Contact-mode AFM topography. Color-scale range: 26 nm. (b) (c) LFM images recorded over the same surface region than (a) scanning from left to right (b) and from right to left (c). (d) Enlargement of the region enclosed by the white rectangle in (a). (e) Height-contour profile over the while line in (d). (f) (g) Enlargements of the regions enclosed by the white rectangles in (b) (c).
We hypothesize that these areas correspond to crystalline PVA domains, whose shape has been modified by the incorporation of 1.0 wt.% glycerol in the PVA matrix. According to our preparation method, we prepare a 7.0 wt.% PVA stock solution, which we dilute up to 3.5 wt.% PVA by adding a glycerol/water solution with the appropriate concentration. The addition of the glycerol/water solution is carried out at room temperature (25ºC). We presume that the initial PVA crystalline nuclei are already present in the 7.0 wt.% PVA stock solution. These nuclei would have formed as the solution was slowly cooled from 90ºC to room temperature. The growth or assembly of these nuclei is expected to take place as the resulting solution is eventually dried. Glycerol will incorporate to the PVA chains through hydrogen bonds, but if only in a small quantity, it will most likely not penetrate inside the PVA crystallites. Instead, it will preferentially accumulate at the amorphous/crystalline interface, as it happens with water. The incorporation of a few amount of glycerol to the PVA molecules may help the assembly of the crystalline domains, fostering the reorganization of the amorphous PVA regions. This would explain the results obtained by XRD, the fact that the halo corresponding to the amorphous areas in the XRD diffractogram diminishes for the PVA/glycerol 1.0 wt.% films and the slight increase in crystallinity of the PVA/glycerol 1.0 wt.% films inferred from the XRD, FT-IR and DTA data. Furthermore, the fact that a peak presumably related to PVA crystallization is observed in the DTA curves (red curve in Figure 5a) is also understandable within this context. In addition, the modification of the shape of the PVA crystalline domains allows us to explain the changes in the relative intensities of the XRD peaks.
Figure 8d corresponds to an enlargement of the topographic area enclosed by the rectangle in Figure 8a. Figure 8e displays a height-contour profile along the straight line in Figure 8d. Figure 8f and 8g are enlargements of the LFM images of the same surface area, also enclosed by rectangles in Figure 8b,c respectively. The rounded areas with a lower frictional contrast have been enclosed by circles in Figure 8f,g, and circles over the same area have also been drawn in Figure 8d to facilitate the analysis of the topography on those areas. In both the topography and the LFM images, clusters may be clearly distinguished in the regions enclosed by the circles. However, clusters that appear topographically identical do not produce the same frictional contrast. In Figure 8d we observe clusters located at different layers. A detailed examination of Figure 8a-c allows us to infer that at the topographic regions around those that yield a lower frictional contrast, the clusters tend to be located at higher sites. It is also interesting to remark that in Figure 8f,g, the boundary regions of the lower friction domains appear defined by individual clusters, as is also the case in Figure 6c,d. This supports the interpretation that the assembly of the PVA crystalline domains proceeds through the assembly of the PVA clusters themselves.
The presence of numerous pores is also noticeable in Figure 8a. As in Figure 7a, many of those pores appear to be originated by a missing PVA cluster. Pores with a larger diameter which might correspond to the displacement of various neighboring clusters may also be seen at the topographic image. For instance, those within the white dotted circles in Figure 8(a) have a diameter of ~300 nm. Notice that those pores produce a higher frictional contrast in the LFM images in which the same locations have also been marked with white dotted circles to facilitate their localization. The origin of this contrast will be discussed in detail below.
Figure 9a corresponds to contact-mode AFM and Figure 9b,c correspond to UFM images of the PVA/glycerol 1.0 wt.% recorded over the same surface region as Figure 8a-c. Even though the areas are not exactly coincident, likely because of a displacement of the tip position due to drift, features from Figure 8a, such as the three pores enclosed by the white dotted circles on the top right-hand corner, can be easily identified in both images. Figure 9a,b were recorded while the tip was scanning forwards (from the left to right) and Figure 9c was recorded together with Figure 9b while the tip was scanning backwards (from right to left). As it is apparent from Figure 9b,c, while scanning from left to right in the presence of ultrasonic vibration some of the PVA surface clusters from the right-hand side were dragged to the left by the tip, and remained there as the tip scanned back to produce Figure 9c. A close look to Figure 9a also shows straight features resulting from the dragging of the clusters, even though the topography does not seem to be severely affected by the tip-induced modifications. In Figure 9c we find areas with a lower (softer) UFM contrast in similar locations as those that in Figure 8b,c yielded lower frictional contrast. As it is apparent, the shape of domain located at the center in Figure 9c is markedly different from this in Figure 8b,c, presumably as a result of the tip action. At the lower right-hand border of Figure 9c, the image shows a heap with darker (softer) contrast. Figure 9d corresponds to a larger UFM image recorded over a region that included the area of Figure 9a-c in its central part, recorded following the latter. The heap with lower UFM contrast induced by the tip while producing Figure 9b can be here clearly distinguished. Such heap presumably consists of clusters drugged by the tip while scanning forwards and piled up at the end of the scan. Interestingly, some of the other domains in Figure 8a-c, like those with a rounded shape at the lower right-hand corner of the image, remained unaffected.
When discussing Figure 8a-c we identified the lower friction domains as PVA crystalline regions. The fact that those domains yield a lower (softer) UFM contrast may be explained because of the presence of glycerol (and possibly also water) at the amorphous/crystalline interface areas. UFM images in Figure 7f also yielded a lower UFM contrast in crystalline domains of the pure PVA films. However, we cannot rule out that in PVA/glycerol films, clusters incorporating glycerol molecules produce a softer and lower frictional contrast even if they do not contain crystalline nuclei.
Glycerol molecules located at PVA cluster surfaces may facilitate the displacement of those clusters relative to each other, and this effect may certainly be enhanced by the presence of surface ultrasonic vibration, promoting tip-induced modifications while scanning.
In addition, the glycerol molecules might favor the detachment of surface clusters and induce surface pores. Figure 9e,f show simultaneously recorded contact-mode topographic and UFM images respectively of a surface area of the PVA/glycerol 1.0 wt.% film in which various surface pores of different sizes up to ~ 300 nm are apparent. As can be seen in the images, the UFM contrast is stiffer (brighter) within the pores. And, as it was mentioned above, a higher frictional contrast is also found at those regions. (see Figure 8a-c, pores located within the white dashed circles). The size of the pores rules out that this contrast is an artifact. In fact, such contrast is not observed in the pores found in the pure PVA films (see Figure 6). These results may possibly be explained because of the presence of glycerol on the surfaces of the clusters at the bottom of the pores. On the one hand, this could have facilitated the detachment of the clusters at the top, explaining the formation of the pore itself. On the other hand, glycerol molecules within a cluster bonded with their primary alcohol groups to a PVA molecular chain and with their secondary alcohol groups to a neighboring PVA molecular chain could exert a hydrogen bond mediated crosslinking effect on PVA increasing the stiffness of the confined cluster.
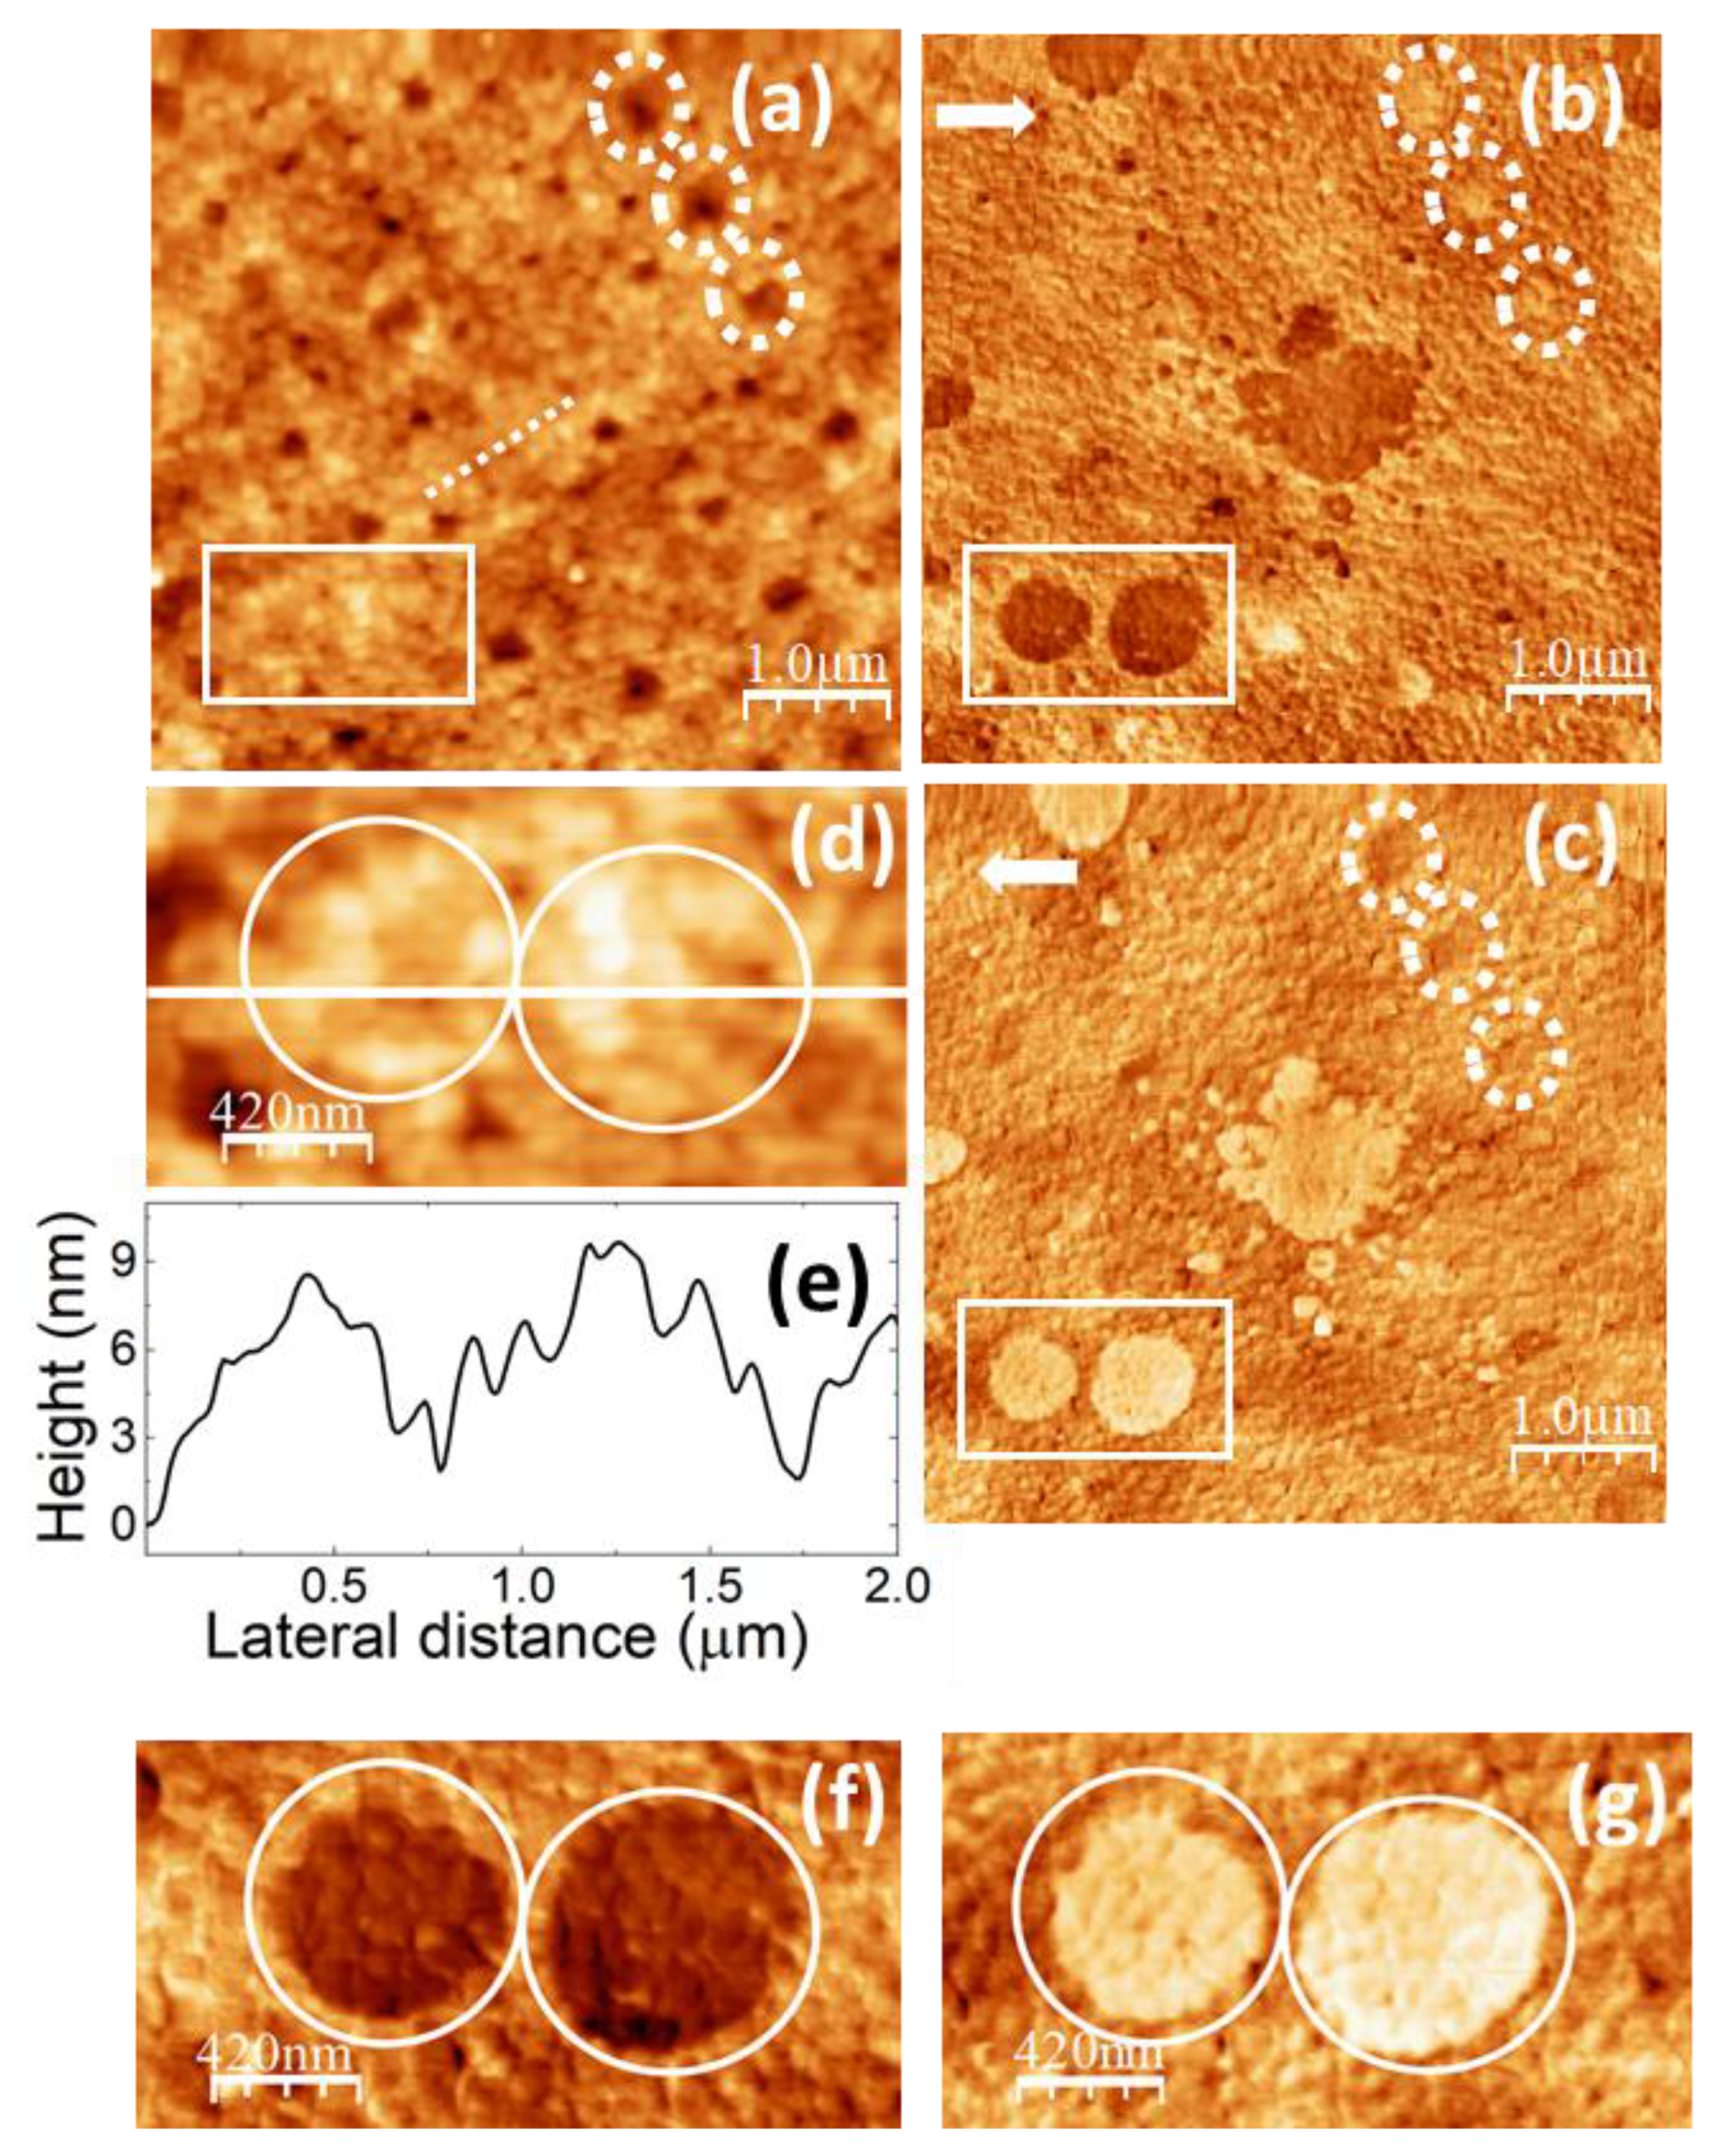
Figure 10 shows SPM images of the PVA/glycerol 2.0 wt.% film. Figure 10a corresponds to a contact-mode AFM topographic image, recorded over an area of the same size as Figure 6e and Figure 8a. As in the case of the pure PVA and the PVA/glycerol 1.0 wt.% film, the topography is characterized by cluster aggregates, some of which are aligned into rows. Figure 10b displays a contour-line profile along the straight line in Figure 10a.
Figure 10c,d correspond to lateral force microscopy images scanning from left to right (Figure 10c) and from right to left (Figure 10d) recorded over the same surface region as (Figure 10a). As it is clearly seen in Figure 10c,d we find areas with a lower frictional contrast, similar to those in Figure 6c,d, Figure 7c,d and Figure 8b,c. While some of those areas exhibit rounded interfaces similar to those in Figure 7c,d, others rather resemble the ribbon-like shape domains found in the pure PVA film surface (Figure 6c,d and 7c,d). Nevertheless here, the extension of the lower contrast domains is apparently larger, as if some of the areas linking the domains in Figure 7 that for the pure PVA produced a higher friction contrast, were now also yielding a low frictional response. Interestingly, some of the ribbon-like low friction domains in Figure 10c,d (like for instance those within the white dashed rectangles) seem to be correlated to higher topographic regions, but at other areas of the low friction domains, no correlation with the topographic image could be appreciated.
According to the FT-IR and XRD data, the crystallinity of the PVA/glycerol 2.0 wt.% films is reduced compared to this for the pure PVA and 1.0 wt.% glycerol films. This may be explained by the formation of glycerol aggregates for the higher glycerol concentrations which may penetrate within the crystalline PVA domains and partially destroy them. For these films, in the DTA curves, the endothermic peak corresponding to the maximum rate of degradation for PVA appears split into two well-resolved peaks, which might be indicative of the formation of a new phase formed by glycerol aggregates or glycerol-PVA complexes. The lower friction contrast in Figure 10 b,c might originate either because of the presence of crystalline PVA domains, or of the presence of a distinct phase formed by glycerol-PVA complexes, even though the LFM image provides no clue to justify the presence of lower frictional domains of a different nature.
It should be pointed out that on the PVA/glycerol 2.0 wt.% films, we did not succeed in recording good quality UFM images, as the film was severely affected by tip actuation in the presence of ultrasound. And for the case of PVA/glycerol 4.4 wt.% nor even contact-AFM and LFM images could be recorded without surface modification.
According to FT-IR, XRD and DTA data, the incorporation of 4.4 wt.% glycerol leads to a significant reduction of the PVA crystallinity. The effect may be similar to this observed with water, which in a little amount enhances the PVA crystallinity, but excess water leads to destruction of the PVA crystallites.
4. Conclusions
The study presents a thorough investigation of the structural properties, crystallinity and thermal response of pure PVA and PVA/glycerol films using FT-IR, XRD, TG/TDA and advanced SPM.
According to FTIR, as glycerol is incorporated to the PVA matrix, intermolecular hydrogen bonds between PVA and glycerol are formed, as evidenced by a shift of the (O–H) stretching vibration band to higher wavenumbers. The data suggest that, for low glycerol contents, PVA-glycerol bonding occurs mainly through the glycerol’s secondary alcohol group, as the glycerol primary alcohol group (C-O) stretching band appears at the same wavenumber as in pure glycerol. As the amount of glycerol is increased, PVA-glycerol bonding through the glycerol’s primary alcohol groups increases (the (C-O) stretching band displaces to lower wavenumbers), and the appearance of bands corresponding to (C–H) groups and (C–C) skeleton vibrations of glycerol suggest the formation of glycerol aggregates. In addition, an increase of water content in the film is observed (the FTIR band related to absorbed water increases).
The XRD pattern of PVA reveals the semicrystalline nature of the film, with crystallites of ~5 nm in size. For low glycerol contents, a structural rearrangement of the polymer chains occurs, such that for 1.0 wt.% glycerol, a reduction of the diffuse scattering associated with the amorphous phase and an increase of the diffraction signal of the planes versus the (101) planes are observed. For higher glycerol contents, the increase of glycerol-PVA interactions, and formation of glycerol aggregates together with the incorporation of a larger amount of absorbed water into the films, lead first, for 2.0 wt.% to a subsequent increase of the diffuse scattering associated with the amorphous phase and a decrease of the diffraction signal of the planes versus the (101) planes to values similar to those in pure PVA, and for 4.4 wt.% to the disappearance of the main diffraction peak of PVA. According to FT-IR and XRD data the crystallinity of the PVA films is slightly higher for low glycerol content and decreases for higher glycerol contents down to a level below that of the pure PVA film.
Thermal analysis of PVA and PVA/glycerol films carried out at two heating rates (5 and 25 ºC/min) in air atmosphere confirmed that degradation of pure PVA occurs in 4 stages with appearance of an additional DTG/DTA event for PVA/glycerol films when heating at lower rates, possibly related to degradation of glycerol or of a PVA/glycerol phase. At the higher heating rates, the endothermic DTA peak corresponding to the maximum TG degradation rate splits into two peaks for the films with higher glycerol content, suggesting the presence of a new glycerol related phase. The thermal stability and melting temperature of PVA decreases with increasing glycerol content; however, for 1.0 wt.% glycerol, the reduction of melting point is not significant.
Interestingly, upon heating at 5°C/min, DTA revealed the appearance of exothermic peaks in the PVA and PVA/glycerol 1.0 wt.% films in the temperature range corresponding to the main TG degradation peak. To the best of our knowledge, such exothermic DTA peak of PVA has not been reported before. As it is not observed in argon atmosphere, such peak could be related to the oxidation of PVA. At higher heating rate, the absence of exothermic peaks can be explained by lower rate of oxidation compared to thermal decomposition.
The topography of pure PVA film is characterized by clusters aggregates, some of which align along well-defined direction forming intersecting rows with a higher topographic height of ~ 10 nm, and lower frictional and higher (stiffer) UFM contrast. At some places, UFM allowed us to resolve stiffer clusters ~ 45 nm in diameter arranged in a zig-zag pattern along a row. The alignment of the topographic clusters in rows can be explained as being due to the assembly of PVA crystalline nuclei (~5 nm in diameter according to XRD) located within the clusters. At other surface regions, well-defined ribbon-like domains with a characteristic crystalline morphology are observed, which yielded lower frictional and lower (softer) UFM contrast. The lower UFM contrast in those areas can be explained by a slightly higher local content of water, which facilitates the assembly of the surface clusters and remains at the amorphous/crystalline interface.
The incorporation of 1.0 wt.% glycerol led to modification in shape of the ribbon-like domains in pure PVA to rounded. Hence, glycerol molecules in a small quantity do not penetrate inside the PVA crystallites, but foster the reorganization of the amorphous PVA regions, alter the shape of the PVA crystalline domains, and preferentially accumulates at the amorphous/crystalline interface. In those films, the domains could only be clearly identified from LFM and UFM, as a topographical correlation was not apparent. In addition, pores of various sizes up to 300 nm in diameter were observed, which produced a characteristic higher frictional and higher (stiffer) UFM contrast.
At the film with 2.0 wt.% glycerol content, domains with lower frictional contrast could also be observed, some with rounded interfaces like those seen in PVA/1.0 wt.% glycerol films, and others which rather resembled the ribbon-like domains found in the pure PVA film surface, but wider and joined together. It cannot be ruled out that a different phase formed by glycerol aggregates or glycerol-PVA complexes also contributes to the contrast of the domains, although the LFM images did not provide clues to justify the presence of lower friction domains of a different nature.
In the PVA/glycerol films, we observed tip-induced surface modification effects, which were more significant in the presence of ultrasonic vibration. For the case of films with 1.0 wt.% glycerol tip-induced displacement of clusters with lower LFM/UFM contrast forming distinct domains led to modification of the domain shape and formation of heaps with distinct contrast at the edge of the scanned area. For glycerol contents higher than 2.0 wt.% glycerol, the tip-induced modification severely complicated the acquisition and analysis of SPM images.
The presented research contributes to the understanding of crystallinity in PVA and its modification by plasticizers such as glycerol. Our findings deliver crucial insights into how glycerol impacts that nanostructure of PVA, thereby paving the way for tailoring PVA properties to achieve optimal performance.
Author Contributions
Conceptualization, G.K. and T.C.; methodology, G.K. and T.C.; formal analysis, G.K, D.C. and T.C..; investigation, G.K., D.C. and T.C.; resources, T.C.; data curation, G.K., D.C. and T.C.; writing—original draft preparation, G. K. and T.C.; writing—review and editing, G.K., T.C.; visualization, G.K. and T.C.; supervision, T.C.; funding acquisition, T.C. All authors have read and agreed to the published version of the manuscript.
Funding
We acknowledge financial support under project Ref. 2022-GRIN-34226 (Plan Propio UCLM cofunded 85% by FEDER). G.K. acknowledges financial support from the UCLM for her stay in Almadén, Spain, under contract 2022-UNIVERS-11036, ref. 2022-POST-20987.
Data Availability Statement
The data presented in this study are available on request from the corresponding author.
Acknowledgments
Carlos Rivera Cavanillas (UCLM IRICA Instrumentation Service) is gratefully acknowledged for technical aid in XRD, FT-IR, and TGA/DTA data acquisition.
Conflicts of Interest
The authors declare no conflict of interest. The funders had no role in the design of the study; in the collection, analyses, or interpretation of data; in the writing of the manuscript, or in the decision to publish the results.
References
- Abdullah, Z.W.; Dong, Y.; Davies, I.J.; Barbhuiya, S. PVA, PVA Blends, and Their Nanocomposites for Biodegradable Packaging Application. Polymer-Plastics Technology and Engineering 2017, 56, 1307–1344. [Google Scholar] [CrossRef]
- Aslam, M.; Kalyar, M.A.; Raza, Z.A. Polyvinyl alcohol: A review of research status and use of polyvinyl alcohol based nanocomposites. Polymer Engineering & Science 2018, 58, 2119–2132. [Google Scholar] [CrossRef]
- Panda, P.K.; Sadeghi, K.; Seo, J. Recent advances in poly (vinyl alcohol)/natural polymer based films for food packaging applications: A review. Food Packaging and Shelf Life 2022, 33, 100904. [Google Scholar] [CrossRef]
- Shekaryar, H.; Norouzbahari, S. A review on versatile applications of polyvinyl alcohol thin films, specifically as sensor devices. Polymer Engineering & Science 2024, 64, 455–468. [Google Scholar] [CrossRef]
- Lim, L.Y.; Wan, L.S.C. The Effect of Plasticizers on the Properties of Polyvinyl Alcohol Films. Drug Development and Industrial Pharmacy 1994, 20, 1007–1020. [Google Scholar] [CrossRef]
- Jang, J.; Lee, D.K. Plasticizer effect on the melting and crystallization behavior of polyvinyl alcohol. Polymer 2003, 44, 8139–8146. [Google Scholar] [CrossRef]
- Cortés-Morales, E.C.; Rathee, V.S.; Ghobadi, A.; Whitmer, J.K. A molecular view of plasticization of polyvinyl alcohol. The Journal of Chemical Physics 2021, 155, 174903. [Google Scholar] [CrossRef]
- Chen, M.; Runge, T.; Wang, L.; Li, R.; Feng, J.; Shu, X.-L.; Shi, Q.-S. Hydrogen bonding impact on chitosan plasticization. Carbohydrate Polymers 2018, 200, 115–121. [Google Scholar] [CrossRef]
- Farahnaky, A.; Saberi, B.; Majzoobi, M. Effect of Glycerol on Physical and Mechanical Properties of Wheat Starch Edible Films. Journal of Texture Studies 2013, 44, 176–186. [Google Scholar] [CrossRef]
- Shi, S.; Peng, X.; Liu, T.; Chen, Y.-N.; He, C.; Wang, H. Facile preparation of hydrogen-bonded supramolecular polyvinyl alcohol-glycerol gels with excellent thermoplasticity and mechanical properties. Polymer 2017, 111, 168–176. [Google Scholar] [CrossRef]
- Sin, L.T.; Aizan, W.; Abdul, W.; Rahmat, A. Specific heats of neat and glycerol plasticized polyvinyl alcohol. Pertanika Journal of Science & Technology 2010, 18, 387–391. [Google Scholar]
- Mohsin, M.; Hossin, A.; Haik, Y. Thermal and mechanical properties of poly(vinyl alcohol) plasticized with glycerol. Journal of Applied Polymer Science 2011, 122, 3102–3109. [Google Scholar] [CrossRef]
- Pu-You, J.; Cai-ying, B.; Li-hong, H.; Yong-hong, Z. Properties of Poly (vinyl alcohol) Plasticized by Glycerin. J. For. Prod. Ind 2014, 3, 151–153. [Google Scholar]
- Tian, H.; Yuan, L.; Zhou, D.; Niu, J.; Cong, H.; Xiang, A. Improved mechanical properties of poly (vinyl alcohol) films with glycerol plasticizer by uniaxial drawing. Polymers for Advanced Technologies 2018, 29, 2612–2618. [Google Scholar] [CrossRef]
- Lv, C.; Liu, D.; Tian, H.; Xiang, A. Non-isothermal crystallization kinetics of polyvinyl alcohol plasticized with glycerol and pentaerythritol. Journal of Polymer Research 2020, 27. [Google Scholar] [CrossRef]
- Fei, W.; Wu, Z.; Cheng, H.; Xiong, Y.; Chen, W.; Meng, L. Molecular mobility and morphology change of poly(vinyl alcohol) (<scp>PVA</scp>) film as induced by plasticizer glycerol. Journal of Polymer Science 2023, 61, 1959–1970. [Google Scholar] [CrossRef]
- Fu, Z.Z.; Yao, Y.H.; Guo, S.J.; Wang, K.; Zhang, Q.; Fu, Q. Effect of Plasticization on Stretching Stability of Poly(Vinyl Alcohol) Films: A Case Study Using Glycerol and Water. Macromolecular Rapid Communications 2023, 44, 2200296. [Google Scholar] [CrossRef] [PubMed]
- Gassab, M.; Papanastasiou, D.T.; Sylvestre, A.; Bellet, D.; Dridi, C.; Basrour, S. Dielectric Study of Cost-Effective, Eco-Friendly PVA-Glycerol Matrices with AgNW Electrodes for Transparent Flexible Humidity Sensors. Advanced Materials Interfaces 2023, 10, 2201652. [Google Scholar] [CrossRef]
- Teresa Cuberes, M. Mechanical Diode-Based Ultrasonic Atomic Force Microscopies. In Applied Scanning Probe Methods Xi: Scanning Probe Microscopy Techniques, Bhushan, B., Fuchs, H., Eds.; Nanoscience and Technology; 2009; pp. 39-71.
- Horcas, I.; Fernández, R.; Gomez-Rodriguez, J.; Colchero, J.; Gómez-Herrero, J.; Baro, A. WSXM: A software for scanning probe microscopy and a tool for nanotechnology. Review of scientific instruments 2007, 78. [Google Scholar] [CrossRef]
- Vu, T.H.N.; Morozkina, S.N.; Uspenskaya, M.V. Study of the Nanofibers Fabrication Conditions from the Mixture of Poly(vinyl alcohol) and Chitosan by Electrospinning Method. Polymers 2022, 14, 811. [Google Scholar] [CrossRef]
- Chen, T.; Wu, Z.; Wei, W.; Xie, Y.; Wang, X.A.; Niu, M.; Wei, Q.; Rao, J. Hybrid composites of polyvinyl alcohol (PVA)/Si–Al for improving the properties of ultra-low density fiberboard (ULDF). RSC advances 2016, 6, 20706–20712. [Google Scholar] [CrossRef]
- Anicuta, S.-G.; Dobre, L.; Stroescu, M.; Jipa, I. Fourier transform infrared (FTIR) spectroscopy for characterization of antimicrobial films containing chitosan. Analele Universită Ńii din Oradea Fascicula: Ecotoxicologie, Zootehnie şi Tehnologii de Industrie Alimentară 2010, 2010, 1234–1240. [Google Scholar]
- Tretinnikov, O.N.; Zagorskaya, S.A. Determination of the degree of crystallinity of poly(vinyl alcohol) by FTIR spectroscopy. Journal of Applied Spectroscopy 2012, 79, 521–526. [Google Scholar] [CrossRef]
- Jaipakdee, N.; Pongjanyakul, T.; Limpongsa, E. Preparation and characterization of poly (vinyl alcohol)-poly (vinyl pyrrolidone) mucoadhesive buccal patches for delivery of lidocaine HCL. Int. J. Appl. Pharm 2018, 10, 115–123. [Google Scholar] [CrossRef]
- Mallapragada, S.K.; Peppas, N.A.; Colombo, P. Crystal dissolution-controlled release systems. II. Metronidazole release from semicrystalline poly(vinyl alcohol) systems. Journal of Biomedical Materials Research 1997, 36, 125–130. [Google Scholar] [CrossRef]
- Andrade, J.; González-Martínez, C.; Chiralt, A. The Incorporation of Carvacrol into Poly (vinyl alcohol) Films Encapsulated in Lecithin Liposomes. Polymers 2020, 12, 497. [Google Scholar] [CrossRef] [PubMed]
- Stachowiak, N.; Kowalonek, J.; Kozlowska, J. Effect of plasticizer and surfactant on the properties of poly(vinyl alcohol)/chitosan films. International Journal of Biological Macromolecules 2020, 164, 2100–2107. [Google Scholar] [CrossRef] [PubMed]
- Syahputra, R.A.; Rani, Z.; Ridwanto, R.; Miswanda, D.; Pulungan, A. ISOLATION AND CHARACTERIZATION OF GLYCEROL BY TRANSESTERIFICATION OF USED COOKING OIL. Rasayan Journal of Chemistry 2023, 16. [Google Scholar] [CrossRef]
- Habuka, A.; Yamada, T.; Nakashima, S. Interactions of Glycerol, Diglycerol, and Water Studied Using Attenuated Total Reflection Infrared Spectroscopy. Appl. Spectrosc. 2020, 74, 767–779. [Google Scholar] [CrossRef]
- Basiak, E.; Lenart, A.; Debeaufort, F. How Glycerol and Water Contents Affect the Structural and Functional Properties of Starch-Based Edible Films. Polymers 2018, 10, 412. [Google Scholar] [CrossRef]
- Guerrero, P.; Retegi, A.; Gabilondo, N.; De La Caba, K. Mechanical and thermal properties of soy protein films processed by casting and compression. Journal of Food Engineering 2010, 100, 145–151. [Google Scholar] [CrossRef]
- Xiang, A.; Lv, C.; Zhou, H. Changes in Crystallization Behaviors of Poly(Vinyl Alcohol) Induced by Water Content. Journal of Vinyl and Additive Technology 2020, 26, 613–622. [Google Scholar] [CrossRef]
- Assender, H.E.; Windle, A.H. Crystallinity in poly(vinyl alcohol). 1. An X-ray diffraction study of atactic PVOH. Polymer 1998, 39, 4295–4302. [Google Scholar] [CrossRef]
- Kumar, A.; Negi, Y.S.; Choudhary, V.; Bhardwaj, N.K. Microstructural and mechanical properties of porous biocomposite scaffolds based on polyvinyl alcohol, nano-hydroxyapatite and cellulose nanocrystals. Cellulose 2014, 21, 3409–3426. [Google Scholar] [CrossRef]
- Sreekumar, P.A.; Al-Harthi, M.A.; De, S.K. Studies on compatibility of biodegradable starch/polyvinyl alcohol blends. Polymer Engineering & Science 2012, 52, 2167–2172. [Google Scholar] [CrossRef]
- Assender, H.E.; Windle, A.H. Crystallinity in poly(vinyl alcohol) 2. Computer modelling of crystal structure over a range of tacticities. Polymer 1998, 39, 4303–4312. [Google Scholar] [CrossRef]
- Sreekumar, P.A.; Al-Harthi, M.A.; De, S.K. Effect of glycerol on thermal and mechanical properties of polyvinyl alcohol/starch blends. Journal of Applied Polymer Science 2012, 123, 135–142. [Google Scholar] [CrossRef]
- Liu, T.; Peng, X.; Chen, Y.-N.; Bai, Q.-W.; Shang, C.; Zhang, L.; Wang, H. Hydrogen-Bonded Polymer–Small Molecule Complexes with Tunable Mechanical Properties. Macromolecular Rapid Communications 2018, 39, 1800050. [Google Scholar] [CrossRef] [PubMed]
- Yin, D.; Xiang, A.; Li, Y.; Qi, H.; Tian, H.; Fan, G. Effect of Plasticizer on the Morphology and Foaming Properties of Poly(vinyl alcohol) Foams by Supercritical CO2 Foaming Agents. Journal of Polymers and the Environment 2019, 27, 2878–2885. [Google Scholar] [CrossRef]
- Prime, R.B.; Bair, H.E.; Vyazovkin, S.; Gallagher, P.K.; Riga, A. Thermogravimetric Analysis (TGA). In Thermal Analysis of Polymers; 2009; pp. 241-317.
- Budrugeac, P. Kinetics of the complex process of thermo-oxidative degradation of poly(vinyl alcohol). Journal of Thermal Analysis and Calorimetry 2008, 92, 291–296. [Google Scholar] [CrossRef]
- Wiśniewska, M.; Chibowski, S.; Urban, T.; Sternik, D. Investigation of the alumina properties with adsorbed polyvinyl alcohol. Journal of Thermal Analysis and Calorimetry 2011, 103, 329–337. [Google Scholar] [CrossRef]
- Zhang, W.; Jia, J.; Ding, Y.; Jiang, G.; Sun, L.; Lu, K. Effects of heating rate on thermal degradation behavior and kinetics of representative thermoplastic wastes. Journal of Environmental Management 2022, 314, 115071. [Google Scholar] [CrossRef] [PubMed]
- Tarique, J.; Sapuan, S.M.; Khalina, A. Effect of glycerol plasticizer loading on the physical, mechanical, thermal, and barrier properties of arrowroot (Maranta arundinacea) starch biopolymers. Scientific Reports 2021, 11. [Google Scholar] [CrossRef] [PubMed]
- Castelló, M.; Dweck, J.; Aranda, D. Thermal stability and water content determination of glycerol by thermogravimetry. Journal of Thermal Analysis and Calorimetry 2009, 97, 627–630. [Google Scholar] [CrossRef]
- Ilyas, R.A.; Sapuan, S.M.; Ishak, M.R.; Zainudin, E.S. Development and characterization of sugar palm nanocrystalline cellulose reinforced sugar palm starch bionanocomposites. Carbohydrate Polymers 2018, 202, 186–202. [Google Scholar] [CrossRef] [PubMed]
- Sanyang, M.; Sapuan, S.; Jawaid, M.; Ishak, M.; Sahari, J. Effect of Plasticizer Type and Concentration on Tensile, Thermal and Barrier Properties of Biodegradable Films Based on Sugar Palm (Arenga pinnata) Starch. Polymers 2015, 7, 1106–1124. [Google Scholar] [CrossRef]
- Andrade, J.; González-Martínez, C.; Chiralt, A. The Incorporation of Carvacrol into Poly (vinyl alcohol) Films Encapsulated in Lecithin Liposomes. Polymers 2020, 12. [Google Scholar] [CrossRef] [PubMed]
- Fong, R.; Robertson, A.; Mallon, P.; Thompson, R. The Impact of Plasticizer and Degree of Hydrolysis on Free Volume of Poly(vinyl alcohol) Films. Polymers 2018, 10, 1036. [Google Scholar] [CrossRef] [PubMed]
- Abd-Elrahman, M.I. Enhancement of thermal stability and degradation kinetics study of poly(vinyl alcohol)/zinc oxide nanoparticles composite. Journal of Thermoplastic Composite Materials 2014, 27, 160–166. [Google Scholar] [CrossRef]
- Tubbs, R.K. Melting point and heat of fusion of poly(vinyl alcohol). Journal of Polymer Science Part A 1965, 3, 4181–4189. [Google Scholar] [CrossRef]
- Cuberes, M.T. Mechanical Diode-Based Ultrasonic Atomic Force Microscopies. In Applied Scanning Probe Methods Xi: Scanning Probe Microscopy Techniques, Bhushan, B., Fuchs, H., Eds.; Nanoscience and Technology; 2009; pp. 39-71.
- Sperling, L.H. Introduction to physical polymer science; John Wiley & Sons: 2005.
- Strawhecker, K.E.; Manias, E. AFM of Poly(vinyl alcohol) Crystals Next to an Inorganic Surface. Macromolecules 2001, 34, 8475–8482. [Google Scholar] [CrossRef]
- Hodge, R.M.; Edward, G.H.; Simon, G.P. Water absorption and states of water in semicrystalline poly(vinyl alcohol) films. Polymer 1996, 37, 1371–1376. [Google Scholar] [CrossRef]
- Tsuboi, K. Solution-grown crystals of poly(vinyl alcohol). Journal of Macromolecular Science, Part B 1968, 2, 603–622. [Google Scholar] [CrossRef]
- Tsuboi, K.; Mochizuki, T. Single crystals of polyvinyl alcohol. Journal of Polymer Science Part B: Polymer Letters 1963, 1, 531–534. [Google Scholar] [CrossRef]
- Song, Y.; Zhang, S.; Kang, J.; Chen, J.; Cao, Y. Water absorption dependence of the formation of poly(vinyl alcohol)-iodine complexes for poly(vinyl alcohol) films. RSC Advances 2021, 11, 28785–28796. [Google Scholar] [CrossRef]
Figure 2.
(a) Normalized FTIR spectra of the pure PVA and PVA/glycerol films with different concentrations of glycerol: 1.0, 2.0, 4.4 wt.%. (b-c) Zoom of regions highlighted in yellow in (a). In (b) (c), the dotted black curves correspond to the pure PVA film, which has been shifted and superimposed on each of the other curves to facilitate comparison. (d) Absorbance spectra (inverse from the transmittance) in the selected region to illustrate the procedure for constructing the baseline to determine A1141 and A1088 in equation (1) (see text).
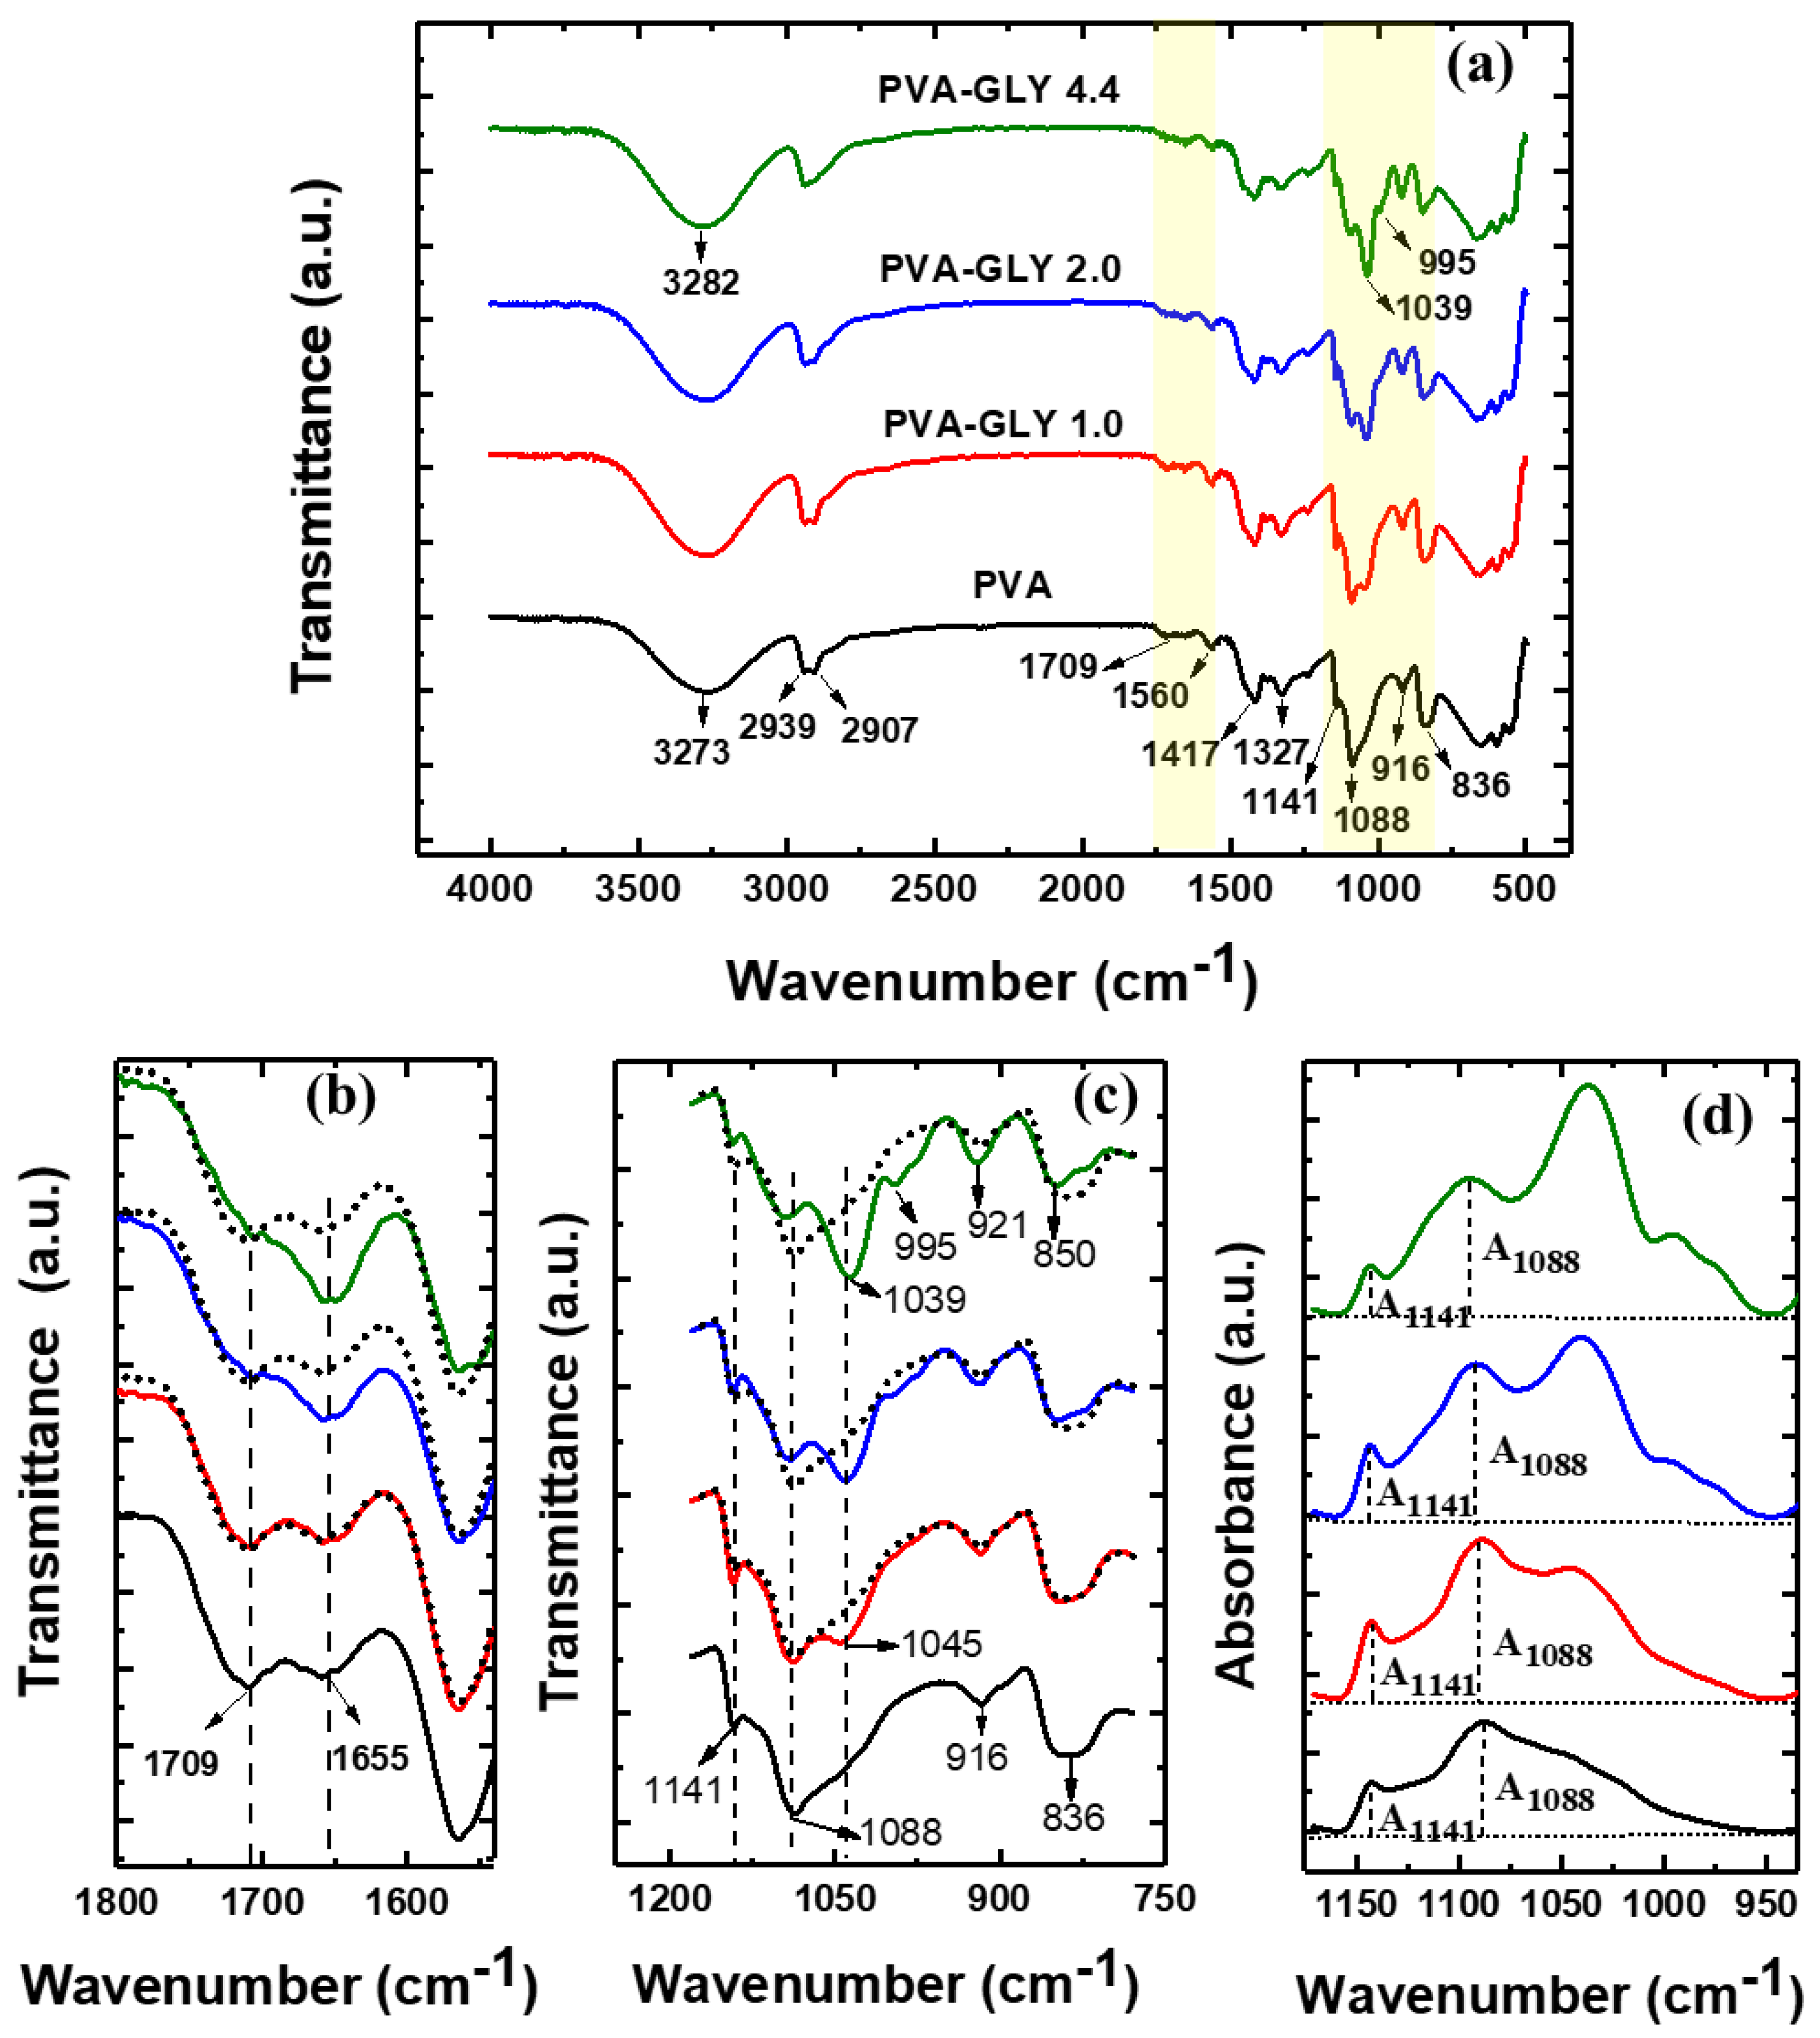
Figure 9.
SPM images recorded on PVA/glycerol 1.0 wt.%. (a) Contact-mode AFM topography over the same surface region than Figure 8(a). (b) UFM image recorded simulatenously with (a), scanning from right to left. (c) UFM image recorded together with (b) but scanning from left to right. (d) UFM image over a larger area than (c), centred at the same position. (e) Contact-mode AFM topography at nearby region. Color-scale range: 24 nm. (f) UFM image recorded simultenously with (e).
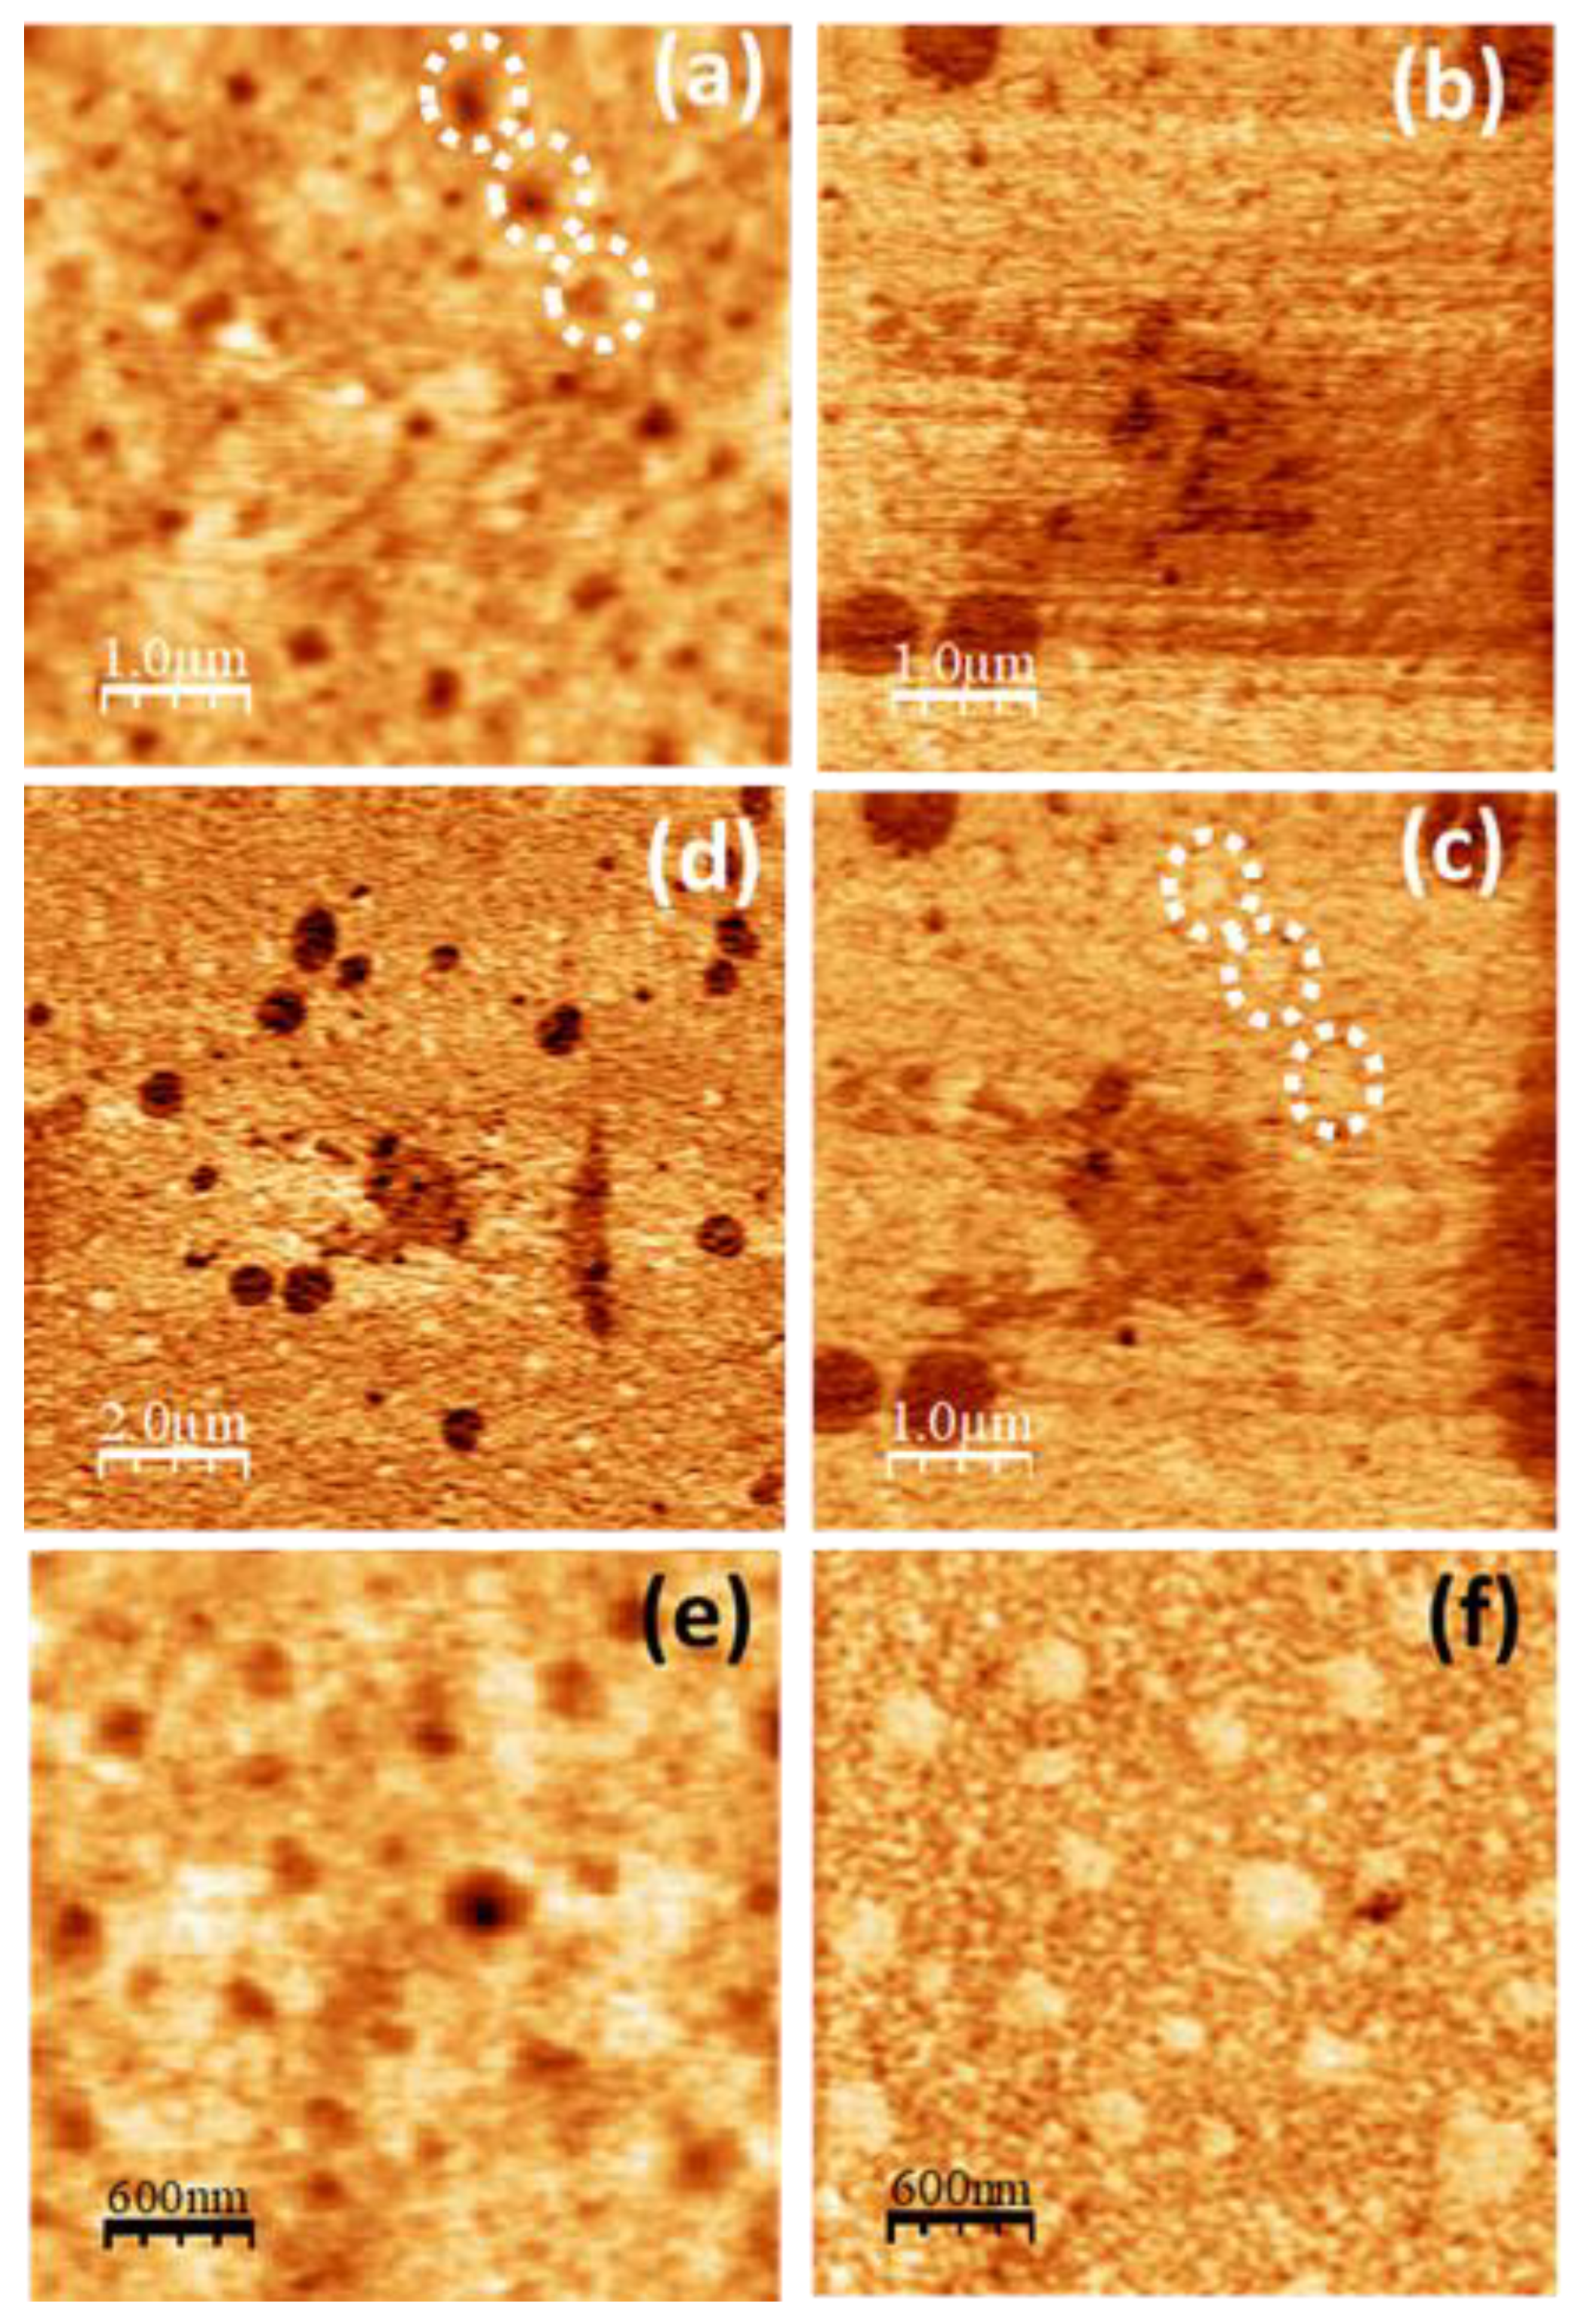
Figure 10.
SPM images recorded on PVA/glycerol 2.0 wt.%. (a) Contact-mode topography. Color-scale range: 28 nm. (b) Height-contour profile recorded along the continuous white line in (a). (c) (d) LFM images recorded over the same surface area as (a), scanning from left to right (c) and from right to left (d).
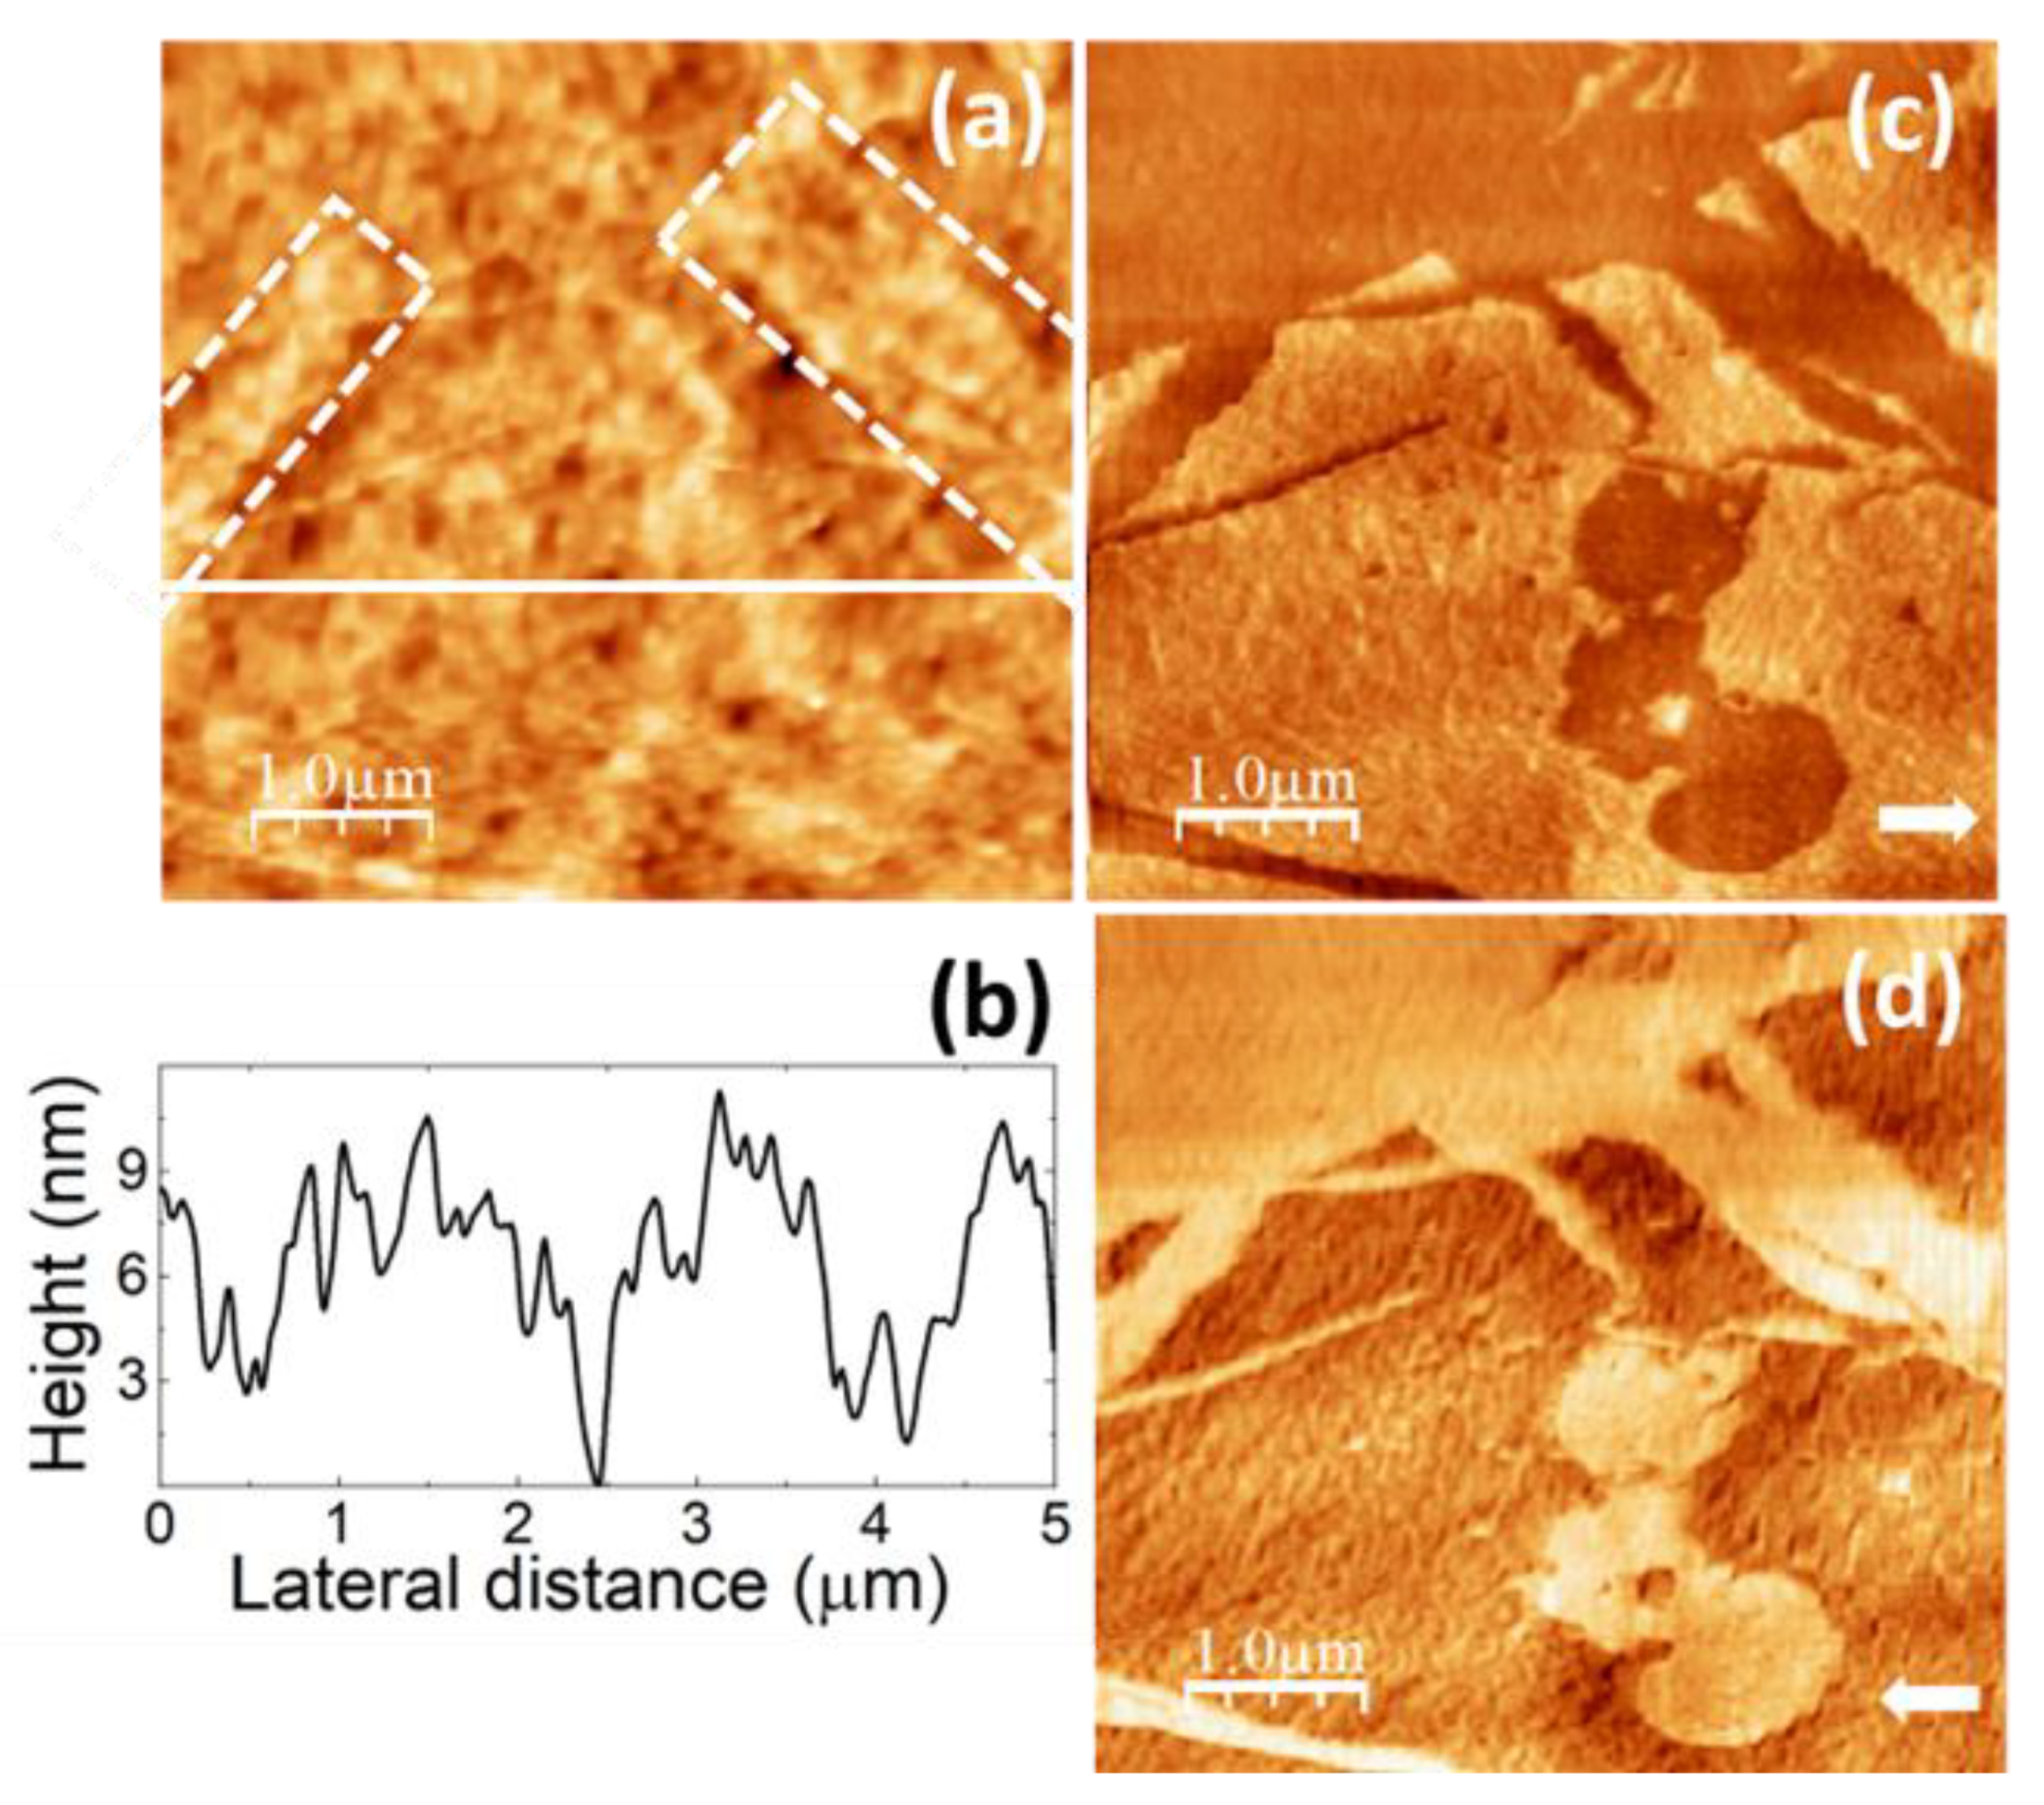
Table 1.
Crystallinity percentage (a) of PVA films with different glycerol content calculated by FTIR (Figure 2) and XRD (Figure 3); melting points (TM) determined from DTA at 25 °С/min heating rate (Figure 5d).
| Glycerol (wt.%) | α(FT-IR) | α(XRD) | Crystal Size (nm) | TM (ºC) |
|---|---|---|---|---|
| 19.7º | ||||
| 0 | 27.13 | 27.14 | 4.25 | 255 |
| 1.0 2.0 4.4 |
30.39 27.25 19.49 |
29.70 24.73 15.80 |
5.08 4.90 - |
253 231 - |
Disclaimer/Publisher’s Note: The statements, opinions and data contained in all publications are solely those of the individual author(s) and contributor(s) and not of MDPI and/or the editor(s). MDPI and/or the editor(s) disclaim responsibility for any injury to people or property resulting from any ideas, methods, instructions or products referred to in the content. |
© 2024 by the authors. Licensee MDPI, Basel, Switzerland. This article is an open access article distributed under the terms and conditions of the Creative Commons Attribution (CC BY) license (http://creativecommons.org/licenses/by/4.0/).
Copyright: This open access article is published under a Creative Commons CC BY 4.0 license, which permit the free download, distribution, and reuse, provided that the author and preprint are cited in any reuse.


