Submitted:
10 June 2024
Posted:
11 June 2024
You are already at the latest version
Abstract
The Congo River Basin is the second-largest watershed globally, flowing through nine countries before reaching the Atlantic Ocean. The Kasai River Basin (KARB), containing about one-fourth of Congo’s freshwater resources, plays a strategic role in sustaining navigation, food production, and hydroelectricity generation in Central Africa. A multi-model framework suited for data scarce regions is applied for climate change impacts on water availability in the KARB to propose effective development plans in the future. This includes consideration of two conceptual hydrological models calibrated using four reanalysis datasets and fed with bias-corrected outputs of 19 climate models under two future Representative Climate Pathways (RCPs). Changes in mean annual discharge in the KARB from -18% to +3% are projected depending on the considered modeling configuration. This shows the sensitivity of impact assessment to the choice of models as well as input data. Moreover, about 9%, 18%, and 13% decline in streamflow signatures (Q10, Q50 and Q90) are projected based on the ensemble of models under RCP 8.5. A decrease of 14% and 5% in annual hydropower potential of the mainstream is estimated under RCPs 4.5 and 8.5, respectively. These changes in flows conditions should be considered in decision-making around constructing reservoirs and hydroelectricity generation.
Keywords:
Climate change
; Hydrological modeling
; Streamflow regime
; Reanalysis datasets
; Kasai River Basin
; Congo
1. Introduction
Central Africa is a strategic region globally [1,2], containing large tropical rainforests that are significant carbon sinks and play a critical role in mediating the effects of global warming [3]. The Congo River Basin in this region encompasses various countries and is the second largest watershed in the world that includes about one-third of Africa’s freshwater resources. Despite the abundant water budget, high potential for power production, and rich natural resources, the countries herein are the least economically developed and face various food and water security challenges [4,5]. On top of the existing problems, the hydroclimatic conditions of the region have been altered due to the warming climate, which makes sustainable development highly challenging. Alterations in numbers and periods of dry and wet days, reduction of water content in rainforests, multidecadal drying trends in streamflow, increase of temperature by 0.5 °C with a stronger increasing trend in minimum than maximum temperature and decline of rainfall by 9% during the 20th century are few examples of changes in the past few decades [6,7,8,9,10,11]. Continuation of changes in climate can cause severe socio-economic vulnerability in the region due to the lack of adequate infrastructure, industrialization, mismanagement, and political issues [10,12,13,14]. Therefore, understanding the impact of climate change on water availability in the Congo River Basin is essential to propose adaptive water and energy management policies [3].
The impact of climate change can be assessed using the so-called “top-down” approach [15] based on the projections of General Circulation Models (GCMs), which are downscaled to the spatial resolution of interest, and fed into impact assessment models [16]. The GCMs simulate the Earth’s physical processes using various mathematical equations, representing mass and energy transfer through the climate system [17]. Due to the inconsistency of GCMs projections and the complexity of the Congo River Basin’s climate system, using an ensemble of climate models is recommended for impact assessment [3,18,19]. Nevertheless, modeling the impact of climate change on water availability is highly challenging in the Congo River Basin. One of the main problems is the availability of sparse or low-quality hydroclimatic data in the watersheds [20,21]. Even if such data exist, they might be erroneous due to maintenance and operational issues, human errors, and environmental conditions [8,22]. Indeed, the number of active stations in the Congo Basin region has been significantly reduced since the independence of the countries in 1960 [23]. Escalating political issues, lack of infrastructure such as limited transportation networks, and a limited budget for operation and maintenance are other contributing factors for scarce hydroclimatic stations [21,24,25]. This makes hydrological representation of catchment physical processes difficult even under the historical conditions in these regions. Hence, some approaches such as regionalization [26], use of satellite-derived data [27] or reanalysis datasets [28] have been commonly utilized. Reanalysis is a systematic approach to generate grid-based climate data using data assimilation schemes and models that are fed by available observational data, which are provided from various sources such as satellites, buoys, aircrafts, and ship reports [29,30]. The improved quality and homogeneity of the reanalysis data make them a desirable choice for climate monitoring and research, as well as in commercial applications particularly in data-scarce regions [28,30]. The hydrological models using reanalysis can estimate river discharge as good as or even better than the ones using the station data [31,32]. Given the differences among reanalysis datasets attributed to the inter-model variability, assimilation approach, and available observations [9,25,33,34], using an ensemble of reanalysis datasets in hydrological modeling is suggested to reduce the related uncertainty.
In addition to limited data, the complexity of catchments including their size and remoteness can affect the choice of hydrological models for process representations too [35,36,37]. The conceptual models have shown acceptable performance and have been suggested to be used in climate change impact studies, specifically in data scares regions of the Congo River Basin, due to their simplicity and lower number of variables compared to the other types [34,38,39,40,41,42,43]. For instance, using GW-PITMAN, it is found that the streamflow characteristics will change in the future, but the magnitude and sign of change are not consistent over the basin [10,19,43,44]. Since the simulation of flow is sensitive to the structure of hydrological models, and different models may provide varying flow estimations, it is recommended to use more than one conceptual model for impact assessment [45,46,47,48,49].
This study aims to assess the impact of climate change on water availability in the Kasai River Basin (KARB; 897,500 km2), one of the key watersheds in the Congo River Basin, using an ensemble of state-of-the-art reanalysis data, two conceptual hydrological models, as well as multi-model climate projections under different future scenarios. Containing more than 25% of Congo’s freshwater resources with an average annual discharge of 11500 m3/s at the reaching point to the Congo River [50], the KARB plays a strategic role in Central Africa’s economic growth, with great potential in agriculture, hydropower, mining and navigation [51]. The almost unexploited hydropower resource (~ 68 GW) of the KARB, due to the financial, political, and infrastructural issues is considered as one of the prioritized components of the sustainable development plan in Africa [51]. However, the high sensitivity of this energy resource to alterations in the streamflow regime makes the hydropower production vulnerable to changing climatic conditions. Few studies have analyzed the performance of the water resources system in the KARB in the future [52,53,54]. While the existing studies over the Congo River Basin use a single hydrological model [e.g., 19,34,43], to the best of our knowledge a multi-model projection framework has been hindered for impact assessment over the KARB. The structure of the paper is as follows. In Section 2, the KARB and its major challenges in terms of water resources are described. Section 3 includes the framework of impact assessment, dataset and hydrological models used in this study. Section 4 presents the performance of hydrological models in the historical period and estimated flow conditions by the end of the century. The conclusions of the paper are highlighted in Section 5.
2. Case study
The Congo River Basin has an average annual discharge of 40,600 m3/s and covers an area of about 3.7 × 10⁶ km2 [55, see Figure 1]. It encompasses five sub-watersheds, among which the Kasai River Basin is one of the largest watersheds [7]. Around 72.4% of the KARB is located in Congo, and the remaining part (southwest) is in Angola [56]. The long-term average annual temperature of the basin is about 24°C [56], and rainfall varies from 1431 to 1515 mm per year [7]. The Kasai River (KAR), with a length of 2153 km, is the mainstream [52], originating from the Munyango headwaters in Angola [44]. The Kwango, Kwilu, and Loange on the left bank of the KAR and Sankuru and Lulua on the right bank are other key rivers in the KARB with an average flow of 2092, 1207, 427, 2500, and 502 m3/s, respectively [51]. These rivers confluence in Kutu Moke and have an average annual discharge of 8246 m3/s at the outlet [23, see Figure 1]. The main hydrometric station in the KARB is the Kutu-Moke covering a drainage area of 750,000 km2, about 20% of the Congo River Basin [44]. The basin’s mean annual rainfall, temperature, streamflow discharge, and drainage area are presented in Table 1.
Containing 360 million cubic meters of the Congo River Basin’s water budget per year, the KARB plays a key role in the water resource management of the region [50,57]. Currently, around 25% of the Democratic Republic of Congo’s population resides with unequal distribution in the KARB. While most of the population still lives in rural areas, urbanization has been considerable in recent decades [58]. Significant mining resources such as gold, diamonds, and other minerals exist in this region. Nevertheless, shifting agriculture is the primary source of income for most households, which highly depends on water availability in the area. In particular, food production is mostly based on rain-fed agriculture; therefore, any crisis in the basin’s water availability might threaten food security at the regional scale [59]. The basin is rich in flora and fauna and is home to various animal and fish species, including endangered habitats [58].
Despite the KARB’s potential for power production, agriculture and rich natural resources, many households have limited access to electricity, safe drinking water, and health services due to the poorly developed infrastructures and political issues [60]. Several rapids and waterfalls flowing into the deep valleys make the KAR and its tributaries strategic for not only navigation purposes but also for hydropower generation, which can promote the region’s energy supply. However, the only hydropower plant project in the advanced planning stage is the Katende hydroelectric dam, with a 64 Megawatts (MW) planned capacity [58].
As previously noted, changes in climate have already affected Central Africa, including the KARB. The Congo River has faced flow instability during the second half of the 20th century following a remarkable change by a sharp decline in the last decade [8,55,61,62]. In the KARB, rainfall intensity has dropped by around 9% from 1940 to 1999, with the change of annual rainfall from 1525 mm in 1920-1969 to 1388 mm during 1970-1990 [23]. Such alterations in precipitation have affected groundwater storage of the basin and have led to reductions in streamflow discharge [61], e.g., from 8606 m3/s in 1948-1991 to 6943 m3/s in 1992-2012 at Kutu-Moke [7].
Using the outputs of GCMs, an increase of between 2-6°C in temperature is projected in Central Africa in the 21st century [3,12,64]. Regarding the precipitation, the projections diverge considerably [12,65,66], and the changes are not homogenous over the basin. For instance, a decrease in precipitation in the south and a slight increase in the north are estimated [19]. As a result, no changes in annual average precipitation over the whole of Central Africa are projected [64]. However, for the KARB, the median of changes in annual total precipitation is projected to increase by around 10% in the late 21st century (2071-2100) under a high emission scenario. Reductions in precipitation during the dry seasons, i.e., June-July-August and September-October-November, are estimated [64]. The projected rise in temperature and the decrease or no change in the region’s precipitation may lead to prolonged and more frequent dry periods in the future [64]. Moreover, drought-prone areas in the KARB, including savanna parts of the Katanga and the Kasai plateau, are expected to experience seasonal water shortage in the near future [4].
Diverging changes in the streamflow regime in the KARB are estimated depending on the rainfall projections and utilized hydrological models [65,66]. For instance, using a global hydrological model with a spatial resolution of 0.5°, more than half of the GCMs in CMIP3 show a decrease in the average annual runoff by 2080 over the basin [67]. In another study, a marginal decrease in average annual runoff in the south and a slight increase (less than 10%) in other regions is projected using a macro-scale VIC hydrological model, forced with bias-corrected outputs of three GCMs in CMIP3 [68]. Such changes in flow make different sectors, including energy, food security, agriculture, environment and natural resources vulnerable due to their low adaptive capacity [14]. In these studies, the streamflow is simulated without considering routing through catchments, which may not properly represent flow series at a daily scale. Using a SWAT model for the Congo River Basin and considering an ensemble of GCMs, an increase in the mean seasonal runoff in wet seasons (from December to May) and a reduction in runoff during the dry period in the KARB (from Jun to November) but an overall increase in annual runoff of whole Congo River Basin is projected (Aloysius and Saiers [19]. Nevertheless, there are some limitations in the noted study, such as the calibration of the model using monthly data due to the lack of observed daily streamflow. While in our study, the climate change impacts are assessed utilizing the high-resolution GCMs projections, the focus is also on understanding the importance of using different hydrological model structures and calibration, which have not been done before for this case study to the best of our knowledge.
3. Materials and Methods
3.1. Framework for Climate Change Impact Assessment
Here, we applied a framework suited to the Central African Basins to assess the impact of climate change on the KARB, see Figure 2. As previously noted, for these scarce data regions, most studies suggest using an ensemble of reanalysis data for calibration of hydrologic models [21,24,29]. Therefore, in this study, a set of state-of-the-art reanalysis along with recorded climate data are used as input to hydrologic models. Moreover, HBV and GR4J hydrologic models are used to simulate natural streamflow, with the aim of addressing the inherent uncertainty of the hydrological models and avoiding divergence that may occur using a single model. The calibrated models using these data are forced with the outputs of an ensemble of GCMs under different future scenarios to project water availability by the end of the century. Accordingly, the changes in streamflow characteristics affecting hydropower production are investigated. The historical and future climatic data used in this study are described in Section 3.2 and 3.3, respectively. Section 3.4 represents the employed hydrological models and their calibration and validation procedures.
3.2. Station-Based and Reanalysis Datasets
The streamflow data in the outlet, Kutu-Moke station, is obtained from the International Commission for the Congo-Ubangi-Sangha Basin [23]. Regarding the climate data, the recorded daily precipitation as well as minimum and maximum temperature for the KARB are obtained from the National Meteorological Agency of the Democratic Republic of Congo. Table 1 shows the characteristics of these data. Moreover, the temperature and precipitation data of 4 reanalysis, namely, ERA5-land, CFSR, JRA55, and MERRA [24,69], are considered in this study, see Table 2.
The temporal variation of daily mean precipitation and temperature averaged over the KARB, as well as seasonal cycles of climatic data for each reanalysis product and observed data are presented in Figure 3. Boxplots and lines respectively contain daily and expected daily temperature and precipitation values over a 30-year period (1981-2010), respectively. Overall, it is evident that the range of reanalysis datasets is different from each other and observed values, in particular considering precipitation. This can be due to divergence in the assimilation schemes, ground data used in assimilation, and/or utilized forecast climate models [e.g., 33]. Considering the right panel, it is clear that over the Kasai watershed, there are two high precipitation periods during March-April-May (MAM) and September-October-November (SON). However, the magnitude of rainfall in these wet seasons varies among reanalysis; MERRA is the most inconsistent dataset, which shows higher differences relative to other datasets. CFSR presents the wettest rainy season, while the JRA-55 data shows the driest season among reanalysis. Considering the dry season from June to August (JJA), all reanalysis capture similar distribution rather than the wet season. Figure 3 shows that all datasets are more consistent in seasonal temperature variation than precipitation, yet the temperature variability in the MERRA is more than in others. Overall, reanalysis provides reliable precipitation and temperature data for the river flow simulation.
3.3. Climate Model Projections
The NASA Earth Exchange Global Daily Downscaled Projections dataset for 19 GCMs are used in this study [74]. The data include the maximum and minimum air temperature and precipitation with the spatial resolution of 0.25° from 1950 to 2100 for the historical and future periods. The projections are available under two Representative Concentration Pathways (RCPs) 4.5 and 8.5, corresponding to the intermediate mitigation and high emission scenarios, respectively [75]. The near-term (2021-2040), mid-term (2041-2070), and long-term (2071-2099) horizons are considered to better discuss the results of impact assessment in the future.
Here, the 19 GCMs simulations during the historical and future periods are compared with each other and reanalysis datasets in Figure 4. Overall, GCMs have a smaller variability than the reanalysis datasets, except MERRA, in the historical period, and GCMs have a closer median to ERA5-land. Regarding the temperature, historical GCMs are similar to ERA5-land and JRA-55 in terms of variability, with an almost identical median (around 24.5 °C). In general, our analysis reveals that there is a definite increase in temperature in the future ranging between 1.05-2.1°C and 1.3-4.0 °C under RCPs 4.5 and 8.5, respectively. These results are consistent with the findings of the previous studies [3,12,64]. Regarding the precipitation, a slight increase is expected in the long-term future. The median of projections during the future horizons ranges between 4.33-4.42 mm/day and 4.33-4.53 mm/day under low and high emission scenarios, respectively. These quantiles present around 1% to 6% increase in the median of daily precipitation with respect to the historical values.
3.4. Hydrological Models
As noted earlier, HBV-MTL and GR4J models are used to simulate daily streamflow in the KARB due to their simplicity and accuracy [76]. HBV is widely used [77,78] in climate change impact studies [34,39]. In particular, the model has shown considerable potential for streamflow estimation in ungauged basins [79,80]. HBV-MTL, a recently modified HBV model by [45], is used here. The main inputs to this model are daily precipitation, as well as maximum and minimum air temperature. The model consists of four main modules: soil moisture, surface runoff, interflow, and baseflow reservoirs. The precipitation, either rainfall or snowmelt, enters the soil moisture module. This module evaluates effective rainfall contributing to surface runoff, or the water infiltrates the soil used by vegetation through evapotranspiration. The evapotranspiration is estimated using the Hargreaves method (Hargreaves & Samani, 1985) because of its simplicity and minimum data requirements compared to other methods, especially in such a data-scarce region [81]. The remaining water in the soil is stored in two conceptual reservoirs, the so-called intermediate and deep soil layer, which gradually releases and forms the intermediate and base flow. Finally, the flow at the watershed outlet is stimulated by the accumulation of direct runoff, intermediate flow, and base flow routed through a triangle delay function. For more information about model structure and equations, see Sharifinejad, Hassanzadeh and Zaerpour [45].
The GR4J is a lumped model which estimates runoff based on daily temperature, precipitation, and potential evapotranspiration data. Unlike HBV, in GR4J, the net precipitation obtained by subtracting potential evapotranspiration from precipitation is divided into two portions. The model consists of three modules, namely production storage, routing storage, and two unit-hydrograph functions. First, a portion of net precipitation is stored in the production storage, from which the water percolates gradually, dependent on the soil moisture capacity. Meanwhile, some of the stored water used by vegetation lead to evapotranspiration. The other portion of the net precipitation integrates with the percolated water from production storage and contributes to the routing storage through unit hydrographs. Indeed, the unit hydrographs in the model address the lag time between precipitation and streamflow generation. In this stage, 10% of the existing water (runoff) is directly routed to the outlet using a two-sided unit hydrograph, while the remaining 90% is routed indirectly through the groundwater exchange using a one-sided unit hydrograph. More details about the model structure and equations can be found in Perrin, et al. [82].
The model parameterization includes a few steps. In brief, the data during the historical period is divided into three parts for model warm-up, calibration, and validation. The first year of data is used for warm-up to allow model states to tune out based on the initial conditions of the watershed [78,83]. The 66% and 34% of the remaining data are used for model calibration and validation, respectively, based on the split-sample test [45,84]. The two hydrological models are calibrated against observed streamflow using an ensemble of climate datasets during the historical period, including station-based data as well as four reanalysis, ERA5-land, CFSR, JRA55 and MERRA. Accordingly, the models’ performance is evaluated based on the Kling-Gupta Efficiency (KGE) measure [85], and the value of parameters are obtained for each model. The KGE presents a more comprehensive comparison between the estimated and observed values using different statistical criteria, namely standard deviation, mean and Pearson correlation coefficient, which are shown as α, β and r in the following equations (Eqs1, 2, and 3). As shown in Eq. 4, these criteria are combined in the KGE in a more balanced way using the Euclidean distance measure compared to other measures such as Nash-Sutcliffe Efficiency [86]. The calibration and evaluation of the models are done considering this measure at daily and annual scales (Eq. 5). In Equation 1 to 3, and are the standard deviation of simulated and observed flow, and are the mean simulated and observed flow, and are simulated and observed flow, respectively.
The Shuffled Complex Evolution algorithm (SCE-UA) is used to calibrate the hydrological models [87,88]. In this method, the optimized parameter set is found based on a combination of random [89] and deterministic approaches [90], clustering [91] and competitive evolution [92]. The optimized parameter sets are found in a natural evolution process through a global search. A population (parameter sets) is randomly sampled from the feasible space and then partitioned into several complexes that will evolve independently through the complex, competitive evolution technique. To avoid reaching local optima, the entire population is shuffled, and the information of complexes is shared. These processes are repeated since the convergence criteria are satisfied. In this study, 50 populations are selected randomly from the feasible space based on the parameter sets’ range and are divided into five complexes. The evolution and shuffling of the independent complexes are repeated until the maximum iteration of 100. As a result, the best parameter sets with the smallest value for the considered objective function (Eq. 5) are obtained. This ensemble of parameter set is called “optimal parameter set” leading into “optimal flow simulation”. Beside the use of global optimization in calibration of the models, to avoid the probable underestimation of the parametric uncertainty [93,94], the Generalized Likelihood Uncertainty Estimation (GLUE) is used [95,96,97]. GLUE is a statistical method employed in hydrological modeling for quantification of uncertainty attributed to the model parameters. Hence, instead of having one optimal parameter sets, there will be a range of acceptable parameter sets based on considered objective function. For this purpose, the initial parameter sets are selected randomly from the feasible range of parameters using a uniform probability distribution. The KGE is used as the statistical criteria to quantify the closeness of simulated and observed flow and find the acceptable parameter sets. Considering both daily and annual scale the value of KGE should be larger than 0.5 to select the “acceptable parameter sets”. 10000 iterations are considered to generate the parameter sets. Using these “acceptable parameter sets”, an ensemble of “acceptable streamflow” for each model are estimated.
4. Results
4.1. Performance of the Hydrological Models during the Historical Period
Based on the availability of daily streamflow and climate datasets, 1980-1991 is considered as the historical period for streamflow simulation. The HBV and GR4J models are calibrated using the observed as well as four reanalysis datasets. The performance of these models in reproducing the observed streamflow is assessed using the KGE measure, see Table S1 in the Supplementary Materials. The low KGE values, i.e., less than 0.4 and 0.2 for HBV and GR4J models, are not acceptable, which can be attributed to the low quality of the observed station-based data, demystified in various studies [19,35]. Hence, these models are not considered for impact assessment. However, the calibrated models using the reanalysis datasets provide reasonable results. Figure 5 shows the daily and annual time series of the observed and simulated flow using HBV (left) and GR4J (right) models fed with the four reanalysis datasets during the calibration and validation periods, respectively. Considering the simulations, both the optimal and an ensemble of acceptable flow series, corresponding to their parameter conditions, noted in Section 3.4, are presented. Both seasonality in discharge and overall distribution of discharge (monthly hydrograph) are simulated well. Moreover, the KGE values above 0.5 for all 8 configurations indicate that these models perform better than the calibrated models using the observed data, which is concluded by other researchers as well [31,32].
However, the performance of the models varies depending on the applied reanalysis datasets for calibration as well as the considered hydrological model [98,99]. Considering both daily and annual time series, it seems that the calibrated models with ERA5-land datasets perform better, in particular, in representing the peak flow timing and magnitude and low flows. Conversely, the models calibrated with MERRA show a larger discrepancy in estimating flow discharge. The impact of input data on flow simulation is more evident at the annual scale. For instance, both HBV and GR4J models using the CFSR dataset continuously underestimate the annual flow during the historical period, while the calibrated models using JRA-55 estimate streamflow more accurately than with the CFSR dataset. It is noteworthy to mention that the ERA5-based models more precisely simulate annual flow by around half relative error than other datasets. Besides the input data, it is clear that the structure of the hydrological models is critical in simulating streamflow. For instance, using the MERRA dataset, the HBV model during the validation period (1989-1991) underestimates annual flow while the GR4J model overestimates it. In addition, the GR4J model better reproduces the daily flow with a lower relative bias (0.05) than HBV (0.1) and a higher Correlation Coefficient by 0.05 difference, given the ERA5-land dataset. Considering the long-term annual hydrograph of simulated and observed flow (Figure 6), in the wet season (March-April-May), the HBV model calibrated with ERA5 simulates high flows more accurately than other models (with 2% bias respecting the observed ones), while GR4J with the same dataset (ERA5-land) show a larger difference in the simulated peak flow with observations by around 7% bias. Meanwhile, the largest bias in estimated flow in the wet season is related to the GR4J model calibrated using the CFSR.
To better understand the differences between the models, the envelopes of simulated flow considering all reanalysis using HBV and GR4J are shown in Figure 7 in the top and bottom rows, respectively. Considering the ensemble of acceptable flow, the GR4J model presents a wider range of values and overestimates daily flows than the HBV model. During the wet season, GR4J estimates higher values for annual peak flow, e.g., greater than 15000 m3/s, while the low flows are approximately the same for both models. It is evident that the shape of the annual hydrograph obtained from the HBV model is more consistent with the observed one, in particular in the first quarter of the year. However, the difference between the two models, HBV and GR4J, is negligible (less than 5% difference considering the mean annual hydrographs). Since the differences among the performance of these 8 configurations are not significant, all of them are used for impact assessment.
4.2. Projected Streamflow Conditions under Changing Climate
The outputs of 19 climate models under RCPs 4.5 and 8.5 are fed to these eight hydrological models to estimate the flow in the KARB during the future horizons. The observed and projected mean annual streamflow hydrographs at the basin’s outlet under RCP8.5 using HBV and GR4J models calibrated with four reanalysis are presented in Figure 8. The right panel in this figure shows all projected flows under these 8 configurations. The results for RCP4.5 are depicted in Figure S1 in the Supplementary Materials. Overall, the models show changes in flow conditions; however, the estimated rate of change depends on the considered modeling configuration. For instance, the rate of decrease is more considerable based on the HBV than GR4J model. Indeed, the projected flow using GR4J, an ensemble of 4 configurations, presents no change in the near term and midterm future and a slight increase in the long term under a high emission scenario. Such divergence between the results of these two models can be logical due to the noted differences in the structure and performance of these models during the historical period.
Considering the impact of reanalysis, the models calibrated using ERA5-land, CFSR, and JRA-55 show almost similar hydrographs. In contrast, MERRA-based models have considerably different hydrographs in shape and high flow magnitudes showing an increase in future high flows. The mean of projections based on all 8 model configurations (right panel) reveals a slight decline in streamflow volume with no change in peak flow timing at the outlet of KARB under RCP 8.5. Regarding the RCP 4.5, one week earlier peak flow is projected for the mean annual flow during all future horizons. This reduction in flow might be due to a decrease in rainfall and an increase in the evapotranspiration caused by temperature rise. These findings are consistent with the previous studies for the Congo River Basin [19,64,67,68]. For instance, Aloysius and Saiers [19] estimated prolonged periods of low flow and runoff decline in the southern headwater areas due to rainfall decrease in comparison to their reference period of 1986-2005. They also found a runoff increase of 10.4% over the whole southwestern region under RCP8.5 during 2046-2065.
Such decreases in streamflow discharge can affect water resources management in the KARB. Here, the changes in 90th (Q90), 50th (Q50), and 10th (Q10) percentiles of flow are analyzed to have a better understanding of flow conditions in the future based on individual and all model configurations. For this purpose, the observed (recorded) and simulated annual flow duration curves (i.e., empirical cumulative probability distributions of flow in each year) are found during the historical and future horizons. The long-term mean annual quantiles for the observed flow are calculated by averaging these values over the historical period. Regarding the future period, the annual values are found under each and all 8 model configurations considering the optimal and acceptable parameter sets under RCPs 4.5 and 8.5 and 19 GCM outputs. The relative changes between these future annual quantiles under RCPs 8.5 and 4.5 and the long-term historical value are presented in Figure 9 and Figure S2 in the Supplementary Materials, respectively. The results are shown per model configuration, as well as the ensemble of values per each hydrological model, followed by a boxplot containing values per all configurations.
While an overall decrease in all three flow signatures is projected considering the ensemble of all eight models, the magnitude and sign of change vary among configurations. Interestingly, considering the long-term horizon under RCP 8.5, the high flow is expected to decrease by 40% by HBV-ERA5 and 22% by GR4J-ERA5, whereas the MERRA-based models estimate an increase of 50% by HBV and 57% by GR4J for Q50. Indeed, the model calibrated with MERRA datasets shows completely different changes than the models calibrated with other reanalysis datasets. This model overestimates the high flows during the historical period too. Figure 9 also shows that the GR4J-based models estimate a larger range of change in quantile than HBV ones. Moreover, although both models project a decline in Q10, Q50 and Q90 in all future horizons; the percentage of reduction based on HBV models is more intense. For example, the Q50 is projected to decrease on average by -23% based on HBV and -1% by GR4J models under RCP 8.5 and in the late century. The results based on all model configurations (black boxplot) reveal a decline of 9%, 18%, and 13% for the low, median, and high flow, respectively, under RCP 8.5. These ranges of reduction are larger under RCP4.5, i.e., -24% for Q10, -28% for Q50 and -25% for Q90, respectively, see Figure S2 in the Supplementary Materials. This is mainly because of the higher rate of increase in mean precipitation relative to the historical period under RCP8.5 than RCP4.5, see Figure 4(a).
As previously noted, the values of high flows are particularly important for the estimation of potential hydropower production in this region. Therefore, here the trend in annual Q90 is analyzed over 2021-2100, which is estimated using the individual and all model configurations, given the acceptable and optimal parameter sets, fed by 19 GCM outputs under RCPs 4.5 and 8.5, see Figure 10. The long-term average annual Q90 equal to 12030 m3/s during the historical period is shown as the benchmark (reference value). The projected trend in high flow by the ensemble of models reveals a slight decline in hydropower potential. It is apparent that the estimated values and trends of Q90 in the future significantly differ among the model configurations. In particular, the MERRA-based model notably shows a different trend than others. The calibrated models with ERA5-land and JRA-55 estimate a decrease in high flow over the whole century under both scenarios. Besides, it is noteworthy to mention that the estimated Q90 values by the GR4J using CFSR show almost no change under RCP 4.5 and slight increase under RCP 8.5 from the mid to the end of the century. In comparison, the trendline for Q90 based on the HBV-CFSR model remains below the reference level over the whole century under both emission scenarios. Indeed, the expected values of Q90 based on all models (right panels) remains below the reference level under RCP4.5, whereas it reaches the long-term historical quantile by 2058 and slightly increases by the end of the century under RCP8.5.
Mann-Kendall trend test [100], a commonly-used nonparametric method in climate analysis [see Kaemo et al., 2022; 101], is employed to understand the trend and determine its significance. The p-values and trend slope of expected future annual Q90 calculated for individual, and all configurations are presented in Table S2 in the Supplementary Materials. The results of the significance test reveal an increasing trend in high flow based on the ensemble of all models under both RCPs 4.5 and 8.5 with the significance level of 0.05 and p-value of 4.5E-10 and 1.5E-18, respectively. Notably the slope of trend line under RCP8.5 is double compared to RCP4.5. These changes in streamflow conditions, particularly high flows, mean that the decisions around constructing reservoirs and hydroelectricity generation should take into account the impacts of climate change.
Here, the gross hydropower potential for both present and future periods is estimated to provide an overall indication of the relative changes in the basin [102,103]. The amount of hydropower generated from the flow with the discharge of Q and head difference of H can be estimated by , where P is the power, ρ is the density of water, g is the gravity acceleration, and ղ is the overall efficiency of the turbine. The theoretical hydropower production is estimated by considering the natural drop of the KARB mainstream for the head, which is 1120 m [51]. The mean of annual high flow (Q90) obtained from the ensemble of all of 8 model configurations in the future is used as Q, which is equal to 10332 and 11436 m3/s under RCPs 4.5 and 8.5, respectively. Accordingly, the relative change in the theoretical hydroelectric generation between future and historical periods is calculated. Assuming that the efficiency coefficient of 0.7 is resealable, the result reveals that the theoretical potential of the basin will decrease by around 14% and 5% under RCP4.5 and RCP8.5, respectively, in the long-term future. Such changes in hydropower potential should be considered in energy supply and development plans.
5. Summary and Conclusions
This study assesses the possible impacts of climate change on streamflow characteristics and hydropower potential using a multi-model framework over the KARB, an important watershed in the Congo River Basin, Central Africa. For this purpose, two conceptual hydrological models, HBV and GR4J, which are calibrated using four reanalysis products, are fed with 19 GCMs’ bias-corrected outputs under two emission scenarios, RCPs 4.5 and 8.5. Results reveal that both hydrological models calibrated with different reanalysis datasets can simulate the observed flow in the KARB with acceptable performance. Considering both daily and annual time series, the calibrated models with ERA5-land datasets perform better, particularly in representing the peak flow timing and magnitude and low flows. Our simulations under climate change scenarios show that flow discharge is likely to decrease with no change in peak timing and seasonality. However, the estimated magnitude of change depends on the considered configuration, i.e., hydrological model and the reanalysis dataset used for calibration and the future scenario. Overall, changes in mean annual discharge ranging from −18% to +3% at the outlet of the basin in the future is estimated in comparison to observed values. Among model configurations, MERRA-based models and GR4J-CFSR-based models show an increase in annual hydrographs while others are similar with a declining trend. Considering flow signatures, while an overall decrease in all three quantiles (Q10, Q50, and Q90) is projected based on the ensemble of all 8 modeling configurations, the magnitude and sign of change vary among configurations. Given the importance of high flow (Q90) in hydropower potential analysis, our analysis reveals that Q90 will be decreased by 25% and 13% under RCPs 4.5 and 8.5, respectively, with respect to the long-term average historical value. Consequently, the theoretical hydropower potential is expected to decline by 14% and 5% under low and high emission scenarios, respectively. In addition, trend analysis reveals that annual power potential follows a significant increasing trend between 2021-2100 based on the ensemble of all models with a p-value of 4.5E-10 and 1.5E-18. Although the mean annual flow’s magnitude is below the reference line (long-term average historical value) during the future period, its trend is positive toward the end of the century. Moreover, although the projections show a decline in annual high flow, these decreased rates are not likely to make a major water supply issue for hydropower generation. Based on the ensemble of all models, the average decrease in low flow (Q10) is projected by 24% and 9% in the long-term future under RCP4.5 and RCP8.5, respectively. This decline in low flow might affect navigation, which has already been threatened by climate change over the KARB, reported by CICOS [104]. The changes in low and high flow can also have implications for aquatic life, channel maintenance, and flooding. Hence, the water managers should consider these changes in policymaking and water allocations.
Our study is the first step toward a multi-model climate change impact assessment in the Congo River Basin and has some limitations. In the future research with the ongoing field measurements that CICOS has planned within the KARB, one may apply hydrological models with different catchment representations (both lumped and semi-distributed models) or include more models to estimate flow. Furthermore, in this study, the GCMs outputs based on CMIP5 project is used. It is recommended to use other climate model outputs that are recently released, i.e., CMIP6, to better highlight the probable future conditions of the basin. Such analysis in the context of the applied framework can also be extended to analyze the vulnerability of other catchments in the Congo River Basin to provide an integrated impact assessment within the whole basin conditions. This integration can provide policymakers with more comprehensive knowledge for water resources, energy, agriculture and ecosystem management. Notably, the flow projections of this study account for changing climate and can be considered a part of an investigation of multiple stressors on water resources. It is also suggested that other key aspects such as population growth and rising water demand be considered in the development of adaptation policies.
Author Contributions
Conceptualization, S.L., E.H., and M.F; methodology, S.L., S.Z., E.H., A.S., and M.F; validation, S.L. S.Z. E.H., and M.F; formal analysis, S.L.; investigation, S.L; resources, S.L., S.Z., E.H., A.S., and M.F and E.H.; data curation, S.L.; writing—original draft preparation, S.L and E.H.; writing—review and editing, S.L., S.Z., E.H., A.S., and M.F; visualization, S.L. A.S., E.H; supervision, E.H. and M.F; project administration, E.H., and M.F. All authors have read and agreed to the published version of the manuscript.
Funding
This research was partly funded by NSERC (RGPIN-06979-2020), held by the fourth author.
Data Availability Statement
The historical hydrometric data for the outlet, Kutu-Moke station, was obtained from the International Commission for the Congo-Ubangi-Sangha Basin (CICOS). Regarding the climate data, the recorded daily precipitation as well as minimum and maximum temperature for the KARB was obtained from the National Meteorological Agency (METTELSAT) of the Democratic Republic of Congo. The temperature and precipitation data for four reanalyses, namely ERA5-land, CFSR, JRA55, and MERRA, are freely available from the following sources: • ERA5-land: https://www.ecmwf.int/node/18714, accessed on 10 October 2018 • CFSR: http://cfs.ncep.noaa.gov/cfsr/, accessed on 17 August 2018 • JRA55: https://rda.ucar.edu/datasets/ds628.0, accessed on 10 August 2018 • MERRA: https://disc.sci.gsfc.nasa.gov/mdisc, accessed on 02 August 2018. The climate model projections are freely available from NASA Earth Exchange Global Daily Downscaled Projections at https://www.nccs.nasa.gov/services/data-collections/land-based-products/nex-gddp, accessed on 7 July 2021.
Acknowledgments
Not applicable.
Conflicts of Interest
The authors declare no conflicts of interest.
References
- Laraque, A.; N'kaya, G.D.M.; Orange, D.; Tshimanga, R.; Tshitenge, J.M.; Mahé, G.; Nguimalet, C.R.; Trigg, M.A.; Yepez, S.; Gulemvuga, G. Recent Budget of Hydroclimatology and Hydrosedimentology of the Congo River in Central Africa. Water 2020, 12, 2613. [Google Scholar] [CrossRef]
- Runge, J. The Congo River, Central Africa. Large Rivers: Geomorphology and Management, Second Edition 2022, 433-456.
- Aloysius, N.R.; Sheffield, J.; Saiers, J.E.; Li, H.; Wood, E.F. Evaluation of historical and future simulations of precipitation and temperature in central Africa from CMIP5 climate models. Journal of Geophysical Research: Atmospheres 2016, 121, 130–152. [Google Scholar] [CrossRef]
- UNEP. Water Issues in the Democratic Republic of the Congo Challenges and Opportunities; 2011.
- IPCC. Climate Change 2021: The Physical Science Basis. Contribution of Working Group I to the Sixth Assessment Report of the Intergovernmental Panel on Climate Change [Masson-Delmotte, V., P. Zhai, A. Pirani, S.L. Connors, C. Péan, S. Berger, N. Caud, Y. Chen, L. Goldfarb, M.I. Gomis, M. Huang, K. Leitzell, E. Lonnoy, J.B.R. Matthews, T.K. Maycock, T. Waterfield, O. Yelekçi, R. Yu, and B. Zhou (eds.)]. Cambridge University Press. In Press. 2021.
- Sidibe, M.; Dieppois, B.; Mahé, G.; Paturel, J.-E.; Amoussou, E.; Anifowose, B.; Lawler, D. Trend and variability in a new, reconstructed streamflow dataset for West and Central Africa, and climatic interactions, 1950–2005. Journal of Hydrology 2018, 561, 478–493. [Google Scholar] [CrossRef]
- Moukandi, G.; Laraque, A.; Paturel, J.-E.; Gulemvuga, G.; Mahe, G.; Tshimanga, R. A new look at hydrology in the Congo Basin, based on the study of multi-decadal chronicles; 2020; 10.1002/essoar.10505510.1.
- Diem, J.E.; Ryan, S.J.; Hartter, J.; Palace, M.W. Satellite-based rainfall data reveal a recent drying trend in central equatorial Africa. Climatic Change 2014, 126, 263–272. [Google Scholar] [CrossRef]
- Nicholson, S.E.; Klotter, D.; Dezfuli, A.K.; Zhou, L. New Rainfall Datasets for the Congo Basin and Surrounding Regions. Journal of Hydrometeorology 2018, 19, 1379–1396. [Google Scholar] [CrossRef]
- CSC. Climate Change Scenarios for the Congo Basin. [Haensler A., Jacob D., Kabat P., Ludwig F. (eds.)]. Climate Service Centre Report No. 11, Hamburg, Germany, ISSN: 2192-4058. 2013.
- IPCC. Summary for Policymakers. In Climate Change 2013 – The Physical Science Basis: Working Group I Contribution to the Fifth Assessment Report of the Intergovernmental Panel on Climate Change, Intergovernmental Panel on Climate, C., Ed. Cambridge University Press: Cambridge, 2014; pp. 1-30. 10.1017/CBO9781107415324.004.
- Niang, I.; Ruppel, O.C.; Abdrabo, M.A.; Essel, C.; Lennard, C.; Padgham, J.; Urquhart, P.; Descheemaeker, K.K.E. Chapter 22 Africa. In: Climate Change 2014: Impacts, Adaptation, and Vulnerability. Part B: Regional Aspects. Contribution of Working Group II to the Fifth Assessment Report of the Intergovernmental Panel on Climate Change. 2014; 10.1017/CBO9781107415386.002pp. 1199-1265.
- Schneider, S.H.; Semenov, S.; Patwardhan, A.; Burton, I.; Magadza, C.H.D.; Oppenheimer, M.; Pittock, A.B.; Rahman, A.; Smith, J.B.; Suarez, A.; et al. Assessing key vulnerabilities and the risk from climate change. Climate Change 2007: Impacts, Adaptation and Vulnerability. Contribution of Working Group II to the Fourth Assessment Report of the Intergovernmental Panel on Climate Change, M.L. Parry, O.F. Canziani, J.P. Palutikof, P.J. van der Linden and C.E. Hanson, Eds., Cambridge University Press, Cambridge, UK, 779-810. 2007.
- Boko, M.; Niang, I.; Nyong, A.; Vogel, C.; Githeko, A.; Medany, M.; Osman-Elasha, B.; Tabo, R.; Yanda, P. Africa. Climate change 2007: impacts, adaptation and vulnerability. Contribution of working group II to the fourth assessment report of the intergovernmental panel on climate change. Cambridge, UK: Cambridge University Press, Cambridge 2007, 433-467.
- Bhave, A.G.; Mishra, A.; Raghuwanshi, N.S. A combined bottom-up and top-down approach for assessment of climate change adaptation options. Journal of Hydrology 2014, 518, 150–161. [Google Scholar] [CrossRef]
- Sorland, S.L.; Schar, C.; Luthi, D.; Kjellstrom, E. Bias patterns and climate change signals in GCM-RCM model chains. Environmental Research Letters 2018, 13. [Google Scholar] [CrossRef]
- Hannah, L. Chapter 2 - The Climate System and Climate Change. In Climate Change Biology (Second Edition), Hannah, L., Ed. Academic Press: Boston, 2015; 10.1016/B978-0-12-420218-4.00002-0pp. 13-53.
- Chen, J.; Brissette, F.P.; Leconte, R. Uncertainty of downscaling method in quantifying the impact of climate change on hydrology. Journal of Hydrology 2011, 401, 190–202. [Google Scholar] [CrossRef]
- Aloysius, N.; Saiers, J. Simulated hydrologic response to projected changes in precipitation and temperature in the Congo River basin. Hydrol Earth Syst Sc 2017, 21, 4115–4130. [Google Scholar] [CrossRef]
- Sidibe, M.; Dieppois, B.; Eden, J.; Mahé, G.; Paturel, J.-E.; Amoussou, E.; Anifowose, B.; Van De Wiel, M.; Lawler, D. Near-term impacts of climate variability and change on hydrological systems in West and Central Africa. Climate Dynamics 2020, 54, 2041–2070. [Google Scholar] [CrossRef]
- Zhou, L.; Tian, Y.; Myneni, R.B.; Ciais, P.; Saatchi, S.; Liu, Y.Y.; Piao, S.; Chen, H.; Vermote, E.F.; Song, C.; et al. Widespread decline of Congo rainforest greenness in the past decade. Nature 2014, 509, 86–90. [Google Scholar] [CrossRef] [PubMed]
- Samba, G.; Nganga, D.; Mpounza, M. Rainfall and temperature variations over Congo-Brazzaville between 1950 and 1998. Theoretical and Applied Climatology 2008, 91, 85–97. [Google Scholar] [CrossRef]
- Laraque, A.; Moukandi, G.; Orange, D.; Tshimanga, R.; Jean Marie, T.; Mahe, G.; Nguimalet, C.-R.; Trigg, M.; Yépez, S.; Gulemvuga, G. Recent Budget of Hydroclimatology and Hydrosedimentology of the Congo River in Central Africa. Water 2020, 12(9), 2613. [Google Scholar] [CrossRef]
- Hua, W.; Zhou, L.; Nicholson, S.E.; Chen, H.; Qin, M. Assessing reanalysis data for understanding rainfall climatology and variability over Central Equatorial Africa. Climate Dynamics 2019, 53, 651–669. [Google Scholar] [CrossRef]
- Washington, R.; James, R.; Pearce, H.; Pokam, W.M.; Moufouma-Okia, W. Congo Basin rainfall climatology: can we believe the climate models? Philosophical Transactions of the Royal Society B: Biological Sciences 2013, 368, 20120296. [Google Scholar] [CrossRef] [PubMed]
- Beck, H.E.; van Dijk, A.I.J.M.; de Roo, A.; Miralles, D.G.; McVicar, T.R.; Schellekens, J.; Bruijnzeel, L.A. Global-scale regionalization of hydrologic model parameters. Water Resources Research 2016, 52, 3599–3622. [Google Scholar] [CrossRef]
- Huang, Q.; Qin, G.; Zhang, Y.; Tang, Q.; Liu, C.; Xia, J.; Chiew, F.H.S.; Post, D. Using Remote Sensing Data-Based Hydrological Model Calibrations for Predicting Runoff in Ungauged or Poorly Gauged Catchments. Water Resources Research 2020, 56, e2020WR028205. [Google Scholar] [CrossRef]
- Ghebrehiwot, A.; Kozlov, D. Reanalysis dataset-based hydrologic predictions for ungauged basins; 2021; Vol. 264, pp. 01001.
- Bosilovich, M.G.; Chen, J.; Robertson, F.R.; Adler, R.F. Evaluation of Global Precipitation in Reanalyses. Journal of Applied Meteorology and Climatology 2008, 47, 2279–2299. [Google Scholar] [CrossRef]
- Parker, W.S. Reanalyses and Observations: What’s the Difference? Bulletin of the American Meteorological Society 2016, 97, 1565–1572. [Google Scholar] [CrossRef]
- Essou, G.R.C.; Sabarly, F.; Lucas-Picher, P.; Brissette, F.; Poulin, A. Can Precipitation and Temperature from Meteorological Reanalyses Be Used for Hydrological Modeling? Journal of Hydrometeorology 2016, 17, 1929–1950. [Google Scholar] [CrossRef]
- Fuka, D.R.; Walter, M.T.; MacAlister, C.; Degaetano, A.T.; Steenhuis, T.S.; Easton, Z.M. Using the Climate Forecast System Reanalysis as weather input data for watershed models. Hydrological Processes 2014, 28, 5613–5623. [Google Scholar] [CrossRef]
- Lin, R.; Zhou, T.; Qian, Y. Evaluation of Global Monsoon Precipitation Changes based on Five Reanalysis Datasets. Journal of Climate 2014, 27, 1271–1289. [Google Scholar] [CrossRef]
- Hamududu, B. Impacts of Climate Change on Water Resources and Hydropower Systems: in central and southern Africa. Doctoral, Norwegian University of Science and Technology, Norway, 2012.
- Tshimanga, R.M.; Hughes, D.A. Basin-scale performance of a semidistributed rainfall-runoff model for hydrological predictions and water resources assessment of large rivers: The Congo River. Water Resources Research 2014, 50, 1174–1188. [Google Scholar] [CrossRef]
- Munzimi, Y.A.; Hansen, M.C.; Asante, K.O. Estimating daily streamflow in the Congo Basin using satellite-derived data and a semi-distributed hydrological model. Hydrological Sciences Journal 2019, 64, 1472–1487. [Google Scholar] [CrossRef]
- Asante, K.O.; Arlan, G.A.; Pervez, M.S.; Rowland, J. A linear geospatial streamflow modeling system for data sparse environments. International Journal of River Basin Management 2008, 6, 233–241. [Google Scholar] [CrossRef]
- Chen, J.; Brissette, F.P.; Chaumont, D.; Braun, M. Performance and uncertainty evaluation of empirical downscaling methods in quantifying the climate change impacts on hydrology over two North American river basins. Journal of Hydrology 2013, 479, 200–214. [Google Scholar] [CrossRef]
- Nonki, R.M.; Lenouo, A.; Lennard, C.J.; Tchawoua, C. Assessing climate change impacts on water resources in the Benue River Basin, Northern Cameroon. Environmental Earth Sciences 2019, 78, 606. [Google Scholar] [CrossRef]
- dos Santos Franciane, M.; de Oliveira Rodrigo, P.; Mauad Frederico, F. Lumped versus Distributed Hydrological Modeling of the Jacaré-Guaçu Basin, Brazil. Journal of Environmental Engineering 2018, 144, 04018056. [Google Scholar] [CrossRef]
- Her, Y.; Chaubey, I. Impact of the numbers of observations and calibration parameters on equifinality, model performance, and output and parameter uncertainty. Hydrological Processes 2015, 29, 4220–4237. [Google Scholar] [CrossRef]
- Singh, S.; Marcy, N. Comparison of Simple and Complex Hydrological Models for Predicting Catchment Discharge Under Climate Change. AIMS Geosciences 2017, 3, 467–497. [Google Scholar] [CrossRef]
- Tshimanga, R.M.; Hughes, D.A. Climate change and impacts on the hydrology of the Congo Basin: The case of the northern sub-basins of the Oubangui and Sangha Rivers. Physics and Chemistry of the Earth, Parts A/B/C 2012, 50-52, 72–83. [Google Scholar] [CrossRef]
- Tshimanga, R.M. Hydrological uncertainty analysis and scenario-based streamflow modelling for the Congo River Basin. Doctoral, Rhodes University, South Africa, 2012.
- Sharifinejad, A.; Hassanzadeh, E.; Zaerpour, M. Assessing water system vulnerabilities under changing climate conditions using different representations of a hydrologic system. Hydrological Sciences Journal 2021, 1–17. [Google Scholar] [CrossRef]
- Ludwig, R.; May, I.; Turcotte, R.; Vescovi, L.; Braun, M.; Cyr, J.F.; Fortin, L.G.; Chaumont, D.; Biner, S.; Chartier, I.; et al. The role of hydrological model complexity and uncertainty in climate change impact assessment. Advances in Geosciences 2009, 21, 63–71. [Google Scholar] [CrossRef]
- Yaghoubi, M.; Massah Bavani, A.R. Sensitivity analysis and comparison of capability of three conceptual models HEC-HMS, HBV and IHACRES in simulating continuous rainfall-runoff in semi-arid basins. Journal of the Earth and Space Physics 2014, 40, 153–172. [Google Scholar] [CrossRef]
- Seiller, G.; Anctil, F.; Perrin, C. Multimodel evaluation of twenty lumped hydrological models under contrasted climate conditions. Hydrol Earth Syst Sc 2012, 16, 1171–1189. [Google Scholar] [CrossRef]
- Viney, N.R.; Bormann, H.; Breuer, L.; Bronstert, A.; Croke, B.F.W.; Frede, H.; Gräff, T.; Hubrechts, L.; Huisman, J.A.; Jakeman, A.J.; et al. Assessing the impact of land use change on hydrology by ensemble modelling (LUCHEM) II: Ensemble combinations and predictions. Advances in Water Resources 2009, 32, 147–158. [Google Scholar] [CrossRef]
- Becker, M.; Papa, F.; Frappart, F.; Alsdorf, D.; Calmant, S.; da Silva, J.S.; Prigent, C.; Seyler, F. Satellite-based estimates of surface water dynamics in the Congo River Basin. International Journal of Applied Earth Observation and Geoinformation 2018, 66, 196–209. [Google Scholar] [CrossRef]
- GEIDCO. Global Energy Interconnection Development and Cooperation Organization, Research on Hydropower Development and Delivery in Congo River, ; 2020. [CrossRef]
- Devroey, E. Le Kasai et son bassin hydrographique / par E. Devroey; Goemaere: Bruxelles, 1939. [Google Scholar]
- Kisangala, M.; Ntombi, M.K. Estimation des réserves régulatrices et établissement de la courbe de tarissement du bassin versant du Kasaï durant la période d’étiage à l’échelle de Lumbu. Revue Congolaise des Sciences Nucléaires 2012, 26. [Google Scholar]
- Ntombi, M.K.; Kisangala, M. Impact de la lithologie et de l’hydrométrie sur la navigabilité du Kasaï en R. D. Congo. Annales de la Faculté des Sciences 2002, 157-164.
- Laraque, A.; Mahé, G.; Orange, D.; Marieu, B. Spatiotemporal variations in hydrological regimes within Central Africa during the XXth century. Journal of Hydrology 2001, 245, 104–117. [Google Scholar] [CrossRef]
- Jean Marie, T.; Mbata, A.; Mwamba, V.; Phuati, E.; Kazadi Mukenga Bantu, A.; Keto, F. Time-scale characteristics of Kasai river hydrological regime variability for 1940-1999. International Journal of Innovation and Applied Studies 2016, 17, 531–547. [Google Scholar]
- Bultot, F. Atlas climatique du bassin congolais; Institut national pour l'étude agronomique du Congo: 1971.
- Mbimbi Mayi Munene, J.J.; Stiassny, M.L.J.; Monsembula Iyaba, R.J.C.; Liyandja, T.L.D. Fishes of the Lower Lulua River (Kasai Basin, Central Africa): A Continental Hotspot of Ichthyofaunal Diversity under Threat. Diversity 2021, 13. [Google Scholar] [CrossRef]
- Brown, H.C.P.; Smit, B.; Somorin, O.A.; Sonwa, D.J.; Nkem, J.N. Climate Change and Forest Communities: Prospects for Building Institutional Adaptive Capacity in the Congo Basin Forests. AMBIO 2014, 43, 759–769. [Google Scholar] [CrossRef]
- World Bank. World Bank Global Electrification Database from "Tracking SDG 7: The Energy Progress Report" led jointly by the custodian agencies: the International Energy Agency ( IEA ), the International Renewable Energy Agency ( IRENA ), the United Nations Statistics Division ( UNSD ), the World Bank and the World Health Organization ( WHO ). License : CC BY-4.0. 2021.
- Mahe, G.; Lienou, G.; Descroix, L.; Bamba, F.; Paturel, J.E.; Laraque, A.; Meddi, M.; Habaieb, H.; Adeaga, O.; Dieulin, C.; et al. The rivers of Africa: witness of climate change and human impact on the environment. Hydrological Processes 2013, 27, 2105–2114. [Google Scholar] [CrossRef]
- Nguimalet, C.-R.; Orange, D. Caractérisation de la baisse hydrologique actuelle de la rivière Oubangui à Bangui, République Centrafricaine. La Houille Blanche 2019, 105, 78–84. [Google Scholar] [CrossRef]
- Linke, S.; Lehner, B.; Ouellet Dallaire, C.; Ariwi, J.; Grill, G.; Anand, M.; Beames, P.; Burchard-Levine, V.; Maxwell, S.; Moidu, H.; et al. Global hydro-environmental sub-basin and river reach characteristics at high spatial resolution. Scientific Data 2019, 6, 283. [Google Scholar] [CrossRef] [PubMed]
- Haensler, A.; Saeed, F.; Jacob, D. Assessing the robustness of projected precipitation changes over central Africa on the basis of a multitude of global and regional climate projections. Climatic Change 2013, 121, 349–363. [Google Scholar] [CrossRef]
- Rowell, D. Sources of uncertainty in future changes in local precipitation. Climate Dynamics 2012, 39, 1929–1950. [Google Scholar] [CrossRef]
- Orlowsky, B.; Seneviratne, S.I. Global changes in extreme events: regional and seasonal dimension. Climatic Change 2012, 110, 669–696. [Google Scholar] [CrossRef]
- Arnell, N.W. Effects of IPCC SRES* emissions scenarios on river runoff: a global perspective. Hydrology and Earth System Sciences 2003, 7, 619–641. [Google Scholar] [CrossRef]
- Beyene, T.; Ludwig, F.; Franssen, W. The potential consequences of climate change in hydrology regime of the Congo River Basin. In: Climate Change Scenarios for the Congo Basin. [Haensler A., Jacob D., Kabat P., Ludwig F. (eds.)]. Climate Service Centre Report 2013, NO.11, Hamburg, Germany, ISSN: 2192-4058.
- Chen, Y.; Sharma, S.; Zhou, X.; Yang, K.; Li, X.; Niu, X.; Hu, X.; Khadka, N. Spatial performance of multiple reanalysis precipitation datasets on the southern slope of central Himalaya. Atmospheric Research 2021, 250, 105365. [Google Scholar] [CrossRef]
- Muñoz-Sabater, J.; Dutra, E.; Agustí-Panareda, A.; Albergel, C.; Arduini, G.; Balsamo, G.; Boussetta, S.; Choulga, M.; Harrigan, S.; Hersbach, H.; et al. ERA5-Land: a state-of-the-art global reanalysis dataset for land applications. Earth System Sciences Data 2021, 13, 4349–4383. [Google Scholar] [CrossRef]
- Saha, S.; Moorthi, S.; Wu, X.; Wang, J.; Nadiga, S.; Tripp, P.; Behringer, D.; Hou, Y.-T.; Chuang, H.-y.; Iredell, M.; et al. The NCEP Climate Forecast System Version 2. Journal of Climate 2014, 27, 2185–2208. [Google Scholar] [CrossRef]
- Kobayashi, S.; Ota, Y.; Harada, Y.; Ebita, A.; Moriya, M.; Onoda, H.; Onogi, K.; Kamahori, H.; Kobayashi, C.; Endo, H.; et al. The JRA-55 Reanalysis: General Specifications and Basic Characteristics. Journal of the Meteorological Society of Japan. Ser. II 2015, 93, 5–48. [Google Scholar] [CrossRef]
- Rienecker, M.M.; Suarez, M.J.; Gelaro, R.; Todling, R.; Bacmeister, J.; Liu, E.; Bosilovich, M.G.; Schubert, S.D.; Takacs, L.; Kim, G.-K.; et al. MERRA: NASA’s Modern-Era Retrospective Analysis for Research and Applications. Journal of Climate 2011, 24, 3624–3648. [Google Scholar] [CrossRef]
- NCCS. NASA Earth Exchange Global Daily Downscaled Projections (NEX-GDDP). Simulation, N.C.f.C., Ed. 2020.
- Thrasher, B.; Xiong, J.; Wang, W.; Melton, F.; Michaelis, A.; Nemani, R. Downscaled climate projections suitable for resource management. Eos, Transactions American Geophysical Union 2013, 94, 321–323. [Google Scholar] [CrossRef]
- Kwakye, S.O.; Bárdossy, A. Hydrological modelling in data-scarce catchments: Black Volta basin in West Africa. SN Applied Sciences 2020, 2, 628. [Google Scholar] [CrossRef]
- Lindström, G.; Johansson, B.; Persson, M.; Gardelin, M.; Bergström, S. Development and test of the distributed HBV-96 hydrological model. J Hydrol 1997, 201, 272–288. [Google Scholar] [CrossRef]
- Seibert, J.; Vis, M.J.P. Teaching hydrological modeling with a user-friendly catchment-runoff-model software package. Hydrol Earth Syst Sc 2012, 16, 3315–3325. [Google Scholar] [CrossRef]
- Seibert, J.; Beven, K.J. Gauging the ungauged basin: how many discharge measurements are needed? Hydrology and Earth System Sciences 2009, 13, 883–892. [Google Scholar] [CrossRef]
- Samuel, J.; Coulibaly, P.; Metcalfe, R.A. Identification of rainfall–runoff model for improved baseflow estimation in ungauged basins. Hydrological Processes 2012, 26, 356–366. [Google Scholar] [CrossRef]
- Hargreaves, G.; Allen, R. History and Evaluation of Hargreaves Evapotranspiration Equation. Journal of Irrigation and Drainage Engineering-asce 2003, 129. [Google Scholar] [CrossRef]
- Perrin, C.; Michel, C.; Andréassian, V. Improvement of a parsimonious model for streamflow simulation. Journal of Hydrology 2003, 279, 275–289. [Google Scholar] [CrossRef]
- Sadegh, M.; AghaKouchak, A.; Flores, A.; Mallakpour, I.; Nikoo, M.R. A Multi-Model Nonstationary Rainfall-Runoff Modeling Framework: Analysis and Toolbox. Water Resources Management 2019, 33. [Google Scholar] [CrossRef]
- KlemeŠ, V. Operational testing of hydrological simulation models. Hydrological Sciences Journal 1986, 31, 13–24. [Google Scholar] [CrossRef]
- Gupta, H.V.; Kling, H.; Yilmaz, K.K.; Martinez, G.F. Decomposition of the mean squared error and NSE performance criteria: Implications for improving hydrological modelling. Journal of Hydrology 2009, 377, 80–91. [Google Scholar] [CrossRef]
- Nash, J.E.; Sutcliffe, J.V. River flow forecasting through conceptual models part I — A discussion of principles. Journal of Hydrology 1970, 10, 282–290. [Google Scholar] [CrossRef]
- Duan, Q.Y.; Gupta, V.K.; Sorooshian, S. Shuffled Complex Evolution Approach for Effective and Efficient Global Minimization. Journal of Optimization Theory and Applications 1993, 76, 501–521. [Google Scholar] [CrossRef]
- Yarpiz. Shuffled Complex Evolution (SCE-UA), MATLAB Central File Exchange. 2020.
- Price, W.L. Global Optimization by Controlled Random Search. Journal of Optimization Theory and Applications 1983, 40, 333–348. [Google Scholar] [CrossRef]
- Dixon, L.C.W.; Szegö, G.P.; Szegö, G.; Szegö, G. Towards global optimisation 2; North Holland: 1978; Vol. 2.
- Törn, A.A. Clustering Methods in Global Optimization. IFAC Proceedings Volumes 1986, 19, 247–252. [Google Scholar] [CrossRef]
- Holland, J.H. Adaptation in Natural and Artificial Systems: An Introductory Analysis with Applications to Biology, Control, and Artificial Intelligence. The MIT Press: 1992; 10.7551/mitpress/1090.001.0001.
- Yang, J.; Reichert, P.; Abbaspour, K.C.; Yang, H. Hydrological modelling of the Chaohe Basin in China: Statistical model formulation and Bayesian inference. Journal of Hydrology 2007, 340, 167–182. [Google Scholar] [CrossRef]
- Wu, H.; Chen, B. Evaluating uncertainty estimates in distributed hydrological modeling for the Wenjing River watershed in China by GLUE, SUFI-2, and ParaSol methods. Ecological engineering 2015, 76, 110–121. [Google Scholar] [CrossRef]
- Mirzaei, M.; Huang, Y.; El-Shafie, A.; Shatirah, A. Application of the generalized likelihood uncertainty estimation (GLUE) approach for assessing uncertainty in hydrological models: A review. Stochastic Environmental Research and Risk Assessment 2015, 29. [Google Scholar] [CrossRef]
- Beven, K.; Binley, A. GLUE: 20 years on. Hydrological Processes 2014, 28, 5897–5918. [Google Scholar] [CrossRef]
- Beven, K.; Binley, A. The future of distributed models: Model calibration and uncertainty prediction. Hydrological Processes 1992, 6, 279–298. [Google Scholar] [CrossRef]
- Dakhlaoui, H.; Ruelland, D.; Tramblay, Y.; Bargaoui, Z. Evaluating the robustness of conceptual rainfall-runoff models under climate variability in northern Tunisia. J Hydrol 2017, 550, 201–217. [Google Scholar] [CrossRef]
- Osuch, M.; Romanowicz, R.J.; Booij, M.J. The influence of parametric uncertainty on the relationships between HBV model parameters and climatic characteristics. Hydrological Sciences Journal 2015, 60, 1299–1316. [Google Scholar] [CrossRef]
- Mann, H.B. Nonparametric Tests against Trend. Econometrica 1945, 13, 245–259. [Google Scholar] [CrossRef]
- Ojo, O.I.; Ilunga, M.F. Application of nonparametric trend technique for estimation of onset and cessation of rainfall. Air, Soil and Water Research 2018, 11, 1178622118790264. [Google Scholar] [CrossRef]
- Pandey, A.; Lalrempuia, D.; Jain, S.K. Assessment of hydropower potential using spatial technology and SWAT modelling in the Mat River, southern Mizoram, India. Hydrological Sciences Journal 2015, 60, 1651–1665. [Google Scholar] [CrossRef]
- Yamba, F.D.; Walimwipi, H.; Jain, S.; Zhou, P.; Cuamba, B.; Mzezewa, C. Climate change/variability implications on hydroelectricity generation in the Zambezi River Basin. Mitigation and Adaptation Strategies for Global Change 2011, 16, 617–628. [Google Scholar] [CrossRef]
- CICOS. International Commission of the Congo-Oubangui-Sangha Basin (CICOS), PROGRAMME DE MESURES 2016 – 2020, www.cicos.int. 2016.
Figure 1.
The Kasai River Basin, sub-watershed of the Congo River Basin, in Central Africa, and its main tributaries. River networks and sub-basins are retrieved from Linke, et al. [63].
Figure 1.
The Kasai River Basin, sub-watershed of the Congo River Basin, in Central Africa, and its main tributaries. River networks and sub-basins are retrieved from Linke, et al. [63].
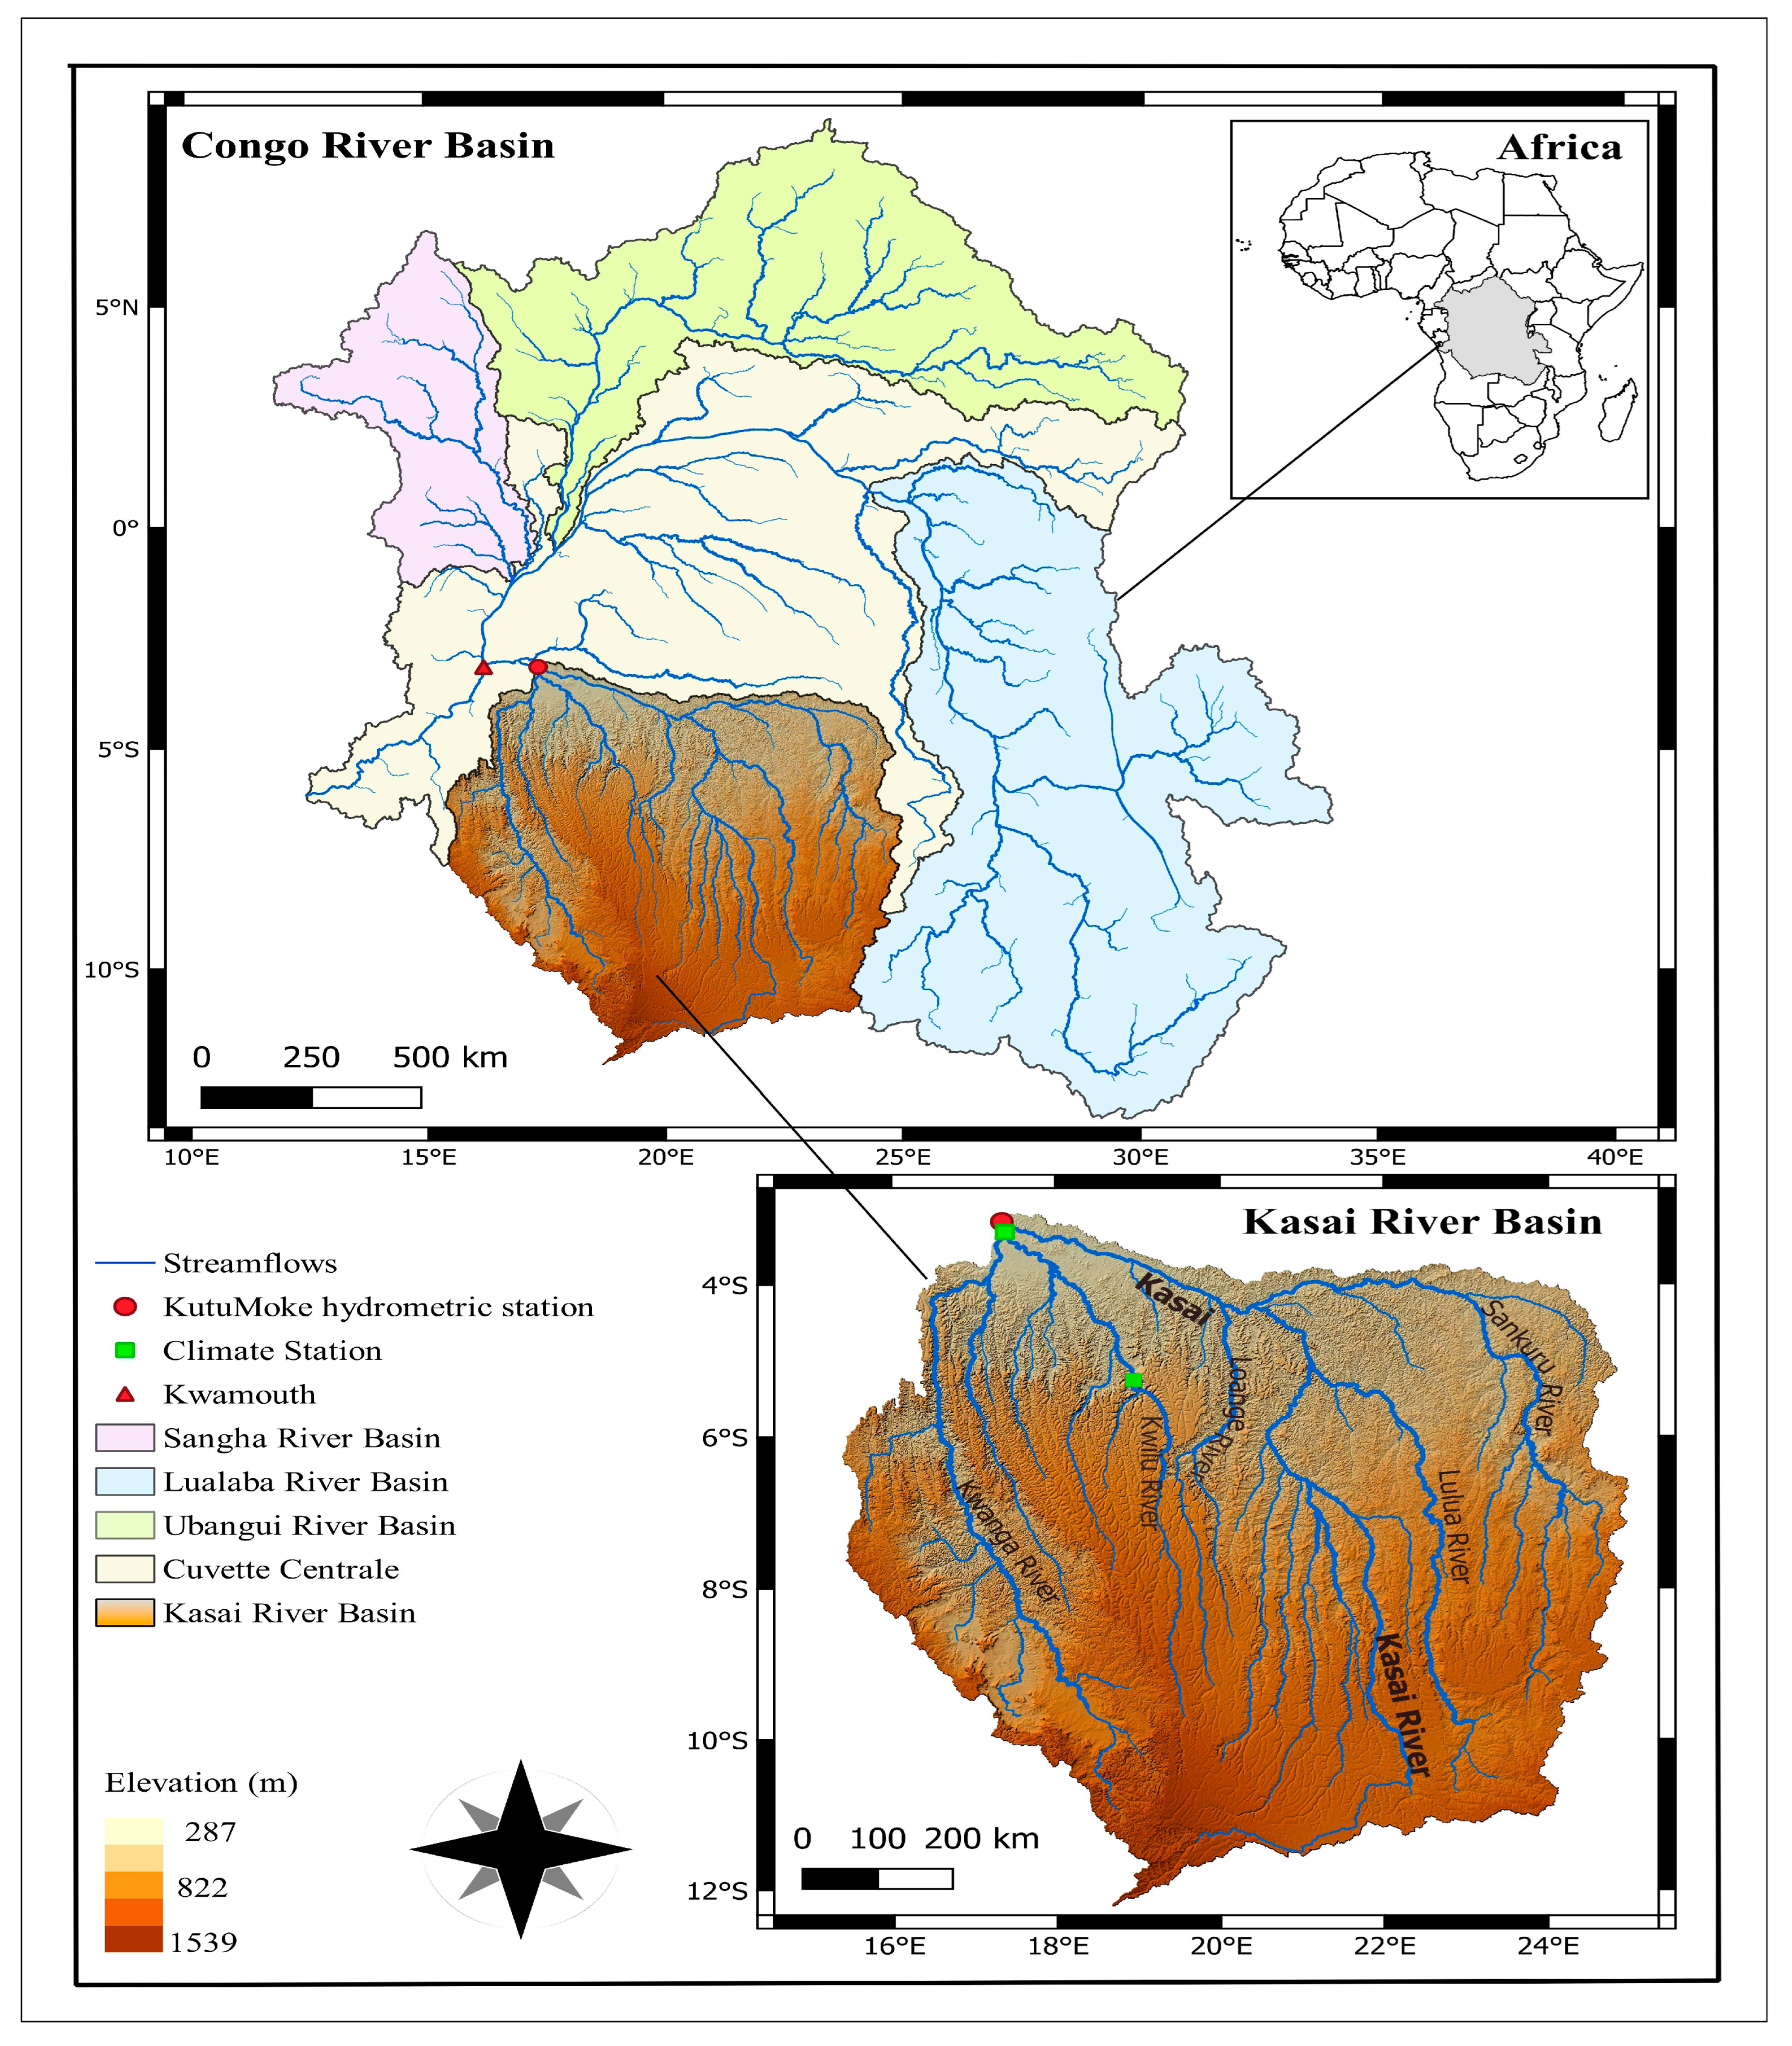
Figure 2.
Framework to assess the climate change impacts on water availability in the KARB.

Figure 3.
Daily precipitation and temperature values over a 30-year period based on the observed and four reanalysis datasets (Left panel), averaged over the KARB. The right panel shows the observed daily (boxplots) as well as expected values (lines) in each month based on observed and reanalysis datasets, which are averaged over the basin.
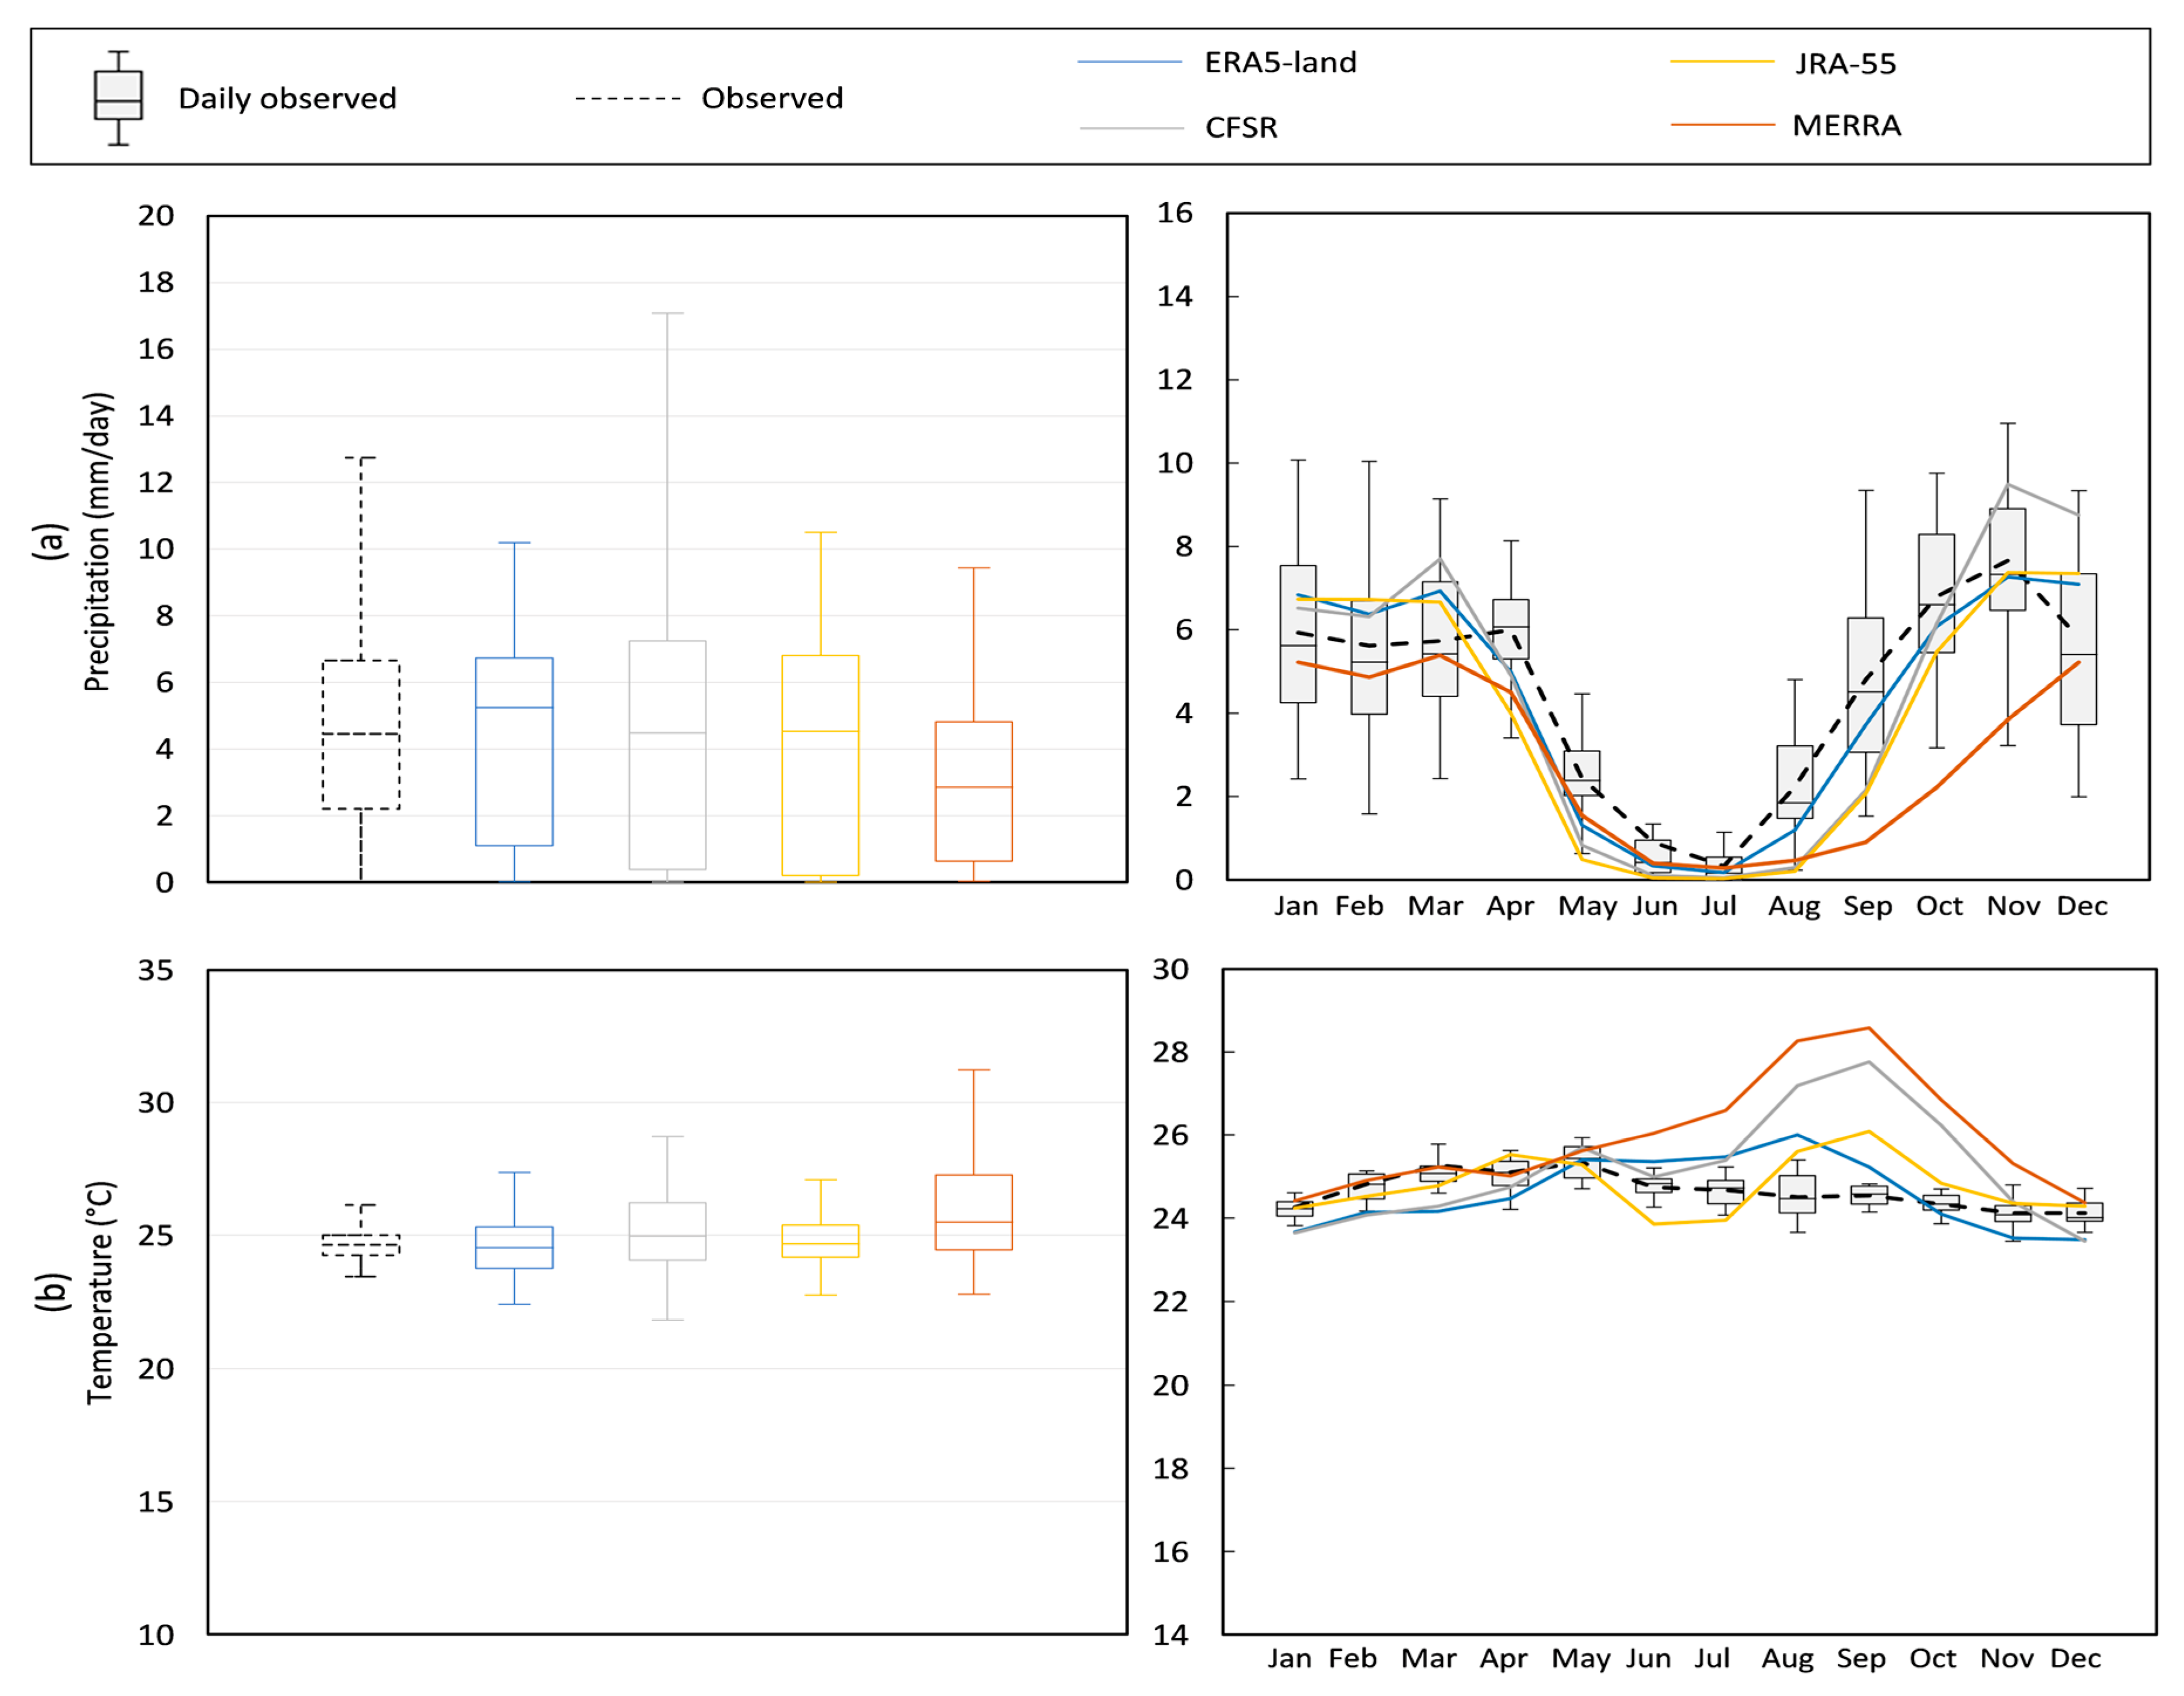
Figure 4.
Comparison of (a) precipitation and (b) temperature in the future based on 19 climate models under RCPs 4.5 and 8.5 (right) with respect to the historical values of (GCMs and reanalysis (left) in the KARB.
Figure 4.
Comparison of (a) precipitation and (b) temperature in the future based on 19 climate models under RCPs 4.5 and 8.5 (right) with respect to the historical values of (GCMs and reanalysis (left) in the KARB.
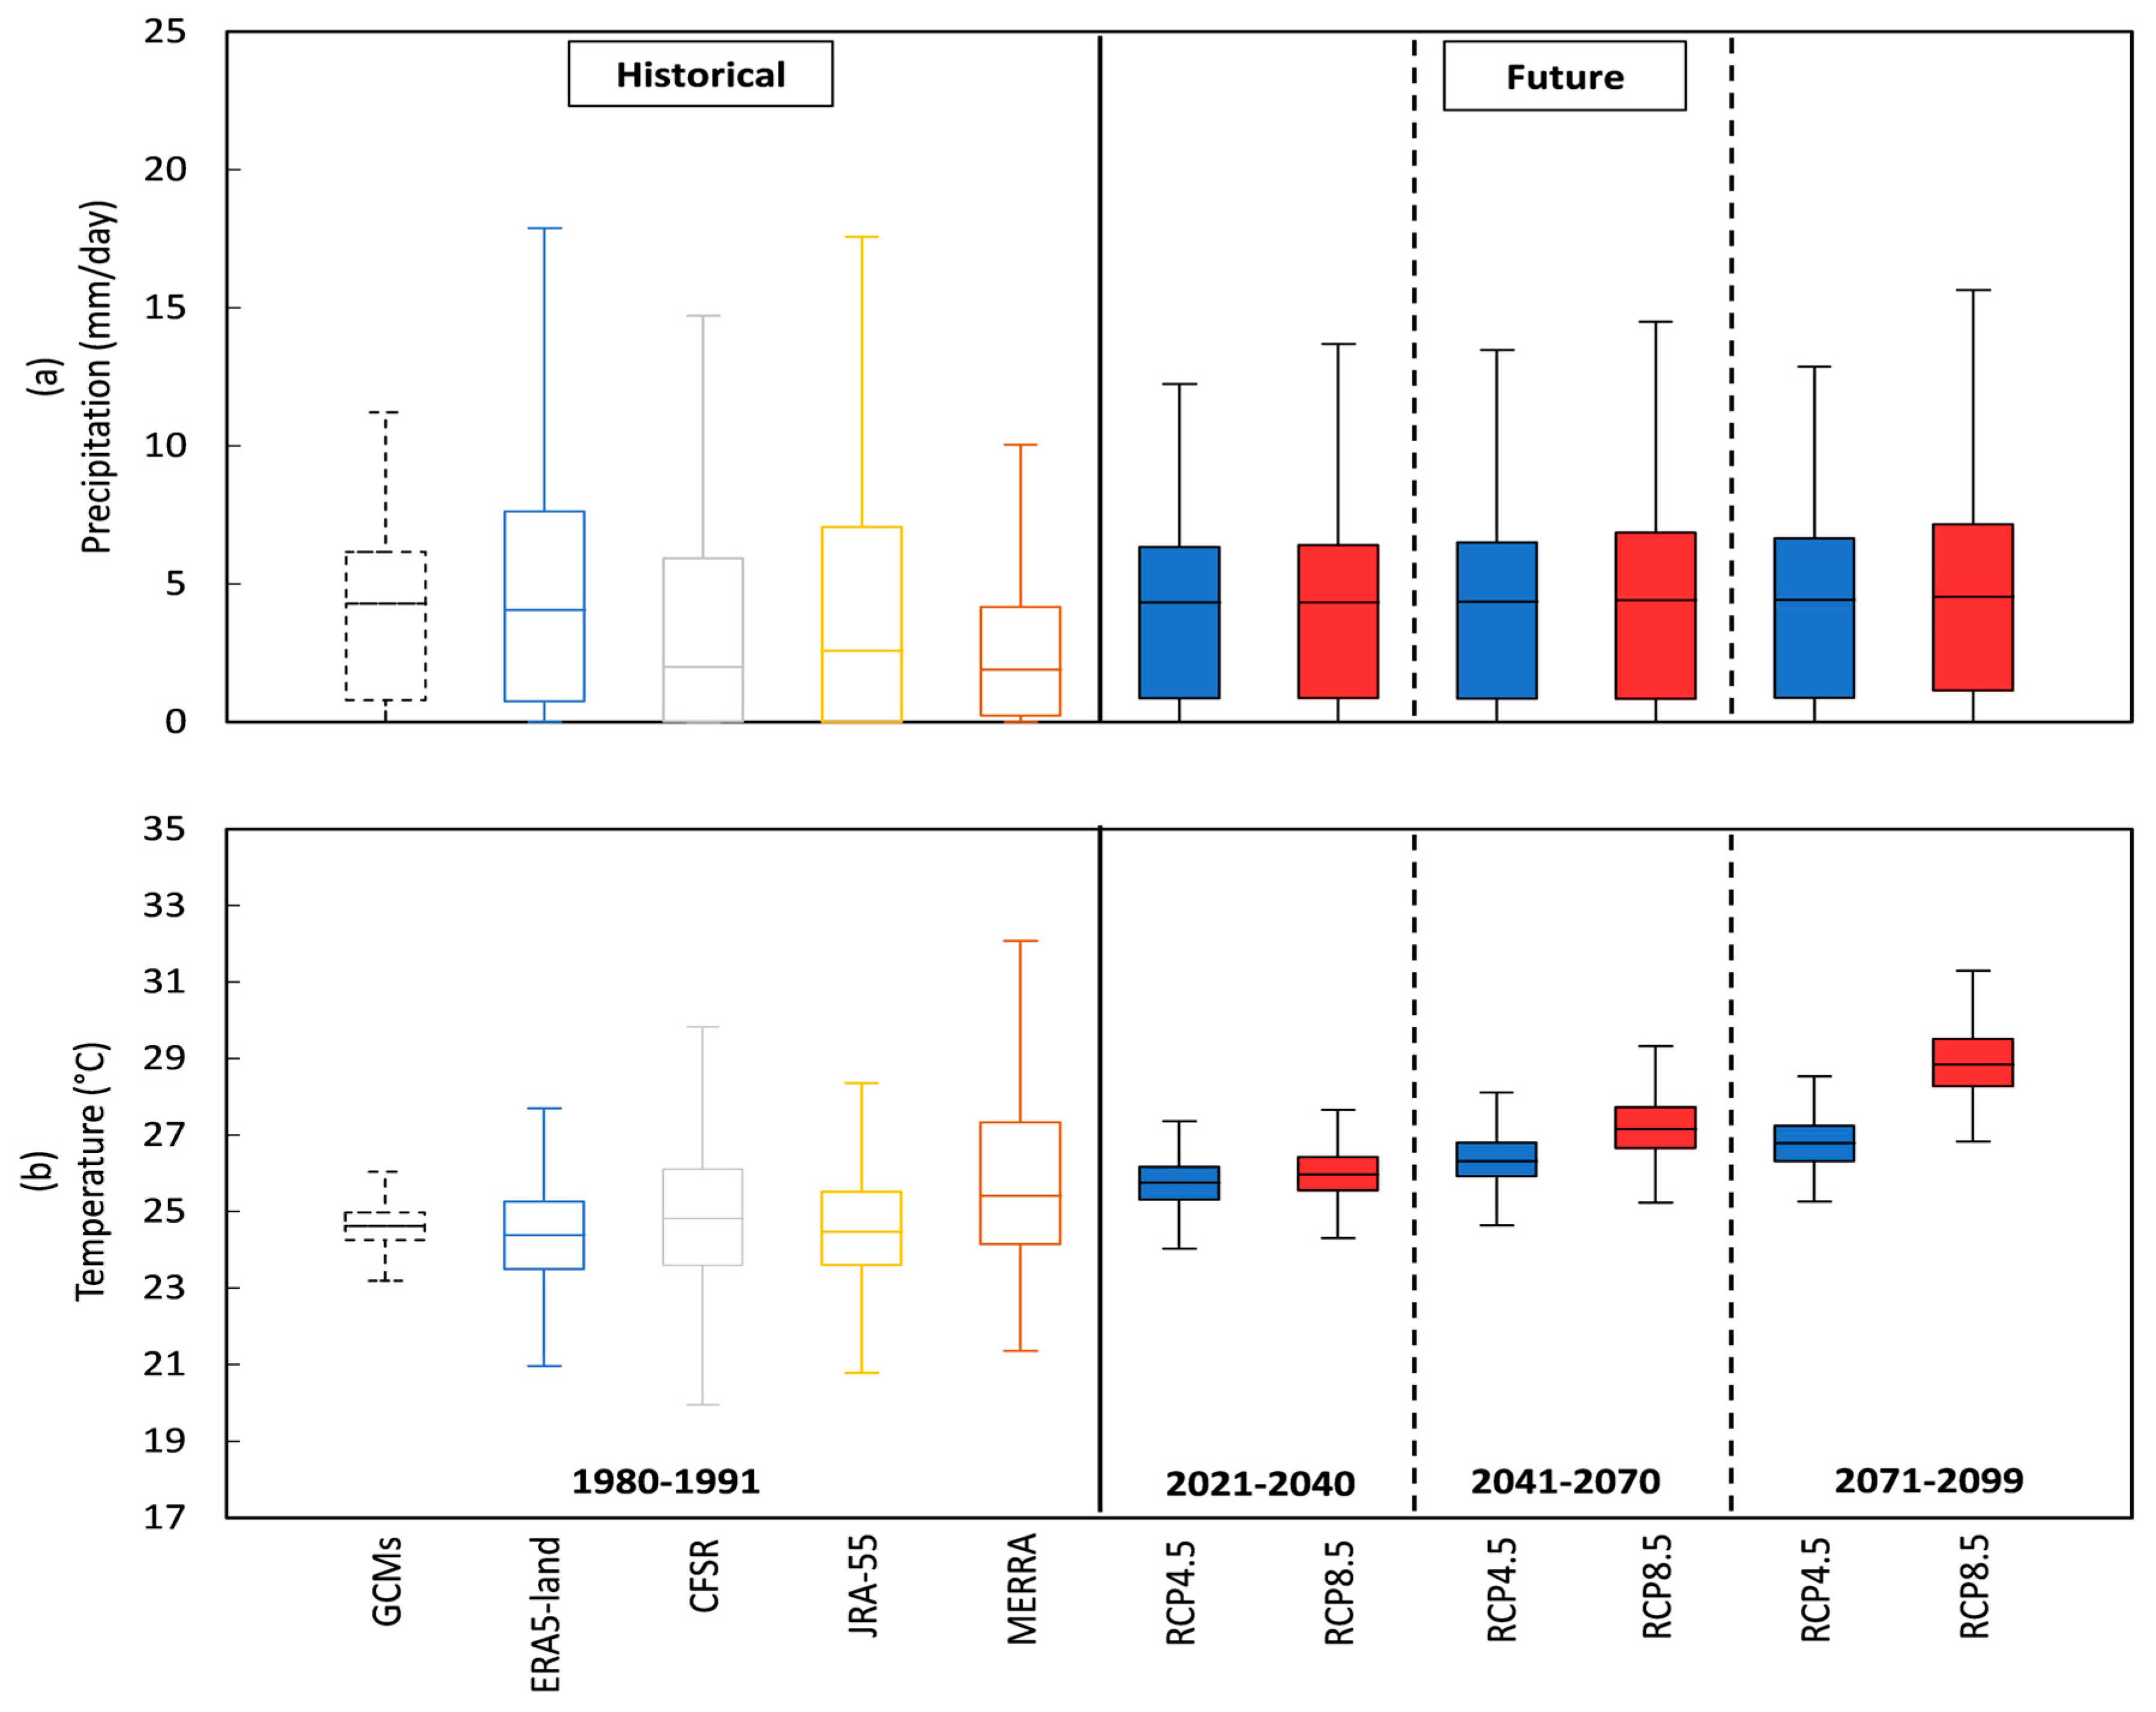
Figure 5.
Observed and simulated daily and annual flow during the historical period at the outlet using four reanalysis datasets forced to HBV (left) and GR4J (right) models.
Figure 5.
Observed and simulated daily and annual flow during the historical period at the outlet using four reanalysis datasets forced to HBV (left) and GR4J (right) models.
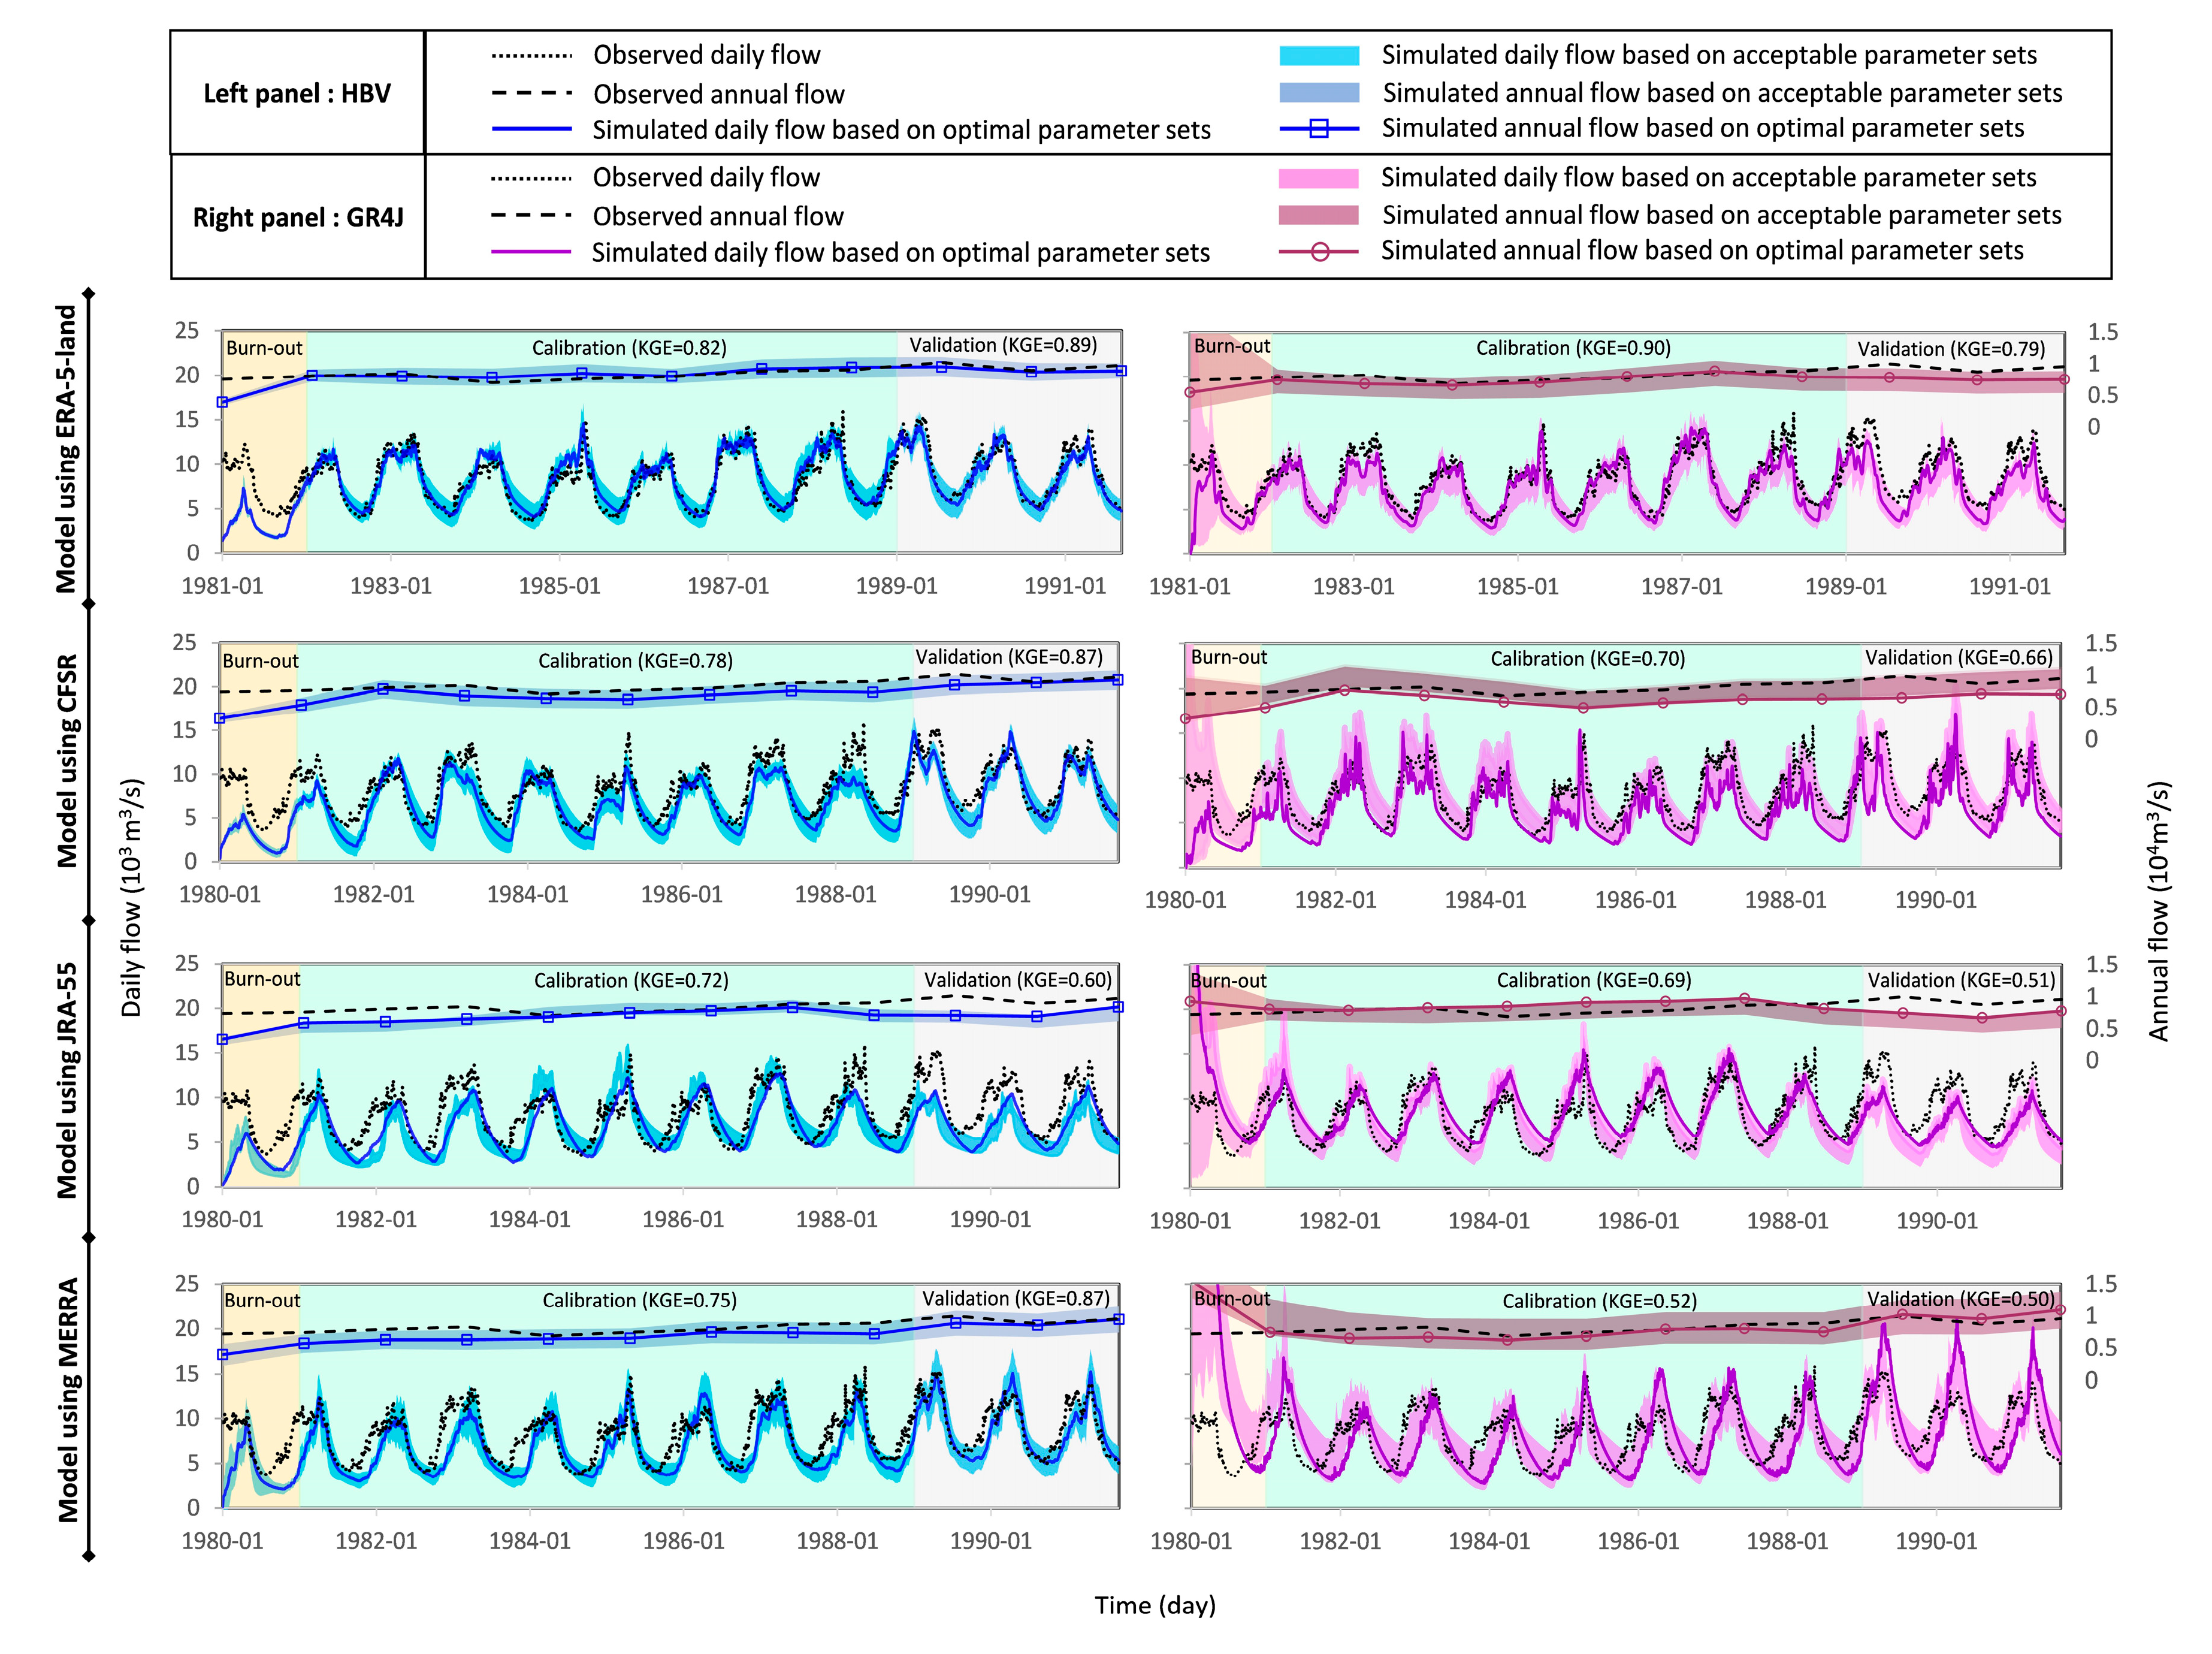
Figure 6.
Observed (dashed line) and simulated long-term annual hydrographs (solid line and shaded areas) during the historical period at the outlet using different reanalysis datasets forced to HBV (left) and GR4J (right) Models.
Figure 6.
Observed (dashed line) and simulated long-term annual hydrographs (solid line and shaded areas) during the historical period at the outlet using different reanalysis datasets forced to HBV (left) and GR4J (right) Models.
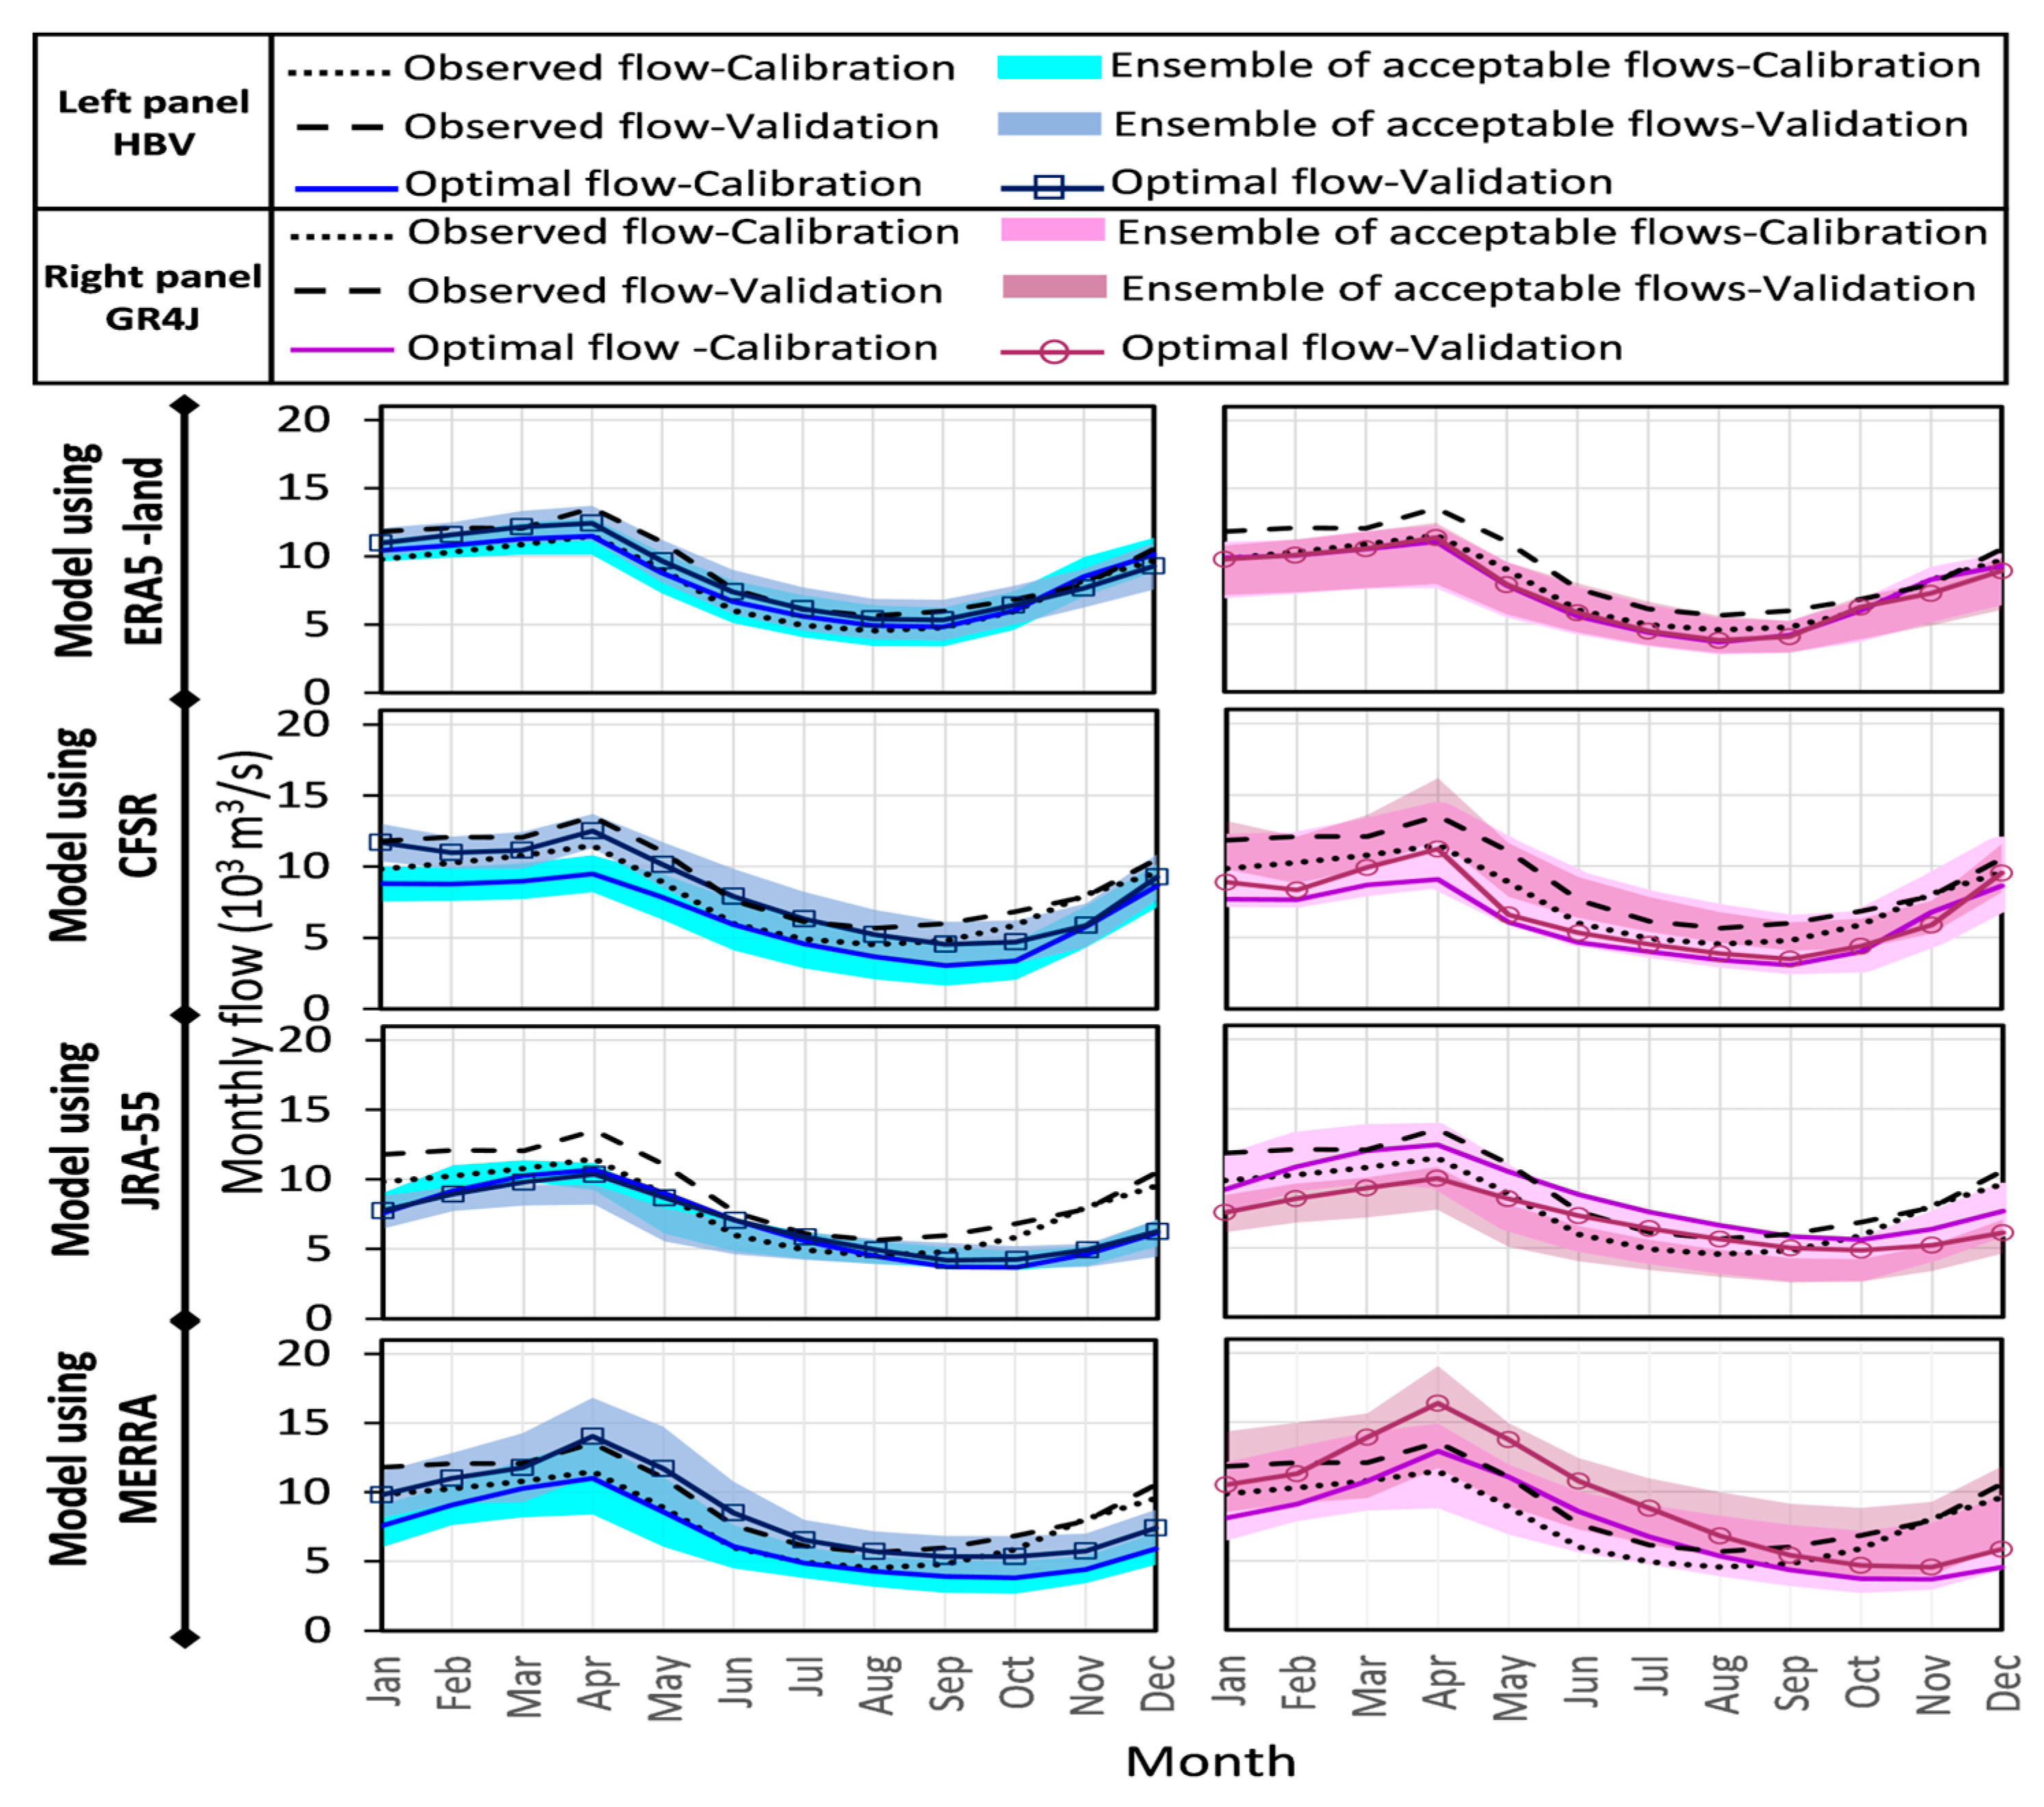
Figure 7.
Comparison between the simulated (solid line and shaded areas) and observed (dashed line) expected daily (left) and annual (right) hydrographs at the outlet during the historical period using four reanalysis datasets in the calibration of hydrological models HBV (top) and GR4J (bottom).
Figure 7.
Comparison between the simulated (solid line and shaded areas) and observed (dashed line) expected daily (left) and annual (right) hydrographs at the outlet during the historical period using four reanalysis datasets in the calibration of hydrological models HBV (top) and GR4J (bottom).
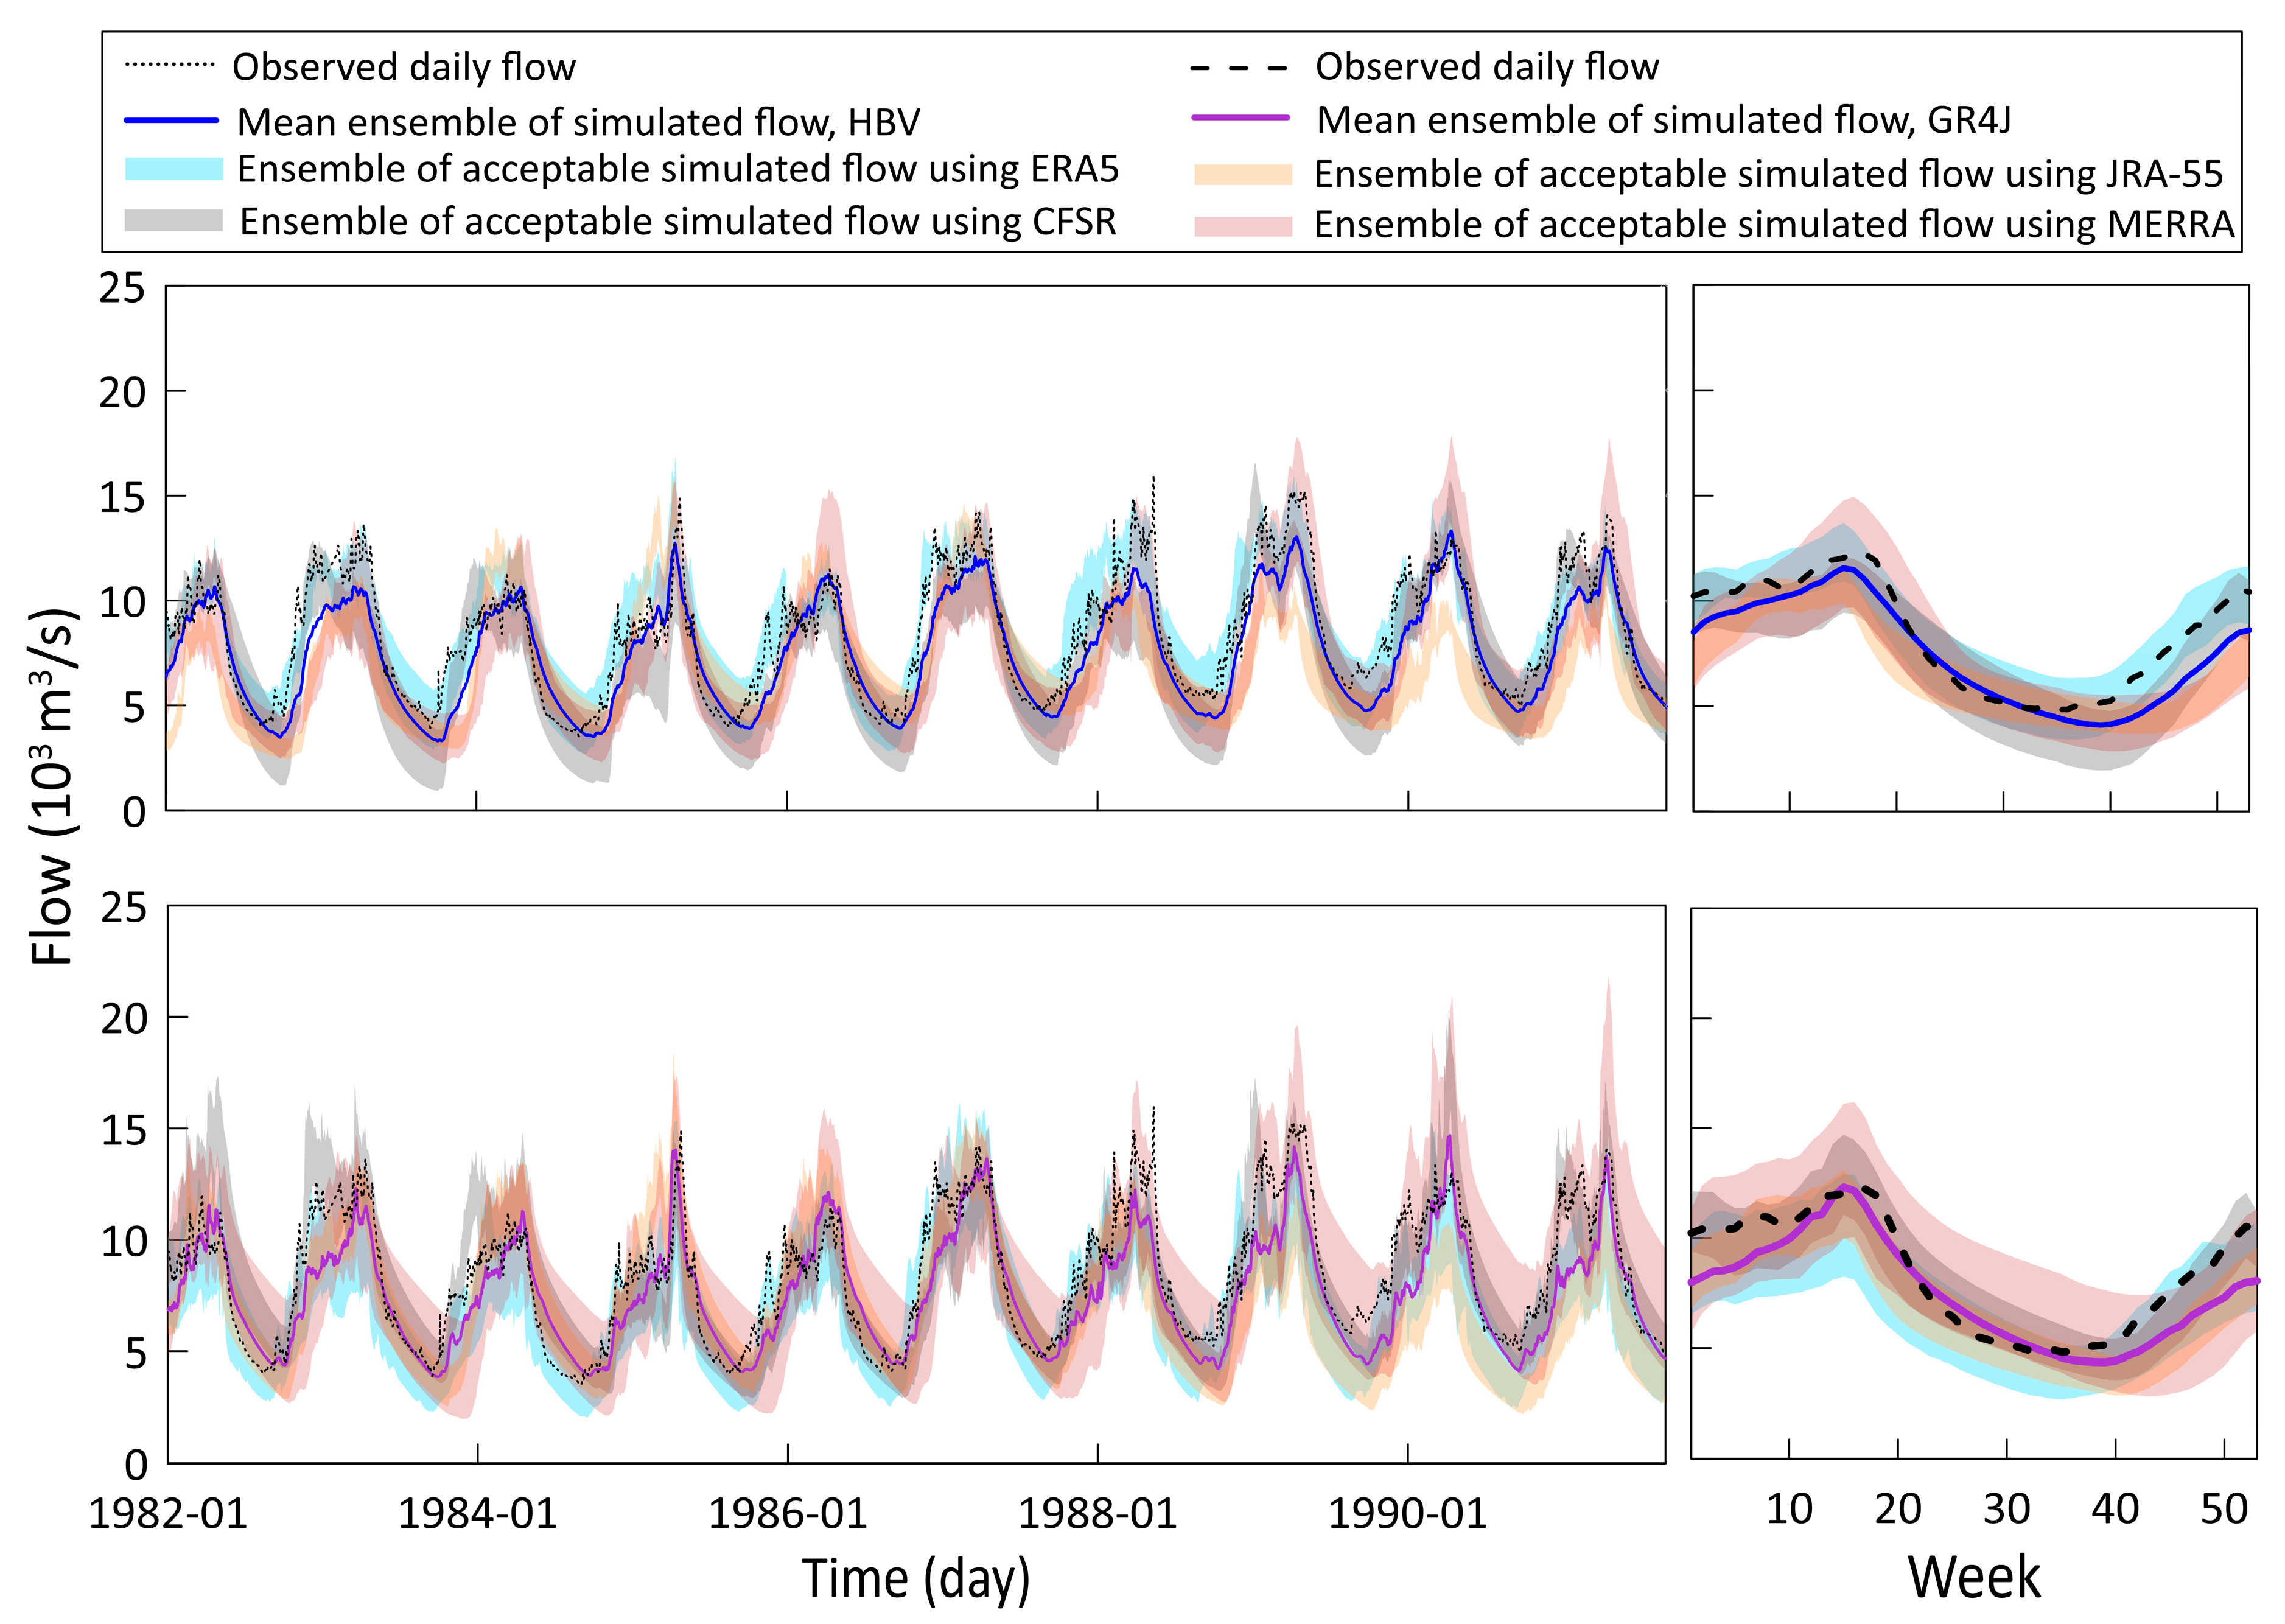
Figure 8.
Observed (dashed line) versus projected ensemble (shaded area) and expected (solid line) mean annual flow hydrograph at the basin’s outlet under RCP8.5 using HBV (left) and GR4J (middle) models calibrated with four reanalysis, and all configurations (right) using the outputs of 19 GCMs.
Figure 8.
Observed (dashed line) versus projected ensemble (shaded area) and expected (solid line) mean annual flow hydrograph at the basin’s outlet under RCP8.5 using HBV (left) and GR4J (middle) models calibrated with four reanalysis, and all configurations (right) using the outputs of 19 GCMs.
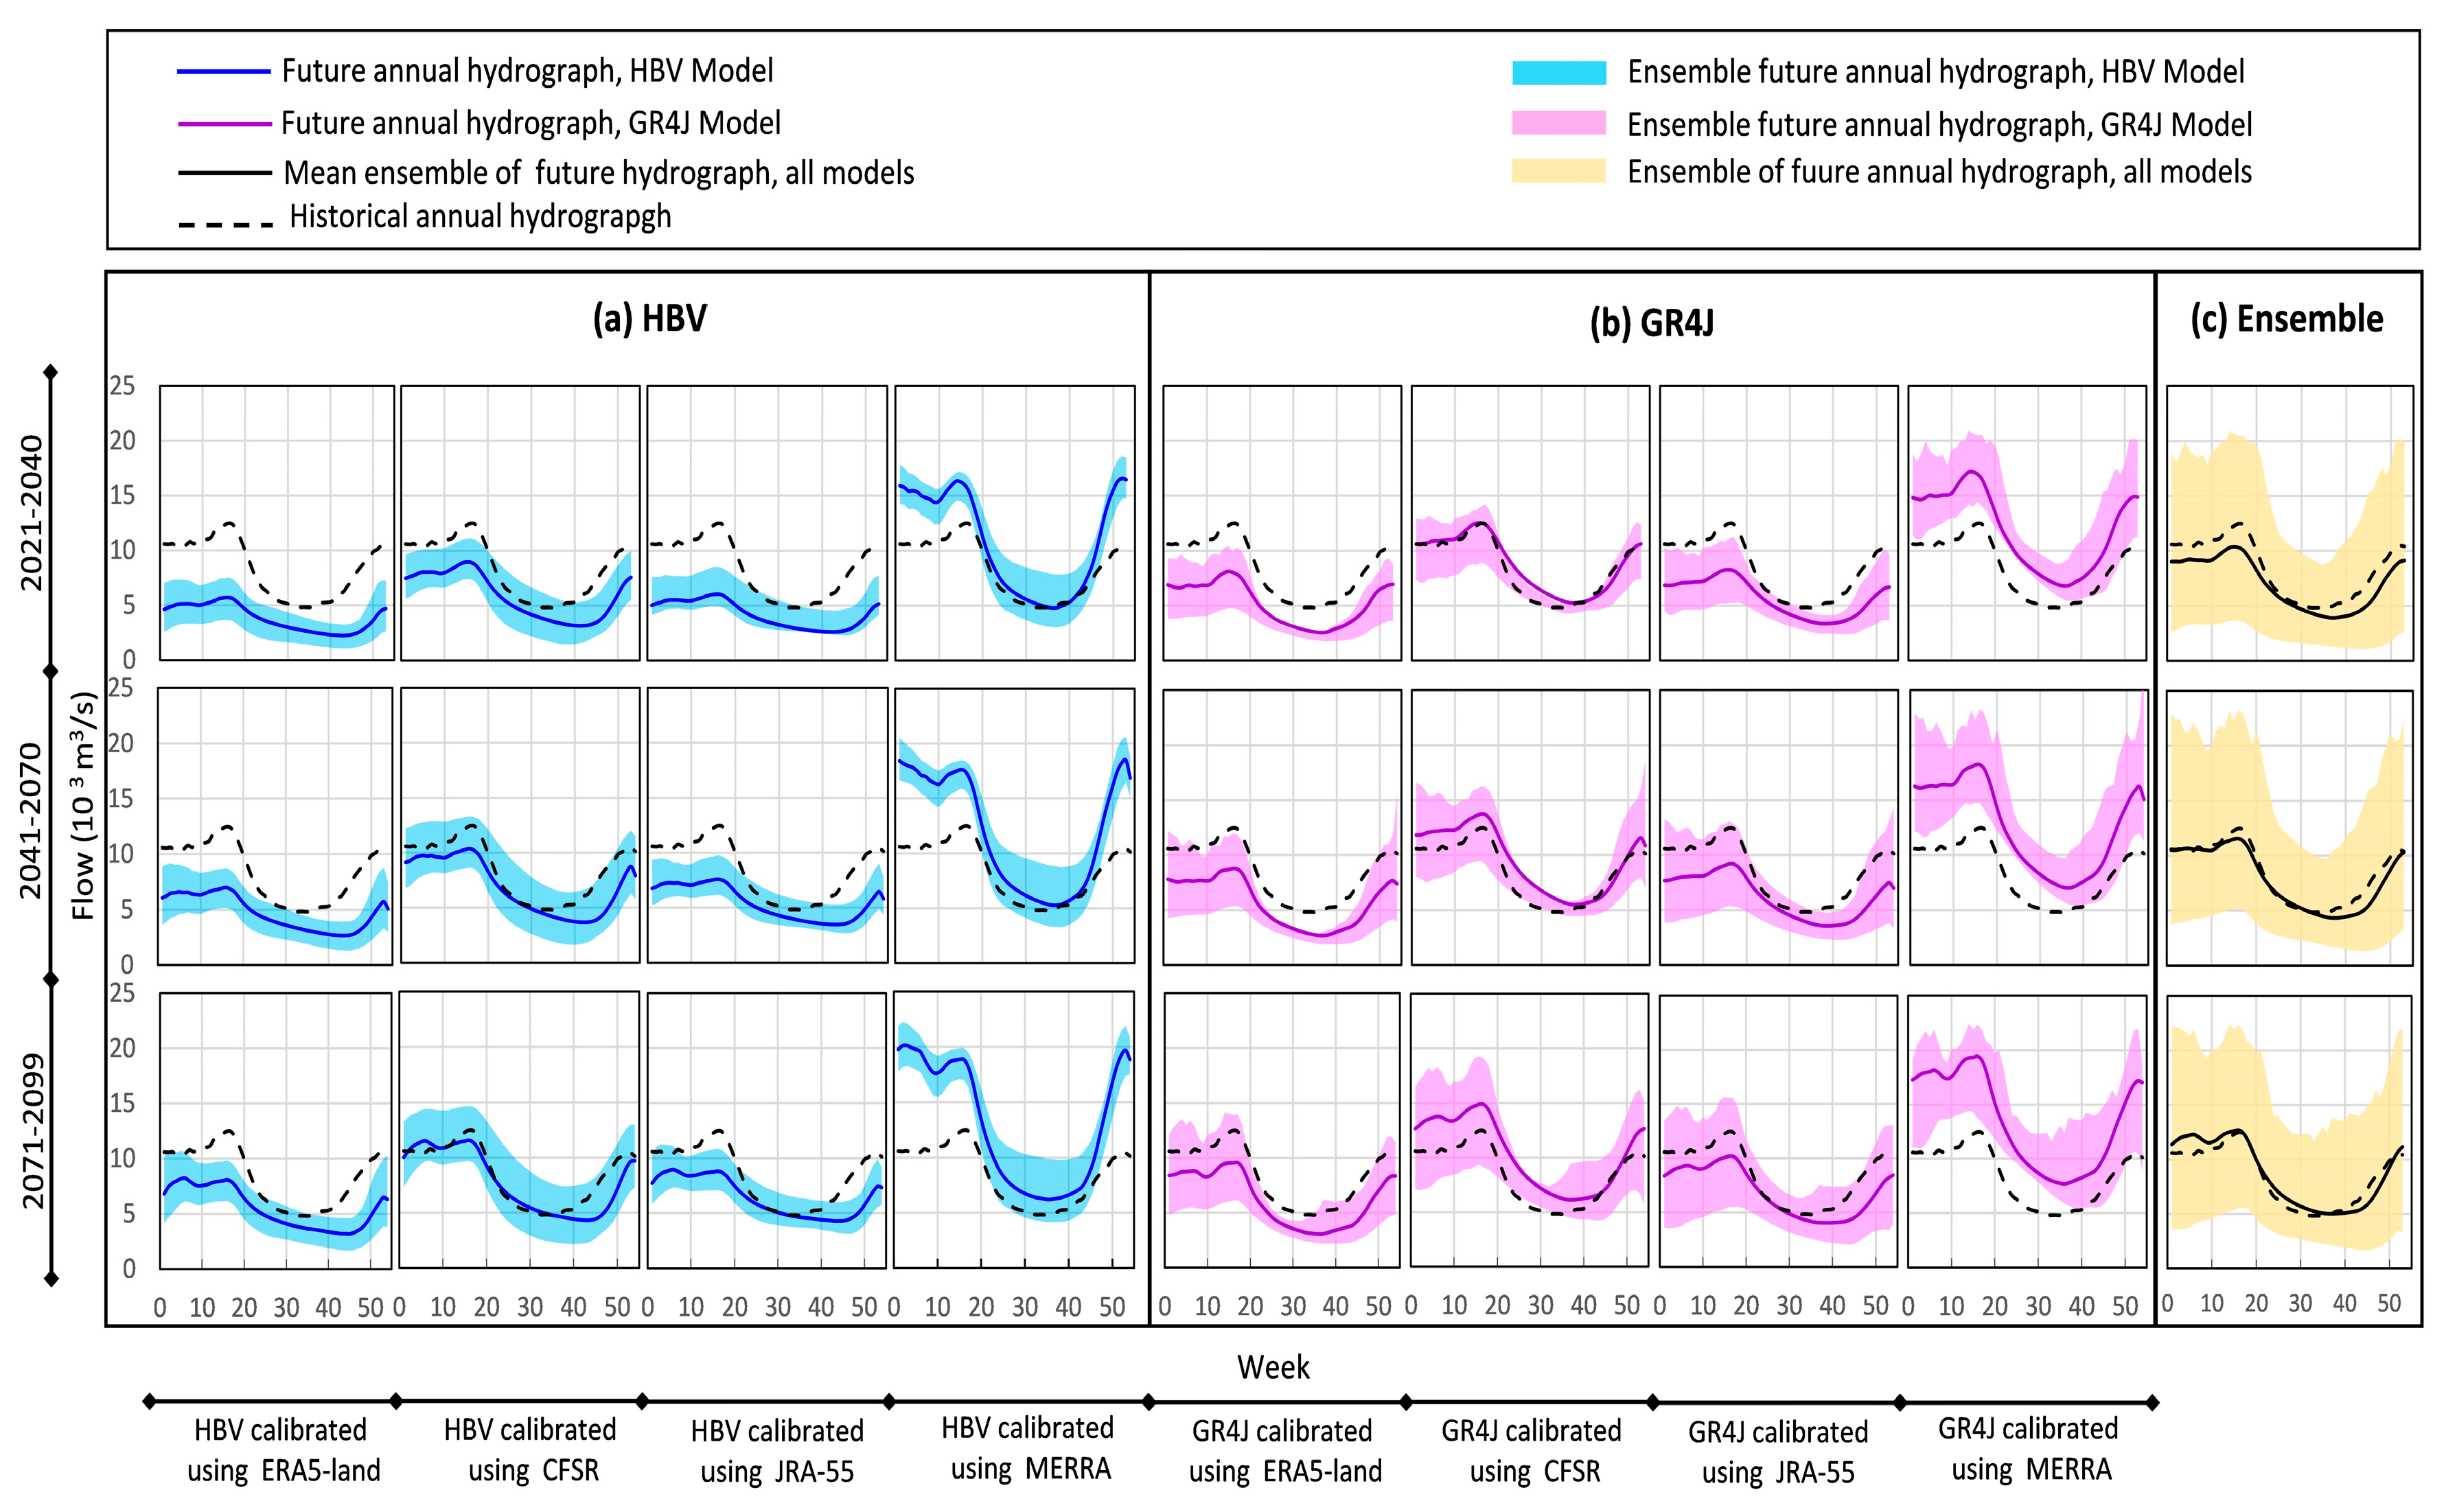
Figure 9.
Relative changes between the estimated annual streamflow quantiles by individual and all model configurations fed by outputs of 19 GCMs under RCP8.5 with respect to the long-term average historical value.
Figure 9.
Relative changes between the estimated annual streamflow quantiles by individual and all model configurations fed by outputs of 19 GCMs under RCP8.5 with respect to the long-term average historical value.
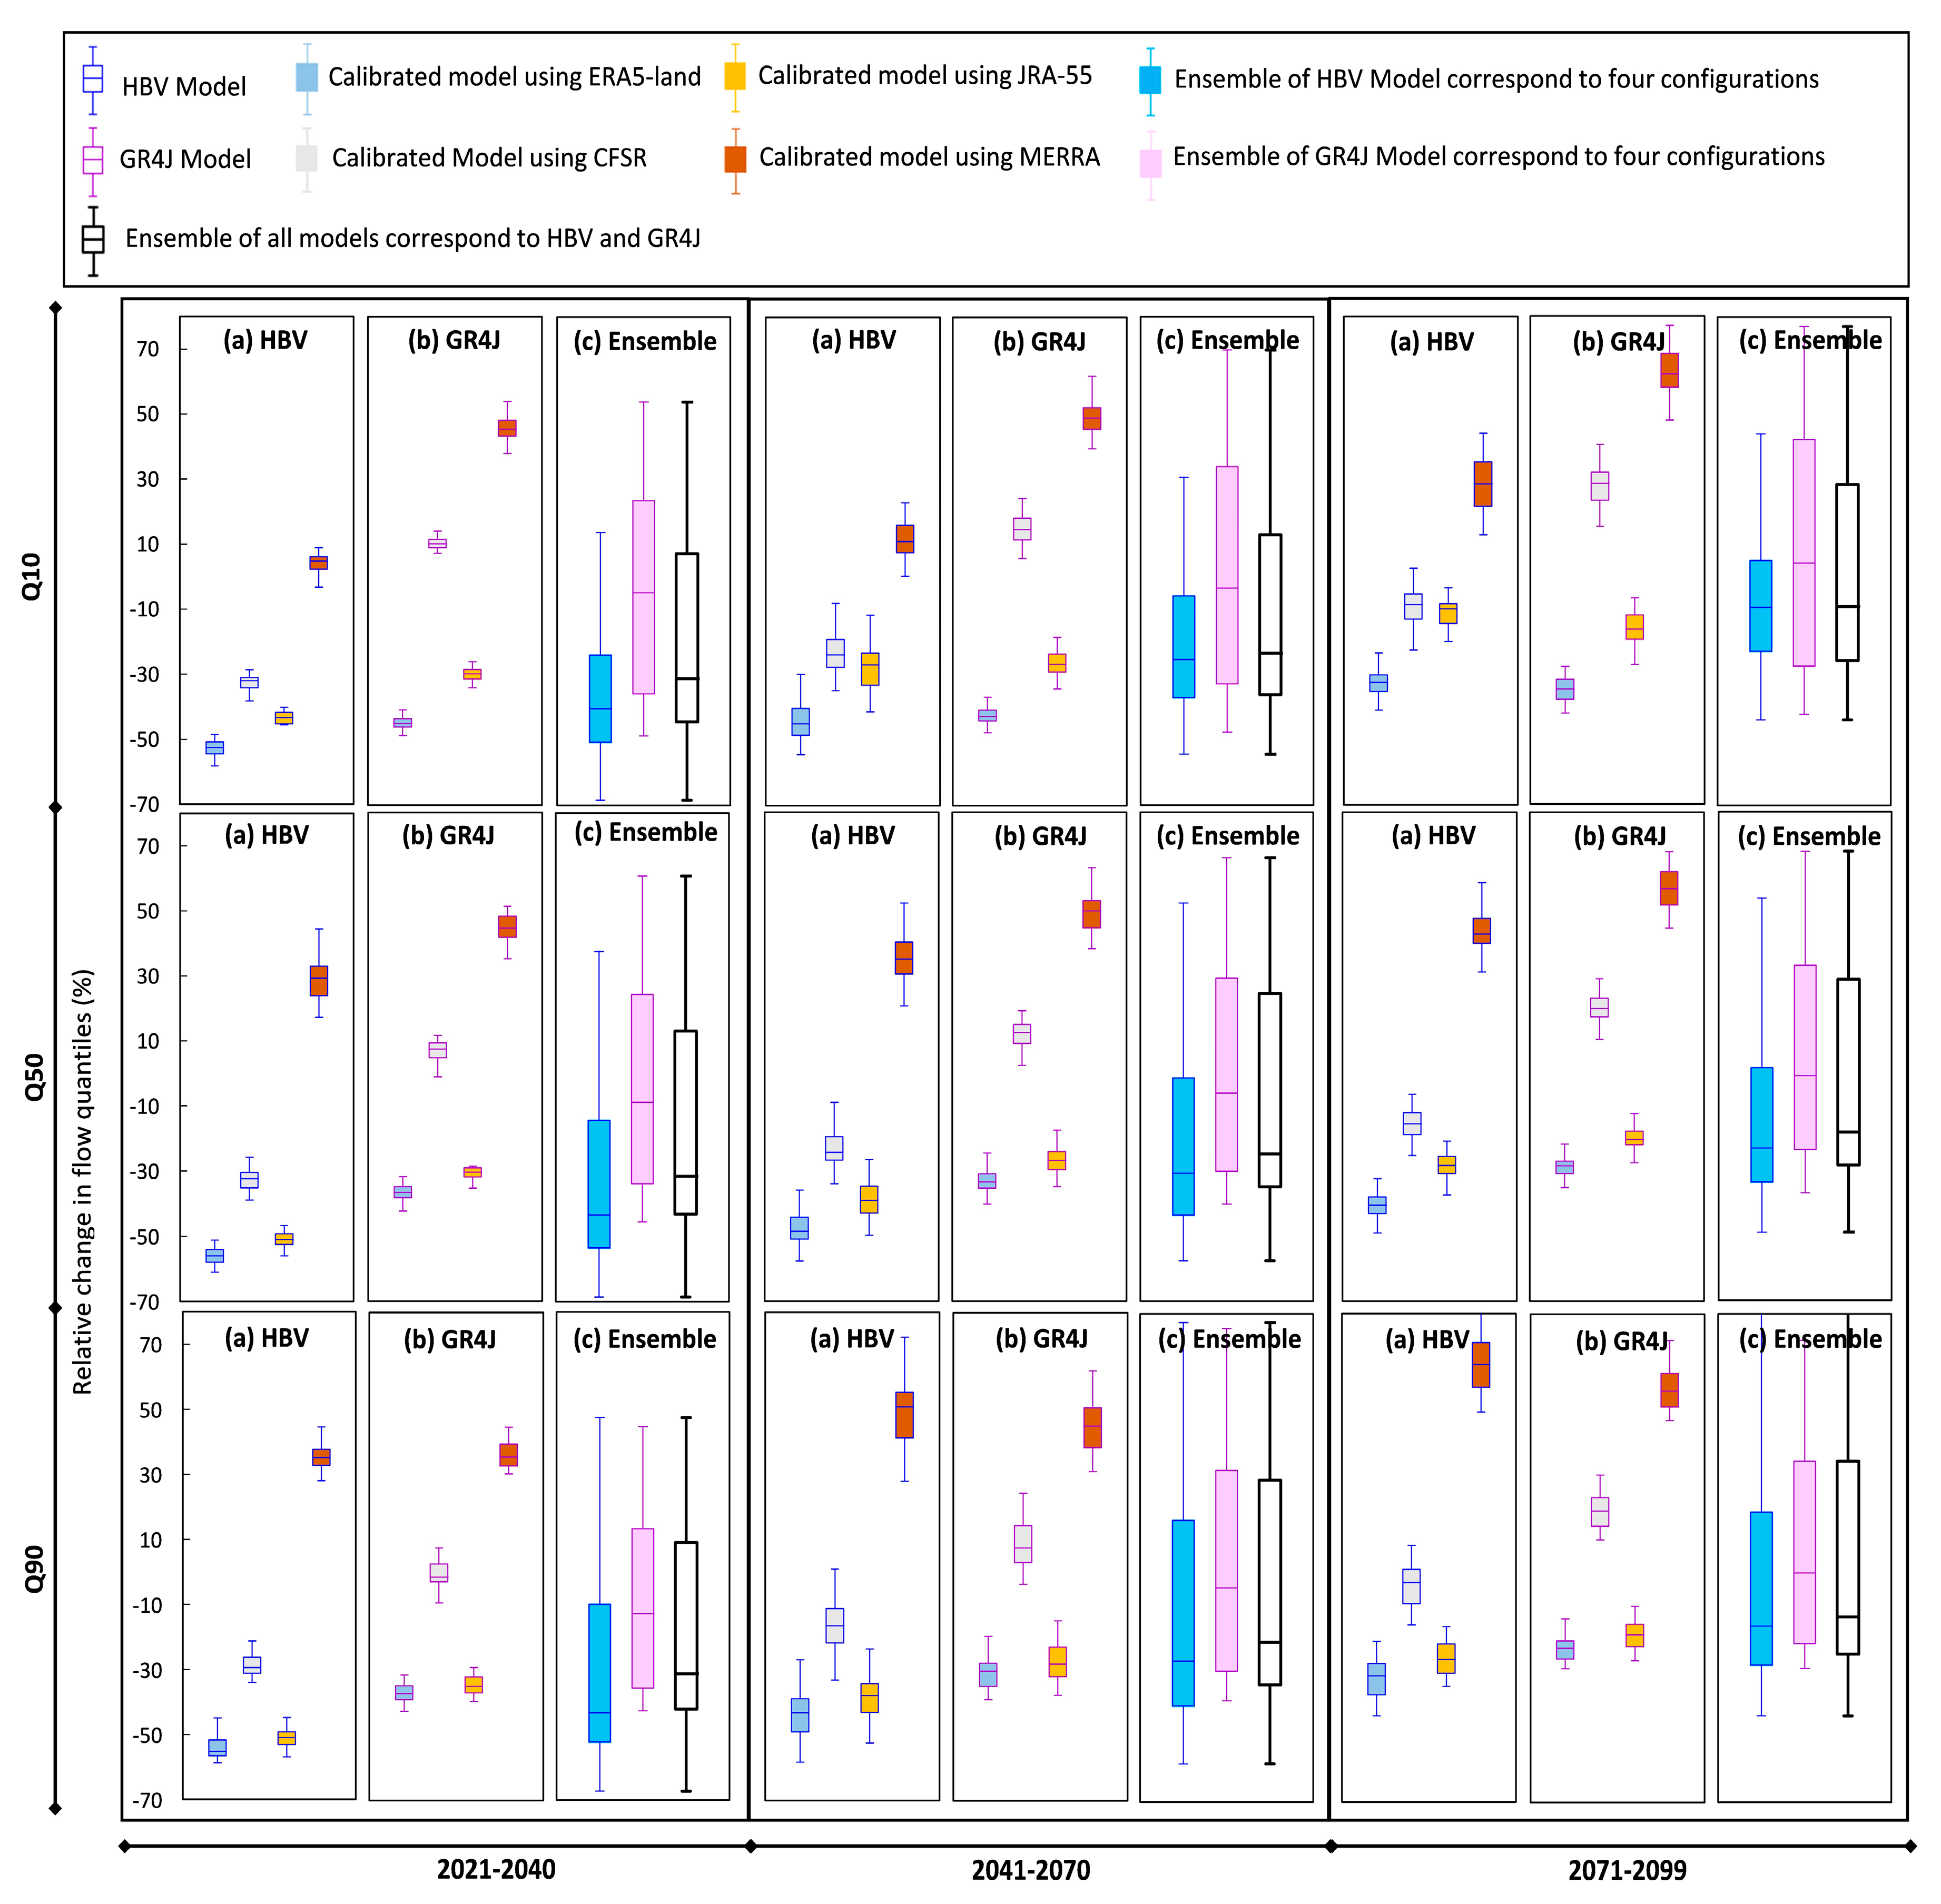
Figure 10.
The ensemble (shaded area) and expected (solid line) values of annual Q90 in the future under RCPs 4.5 and 8.5 based on calibrated HBV (blue) and GR4J (pink) models using four reanalysis datasets (left) and all 8 model configurations (right). The dashed line shows the long-term annual Q90 values during the historical period.
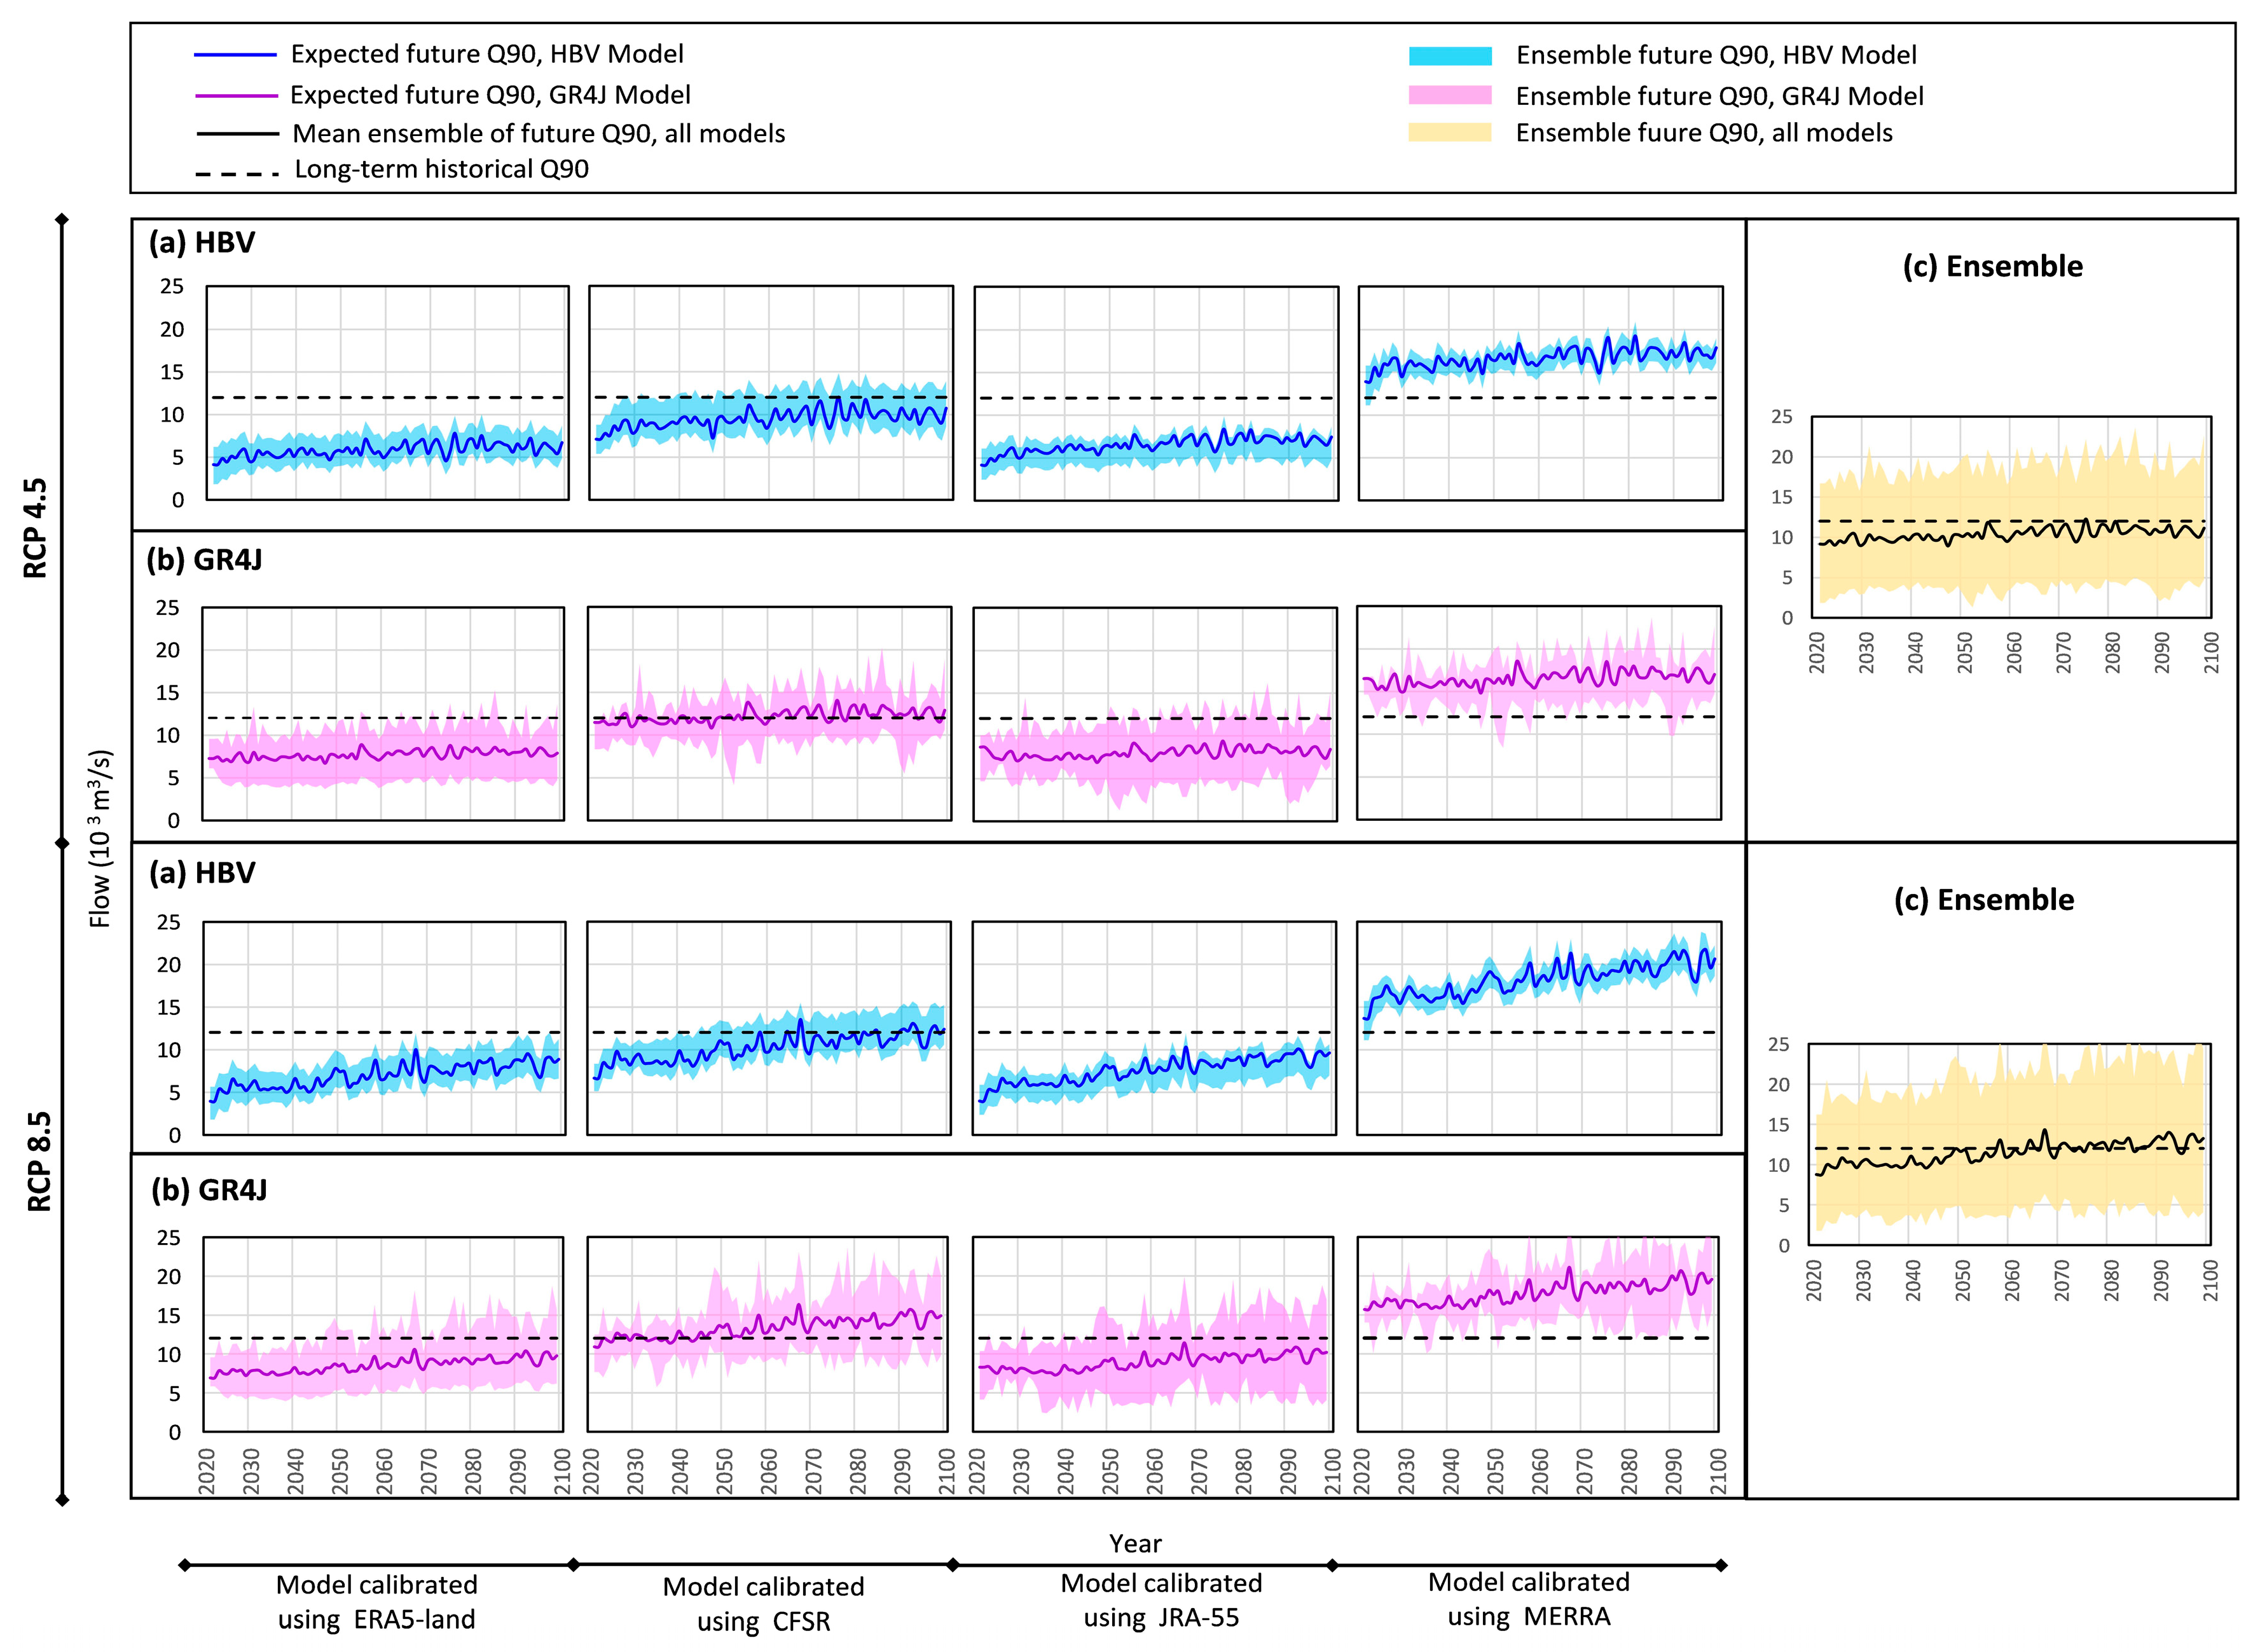

Table 1.
Hydro-climatic characteristics of the KARB.
| Climate | Streamflow | |||||||
|---|---|---|---|---|---|---|---|---|
| Station | Mean annual precipitation (mm) |
Average minimum temperature (°C) | Average maximum temperature (°C) | Basin average precipitation (mm) |
Station | Average annual flow (m3/s) | Drainage area (km2) | |
| Bandundu | 1554 | 21.4 | 30.8 | 1456 | Kutu Moke | 8070 | 750,000 | |
| Kiyaka | 1649 | 20.0 | 29.3 | |||||
Table 2.
Utilized reanalysis datasets, their temporal coverage, as well as spatial and temporal resolutions.
Table 2.
Utilized reanalysis datasets, their temporal coverage, as well as spatial and temporal resolutions.
| Dataset | Source | Available temporal coverage |
Spatial resolution |
Temporal resolution | Reference |
|---|---|---|---|---|---|
| ERA5-land | ECMWF | 1981-present | 0.1°× 0.1° | Daily | Muñoz-Sabater, Dutra [70] |
| Climate Forecast System Reanalysis (CFSR) | NCEP | 1979-present | 0.5° × 0.5° | Daily | Saha, Moorthi [71] |
| Japanese 55-year Reanalysis (JRA-55) | Japan Meteorological Agency | 1958-present | 1.25°×1.25° |
Daily |
Kobayashi, Ota [72] |
| Modern-Era Retrospective analysis for Research and Applications (MERRA) | NASA GMAO | 1979-2016 | 0.5° × 0.66° | Daily | Rienecker, Suarez [73] |
Disclaimer/Publisher’s Note: The statements, opinions and data contained in all publications are solely those of the individual author(s) and contributor(s) and not of MDPI and/or the editor(s). MDPI and/or the editor(s) disclaim responsibility for any injury to people or property resulting from any ideas, methods, instructions or products referred to in the content. |
© 2024 by the authors. Licensee MDPI, Basel, Switzerland. This article is an open access article distributed under the terms and conditions of the Creative Commons Attribution (CC BY) license (http://creativecommons.org/licenses/by/4.0/).
Copyright: This open access article is published under a Creative Commons CC BY 4.0 license, which permit the free download, distribution, and reuse, provided that the author and preprint are cited in any reuse.


