Submitted:
06 June 2024
Posted:
10 June 2024
You are already at the latest version
Abstract
During the last 100 years the planet has increased its temperature rapidly, this climate change could bring catastrophic effects for organisms and natural systems. One of the most affected groups is the ectotherms, due to their direct dependence on the environmental temperature. In recent years several studies analyse the effects of temperature and the thermal tolerance on several species of ectotherms. However, there are species whose thermal tolerances are still unknown. Such is the case of critically endangered species the Montseny Brook Newt (Calotriton arnoldi), endemic from the Montseny massif in Spain and whose thermal biology is unknown. Its critical situation makes essential to know its tolerance to cooling, warming and thermopreferendum in water environment where the newt lives. Three experimental procedures were conducted from the western and eastern subpopulations of C. arnoldi considering four classes separately (males, females, juveniles and larvae). The results obtained showed that the CTmax of the species exceeded 31°C, with a significant difference between the two populations. We found that the species tolerates well low temperatures (<1°C), because of the genera Calotriton is adapted to lives in cold waters with temperatures below 15º. Although the thermopreference of the species was expected to trend to cold temperatures, some individuals chose relatively high temperatures, obtaining a range of 11.7°C to 21.6°C. The results presented in this study are an advance in the knowledge of the thermal physiology of this species and support the importance of the temperature of the torrent on its survival. Knowing their thermal limits and their preferred temperature range will help to propose management measures that promote the conservation of streams and its riparian forest cover to mitigate the temperature increase due to climate change.
Keywords:
Calotriton arnoldi
; Critical Thermal Maximum (CTmax)
; thermopreference
; thermopreferendum
; temperature
; thermal tolerance
1. Introduction
Over the past 100 years, the Earth's temperature has been increasing rapidly [1]. Throughout evolutionary history, species have shown resilience to certain temperature increases. However, the current rate of temperature rise poses a threat to the rapid adaptation of organisms, jeopardizing their survival [2,3,4]. Consequently, numerous studies have been conducted in recent decades to demonstrate the effects of temperature changes on various organism groups [4,5,6,7,8,9,10]. Ectotherms are among the groups most affected by global warming [11,12], as temperature impacts their organization at all levels, from cellular processes to enzymatic processes [13,14,15,16,17]. These processes determine certain traits among which are: growth, reproduction, metabolism, parasitic relationships, survival and distribution range [9,13,14,15,16,17,18].
The study of thermal ranges is essential to understand numerous aspects of the biology of organisms, since they represent the conditions that limit their fundamental niche and, therefore, their presence and evolution in a certain habitat or geographical area [9,13,19,20,21]. The thermal zone between upper and lower critical limits shapes the thermal tolerance range, where the given species can tolerate the environmental temperatures. The susceptibility of a population, species or community to receive a negative impact, due to climate change will depend on the combination of two factors: First, the sensitivity of the organisms, controlled by intrinsic factors such as thermal tolerance limits (CTmax and CTmin). And second, the amount and variation in exposure to extrinsic environmental stressors, such as extreme temperatures due to climate change [4,5,6,7,8,9,10]. The most recent inferences regarding the impacts of global warming on biodiversity have focused mainly on the extrinsic factors that potentially determine the distribution of species, in front of different climate change scenarios [9,17,18,22].
Given the significance of temperature in the biology and phenology of ectotherms, it is crucial to understand the thermal physiology of organisms for which thermal physiology is unknown, such as the Montseny Brook Newt (Calotriton arnoldi). Moreover, this species is listed as Critically Endangered (CR), according to the IUCN [23] and exhibits a limited geographical distribution and the current population trend is decreasing. Two morphologically and genetic distinct subpopulations have been identified here the eastern and western subpopulations with no gene flow between them [24,25,26,27]. The survival of the species has been primarily affected by logging, deforestation [26], and global warming [28]. Given the known relationship between temperature, climate trend and diversity of responses and strategies of the species of salamanders and newts [15,16,28,29,30,31], it is imperative to understand how C. arnoldi responds to temperature variations, a study not conducted until now, to propose management measures to minimize the effects of this thermal increase. Therefore, the aims of this study are: 1) To determine the critical thermal maximum (CTmax) 2) To determine the tolerance of individuals to cold temperatures below 1°C (CTmin). 3) Determine the preferred body temperature for C. arnoldi.
2. Materials and Methods
2.1. Biosecurity Standards Used
Strict safety measures were employed for the experiments, due to the endangered status of the species. Everybody in contact with the newts had to be disinfected hands and wear surgical gloves [32,33]. All laboratory instruments and materials in contact with water and newts were disinfected with alcohol or sanitizer and rinsed with water before each experiment, and between each group of individuals. Water was changed between each group of individuals and between both subpopulations. Each group of individuals undergoing experiments was observed by more than one researcher to analyse signals, determine the end of the experiments, and prevent any incidents. None of the 60 used individuals for the experiments suffered any harm, and all were returned to their aquariums at the end of the experimentation.
2.2. Experimental Procedure
The study involved exclusively specimens of C. arnoldi kept at the Wildlife Recovery Center of Torreferrussa, located in Santa Perpetua de la Mogoda, Barcelona, Spain. These newts are maintained in aquariums with temperatures ranging from 9°C in winter to 15°C in summer, with lights cycling on and off to simulate natural photoperiods. The two subpopulations, eastern and western, are kept separate within the center to maintain genetic isolation. For this reason, the three experiments (CTmax, CTmin and thermopreferendum) were conducted at different times, first with the western subpopulation and then with the eastern subpopulation. The experimental procedure was conducted from April to July 2019. Thirty individuals from each subpopulation, divided into 5 different groups (6 adult males, 6 adult females, 6 metamorphic juveniles, 6 larvae born in 2017, and 6 larvae born in 2018), were selected for the experiments. Each group underwent the three experiments detailed in Section 2.2.1–Section 2.2.3.
2.2.1. Critical Thermal Maximum (CTmax)
The experiment was conducted following similar procedure to [13,19,34] Before the experiment, the 60 individuals from both subpopulations of C. arnoldi were acclimated to an average temperature of 11.3°C. Each individual was weighed (Suppl. Mat. Table 1), and then placed in a metal mesh basket measuring 8.5 cm in diameter x 8 cm in depth, with a plastic mesh lid to prevent newts from escaping. The 6 baskets were placed in a steel tank measuring 21 cm wide x 51 cm long x 45 cm deep, containing 18 L of water from the aquariums and thus at the newts' acclimation temperature.
A "Digit Cool" immersion thermostat from J.P. Selecta® was used to heat the water. The temperature was increased by 1°C (± 0.5°C) every 3 minutes, and a digital HQ40D multimeter from Hach® was used to measure the temperature (Figure 1). The endpoint of the experiment was the same as considered by other authors: a set of continuous spasms and loss of locomotion or response to stimuli [34]. To determine the response to stimuli, a gentle rubber stirrer was used to lightly touch the individuals and observe their reaction.
2.2.2. Cold Tolerance
The procedure was conducted with the same methodology used in the heat experiment, with the same number of individuals per subpopulation. The "Digit cool" immersion thermostat from J.P. Selecta® was used to cool the tank water, decreasing the temperature by 1°C (± 0.4°C) every 3 minutes. The water temperature was recorded using the HQ40D digital multimeter from Hach®. The endpoint of the experiment was set at 1°C due to issues with the cooler, preventing testing temperatures below freezing and determining the exact critical thermal minimum (CTmin). Each observation and the response of the newts to stimuli were recorded as in the previous experiment.
2.2.3. Preferred Temperature (Tp)
To perform this experiment, a temperature gradient was created in water using a PVC pipe channel measuring 1.50 meters in length and 20 cm in diameter. The tube was divided into three sections separated by fine metal mesh discs: the first section, 25cm long, where a cold source was placed (the same immersion thermostat used in previous experiments), maintaining the temperature at 3.5°C. The second section, 1m long, formed the temperature gradient; at the bottom of this section, approximately 10cm of gravel was placed, and above it, 2 cm of water from the aquariums. The third section, 25cm long, had a heat source (water heater) connected to a thermostat maintaining the temperature at that end at 28°C. Sponges were placed inside the channel every 10 cm, with a hole for newts to pass through; the sponges prevented convective water movement, forming a more stable gradient (Figure 2). It is essential to emphasize that for the gradient to function correctly, constant heat and cold sources, a surface maintaining stable temperature in each zone (in this case, gravel), and elements preventing excessive water circulation within the channel (e.g., sponges) are necessary. Once the gradient was formed, the temperature was measured every 5cm using a fast-response K thermometer from HIBOK 14. The gradient ranged from 3.5°C to 28°C, with an approximately 1°C increase every 5cm (Figure 2). Only 6 males, 6 females, and 6 juveniles from both subpopulations were used for this experiment. The newts were placed in groups of 3 individuals, each group positioned in the channel at the temperature of their acclimation and observed for 40 minutes. After this time, the temperature of the location where the individual was found, the body temperature, the length from snout to cloaca, and the weight were recorded. After each experiment, the temperature was measured every 5cm in the channel to observe if the gradient remained stable.
2.3. Statistical Analysis
For the statistical analysis of Maximum Critical Temperature (MCT) and thermopreferendum (Tp), the "Car" [35], "Stats" [36], and "Pgirmess" [37] packages in the R studio program (version 1.2.1335) were used. For CTmax and CTmin, average values of weights, critical thermal maximum, and minimum reached were calculated for each group of individuals from both populations. Subsequently, correlation tests were performed to determine if there was a correlation between CTmax and the weights of everyone. Pearson correlation was used for groups with normally distributed variables, and Spearman's non-parametric correlation was used for groups in which one or both variables did not show normality. The analyses of CTmax for each group were first performed with both subpopulations combined and then for each subpopulation individually. For parametric data, where the Levene test was not significant (p>0.05), one-way ANOVAs and post-hoc Tukey tests were used. For non-parametric data, where the Levene test was significant (p<0.05), a Kruskal-Wallis test with its respective post-hoc multiple comparison Bonferroni test was used. After analysing each subpopulation, a pairwise test was conducted between each group of individuals from the two populations. Due to the lack of normality in the data, a Wilcoxon paired test was used for comparisons.
For the analysis of data obtained in the thermopreferendum experiment, averages of the temperature at the end of the experiment (Tp), as well as the weight and snout-vent length (SVL) for each group of individuals, were obtained. To determine the preferred temperature range for each group, the tenth and ninetieth percentiles were calculated, which previous studies reliably characterize the thermopreferendum range in newts [14,16]. Similar to the CTmax analyses, a series of correlations were performed. Pearson correlations were used to determine if there was a relationship between Tp and the weight of individuals and between Tp and their SVL. Subsequently, an analysis of Tp for the entire species, i.e., both subpopulations combined, was performed using a one-factor ANOVA with Tukey's post-hoc test. Next, the analysis was conducted for each population; for the eastern population, the same statistics used for the entire species were employed, and for the western population, a Kruskal-Wallis test was used. Finally, paired T-tests were conducted between the groups of both populations to observe if there were differences between them.
3. Results
3.1. Critical Thermal Maximum (CTmax)
At the end of the experiment, all individuals showed a low or no response to external stimuli. The thermal limit was characterized by limb spasms, body contractions, stiffness, and ultimately complete paralysis, from which they immediately recovered upon contact with water at a lower temperature.
Upon analysing both subpopulations together, it was determined that the CTmax is 31.7 °C (± 0.04) for males (N=12); 31.42 °C (± 0.05) for females (N=12); 31.53 °C (± 0.15) for juveniles (N=12); is 32.51 °C (± 0.32); for larvae born in 2017 (N=12) and is 31.69 °C (± 0.19) for larvae born in 2018 (N=12). In the Table 1 we show the results for the two subpopulations (eastern and western) separately. Upon analysing the correlations between weight and TCmax, it was observed that none were significant (p>0.05), indicating that in none of the groups, CTmax is related to the weight of the individuals (Table 1).
When performing the Kruskal-Wallis test for the entire species, highly significant differences were observed between the groups (χ2=13.43; p<0.01). The post-hoc Bonferroni test of multiple comparisons determines that the CTmax of females and larvae born in the year 2017 varied significantly (p<0.05) (Figure 3a). Subsequently, when analysing the populations separately in the western population, it was determined through the non-parametric Kruskal-Wallis test that there are significant differences between the groups (χ2=23.85; p<0.0001). Differences were found between the CTmax of females with both groups of larvae from 2017 and 2018, between larvae from 2017 and males, and between larvae from 2017 and juveniles (p<0.05) (Figure 3b). For the eastern population, the result of the ANOVA was not significant (ANOVA: F=1.39; p>0.05), indicating that there were no significant differences between the CTmax of the five groups in this population (Figure 3c).
Statistical analyses obtained by making paired comparisons between the two populations indicated that only the larvae, from 2017 and 2018, showed significant differences between the populations (W=36; p<0.01 in both cases). The rest of the groups, males, females, and juveniles did not have significant differences in CTmax between the two populations.
Additionally, throughout the experiment, certain signs indicated that individuals were no longer within their comfort temperature. These signs included vomiting, head movement from side to side, small spasms, and mouth opening. Given the similarity in CTmax between males, females, and juveniles from the two populations, the temperature at which these discomfort signals occurred was considered as a single group. Notably, out of the total individuals, 13 exhibited these discomfort signals at an average temperature of 26.24°C (± 0.27), with a minimum of 24.5°C and a maximum of 27.3°C.
3.2. Cold Tolerance
At the end of the experimentation with low temperatures, it was observed that individuals from the western population, including males (N=6), larvae from 2017 (N=6), and larvae from 2018 (N=6), resisted without reaching their critical minimum temperature up to 1°C. However, in females (N=6), two individuals did not withstand this temperature and had to be removed from the experiment at 1.1°C and 1.5°C, respectively. Similarly, in juveniles from the same population (N=6), this behaviour was observed in three individuals (two at 1.1°C and one at 1.2°C). This indicates that out of 30 individuals from the population across the 5 groups, only 5 individuals reached the CTmin at an average temperature of 1.2°C (± 0.08). The signals exhibited by these individuals were similar to those observed for CTmax. For the remaining individuals, the temperature at which they became lethargic and responded slowly to external stimuli was determined, averaging 2.05°C (± 0.19). In the eastern population, it was observed that all individuals from the 5 groups: males, females, juveniles, larvae from 2017, and larvae from 2018, could withstand temperatures up to 1°C without reaching their CTmin. The lethargy temperature for these individuals was determined to be 1.78°C (± 0.18).
3.3. Preferred Temperature (Thermopreferendum–Tp)
The newts used in the experiment exhibited similar behavior across all groups. When placed in the thermopreferendum channel (Tp), they actively moved along the gradient for several minutes until they became stationary in the zone they preferred. After approximately 20 minutes, they showed reduced activity in the channel. Notably, no individual moved to the last box ranging from 22 to 28°C, nor towards the opposite end where the temperature ranged from 3.5 to 5°C.
In the overall analysis of the entire species, both populations combined, males (N=12) had a Tp of 14.89 °C (±0.92) within a range of 11.7 to 19.48°C. Females (N=12) exhibited a Tp of 17.51°C (±0.67) within a range of 15.22 to 20.88°C. Finally, juveniles (N=12) showed an average Tp of 18.24°C (±0.87) within a range of 13.79 to 21.5°C. In the Table 2 we show the results for the two subpopulations (Eastern and Western) separately. Correlations between Tp and individual weight, as well as Tp and body length, were not significant (p>0.05), indicating that Tp for different groups was not related to these variables (Table 2).
The ANOVA conducted for the data obtained for the entire species had a significant result (F=4.55; p<0.05), indicating differences among the three groups (males, females, and juveniles). Post-hoc Tukey test determined that the only significant difference is between males and juveniles (p<0.05).
Males exhibited a lower Tp and a temperature range that included relatively colder temperatures (Figure 4a). When analysing the results for each population separately, significant differences were observed between groups in the western population (χ2=8.80; p<0.05), specifically between males and females, and males and juveniles (p<0.05). This result clearly indicates that males have a preferred range with lower temperatures than the other two groups. Additionally, juveniles can occupy a broad range of temperatures that even surpass those of the adults (Figure 4b). For the eastern population, the ANOVA did not reveal significant differences among the three groups (F=1.17; p>0.05). However, it can be observed that males still exhibit a lower Tp, as observed in the other population, although not statistically proven (Figure 4c). When performing pairwise comparisons using the t-test, no significant differences were found between males, females, and juveniles from the two populations (p>0.05).
4. Discussion
4.1. Thermal Tolerance of Calotriton arnoldi Species
The Critical thermal maximum (CTmax) is determined by a set of spasms and loss of locomotor response [19,34]. Considering this background, it can be stated that individuals of C. arnoldi behaved similarly to what [13,19,34] described. In other words, most individuals had a well-defined thermal limit from which they recovered upon contact with cooler water. Considering both subpopulations of C. arnoldi together, all groups present a similar average of critical thermal maximum (CTmax), surpassing 31°C except the larvae born in 2017, showing a significant difference whit the other classes (Figure 3). However, this occurs only in the Western subpopulation. Both 2018 and 2017 larvae have significatively higger CTmax compared to the other groups.
One possible hypothesis to explain these significant differences in CTmax only in Western population could be related to the dissimilarities in habitat structure [26,27] and temperature range in Western streams. In fact, maximal and minimal water temperatures of Western populations streams are slightly higher than Eastern streams [26]. This could have led to the development of some local temperature adaptation factor during the larval stage, given the morphological and genetic differences between the two subpopulations [25], because of divergence between Eastern and Western Montseny lineages seems to have taken place later, around 111 kya (68–155 kya), roughly matching with a warmer period: the Riss-Würm Interglacial [27]. Previous studies have shown that differences in CTmax within a species or between several species of salamanders are correlated with habitat thermal regimes. Therefore, optimal CTmax adjustment patterns can vary from one habitat to another [13,29]. This ecological adaptation or perhaps plasticity in thermal adjustment need to be studied in detail. because in other stream-dwelling newts, [38] there have been identified significant intraspecific morphological and niche differentiation, suggesting that newt morphology -or CTmax in our study- is responsive to environmental factors. Fluctuations in temperature and the relationship between physiological maxima and environmental climate could be geographically variable and dependent on extrinsic more than intrinsic characteristics [39]. However, the lack of knowledge of the thermal ecology of C. arnoldi and its physiology does not allow us to define what factors determine these differences. Whether they are adaptive with a genetic basis or a result of phenotypic plasticity or acclimatisation.
In Western populations we also found significant differences in CTmax between the larvae born in 2017 and 2018. We hypothesize that the age of the larvae could be the explanation of this dissimilarity. Some studies in different amphibian species have demonstrated differences in CTmax between larvae at different stages and adults due to thermal pressures. However, the reason for these differences is poorly understood [40,41]. In the case of this study, it could be that the 2017 larvae have already lived one year in water with high and low water temperatures in summer and winter, respectively, and, therefore, larvae born in 2017 may have acquired some thermal tolerance or acclimation compared to the young 2018 larvae.
Despite these differences between larvae, the species shows a CTmax, ranging between 31 and 33 °C. This range is like other species of salamanders in temperate zones, which had CTmax ranges from 32 to 34°C [13]. Additionally, during the study, 13 individuals showed significant signs of discomfort, one of them being vomiting at an average temperature of 26°C (24.5°C – 27.3°C). These signs could indicate the thermal conformity limit for the species, which, if prolonged, could be detrimental to its survival as has been observed in other larval species [42] which found that response to warm water for extended periods may be lethal. This temperature could be more plausible to reach in nature because of in western streams some records of water temperatures exceed sightly the 20ºC [26] and in the future these values will be more frequent and prolonged in time in a context of climate change [28].
On the other hand, tolerance to cold or freezing is a key factor in the survival of organisms. It has been observed that some ectotherms, mostly in temperate zones, exhibit resistance to extremely low temperatures, even below freezing [43,44]. Therefore, cold tolerance tends to be extreme or higher in temperate zones, where latitude is greater. Altitude also plays a significant role, with species from higher altitudes being more resistant than those from lower altitudes [45]. As C. arnoldi is a species that mainly inhabits cold-water streams in Montseny [23,46,47] and also thrives in elevated areas, it was expected to have a fairly high cold tolerance, as demonstrated in this study.
During the experimentation, it was observed that most individuals began to become sluggish and move slowly just before or after reaching 2°C. However, they did not show any signs of having reached their critical thermal minimum (CTmin), indicating that their limit would be at temperatures below 1°C. This tolerance has been described in other amphibians such as Desmognathus fuscus, a salamander inhabiting mountain streams, which can exhibit a CTmin below 0°C depending on acclimatization [29]. There is a known relationship between both critical temperatures, and the hypothesis suggests that maintaining a low CTmin can be costly for organisms with a high CTmax and vice versa [29,44}. This could explain why C. arnoldi presents good cold tolerance, but its CTmax is not as high as that of other tropical organisms, which may have CTmax exceeding 40°C [48]. However, as acclimatisation temperatures were not used in this study, it is suggested that future measurements of CTmax and cold tolerance take this factor into account to determine if there are variations.
4.2. Preferred Body Temperature Range (Tp) of Montseny Newt in the Laboratory
Calotriton arnoldi individuals are known to inhabit cold-water streams not exceeding 15°C with steep slopes, at an altitude ranging from 600 to 1200 meters above sea level [24,26,46,47]. However, the preferred body temperature range (Tp) of the species was unknown until this study. It was determined that this species exhibits a broad thermopreferendum range (under laboratory conditions), ranging from cold temperatures of 11.7°C to moderate temperatures of 21.6°C. This was unexpected, as it was initially believed that the species would prefer colder temperatures.
Although the Tp range presented by this species seems high, it is lower than the Tp range of the Calotriton asper sister species, which had a temperature range from 11.10°C to 32°C depending on the altitude of the individuals [31]. These authors observed that C. asper individuals at higher altitudes had a broader Tp range than those at lower altitudes. This demonstrates that this species did not follow what is postulated in the "optimal local hypothesis", which states that individuals at lower altitudes will have a higher Tp than individuals at higher altitudes [49]. On the contrary, they adhered to the "countergradient hypothesis", which states that organisms at medium and high altitudes seek warmer preferred temperatures to compensate for the limited opportunity to be in favourable temperatures [50] and thus perform vital functions for their life cycle (locomotion, reproduction, digestion) [30]. This may explain to some extent why C. arnoldi individuals exhibit a thermopreferendum with temperatures often exceeding 15°C or the temperature to which they are acclimated.
It's important to emphasize that there are differences in thermopreferendum among different groups (males, females, and juveniles) within the species, both in the western and eastern populations. These differences primarily stem from the fact that males within the thermopreferendum channel choose colder temperatures than females and juveniles. Moreover, juveniles might be capable of occupying larger Tp ranges than adults, even reaching higher temperatures than the other two groups. These differences could be attributed to the fact that, in nature, males are found in colder and more oxygenated waters, while females and juveniles tend to be in warmer waters and concealed in the stream [51,52]. An important consideration for future studies is that thermopreferendum could increase or decrease due to various factors such as pregnancy in females, digestion [14,16], seasonality, and acclimatization [53]. However, previous studies have shown that acclimatization did not influence the Tp range choice in some species in temperate zones [13,30}. Therefore, due to the current lack of knowledge about C. arnoldi, it is necessary to conduct a study that involves more factors such as seasonality, digestion, pregnancy, among other parameters, to determine if there is an increase or decrease in Tp throughout the year in this species.
4.3. Ecological Implications and Management Measures
From the analysis of the data obtained in this study, we can observe the significant influence of temperature on the species C. arnoldi, which is crucial for a better understanding of its biology and ecology. Understanding the patterns that lead to the thermal physiology of a species is important to comprehend the evolutionary responses that different organisms may present to climate variations, thereby predicting their future and responses to climate change more effectively (Ledesma et al., 2019). temperature monitoring in Montseny determined that the ambient temperature is rapidly increasing, averaging 0.3°C per decade since the second half of the 20th century [28]. This, combined with the deforestation suffered by the newt's habitat [54,55] and the expansion of the oak forest towards beech forest natural areas, has led to prolonged drought periods that threaten the species' survival in the wild [18].
While it is true that highly unlikely that temperatures in streams will increase to reach the species' critical maximum temperature (CTmax) in the near future, there is a high probability their temperature may rise to levels unsuitable for the species or even that streams may dry up. This is due to the temperature increase in the massif, especially due to the loss of vegetation cover, as direct radiation significantly affects water temperature [54}. The suboptimal temperature for the species can be set at 26ºC, where individuals showed signs of discomfort such as vomiting. Reaching this temperature or experiencing prolonged drought periods would have several implications for the species. On one hand, it could alter its distribution range [9,18], as happened with its sister species C. asper, in which climate change reduced its range, and due to its limited dispersal capacity, genetic loss may have occurred [56]. This can also happen to the Montseny newt, which would have to migrate during warmer or even dry periods, to find niches where stream temperatures are within its preferred or optimal range. If suitable sites are not found, individuals and genetic diversity may be lost, potentially leading to the species' extinction [27,56].
Studies carried out between 1983 and 2015 in one stream located into the distribution area of C. arnoldi [57] showed that the air temperature has increased 0.6 ± 0.057 ºC/decade, but the water temperature did not. Authors propose two hypotheses: ground water fed streams, especially during the dry season, and the maintenance of a high riparian canopy in the stream, which would avoid direct solar radiation [57].
For this reason, one of the proposed management measures for the conservation of this species would be to maintain the vegetation cover of the streams where newts are found to prevent an increase in their temperature according to [42] who observes that absence or reduction of forest canopy after logging results in increased stream temperatures,. These effects may be amplified in areas with a variable Mediterranean climate like the Montseny massif, where streams have cold but low groundwater flows, making them more vulnerable to warming [26]. Additionally, water extraction from Montseny streams must be be regulated by authorities. Excessive exploitation of this resource, which is essential for the newt, could lead to habitat loss or destruction. Implementing these measures could provide safe habitats for the development of existing populations and populations planned for reintroduction [26].
5. Conclusions
During this study, it is concluded that Calotriton arnoldi has a CTmax that exceeds 31°C in all groups. The larvae of the western population are the only ones that have a CTmax higher than 32°C, which could be due to habitat heterogeneity and their developmental stage. On the other hand, males, females, and juveniles did not show differences between both populations. It is also determined that the temperature from 24.5°C to 27°C could be a conformity limit that should be studied thoroughly.
It is observed that the Montseny newt, being a species found in high-altitude areas and in cold-water streams, has a good cold tolerance in all studied groups. Its minimum critical temperature would likely be less than 1°C.
It is also determined that the thermopreferendum of C. arnoldi ranges form 11.7°C to 21.6°C. It is a broad range but lower than the one reported for its sister species C. asper (11.10 - 32°C). However, it presents warmer temperatures than expected. This can be explained by the "countergradient hypothesis “. It is also observed that males choose colder temperatures than females and juveniles in both populations (more in the western than in the eastern). This can be due to differences in the species' ecology.
The results presented in this study are an advance in the knowledge of the thermal physiology of this species and support the importance of stream temperature for the survival of C. arnoldi. Knowing its thermal limits and its preferred temperature range will help to propose management measures that promote the conservation of Montseny streams and their riparian vegetation to mitigate temperature increase due to climate change.
Supplementary Materials
The following supporting information can be downloaded at the website of this paper posted on Preprints.org, Table S1: C.arnoldi Suppl.Mat. Table1.pdf.
Author Contributions
Conceptualization, J.C., J.G. A.M.; methodology, J.C., J.G. A.M.; software, J.C. D.V.; validation, all authors; formal analysis, J.C.; investigation, all authors; J.C.; writing—original draft preparation, J.C. and D.V.; writing—review and editing, all authors; supervision, J.G. and A.M.; project administration, J.G. and A.M. All authors have read and agreed to the published version of the manuscript.
Funding
This research was funded by Diputació de Barcelona. Life projects of the European (LIFE15NAT/ES/000757).
Institutional Review Board Statement
The animal study protocol was approved by the Institutional Review Board of Life Programme (LIFE15NAT/ES/000757 in October 2018). Commission (LIFE15 NAT/ES/000757). Permission for manipulation animals was given by the experimental committee of University of Barcelona (CEEA: 2464/01 and 2501/01).
Acknowledgments
First: we want to thank the entire team at the Wildlife Recovery Center of Torreferrusa Generalitat de Catalunya - Spain, especially Francesc Carbonell and Raquel Larios, who were present at every step of the experiments, providing their support and knowledge about the Montseny newt. Permits for experimental design granted by: Diputació de Barcelona (DIBA20140609, Servei de Fauna de la Generalitat de Catalunya: SF/0539/2019).
Conflicts of Interest
The authors declare no conflicts of interest.
References
- IPCC. Global Warming of 1.5°C. An IPCC Special Report on the impacts of global warming of 1.5°C above pre-industrial levels and related global greenhouse gas emission pathways, in the context of strengthening the global response to the threat of climate change, sustainable development, and efforts to eradicate poverty. [asson-Delmotte, V., P. Zhai, H.-O. Pörtner, D. Roberts, J. Skea, P.R. Shukla, A. Pirani, W. Moufouma-Okia, C. Péan, R. Pidcock, S. Connors, J.B.R. Matthews, Y. Chen, X. Zhou, M.I. Gomis, E. Lonnoy, T. Maycock, M. Tignor, and T. Waterfield (eds.). Cambridge University Press: Cambridge, UK; New York, NY, USA, p. 616. [CrossRef]
- Morgan, R.; Finnøen, M.H.; Jensen, H.; Pélabon, C.; Jutfelt, F. Low potential for evolutionary rescue from climate change in a tropical fish. Proc. Natl. Acad. Sci. USA 2020, 117, 33365–33372. [Google Scholar] [CrossRef] [PubMed]
- Malhi, Y.; Franklin, J.; Seddon, N.; Solan, M.; Turner, M.G.; Field, C.B.; Knowlton, N. Climate change and ecosystems: threats, opportunities and solutions. Phil. Trans. R. Soc. B 2020, 375, 20190104. [Google Scholar] [CrossRef]
- Tejedo, M.; Duarte, H.; Gutiérrez-Pesquera, L.M.; Beltrán, J.F.; Katzenberger, M.; Marangoni, F.; Navas, C.A. Nicieza, A.C.; Reylea, R.A.; Rezende, E.L.; et al. El estudio de las tolerancias térmicas para el examen de hipótesis biogeográficas y de la vulnerabilidad de los organismos ante el calentamiento global. Ejemplos en anfíbios. Bol. Asoc. Herpetol. Esp.
- Parmesan, C.; Morecroft, M.D.; Trisurat, Y. Climate Change 2022: Impacts, Adaptation and Vulnerability. [Research Report] GIEC. 2022. ffhal-03774939f. https://hal.science/hal-03774939 .
- Parmesan, C. Ecological and Evolutionary Responses to Recent Climate Change. Annu. Rev. Ecol. Evol. Syst. 2006, 37, 637–669. [Google Scholar] [CrossRef]
- Parmesan, C.; Hanley, M. Plants and climate change: complexities and surprises. Ann. Bot. 2015, 16, 849–864. [Google Scholar] [CrossRef]
- Parmesan, C.; Singer, M.C. Mosaics of climatic stress across species' ranges: tradeoffs cause adaptive evolution to limits of climatic tolerance. Philosophical Transactions of the Royal Society B: Biological Sciences 2021, 377, 20210003. [Google Scholar] [CrossRef]
- Enriquez-Urzelai, U.; Bernardo, N.; Moreno-Rueda, G.; Montori, A.; Llorente, G. Are amphibians tracking their climatic niches in response to climate warming? A test with Iberian amphibians. Clim. Change 2019, 154, 289–301. [Google Scholar] [CrossRef]
- Brown, C.J.; O'Connor, M.I.; Poloczanska, E.S.; Schoeman, D.S.; Buckley, L.B.; Burrows, M.T.; Duarte, C.M.; Halpern, B.S.; Pandolfi, J.M.; Parmesan, C.; et al. Ecological and methodological drivers of species’ distribution and phenology responses to climate change. Glob. Change Biol. 2016, 22, 1548–1560. [Google Scholar] [CrossRef] [PubMed]
- Dillon, M.E.; Wang, G.; Huey, R.B. Global metabolic impacts of recent climate warming. Nature 2010, 467, 704–706. [Google Scholar] [CrossRef]
- Paaijmans, K.P.; Heinig, R.L.; Seliga, R.A.; Blanford, J.I.; Blanford, S.; Murdock, C.C.; Thomas, M.B. Temperature variation makes ectotherms more sensitive to climate change. Glob. Change Biol. 2013, 19, 2373–2380. [Google Scholar] [CrossRef]
- Spotila, J.R. Role of Temperature and Water in the Ecology of Lungless Salamanders. Ecological Monographs 1972, 42, 95–125. [Google Scholar] [CrossRef]
- Gvoždík, L. Does reproduction influence temperature preferences in newts? Canadian Journal of Zoology 2005, 83, 1038–1044. [Google Scholar] [CrossRef]
- Gvozdik, L. Plasticity of preferred body temperatures as means of coping with climate change? Biology Letters 2012, 8, 262–265. [Google Scholar] [CrossRef]
- Gvoždík, L.; Kristín, P. Economic thermoregulatory response explains mismatch between thermal physiology and behaviour in newts. J. Exp. Biol. 2017, 220, 1106–1111. [Google Scholar] [CrossRef] [PubMed]
- Teixeira, J.; Arntzen, J. Potential impact of climate warming on the distribution of the Golden-striped salamander, Chioglossa lusitanica, on the Iberian Peninsula. Biodivers. Conserv. 2002, 11, 2167–2176. [Google Scholar] [CrossRef]
- Moreno-Rueda, G.; Pleguezuelos, J.M.; Pizarro, M.; Montori, A. Northward Shifts of the Distributions of Spanish Reptiles in Association with Climate Change. Conserv. Biol. 2012, 26, 278–283. [Google Scholar] [CrossRef] [PubMed]
- Hutchison, V.H. Critical thermal maximum in salamanders. Physiol. Zool. 1961, 34, 92–125. [Google Scholar] [CrossRef]
- Kearney, M.; Shine, R.; Porter, W.P. The potential for behavioural thermoregulation to buffer ‘cold-blooded’ animals against climate warming. Proc. Natl. Acad. Sci. USA 2009, 106, 3835–3840. [Google Scholar] [CrossRef] [PubMed]
- Angilletta, M.J.; Niewiarowski, P.H.; Navas, C.A. The evolution of thermal physiology in ectotherms. J. Therm. Biol. 2002, 27, 249–268. [Google Scholar] [CrossRef]
- Montori, A.; Amat, F. Surviving on the edge: present and future effects of climate warming on the common frog (Rana temporaria) population in the Montseny massif (NE Iberia). PeerJ 2023, 11, e14527. [Google Scholar] [CrossRef]
- IUCN. The IUCN Red List of Threatened Species. Version 2023-1. 2023. Available online: https://www.iucnredlist.org (accessed on 12 May 2024).
- Carranza, S.; Amat, F. Taxonomy, biogeography and evolution of Euproctus (Amphibia: Salamandridae), with the resurrection of the genus Calotriton and the description of a new endemic species from the Iberian Peninsula. Zool. J. Linn. Soc. 2005, 145, 555–582. [Google Scholar] [CrossRef]
- Valbuena-Ureña, E.; Amat, F.; Carranza, S. Integrative phylogeography of Calotriton newts (Amphibia, Salamandridae), with special remarks on the conservation of the endangered Montseny brook newt (Calotriton arnoldi). PLoS ONE 2013, 8, e62542. [Google Scholar] [CrossRef]
- Guinart, D.; Solórzano, S.; Amat, F.; Grau, J.; Fernández-Guiberteau, D.; Montori, A. Habitat Management of the Endemic and Critical Endangered Montseny Brook Newt (Calotriton arnoldi). Land 2022, 11, 449. [Google Scholar] [CrossRef]
- Talavera, A.; Palmada-Flores, M.; Burriel-Carranza, B.; Valbuena-Ureña, E.; Mochales-Riaño, G.; Adams, D.C.; Tejero-Cicuéndez, H.; Soler-Membrives, A.; Amat, F.; Guinart, D.; et al. Genomic insights into the Montseny brook newt (Calotriton arnoldi), a Critically Endangered glacial relict. iScience 2024, 27, 108665. [Google Scholar] [CrossRef] [PubMed]
- Peñuelas, J.; Boada, M. A global change-induced biome shift in the Montseny mountains (NE Spain). Glob. Change Biol. 2003, 9, 131–140. [Google Scholar] [CrossRef]
- Layne, J.R.J.; Claussen, D. The time courses of CTmax and CTmin acclimation in the salamander Desmognathus fuscus. J. Therm. Biol. 1982, 7, 139–141. [Google Scholar] [CrossRef]
- Šamajová, P.; Gvoždík, L. The influence of temperature on diving behaviour in the alpine newt, Triturus alpestris. J. Therm. Biol. 2009, 34, 401–405. [Google Scholar] [CrossRef]
- Trochet, A.; Dupoué, A.; Souchet, J.; Bertrand, R.; Deluen, M.; Murarasu, S.; Calvez, O.; Martinez-Silvestre, A.; Verdaguer-Foz, I.; Darnet, E.; et al. Variation of preferred body temperatures along an altitudinal gradient: a multi-species study. J. Therm. Biol. 2018, S0306456518301736. [Google Scholar] [CrossRef] [PubMed]
- Fernández-Guiberteau, D.; Montori, A.; Pérez-Sorribes, L.; Carranza, S. Protocols Sanitaris per a les Activitats que Impliquin la Interacció Directa o Indirecta amb les Poblacions D’amfibis al Medi Natural; LIFETM Docs: Barcelona, Spain, 2020; 15p, Available online: https://lifetritomontseny.eu/documents/107349215/342993610/Bones_PractiquesWEB.pdf/11a7c63b-cd53-0e37-0cf5-737c18daded8?t=1602242474228 (accessed on 24 January 2023).
- Martínez-Silvestre, A.; Graciá, E.; Giménez, A.; Cadenas, V.; García de la Fuente, M.I.; Thumsová, B.; Bosch, J.; Bioseguridad en trabajos de campo con reptiles y anfibios. Bol. Asoc. Herpetol. Esp. 2023, 34, 3–16. Available online: http://www.herpetologica.org/BAHE/34/BAHE34[I_1158].pdf (accessed on 23 June 2024).
- Lutterschmidt, W.I.; Hutchison, V.H. The onset of spasms as the definitive end point. Can. J. Zool. 1997, 75, 1553–1560. [Google Scholar] [CrossRef]
- Fox, J.; Weisberg, S. An {R} Companion to Applied Regression, Third Edition. Thousand Oaks CA: Sage Publications. Inc. 2019, 608 pages https://socialsciences.mcmaster.ca/jfox/Books/Companion/.
- R Core Team. R: A language and environment for statistical computing. R Foundation for Statistical Computing, Vienna, Austria, 2019. https://www.R-project.org/.
- Giraudoux, P. pgirmess: Spatial Analysis and Data Mining for Field Ecologists. R package version 1.6.9. 2018. https://cran.r-project.org/web/packages/pgirmess/index.html.
- Tran, D.V.; Phan, D.V.; Lau, K.A.; Nishikawa, A. Ecological niche variation drives morphological differentiation in tropical stream-dwelling newts from Indochina. Journal of Zoology, 2024; Early View (29 April 2024). [Google Scholar] [CrossRef]
- Strickland, J.C.; Pinheiro, A.P.; Cecala, K.K.; Dorcas, M.E. Relationship between Behavioral Thermoregulation and Physiological Function in Larval Stream Salamanders. J. Herpetol. 2016, 50, 239–244. [Google Scholar] [CrossRef]
- Cupp, P.V. Thermal Tolerance of Five Salientian Amphibians during Development and Metamorphosis. Herpetologica 1980, 36, 234–244. [Google Scholar]
- Bury, R.B. Low thermal tolerances of stream amphibians in the Pacific Northwest: Implications for riparian and forest management. Appl. Herpetol. 2008, 5, 63–74. [Google Scholar] [CrossRef]
- Bury, R.B. Low thermal tolerances of stream amphibians in the Pacific Northwest: Implications for riparian and forest management. Appl. Herpetol. 2008, 5, 63–74. [Google Scholar] [CrossRef]
- Costanzo, J.P.; Lee, R.E. Avoidance and tolerance of freezing in ectothermic vertebrates. J. Exp. Biol. 2013, 216, 1961–1967. [Google Scholar] [CrossRef] [PubMed]
- Vo, P.; Gridi-Papp, M. Low temperature tolerance, cold hardening and acclimation in tadpoles of the neotropical túngara frog (Engystomops pustulosus). J. Therm. Biol. 2017, 66, 49–55. [Google Scholar] [CrossRef] [PubMed]
- Sanabria, E.A.; Rodríguez, C.Y.; Vergara, C.; Ontivero, E.; Banchig, M.; Navas, A.L.; Herrera-Morata, M.; Quiroga, L.B. Thermal ecology of the post-metamorphic Andean toad (Rhinella spinulosa) at elevation in the monte desert, Argentina. Journal of Thermal Biology 2015, 52, 52–57. [Google Scholar] [CrossRef] [PubMed]
- Montori, A.; Campeny, R. Situación actual de las poblaciones de tritón pirenaico, Euproctus asper, en el macizo del Montseny. Boletín de la Asociación Herpetológica Española 1991, 2, 10–12. [Google Scholar]
- Amat, F.; Montori, A. El tritó del Montseny Calotriton arnoldi i els amfibis i rèptils del Parc Natural i Reserva de la Biosfera del Montseny. Granollers, Museu de Ciències Naturals de Granollers Eds. 2023. p. 196.
- Katzenberger, M.J. Thermal Tolerance and Sensitivity of Amphibian Larvae from Paleartic and Neotropical communities. Trabajo de Fin de Master. 2009. Universidad de Lisboa.
- Levinton, J.S. The latitudinal compensation hypothesis: growth data and a model of latitudinal growth differentiation based upon energy budgets. I. Interspecific comparison of Ophryotrocha (Polychaeta: dorvilleidae). Biol. Bull. 1983, 165, 686–698. [Google Scholar]
- Fangue, N.A.; Podrabsky, J.E.; Crawshaw, L.I.; Schulte, P.M. Countergradient variation in temperature preference in populations of killifish, Fundulus heteroclitus. Physiol. Biochem. Zool. 2009, 82, 776–786. [Google Scholar] [CrossRef] [PubMed]
- Montori, A. Is the Pyrenean newt (Calotriton asper) a thermoconformer? Cloacal and water temperature in two different thermal periods in a Pre-Pyrenean stream population. Basic and Applied Herpetology 2024, (accepted; in press). [Google Scholar] [CrossRef]
- Montori, A.; Llorente, G.A.; Richter-Boix, A. Habitat features affecting the small-scale distribution and longitudinal migration patterns of Calotriton asper in a pre-Pyrenean population. Amphibia-Reptilia 2008, 29, 371–381. [Google Scholar] [CrossRef]
- Hadamová, M.; Gvoždík, L. Seasonal Acclimation of Preferred Body Temperatures Improves the Opportunity for Thermoregulation in Newts. Physiol. Biochem. Zool. 2011, 84, 166–174. [Google Scholar] [CrossRef]
- Amat, F.; Roig, J.M. Amfibis al límit, conservació de Rana temporaria i Euproctus asper al límit meridional de la seva distribució, al Parc Natural del Montseny. Simposi Sobre del Declivi de les Poblacions d'Amfibis. Lleida, 2004 marzo de 2004.
- Ledesma, J.L.J.; Montori, A.; Altava-Ortiz, V.; Barrera-Escoda, A.; Cunillera, J.; Àvila, A. Future hydrological constraints of the Montseny brook newt (Calotriton arnoldi) under changing climate and vegetation cover. Ecol. Evol. 2009, ece3.5506. [Google Scholar] [CrossRef]
- de Pous, P.; Montori, A.; Amat, F.; Sanuy, D. Range contraction and loss of genetic variation of the Pyrenean endemic newt Calotriton asper due to climate change. Reg. Environ. Change 2016, 16, 995–1009. [Google Scholar] [CrossRef]
- Avila, A.; Fernández-Martínez, M. El canvi climàtic al Montseny: anàlisi de les tendències de variació de la temperatura de l’aire i l’aigua a la vall de la Castanya en les tres darreres dècades. IX Trobada D’estudiosos Del Montseny, 2018; 454–464, Diputació de Barcelona. [Google Scholar]
Figure 1.
Experimental design used (Steel tank, baskets and digit cool thermostat) to measure the CTmax and cold tolerance of Calotriton arnoldi.
Figure 1.
Experimental design used (Steel tank, baskets and digit cool thermostat) to measure the CTmax and cold tolerance of Calotriton arnoldi.
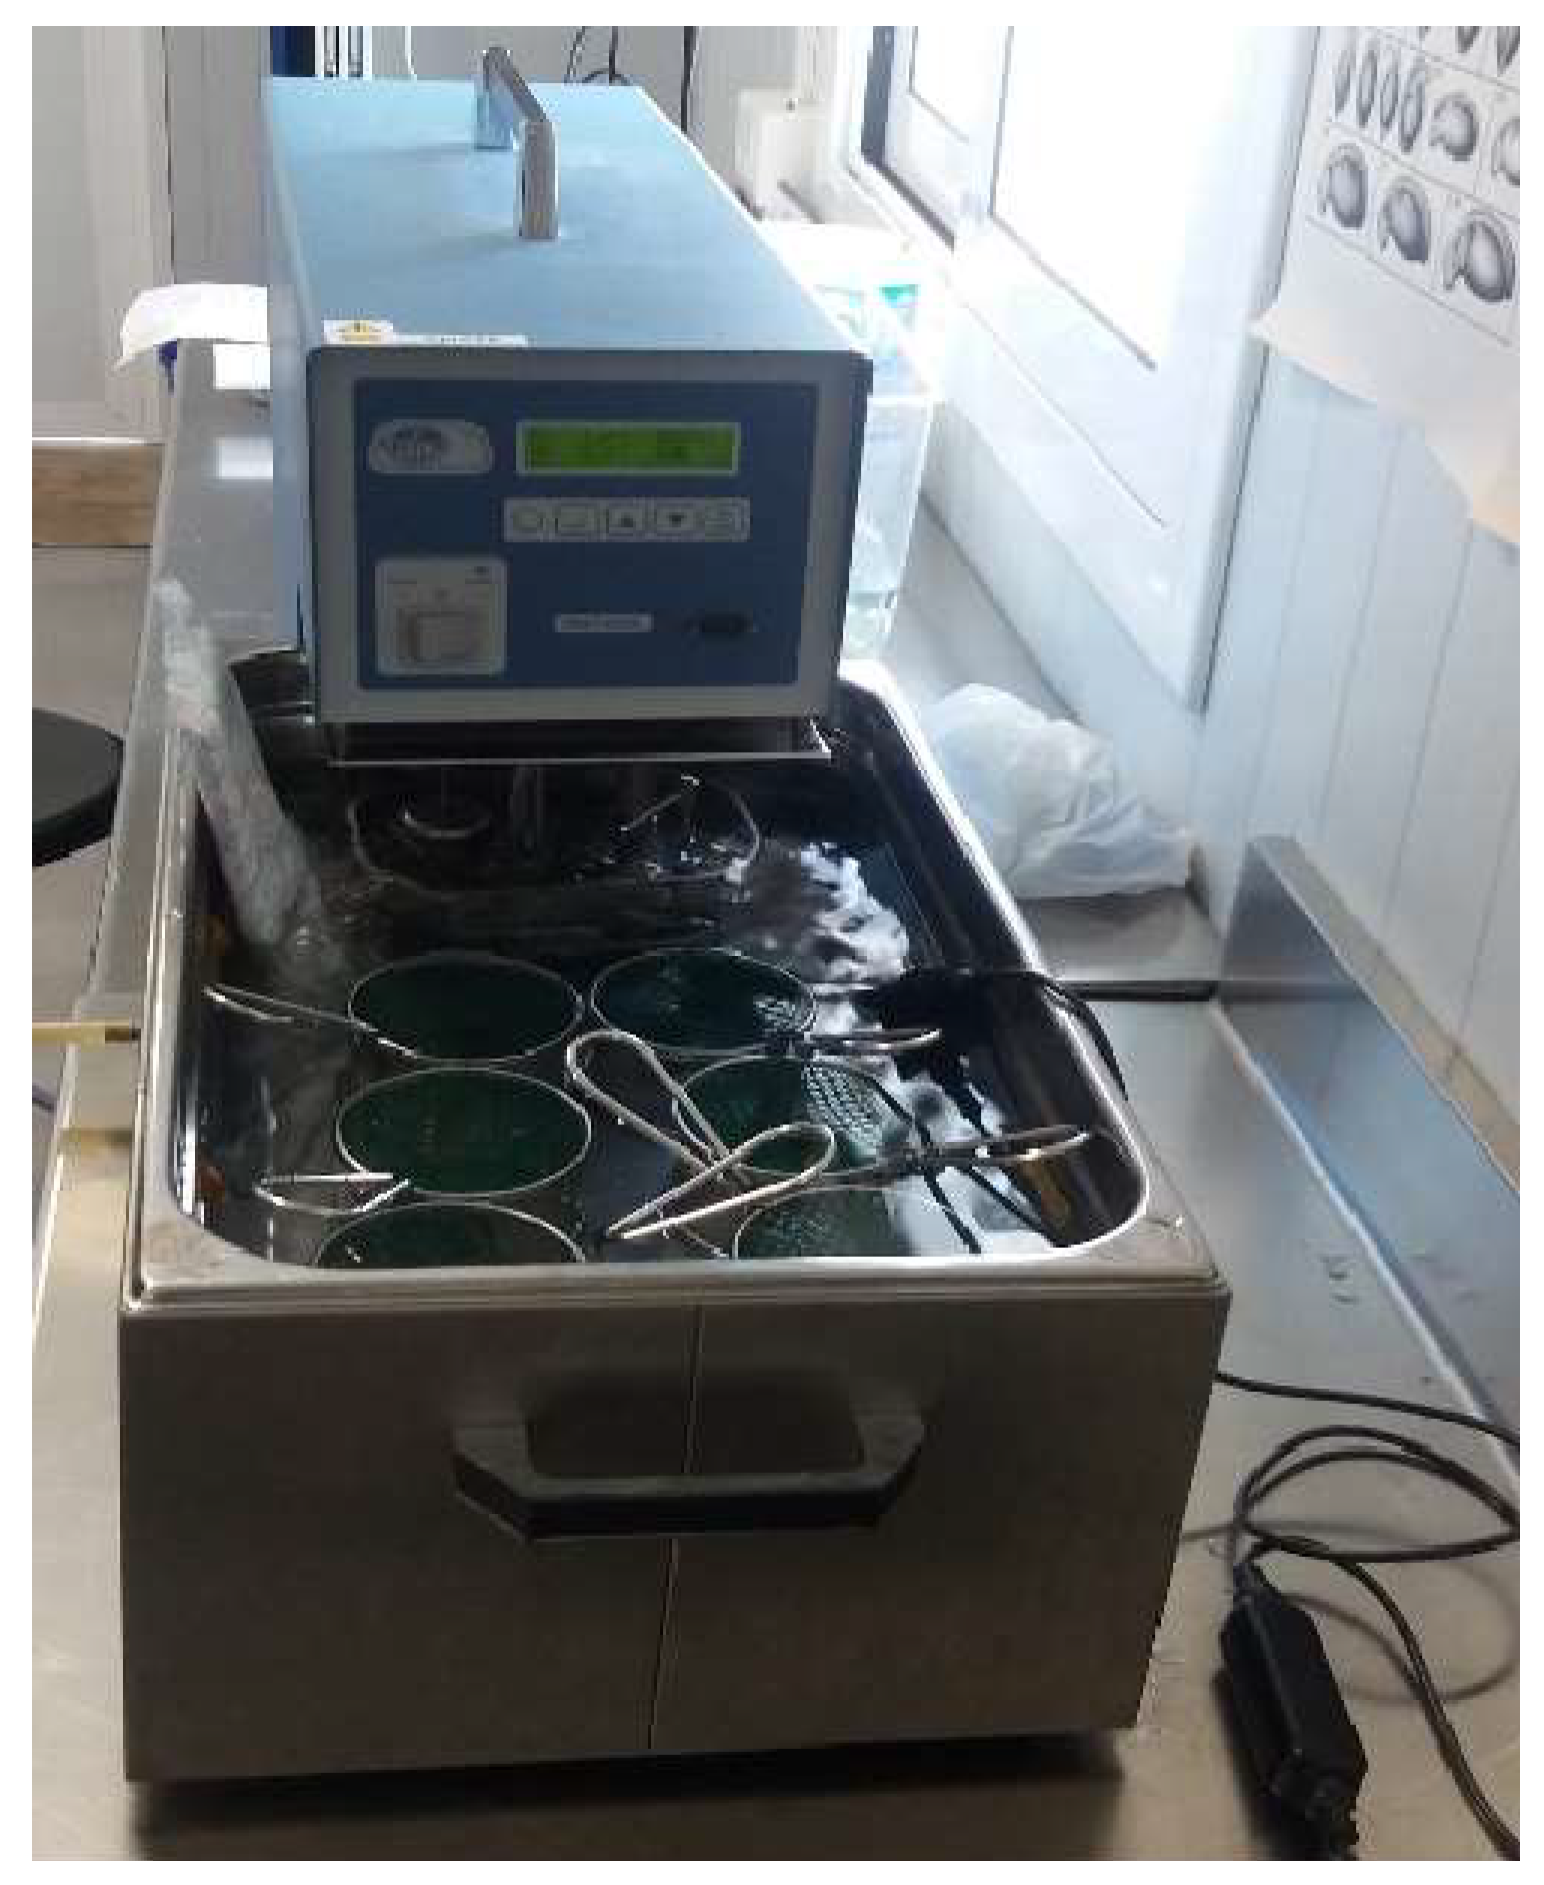
Figure 2.
Left: Thermopreferendum channel used to measure the Preferred Body Temperature of Calotriton arnoldi. Right: Temperature gradient obtained in the 1m. thermopreferendum channel. The minimum temperature was 3.5°C, and the maximum temperature was 28°C.
Figure 2.
Left: Thermopreferendum channel used to measure the Preferred Body Temperature of Calotriton arnoldi. Right: Temperature gradient obtained in the 1m. thermopreferendum channel. The minimum temperature was 3.5°C, and the maximum temperature was 28°C.
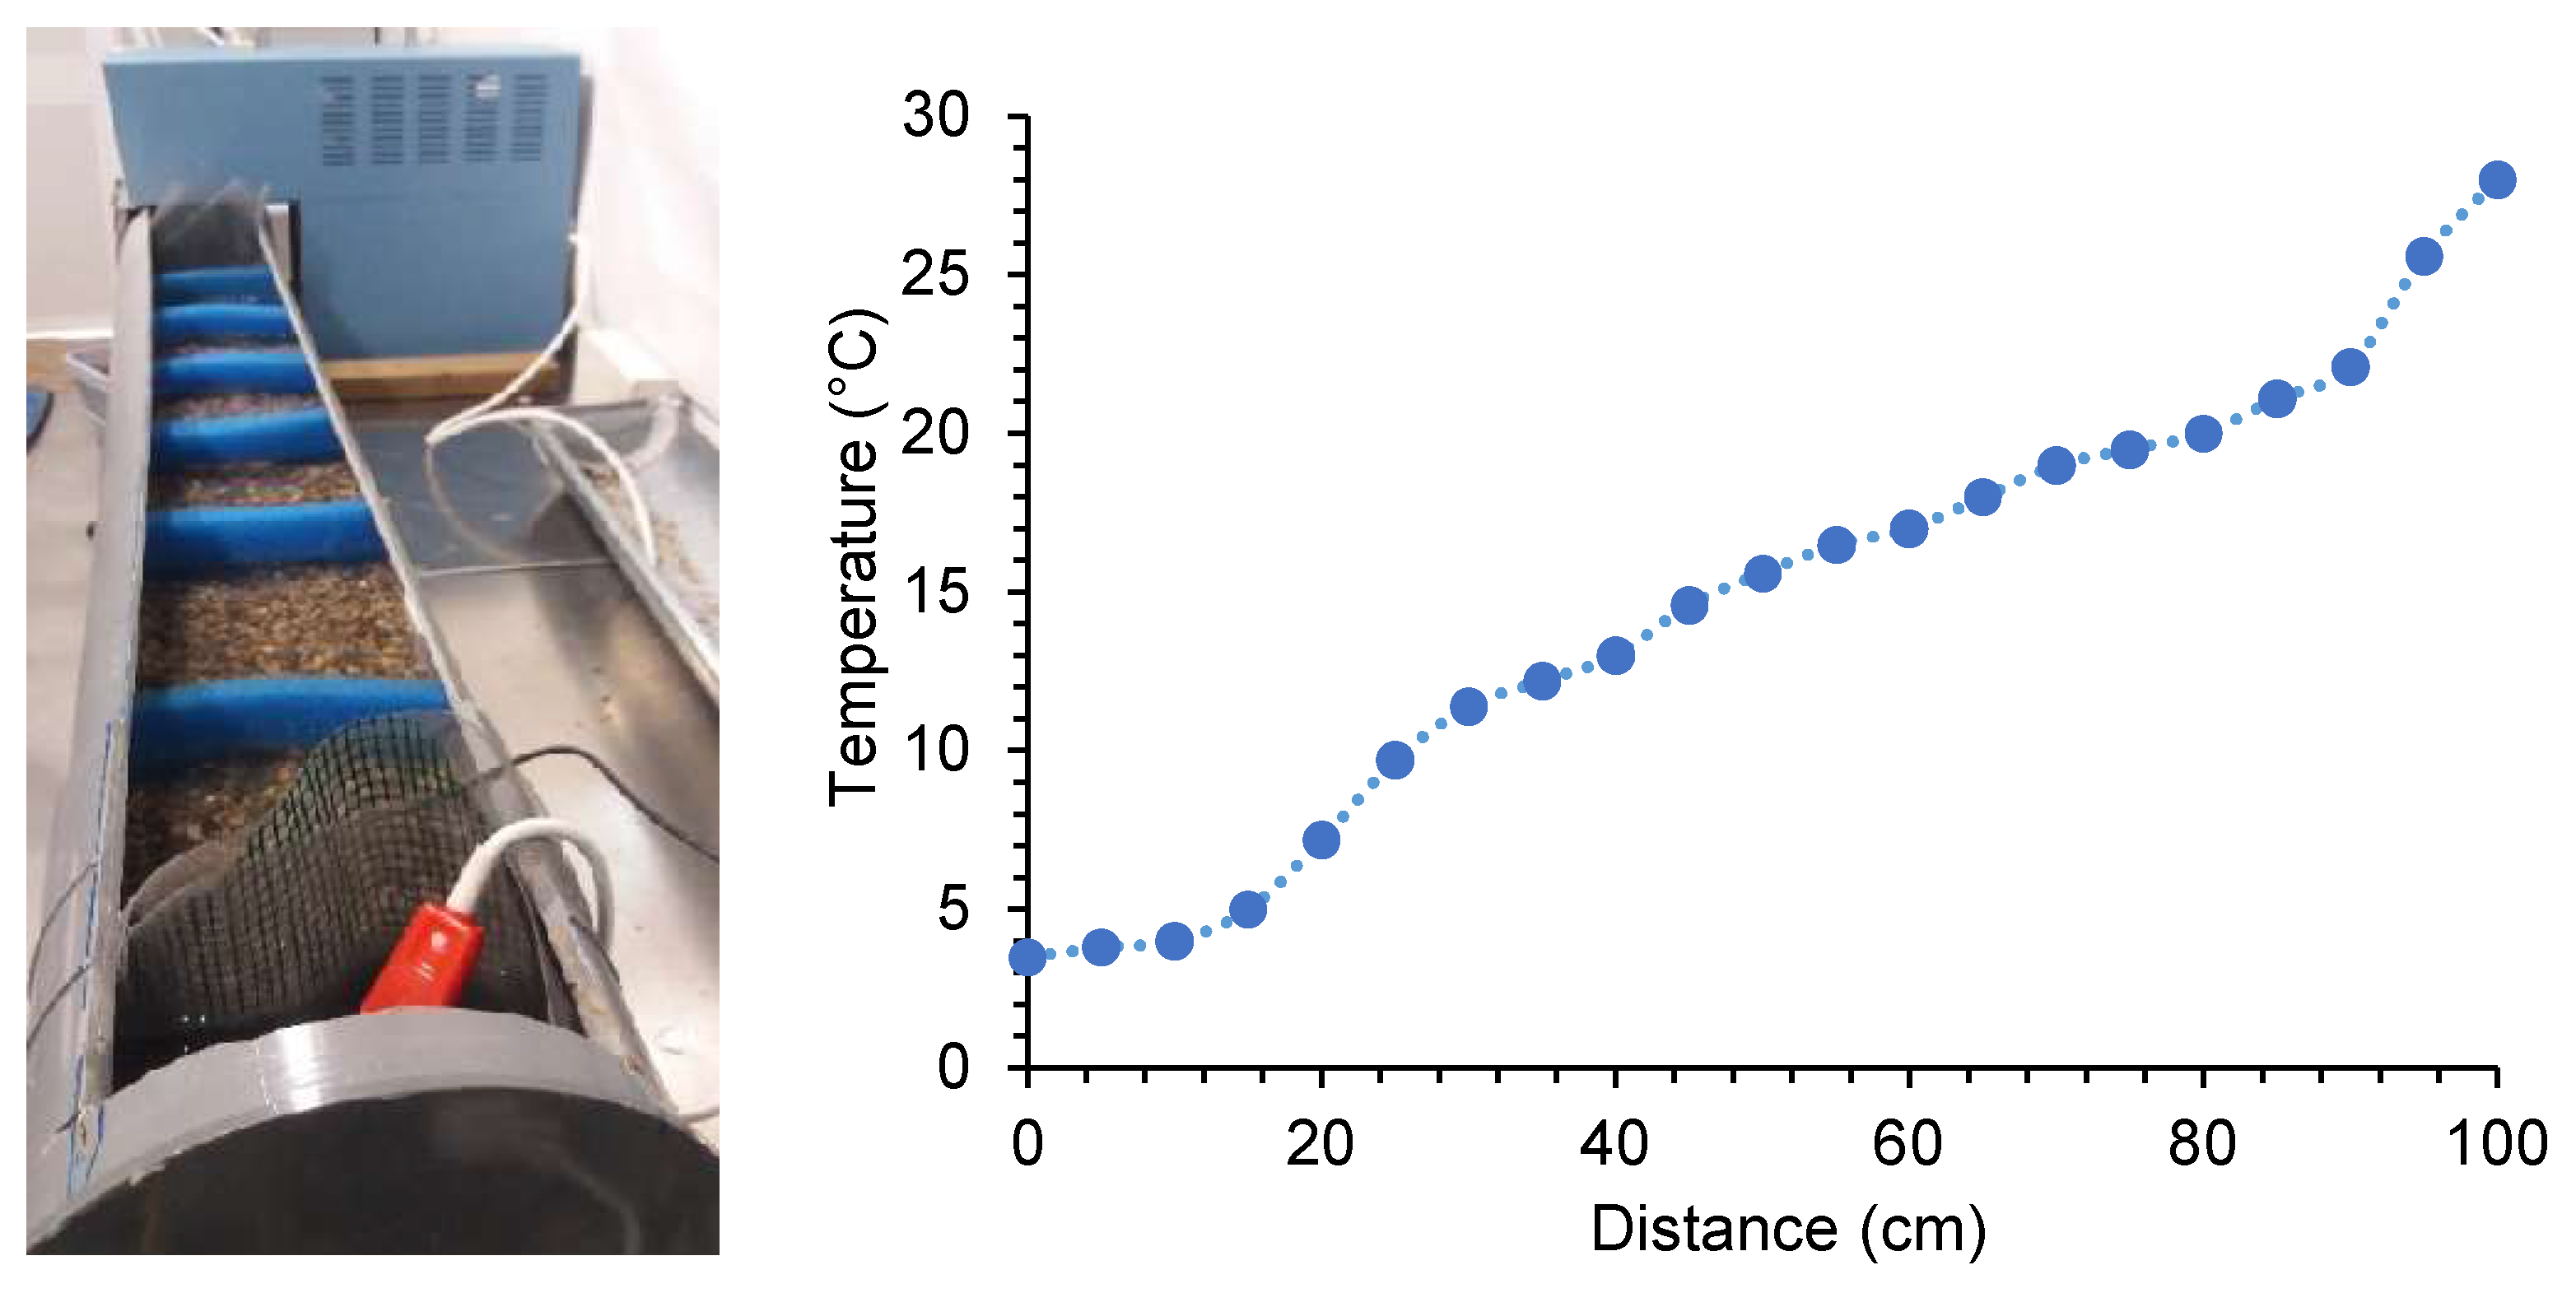
Figure 3.
Average Critical Thermal Maxima (CTmax) of the 5 groups of Calotriton arnoldi. a) Both populations, b) Western subpopulation, c) Eastern subpopulation. Bars represent standard error.
Figure 3.
Average Critical Thermal Maxima (CTmax) of the 5 groups of Calotriton arnoldi. a) Both populations, b) Western subpopulation, c) Eastern subpopulation. Bars represent standard error.
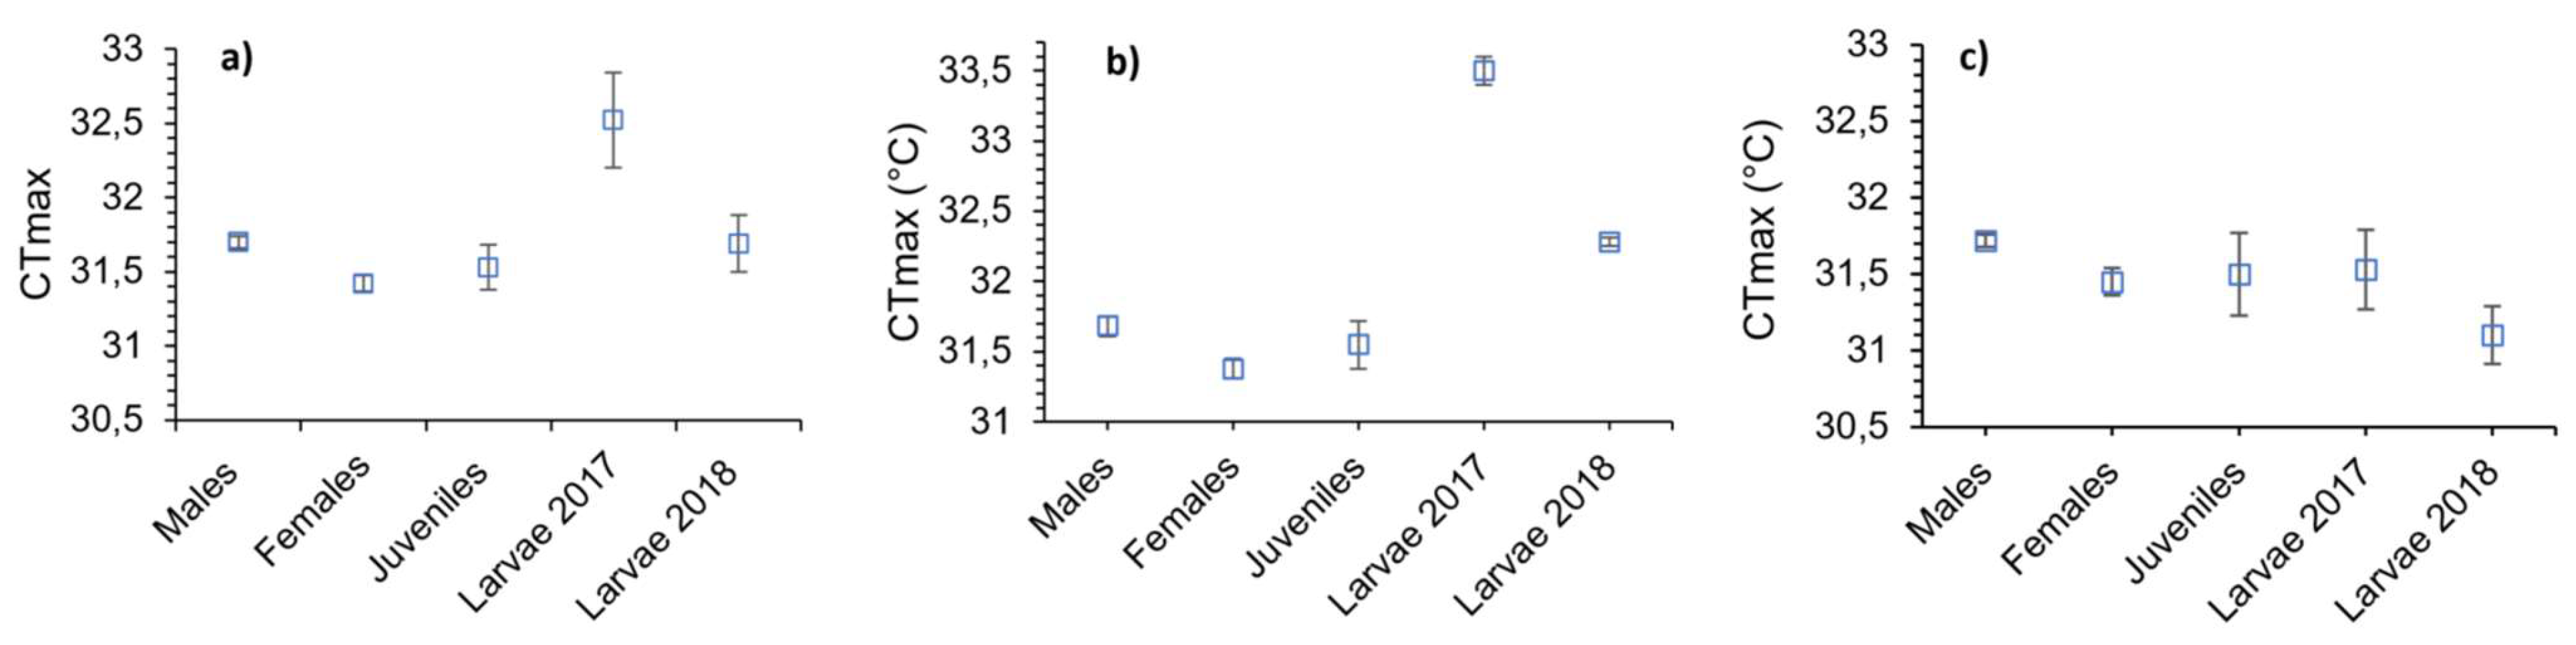
Figure 4.
Preferred Body Temperature (Tp) of the 3 groups of Calotriton arnoldi. a) Both populations, b) Western population, c) Eastern population. Bars represent the thermopreferendum range of each group.
Figure 4.
Preferred Body Temperature (Tp) of the 3 groups of Calotriton arnoldi. a) Both populations, b) Western population, c) Eastern population. Bars represent the thermopreferendum range of each group.
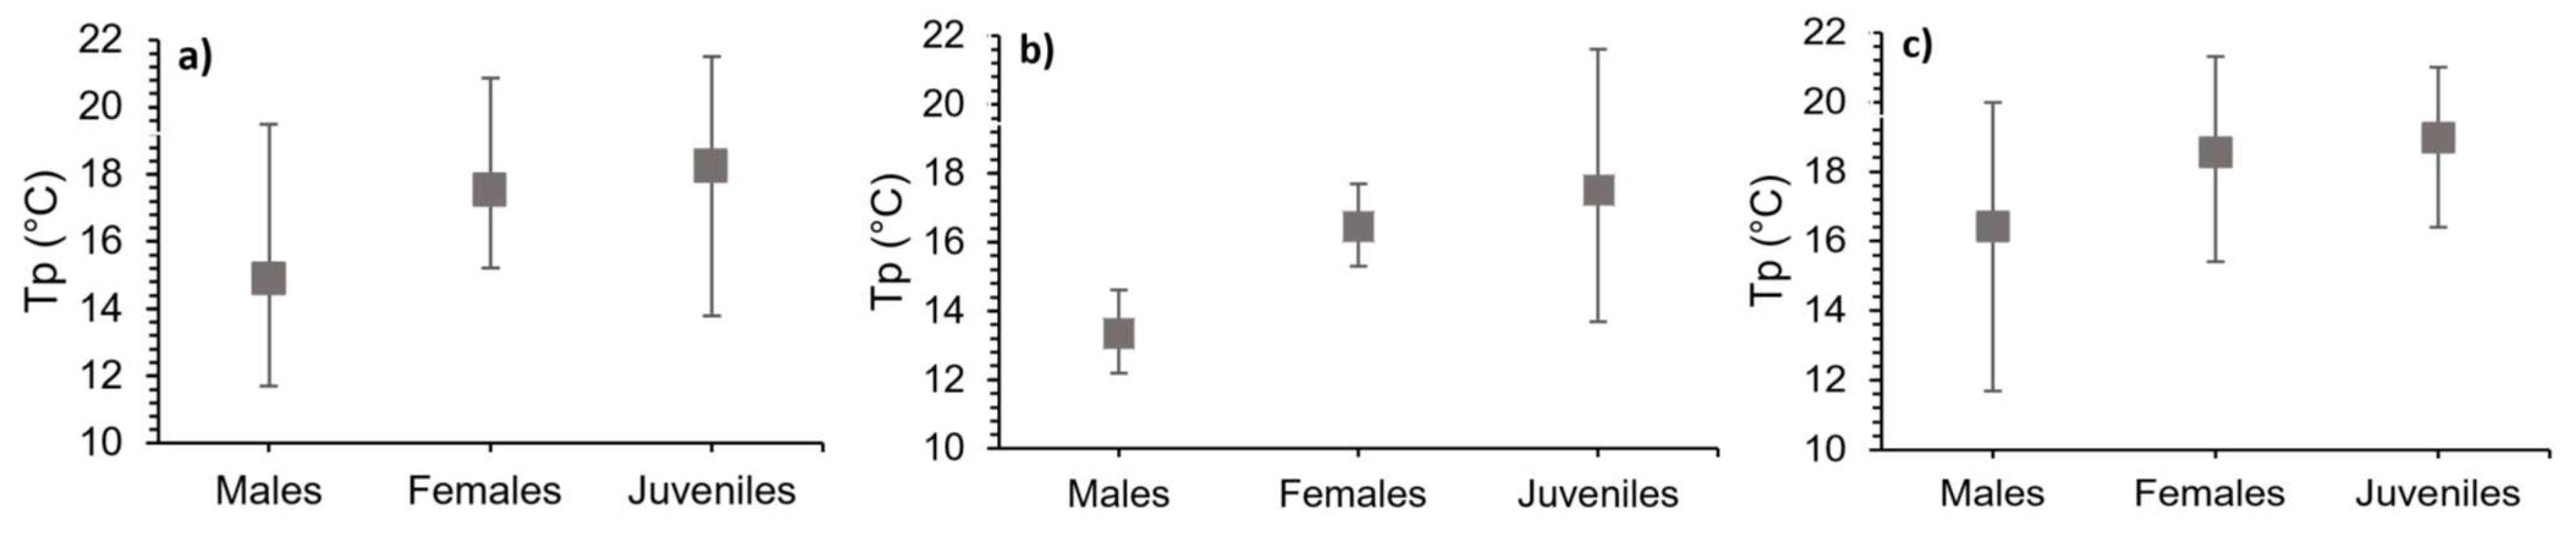

Table 1.
Average weight, Critical Thermal Maxima (CTmax), correlation between weight and CTmax, in the 5 groups of the two subpopulations of Calotriton arnoldi.
Table 1.
Average weight, Critical Thermal Maxima (CTmax), correlation between weight and CTmax, in the 5 groups of the two subpopulations of Calotriton arnoldi.
| Western population | |||||||
|---|---|---|---|---|---|---|---|
| Weight (g) | CTmax (°C) | S.E | Min (°C) | Max (°C) | R2 | p-value | |
| Males | 5.70 | 31.68 | 0.07 | 31.4 | 31.8 | -0.39 | 0.44 |
| Females | 7.03 | 31.38 | 0.07 | 31.1 | 31.5 | -0.52 | 0.29 |
| Juveniles | 2.33 | 31.55 | 0.17 | 31.0 | 32.1 | -0.26 | 0.61 |
| Larvae 2017 | 0.75 | 33.50 | 0.10 | 33.0 | 33.6 | 0.67 | 0.14 |
| Larvae 2018 | - | 32.28 | 0.03 | 32.2 | 32.4 | - | - |
| Eastern population | |||||||
| Males | 6.12 | 31.72 | 0.04 | 31.6 | 31.8 | -0.74 | 0.09 |
| Females | 4.33 | 31.45 | 0.09 | 31,0 | 31.6 | -0.51 | 0.30 |
| Juveniles | 2.35 | 31.50 | 0.27 | 30.2 | 31.9 | -0.21 | 0.69 |
| Larvae 2017 | 1.40 | 31.53 | 0.26 | 30.5 | 32.2 | -0.30 | 0.56 |
| Larvae 2018 | - | 31.10 | 0.19 | 30.5 | 31.5 | - | - |
Table 2.
Average weight, Body length, Preferred temperature (Tp), Temperature range, correlation between weight and Tp, correlation between SVL and Tp, in the 3 groups of the two populations of Calotriton arnoldi.
Table 2.
Average weight, Body length, Preferred temperature (Tp), Temperature range, correlation between weight and Tp, correlation between SVL and Tp, in the 3 groups of the two populations of Calotriton arnoldi.
| Western population | ||||||||||
|---|---|---|---|---|---|---|---|---|---|---|
| Weight (g) | SVL(cm) | Tp (°C) | SE | Min | Max | R2 Weight- Tp | p-value | R2SVL- Tp | p-value | |
| Males | 5,15 | 5,95 | 13,35 | 0,50 | 12,2 | 14,6 | -0,40 | 0,42 | -0,15 | 0,78 |
| Females | 4,73 | 6,13 | 16,45 | 0,48 | 15,3 | 17,7 | -0,76 | 0,08 | -0,01 | 0,98 |
| Juveniles | 2,08 | 4,48 | 17,51 | 1,46 | 13,7 | 21,6 | 0,68 | 0,13 | 0,76 | 0,08 |
| Eastern population | ||||||||||
| Males | 5,63 | 6,05 | 16,43 | 1,58 | 11,7 | 20,0 | -0,07 | 0,89 | 0,56 | 0,24 |
| Females | 3,98 | 5,61 | 18,56 | 1,13 | 15,4 | 21,3 | -0,29 | 0,57 | -0,03 | 0,95 |
| Juveniles | 2,2 | 4,32 | 18,97 | 0,98 | 16,4 | 21,0 | -0,12 | 0,82 | -0,06 | 0,92 |
Disclaimer/Publisher’s Note: The statements, opinions and data contained in all publications are solely those of the individual author(s) and contributor(s) and not of MDPI and/or the editor(s). MDPI and/or the editor(s) disclaim responsibility for any injury to people or property resulting from any ideas, methods, instructions or products referred to in the content. |
© 2024 by the authors. Licensee MDPI, Basel, Switzerland. This article is an open access article distributed under the terms and conditions of the Creative Commons Attribution (CC BY) license (http://creativecommons.org/licenses/by/4.0/).
Copyright: This open access article is published under a Creative Commons CC BY 4.0 license, which permit the free download, distribution, and reuse, provided that the author and preprint are cited in any reuse.


