
Submitted:
07 June 2024
Posted:
11 June 2024
You are already at the latest version
Abstract
The Dual-Frequency Precipitation Radar (DPR) on the Core GPM satellite provides spaceborne 3-dimensional observations of the precipitation field and surface rainfall rate with quasi global coverage. The present study evaluates the behavior of liquid precipitation intensity, radar reflectivity factor (ZKu and ZKa) and Drop Size Distribution (DSD) parameters (weighted mean diameter Dm and intercept parameter Nw) of the GPM DPR derived products version 07 from 2014 to 2023. Observations from seven Parsivel disdrometers located in different topographic zones in the Western Mediterranean are taken as ground reference. Four matching techniques between satellite estimates and ground level observations were tested, and best results were found for the so-called optimal comparison approach. Overall, GPM DPR products capture well the variability of the observed DSD at different rainfall intensities. However, overestimation of the mean Dm and underestimation of the mean Nw are observed, being much more sensitive to errors in drop diameters larger than 1.5 mm. Moreover, lowest errors were found for radar reflectivity factor and Dm, and highest for Nw and rainfall rate. In addition, the GPM DPR convective and stratiform classification was tested and it was found a substantial overestimation of stratiform cases compared to disdrometer observations.
Keywords:
Dual-frequency Precipitation Radar (DPR)
; GPM
; disdrometer
; ground validation
; precipitation estimates
; Western Mediterranean
1. Introduction
Satellite precipitation estimates are an essential input to provide a complete perspective of the hydrological cycle at global scale, including the monitoring of extreme events and complementing traditional ground-based observation methods based on rain gauge and weather radar networks [1]. The Tropical Rainfall Measuring Mission (TRMM) of the National Aeronautics and Space Administration (NASA) and Japan Aerospace Exploration Agency (JAXA), launched in 1997, was the first satellite with a weather radar, operating at Ku-band (13.6 GHz), dedicated to measure precipitation at latitudes between 35°S and 35 °N [2]. In 2014, the same agencies launched the Core Observatory satellite (CO) of the Global Precipitation Measurement (GPM) mission [3] to provide precipitation estimates between 65 °S and 65 °N and become the basis for future long-term analyses [4]. To this end, GPM CO has the first spaceborne dual-frequency precipitation radar (DPR), operating at Ka (35.5 GHz) and Ku-band (13.6 GHz) to offer three-dimensional measurements of the precipitation structure. Compared to the TRMM precipitation radar, the DPR is more sensitive to light rainfall rates, and because of simultaneous measurements by overlapping Ka/Ku bands, new information on the drop size distribution over moderate precipitation intensities is obtained [5].
Because of the valuable information provided by the DPR and their multiple applications, validation exercises are essential. In fact, GPM precipitation recovery algorithms have been subject to frequent updates (seven versions in the first 10 years). Therefore, it is necessary to identify biases and improve future versions, with ground validation being an important component for evaluating and improving the performance of the DPR algorithm [6]. Some of the DPR derived variables are estimated at ground level so specific information about precipitation drop size distributions (DSD) at that level is needed for their verification. For this reason, ground-based disdrometers, able to measure DSDs from which integral rainfall parameters, such as reflectivity, intensity, and liquid water content can be computed, are a key instrument for the verification of DPR derived products. A number of field campaigns promoted by the NASA Ground Validation program and other research groups have been carried out in recent years [7] deploying different disdrometer types (Two-Dimensional Video Disdrometer (2DVD) from Joanneum Research, Inc. in Austria; OTT Parsivel Model 2; and Joss-Waldvogel) [8]. Table 1 lists different GPM DPR validation studies using disdrometers and their region of study.
A first study was performed simulating the DPR algorithm before the GPM CO launch with disdrometer data [9]. In a comparative DPR-disdrometer study over Gadanki, India [10] it was observed that the Dm values obtained from GPM DPR were severely underestimated at high rainfall rates (R > 8 mm/h) during the SW monsoon season. Meanwhile D’Adderio et al. [11] obtained statistical scores that did not differ significantly between land and sea [13,14], and found that the GPM DPR showed superior performance in estimating rainfall parameters in stratiform precipitation than in convective precipitation. Adirosi et al. [15] compared the precipitation and drop size distribution parameters of a large network of disdrometers in Italy with the DPR GPM. The sensitivity analysis revealed, regardless of the type of DPR algorithm (dual or single frequency algorithm), a superior agreement for the mass-weighted mean raindrop diameter (Dm) and a lower agreement for the normalized gamma DSD intercept parameter (Nw), similar to the results of [8,11,16]. Del Castillo-Velarde et al. [14] concluded that differences with respect to convective rainfall could be associated with the setting of the shape parameter (µ) in the DPR algorithm. They also suggested that in the central Andes, the estimation of DSD parameters in stratiform rainfall is strongly affected by the limitation of the DF algorithm in estimating Dm < 1 mm.
The number of verification studies using disdrometer data has been growing over the years, but it is still much lower than the number of studies with rain gauges, limited to comparing precipitation amounts. As disdrometers are not frequently deployed in operational networks, their observations are relatively scarce so the difficulties of sampling satellite overpasses matching precipitation events is an important limitation of such studies. For instance, in the Mediterranean basin, an area vulnerable to climate change, hydrometeorological extremes and uncertainty of projections regarding precipitation [17], studies of this type have focused only over Italy using DPR products V05 and V06A. Therefore, the limited number of geographical regions examined and the continuous upgrade of DPR product versions require more validation studies of this type. To contribute to fill this gap, the objective of this study is to evaluate the behavior of the precipitation intensity, radar reflectivity factor (ZKu and ZKa), and DSD parameters (Dm, Nw) of the GPM DPR level 2 version 07B, the latest available. For this purpose, data from seven disdrometers (OTT Parsivels1, 2) covering the period 2015 to 2024 located in different topographic areas of Catalonia, Spain were used as reference.
The remainder of this paper is organized as follows.
Section 2
provides a description of the study area, datasets used (disdrometers and GPM DPR data), the comparison methodology adopted in this study and the evaluation metrics employed.
Section 3
shows results using disdrometer data, DPR data, and their matches, the latter validated considering four different approaches. The most significant results are discussed in
Section 4
, and a summary and conclusion are provided in
Section 5
.
2. Materials and Methods
2.1. Datasets
2.1.1. GPM-DPR
The GPM CO operates in low-Earth orbit, carrying two instruments to measure the Earth's precipitation and serving as a calibration standard for other members of the GPM satellite constellation [18]. The satellite was developed and tested in-house at NASA’s Goddard Space Flight Center and launched from the Tanegashima Space Center, Japan, on February 27, 2014 [5]. The orbit height is 442 km since November 2023 and the orbit inclination is 65°.
GPM-DPR Version 07B Level 2 products provide three main classes of precipitation products: (1) Ku-band frequency derived over a 245 km wide swath in the so-called Full Scan (FS, low sensitivity) mode; (2) Ka-band frequency derived, which, as of May 2018, occupies a 125 km narrow swath in FS mode and the rest of the swath in the High Scan mode (HS, High Sensitivity); and (3) dual frequency-derived data in FS and HS modes. Finally, the swath structures can be categorized into single- and double-beam pixels based on the availability of radar reflectivity at the Ku and Ka bands [19].
The derivation of the DSD using the Single Frequency (SF) and Dual Frequency (DF) algorithms in the liquid phase intervals assumes a gamma-shaped droplet size distribution with three parameters: Nw, Dm, and the shape parameter (µ). To reduce the number of unknown parameters from three to two, GPM DPR algorithms consider a constant value for µ, set to µ=3 [6]. To determine Dm and Nw, relationships between Dm and k/Ze or DFR are used, where k is the specific attenuation in dB/km, Ze is the effective reflectivity factor, and DFR is the dual-frequency ratio. A brief summary of SF and DF algorithms is shown in Appendix A and further information is available in [19,20,21].
An important relationship is assumed between the precipitation rate R and Dm [15]. In the current version V07B the R-Dm relationship is given by:
where R is the precipitation rate in mm/h for temperatures between -50 °C and 50 °C and α, β, and τ are constants of 0.392, 6.131, and 4.815, respectively. To reconcile possible inconsistencies arising from the use of different attenuation estimation techniques [22], the equation includes an adjustment factor ε. Different R-Dm relations were tested by varying ɛ from 0.2 to 5.0. Assuming a gamma DSD with a fixed shape parameter, it is possible to establish a relationship between R and Dm for various effective reflectivity values [20]. Thus, given ɛ = 1.25, a pair (R, Dm) can be obtained.
In this study, DF (DPR) and SF (Ku-band and Ka-band) products were used in the FS mode of the GPM DPR version 07B from 2014 to 2023. Note that FS format is available in version V07 for observations recorded both before and after the scan pattern change of the Ka-band in May 2018 [21]. The output variables selected to be evaluated were the precipitation intensity (precipRateNearSurface, mm/h) estimated in the clutter-free bin closest to the surface (binClutterFreeBottom, CFB), the reflectivity factor with attenuation correction at the CFB (zFactorFinalNearSurface, dBZ), the normalized gamma DSD parameters (paramDSD), Nw (dB) and Dm (mm) evaluated at the CFB as well as the precipitation type (TypePrecip) for the case of the DF product. It is worth mentioning that HS mode data results were not yet available for processing during this study.
2.1.2. Disdrometer Locations
Data from seven disdrometers deployed at different sites of the region of study were used. The Department of Applied Physics-Meteorology of the University of Barcelona manages six disdrometers. Three of them plus a fourth one of University of Grenoble-Alpes were used during the Land Surface Interactions with the Atmosphere over the Iberian Semi-arid Environment (LIAISE) field campaign in the Eastern Ebro subbasin [23]. The rest of the disdrometers were at the Das aerodrome (in the Eastern Pyrenees, during the Cerdanya-2017 [24] and the ARTEMIS field campaigns), the roof of the Faculty of Physics of the University of Barcelona and the Fabra Observatory of Royal Academy of Sciences and Arts of Barcelona also supporting the ARTEMIS campaign. Table 2 provides detailed information about each site, temporal period covered and valid rainfall data for each site after quality control (for details see next section).
The locations of the disdrometers are representative of three key areas with different climatic and orographic characteristics typical of Catalonia: Mountain (in the Pyrenees mountains), Plain (inland plain of the Segre River valley) and Coast. The disdrometers of Tordera, Mollerussa, Tarrega and Cendrosa are in the Plain subregion, characterized by flat terrain with few orographic contrasts and an Arid Köppen climate (Figure 1), conditioned by precipitation deficit. Disdrometers located at the Faculty of Physics and Fabra Observatory represent the Coast subregion with Hot-summer Mediterranean Köppen climate, more exposed to Mediterranean heavy precipitation. The disdrometer at Das was in a valley at 1094 m a.s.l. in the Mountain subregion according to Temperate Köppen climate.
2.1.3. Disdrometer Data
The OTT Parsivel1, 2 optical disdrometers use a 650 nm laser device with a power of 3 mW [25,26]. The laser emits a horizontal sheet of light 30 mm wide and 180 mm long. With a horizontal sampling area of 54 cm2, particles passing through it cause a reduction in light intensity, resulting in the measurement of their size. The signal duration and particle size allow the estimation of particle velocity [27]. The size and fall speed of each particle is classified into 32 classes ranging from 0.05 to 20 m/s and 32 particle diameter classes ranging from 0.062 mm to 24.5 mm. Based on the recorded size and fall speed spectra different variables are computed, including the present weather type (synop code 4677, [25]). Temporal resolution was set to 1 minute aggregation periods for all disdrometers.
A quality control was applied consisting on the following conditions: (1) to exclude non-liquid particles and errors associated with boundary effects [28], particle fall speeds did not differ more than ±50% with the empirical terminal fall speed [29]; (2) to further ensure liquid precipitation the reported present weather (code 4677) was checked discarding all types containing solid particles [30]; (3) to compute DSD parameters consistently a minimum of 11 drops had to be present in each 1 minute sample [15]. The DSD was computed according to the following expression:
where is the effective sampling area (m2), t is the sampling time (60s), ∆Di is the bin width (mm), nij is the number of drops measured in the ith diameter class and jth drop velocity class, and is the drop velocity according to the theoretical diameter-drop velocity relationship [29]. In this case, as in [27,28], the edge effects mentioned above are considered, where L=180 mm and W=30 mm (laser beam length and width respectively). Finally, for each DSD, ZKa,Ku, R, Dm, Nw, and µ were calculated based on the nth-order moment (Mn) of the drop size distribution [8,31,32,33] using the following:
where is the liquid water content (), λ is the wavelength (mm), Kw is the complex dielectric constant of water, is the density of water (1 g/cm3), and is the backscatter radar cross-section for Ku and Ka bands of a droplet of equivalent diameter D. For the calculation of the cross-sections the T-matrix [34,35] estimation method was applied assuming: (1) an ambient temperature of 20 °C; (2) the shape of hydrometeors according to the model proposed by [36]; and (3) the distribution of hydrometeor canting angles modeled with a Gaussian distribution with mean 0° and standard deviation 10° [15]. These calculations were performed using the Python package pyTMatrix [37,38].
Additionally, considering that the GPM assumes a normalized gamma-type DSD to estimate the DSD parameters (Equations A1-A2, Appendix A) and based on equations A3-A8, the DSD measurements recorded by the disdrometers were used to compute k (specific attenuation), as well as the k/Ze and DFR (dB) ratios, by setting µ=3 [10,14].
2.2. Methodology
As indicated above, the number of satellite overpasses coincident with rainfall events may be an important limiting factor when comparing satellite and disdrometer observations. To overcome or partly mitigate this problem, some previous studies considered not only satellite matches but also datasets of the area of study of both disdrometers and satellite without necessarily satellite overpass matches [8,10]. Then these two relatively independent datasets (as opposed to the datasets with matches) can be compared, for example checking if bias are present, to better interpret the comparison of satellite matches with ground observations. According to this idea, below are described the comparison of the so-called independent (non-matching) DPR and disdrometer datasets and the matching approaches considered.
2.2.1. Comparison of Independent Datasets
To select DPR data comparable to the reference disdrometer data, precipitation DPR observations within a 10 km radius around the location of the disdrometer sites were considered. Duplicate information due to overlapping of the selected areas was eliminated to avoid redundant data that could affect the characterization statistics (Figure 1). The results of this analysis were stratified according to each disdrometer separately, into three geographic areas with different climatic and orographic characteristics and considering all the data together.
According to GPM documentation, the minimum detectable radar reflectivity and rainfall rate for Ku and Ka-bands are 13 dBZ, 17 dBZ and 0.5 and 0.2 mm/h respectively. However, previous studies have observed improved detection of light precipitation using GPM DPR [39]. In addition, GPM DPR estimates over the study region showed minimum precipitation rates of 0.1 mm/h, therefore, in this work this threshold [8,15] was selected to fix precipitation events for both GPM DPR and disdrometer data.
2.2.2. Matching Approaches
Four different matching approaches were considered, based on similar previous studies [8,15]. An attempt was made to determine the most appropriate strategy considering the performance of each GPM DPR scanning mode (Ka-FS, Ku-FS, and DPR-FS). The four methods are as follows:
- Point: The disdrometer location was found within the footprint of the DPR (within the 5 km2 pixel area) so could be compared directly.
- Mean 5 km: Disdrometer data was compared with the average of all DPR pixels within a 5 km radius around the disdrometer.
- Mean 10 km: Disdrometer data was compared with the average of all DPR pixels within a radius of 10 km around the disdrometer.
- Optimal: Disdrometer data was compared with the DPR pixel closest to the disdrometer within a 5 km radius and the nine DPR pixels containing the disdrometer. Finally, among these nine pixels, the pixel with closest radar reflectivity factor to that of the disdrometer was selected for comparison.
After selecting the GPM overpasses in rainy conditions, the 1-min DSD samples from the disdrometers were averaged over a 10-min window to reduce the time and space sampling problems between the GPM-DPR and the disdrometers. The results for the total number of precipitation exceedances and matches following these methodologies are shown in the results section. The comparison was made in terms of Dm (mm), R (mm/h), ZKu,Ka (mm6m-3), and Nw (dB).
2.2.3. Verification Metrics
The comparison between the GPM DPR and disdrometer data was performed considering verification scores for both continuous variables and categorical events (Table 3).
Note that the scores considered for verification of categorical forecasts are based on the so-called confusion matrix, also called contingency table [40]. These scores are typically used in machine-learning applications [41] but in this case are applied to multi-category events [42] considering a 3 x 3 confusion matrix (Table 4). As shown, TPA, TPB and TPC are the number of true positive samples in classes A, B and C respectively. False negative (FN) of any class, which is in a column, can be calculated by adding the errors in that class/column. Whereas the false positive for any predicted class, which is in a row, represents the sum of all errors in that row. For example, the false positive in class A (FPA) is calculated as and the false negative in the A class is [43].
3. Results
3.1. GPM CO vs Disdrometer Derived Independent Estimates
Figure 2 shows the histograms of the probability of occurrence with respect to the following variables: reflectivity factor (ZKa, Ku), precipitation intensity (R), and DSD parameters (Dm, Nw, µ) obtained for both GPM DPR and disdrometer independent datasets. The dashed lines represent the median of the distribution of each dataset and the solid curve represents the kernel density estimation (KDE) curve associated with each distribution.
Despite the differences in the number of samples and period of record in the two independent datasets, important similarities can be observed in the distributions. However the DPR distributions are slightly shifted to higher values compared than the disdrometer distributions in reflectivity (ZKa and ZKu), precipitation intensity, and Dm, which might indicate little skill in detecting the lower thresholds in these variables with respect to the data taken as reference. Specifically, in the case of Dm, while in the disdrometers, the highest probability of occurrence occurs for values less than 1 mm, in the DPR, this occurs between 1.0 and 1.5 mm. In contrast, the Nw values obtained from the DSD of the disdrometers had a wider range, especially with a tendency to detect higher thresholds and a higher mean than that of the DPR. Figure 2f shows the discrepancies between the mean µ close to 10 in the case of the reference data, which is different from that set by the DPR algorithm (µ=3). Several authors [8,9,28] discussed the limitations of setting this parameter.
Table 5 and Table 6 show the number, median, and maximum values of each variable analyzed for each dataset. In addition, to evaluate how the location of the disdrometers might affect the precipitation and DSD parameters, three zones with different orographic and climatic characteristics were analyzed. The plain, coastal, and mountain regions were constructed by combining the data from the disdrometers that compose these homogeneous regions (Figure 1).
In general, there is little variability among the disdrometer statistics according to geographic location. The median reflectivity values range between 20 and 24 dBZ, precipitation intensities between 0.48 and 0.89 mm/h, Dm close to 1 mm and the intercept parameter (Nw) around 35 dB. Similarly, in the analysis of the observations in regions with different climatologies, the behavior of the variables was similar. The coastal area shows slightly higher median values, and the maximum intensity is reported at the Fabra Observatory. This behavior of the variables can be compared with the results obtained by Adirosi et al. [15] in Italy, where median values of 23.4, 21.9, 0.73, 35.72 and 1.05 (see Table 5 last row) were obtained for the variables ZKa, ZKu, R, Nw, and Dm, respectively.
The statistics obtained by DPR data showed higher median values for all variables, except Nw. However, DPR data can capture the variability between different zones, exhibiting the highest median values in the coastal zones. Similarly, the maximum values observed by disdrometers were much higher in all datasets than those recorded by the DPR DF. Although other studies have commented on the limitations in the detection of extreme values by remote sensing products [44], in this case, we cannot draw any conclusions because such values are subject to the availability of DPR data at the time of the occurrence of this type of extreme event.
3.1.1. Rain Rate Effects
The DSD-derived precipitation characteristics were stratified in six rain rate intensity classes. For this purpose, the disdrometer and DPR DF records were considered together and grouped according to the three subregions (Plain, Mountain, and Coast) mentioned above. Figure 3 (top panel) shows the normalized density distributions for the datasets. A necessary condition to obtain the mean of these variables in each precipitation intensity interval was that they had at least 10 records. It is evident that all datasets behave similarly, with a high representation of data -as expected-, at lower precipitation intensities, and much lower for moderate and high intensities. Despite the lack of temporal concurrence between the disdrometers and the DPR, both sources provide relatively similar results with similar qualitative behavior.
Figure 3 (middle and bottom panels) illustrates the variation in the mean Dm and Nw observed and estimated using the DF DPR algorithm as a function of precipitation intensity. The DSD parameters were similar in all regions for intensities below 4 mm/h. At thresholds higher than 16 mm/h, the Dm for example differs by more than 0.5 mm between coastal and mountain areas according to the disdrometer data. The intercept parameter begins to differentiate in the regions from intensities between 8-16 mm/h with a difference of more than 5 dB between coastal and inland areas according to the DPR and close to 6 dB between coastal and mountain areas according to disdrometer data.
From these figures, it is clear that the DSD parameters obtained by the DF algorithms capture the variability observed at different intensities, although with overestimates of the mean Dm and underestimates of the mean Nw, showing the greatest differences at moderate and high intensities, and being much more sensitive to errors in drops greater than 1.5 mm. These results are similar to those found by Del Castillo-Velarde [14], where it is stated that the DF algorithm is susceptible to the uncertainty of μ fixation, which causes an underestimation of Nw.
Comparisons of the DSD parameters show an overestimation of Dm of about 0.1 mm at low and moderate precipitation rates (0.1-1, 1-2, 2-4 mm/h) and of 0.4 mm at precipitation rates higher than 4 mm/h by the DF algorithm with respect to the disdrometer. In contrast, the behavior of Nw was underestimated by the DPR, with a maximum value close to 6 dB at moderate precipitation rates (4-8 mm/h). Compared to the studies of [10], the magnitudes of underestimation and overestimation of Dm and Nw are very similar. However, here the behavior of the DSD parameters occurs in reverse, that is, the mean value of Dm is overestimated and Nw is underestimated. This sensitivity analysis shows that the results presented here are consistent, and the differences with other studies may be due to spatial, temporal, and seasonal sampling factors.
3.1.2. Stratiform vs Convective Regimes
In this section, we analyze the stratiform and convective regimes associated to the DPR and disdrometer data, as well as different related microphysical processes. For this purpose we consider the classification for a given rainfall DSD proposed by Dolan et al. [45] based on the clustering of Do and Nw values obtained from global disdrometric records. From this perspective, six groups with independent characteristics were defined: Group 1, Group 3, Group 5 and Group 6 (Figure 4b) are characterized by convective precipitation processes, while the Group 2 and Group 4 are stratiform precipitation processes, with increasing D0 and decreasing Nw. Complementary, we also considered the DPR algorithm classification in which each pixel is assigned a so-called precipitation type label: stratiform, convective, or other. Figure 4 plots all disdrometer records in the Do-log (Nw) space overlaid with the diagram proposed by Dolan et al. [45].
Note that in Figure 4a most of the measurements were in the stratiform part of the plot, which is consistent with the values of the disdrometer parameters discussed above (low liquid water content and small mean droplet diameters). In the same figure, the values classified as stratiform (turquoise dots) and convective (red dots) by the DPR DF algorithm are plotted. Although the highest percentage of data is in the stratiform domain, there is a large scatter of data that does not fit this classification, especially for events classified as convective rain (Table 7).
Figure 4b provides information on the dominant precipitation mechanisms in the disdrometer and DPR DF records following Dolan et al. [45]. According to this classification, the disdrometer stratiform rainfall was dominant (Table 7) and strongly influenced by vapor deposition followed by riming processes (Table 8). Convective events, on the other hand, are not associated with a single well-defined microphysical mechanism. Moreover, an important part of the events (14%) are classified as ambiguous (neither convective nor stratiform) and are associated with different microphysical mechanisms. DPR records have a large percentage of data (46%) in areas that fall outside the classification range, although the influence of stratiform precipitation processes by riming can be appreciated (Table 8).
3.2. Analysis of Satellite Overpass Events Coincident with Disdrometer Data
This section evaluates the performance of the GPM-DPR estimates for the different matching methods with disdrometer data described in Section 2.2. Table 9 shows the number of overpasses of the GPM-DPR (2014-2023) with precipitation, and the number of matches from the different proposed methods. A comparison was carried out for the two algorithms: DPR DF and SF in the FS mode. Analyses of the variables Z, R, Dm, and Nw were considered.
Between March 2014 and November 2023, the GPM CO passed (at least one footprint) over the region of Catalonia 2089 times and, of them, 1126 times had at least one footprint with rainfall (hereafter rain overpasses). It is important to mention that the Ka-band presents a lower number of cases compared to the others (Table 9) because only inner swatch data are available due to the DPR scan pattern change in May 2018. After that change, the data were reprocessed, leaving the payoffs in HS scan mode in the outer swath, for which no data are available as of the date of this study. The differences in the number of overpasses between the DPR and Ku-band products in both Group A and Group B, although insignificant in this case, are due to differences in the precipitation estimation algorithms around the 0.1 mm/h threshold.
The main statistics for quantifying the error between the DPR estimates at the CFB and disdrometer ground-based values are shown in Table 10. Values marked in red represent the worst scores and in green the best scores for each group of variables and error statistics analyzed.
Figure 5 shows the scatterplots of rainfall rate R (mm/h), ZKa (dBZ), ZKu (dBZ), mass-weighted mean drop diameter (Dm, mm), and Nw (dB) of the GPM DPR and disdrometers. Regarding rainfall intensity, the point and mean methods show a certain dispersion of the data in general around the 1:1 line (dashed line). Although it is less evident in the optimal methods, for intensity values higher than 4 mm/h, it is again marked in all methodologies. In fact, the correlation values are generally higher than 0.7 in the optimal method, and in the point and mean methods most cases are lower than 0.5, showing a worse performance in the SF algorithm.
In the analysis of the intensity of precipitation, the optimal and mean 10 km methods, generally, show the lowest values of NBIAS, NMAE, and NRMSE, as well as higher values of correlation, displaying also a substantial improvement of the DF algorithm over the SF over a mean of 10 km. For the rest of the methods, the behavior of the SF and DF is similar. The NBIAS shows a marked difference in the DF algorithm between the point method (-46%) and optimal (0.26%); however, this could be due to error compensation, a disadvantage associated with this statistic.
The errors associated with the reflectivity in both Ka and Ku-bands are generally below 10%. Again, the worst results are observed with the point method and are better in the optimal method, with errors not exceeding 6%. It should be noted that the optimal method precisely optimizes the comparison with respect to reflectivity. The improvements in SF and DF behave similarly, although a slight improvement is observed in the SF returns associated with the Ka-band, which may be associated with a smaller number of records in the selected sample. A higher dispersion of the Ka-band reflectivity can also be observed, which can be verified with slightly lower correlation values and errors in the Ku-band. In terms of the MAE and RMSE, there were hardly any differences between the point and mean methods. However, these values were almost halved, with values barely exceeding 0.15 in the optimal method.
Agreement with respect to the Dm values depends on the method applied to the selection of cases. In the point method, unlike the others, the Dm values tended to be underestimated by approximately 1 mm and 1.7 mm under the SF and DF algorithms, respectively. However, the mean methods show an overestimation that reaches a maximum value of 5.3 mm in the SF (mean 10 km). In these methods, the lowest correlation values were also obtained, whereas the best values were recorded in the optimal method with 0.83, and the highest point was 0.65. There is a clear improvement in the DF algorithms with respect to SF, especially in the mean methods, where values of 1 and 2 mm are overestimated, and values higher than 2 mm are underestimated.
As in the results of Adirosi et al. [15], the concordance in terms of Nw was not satisfactory. Although the correlations this time turned out to be better, they lack statistical significance: the NMAE values were very similar, close to 12% in all cases, while the NBIAS was higher, similar to the work of Seela et al. [8], increasing the underestimation in our cases. Although earlier versions of the DPR were used in those works, it is shown that the deficiencies in Nw estimates remain. This may support the idea that the discrepancies between satellite- and disdrometer-based Nw may be due to the parameterization used by the GPM to model DSD.
3.2.1. Single vs Dual Frequency Derived Estimates
Figure 6 shows the behavior of Nw versus Dm comparing all disdrometer data and two overpass matching methods (9-pixels and optimal) with GPM CO single and dual frequency estimates. The GPM data follow the typical Dm-10log10 Nw behavior reported by Adirosi et al. [15], although they are concentrated, mainly SF, at approximately 30-35 dBNw. As illustrated in Figure 6, comparing single vs dual frequency estimates, it is apparent that the dual frequency pattern in the Dm-10log10 Nw space is closer to disdrometer data than the single frequency pattern, which is consistent with the improved scores obtained by DF derived estimates seen in Table 10.
Further insight about differences between single and dual frequency derived estimates can be seen in Figure 7, which shows a Taylor Diagram that displays the STD-normalized, CC, and RMSE with the data obtained by the point method and the optimal method for the five variables of analysis. The benchmark represents the standard deviation and the correlation coefficient equal to unity. We observe an improvement using the optimal method, especially in the estimates of ZKa, Ku, and Dm. However, considering the analysis of precipitation intensity using the DF algorithm, the optimal yielded worse results. The differences between the methods may be related to the variability in precipitation in the pixels around the disdrometer.
3.2.2. Stratiform vs Convective Regimes
The precipitation type classification (including stratiform, convective and other regimes) provided by the DPR (variable named TypePrecip) was compared with the classification proposed by Dolan et al. [45] applied to disdrometer data. Table 11 shows the confusion matrix obtained by comparing the two datasets and considering the matches with the optimal method. Note that an "ambiguous" class appears to classify records that do not belong to stratiform or convective regimes using either method.
According to Table 11, disdrometer data presents a similar proportion of convective (37%) and stratiform cases (44%) and a smaller ratio of ambiguous cases. However, this is not the case for the DPR data where stratiform cases are clearly predominant (90%) and convective and ambiguous cases are marginal (5% each). The overall DPR classification is rather limited according to the value of the accuracy (below 0.50), as only 46% (precision of 0.46) of the predominant predicted regime (stratiform) is correctly done, despite 94% of cases identified as stratiform by the disdrometers where correctly predicted. Worse scores are obtained for convective cases.
4. Discussion
As discussed in previous research, discrepancies observed in DSD parameter values between disdrometer data and GPM-DPR estimates may be associated with spatial and/or temporal sampling problems [46,47]. The spatial sampling uncertainties are due to the difference in the observation area of the two instruments, as the disdrometer has a sampling area of about 50 cm2 and the GPM-DPR footprint circular radius is 5 km at nadir [10]. Another aspect to consider is the effect of updrafts and downdrafts present from the lowest GPM-DPR measurement to the ground, which can actually modify the estimated DSD at ground level [48]. As mentioned above there is also a problem associated with the limited GPM-DPR overpasses over a given region which implies a low probability of coincidence with observing precipitation over the disdrometer sites.
Similar to other investigations [14], results found here indicate the DF algorithm overestimated the mean Dm values and underestimated the intercept parameter Nw. Such a problem has been primarily associated with the DPR assumption of a constant shape parameter. In Section 3.1, Figure 2f, we compared the µ distribution observed by disdrometers with the fixed value set by DPR (µ=3) finding that it corresponded to the mode value but differed from the median (µ=7). To better understand the limitation of fixing the shape parameter µ in the calculation of DSD-derived variables, we examine the k/Ze ratio vs. the Dm, and the DFR vs. Dm with the disdrometer DSD (Figure 8). The k/Ze ratio was calculated assuming the SF algorithm applied to ZKu and the DFR was calculated considering the DF algorithm.
Each panel of Figure 8 shows the variable considered in two ways: fixing the shape parameter (grey dots) and not fixing it (blue dots). When µ is set to 3 for both single and dual frequency algorithms (Figure 8a and b), a much higher variability of the data is observed. Radhakrishna et al. [10] posited that the high scatter in the values of (k∕Zh) and DFR is caused by the high variability in the DSD of convective rainfall. When μ is fixed, part of this variability is lost, increasing the uncertainty in the estimates. These results and the strong correlation between μ and Nw [33,49] are among the factors that generate the differences in the DSD parameter values between the disdrometers and the DPR DF. In addition, Del Castillo-Velarde [14] and Radhakrishna et al. [10] showed that the DF algorithm has limitations when attempting to estimate Dm for DFR values less than 0 dB, where there are two possible Dm values for a DFR measurement as the DF algorithm selects the drop with the highest Dm if two solutions exist [19]. Here we also observe that, for DFR values below 0 dB, Dm grows when DFR decreases for Dm below 0.5 mm as reported [10,14].
As seen in equation (1) the GPM DPR rainfall rate computation is based on an adjustable R-Dm relationship linked to ε. In the version 6 of the DPR algorithm, ε was assumed to be invariant, which imposed constraints on rainfall retrieval and led to miss the natural DSD variations along the rainfall column. In version 7 was introduced a two-scale model of ε that allows to vary with range [6]. To assess the consistency of this approach with our disdrometer observations, the Dm vs R observations were plotted overlayed with the corresponding GPM DPR curves computed for values of ε equal to 1.25 and 0.2 and 5.0 thus covering the possible range of values (Figure 9).
The disdrometer data is clearly contained in the region limited by the GPM DPR lines and higher observation densities correspond well to the ε=1.25 for Dm < 1.5 mm but for larger diameters the GPM DPR relationships tend to underestimate R. As posited by [8,15], this may be due to the use of predefined constants (α, β, and τ) in the relationships between the precipitation rate and mass-weighted mean diameter (equation 1) that may not adequate for the rainfall characteristics of the region of study. In addition, factors such as the attenuation effect, multiple scattering, non-uniform beam filling, and terrain interference directly affect the accuracy of the GPM DPR parameter estimation [6,50].
The results of the analysis of the matches between GPM DPR overpasses with disdrometers were consistent with those of similar studies [8,15]. The superiority of the optimal matching approach, the lower errors associated with the radar reflectivity factor and the mass-weighted mean diameter, as well as the poorer agreement between the intercept parameter and the rainfall rate, are indications of limitations in the DPR algorithm. In addition, it is worth mentioning that there is no clear trend of improvement of the DF algorithms over SF in version 07, which agrees with what was observed with version 6 by Adirosi et al. [15]. Finally, the limited ability to detect the convective precipitation type, documented in studies analyzing previous GPM DPR previous versions [11,13,14], is also found here for version 07 as reported by Seela et al. [8].
5. Conclusions
In this study, more than 9 years of data ranging from March 2014 to November 2023 recorded by the GPM DPR over different geographical areas of the northeastern Iberian Peninsula were analyzed. Based on information from seven disdrometers, the first part of the study focuses on the characterization and comparison of DSD-derived parameters obtained from both datasets independently considering 162328 and 2263 min of precipitation records observed by disdrometers and the GPM DPR respectively. Results were stratified by orographic and climatic characteristics and several rainfall rate intensity thresholds. The second part of the study focused on validating four spatial matching methods between DPR overpasses and disdrometers. The main results are as follows:
- The behavior of DSD-derived variables among the inland, mountain, and coastal regions showed little variability according to the disdrometer data, which was captured by the DPR DF algorithm. However, the GPM DSD parameters show an overestimation of Dm by about 0.1 mm at low and moderate precipitation rates (0.1-1, 1-2, 2-4 mm/h) and by 0.4 mm at precipitation rates greater than 4 mm/h by the DF algorithm with respect to the disdrometer. In contrast, the behavior of Nw was underestimated by the DPR, with a maximum value close to 6 dBNw at moderate precipitation rates (4-8 mm/h).
- Disdrometer data indicated that the shape parameter mode over the area of study corresponds to the DPR fixed value (µ=3), but the median was higher (µ=7). Moreover, µ presents a distribution with a substantial natural variability which implies an increase in the uncertainty of DSD estimates based on the constant value assumption.
- The superiority of the optimal matching approach was observed when validating the GPM DPR rainfall parameters with disdrometers. The GPM DPR estimates showed better verification statistics for the radar reflectivity factor in both Ku and Ka bands and the mass-weighted mean diameter, while worse results were found for the rainfall rate and the shape parameter Nw.
- According to the available sample of overpass matches (41 cases) the DPR DF rainfall classification algorithm showed little ability to detect events identified as convective by the disdrometers.
To the authors’ knowledge, this validation study is the first of its kind covering the Iberian Peninsula and one of the few carried out in areas with Mediterranean climate. Moreover, this is one of the first analyses in which recent updates incorporated in version 7 are validated. Results reported here may contribute to enhance our understanding of potential applications and limitations of satellite precipitation observations and can be considered in the development of future satellite precipitation retrievals.
Author Contributions
Conceptualization, E.P. and J.B.; methodology, E.P. and J.B.; formal analysis, E.P.; investigation, E.P. and J.B.; data curation, E.P., F.P., J.B., M.U., S.G. and B.B.; writing—original draft preparation, E.P. and J.B.; writing—review and editing, all the authors.; visualization, E.P.; supervision, J.B. and M.U. All authors have read and agreed to the published version of the manuscript.
Funding
This research was partly funded by the projects WISE-PreP (RTI2018-098693-B-C32), ARTEMIS (PID2021-124253OB-I00 MINECO/FEDER) and the Water Research Institute (IdRA) of the University of Barcelona.
Data Availability Statement
Data are contained within the article.
Acknowledgments
Satellite and gauge data for this study were provided by NASA/JAXA. The authors wish to acknowledge the Fabra Observatory of the Royal Academy of Sciences and Arts of Barcelona and the support from the Secretariat for Universities and Research of the Ministry of Business and Knowledge of the Government of Catalonia and the European Social Fund.
Conflicts of Interest
The authors declare no conflicts of interest.
Appendix A
The GPM algorithm assume a gamma-type DSD (normalized version) to estimate the DSD parameters of the form:
where is the drop size distribution (in mm-1m-3 ), D is the diameter of the raindrop (mm), Dm (mm) is the mass-weighted mean diameter which represents a mean particle size of the distribution. Nw is the normalized scaling parameter for concentration (mm-1m-3), µ the shape parameter for gamma distribution and denotes the gamma function. Letting (in mm2) and (in mm2) be the backscattering cross section and the extinction cross section of raindrops at a given temperature respectively, K as a constant defined as a function of complex refractive index and λ the radar wavelength (in mm), the equivalent reflectivity Z (in mm6/m3) and specific attenuation k (in dB/km) are expressed as follows:
Equations (A3) and (A5) are used by the SF and DF algorithms to determine the DSD parameters. The terms and refer to normalized radar reflectivity and specific attenuation (in dB/km), and are the same as F(Dm) and G(Dm) in [19] and Ib (Dm, µ, λ) and Ie (Dm, µ, λ) in [9]. To determine parameters Dm and Nw, the GPM-DPR uses the SF and DF algorithms defined by Eqs. (A7) and (A8) respectively.
References
- Sun, Q.; Miao, C.; Duan, Q.; Ashouri, H.; Sorooshian, S.; Hsu, K.-L. A Review of Global Precipitation Data Sets: Data Sources, Estimation, and Intercomparisons. Reviews of Geophysics 2018, 56, 79–107. [CrossRef]
- Kummerow, C.; Barnes, W.; Kozu, T.; Shiue, J.; Simpson, J. The Tropical Rainfall Measuring Mission (TRMM) Sensor Package. Journal of atmospheric and oceanic technology 1998, 15, 809–817.
- Hou, A.Y.; Kakar, R.K.; Neeck, S.; Azarbarzin, A.A.; Kummerow, C.D.; Kojima, M.; Oki, R.; Nakamura, K.; Iguchi, T. The Global Precipitation Measurement Mission. Bulletin of the American Meteorological Society 2014, 95, 701–722. [CrossRef]
- Adler, R.F.; Gu, G.; Huffman, G.J.; Sapiano, M.R.; Wang, J.-J. GPCP and the Global Characteristics of Precipitation. Satellite Precipitation Measurement: Volume 2 2020, 677–697.
- GPM Core Observatory Available online: https://gpm.nasa.gov/missions/GPM/core-observatory (accessed on 8 April 2024).
- Liao, L.; Meneghini, R. GPM DPR Retrievals: Algorithm, Evaluation, and Validation. Remote Sensing 2022, 14, 843. [CrossRef]
- Tokay, A.; D’Adderio, L.P.; Wolff, D.B.; Petersen, W.A. Development and Evaluation of the Raindrop Size Distribution Parameters for the NASA Global Precipitation Measurement Mission Ground Validation Program. Journal of Atmospheric and Oceanic Technology 2020, 37, 115–128. [CrossRef]
- Seela, B.K.; Janapati, J.; Lin, P.-L.; Lan, C.-H.; Huang, M.-Q. Evaluation of GPM DPR Rain Parameters with North Taiwan Disdrometers. Journal of Hydrometeorology 2023, 25, 47–64. [CrossRef]
- Liao, L.; Meneghini, R.; Tokay, A. Uncertainties of GPM DPR Rain Estimates Caused by DSD Parameterizations. Journal of Applied Meteorology and Climatology 2014, 53, 2524–2537. [CrossRef]
- Radhakrishna, B.; Satheesh, S.K.; Narayana Rao, T.; Saikranthi, K.; Sunilkumar, K. Assessment of DSDs of GPM-DPR with Ground-Based Disdrometer at Seasonal Scale over Gadanki, India. Journal of Geophysical Research: Atmospheres 2016, 121, 11,792-11,802. [CrossRef]
- D’Adderio, L.P.; Porcù, F.; Panegrossi, G.; Marra, A.C.; Sanò, P.; Dietrich, S. Comparison of the GPM DPR Single- and Double-Frequency Products Over the Mediterranean Area. IEEE Transactions on Geoscience and Remote Sensing 2019, 57, 9724–9739. [CrossRef]
- Wu, Z.; Zhang, Y.; Zhang, L.; Hao, X.; Lei, H.; Zheng, H. Validation of GPM Precipitation Products by Comparison with Ground-Based Parsivel Disdrometers over Jianghuai Region. Water 2019, 11, 1260. [CrossRef]
- Chase, R.J.; Nesbitt, S.W.; McFarquhar, G.M. Evaluation of the Microphysical Assumptions within GPM-DPR Using Ground-Based Observations of Rain and Snow. Atmosphere 2020, 11, 619. [CrossRef]
- Del Castillo-Velarde, C.; Kumar, S.; Valdivia-Prado, J.M.; Moya-Álvarez, A.S.; Flores-Rojas, J.L.; Villalobos-Puma, E.; Martínez-Castro, D.; Silva-Vidal, Y. Evaluation of GPM Dual-Frequency Precipitation Radar Algorithms to Estimate Drop Size Distribution Parameters, Using Ground-Based Measurement over the Central Andes of Peru. Earth Syst Environ 2021, 5, 597–619. [CrossRef]
- Adirosi, E.; Montopoli, M.; Bracci, A.; Porcù, F.; Capozzi, V.; Annella, C.; Budillon, G.; Bucchignani, E.; Zollo, A.L.; Cazzuli, O.; et al. Validation of GPM Rainfall and Drop Size Distribution Products through Disdrometers in Italy. Remote Sensing 2021, 13, 2081. [CrossRef]
- Sun, Y.; Dong, X.; Cui, W.; Zhou, Z.; Fu, Z.; Zhou, L.; Deng, Y.; Cui, C. Vertical Structures of Typical Meiyu Precipitation Events Retrieved from GPM-DPR. Journal of Geophysical Research: Atmospheres 2020, 125, e2019JD031466.
- Cramer, W.; Guiot, J.; Fader, M.; Garrabou, J.; Gattuso, J.-P.; Iglesias, A.; Lange, M.A.; Lionello, P.; Llasat, M.C.; Paz, S.; et al. Climate Change and Interconnected Risks to Sustainable Development in the Mediterranean. Nature Clim Change 2018, 8, 972–980. [CrossRef]
- Kidd, C.; Huffman, G.; Maggioni, V.; Chambon, P.; Oki, R. The Global Satellite Precipitation Constellation: Current Status and Future Requirements. Bulletin of the American Meteorological Society 2021, 102, E1844–E1861. [CrossRef]
- Seto, S.; Iguchi, T.; Oki, T. The Basic Performance of a Precipitation Retrieval Algorithm for the Global Precipitation Measurement Mission’s Single/Dual-Frequency Radar Measurements. IEEE Transactions on Geoscience and Remote Sensing 2013, 51, 5239–5251. [CrossRef]
- Seto, S.; Iguchi, T.; Meneghini, R.; Awaka, J.; Kubota, T.; Masaki, T.; Takahashi, N. The Precipitation Rate Retrieval Algorithms for the GPM Dual-Frequency Precipitation Radar. Journal of the Meteorological Society of Japan. Ser. II 2021, 99, 205–237. [CrossRef]
- Iguchi, T.; Seto, S.; Meneghini, R.; Yoshida, N.; Awaka, J.; Le, M.; Chandrasekar, V.; Kubota, T. GPM/DPR Level-2 Algorithm Theoretical Basis Document. NASA Goddard Space Flight Center 2021.
- Seto, S.; Iguchi, T. Intercomparison of Attenuation Correction Methods for the GPM Dual-Frequency Precipitation Radar. Journal of Atmospheric and Oceanic Technology 2015, 32, 915–926. [CrossRef]
- Udina, M.; Peinó, E.; Polls, F.; Mercader, J.; Guerrero, I.; Valmassoi, A.; Paci, A.; Bech, J. Irrigation Impact on Boundary Layer and Precipitation Characteristics in Weather Research and Forecasting Model Simulations during LIAISE-2021. Quarterly Journal of the Royal Meteorological Society n/a. [CrossRef]
- González, S.; Bech, J.; Garcia-Benadí, A.; Udina, M.; Codina, B.; Trapero, L.; Paci, A.; Georgis, J.-F. Vertical Structure and Microphysical Observations of Winter Precipitation in an Inner Valley during the Cerdanya-2017 Field Campaign. Atmospheric Research 2021, 264, 105826. [CrossRef]
- HydroMet, O.T.T. Operating Instructions Present Weather Sensor OTT Parsivel 2. OTT HydroMet: Kempten, Germany 2016, 52.
- Messtechnik, O.T.T. Operating Instructions: Present Weather Sensor–Parsivel. Kempten, Germany 2009.
- Friedrich, K.; Higgins, S.; Masters, F.J.; Lopez, C.R. Articulating and Stationary PARSIVEL Disdrometer Measurements in Conditions with Strong Winds and Heavy Rainfall. Journal of Atmospheric and Oceanic Technology 2013, 30, 2063–2080. [CrossRef]
- Casanovas, C.; Salio, P.; Galligani, V.; Dolan, B.; Nesbitt, S.W. Drop Size Distribution Variability in Central Argentina during RELAMPAGO-CACTI. Remote Sensing 2021, 13, 2026. [CrossRef]
- Atlas, D.; Srivastava, R.C.; Sekhon, R.S. Doppler Radar Characteristics of Precipitation at Vertical Incidence. Reviews of Geophysics 1973, 11, 1–35.
- WMO CODE TABLE 4677 Available online: https://www.nodc.noaa.gov/archive/arc0021/0002199/1.1/data/0-data/HTML/WMO-CODE/WMO4677.HTM (accessed on 8 April 2024).
- Bringi, V.N.; Chandrasekar, V.; Hubbert, J.; Gorgucci, E.; Randeu, W.L.; Schoenhuber, M. Raindrop Size Distribution in Different Climatic Regimes from Disdrometer and Dual-Polarized Radar Analysis. Journal of the Atmospheric Sciences 2003, 60, 354–365. [CrossRef]
- Seela, B.K.; Janapati, J.; Lin, P.-L.; Reddy, K.K.; Shirooka, R.; Wang, P.K. A Comparison Study of Summer Season Raindrop Size Distribution Between Palau and Taiwan, Two Islands in Western Pacific. Journal of Geophysical Research: Atmospheres 2017, 122, 11,787-11,805. [CrossRef]
- Ulbrich, C.W.; Atlas, D. Rainfall Microphysics and Radar Properties: Analysis Methods for Drop Size Spectra. Journal of Applied Meteorology and Climatology 1998, 37, 912–923. [CrossRef]
- Leinonen, J. High-Level Interface to T-Matrix Scattering Calculations: Architecture, Capabilities and Limitations. Opt. Express, OE 2014, 22, 1655–1660. [CrossRef]
- Mishchenko, M.I.; Travis, L.D.; Mackowski, D.W. T-Matrix Computations of Light Scattering by Nonspherical Particles: A Review. Journal of Quantitative Spectroscopy and Radiative Transfer 1996, 55, 535–575. [CrossRef]
- Thurai, M.; Huang, G.J.; Bringi, V.N.; Randeu, W.L.; Schönhuber, M. Drop Shapes, Model Comparisons, and Calculations of Polarimetric Radar Parameters in Rain. Journal of Atmospheric and Oceanic Technology 2007, 24, 1019–1032. [CrossRef]
- Group, S.M. Python Interface to T-Matrix Scattering Computations (PyTMatrix) Available online: https://www.techbriefs.com/component/content/article/25465-npo-49724 (accessed on 29 February 2024).
- Pytmatrix/Pytmatrix/Tmatrix_aux.Py at Master · Jleinonen/Pytmatrix Available online: https://github.com/jleinonen/pytmatrix/blob/master/pytmatrix/tmatrix_aux.py (accessed on 9 February 2024).
- Hamada, A.; Takayabu, Y.N. Improvements in Detection of Light Precipitation with the Global Precipitation Measurement Dual-Frequency Precipitation Radar (GPM DPR). Journal of Atmospheric and Oceanic Technology 2016, 33, 653–667. [CrossRef]
- Brooks, H.E.; Flora, M.L.; Baldwin, M.E. A Rose by Any Other Name: On Basic Scores from the 2 × 2 Table and the Plethora of Names Attached to Them. Artificial Intelligence for the Earth Systems 2024, 3. [CrossRef]
- Ghada, W.; Casellas, E.; Herbinger, J.; Garcia-Benadí, A.; Bothmann, L.; Estrella, N.; Bech, J.; Menzel, A. Stratiform and Convective Rain Classification Using Machine Learning Models and Micro Rain Radar. Remote Sensing 2022, 14, 4563. [CrossRef]
- Livezey, R.E. Deterministic Forecasts of Multi-Category Events. Forecast Verification: A Practitioner’s Guide in Atmospheric Science 2011, 61–75.
- Tharwat, A. Classification Assessment Methods. Applied computing and informatics 2020, 17, 168–192.
- Peinó, E.; Bech, J.; Udina, M.; Polls, F. Disentangling Satellite Precipitation Estimate Errors of Heavy Rainfall at the Daily and Sub-Daily Scales in the Western Mediterranean. Remote Sensing 2024, 16, 457. [CrossRef]
- Dolan, B.; Fuchs, B.; Rutledge, S.A.; Barnes, E.A.; Thompson, E.J. Primary Modes of Global Drop Size Distributions. Journal of the Atmospheric Sciences 2018, 75, 1453–1476. [CrossRef]
- Bringi, V.N.; Huang, G.-J.; Munchak, S.J.; Kummerow, C.D.; Marks, D.A.; Wolff, D.B. Comparison of Drop Size Distribution Parameter (D0) and Rain Rate from S-Band Dual-Polarized Ground Radar, TRMM Precipitation Radar (PR), and Combined PR–TMI: Two Events from Kwajalein Atoll. Journal of Atmospheric and Oceanic Technology 2012, 29, 1603–1616. [CrossRef]
- Bringi, V.N.; Tolstoy, L.; Thurai, M.; Petersen, W.A. Estimation of Spatial Correlation of Drop Size Distribution Parameters and Rain Rate Using NASA’s S-Band Polarimetric Radar and 2D Video Disdrometer Network: Two Case Studies from MC3E. Journal of Hydrometeorology 2015, 16, 1207–1221.
- Watters, D.C. The Global Precipitation Measurement Mission: Product Validation and Model Evaluation Studies, University of Leicester, 2021.
- Ulbrich, C.W. Natural Variations in the Analytical Form of the Raindrop Size Distribution. Journal of Applied Meteorology and Climatology 1983, 22, 1764–1775. [CrossRef]
- Meneghini, R.; Liao, L.; Iguchi, T. A Generalized Dual-Frequency Ratio (DFR) Approach for Rain Retrievals. Journal of Atmospheric and Oceanic Technology 2022, 39, 1309–1329. [CrossRef]
Figure 1.
Digital elevation model of the region of study and the three subregions considered (Mountain, Plain and Coast) and disdrometer sites (black dots), showing range circles of 5 km (thin red line) and 10 km (black dotted line) around each site where GPM-DPR data are collected for the present study. The lower right corner shows a map with the Köppen climate classification of the region and the disdrometer locations.
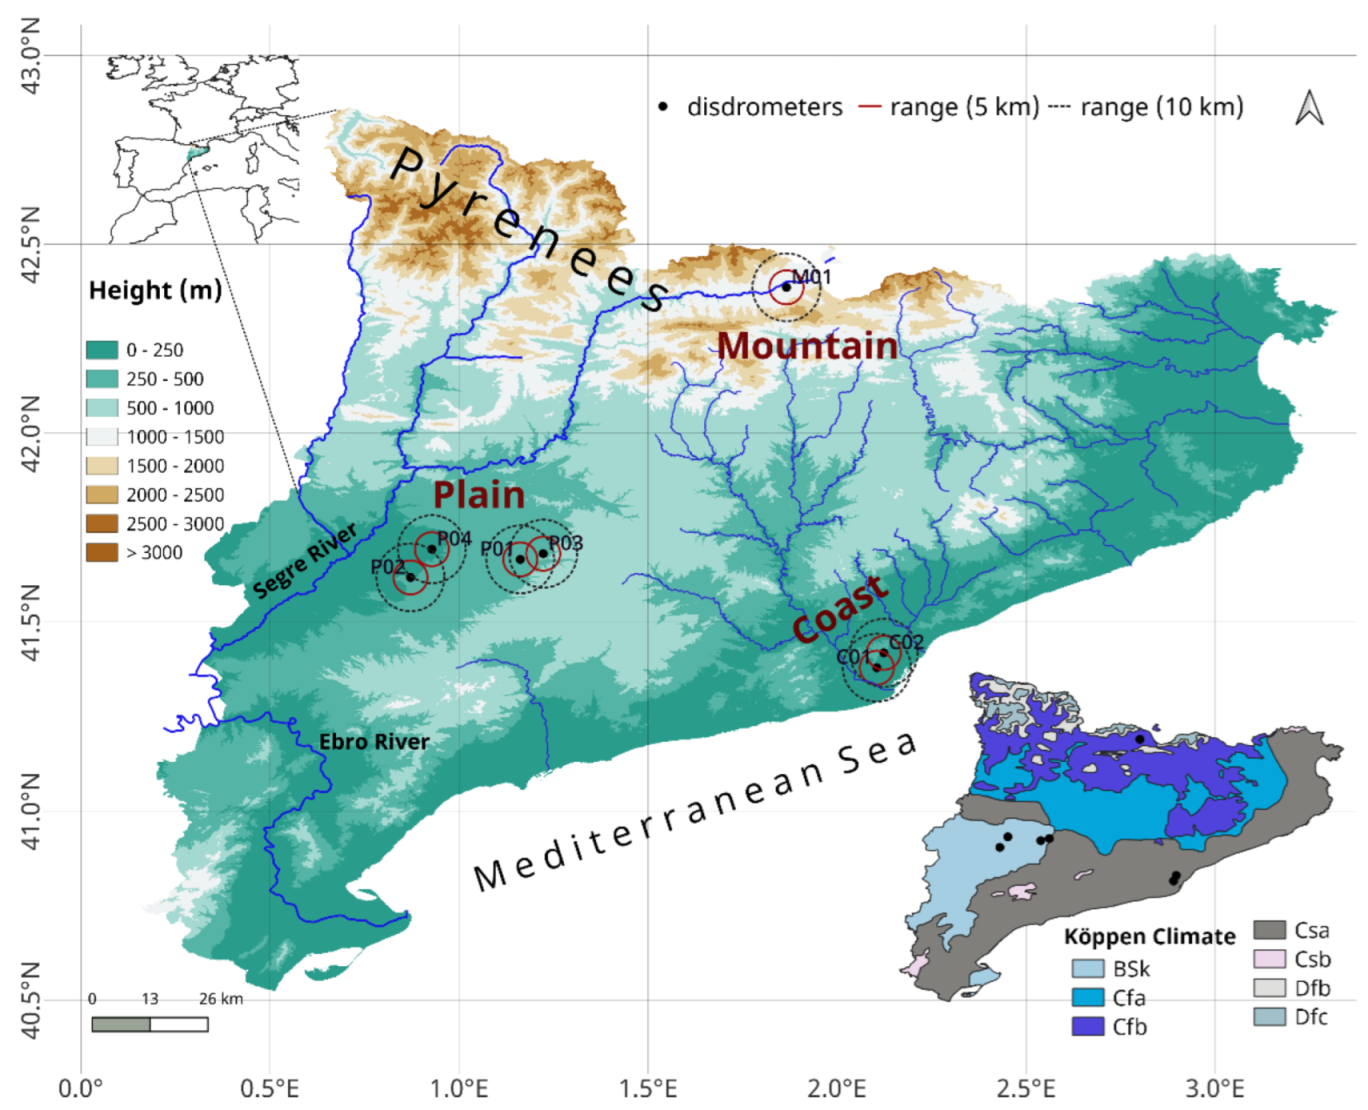
Figure 2.
Histograms of (a) ZKu, (b) ZKa, (c) log10(R), (d) Dm, (e)10 log10 (Nw), and (f) shape parameter (µ) derived from all disdrometer and GPM DPR (DF) datasets.
Figure 2.
Histograms of (a) ZKu, (b) ZKa, (c) log10(R), (d) Dm, (e)10 log10 (Nw), and (f) shape parameter (µ) derived from all disdrometer and GPM DPR (DF) datasets.
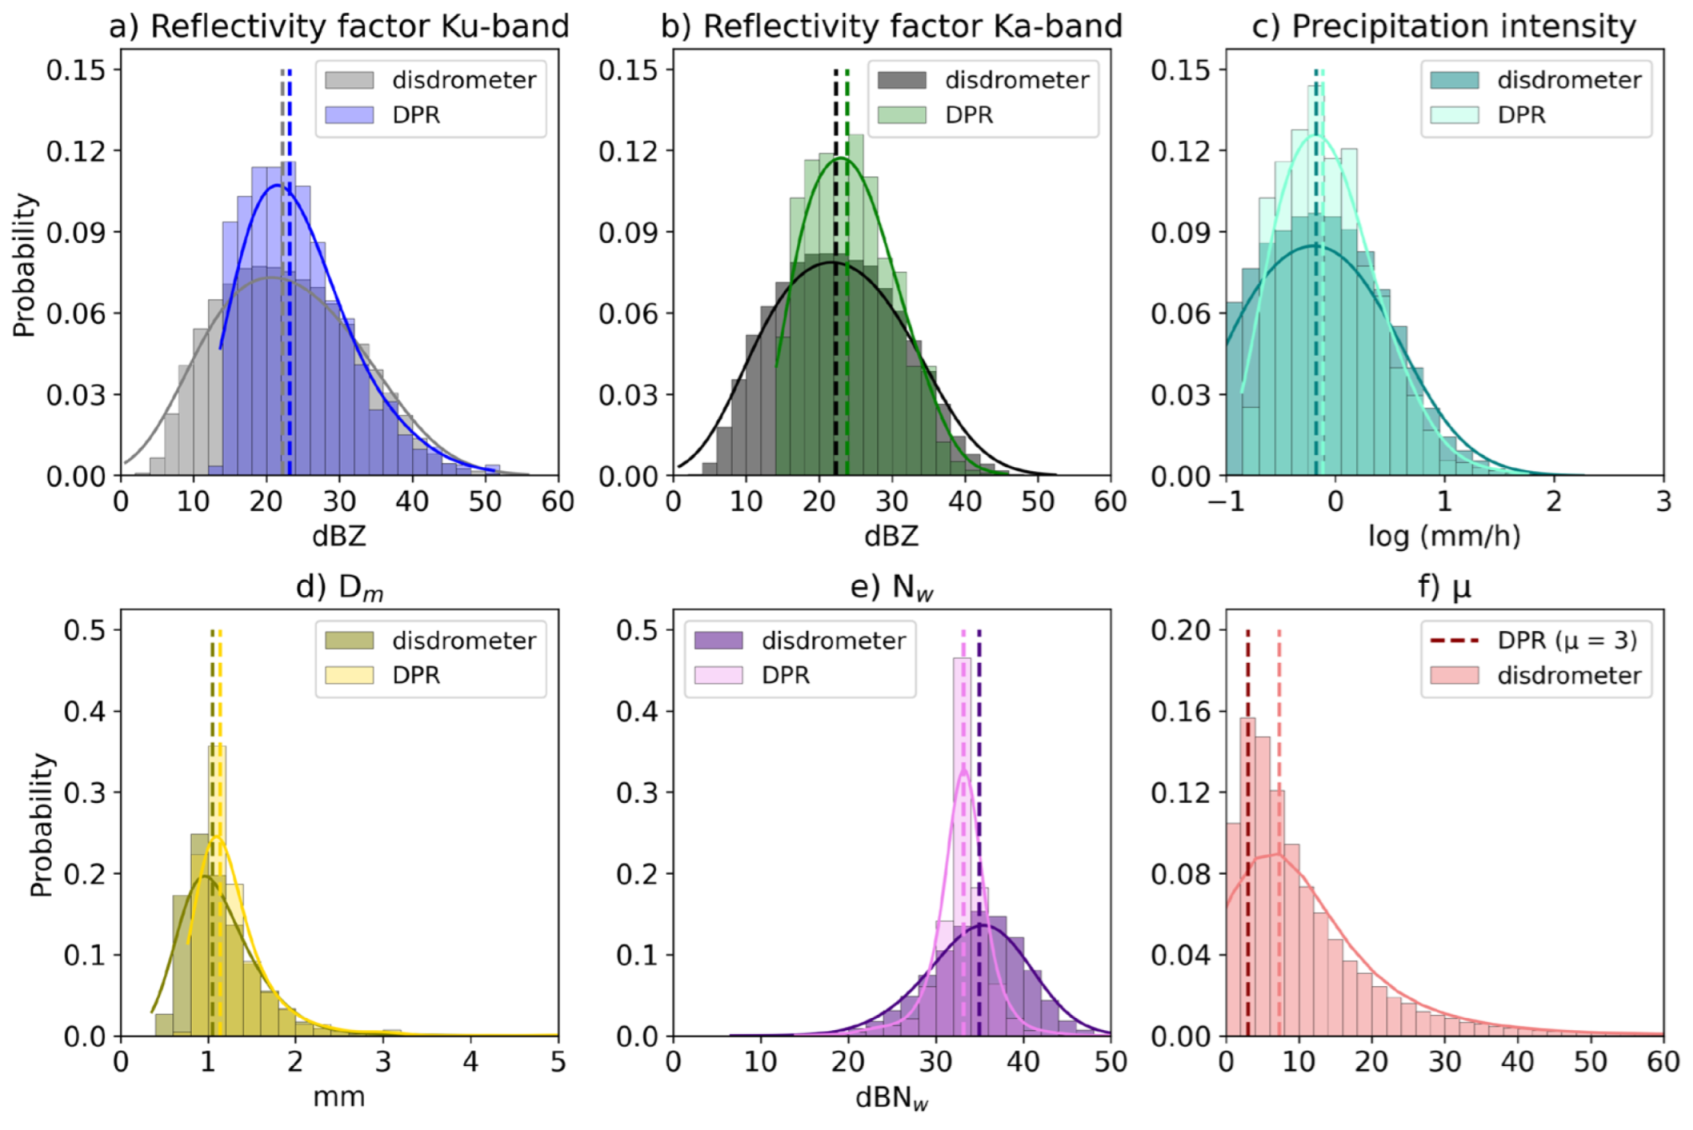
Figure 3.
Comparison of normalized frequency distribution showing the ratio of data at each rain rate interval for disdrometer (in blue) and DPR (in red) data (top panel). Similarly, comparison of DSD parameters Dm (middle panel) and Nw (bottom panel). All panels show values for the subregions Plain (dashed line), Coast (dotted line), Mountain (semi-dashed line), and the whole region (All, thick line), for both disdrometer (DIS_) and DPR (DPR_) data.
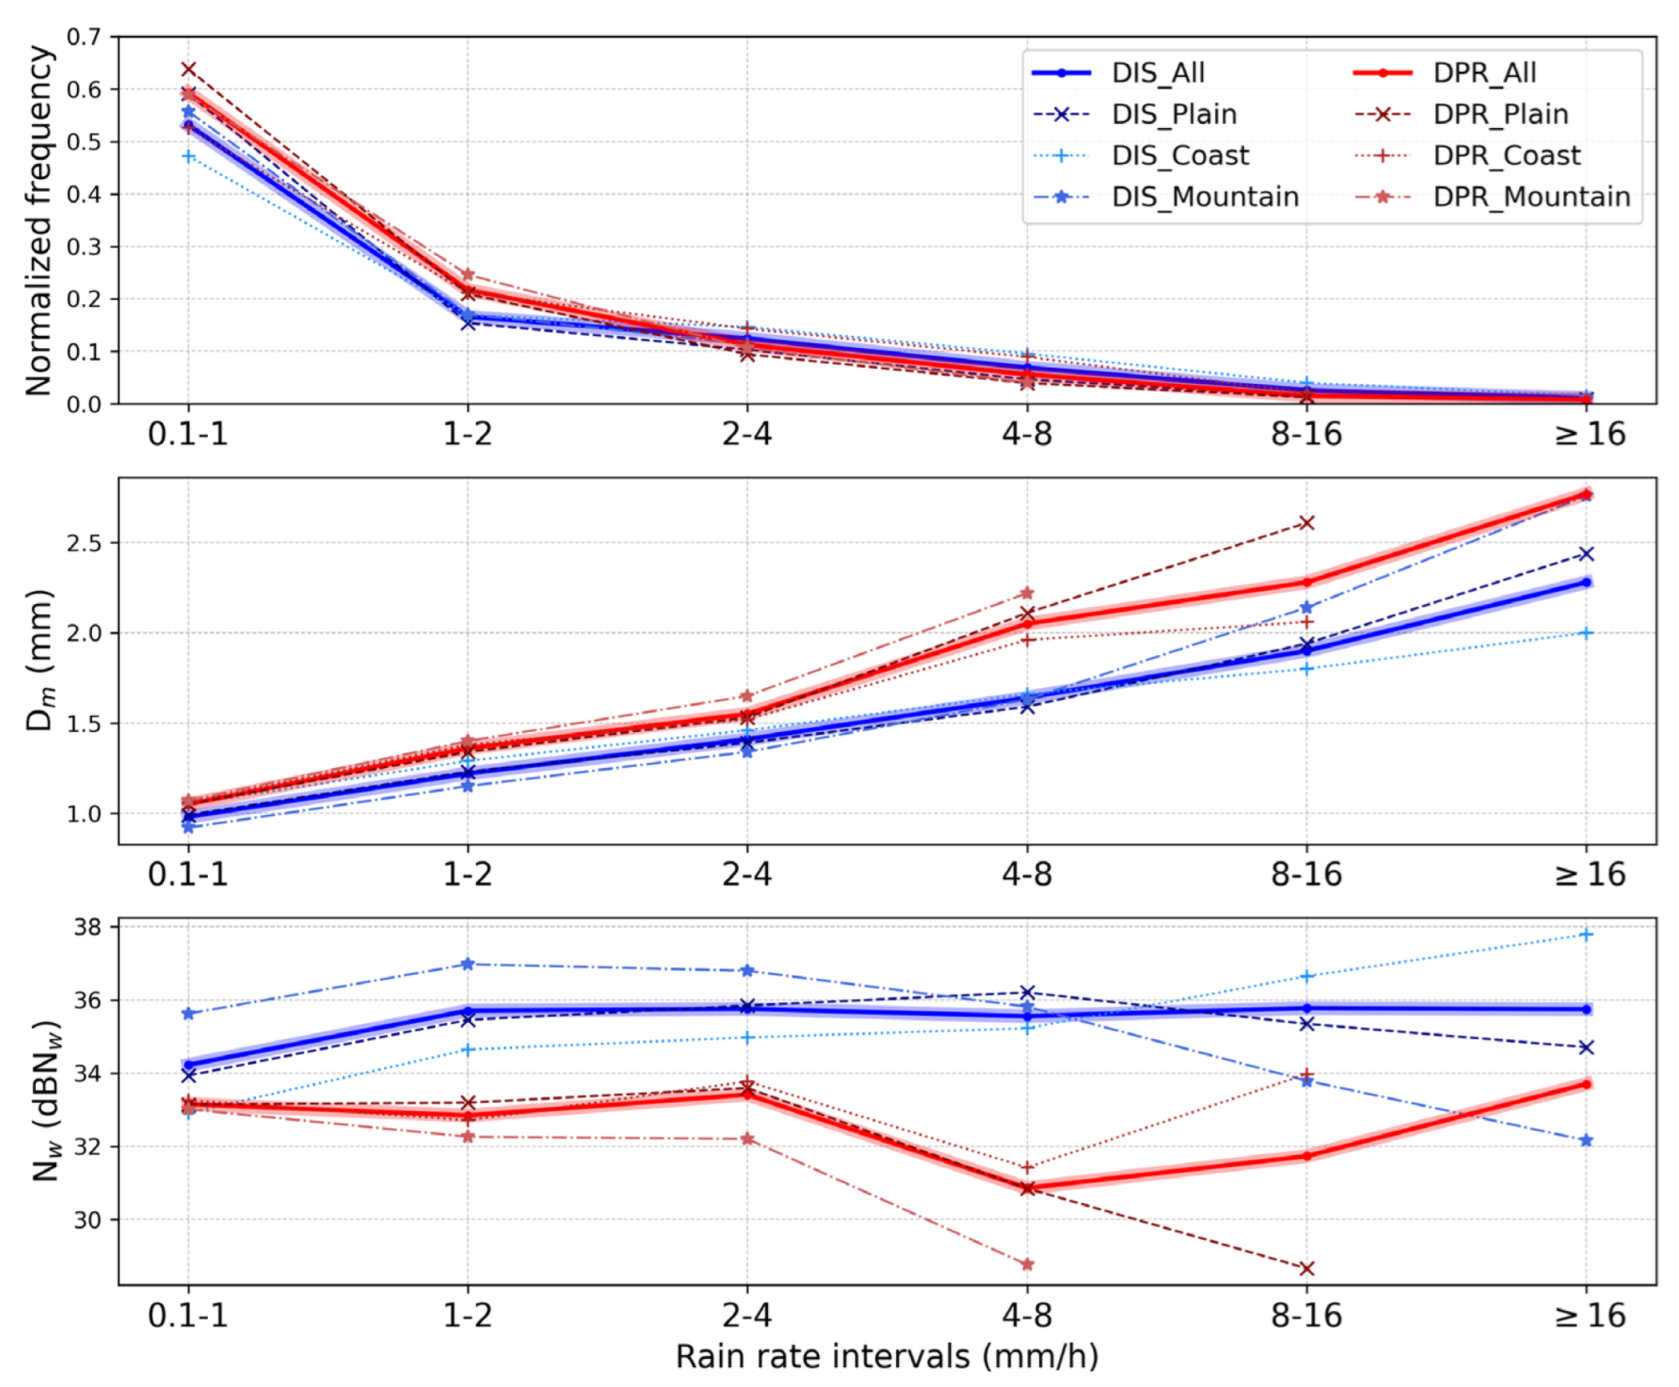
Figure 4.
(a) Scatter density plot of raindrop size distribution measurements from all disdrometers in the D0-log(Nw) space overlapped with the stratiform region (limited by turquoise dashed line) and convective region (limited by red dashed line) defined by Dolan et al. [45]. Disdrometer data density increases from dark to white dots and DPR DF convective and stratiform types are indicated by red and turquoise dots respectively (b) Convective, stratiform and microphysical dominant processes regions in the D0-log(Nw) space according to Dolan et al. [45] overlapped with disdrometer (grey dots) and DF DPR (cyan dots) data.
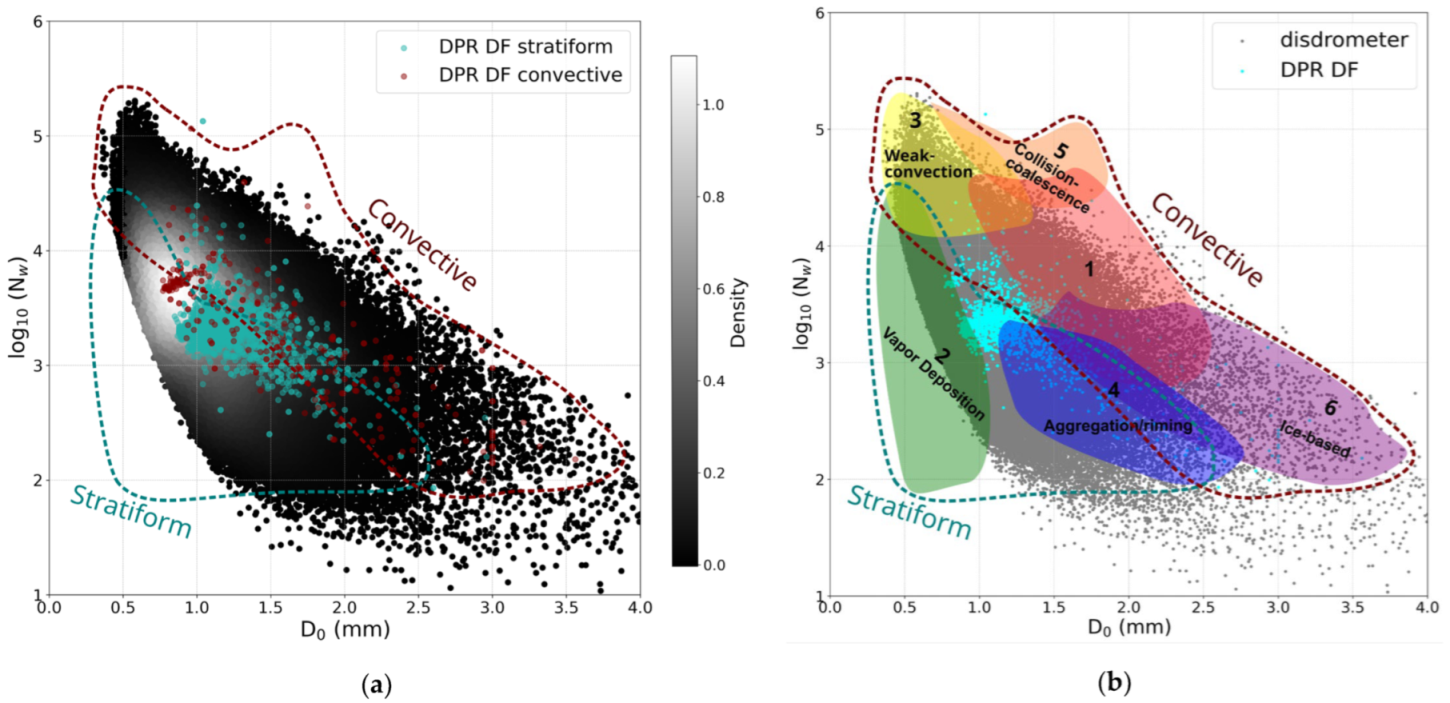
Figure 5.
Scatterplots between disdrometer (x-axis) and GPM products (y-axis) considering rainfall rate (first row), ZKa (second row), ZKu (third row), Dm (fourth row) , and dBNw (fifth row) and four matching methods (point, mean 5km, mean 10km, and optimal).
Figure 5.
Scatterplots between disdrometer (x-axis) and GPM products (y-axis) considering rainfall rate (first row), ZKa (second row), ZKu (third row), Dm (fourth row) , and dBNw (fifth row) and four matching methods (point, mean 5km, mean 10km, and optimal).
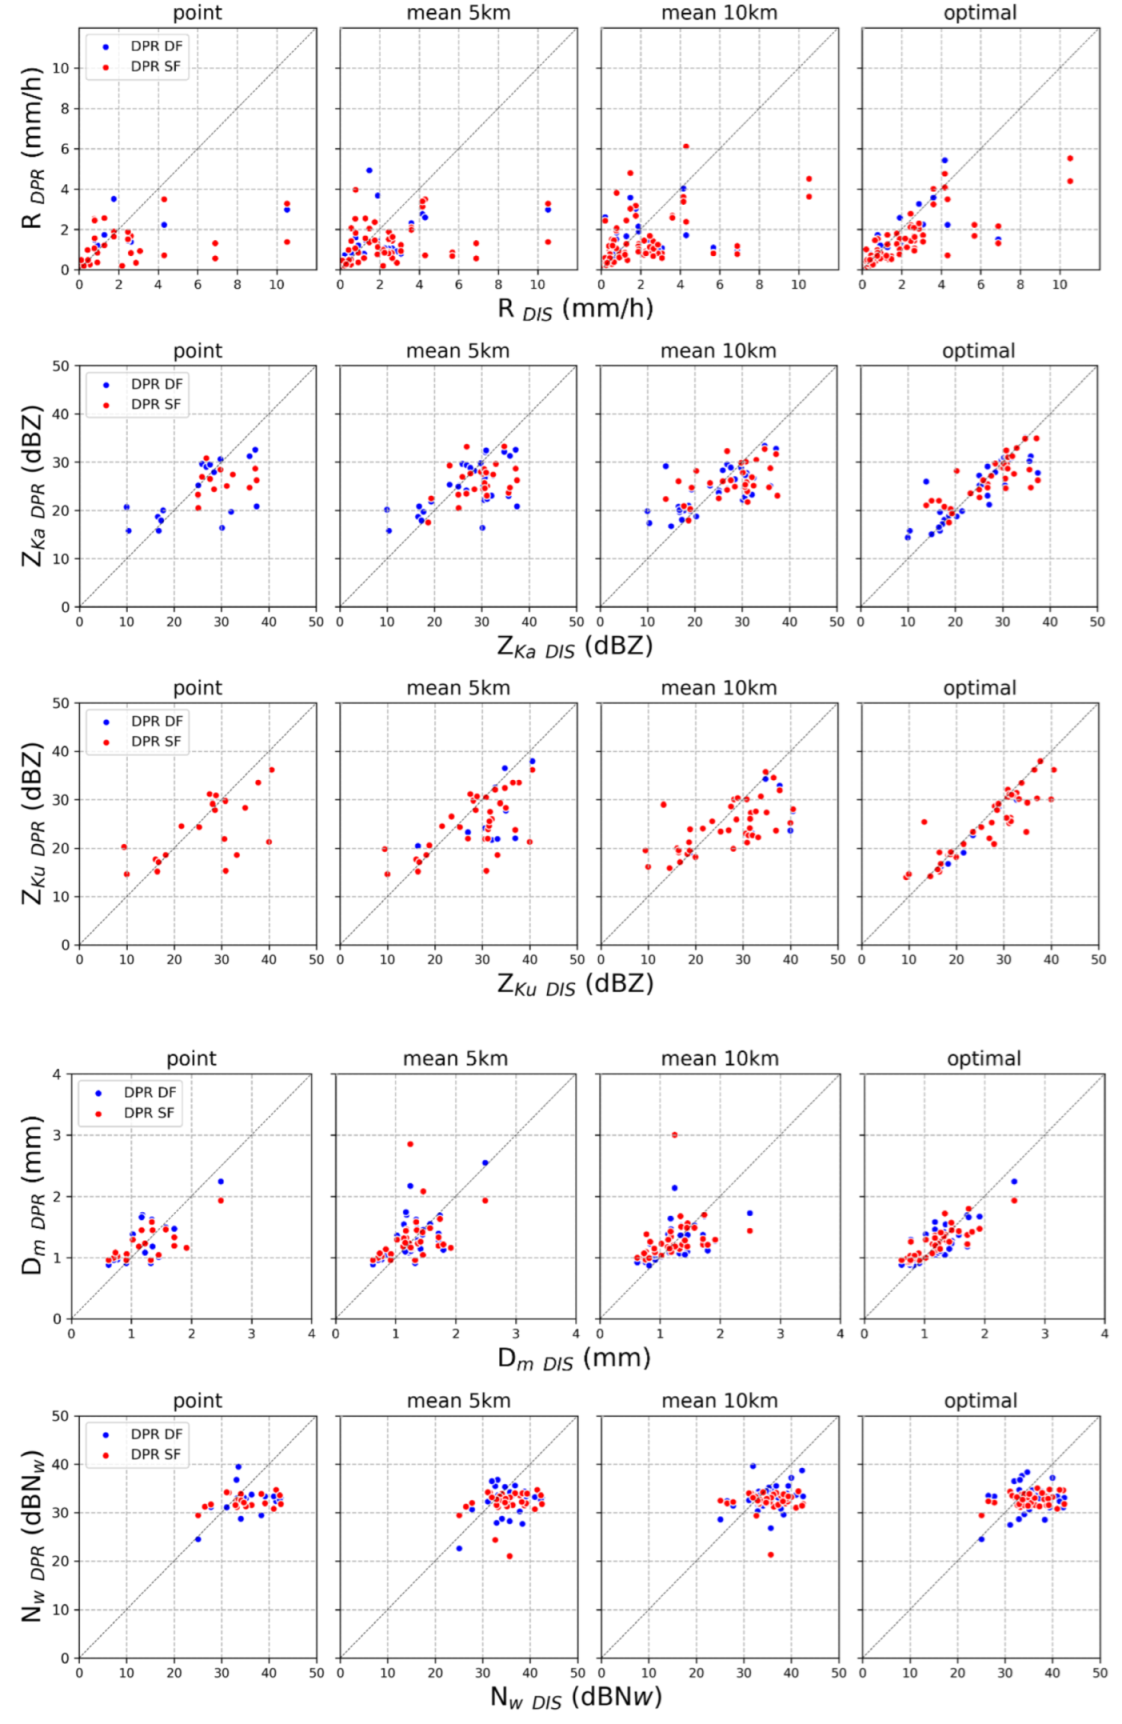
Figure 6.
Dm vs. Nw for all available disdrometer data (grey dots), GPM data of nine pixels around the disdrometers (cyan dots), and GPM data coincident with disdrometers (violet dots) under optimal method showing GPM single frequency (a) and dual frequency (b) derived estimates. The black and red dots with the error bars represent the averages and standard deviations of the disdrometer data set and GPM 9 pixels method.
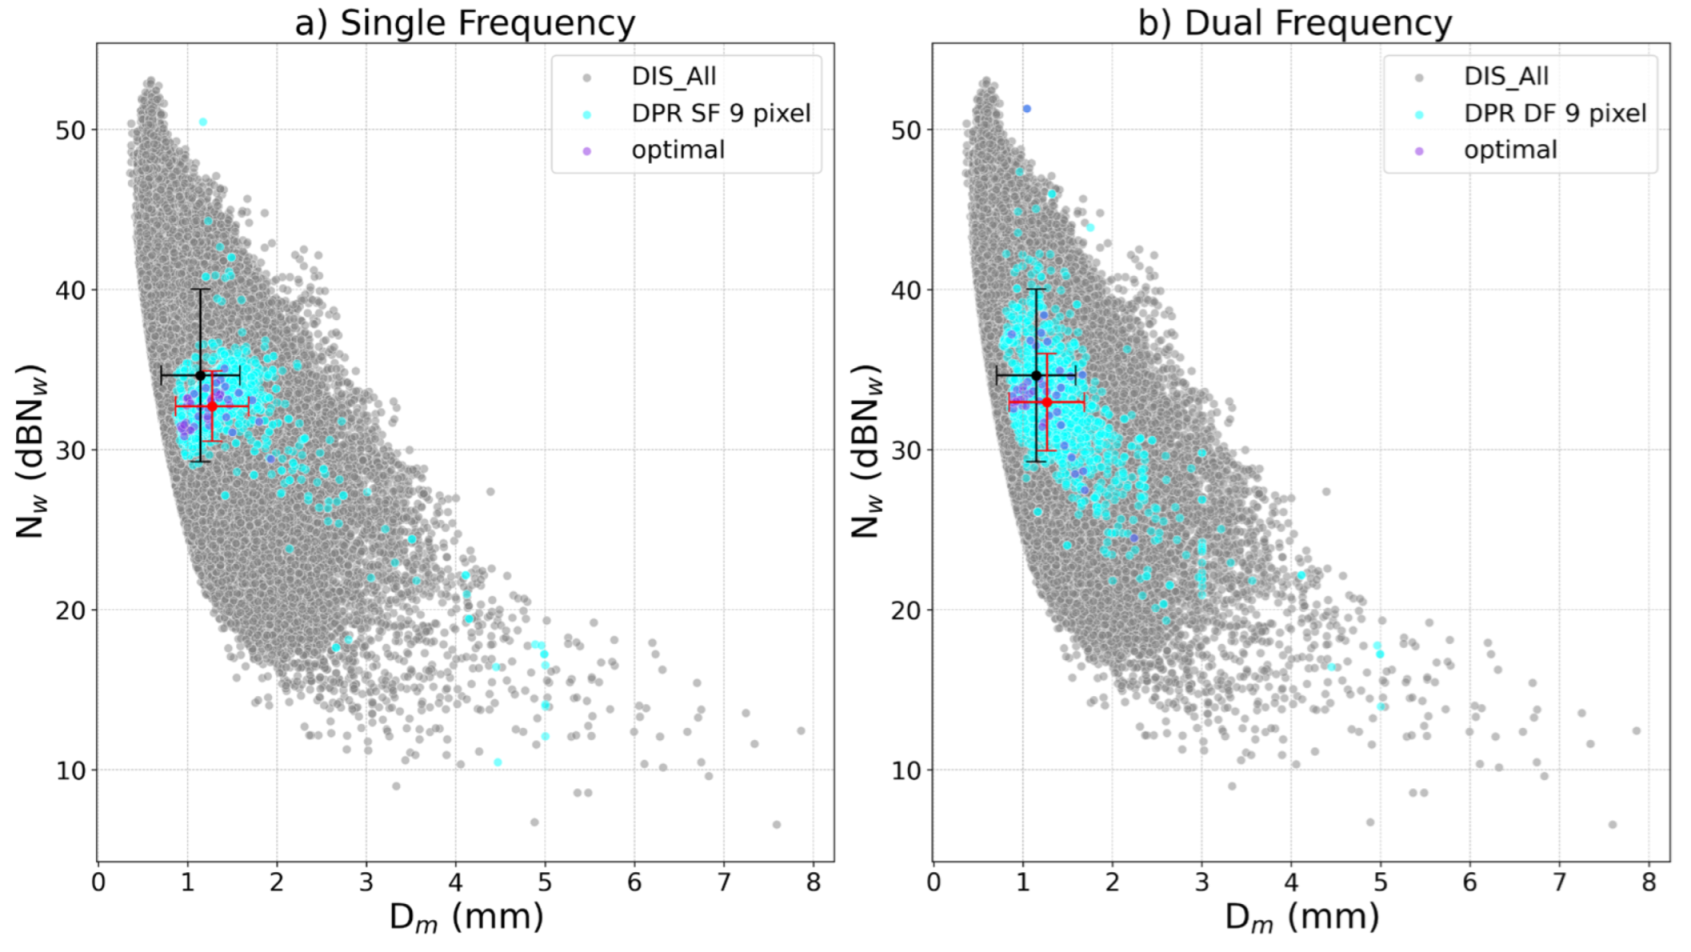
Figure 7.
Taylor diagram with the data obtained by the point and the optimal methods for R, ZKa, ZKu, Dm and Nw for single frequency (a) and dual frequency (b) GPM derived estimates.
Figure 7.
Taylor diagram with the data obtained by the point and the optimal methods for R, ZKa, ZKu, Dm and Nw for single frequency (a) and dual frequency (b) GPM derived estimates.
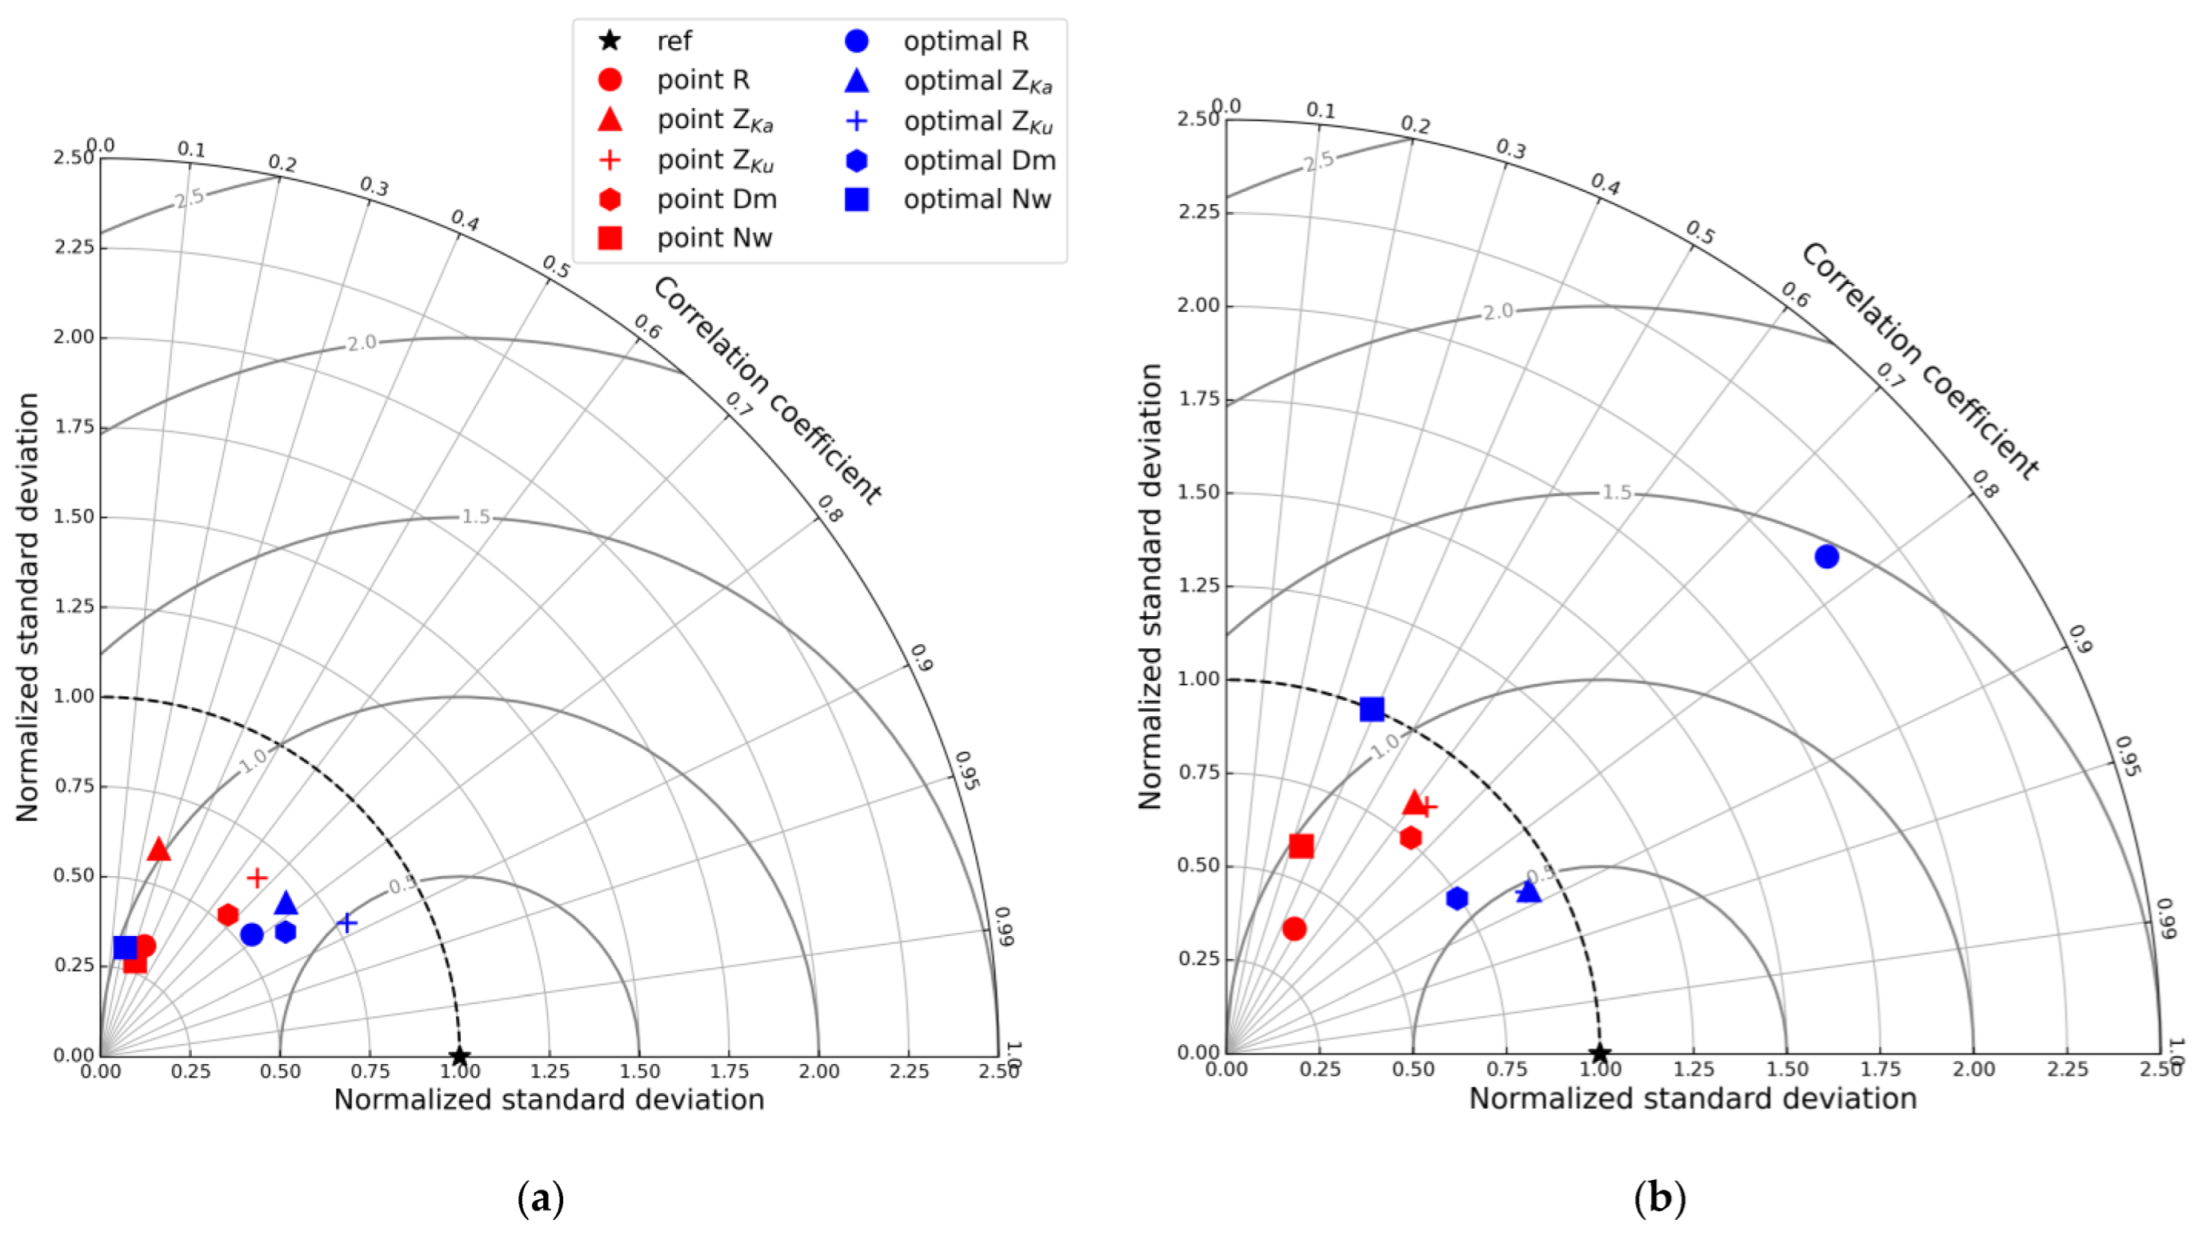
Figure 8.
a) Attenuation (k) to reflectivity (Zh) ratio as a function of Dm at Ku-band frequency obtained from disdrometer measurements without and with fixed shape parameter (μ=3) b) As panel a) but for DFR estimated with the Dual Frequency algorithm.
Figure 8.
a) Attenuation (k) to reflectivity (Zh) ratio as a function of Dm at Ku-band frequency obtained from disdrometer measurements without and with fixed shape parameter (μ=3) b) As panel a) but for DFR estimated with the Dual Frequency algorithm.
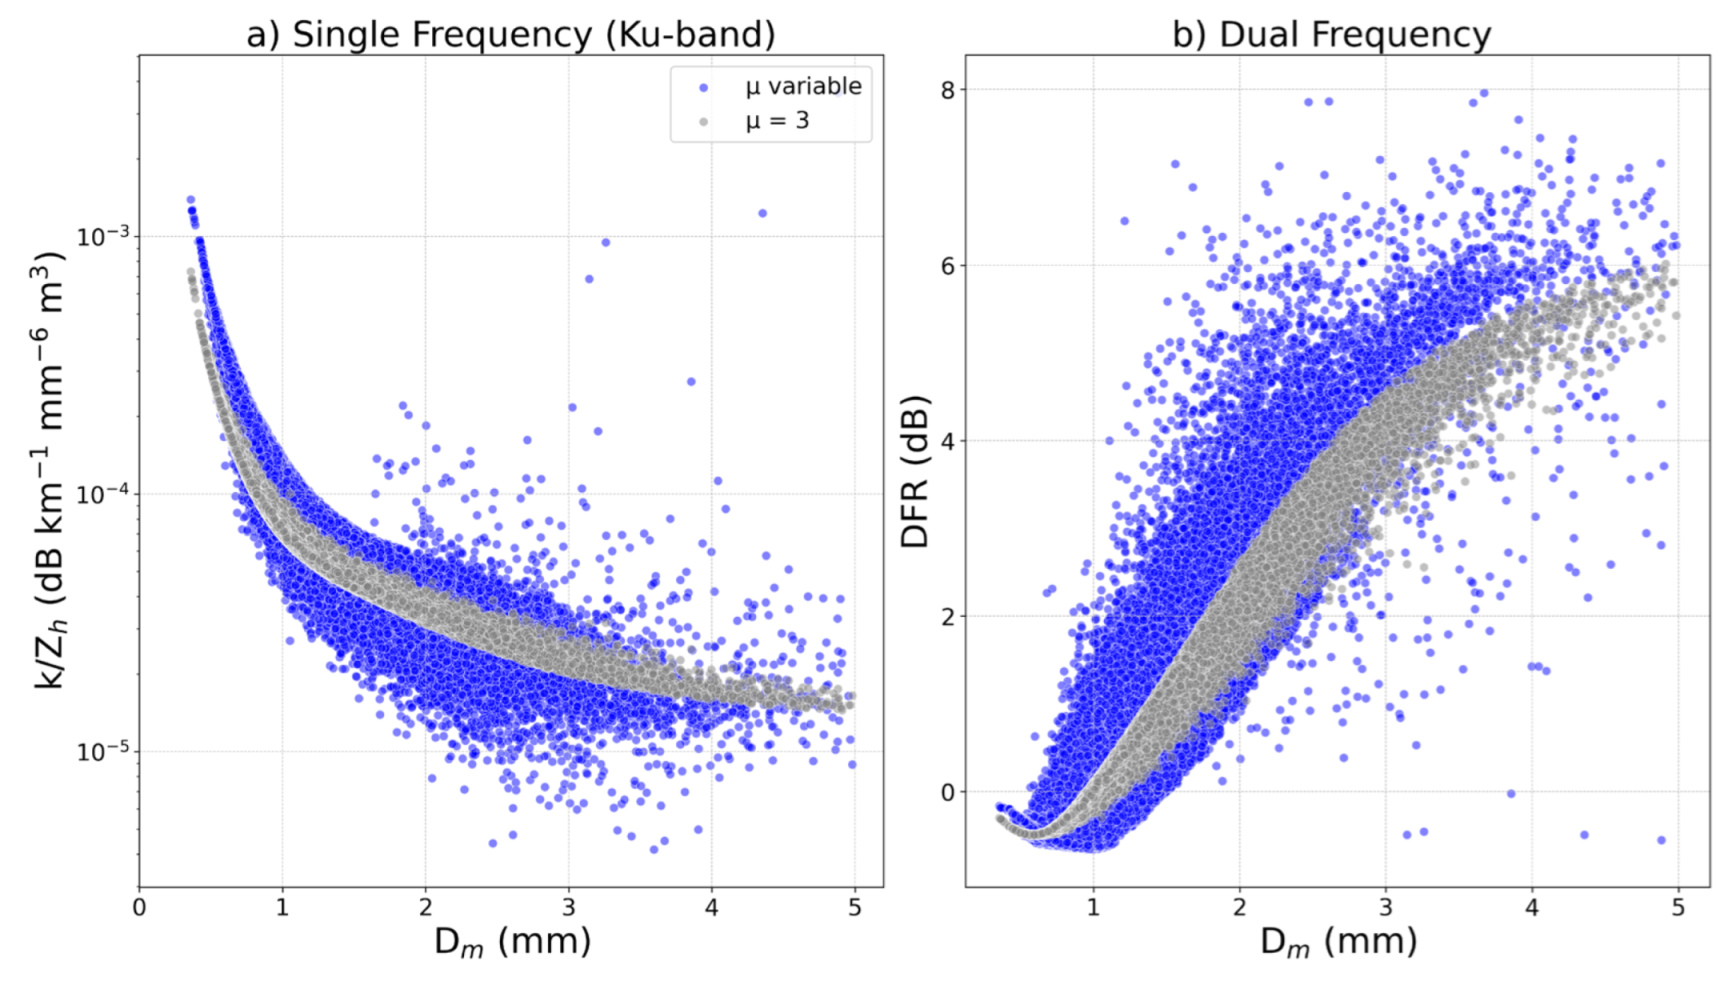
Figure 9.
Scatter density plot of log10 (R) vs Dm observed by disdrometers overlayed with the relation used in the GPM DPR algorithm for ε equal to 0.2 (upper dashed line), 1.25 (solid line), and 5.0 (lower dashed line).
Figure 9.
Scatter density plot of log10 (R) vs Dm observed by disdrometers overlayed with the relation used in the GPM DPR algorithm for ε equal to 0.2 (upper dashed line), 1.25 (solid line), and 5.0 (lower dashed line).
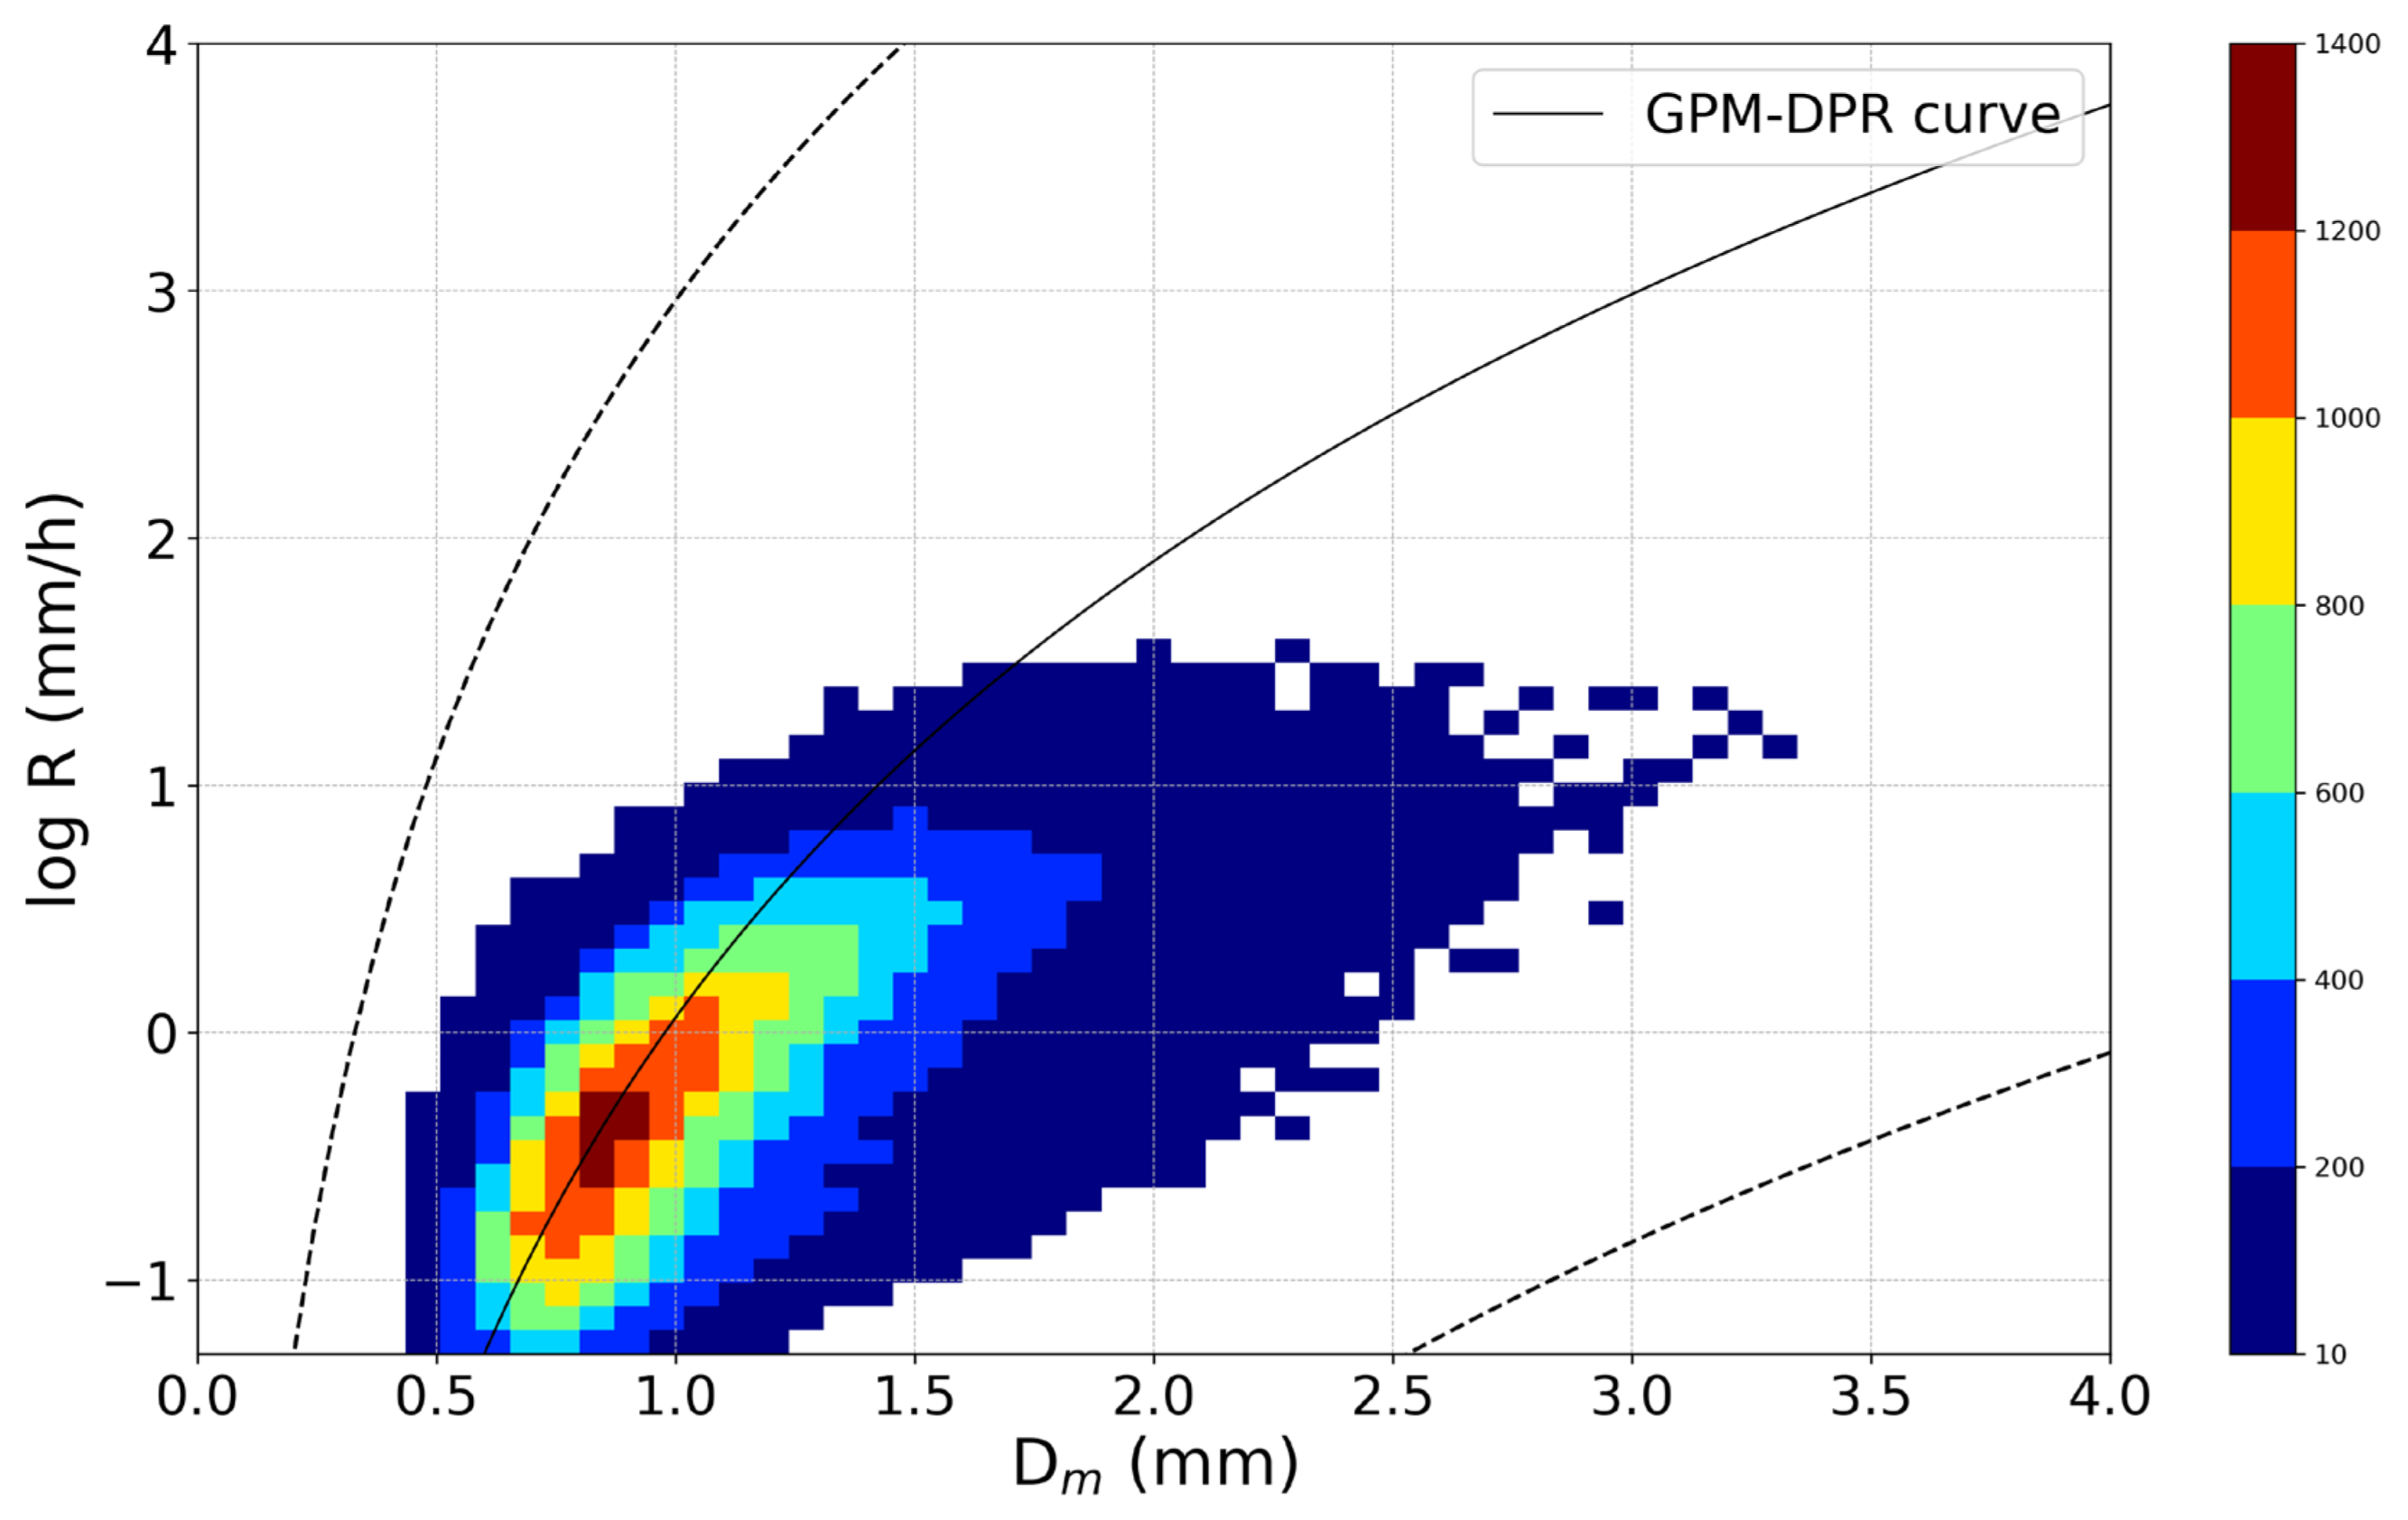

Table 1.
Validation studies of GPM DPR products using disdrometers.
| DPR Version |
Disdrometer Type |
Variables Studied* |
Region, Country |
Reference |
|---|---|---|---|---|
| - | OTT Parsivel2 | RR, Nw, Dm, Z, k | Iowa, USA | Liao et al., (2014) [9] |
| V03 | RD-80 | RR, Nw, Dm, Z, k | Gadanki, India | Radhakrishna et al., (2016) [10] |
| V05 | 2DVD | RR, DSD, Z | Italian Peninsula | D’Adderio et al. , (2019) [11] |
| V06 | OTT Parsivel2 | RR, Nw, Dm, Z, µ | Jianghuai, China | Wu et al., (2019) [12] |
| V06 | 2DVD | RR, Dm | USA | Chase et al., (2020) [13] |
| V06 | OTT Parsivel2 | RR, Nw, Dm, Z, k | Central Andes, Peru | Del Castillo-Velarde et al. , (2021)[14] |
| V06 | Thies, OTT Parsivel2 | RR, Nw, Dm, Z | Italian Peninsula | Adirosi et al., (2021) [15] |
| V07 | Joss–Waldvogel | RR, Nw, Dm, Z | North Taiwan, Taiwan | Seela et al., (2023) [8] |
*Variables considered are Rain rate (RR), Mass weighted mean drop diameter (Dm), Intercept parameter (Nw), Shape parameter (µ) , Radar Reflectivity (Z), Specific attenuation (k).
Table 2.
Information about the disdrometers used in the present study.
| Disdrometer Type |
Disdrometer Site |
Label (Subregions) |
Lon (°E) | Lat (°N) |
Height (m) | Start Date |
End Date |
Valid Data (min) |
|---|---|---|---|---|---|---|---|---|
| Parsivel1 | Barcelona University | C01 (Coast) | 2.11 | 41.38 | 79 | 01-01-2015 | 01-02-2024 | 51679 |
| Parsivel2 | Fabra Observatory | C02 (Coast) | 2.12 | 41.42 | 411 | 26-07-2022 | 13-02-2024 | 12537 |
| Parsivel1,2 | Das | M01 (Mountain) | 1.87 | 42.39 | 1097 | 09-12-2016 | 08-02-2024 | 59388 |
| Parsivel2 | Tarrega | P01 (Plain) | 1.16 | 41.67 | 427 | 04-05-2021 | 14-06-2022 | 10218 |
| Parsivel2 | Mollerussa | P02 (Plain) | 0.87 | 41.62 | 247 | 27-04-2021 | 05-12-2022 | 12855 |
| Parsivel2 | Tordera | P03 (Plain) | 1.22 | 41.68 | 388 | 30-04-2021 | 14-06-2022 | 12035 |
| Parsivel2 | Cendrosa | P04 (Plain) | 0.93 | 41.69 | 239 | 09-04-2021 | 12-10-2021 | 3616 |
Table 3.
List of verification metrics used to evaluate DPR products.
| Name | Formula | Perfect Score |
|---|---|---|
| Correlation Coefficient (CC) | 1 | |
| Normalized Mean Bias (NBias) | 0 | |
| Normalized Mean Absolute Error (MAE) | 0 | |
| Normalized Root Mean Square Error (RMSE) | 0 | |
| Accuracy | 1 | |
| Precision | 1 | |
| Recall | 1 |
Si is the value of satellite precipitation estimates for the ith event, Oi is the value of disdrometer observation for the ith event, n is the number of observed records. and are the mean of satellite and observations respectively. The values of TP and FP are based on the confusion matrix (Table 4).
Table 4.
Confusion Matrix for multi-class classification (3 x 3).
| Observed Class | |||||
|---|---|---|---|---|---|
| A | B | C | Total | ||
| Predicted Class | A | TPA | FBA | FCA | TPA+ FBA+ FCA |
| B | FAB | TPB | FCB | FAB+TPB+FCB | |
| C | FAC | FBC | TPC | FAC +FBC +TPC | |
| Total | TPA+ FAB+ FAC | FBA +TPB +FBC | FCA +FCB +TPC | All classifications | |
Table 5.
Statistics of the different rainfall and DSD parameters for each single dataset, three similar orographic and climatic regions, and all datasets together from the disdrometers.
Table 5.
Statistics of the different rainfall and DSD parameters for each single dataset, three similar orographic and climatic regions, and all datasets together from the disdrometers.
| Dataset | ZKa (dBZ) | ZKu (dBZ) | R (mm/h) | Nw (dB) | Dm (mm) | ||||||
|---|---|---|---|---|---|---|---|---|---|---|---|
| N | Median | Max | Median | Max | Median | Max | Median | Max | Median | Max | |
| C01 | 51679 | 24.77 | 47.27 | 24.92 | 51.86 | 0.89 | 60.83 | 33.75 | 51.61 | 1.19 | 6.28 |
| C02 | 12537 | 22.79 | 52.40 | 22.68 | 55.83 | 0.77 | 183.27 | 35.23 | 53.06 | 1.04 | 4.40 |
| M01 | 59388 | 21.13 | 49.74 | 20.92 | 54.88 | 0.60 | 107.70 | 36.16 | 52.04 | 0.96 | 7.86 |
| P01 | 10218 | 20.30 | 47.83 | 20.04 | 52.47 | 0.48 | 74.61 | 34.77 | 50.17 | 0.98 | 3.85 |
| P02 | 12855 | 21.49 | 50.26 | 21.38 | 53.97 | 0.54 | 115.74 | 34.09 | 49.98 | 1.06 | 4.91 |
| P03 | 12035 | 21.04 | 50.16 | 20.79 | 53.76 | 0.56 | 114.86 | 35.27 | 50.00 | 1.00 | 7.59 |
| P04 | 3616 | 21.56 | 50.71 | 21.44 | 55.20 | 0.54 | 132.65 | 34.75 | 50.88 | 1.04 | 4.75 |
| Coast | 64216 | 24.39 | 52.40 | 24.48 | 55.83 | 0.87 | 183.27 | 34.02 | 53.06 | 1.17 | 6.28 |
| Mountain | 59388 | 21.13 | 49.74 | 20.92 | 54.88 | 0.60 | 107.70 | 36.16 | 52.04 | 0.96 | 7.86 |
| Plain | 38724 | 21.02 | 50.71 | 20.82 | 55.20 | 0.53 | 132.65 | 34.73 | 50.88 | 1.01 | 7.59 |
| All | 162328 | 22.32 | 52.40 | 22.21 | 55.83 | 0.67 | 183.27 | 34.96 | 53.06 | 1.05 | 7.86 |
Table 6.
Same as Table 4, but with dual-frequency DPR data. Note that the number of Ka-band reflectivity data is different from other variables because only the Ka inner swath was available.
Table 6.
Same as Table 4, but with dual-frequency DPR data. Note that the number of Ka-band reflectivity data is different from other variables because only the Ka inner swath was available.
| Dataset | ZKa (dBZ) | ZKu (dBZ) | R (mm/h) | Nw (dB) | Dm (mm) | |||||||
|---|---|---|---|---|---|---|---|---|---|---|---|---|
| N | Median | Max | N | Median | Max | Median | Max | Median | Max | Median | Max | |
| C01 | 291 | 25.10 | 45.70 | 351 | 24.46 | 51.13 | 0.96 | 57.07 | 33.19 | 51.29 | 1.19 | 3.00 |
| C02 | 312 | 25.00 | 42.34 | 376 | 24.24 | 51.13 | 0.90 | 36.33 | 33.24 | 51.29 | 1.18 | 4.45 |
| M01 | 360 | 23.47 | 37.54 | 423 | 23.25 | 46.34 | 0.78 | 18.49 | 33.04 | 50.65 | 1.16 | 3.00 |
| P01 | 262 | 23.16 | 41.37 | 304 | 22.38 | 51.05 | 0.68 | 27.75 | 33.11 | 43.93 | 1.12 | 5.00 |
| P02 | 203 | 24.23 | 38.67 | 232 | 23.18 | 44.61 | 0.75 | 11.71 | 33.34 | 41.34 | 1.12 | 3.00 |
| P03 | 269 | 23.63 | 41.37 | 304 | 22.20 | 51.05 | 0.67 | 27.75 | 33.13 | 43.93 | 1.11 | 4.99 |
| P04 | 234 | 23.42 | 37.44 | 273 | 22.38 | 47.42 | 0.68 | 13.18 | 33.34 | 41.51 | 1.11 | 3.56 |
| Coast | 603 | 25.05 | 45.70 | 727 | 24.40 | 51.13 | 0.92 | 57.07 | 33.21 | 51.29 | 1.18 | 4.45 |
| Mountain | 360 | 23.47 | 37.54 | 423 | 23.25 | 46.34 | 0.78 | 18.49 | 33.04 | 50.65 | 1.16 | 3.00 |
| Plain | 968 | 23.55 | 41.37 | 1113 | 22.59 | 51.05 | 0.69 | 27.75 | 33.21 | 43.93 | 1.11 | 5.00 |
| All | 1931 | 23.89 | 45.70 | 2263 | 23.19 | 51.12 | 0.77 | 57.07 | 33.17 | 51.29 | 1.14 | 5.00 |
Table 7.
Percentage (%) of data according to the rainfall regime considering stratiform, convective, ambiguous (between stratiform and convective) and outlier (out of the stratiform and convective classification domain) according to Dolan et al. [45].
Table 7.
Percentage (%) of data according to the rainfall regime considering stratiform, convective, ambiguous (between stratiform and convective) and outlier (out of the stratiform and convective classification domain) according to Dolan et al. [45].
| Stratiform | Convective | Ambiguous | Outlier | |
|---|---|---|---|---|
| Disdrometer | 57 | 28 | 14 | 2 |
| GPM DPR (DF) | 73 | 18 | 8 | 1 |
Table 8.
Percentage (%) of data associated with microphysical precipitation mechanism groups proposed by Doan et al. [45] (see Figure 4b).
| Group 1 | Group 2 | Group 3 | Group 4 | Group 5 | Group 6 | |||
|---|---|---|---|---|---|---|---|---|
| Vapor Deposition |
Weak Convection |
Aggregation/ Riming |
Collision- Coalescence |
Iced Based |
Ambiguous | Outlier | ||
| Disdrometer | 8 | 32 | 4 | 14 | 0 | 1 | 8 | 33 |
| GPM DPR (DF) | 4 | 15 | 0 | 22 | 0 | 2 | 11 | 46 |
Table 9.
Summary of overpasses over disdrometer sites without (Group A) and with (Group B) concurrent disdrometer rainfall data for DPR, Ka and Ku FS modes. Matching methods between GPM observations and disdrometer sites are point, 5 km, 10 km, 9 pixels (Group A) and optimal (GroupB).
Table 9.
Summary of overpasses over disdrometer sites without (Group A) and with (Group B) concurrent disdrometer rainfall data for DPR, Ka and Ku FS modes. Matching methods between GPM observations and disdrometer sites are point, 5 km, 10 km, 9 pixels (Group A) and optimal (GroupB).
| GPM Product | Group A: GPM CO Overpasses with Rain without Necessarily Matching Disdrometer Data |
Group B: GPM CO Overpasses with Rain Matching Disdrometer Data |
||||||
|---|---|---|---|---|---|---|---|---|
| Matching Method | Point | 5 km | 10 km | 9 pixels | Point | Mean 5km | Mean 10 km | Optimal |
| DPR-FS | 142 | 272 | 460 | 567 | 19 | 33 | 39 | 40 |
| Ka-FS | 69 | 157 | 289 | 328 | 12 | 27 | 33 | 34 |
| Ku-FS | 142 | 270 | 463 | 569 | 20 | 34 | 41 | 41 |
Table 10.
Statistics of the comparison between the GPM DF and SF products and disdrometer data for different variables and matching methods. Statistical significance of CC is indicated with an asterisk and was tested with the t-test using a significance level of 0.05. The best and worst statistics obtained for each product, method and variable are marked in green and red respectively.
| Point | Mean 5 km | Mean 10 km | Optimal | ||||||||||||||
|---|---|---|---|---|---|---|---|---|---|---|---|---|---|---|---|---|---|
| NBIAS | NMAE | NRMSE | CC | NBIAS | NMAE | NRMSE | CC | NBIAS | NMAE | NRMSE | CC | NBIAS | NMAE | NRMSE | CC | ||
| R | DF | -46.12 | 0.70 | 1.20 | 0.48* | -39.21 | 0.66 | 1.02 | 0.31 | -16.88 | 0.59 | 0.90 | 0.70* | 0.26 | 0.61 | 1.60 | 0.77* |
| SF | -49.84 | 0.69 | 1.18 | 0.37* | -46.93 | 0.64 | 1.01 | 0.30* | -31.63 | 0.66 | 0.99 | 0.44* | -35.35 | 0.43 | 0.78 | 0.78* | |
| ZKa | DF | -6.07 | 0.19 | 0.27 | 0.61 | -7.55 | 0.17 | 0.22 | 0.61* | -4.68 | 0.18 | 0.23 | 0.66* | -2.58 | 0.09 | 0.14 | 0.88* |
| SF | -13.55 | 0.16 | 0.20 | 0.27 | -11.58 | 0.16 | 0.19 | 0.42* | -7.37 | 0.17 | 0.21 | 0.48* | -2.81 | 0.10 | 0.16 | 0.77* | |
| ZKu | DF | -10.23 | 0.20 | 0.29 | 0.63* | -10.75 | 0.18 | 0.25 | 0.63* | -8.27 | 0.20 | 0.26 | 0.66* | -6.04 | 0.12 | 0.16 | 0.88* |
| SF | -9.23 | 0.20 | 0.29 | 0.63* | -11.53 | 0.18 | 0.27 | 0.64* | -8.12 | 0.20 | 0.25 | 0.65* | -5.37 | 0.10 | 0.16 | 0.88* | |
| Dm | DF | -1.08 | 0.24 | 0.28 | 0.65* | 2.05 | 0.21 | 0.27 | 0.56* | 1.82 | 0.22 | 0.28 | 0.51* | 0.96 | 0.14 | 0.18 | 0.83* |
| SF | -1.68 | 0.23 | 0.27 | 0.67* | 2.82 | 0.23 | 0.32 | 0.38* | 5.30 | 0.23 | 0.34 | 0.33* | 2.99 | 0.14 | 0.19 | 0.83* | |
| Nw | DF | -7.01 | 0.12 | 0.16 | 0.34 | -7.59 | 0.11 | 0.14 | 0.32 | -5.83 | 0.09 | 0.12 | 0.35* | -5.12 | 0.11 | 0.13 | 0.39* |
| SF | -6.77 | 0.12 | 0.15 | 0.34 | -8.61 | 0.12 | 0.15 | 0.16 | -8.36 | 0.12 | 0.15 | -0.01 | 0.29 | 0.12 | 0.14 | 0.19 | |
Table 11.
Confusion matrix between ambiguous, stratiform and convective regimes classified by DPR DF and disdrometer data matched with the optimal approach, listing totals for each regime.
Table 11.
Confusion matrix between ambiguous, stratiform and convective regimes classified by DPR DF and disdrometer data matched with the optimal approach, listing totals for each regime.
| Disdrometer | |||||
|---|---|---|---|---|---|
| Ambiguous | Convective | Stratiform | Total | ||
| DPR DF | Ambiguous | 1 | 0 | 1 | 2 |
| Convective | 2 | 0 | 0 | 2 | |
| Stratiform | 5 | 15 | 17 | 37 | |
| Total | 8 | 15 | 18 | 41 | |
Disclaimer/Publisher’s Note: The statements, opinions and data contained in all publications are solely those of the individual author(s) and contributor(s) and not of MDPI and/or the editor(s). MDPI and/or the editor(s) disclaim responsibility for any injury to people or property resulting from any ideas, methods, instructions or products referred to in the content. |
© 2024 by the authors. Licensee MDPI, Basel, Switzerland. This article is an open access article distributed under the terms and conditions of the Creative Commons Attribution (CC BY) license (http://creativecommons.org/licenses/by/4.0/).
Copyright: This open access article is published under a Creative Commons CC BY 4.0 license, which permit the free download, distribution, and reuse, provided that the author and preprint are cited in any reuse.


