Submitted:
07 June 2024
Posted:
10 June 2024
You are already at the latest version
Abstract
Efficiency serves as a crucial metric in assessing the advancement of scientific research for universities. Reasonable inputs of human resources, finances, materials, and other resources, along with high-quality research output, are important guarantees for the research efficiency of Chinese universities. This study delves into the patterns of changes of research efficiency among universities across the 31 provinces and municipalities of China from 2012 to 2022. By scrutinizing input-output perspectives and utilizing data sourced from the China Statistical Yearbook, the analysis unveils prevailing scenarios of input redundancy and output insufficiency in research efficiency across universities. The static and dynamic trends in research efficiency were further investigated by employing a static non-parametric Data Envelopment Analysis (DEA)-BCC model and a dynamic Malmquist index. Key findings from the analysis from 2012 to 2022 include: (1) notable growth in investments in teaching, research equipment assets, and research and development funds among nationwide universities; (2) a steady increase in the mean value of technical efficiency (TE) from 0.97 to 0.99, indicating continuous enhancement in overall efficiency in research input resource allocation across the provinces; (3) the mean Malmquist productivity index of 1.285, with an average annual increase of 28.5%, signifying a consistent improvement in university research efficiency throughout the study period; and (4) the provinces experiencing varying degrees of input redundancy or output insufficiency were selected to suggest the need for tailored strategies in resource allocation. The study underscores the importance of a holistic evaluation system involving stakeholders from government, universities, and society to optimize research efficiency and promote scientific innovation and social development.
Keywords:
research efficiency
; face validity
; input redundancy
; interprovincial data
; technical efficiency
1. Introduction
Universities in China bear multifaceted responsibilities encompassing talent cultivation, scientific inquiry, societal engagement, cultural preservation, innovation, and international collaboration (Shi et al, 2022; Adhi et al, 2024; Li et al, 2022). The role of universities in fulfilling the national mission must be tangibly realized through knowledge innovation and talent cultivation. Only through these efforts can universities genuinely contribute to driving economic development and social progress in China, as well as in specific regions (Ma, 2021; Yang et al, 2022; Jiang et al, 2022). Universities, as the mainstay of national scientific and technological innovation, are the "leaders" in conducting fundamental and forward-looking research. They are the primary driving force behind the rapid development of local scientific research, technology, and socio-economic progress.
Scientific research is one of the foundations for the high-quality development of higher education in China. It can support the improvement of regional innovation talent cultivation and social service capabilities, thereby achieving the coordinated development of education, economy, and society (Li et al, 2022; Wang et al, 2019). Therefore, against the backdrop of implementing the strategy of coordinated regional development and advancing the strengthening of education in China, accurately quantifying the current status of university research efficiency as a backbone force in scientific research and its regional differences is crucial. Furthermore, based on the research findings, it is important to explore the changing patterns of research efficiency among various types of universities and identify the bottlenecks in efficiency improvement. Suggestions for improvement should be proposed accordingly. This is of great significance for comprehensively enhancing the input-output efficiency of university research in a coordinated manner.
A comprehensive review of both domestic and international literature underscores the thorough examination of university research efficiency. Noteworthy trends in this research domain include:
(1) Research methods: The measurement of university research efficiency has evolved from single-factor to total-factor efficiency, leading to a variety of models and data analysis techniques(Charnes et al,1978;Griliches 1979;Antreas et al, 1997;Abbott 2003). However, most studies use relatively short-term data, typically conducting static analyses of research performance for a particular year, with limited literature on dynamic analysis. Given that university research activities are continuous and dynamic processes, analyzing only a single time point may lead to flawed conclusions. This approach may not adequately reflect the actual changes in the dynamic efficiency of university research over a longer period.
(2) Regional Focus: Existing studies primarily concentrate on subnational regional levels, with limited comparative research among China's 31 provinces and municipalities. Notably absent are systematic investigations into the central and western regions of the country.
(3) Methodological Diversity: Common methods for evaluating higher education efficiency include parametric and non-parametric methods(Charnes et al, 1984;Madriaet al, 2019; Cai et al, 2023;). Evaluation methods for higher education efficiency range from parametric (e.g., Stochastic Frontier Analysis) to non-parametric (e.g., Data Envelopment Analysis, or DEA). The DEA-Malmquist index emerges as a robust approach, facilitating the evaluation of cross-period dynamic production efficiency and changes in total-factor productivity (Charnes et al, 1985).
The parametric approach, primarily the Stochastic Frontier Analysis (SFA), requires the construction of functional models. In domestic research, the econometric models mainly used by researchers to measure the efficiency of higher education through parameter estimation methods are cost functions and production functions. However, using this method to estimate the research efficiency of universities may introduce "selection bias" and "simultaneity bias". The non-parametric approach mainly involves DEA, namely Data Envelopment Analysis. DEA, with its flexible and diverse combination forms, has been widely applied in the field of education. Due to the fact that the DEA method can only assess the relative efficiency of Decision Making Units (DMUs) with multiple inputs and outputs, but cannot address the evaluation of dynamic efficiency over multiple periods, most studies combine it with the Malmquist index method to fill this research gap.
The DEA-Malmquist index combines the DEA model with a time factor, enabling the evaluation of both cross-period dynamic production efficiency and changes in the total-factor productivity of university research efficiency( Zhang et al, 2015;Zhou, et al, 2022; Zhang,et al., 2023). This approach has several advantages, including the lack of restrictions on the dimensions of input and output variables, avoidance of subjective influences, and suitability for production units with complex input-output relationships. As a result, it has garnered significant attention and recognition.
The DEA-Malmquist model has been employed to analyze the regional technological resource performance and its changes in "Double High" construction colleges from 2019 to 2021 (Liu et al., 2023). Zhu utilized the DEA-Malmquist DEA model and Malmquist index to analyze the dynamic changes in sustainable development capabilities among 31 provinces, municipalities, and autonomous regions in eastern, central, and western China from 2009 to 2015 (Zhu et al., 2018). Zhou combined the DEA-BCC method with the Malmquist index to assess the efficiency of technological innovation in 41 top universities from 2010 to 2017 (Zhou et al., 2022). Zhu utilized the Malmquist index method based on the DEA model to analyze the dynamic changes in the sustainable development capacity of 31 provinces, municipalities, and autonomous regions in eastern, central, and western China from 2009 to 2015 (Zhu et al., 2018).
In summary, existing literature on university research efficiency has matured significantly, both in terms of evaluation methods and indicator systems (Bhutto et al, 2012; Madria et al, 2019; Nabil et al, 2020). Compared to analyses conducted from static or dynamic single perspectives, this paper building upon this scholarly foundation, this paper advocates for a comprehensive analysis of Chinese university research efficiency using a combination of the DEA-BCC model and dynamic Malmquist index. By leveraging panel data from 2012 to 2022 sourced from authoritative institutions such as the National Bureau of Statistics and the Ministry of Education, this study aims to longitudinally and cross-sectionally elucidate the dynamic efficiency of university research across China. Its findings will illuminate patterns of efficiency variation among diverse university types, identify efficiency bottlenecks, and proffer targeted recommendations for improvement (Qi, 2023). This endeavor holds significant promise for enhancing the service capacity of Chinese higher education in driving economic and social development while fostering sustainable regional coordination and growth (Liu et al, 2023).
2. Materials and Methods
2.1. The Construction of the Indicator System
Surface validity is a primary goal when constructing an indicator system. Therefore, the evaluation system for research efficiency in Chinese universities must reflect the actual situation of higher education in China and the broader social context. The indicator system is designed from an input-output perspective, considering data continuity and availability, while ensuring scientific rigor. The system adheres to principles of adaptability to social development, scientific rigor, guidance, representativeness, and objectivity, drawing on mature experiences from related studies (Song et al, 2022; Wang et al, 2023).
The main selected research indicators for evaluating research efficiency are as follows (Dagum, 1997; Valero, 2019; Nabil et al, 2020; Liu et al, 2022): (1) research inputs, including university R&D personnel, university R&D funds, and full-time equivalent of university R&D personnel. (2) research outputs, which comprises domestic and international aspects. Domestic research output encompasses both economic and social benefits and includes indicators such as the number of university R&D projects, income from patent ownership transfer and licensing, and the establishment of national or industry standards. Foreign research output indicators consist of the number of scientific papers published in international journals and the inclusion of Chinese scientific papers in major international databases (SCI, EI, CPCI-S).

Table 1.
Indicator System for Evaluating Research Efficiency in China.
| Primary Indicators | Secondary Indicators | Tertiary Indicators | Unit | Attribute |
|---|---|---|---|---|
| Research Inputs(A1) | Personnel(B1) | Proportion of Faculty with Doctoral Degrees(C1) | % | + |
| Number of Full Professors among Full-time Faculty(C2) | Person | + | ||
| University R&D Personnel(C3) | Person | + | ||
| Financial Resources(B2) | University R&D Funding(C4) | Ten Thousand Yuan | + | |
| Assets of Teaching and Research Instruments and Equipment(C5) | Ten Thousand Yuan | + | ||
| Time(B3) | Full-time Equivalent of University R&D Personnel(C6) | Person-Year | + | |
| Research Output(A2) | Domestic Research Output(B4) | Publication of Scientific Papers(C7) | Articles | + |
| Publication of Technological Works(C8) | Projects | + | ||
| Number of Patent Applications(C9) | Projects | + | ||
| Income from Patent Ownership Transfer and Licensing(C10) | Articles | + | ||
| Number of R&D Projects in Higher Education Institutions(C11) | Categories | + | ||
| Establishing national or industry standard figures.(C12) | Categories | + | ||
| International Research Output(B5) | Number of Scientific Papers Published Abroad(C13) | Articles | + | |
| Inclusion of Chinese Scientific Papers (SCI) in Major Foreign Indexing Tools(C14) | Articles | + | ||
| Inclusion of Chinese Scientific Papers in Major Foreign Indexing Tools (EI)(C15) | Articles | + | ||
| Inclusion of Chinese Scientific Papers in Major Foreign Indexing Tools (CPCI-S)(C16) | Articles | + |
2.2. Data
The required data primarily comes from authoritative sources such as the "China Statistical Yearbook", "China Education Statistical Yearbook", "China Education Funding Statistical Yearbook", "China Science and Technology Statistical Yearbook", National Bureau of Statistics, Ministry of Education statistical data, and other credible sources. These sources cover the period from 2012 to 2022 and provide high levels of objectivity, reliability, and scientific rigor.
2.3. Model
2.3.1. BCC-DEA Model
Classic DEA models mainly include CCR, BCC, FG, and ST, among others. The CCR (Charnes, Cooper, and Rhodes) model assumes constant returns to scale (CRS) and measures the overall efficiency of Decision Making Units (DMUs). In contrast, the BCC (Banker, Charnes, and Cooper) model is an extension of the CCR model, accommodating variable returns to scale (VRS).
The BCC model can be further divided into Input (I) and Output (O) models: (1) The Input model assumes constant outputs and focuses on how to adjust inputs to achieve efficiency. (2)The Output model assumes constant inputs and focuses on improving and increasing outputs.
The model used in this article is the BCC (O) model, which emphasizes improving and increasing outputs while holding inputs constant. This approach is particularly suitable for evaluating research efficiency in universities, where enhancing the quality and quantity of research outputs is often a primary objective.
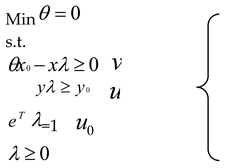
BCC Model and Its Properties: Envelopment Form
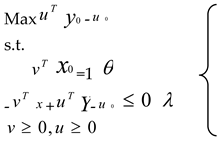
BCC Model and Its Properties: Dual Form
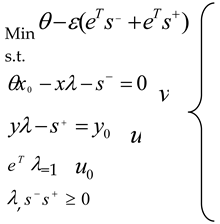
Introducing non-Archimedean factors, the BCC model can be formulated in its envelopment form:
Its dual form
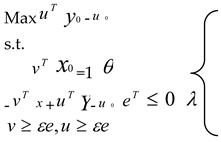
In the formula, , represent the input and output indicators of the evaluated unit respectively; denotes the unit combination coefficient; stands for the non-Archimedean infinitesimal, typically assumed to be a very small positive number, such as 10-6, in practical applications. In the formula, represents the unit row vector, denotes the slack (redundant) variables, and stands for the efficiency evaluation index. If =1, and and , then DMU0 is BCC efficient; otherwise, DMU0 is BCC inefficient.
2.3.2. Malmquist-DEA Model
The Malmquist index, based on panel data analysis, facilitates dynamic assessment by comparing efficiency between a given period and the previous period or base period. Its results provide a dynamic comparison of input-output efficiency between the current period and the previous one.
refers to the distance function for period t, and refers to the distance function for period t+1, where x represents inputs and outputs. When M0>1, it indicates efficiency growth, and when M0<1, it indicates efficiency decline.
2.3.3. Calculation of Redundancy Ratio
The calculation of redundancy ratio, based on the BCC-DEA model, enables the study of input redundancy for DMUs.
represents the input redundancy ratio, denotes the redundancy amount of the m-th input for the i-th DMU, and Xmi indicates the m-th input quantity for the i-th DMU.
3. Results
3.1. Statistical Analysis
In recent years, the country has significantly increased its investment in research resources for universities. The number of R&D personnel in universities has risen from 632,000 in 2012 to 1,408,000 in 2022. R&D funding has also seen substantial growth, rising from 6.888 billion yuan in 2012 to 21.805 billion yuan in 2022. Moreover, The full-time equivalent of R&D personnel has expanded from 299,000 person-years in 2012 to 672,000 person-years in 2022. Additionally, there has been a notable increase in the proportion of teachers with doctoral degrees in the full-time faculty, climbing from 16.33% in 2012 to 28.98% in 2022. Concurrently, there has been remarkable growth in research output, with the number of R&D projects rising from 604,107 in 2012 to 1,436,251 in 2022, and the number of scientific papers published increasing from 1,109,965 in 2012 to 1,577,932 in 2022.
To illustrate the disparities in research efficiency among provinces, changes in six input indicators and ten output indicators of national university research and innovation from 2012 to 2022, with 2012 as the base year (set to 1), were analyzed (Figure 1 and Figure 2).
It is evident that all six indicators of research input for nationwide universities have displayed an upward trajectory from 2012 to 2022. Notably, investment in teaching, research equipment assets, and R&D funding have experienced the most pronounced growth. Furthermore, among the ten indicators of research output, there is a blend of varying growth rates. Particularly, the indicators related to "establishment of national or industry standards" and "revenue from patent ownership transfer and licensing" have exhibited the swiftest growth, albeit with fluctuations, whereas the remaining eight indicators have shown consistent growth patterns.
3.2. Outcomes of BCC-DEA Model
The outcomes derived from the BCC-DEA model primarily encompass four metrics: Technical Efficiency (TE), Pure Technical Efficiency (PTE), Scale Efficiency (SE), and Scale Returns. TE, also referred to as Overall Efficiency (OE), assesses the comprehensive efficiency of resource allocation and utilization across Decision-Making Units (DMUs), such as research resources in Chinese universities, including personnel and finances. TE is computed as the product of PTE and SE. Scale Returns are classified into three categories: decreasing, constant, and increasing returns to scale.
3.2.1. The Overall Change in Research Efficiency of Universities in China from 2012 to 2022
Based on the BCC-DEA results presented in Table 2: (1) TE Improvement: The average TE of research in universities across 31 provinces increased from 0.97 to 0.99 between 2012 and 2022. This indicates an enhancement in the efficiency of research input resource allocation across the 31 provinces and cities. (2) PTE Fluctuations: The PTE of research input-output in universities across 31 provinces showed fluctuations but generally increased. In the years 2014, 2017, 2018, 2020, and 2022, the PTE reached 1 in 29 provinces, indicating optimal research input-output PTE during those years. (3) SE Improvement: Although SE values fluctuated, they gradually increased over time. In 2021 and 2022, SE values in 28 provinces reached 1, indicating optimal scale efficiency. (4) Scale Returns Variations: The number of provinces with increasing scale returns fluctuated, decreasing from 7 in 2012 to 3 in 2022. The average number of provinces with constant scale returns throughout the period was 26.
These findings suggest an overall improvement in research efficiency and resource allocation in universities across the provinces of China from 2012 to 2022, with fluctuations observed in certain indicators over the years.
3.2.2. Research Technical (Overall) Efficiency Values
The average Research Technical (Overall) Efficiency is 0.980. The 31 provinces and cities are categorized into high-efficiency, medium-efficiency, and low-efficiency regions.
High-efficiency regions (average = 1), reaching the production frontier: 16 provinces and cities, including Fujian, Beijing, Shanghai, Jiangsu, Zhejiang, Shandong, Hunan, Guangdong, Guangxi, Hainan, Guizhou, Yunnan, Shaanxi, Gansu, Qinghai, and Xinjiang.
Medium-efficiency regions (1 > average > 0.98): 5 provinces and cities, including Henan, Ningxia, Anhui, Chongqing, and Hubei.
Low-efficiency regions (average < 0.98): Jilin, Jiangxi, Tianjin, Liaoning, Hebei, Tibet, Shanxi, Sichuan, Heilongjiang, and Inner Mongolia, totaling 10 provinces. Heilongjiang and Inner Mongolia have the lowest efficiency, with averages below 0.90.
3.2.3. Each Indicators of Research Efficiency
Based on Table 2 and Table 3: (1) The average TE increased from 0.97 to 0.99. TE was highest in 29 provinces and cities, indicating a continuous improvement in research input resource allocation efficiency. (2) PTE fluctuated but generally increased. In 2014, 2017, 2018, 2020, and 2022, PTE reached 1 in 29 provinces, indicating optimal research input-output PTE. (3) SE values reached 1 in 28 provinces and cities in 2021 and 2022, indicating optimal scale efficiency. (4) Scale Returns: Provinces with increasing scale returns fluctuated, decreasing from 7 in 2012 to 3 in 2022.The average number of provinces and cities with constant scale returns throughout the period was 26.
These indicators reflect improvements in research efficiency and resource allocation across ordinary colleges and universities in China from 2012 to 2022, with fluctuations observed in certain indicators over the years.
3.3. Results of Malmquist Index
The dynamic changes and heterogeneity of Malmquist productivity and its decomposition was obtained by DEAP2.1 software.
- (1)
- Overall efficiency change analysis: Table 4 and Table 5 reveal that from 2012 to 2022, the research efficiency of ordinary colleges and universities across the 31 provinces and cities of China experienced a fluctuating but upward trend. The mean value of research efficiency Malmquist productivity was 1.285, with an average annual increase of 28.5%. Moreover, the Malmquist productivity index for each year during the study period was greater than 1, indicating a steady rise in research efficiency.
Breaking down the analysis, technical efficiency increased by 1.1%, while technological progress increased by an average of 27.1%. This indicates that technological progress played a primary driving role in improving research efficiency, although there is still considerable room for improvement in technical efficiency. Looking at individual years, the technical efficiency for the periods 2015-2016 and 2017-2018 was 0.997 and 0.996 respectively, with technological progress indices of 1.048 and 1.490, highlighting the significant contribution of technological progress in enhancing research efficiency during these periods. Pure technical efficiency was below 1 only in the periods 2015-2016 and 2021-2022, to some extent restraining the improvement in research efficiency during these timeframes. For other years, pure technical efficiency was above 1.
(2) Comparison of research efficiency changes across the 31 provinces and cities of China from 2012 to 2022: Only three provinces and cities, namely Heilongjiang, Hainan, and Ningxia, had Malmquist productivity indices below 1, while the remaining 28 provinces and cities had research efficiency indices above 1. This indicates that over the years, the overall research efficiency of ordinary colleges and universities across the 31 provinces and cities of China has continuously improved, showing a favorable development trend.
Analyzing the growth drivers, in terms of technical efficiency and technological progress, only Tianjin, Jilin, Heilongjiang, Hubei, and Chongqing had technical efficiency values below 1, while the technical efficiency values of the other 26 provinces and cities were above 1. Heilongjiang's Malmquist productivity index was 0.870, decomposed into technical efficiency 0.804, technological progress 1.082, pure technical efficiency 0.835, and scale efficiency 0.983, indicating that the improvement in research efficiency in Heilongjiang was mainly due to technological progress. The Malmquist productivity indices of Hainan and Ningxia were 0.990 and 0.848, respectively, with technical efficiency, pure technical efficiency, and scale efficiency indices all equal to 1, and technological progress indices of 0.990 and 0.848, respectively, indicating that the improvement in research efficiency in Hainan and Ningxia was primarily constrained by technological progress.
4. Discussion
Based on the results of redundant input and insufficient output variables for research investment, only eight provinces and cities, namely Tianjin, Hebei, Shanxi, Inner Mongolia, Jilin, Heilongjiang, Hubei, and Ningxia, experienced varying degrees of input redundancy or output insufficiency.
Table 7.
Redundancy Amount and Ratio of Research Input in 8 Provinces and Municipalities of China from 2012 to 2022.
Table 7.
Redundancy Amount and Ratio of Research Input in 8 Provinces and Municipalities of China from 2012 to 2022.
| provinces | C1 | C2 | C3 | C4 | C5 | C6 | C1 | C2 | C3 | C4 | C5 | C6 |
|---|---|---|---|---|---|---|---|---|---|---|---|---|
| Redundant investment amount | redundant investment ratio | |||||||||||
| Tianjin | 10.895 | 124.427 | 0.000 | 202130.830 | 0.000 | 2.219 | 31.459 | 2.621 | 0.000 | 43.522 | 0.000 | 0.028 |
| Hebei | 0.000 | 3599.567 | 846.539 | 11132.614 | 164086.840 | 567.348 | 0.000 | 36.071 | 8.988 | 16.008 | 11.804 | 9.041 |
| Shanxi | 0.000 | 0.000 | 2691.679 | 0.000 | 255016.610 | 1795.386 | 0.000 | 0.000 | 38.657 | 0.000 | 31.598 | 38.685 |
| Inner Mongolia | 0.272 | 426.756 | 312.241 | 0.000 | 251287.300 | 207.908 | 2.188 | 15.535 | 8.476 | 0.000 | 35.088 | 8.472 |
| Jilin | 5.294 | 346.041 | 8944.117 | 0.000 | 0.000 | 5961.572 | 22.528 | 5.448 | 50.180 | 0.000 | 0.000 | 50.186 |
| Heilongjiang | 0.000 | 613.122 | 4514.738 | 67646.649 | 0.000 | 3008.593 | 0.000 | 8.134 | 24.771 | 19.504 | 0.000 | 24.770 |
| Hubei | 0.000 | 1226.526 | 0.000 | 30252.130 | 0.000 | 0.397 | 0.000 | 11.196 | 0.000 | 6.823 | 0.000 | 0.004 |
| Ningxia | 2.198 | 621.337 | 0.371 | 0.000 | 2688.096 | 0.000 | 16.314 | 45.586 | 0.025 | 0.000 | 1.275 | 0000 |
| Mean | 2.332 | 869.722 | 2163.711 | 38895.278 | 84134.856 | 1442.928 | 9.061 | 15.574 | 16.387 | 10.732 | 9.971 | 16.398 |
From the average proportions of redundant input variables in the eight provinces and cities in China, the indicator "Proportion of doctoral degree teachers in the full-time teaching staff" had the lowest redundant total amount, at 2.332%, and the lowest relative redundancy proportion, at 9.061%. Conversely, the redundant total amounts for the indicators "R&D personnel full-time equivalent" and "School R&D personnel" were the highest, at 1442.928 person-years and 2163.711 persons, respectively, with relative redundancy proportions reaching 16.398% and 16.387%, respectively.
In terms of provinces, Tianjin, Jilin, and Ningxia had the largest redundant amounts for the indicator "Proportion of doctoral degree teachers in the full-time teaching staff", at 10.895%, 5.294%, and 2.198%, respectively, with redundancy proportions reaching 31.459%, 22.528%, and 16.314%, respectively.
Looking at the total redundant amounts of input variables in the eight provinces, "Investment in teaching and research equipment assets" had the highest absolute redundant value, at 84134.856 million yuan, followed by "School R&D funds," with an average redundancy value of 38895.278 million yuan.
In terms of provinces, Shanxi, Inner Mongolia, and Hebei had the highest redundant amounts for the indicator "Investment in teaching and research equipment assets," at 255016.610 million yuan, 251287.302 million yuan, and 164086.841 million yuan, respectively, with redundancy proportions of 31.598%, 35.088%, and 11.804%, respectively. For the indicator "School R&D funds," Tianjin, Heilongjiang, and Hubei had the highest redundant amounts, at 202130.827 million yuan, 67646.649 million yuan, and 30252.130 million yuan, respectively, with redundancy proportions of 43.522%, 19.504%, and 6.823%, respectively.
Table 8.
A Comparison of Research Input-Output Shortage Variables in 8 Provinces and Cities in China from 2012 to 2022.
Table 8.
A Comparison of Research Input-Output Shortage Variables in 8 Provinces and Cities in China from 2012 to 2022.
| Provinces | C7 | C8 | C9 | C10 | C11 | C12 | C13 | C14 | C15 | C16 |
|---|---|---|---|---|---|---|---|---|---|---|
| Tianjin | 1900.27 | 82.93 | 265.04 | 0.00 | 0.00 | 79.87 | 1349.35 | 1068.23 | 0.00 | 0.00 |
| Hebei | 827.01 | 30.12 | 313.58 | 894.47 | 823.18 | 80.63 | 585.75 | 2820.76 | 1565.16 | 0.00 |
| Shanxi | 504.56 | 49.10 | 0.00 | 775.13 | 0.00 | 0.00 | 590.69 | 503.55 | 0.00 | 263.86 |
| Inner Mongolia | 346.02 | 2.37 | 191.60 | 24.61 | 0.00 | 0.00 | 174.50 | 169.13 | 103.30 | 0.00 |
| Jilin | 3890.13 | 287.87 | 940.01 | 1813.62 | 0.00 | 163.47 | 896.70 | 82.56 | 0.00 | 0.00 |
| Heilongjiang | 2679.90 | 105.53 | 921.35 | 1712.15 | 4727.16 | 99.37 | 1330.86 | 800.36 | 0.00 | 0.00 |
| Hubei | 4455.19 | 214.45 | 2028.98 | 2335.00 | 0.00 | 179.07 | 1380.28 | 998.62 | 2634.34 | 0.00 |
| Ningxia | 577.06 | 0.00 | 192.28 | 0.00 | 0.00 | 3.96 | 159.43 | 296.20 | 133.46 | 9.03 |
| Mean | 1897.52 | 96.55 | 606.61 | 944.37 | 693.79 | 75.80 | 808.44 | 842.43 | 554.53 | 34.11 |
Comparing the average values of the insufficient output variables across the eight provinces and cities, the main deficiencies were observed in four indicators: "Number of scientific papers published," "Revenue from patent ownership transfer and licensing," "Number of scientific papers indexed in major foreign databases (SCI)," and "Number of scientific papers published abroad," with values of 1897.517 papers, 944.373 million yuan, 842.425 papers, and 808.443 papers, respectively.
Hubei, Jilin, and Heilongjiang had significant output deficiencies in the indicators "Number of scientific papers published" and "Revenue from patent ownership transfer and licensing," with total amounts of 4455.186 papers and 335.002 million yuan, 3890.130 papers and 1813.622 million yuan, and 2679.902 papers and 1712.146 million yuan, respectively.
Hebei, Tianjin, and Hubei had notable output deficiencies in the indicator "Number of scientific papers indexed in major foreign databases (SCI)," with values of 2820.761 papers, 1068.226 papers, and 998.616 papers, respectively.
Hubei, Tianjin, and Heilongjiang also faced significant output deficiencies in the indicator "Number of scientific papers published abroad," with values of 1380.280 papers, 1349.346 papers, and 1330.861 papers, respectively.
5. Conclusions
Based on the analysis of the input-output efficiency and its influencing factors of ordinary universities in China, the following findings are obtained:
Table 9.
Summary of Static and Dynamic Analysis Results of Research Efficiency in 31 Provinces and Cities in China from 2012 to 2022.
Table 9.
Summary of Static and Dynamic Analysis Results of Research Efficiency in 31 Provinces and Cities in China from 2012 to 2022.
| Results of the BCC-DEA Model Run | Efficiency type | provinces | ||
| Composite Efficiency | Efficient Regions | Mean = 1 | (16 provinces) Fujian, Beijing, Shanghai, Jiangsu, Zhejiang, Shandong, Hunan, Guangdong, Guangxi, Hainan, Guizhou, Yunnan, Shaanxi, Gansu, Qinghai, Xinjiang | |
| Inefficient Regions | 1>Mean >0.98 | (5 provinces) Henan, Ningxia, Anhui, Chongqing, and Hubei | ||
| Mean <0.98 | (10 provinces) Jilin, Jiangxi, Tianjin, Liaoning, Hebei, Tibet, Shanxi, Sichuan, Heilongjiang, and Inner Mongolia | |||
| Pure Technical Efficiency | Efficient Regions | Mean =1 | (2 provinces) Beijing, Liaoning、 | |
| Inefficient Regions | Mean <1 | (9 provinces) Tianjin, Shanxi, Inner Mongolia, Jilin, Heilongjiang, Hubei, Ningxia, Hebei, Chongqing | ||
| Scale Efficiency | Efficient Regions | Constant Returns to Scale | (13 provinces) Beijing, Shanghai, Jiangsu, Zhejiang, Fujian, Hunan, Guangdong, Guangxi, Hainan, Yunnan, Gansu, Qinghai, Xinjiang | |
| Inefficient Regions | Decreasing Returns to Scale | (2 provinces) Hubei, Ningxia | ||
| Increasing Returns to Scale | (16 provinces) Tianjin, Shanxi, Inner Mongolia, Jilin, Heilongjiang, Chongqing, Anhui, Jiangxi, Henan, Sichuan, Shandong, Guizhou, Shaanxi, Hebei, Liaoning, Tibet | |||
| Results of the Malmquist Model | Regions with Balanced Input-Output Ratio | (23 provinces) Beijing, Liaoning, Shanghai, Jiangsu, Zhejiang, Anhui, Fujian, Jiangxi, Shandong, Henan, Hunan, Guangdong, Guangxi, Hainan, Chongqing, Sichuan, Guizhou, Yunnan, Shaanxi, Gansu, Qinghai, Xinjiang, Tibet | ||
| Regions with Input Redundancy | (8 provinces) Tianjin, Hebei, Shanxi, Inner Mongolia, Jilin, Heilongjiang, Hubei, Ningxia | |||
| Regions with Output Shortages | (8 provinces) Tianjin, Hebei, Shanxi, Inner Mongolia, Jilin, Heilongjiang, Hubei, Ningxia | |||
At the national level, from 2012 to 2022, the average technical efficiency (TE) of scientific research in 31 ordinary universities increased from 0.97 to 0.99, with the highest reaching 29 provinces and municipalities. This indicates a continuous improvement in the overall efficiency of scientific research input resource allocation. The overall input-output efficiency of scientific research is good, but some provinces have serious input redundancy and output insufficiency.
Table 10.
Key Points of Evaluation for Different Types of Universities in China in the New Era.
| University Types/Indicators | Talent Cultivation | Scientific Research | Social Services | Cultural Heritage and Innovation | International Cooperation and Exchange | |||||
|---|---|---|---|---|---|---|---|---|---|---|
| Highlight Points | Evaluation Criteria | Highlight Points |
Evaluation Criteria | Highlight Points | Evaluation Criteria | Highlight Points |
Evaluation Criteria | Highlight Points |
Evaluation Criteria | |
| Theoretical Universities | Scientific Thinking | Reflection | Theoretical Innovation | "Fund Projects" and "Papers" | Thought Leadership | Academic Reputation | Seeking Truth |
Scientific Influence | Integration | Collaboration Depth |
| Engineering Universities | Integrated Practice | Design Implementation | Industry Leadership | "Fund Projects" and "Industry Major Projects" | Technical Support | Industry Position | Seeking Practicality | Engineering and Technological Influence | Distinctive Features | Collaboration Projects with Similar Universities |
| Applied Universities | Knowledge Application | Knowledge Mastery | Local Involvement | Lateral Funding |
Technical Services and Promotion Efforts | "Local Reputation" and "Lateral Funding" | Practicality | Popularity Among Graduates | Participation | Exchange |
| Vocational Universities | Technical Skills | Hands-on Practice | University-Enterprise Collaboration | Collaborative Funding | "Corporate Reputation" and "Student Internships" | Craftsmanship | Pursuit of Excellence | Understanding | Whether there's Mutual Learning Mode | |
At the regional level, it is found that there are significant regional differences in the input-output efficiency of scientific research in ordinary Chinese universities. For universities with effective DEA and constant or increasing returns to scale, the focus should be on continuously optimizing the allocation of scientific research resources. The key lies not in simply adding resources such as personnel and funds, but in adjusting the types and quantities of inputs according to the actual situation of each province and municipality, in order to improve the rational allocation and utilization efficiency of existing input resources. However, it is still necessary to continuously improve the efficiency of scientific research resource allocation and the ability to serve economic and social development under the guidance of the national "Fourteenth Five-Year Plan" strategy and the leadership of the Chinese-style modernization. The following are the key recommendations for follow-up:
(1) Further optimize the allocation of scientific research resources, and adjust the types and quantities of inputs according to the actual situation of each region.
(2) Strengthen the rational allocation and utilization efficiency of scientific research resources to ensure that scientific research inputs can be effectively transformed into technological innovation and social progress.
(3) Continuously improve the efficiency of scientific research resource allocation under the guidance of the national "Fourteenth Five-Year Plan" strategy and the leadership of Chinese-style modernization, and enhance the ability to serve economic and social development.
(4) Encourage ordinary universities in various regions to emphasize cooperation, share scientific research resources, and promote technological innovation and industrial development.
(5) Strengthen the monitoring and evaluation of the input-output efficiency of scientific research in universities, promptly identify problems, and take effective measures to address them.
Data Availability Statement
The datasets generated during and/or analysed during the current study are available from the corresponding author on reasonable request.
Acknowledgments
This paper is supported by the14th Five-Year Plan for Education Science of Shaanxi Province (Grant No. SGH23Y2291) and the Soft Science Research of Shaanxi Science and Technology Plan Project in 2021 (Grant No. 2021KRM011).
Conflicts of Interest
The authors declare that they have no known competing fnancial interests or personal relationships that could have appeared to infuence the work reported in this paper.
References
- Abbott, M., & Doucouliagos, C.(2003). The efficiency of Australian universities: a data envelopment analysis. Economics of Education Review, 32(1),89-97. [CrossRef]
- Adhi, I. H., Diana, S., Muhammad, A. I. M., & Kurnia, A.(2024). Efficiency of research in various fields: Evidence from Indonesia. Research Evaluation, 2024, rvae001. [CrossRef]
- Antreas, D. A., & Estelle, S.(1997). Assessing the Comparative Efficiency of Higher Education Institutions in the UK by the Means of Data Envelopment Analysis.Education Economics,5(2),117-134.
- Bhutto, A., Rashdi, P. I., Abro, Q. M.(2012).Indicators for science and technology policy in Pakistan: Entering the science, technology and innovation paradigm. Science and Public Policy,39(1):1-12. [CrossRef]
- Cai, S. F., Zhang, G. Q., &Wang, W.(2023). Evaluation of Innovation Performance of University Knowledge Economic Circles Based on Data Envelopment Analysis. Journal of Tongji University (Natural Science Edition),51(05), 682-686.
- Charnes, A., Clark, C. T. Cooper, W. W. & Golany, B. (1984)..A developmental study of data envelopment analysis in measuring the efficiency of maintenance units in the U.S. air forces. Annals of Operations Research,2(1),95-112. [CrossRef]
- Charnes, A, Cooper, W.W., Golany, B., Seiford, L., & Stutz, J.(1985). Foundations of data envelopment analysis for Pareto-Koopmans efficient empirical production functions. Journal of Econometrics, 30(1-2): 81-107. [CrossRef]
- Charnes, A., Cooper, W.W., & Rhodes, E.(1978). Measuring the efficiency of decision making units. European Journal of Operational Research,,2(6):429-444. [CrossRef]
- Dagum, C.(1997). A new approach to the decomposition of the Gini income inequality ratio. Empirical Economics, 22(4), 515-531. [CrossRef]
- Griliches, Z. (1979). Issues in Assessing the Contribution of Research and Development to Productivity Growth. The Bell Journal of Economics,1979,10(1):92-106. [CrossRef]
- Li, K., & Fan, Y. J. (2022). Evaluation of Research Efficiency of First-Class Universities under the "Double First-Class" Goal. Research Management, 43(09), 41-47. [CrossRef]
- Jiang, H., Yang, Y., & Wang, P. J. (2022). Research on Evaluation of Research Output of Universities Based on DEA and SFA Efficiency Value Method - Taking Analysis of Data from 52 "Double First-Class" Universities as an Example. Modern Education Management, (04), 40-49 . [CrossRef]
- Li, Y., & Zhang, P.(2022). Research on Efficiency of Scientific and Technological Innovation in Production, Learning and Research Based on Network DEA and Shapley Value. Research in Science and Technology Management, 42(05), 93-103.
- Liu, C. B., Dai, W., Yu, L. A., & Yang, J. A.(2022). Research on Prediction of Evaluation of University Scientific Research Platform Based on GCA-DEA-MSVC Method. Chinese Journal of Management Science, 2022,30(03): 240-247. [CrossRef]
- Liu, Z. W., & Liu, H. M.(2023). Research on Enhancing the Performance Evaluation of Regional Scientific and Technological Resources in Universities with "Double High" Construction Schools: Based on the DEA-Malmquist Model. Science and Technology Management Research, 43(09), 82-89.
- Ma, L.(2021) Promoting Differentiated Innovation in the Evaluation of Universities in the New Era. Ethnic Education Research, 32(06), 5-10. [CrossRef]
- Madria, W. F., Miguel, A. S., & Li, R. C.(2019). Quality-Oriented Network DEA Model for the Research Efficiency of Philippine Universities.International Conference on Industrial Engineering and Engineering Management, 596-600. [CrossRef]
- Nabil, A., Mehdi, R., & Norrin, H.(2020).Assessing the research efficiency of Canadian scholars in the management field: Evidence from the DEA and fsQCA. Journal of Business Research,115, 296-306. [CrossRef]
- Qi, T.(2023). Retrospective Study on the Research Efficiency of Various Types of Universities in China during the "Thirteenth Five-Year Plan" Period Based on Data Envelopment Analysis. Research in Science and Technology Management, 43(06), 114-122.
- Song, Z. Y., & Sun, B. C.(2022). Research on Input-Output Efficiency and Its Influencing Factors in Chinese Ordinary Universities: A Stochastic Frontier Analysis Based on Provincial Panel Data from 2009 to 2018. Journal of Lanzhou University (Social Sciences Edition), 50(06),128-137. [CrossRef]
- Valero, A., & Reenen, J. V.(2019). The Economic Impact of Universities: Evidence from Across the Globe.Economics of Education Review,68(1), 53-67. [CrossRef]
- Wang, X. Z., & Jiang, Z. H.(2019). Analysis of Innovation Efficiency and Environment of Universities in China: A Perspective of Value Types. Research Management,,40(10), 25-36. [CrossRef]
- Wang, Z., Lv, N. H., Wu, M. Y. (2023). Evaluation of Research Efficiency of Humanities and Social Sciences in "Double First-Class" Construction Universities Based on Three-Stage DEA. China's Higher Education of Science and Technology, Z1, 26-30. [CrossRef]
- Yang, M., Fei, X. Y., Wei, Y. Q., & Liang L. (2022).Two-Stage DEA Evaluation Method Based on Resource Sharing and Subsystem Interaction - Evaluation of Research Performance of "First-Class Universities" in China. Chinese Journal of Management Science, 30(02), 256-263. [CrossRef]
- Shi, Y. K., Wang, D. C., & Zhang, Z.M. (2022). Categorical Evaluation of Scientific Research Efficiency in Chinese Universities: Basic and Applied Research. Sustainability, 14(8), 4402. [CrossRef]
- Zhang, H. Q., & Shang, T. T.(2015). Comparative Analysis of Research and Innovation Efficiency in Universities: Based on Panel Data from 30 Provinces Nationwide. Research Management, 36(S1),181-186. [CrossRef]
- Zhang, X. M., & Zhao, G. D.(2023). Spatial-Temporal Pattern and Evolution of Efficiency in the Allocation of Graduate Education Resources in China - Supply-Side Analysis Based on Provincial Panel Data from 2003 to 2018. Journal of East China Normal University (Educational Sciences Edition),,41(06), 59-77. [CrossRef]
- Zhou, J. X., & Gao, S. H.(2022). Evaluation of Scientific and Technological Innovation Efficiency in the Construction of First-Class Universities - A Dual Perspective Based on School Types and Regional Differences. China's Higher Education of Science and Technology, (09), 8-15. [CrossRef]
Figure 1.
Research Investment in National Regular Higher Education Institutions from 2012 to 2022.
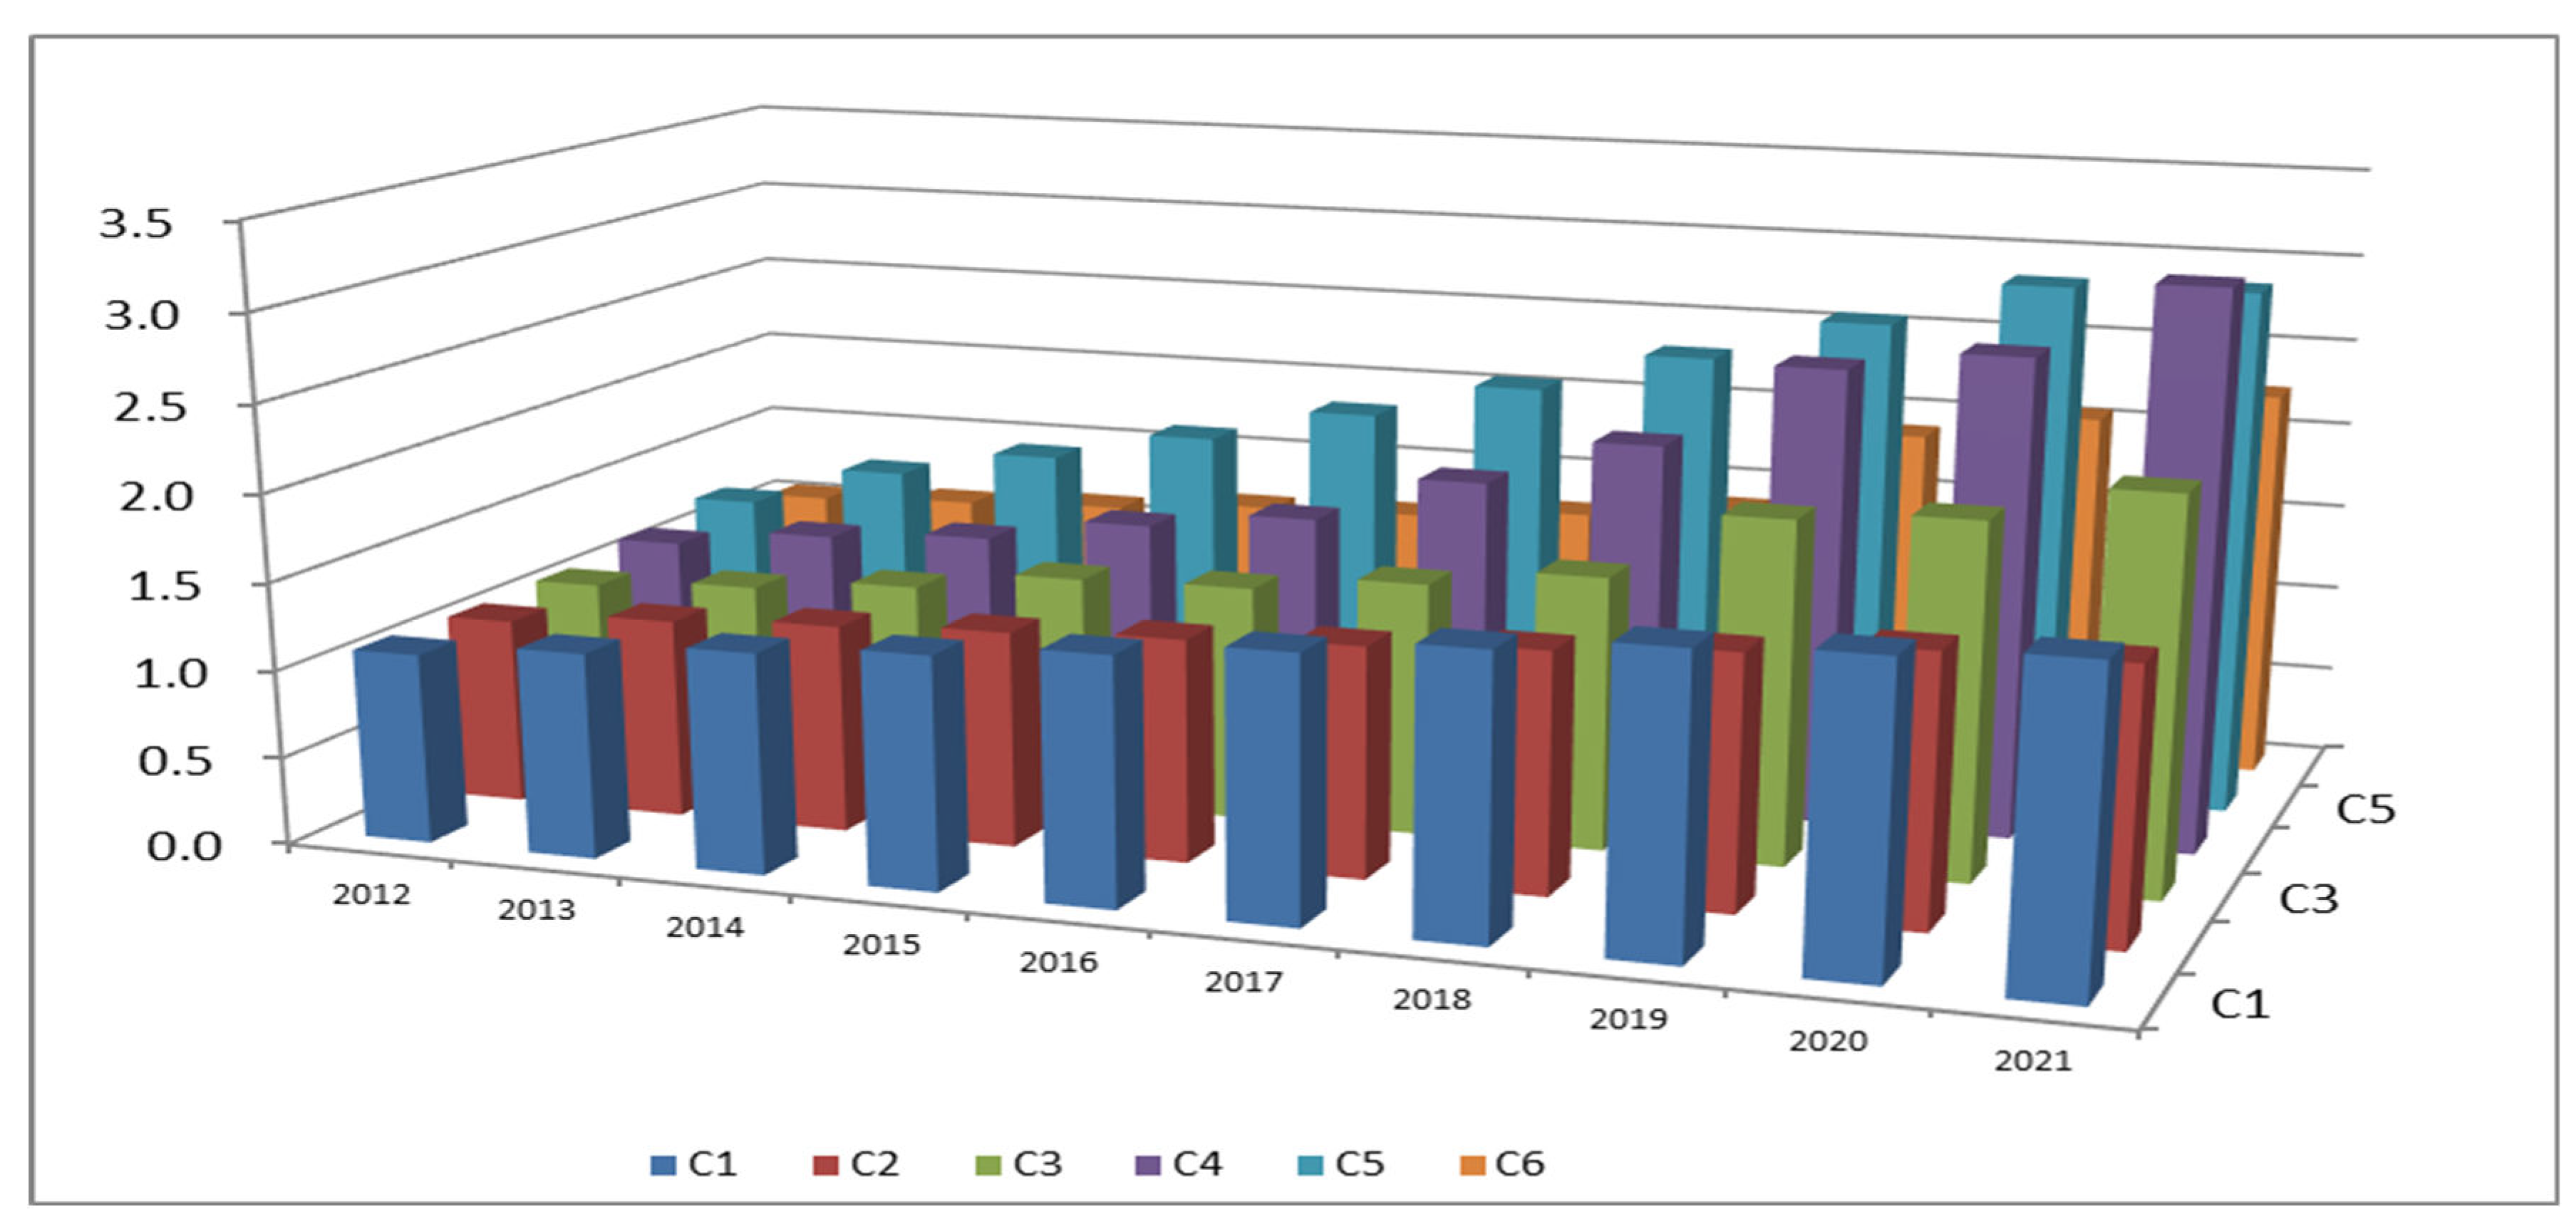
Figure 2.
Research Output in National Regular Higher Education Institutions from 2012 to 2022.
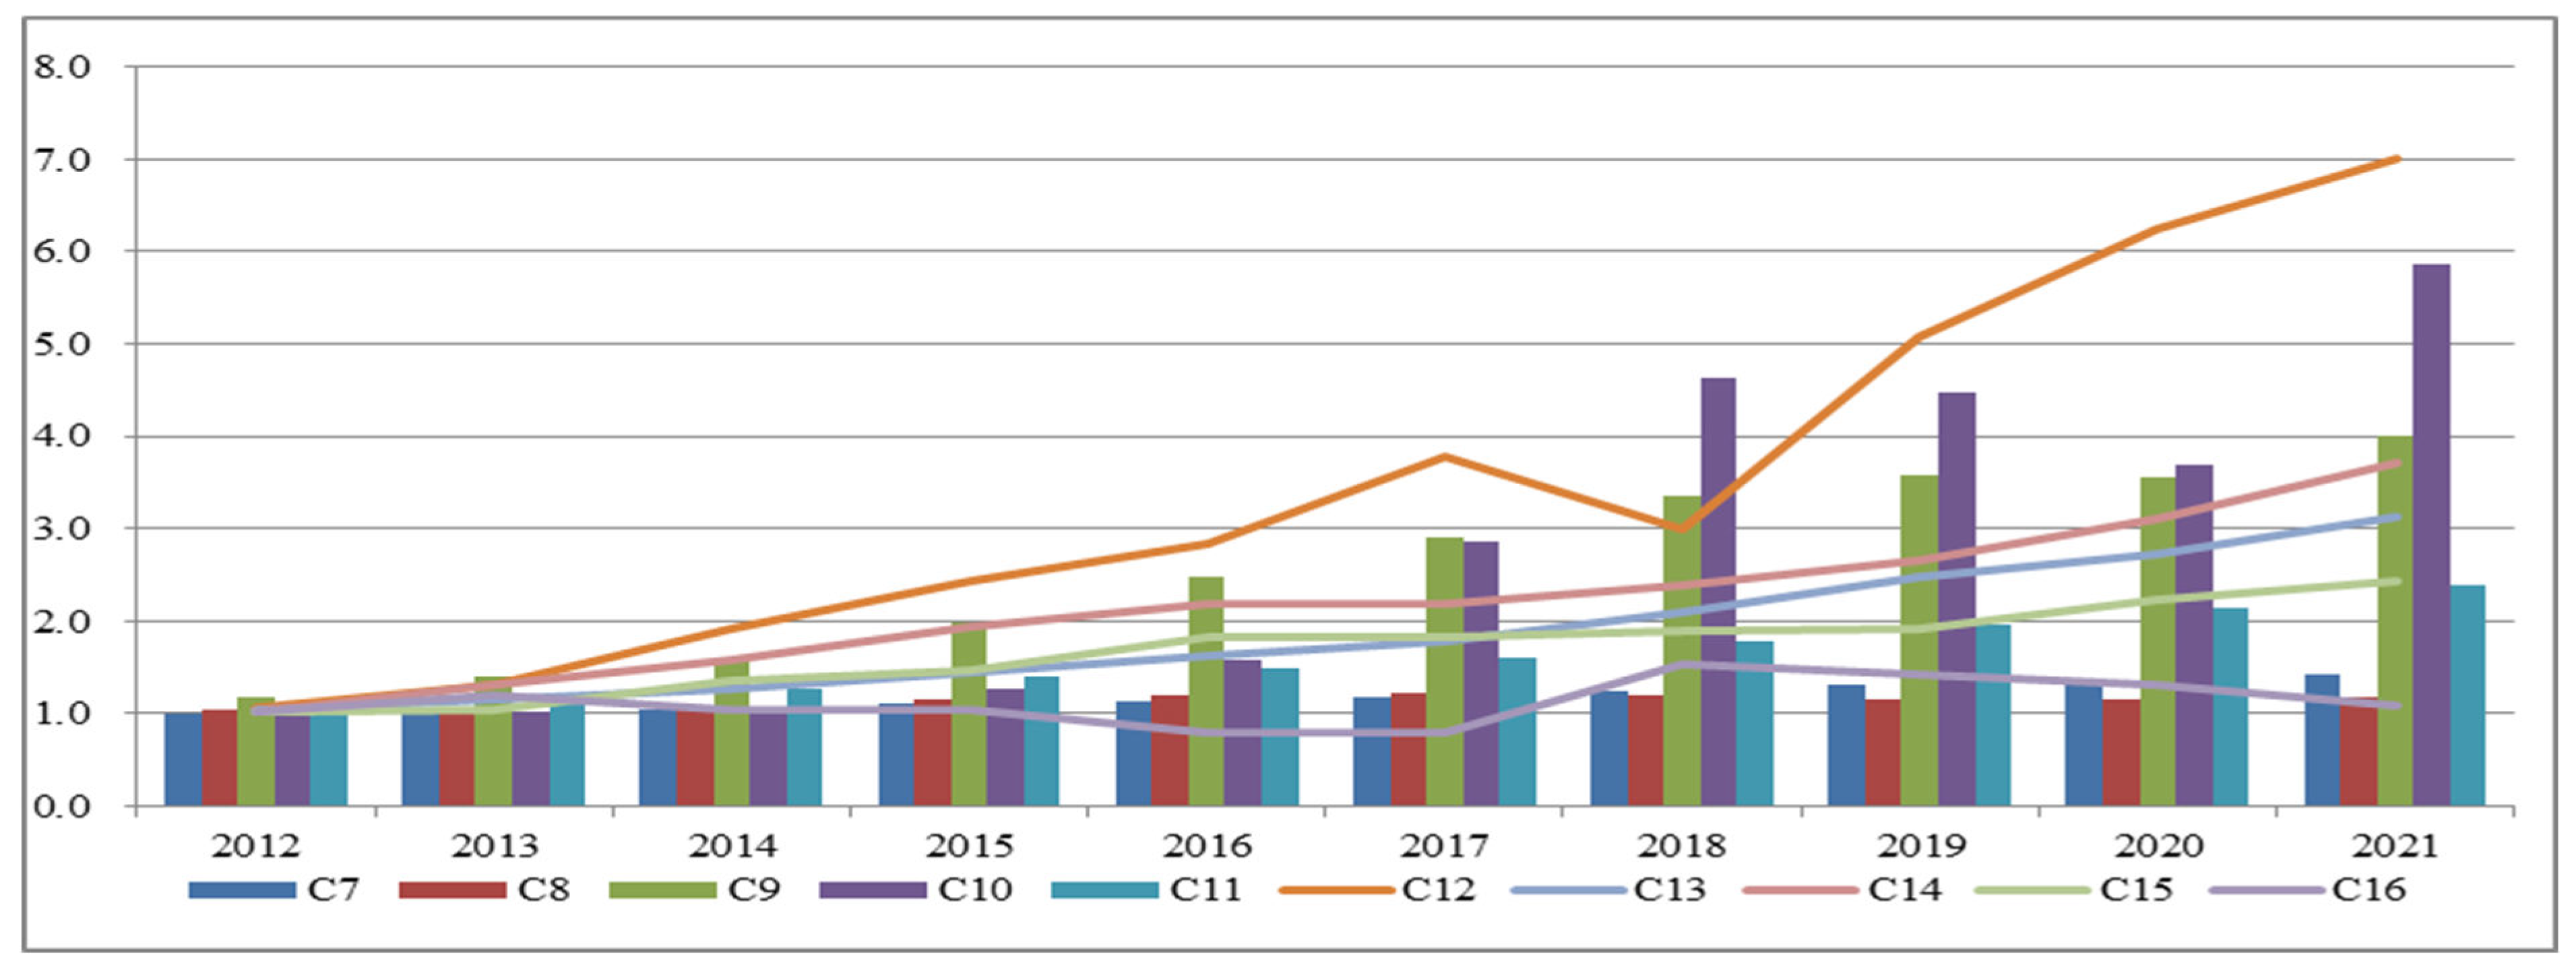
Table 2.
Overall Changes in Research Efficiency of Chinese Regular Higher Education Institutions from 2012 to 2022.
Table 2.
Overall Changes in Research Efficiency of Chinese Regular Higher Education Institutions from 2012 to 2022.
| Type of Efficiency | Mean and Number of Provinces | 2012 | 2013 | 2014 | 2015 | 2016 | 2017 | 2018 | 2019 | 2020 | 2021 | 2022 | Mean |
|---|---|---|---|---|---|---|---|---|---|---|---|---|---|
| Technical Efficiency (TE) | Mean | 0.97 | 0.97 | 0.97 | 0.98 | 0.98 | 0.99 | 0.98 | 0.98 | 0.99 | 0.99 | 0.99 | 0.98 |
| TE=1 | 24.00 | 23.00 | 26.00 | 24.00 | 23.00 | 29.00 | 27.00 | 25.00 | 28.00 | 28.00 | 28.00 | 25.91 | |
| Pure Technical Efficiency (PTE) | Mean | 0.99 | 0.98 | 1.00 | 0.99 | 0.98 | 1.00 | 1.00 | 0.98 | 1.00 | 0.99 | 1.00 | 0.99 |
| PTE=1 | 28.00 | 25.00 | 29.00 | 25.00 | 24.00 | 29.00 | 30.00 | 27.00 | 28.00 | 29.00 | 29.00 | 27.55 | |
| Scale Efficiency (SE) | Mean | 0.97 | 0.99 | 0.97 | 0.99 | 0.99 | 0.99 | 0.98 | 0.99 | 0.99 | 1.00 | 1.00 | 0.99 |
| SE=1 | 24.00 | 23.00 | 26.00 | 24.00 | 23.00 | 29.00 | 27.00 | 25.00 | 28.00 | 28.00 | 28.00 | 25.91 | |
| Scale Returns | Decreasing | 0.00 | 1.00 | 0.00 | 1.00 | 1.00 | 0.00 | 0.00 | 0.00 | 0.00 | 0.00 | 0.00 | 0.27 |
| Constant | 24.00 | 23.00 | 26.00 | 24.00 | 23.00 | 29.00 | 27.00 | 25.00 | 28.00 | 28.00 | 28.00 | 25.91 | |
| Increasing | 7.00 | 7.00 | 5.00 | 6.00 | 7.00 | 2.00 | 4.00 | 6.00 | 3.00 | 3.00 | 3.00 | 4.82 |
Note: Technical Efficiency (TE) = Pure Technical Efficiency (PTE) * Scale Efficiency (SE).
Table 3.
Technical Efficiency Values of Regular Higher Education Institutions' Research in 31 Chinese provinces from 2012 to 2022.
Table 3.
Technical Efficiency Values of Regular Higher Education Institutions' Research in 31 Chinese provinces from 2012 to 2022.
| Provinces | 2012 | 2013 | 2014 | 2015 | 2016 | 2017 | 2018 | 2019 | 2020 | 2021 | 2022 | Mean |
|---|---|---|---|---|---|---|---|---|---|---|---|---|
| Fujian | 1.000 | 1.000 | 1.000 | 1.000 | 1.000 | 1.000 | 1.000 | 1.000 | 1.000 | 1.000 | 1.000 | 1.000 |
| Beijing | 1.000 | 1.000 | 1.000 | 1.000 | 1.000 | 1.000 | 1.000 | 1.000 | 1.000 | 1.000 | 1.000 | 1.000 |
| Shanghai | 1.000 | 1.000 | 1.000 | 1.000 | 1.000 | 1.000 | 1.000 | 1.000 | 1.000 | 1.000 | 1.000 | 1.000 |
| Jiangsu | 1.000 | 1.000 | 1.000 | 1.000 | 1.000 | 1.000 | 1.000 | 1.000 | 1.000 | 1.000 | 1.000 | 1.000 |
| Zhejiang | 1.000 | 1.000 | 1.000 | 1.000 | 1.000 | 1.000 | 1.000 | 1.000 | 1.000 | 1.000 | 1.000 | 1.000 |
| Shandong | 1.000 | 1.000 | 1.000 | 1.000 | 1.000 | 1.000 | 1.000 | 1.000 | 1.000 | 1.000 | 1.000 | 1.000 |
| Hunan | 1.000 | 1.000 | 1.000 | 1.000 | 1.000 | 1.000 | 1.000 | 1.000 | 1.000 | 1.000 | 1.000 | 1.000 |
| Guangdong | 1.000 | 1.000 | 1.000 | 1.000 | 1.000 | 1.000 | 1.000 | 1.000 | 1.000 | 1.000 | 1.000 | 1.000 |
| Guangxi | 1.000 | 1.000 | 1.000 | 1.000 | 1.000 | 1.000 | 1.000 | 1.000 | 1.000 | 1.000 | 1.000 | 1.000 |
| Hainan | 1.000 | 1.000 | 1.000 | 1.000 | 1.000 | 1.000 | 1.000 | 1.000 | 1.000 | 1.000 | 1.000 | 1.000 |
| Guizhou | 1.000 | 1.000 | 1.000 | 1.000 | 1.000 | 1.000 | 1.000 | 1.000 | 1.000 | 1.000 | 1.000 | 1.000 |
| Yunnan | 1.000 | 1.000 | 1.000 | 1.000 | 1.000 | 1.000 | 1.000 | 1.000 | 1.000 | 1.000 | 1.000 | 1.000 |
| Shaanxi | 1.000 | 1.000 | 1.000 | 1.000 | 1.000 | 1.000 | 1.000 | 1.000 | 1.000 | 1.000 | 1.000 | 1.000 |
| Gansu | 1.000 | 1.000 | 1.000 | 1.000 | 1.000 | 1.000 | 1.000 | 1.000 | 1.000 | 1.000 | 1.000 | 1.000 |
| Qinghai | 1.000 | 1.000 | 1.000 | 1.000 | 1.000 | 1.000 | 1.000 | 1.000 | 1.000 | 1.000 | 1.000 | 1.000 |
| Xinjiang | 1.000 | 1.000 | 1.000 | 1.000 | 1.000 | 1.000 | 1.000 | 1.000 | 1.000 | 1.000 | 1.000 | 1.000 |
| Henan | 0.940 | 1.000 | 1.000 | 1.000 | 1.000 | 1.000 | 1.000 | 1.000 | 1.000 | 1.000 | 1.000 | 0.995 |
| Ningxia | 1.000 | 1.000 | 1.000 | 1.000 | 0.924 | 1.000 | 1.000 | 1.000 | 1.000 | 1.000 | 1.000 | 0.993 |
| Anhui | 0.953 | 1.000 | 1.000 | 1.000 | 1.000 | 1.000 | 0.988 | 0.983 | 1.000 | 0.980 | 0.941 | 0.986 |
| Chongqing | 0.952 | 0.914 | 1.000 | 0.976 | 0.997 | 1.000 | 1.000 | 1.000 | 1.000 | 1.000 | 1.000 | 0.985 |
| Hubei | 1.000 | 0.985 | 1.000 | 0.978 | 0.973 | 1.000 | 1.000 | 0.899 | 1.000 | 1.000 | 1.000 | 0.985 |
| Jilin | 1.000 | 0.900 | 1.000 | 0.864 | 0.957 | 1.000 | 1.000 | 0.899 | 1.000 | 1.000 | 1.000 | 0.975 |
| Jiangxi | 0.955 | 0.928 | 0.897 | 1.000 | 1.000 | 1.000 | 0.894 | 1.000 | 1.000 | 1.000 | 1.000 | 0.970 |
| Tianjin | 1.000 | 0.871 | 1.000 | 0.931 | 0.924 | 1.000 | 1.000 | 0.875 | 1.000 | 1.000 | 1.000 | 0.964 |
| Liaoning | 1.000 | 1.000 | 1.000 | 1.000 | 1.000 | 1.000 | 1.000 | 0.859 | 0.882 | 0.876 | 0.953 | 0.961 |
| Hebei | 1.000 | 1.000 | 1.000 | 1.000 | 1.000 | 0.818 | 0.774 | 1.000 | 1.000 | 1.000 | 0.857 | 0.950 |
| Tibet | 1.000 | 1.000 | 0.631 | 1.000 | 1.000 | 1.000 | 1.000 | 0.960 | 0.857 | 1.000 | 1.000 | 0.950 |
| Shanxi | 0.941 | 0.865 | 0.794 | 0.930 | 0.900 | 1.000 | 1.000 | 1.000 | 1.000 | 1.000 | 1.000 | 0.948 |
| Sichuan | 0.780 | 1.000 | 0.944 | 1.000 | 1.000 | 0.794 | 0.831 | 1.000 | 1.000 | 1.000 | 1.000 | 0.941 |
| Heilongjiang | 1.000 | 0.887 | 1.000 | 0.804 | 0.693 | 1.000 | 1.000 | 0.672 | 0.954 | 0.803 | 1.000 | 0.892 |
| Inner Mongolia | 0.457 | 0.709 | 0.834 | 0.864 | 0.926 | 1.000 | 1.000 | 1.000 | 1.000 | 1.000 | 1.000 | 0.890 |
| Mean | 0.967 | 0.970 | 0.971 | 0.979 | 0.977 | 0.987 | 0.983 | 0.976 | 0.990 | 0.989 | 0.992 | 0.980 |
Table 4.
Statistics on Inefficiency of Research Indicators in Regular Higher Education Institutions across 31 Provinces and Municipalities in China from 2012 to 2022.
Table 4.
Statistics on Inefficiency of Research Indicators in Regular Higher Education Institutions across 31 Provinces and Municipalities in China from 2012 to 2022.
| Type of Efficiency | 2012 | 2013 | 2014 | 2015 |
|---|---|---|---|---|
| Technical Efficiency < 1 | seven provinces: Shanxi (0.941), Inner Mongolia (0.457), Anhui (0.953), Jiangxi (0.955), Henan (0.940), Chongqing (0.952), and Sichuan (0.780). | eight provinces: Tianjin (0.871), Shanxi (0.865), Inner Mongolia (0.709), Jilin (0.901), Heilongjiang (0.887), Jiangxi (0.928), Hubei (0.985), and Chongqing (0.914). | five provinces: Inner Mongolia (0.794), Liaoning (0.834), Shandong (0.897), Guizhou (0.944), and Shaanxi (0.631). | seven provinces: Tianjin (0.931), Shanxi (0.930), Inner Mongolia (0.864), Jilin (0.864), Heilongjiang (0.804), Hubei (0.978), and Chongqing (0.976). |
| Pure Technical Efficiency < 1 | three provinces: Shanxi (0.988), Inner Mongolia (0.768), and Chongqing (0.969). | six provinces: Tianjin (0.887), Inner Mongolia (0.858), Jilin (0.906), Heilongjiang (0.894), Hubei (0.987), and Chongqing (0.929). | two provinces: Inner Mongolia (0.947) and Liaoning (0.941). | six provinces: Tianjin (0.945), Inner Mongolia (0.944), Jilin (0.879), Heilongjiang (0.835), Hubei (0.986), and Chongqing (0.999). |
| Scale Efficiency < 1 | seven provinces: Shanxi (0.953), Inner Mongolia (0.596), Anhui (0.953), Jiangxi (0.955), Henan (0.940), Chongqing (0.983), and Sichuan (0.780). | eight provinces: Tianjin (0.982), Shanxi (0.865), Inner Mongolia (0.826), Jilin (0.994), Heilongjiang (0.992), Jiangxi (0.928), Hubei (0.998), and Chongqing (0.984). | four provinces: Inner Mongolia (0.838), Liaoning (0.887), Shandong (0.897), and Guizhou (0.944). | seven provinces: Tianjin (0.985), Shanxi (0.930), Inner Mongolia (0.915), Jilin (0.983), Heilongjiang (0.963), Hubei (0.992), and Chongqing (0.977). |
| Decreasing Returns to Scale | - | one province: Hubei | - | one province: Hubei |
| Increasing Returns to Scale | Seven provinces: Shanxi, Inner Mongolia, Anhui, Jiangxi, Henan, Chongqing, Sichuan | Seven provinces: Tianjin, Shanxi, Inner Mongolia, Jilin, Heilongjiang, Jiangxi, Chongqing | five provinces: Inner Mongolia, Liaoning, Shandong, Guizhou, Shaanxi | six provinces: Tianjin, Shanxi, Inner Mongolia, Jilin, Heilongjiang, Chongqing |
| Type of Efficiency | 2016 | 2017 | 2018 | 2019 |
| Technical Efficiency < 1 | eight provinces: Tianjin (0.924), Shanxi (0.900), Inner Mongolia (0.926), Jilin (0.957), Heilongjiang (0.693), Hubei (0.973), Chongqing (0.997), and Ningxia (0.924). | Two provinces: Hebei (0.818), Sichuan (0.794) | Four provinces: Hebei (0.774), Anhui (0.988), Jiangxi (0.894), Sichuan (0.831) | Six provinces: Tianjin (0.875), Liaoning (0.859), Heilongjiang (0.672), Anhui (0.983), Hubei (0.899), Tibet (0.960) |
| Pure Technical Efficiency < 1 | Seven provinces: Tianjin (0.937), Shanxi (0.992), Inner Mongolia (0.929), Jilin (0.969), Heilongjiang (0.759), Hubei (0.978), Ningxia (0.947) | One province: Hebei (0.913) | One province: Hebei (0.913) | Four provinces: Tianjin (0.906), Liaoning (0.878), Heilongjiang (0.803), Hubei (0.930) |
| Scale Efficiency < 1 | Eight provinces: Tianjin, Shanxi, Inner Mongolia, Jilin, Heilongjiang, Hubei, Chongqing, Ningxia | Two provinces: Hebei (0.896), Sichuan (0.794) | Four provinces: Hebei (0.804), Anhui (0.988), Jiangxi (0.894), Sichuan (0.831) | Six provinces: Tianjin (0.966), Liaoning (0.978), Heilongjiang (0.837), Anhui (0.983), Hubei (0.967), Tibet (0.960) |
| Decreasing Returns to Scale | One province: Ningxia | - | - | - |
| Increasing Returns to Scale | Seven provinces: Tianjin, Shanxi, Inner Mongolia, Jilin, Heilongjiang, Hubei, Chongqing | Two provinces: Hebei, Sichuan | Four provinces: Hebei, Anhui, Jiangxi, Sichuan | Six provinces: Tianjin, Liaoning, Heilongjiang, Anhui, Hubei, Tibet |
| Type of Efficiency | 2020 | 2021 | 2022 | |
| Technical Efficiency < 1 | Three provinces: Liaoning (0.882), Heilongjiang (0.954), Tibet (0.857) | Three provinces: Liaoning (0.876), Heilongjiang (0.803), Anhui (0.980) | Three provinces: Hebei (0.857), Liaoning (0.953), Anhui (0.941) | - |
| Pure Technical Efficiency < 1 | Two provinces: Liaoning (0.924), Heilongjiang (0.969) | Two provinces: Liaoning (0.928), Heilongjiang (0.871) | Two provinces: Liaoning (0.965), Anhui (0.947) | - |
| Scale Efficiency < 1 | Three provinces: Liaoning (0.955), Heilongjiang (0.985), Tibet (0.857) | Three provinces: Liaoning (0.944), Heilongjiang (0.922), Anhui (0.980) | Three provinces: Hebei (0.857), Liaoning (0.988), Anhui (0.993) | - |
| Decreasing Returns to Scale | - | - | - | - |
| Increasing Returns to Scale | Three provinces: Liaoning, Heilongjiang, Tibet | Three provinces: Liaoning, Heilongjiang, Anhui | Three provinces: Hebei, Liaoning, Anhui | - |
Table 5.
Malmquist Productivity and Its Decomposition of Research Efficiency in Chinese Ordinary Universities from 2012 to 2022.
Table 5.
Malmquist Productivity and Its Decomposition of Research Efficiency in Chinese Ordinary Universities from 2012 to 2022.
| Year | Technical Efficiency | Technological Progress | Pure Technical Efficiency | Scale Efficiency | Total Factor Productivity (Malmquist Productivity Index) |
|---|---|---|---|---|---|
| 2012-2013 | 1.000 | 1.041 | 1.000 | 1.000 | 1.041 |
| 2013-2014 | 1.000 | 1.298 | 1.000 | 1.000 | 1.298 |
| 2014-2015 | 1.000 | 1.193 | 1.000 | 1.000 | 1.193 |
| 2015-2016 | 0.997 | 1.048 | 0.997 | 1.000 | 1.046 |
| 2016-2017 | 1.000 | 1.881 | 1.000 | 1.000 | 1.881 |
| 2017-2018 | 0.996 | 1.490 | 1.000 | 1.000 | 1.484 |
| 2018-2019 | 1.000 | 1.886 | 1.000 | 1.000 | 1.886 |
| 2019-2020 | 1.017 | 1.886 | 1.000 | 1.000 | 1.918 |
| 2020-2021 | 1.000 | 1.007 | 1.000 | 1.000 | 1.007 |
| 2021-2022 | 1.072 | 0.990 | 0.985 | 1.089 | 1.062 |
| Mean | 1.011 | 1.271 | 0.990 | 1.022 | 1.285 |
Table 6.
Malmquist Productivity and Its Decomposition of Research Efficiency in Ordinary Universities in 31 Provinces, Municipalities, and Autonomous Regions of China from 2012 to 2022.
Table 6.
Malmquist Productivity and Its Decomposition of Research Efficiency in Ordinary Universities in 31 Provinces, Municipalities, and Autonomous Regions of China from 2012 to 2022.
| 31 provinces | Technical Efficiency | Technological Progress | Pure Technical Efficiency | Scale Efficiency | Total Factor Productivity(Malmquist Productivity Index) |
|---|---|---|---|---|---|
| Beijing | 1.000 | 2.046 | 1.000 | 1.000 | 2.046 |
| Tianjin | 0.931 | 1.395 | 0.945 | 0.985 | 1.298 |
| Hebei | 1.000 | 1.457 | 1.000 | 1.000 | 1.457 |
| Shanxi | 1.171 | 1.169 | 1.056 | 1.109 | 1.369 |
| InnerMongolia | 1.035 | 1.215 | 1.003 | 1.032 | 1.258 |
| Liaoning | 1.000 | 1.230 | 1.000 | 1.000 | 1.230 |
| Jilin | 0.864 | 1.226 | 0.879 | 0.983 | 1.059 |
| Heilongjiang | 0.804 | 1.082 | 0.835 | 0.963 | 0.870 |
| Shanghai | 1.000 | 1.416 | 1.000 | 1.000 | 1.416 |
| Jiangsu | 1.000 | 1.416 | 1.000 | 1.000 | 1.416 |
| Zhejiang | 1.000 | 1.113 | 1.000 | 1.000 | 1.113 |
| Anhui | 1.000 | 1.765 | 1.000 | 1.000 | 1.765 |
| Fujian | 1.000 | 1.293 | 1.000 | 1.000 | 1.293 |
| Jiangxi | 1.115 | 1.174 | 1.000 | 1.115 | 1.309 |
| Shandong | 1.000 | 1.239 | 1.000 | 1.000 | 1.239 |
| Henan | 1.000 | 1.426 | 1.000 | 1.000 | 1.426 |
| Hubei | 0.978 | 1.500 | 0.986 | 0.992 | 1.467 |
| Hunan | 1.000 | 1.148 | 1.000 | 1.000 | 1.148 |
| Guangdong | 1.000 | 1.349 | 1.000 | 1.000 | 1.349 |
| Guangxi | 1.000 | 1.085 | 1.000 | 1.000 | 1.085 |
| Hainan | 1.000 | 0.990 | 1.000 | 1.000 | 0.990 |
| Chongqing | 0.976 | 1.038 | 0.999 | 0.977 | 1.013 |
| Sichuan | 1.059 | 1.581 | 1.000 | 1.059 | 1.675 |
| Guizhou | 1.000 | 1.111 | 1.000 | 1.000 | 1.111 |
| Yunnan | 1.000 | 1.175 | 1.000 | 1.000 | 1.175 |
| Tibet | 1.585 | 1.262 | 1.000 | 1.585 | 2.000 |
| Shaanxi | 1.000 | 1.709 | 1.000 | 1.000 | 1.709 |
| Gansu | 1.000 | 1.189 | 1.000 | 1.000 | 1.189 |
| Qinghai | 1.000 | 1.113 | 1.000 | 1.000 | 1.113 |
| Ningxia | 1.000 | 0.848 | 1.000 | 1.000 | 0.848 |
| Xinjiang | 1.000 | 1.281 | 1.000 | 1.000 | 1.281 |
| Average | 1.011 | 1.271 | 0.990 | 1.022 | 1.285 |
Disclaimer/Publisher’s Note: The statements, opinions and data contained in all publications are solely those of the individual author(s) and contributor(s) and not of MDPI and/or the editor(s). MDPI and/or the editor(s) disclaim responsibility for any injury to people or property resulting from any ideas, methods, instructions or products referred to in the content. |
© 2024 by the authors. Licensee MDPI, Basel, Switzerland. This article is an open access article distributed under the terms and conditions of the Creative Commons Attribution (CC BY) license (http://creativecommons.org/licenses/by/4.0/).
Copyright: This open access article is published under a Creative Commons CC BY 4.0 license, which permit the free download, distribution, and reuse, provided that the author and preprint are cited in any reuse.


