

Submitted:
07 June 2024
Posted:
07 June 2024
You are already at the latest version
Abstract
Early and accurate mapping of winter canola planting areas provides critical support for sustainable cropland management. Although some methods have been proposed to map the winter canola at the flowering or later stage, mapping winter canola planting areas at the early stage is still challenging, due to the insufficient understanding of the multi-source remote sensing features sensitive for winter canola mapping. This study proposed an early-stage winter canola area mapping method by using the combination of optical and synthetic aperture radar (SAR) data. We analyzed the spectral features, backscatter coefficients, and textural features of winter canola based on Sentinel-2 and Sentinel-1 images. Random forest (RF) and Support Vector Machine (SVM) classification models were built to map winter canola based on early-stage images and field samples in 2017 and then apply the best model to corresponding satellite data in 2018-2022. Results showed that: (1) The red edge and near-infrared-related spectral features were most important for the mapping of early-stage winter canola, followed by VV, DVI and GOSAVI, which also showed greater differences than the other features; (2) Based on Sentinel-1 and Sentinel-2 data, winter canola could be earliest mapped around 130 days prior to ripening (i.e., early overwinter stage) with the F-score over 0.85 and the OA over 81%; (3) Adding Sentinel-1 could improve the OA by about 2%-4% and the F-score by about 1% -2% in winter canola mapping. (4) The F-score of winter canola mapping based on the classifier transfer approach in 2018-2022 varied between 0.75 and 0.97, and the OA ranged from 79% to 86%. This study demonstrates the potential of early-stage winter canola mapping using the combination of Sentinel-2 and Sentinel-1 images, which could provide valuable and timely information for stakeholders and decision makers.
Keywords:
smart agriculture
; early-stage mapping
; Sentinel- 1
; Sentinel-2
1. Introduction
The production of canola, which is one of the four major oil crops in the world [1], occupies a critical position in the national economy. The planting of winter canola provides an effective way to make use of winter fallow fields, rationally multiple cropping, and solve the national oil shortage [2,3]. Therefore, early and accurate mapping of winter canola is critical for rationally planning and evaluating the current status of arable land use and forecast the yield of oilseeds [ 4,5]. Traditionally, manual surveys have been conducted for measuring cultivated areas during the crop growing season [6,7]; however, it is costly, labor-intensive, and time-consuming. Recently, satellite remote sensing has become an effective way to mapping the spatial-temporal distribution of winter canola planting areas, as it can efficiently collect multi-source data from vast geographical areas in a short time [8,9,10].
Many studies have used medium-resolution, optical satellite images (e.g., Sentinel-2) for crop mapping [11,12]. Recently, some new spectral indices have been proposed for the mapping of winter canola. Spectral index-based methods commonly utilize the spectral features of canola at the flowering stage (i.e. the distinctive bright yellow color). For example, Ashourloo developed an index to enhance the spectral feature of reflectance of red and green bands for the winter canola mapping during the flowering stage [13]. Han et al. developed another index to map canola by combining the high normalized difference yellow index values during the flowering stage and the high VH values during the podding stage [14]. However, a method that does not rely on flowering images is urgently needed to mapping winter canola at the early stage.
Cloud-free optical satellite data during the flowering stage in China’s main planting area are often lacking, as winter canola often flowers in the local rainy season. As collected from active sensor, satellite SAR data are unaffected by rain and clouds and can provide regular observations day and night comparing to satellite optical data [15]. Optical and SAR data together provide complementary information for winter canola mapping: optical images reflect the spectral features of winter canola, while the SAR data provide information about the surface roughness, texture and dielectric properties of winter canola [16,17]. Although many studies have used a combination of optical and SAR images for crop mapping (e.g., rice, corn, and wheat) [17,18,19], few studies have been conducted for the early-stage mapping of winter canola by combining optical and SAR data. In other words, there has been insufficient understanding on the spectral-SAR features for the early-stage mapping of winter canola.
Therefore, the primary goal of this study was to develop a method for mapping winter canola at the early stage by the integrated use of Sentinel-2/1 images. Early-stage Sentinel-1/2 imagery and field samples collected in 2017 were used to train random forest (RF) and Support Vector Machine (SVM) classifiers, which were then applied to the corresponding satellite data in 2018-2022. Specifically, we address two questions, as follows: (1) What were the most important features for mapping winter canola at early stage? (2) Can the integrated use of Sentinel-2 and Sentinel- 1 data effectively improve the timeliness and accuracy of winter canola mapping, compared with the use of only Sentinel-2 or Sentinel- 1?
2. Study Area and Data
2.1. Study Area
Jianghan Plain in Hubei Province is one of the major planting areas for canola in China, accounting for 9% of total canola production in China. Its geographical location is between 29°26'-31°37' north latitude and 111°14'-114°36' east longitude. Winter canola accounts for approximately 90% of the total canola in China [20]. The study area includes Zhijiang, Shishou, Xiantao, Zhongxiang, Tianmen, Qianjiang, and 20 other cities and counties, with a total area of 37,660.79 square kilometers (Figure 1). The crops grown in Jianghan Plain are mainly rice, cotton, and canola. The two types of canola are spring and winter, according to when they are planted. Winter canola is planted in the fall (September-October) over winters and is harvested in the summer (June). The phenological information of winter canola and winter wheat, as the main crops of Jianghan Plain in winter, is shown in Table 1.
2.2. Datasets and Processing
2.2.1. Sentinel-1 Data
Sentinel-1 is a C-band Synthetic Aperture Radar (SAR) satellite with dual polarization (VV and VH) [21]. The Sentinel-1 Ground Range Detected (GRD) data used in this study has been preprocessed, including orbit restoration, thermal noise removal, topographic correction, and radiometric calibration [19,21,22,23]. In addition, we used DNCNN algorithm to reduce speckle of Sentinel-1. This method was selected because it can filter white Gaussian noise at unknown noise levels and better preserve detailed information under the influence of speckle removal [24,25,26,27]. Since early-stage crop mapping cannot rely on long time series data, we chose to use the mean of single temporal data at each phenological stage separately to construct the predictors. This process helped reduce the bias of phenological characteristics of remote sensing data caused by the sowing time. The Sentinel-1 data of each phenological stage of winter canola from 2017 to 2022 were selected as shown in Table S1.
2.2.2. Sentinel-2 Data
Sentinel-2 optical data has 13 spectral bands (from visible and near-infrared to short-wave infrared) at variable spatial resolutions (10, 20, and 60 m) [21]. We accessed the Sentinel-2 Level- 1C Top of Atmosphere (TOA) reflectance images in 2017-2022, which had been ortho-rectified and geometrically corrected. We performed atmospheric correction of Sentinel-2 with an algorithm (SIAC) developed on the GEE platform [28]. We selected the Sentinel-2 data with clouds of <20% to reduce the influence of cloud pollution. After cloud mask using the QA60 band of Sentinel-2, all images used in the study were re-sampled to 10 meters with Nearest Neighbor [29]. Table S2 shows the Sentinel-2 data with the best quality and the least image cloud cover at the early stage of winter canola from 2017 to 2022. Figure 2 shows that, in 2019, a higher presence of clouds and increased rainfall limited the availability of optical images for early-stage winter canola, resulting in difficulties of early-stage winter canola mapping. Thus, early-stage crop mapping research based on SAR data is particularly important.
2.2.3. Sample Data
In this study, we classified satellite data into five land types, as follows: (1) winter canola; (2) other winter crops (mainly winter wheat); (3) trees (including orchard, coniferous forest, and shrub); (4) water (including rivers, lakes, and ponds); (5) building (including roads and houses). In other winter crops, we primarily focused on winter wheat and did not classifier other winter crops, such as vegetables, as the primary source of misclassification for winter canola mapping comes from winter wheat. The samples in this study were obtained by visual interpretation of high-resolution images of Google Earth and Planet in 2017-2022(Figure S1). To ensure the representativeness of the samples, we uniformly sampled from different areas in the JiangHan Plain. In this study, the coverage area for each sample is no less than 10m×10m. The number and spatial distribution of these samples for each year are shown in Table 2 and Figure 2, respectively. As shown in Table 2, we had a total of 6227 samples selected in 2017, and in the subsequent years from 2018 to 2022, the number decreased to around 2000. The data from 2017 were used for training the model and validating the model accuracy at various phenological stages, while data from other years were only used for validation. In this study, the training samples were selected from four experimental areas in 2017, namely, Zhijiang, Shishou, Hanchuan, and Yingcheng. The selected training samples and early-stage images were used to train classifiers, which were then applied to the corresponding images in 2017-2022 in our study area.
2.2.4. Field Survey Data
We collected the field survey data at Huazhong Agricultural University during its growth stage in 2022 to further illustrate the phenological characteristics of winter canola and the reliability of the multispectral data. From November 2021 to April 2022, the growth stage of winter canola and winter wheat was continuously observed at different phenological stages (Figure 3).
3. Methods
The flowchart of the study is shown in Figure 4. First, we obtain Sentinel-1 and Sentinel-2 data after data preprocessing to extract various features of the images. Second, the VSURF algorithm is used to select features at different phenological stages of winter canola. Then, we constructed SAR data models and optical-SAR combination models to study the earliest mapping timing based on different data sources. Finally, to verify the transferability of the model in time, the approach based on multisource data model in 2017 was applied to 2018 and 2020-2022 and that based on SAR data model in 2017 was applied to 2019 to realize the information extraction on multi-year and early-stage winter canola planting area.
3.1. Feature Extraction
In this study, six types of predictors were used: spectral bands, spectral indexes, backscatter coefficients, polarization indexes, textural features, and topographical features.
We used sample data from the 2017 collected in Zhijiang, Shishou, Hanchuan, and Yingcheng to extract these features. There are a total of 1809 samples, including 346 winter canola, 368 winter wheat, 365 trees, 365 water, and 365 buildings. We calculated 20 spectral indices from 10 spectral bands of Sentinel-2 (Table S3). We also calculated seven polarization indexes (Table 3) from two polarization features of Sentinel-1. We extracted 32 textural features based on gray level co-occurrence matrix (GLCM) from Sentinel-1 bands (VH polarization and VV polarization, Table 4). Moreover, three topographic features including DEM, slope, and aspect were calculated based on the SRTM data.
3.2. Feature Selection
Feature selection is a crucial issue, as excessive features increase the computational cost and easily cause data redundancy and overfitting, leading to the degradation of the performance of machine learning models [33]. To study the contribution of different features for early-stage winter canola mapping, the features of the training samples at different phenological stages are calculated and their importance is evaluated. An RF-based variable selection method (VSURF) proposed by Genuer et al. was adopted, as it has high computational efficiency and is suitable for feature selection of crop type mapping [34,35].
3.3. Classification Models
3.3.1. RF Algorithm
The RF is an ensemble algorithm, which is suitable for supervised classification [34]. No relationship exists between each decision tree, each decision tree in the forest performs judgments separately, and voting is used to select the class as the final classification result.
3.3.2. SVM Algorithm
SVM is a machine learning classification method initially proposed by Cortes and Vapnik in 1995 [36]. It is a supervised learning method that widely used in statistical classification and regression analysis. SVM is a classic two-class model. The basic model is a linear classifier with the largest interval in the feature space. The optimization goal is to maximize the interval. In this study, we set the parameters as follows: kernel_type=RBF, gamma=0.6, and cost=40.
3.4. Accuracy Assessment
According to the sample data selected in Jianghan Plain, we used confusion matrix, overall classification accuracy (OA), winter canola producer accuracy (PA), winter canola user accuracy (UA), and the F-score to evaluate the accuracy of winter canola at different phenological stages.
4. Results
This section may be divided by subheadings. It should provide a concise and precise description of the experimental results, their interpretation, as well as the experimental conclusions that can be drawn.
4.1. Feature Analysis
4.1.1. Backscattering Features of Winter Canola at Different Phenological Stages
The Figure 5 shows that, at the seedling stage, overwinter stage, and early bolting stages, the VH and VV polarizations of winter canola were significantly different from those of other land types at the level of 0.05. Similarly, at the late bolting stage and flowering stage, the differences in VH and VV polarizations between winter canola, winter wheat and water were also significant(p<0.05). The findings showed that Sentinel-1 data could distinguish early-stage winter canola and other land types to different degrees at different phenological stages and could be identified by subsequent studies.
4.1.2. Textural Features of Winter Canola at Different Phenological Stages
Figure 6 shows that, at the seedling stage, overwinter stage, and early bolting stage, the VH_Savg and VV_Savg features of winter canola were significantly different from those of other land types(p<0.05). At the late bolting stage, VH_Savg and VV_Savg features also showed significant differences between winter canola and other land types (except trees). At the flowering stage, the VH_Savg and VV_Diss features of winter canola were significantly different from other land types (except trees). According to the analysis, some textural features could effectively distinguish winter canola from other land types and could be used for early-stage winter canola mapping research.
4.1.3. Spectral Indices of Winter Canola at Different Phenological Stages
As shown in Figure 7, at the seedling stage, the GOSAVI of winter canola was significantly different from that of other land types (p<0.05). Its LSWI was also significantly different from that of other land types (except water). At the overwinter stage, the GOSAVI and DVI features of winter canola were significantly different from those of other land types (p<0.05). At the bolting stage, the DVI of winter canola was significantly different from that of other land types (p<0.05). Its GARI as also significantly different from that of other land types (except winter wheat).
4.2. Earliest Mapping Timing Based on Sentinel-1
Figure 8 shows the mapping accuracy of winter canola at different phenological stages using RF and SVM models based on Sentinel-1 images. The Figure shows that the accuracy of winter canola shows a trend of initially increasing and then decreasing with the changes in phenology. At the seedling stage, the F-score of winter canola was the lowest, and the F-score of winter canola under RF and SVM models was 0.64, and the overall accuracy (OA) was 72.25% and 70.79%, respectively. At the early-bolting stages, the mapping accuracy of winter canola reached the highest, with F-score of 0.76 and 0.75, and the OA could reach 79.23% and 76.62% under RF and SVM models, respectively. Then, at the flowering stage, the accuracy began to decline.
Based on this analysis, the Sentinel-1SAR images indicate that while ensuring accuracy, the earliest winter canola mapping research could be achieved at the early-bolting, which was approximately 50 days ahead of the traditional flowering stage recognition of winter canola. In addition, the mapping based on SAR images was unaffected by weather and could be used for early-stage winter canola mapping research at any time and any year.
4.3. Earliest Mapping Timing Based on Sentinel-1 and Sentinel-2
Using Sentinel-1 and Sentinel-2 data combination for crop mapping can achieve higher mapping accuracy than using only Sentinel-1SAR data. Table 7 shows that at the seeding stage (early December 2017), combining Sentinel-1 and Sentinel-2 data, the F-score of winter canola under the RF model was 0.8010, with OA of 81.48%. At the overwinter stage (late December 2017), winter canola could be classified with F-scores of 0.8615 and 0.8583 and OA of 81.63% and 82.34% under the RF and SVM. The F-score increased by 6% compared with the seedling stage. At the bolting stage (late February 2017), the accuracy of mapping winter canola was improved by 18% and 12%, compared with the seedling and overwinter stages (F-score). In addition, winter canola could be classified 20 days prior to flowering at the bolting stage, 80 days prior to flowering at the overwinter stage, and 100 days prior to flowering at the seedling stage.
In summary, early-stage mapping of winter canola at the overwinter stage achieved the best accuracy. Considering the benefits of time and accuracy, it could not only ensure high mapping accuracy, but also map winter canola 80 days in advance, indicating great significance for early-stage agricultural monitoring and planning. The spatial details of the winter canola map at the overwinter stage are shown in the Figure S4.
4.4. Mapping Multiyear and Early-Stage Winter Canola
Figure 9 shows the mapping accuracy of winter canola based on optical and SAR images for different cities and years. In 2018, the average F-score of winter canola could reach 0.8366, and the OA was 79.22%. The F-score of winter canola in most areas was above 0.8, and the accuracy of some areas could reach more than 0.9 (such as Tianmen and Zhongxiang). The lowest accuracy was in Jianli, where the F-score of winter canola was only 0.59 and the OA was 76.79%, indicating that more winter canola in the region was inaccurately classified. In general, the model migration accuracy based on the combination of Sentinel-1 and Sentinel-2 at the early overwinter stage performed effectively in 2018.
According to Figure 9, in 2019, winter canola had an average F-score of 0.7855 and an average OA of 80.52% when only using SAR data. The F-score of winter canola mapping in most areas was above 0.7, and the accuracy in some areas was above 0.8 (Gongan, Jianli, Qianjiang, Shayang, Zhongxiang, and Shishou). Overall, the transfer accuracy of SAR model at the early bolting stage performed well in 2019.
In 2020 and 2022, the average F-score of winter canola were 0.9750 and 0.9482, and the average OA were 85.42% and 86.87%, respectively. Winter canola in all eight areas of the Jianghan Plain achieved an F-score exceeding 0.9 and an OA above 80%, demonstrating a good model transferability based on the combination of Sentinel-1 and Sentinel-2 data. In 2021, the F-score of winter canola in some areas of the Jianghan Plain could was up to 0.9 (Gongan, Zhongxiang) and in most areas was above 0.7. The average F-score of winter canola was 0.7569, and the OA was 84.34%. The model transferability was slightly lower than that in 2020.
Figure 10 shows the early-stage mapping result of winter canola in the Jianghan Plain from 2017 to 2022. The figure indicates that the planting area of winter canola in 2020 and 2021 was relatively small, while the planting area in 2017, 2019, and 2022 was relatively large.
5. Discussion
5.1. Important Features for Winter Canola Mapping
The importance of each feature was evaluated and ranked from the highest to lowest in Figure S2. By analyzing the features importance of different stages, we determined the features at different stages for the winter canola mapping using different data combination (Table 5, Table 6). The SAR signal is sensitive to the geometry (e.g.roughness, texture, internal structure) and wetness of the observed targets [37]. Han et al. found the VH reached a maximum value at the pod stage of winter canola, and using the high VH value on Sentinel-1 images to map winter canola [14]. Although the VH value of winter canola reaches its maximum at the poddig stage, but for the early-stage mapping, we only need to study the polarization features that can distinguish winter canola from other crops. In this study, we found that the VV value of winter canola was higher than that of other crops at the early-bolting stage (late January) (Figure 5). According to Cookmartin et al. [38], they showed that VV is particularly sensitive to vegetation wetness and Fieuzal et al. [39] observed maximum water content at the stem elongation stage. At the early-bolting stage of winter canola, the rapid increase in the number of stems per plant and the length of stems results in an increase in VV polarization, which is dominated by the influence of soil and canopy, resulting in differences in polarization features between winter canola and other crops. Besides, textural features can distinguish ground objects with similar spectral features. We calculated textural features of the crop provided by Sentinel-1 images and found that VV_Savg and VH_Savg values were higher than other crops at the early-bolting stage (Figure 6), which is also a critical factor in distinguishing winter canola from other ground objects at the early-stage based on Sentinle-1 images. Moreover, we also added the SRI polarization index for early-season mapping (Table 5). Based on this, early-stage winter canola was mapped based on SAR images at the early-bolting stage, with F-score of 0.76 and OA of 79.23% in 2017 (Figure 8).
Some studies have found that red, green, blue and NIR bands can be effectively used for winter canola mapping during the flowering stage [13,40,41]. Previous studies have mainly explored the features of winter canola at the flowering stage, but rarely explored the early-stage features of winter canola. Besides, they have not yet studied the role of red-edge in winter canola mapping. Because the temperature is low during the early-stage of winter canola, the ground vegetation stops growing or even gradually freezes until death [42]. For winter canola, winter canola grows rapidly with leaf development after the seeding stage, so the spectral response of winter canola is different from that of other ground objects at the early-stage. In this study, based on Sentinel-2 data, we found the reflectance values of red-edge and near-infrared in winter canola were higher than others at the seeding stage, overwinter stage and bolting stage (Figure S3), which is a critical factor in distinguishing winter canola from other ground objects at the early-stage (Table 6). At the overwintering stage, the differences in the red-edge and near-infrared bands were the largest, followed by VV, DVI and GOSAVI, which also showed greater differences than the other features (Table 6). Based on this, we achieved the earliest mapping of winter canola during the overwinter stage, with F-score of 0.86 and OA of 81.63% (Table 7) based on Sentinel-1 and Sentinel-2 data. The proposed approach potentially provides a reference for early-stage mapping of other crop types in agricultural regions worldwide [42].
5.2. Advantages of Combination of Sentinle-1 and Sentinel-2 Data for Winter Canola Mapping
We proposed the method of early-stage mapping based on the unique spectral and polarization features of Sentinel-2 and Sentinel-1 images. The study is different from the methods developed in previous studies [43,44]. (1) Most of these studies used a single type of optical satellite imagery for winter canola mapping. The combination of optical and SAR images can solve the problem of the cloud to some extent. Besides, optical images reflect the spectral features of winter canola but not the geometric features and textural features of winter canola [14]. The integrated spectrum and polarization indices incorporated in the study are effective for distinguishing winter canola from other land cover types. (2) Existing winter canola mapping studies typically achieve the highest classification accuracy during the flowering and podding stages of winter canola [14,45]. For example, Ashourloo et al. based on Sentinel-2 time-series data from March to June, achieved a winter canola mapping accuracy of 88% [13]. Compared to previous studies, we map winter canola at the early-stage by using the early-stage features of winter canola.
By combining Sentinel-1 and Sentinel-2 images, the early-stage mapping accuracy and time of winter canola are much higher and earlier than that of using SAR data alone, mainly because optical images can obtain rich crop canopy spectral information [46]. According to Table 7, adding Sentinel-1 could improve the overall accuracy by about 2%-4% and the F-score by about 1% -2% in winter canola mapping. Although the early-stage mapping accuracy of winter canola using only SAR images is not as good as the combination of Sentinle-1 and Sentinel-2 data, it is still worthy of studying given the effects of rainy and cloudy conditions on the optical images.
5.3. Future Studies
The early-stage winter canola mapping method proposed in this study achieved satisfactory results. This method can map winter canola planting areas 4.5 months before harvest. However, there are still some limitations. In this study, we used Machine learning algorithms, RF model, is highly dependent on samples for training. RF require manual feature selecting and pre-definition of crop growth stage, whereas deep learning can overcome this problem and generate high-dimensional features [42,46,47]. For example, Wang et al. developed a deep adaptation crop classification network (DACCN) [25]. They found that DACCN outperformed other models (RF and SVM) with overall classification accuracies ranging from 0.835 to 0.92. The use of deep neural networks for early-stage mapping of crops is a potential improvement in the future.
The early-stage mapping method developed in this study can be applied to other regions by the classifier transfer method. However, classifier transfer often produces errors owing to differences in remote sensing observations and climate environment. In order to obtain the best transfer results, we need to use remote sensing images of the same phenological stage. If there is significant interannual variation in weather conditions or different growing dates of crops in different regions, it may lead to differences in crop phenology, thereby diminishing the accuracy of classifier transfer. For example, in this study, in the 2021, because of cloud impact, the phenological stage of the images we used was different from other years (Table S2), the migration accuracy of the classifier is only 0.7569(Figure 9). Some countries and regions have accurate crop phenology observations, such as data from agrometeorological stations in China. In the future, combining remote sensing, topographic and climate variables (temperature, precipitation) data to simulate winter canala growth phenology may prove an effective method or improving the accuracy of early-stage winter canola.
6. Conclusions
Early-stage crop mapping would greatly benefit the policymakers, civil society, and private industry to forecast food production and ensure food safety. Here, we studied the earliest mapping phenological stage of winter canola in the Jianghan Plain with the combination of Sentinel-1 and Sentinel-2 imagery. The mapping accuracy of winter canola at different phenological stages was compared. In addition, the impact of combining Sentinel-2 optical and Sentinel- 1SAR data on the mapping accuracy of early-stage winter canola was evaluated, and various features of winter canola mapping at different phenological stages were analyzed. RF and SVM classifiers were trained based on early-stage images and field samples in 2017, and then transferred to the corresponding images in 2018-2022 to obtain early-stage canola maps independent of within-year ground samples. The following conclusions could be drawn:
- At the overwintering stage, the differences in the red-edge and near-infrared bands were the largest, followed by VV, DVI and GOSAVI, which also showed greater differences than the other features
- When using only Sentinel-1 data, the winter canola could be earliest identified at the bolting stage (Late January, 3.5 months prior to harvest), that is, 50 days earlier than the traditional flowering period (Mid-March). The F-score of winter canola under RF and SVM models could reach more than 0.75, and the OA could reach more than 80%; the accuracy of the RF model was slightly higher.
- Combining Sentinel-1 and Sentinel-2 data, the winter canola could be earliest mapped on the early overwinter stage (Late December, 4.5 months prior to harvest), with the F-score of winter canola over 0.85 and the OA over 81% under RF and SVM models. Adding Sentinel-1 could improve the overall accuracy by about 2%-4% and the F-score by about 1% -2% in winter canola mapping.
- The F-score of winter canola mapping based on the classifier transfer approach in 2018-2022 varied between 0.75 and 0.97, and the OA ranged from 79% to 86%.
Supplementary Materials
The following supporting information can be downloaded at the website of this paper posted on Preprints.org.
Author Contributions
Conceptualization, T.L. and R.M.; methodology, T.L. and R.M.; validation, T.L.and P.L.; formal analysis, T.L.; data curation, T.L.and P.L.; writing—original draft preparation, T.L.; writing—review and editing, T.L., R.M., J.L. and F.Z.; visualization, J.L. and R.M.; supervision, R.M.,F.Z., and J.L. All authors have read and agreed to the published version of the manuscript.
Funding
This research received no external funding.
Data Availability Statement
Data will be made available on request.
Acknowledgments
This work was supported by Key Research and Development Program of Heilongjiang, China (grant No. 2022ZX01A25; JD2023GJ01) and National Natural Science Foundation of China (grant No. 41901382). We thank Chaoyang Zhang, Yigui Liao, Longfei Zhou and Rui Sun for their help.
Conflicts of Interest
The authors declare no conflicts of interest.
References
- Sulik, J.J. and D.S. Long, Spectral indices for yellow canola flowers. International Journal of Remote Sensing, 2015. 36(10): p. 2751-2765. [CrossRef]
- Kontgis, C., A. Schneider, and M.J.R.S.o.E. Ozdogan, Mapping rice paddy extent and intensification in the Vietnamese Mekong River Delta with dense time stacks of Landsat data. 2015. 169: p. 255-269. [CrossRef]
- Zhang, M. and H.J.A.i.S.R. Lin, Object-based rice mapping using time-series and phenological data. 2019.
- Chipanshi, A. , et al., Evaluation of the integrated Canadian crop yield forecaster (ICCYF) model for in-season prediction of crop yield across the Canadian agricultural landscape. 2015. 206: p. 137-150. [CrossRef]
- Song, Q. , et al., In-Season Crop Mapping with GF-1/WFV Data by Combining Object-Based Image Analysis and Random Forest. 2017. 9: p. 1184.
- Mosleh, M.K., Q. K. Hassan, and E.H. Chowdhury, Application of Remote Sensors in Mapping Rice Area and Forecasting Its Production: A Review. 2015. 15(1): p. 769-791. [CrossRef]
- Yuanshu, J. , et al. Determination of paddy rice growth indicators with MODIS data and ground-based measurements of LAI. 2013.
- Belgiu, M. and O.J.R.S.o.E. Csillik, Sentinel-2 cropland mapping using pixel-based and object-based time-weighted dynamic time warping analysis. 2018. 204: p. 509-523.
- Griffiths, P., C. Nendel, and P.J.R.S.o.E. Hostert, Intra-annual reflectance composites from Sentinel-2 and Landsat for national-scale crop and land cover mapping. 2019. [CrossRef]
- Jin, Z. , et al., Smallholder maize area and yield mapping at national scales with Google Earth Engine. Remote Sensing of Environment, 2019. 228: p. 115-128. [CrossRef]
- Liu, S. , et al., Mapping Ratoon Rice Planting Area in Central China Using Sentinel-2 Time Stacks and the Phenology-Based Algorithm. 2020. 12(20): p. 3400. [CrossRef]
- Mercier, A. , et al., Evaluation of Sentinel-1 & 2 time series for predicting wheat and rapeseed phenological stages. 2020. 163: p. 231-256. [CrossRef]
- Ashourloo, D. , et al., Automatic canola mapping using time series of sentinel 2 images. 2019. [CrossRef]
- Han, J. , et al., Mapping rapeseed planting areas using an automatic phenology- and pixel-based algorithm (APPA) in Google Earth Engine. 2022. [CrossRef]
- De Vroey, M. , et al., Mowing detection using Sentinel-1 and Sentinel-2 time series for large scale grassland monitoring. Remote Sensing of Environment, 2022. 280: p. 113145.
- Liao, C. , et al., Synergistic Use of Multi-Temporal RADARSAT-2 and VENµS Data for Crop Classification Based on 1D Convolutional Neural Network. 2020. 12(5): p. 832. [CrossRef]
- Park, S. , et al., Classification and Mapping of Paddy Rice by Combining Landsat and SAR Time Series Data. 2018. 10(3): p. 447. [CrossRef]
- Jiao, X. , et al., Object-oriented crop mapping and monitoring using multi-temporal polarimetric RADARSAT-2 data. 2014. 96: p. 38-46.
- Luo, C. , et al., Using Time Series Sentinel-1 Images for Object-Oriented Crop Classification in Google Earth Engine. 2021. 13(4): p. 561. [CrossRef]
- Tao, J. , et al., Fusing multi-source data to map spatio-temporal dynamics of winter rape on the Jianghan Plain and Dongting Lake Plain, China. 2019. [CrossRef]
- Hu, L., et al. Advancing the Mapping of Mangrove Forests at National-Scale Using Sentinel-1 and Sentinel-2 Time-Series Data with Google Earth Engine: A Case Study in China. Remote Sensing, 2020. 12. [CrossRef]
- Gašparović, M. and D.J.R.S. Dobrinić, Comparative Assessment of Machine Learning Methods for Urban Vegetation Mapping Using Multitemporal Sentinel-1 Imagery. 2020. 12: p. 1952. [CrossRef]
- Sun, Z. , et al., Nation-Scale Mapping of Coastal Aquaculture Ponds with Sentinel-1 SAR Data Using Google Earth Engine. 2020. 12(18): p. 3086. [CrossRef]
- Lattari, F. , et al., Deep Learning for SAR Image Despeckling. 2019. 11(13): p. 1532. [CrossRef]
- Wang, Y. , et al., An unsupervised domain adaptation deep learning method for spatial and temporal transferable crop type mapping using Sentinel-2 imagery. 2023. [CrossRef]
- Wang, P., H. Zhang, and V.M. Patel, SAR Image Despeckling Using a Convolutional Neural Network. IEEE Signal Processing Letters, 2017. 24(12): p. 1763-1767. [CrossRef]
- Zhang, K. , et al., Beyond a Gaussian Denoiser: Residual Learning of Deep CNN for Image Denoising. IEEE Transactions on Image Processing, 2017. 26(7): p. 3142-3155. [CrossRef]
- Yin, F. , et al. A sensor-invariant atmospheric correction method: application to Sentinel-2/MSI and Landsat 8/OLI. 2019.
- Porwal, S. and S.K. Katiyar. Performance evaluation of various resampling techniques on IRS imagery. in 2014 Seventh International Conference on Contemporary Computing (IC3). 2014.
- Periasamy, S. , Significance of dual polarimetric synthetic aperture radar in biomass retrieval: An attempt on Sentinel-1. Remote Sensing of Environment, 2018. 217: p. 537-549. [CrossRef]
- Haralick, R.M., K. Shanmugam, and I.H. Dinstein, Textural features for image classification. IEEE Transactions on systems, man, and cybernetics, 1973. SMC-3(6): p. 610-621. [CrossRef]
- Conners, R.W., M. M. Trivedi, and C.A. Harlow, Segmentation of a high-resolution urban scene using texture operators. Computer vision, graphics, and image processing, 1984. 25(3): p. 273-310. [CrossRef]
- Hastie, T. , et al., The Elements of Statistical Learning: Data Mining, Inference, and Prediction. Math. Intell., 2004. 27: p. 83-85.
- Breiman, L.J.M.L. , Random Forests. 2001. 45: p. 5-32.
- Genuer, R., J. M. Poggi, and C.J.P.R.L. Tuleau-Malot, VSURF: Variable Selection Using Random Forests. 2016. 31(14): p. 2225-2236.
- Cortes, C. and V. Vapnik, Support-vector networks. Machine learning, 1995. 20(3): p. 273-297.
- Betbeder, J. , et al., Contribution of multitemporal polarimetric synthetic aperture radar data for monitoring winter wheat and rapeseed crops. 2016. 10. [CrossRef]
- Cookmartin, G. , et al., Modeling microwave interactions with crops and comparison with ERS-2 SAR observations. 2000. 38: p. 658-670. [CrossRef]
- Fieuzal, R., F. Baup, and C.J.A. Marais-Sicre, Monitoring Wheat and Rapeseed by Using Synchronous Optical and Radar Satellite Data—From Temporal Signatures to Crop Parameters Estimation. 2013. 2: p. 162-180. [CrossRef]
- Sulik, J.J. and D.S. Long. Automated detection of phenological transitions for yellow flowering plants such as Brassica oilseeds. 2020. [CrossRef]
- Zang, Y. , et al., Remote Sensing Index for Mapping Canola Flowers Using MODIS Data. 2020. 12(23): p. 3912. [CrossRef]
- Huang, X. , et al., Early mapping of winter wheat in Henan province of China using time series of Sentinel-2 data. GIScience & Remote Sensing, 2022. 59(1): p. 1534-1549. [CrossRef]
- d’Andrimont, R. , et al., Detecting flowering phenology in oil seed rape parcels with Sentinel-1 and -2 time series. 2020. 239. [CrossRef]
- Wang, D. , et al., A Regional Mapping Method for Oilseed Rape Based on HSV Transformation and Spectral Features. 2018. 7(6): p. 224. [CrossRef]
- Tao, J.-b. , et al., Mapping winter rapeseed in South China using Sentinel-2 data based on a novel separability index. Journal of Integrative Agriculture, 2023. 22(6): p. 1645-1657. [CrossRef]
- Adrian, J. , et al., Sentinel SAR-optical fusion for crop type mapping using deep learning and Google Earth Engine. 2021. 175: p. 215-235. [CrossRef]
- Zhong, L. , et al., Deep learning based winter wheat mapping using statistical data as ground references in Kansas and northern Texas, US. 2019. [CrossRef]
Figure 1.
Study area (from Globe Land30 2010 dataset).
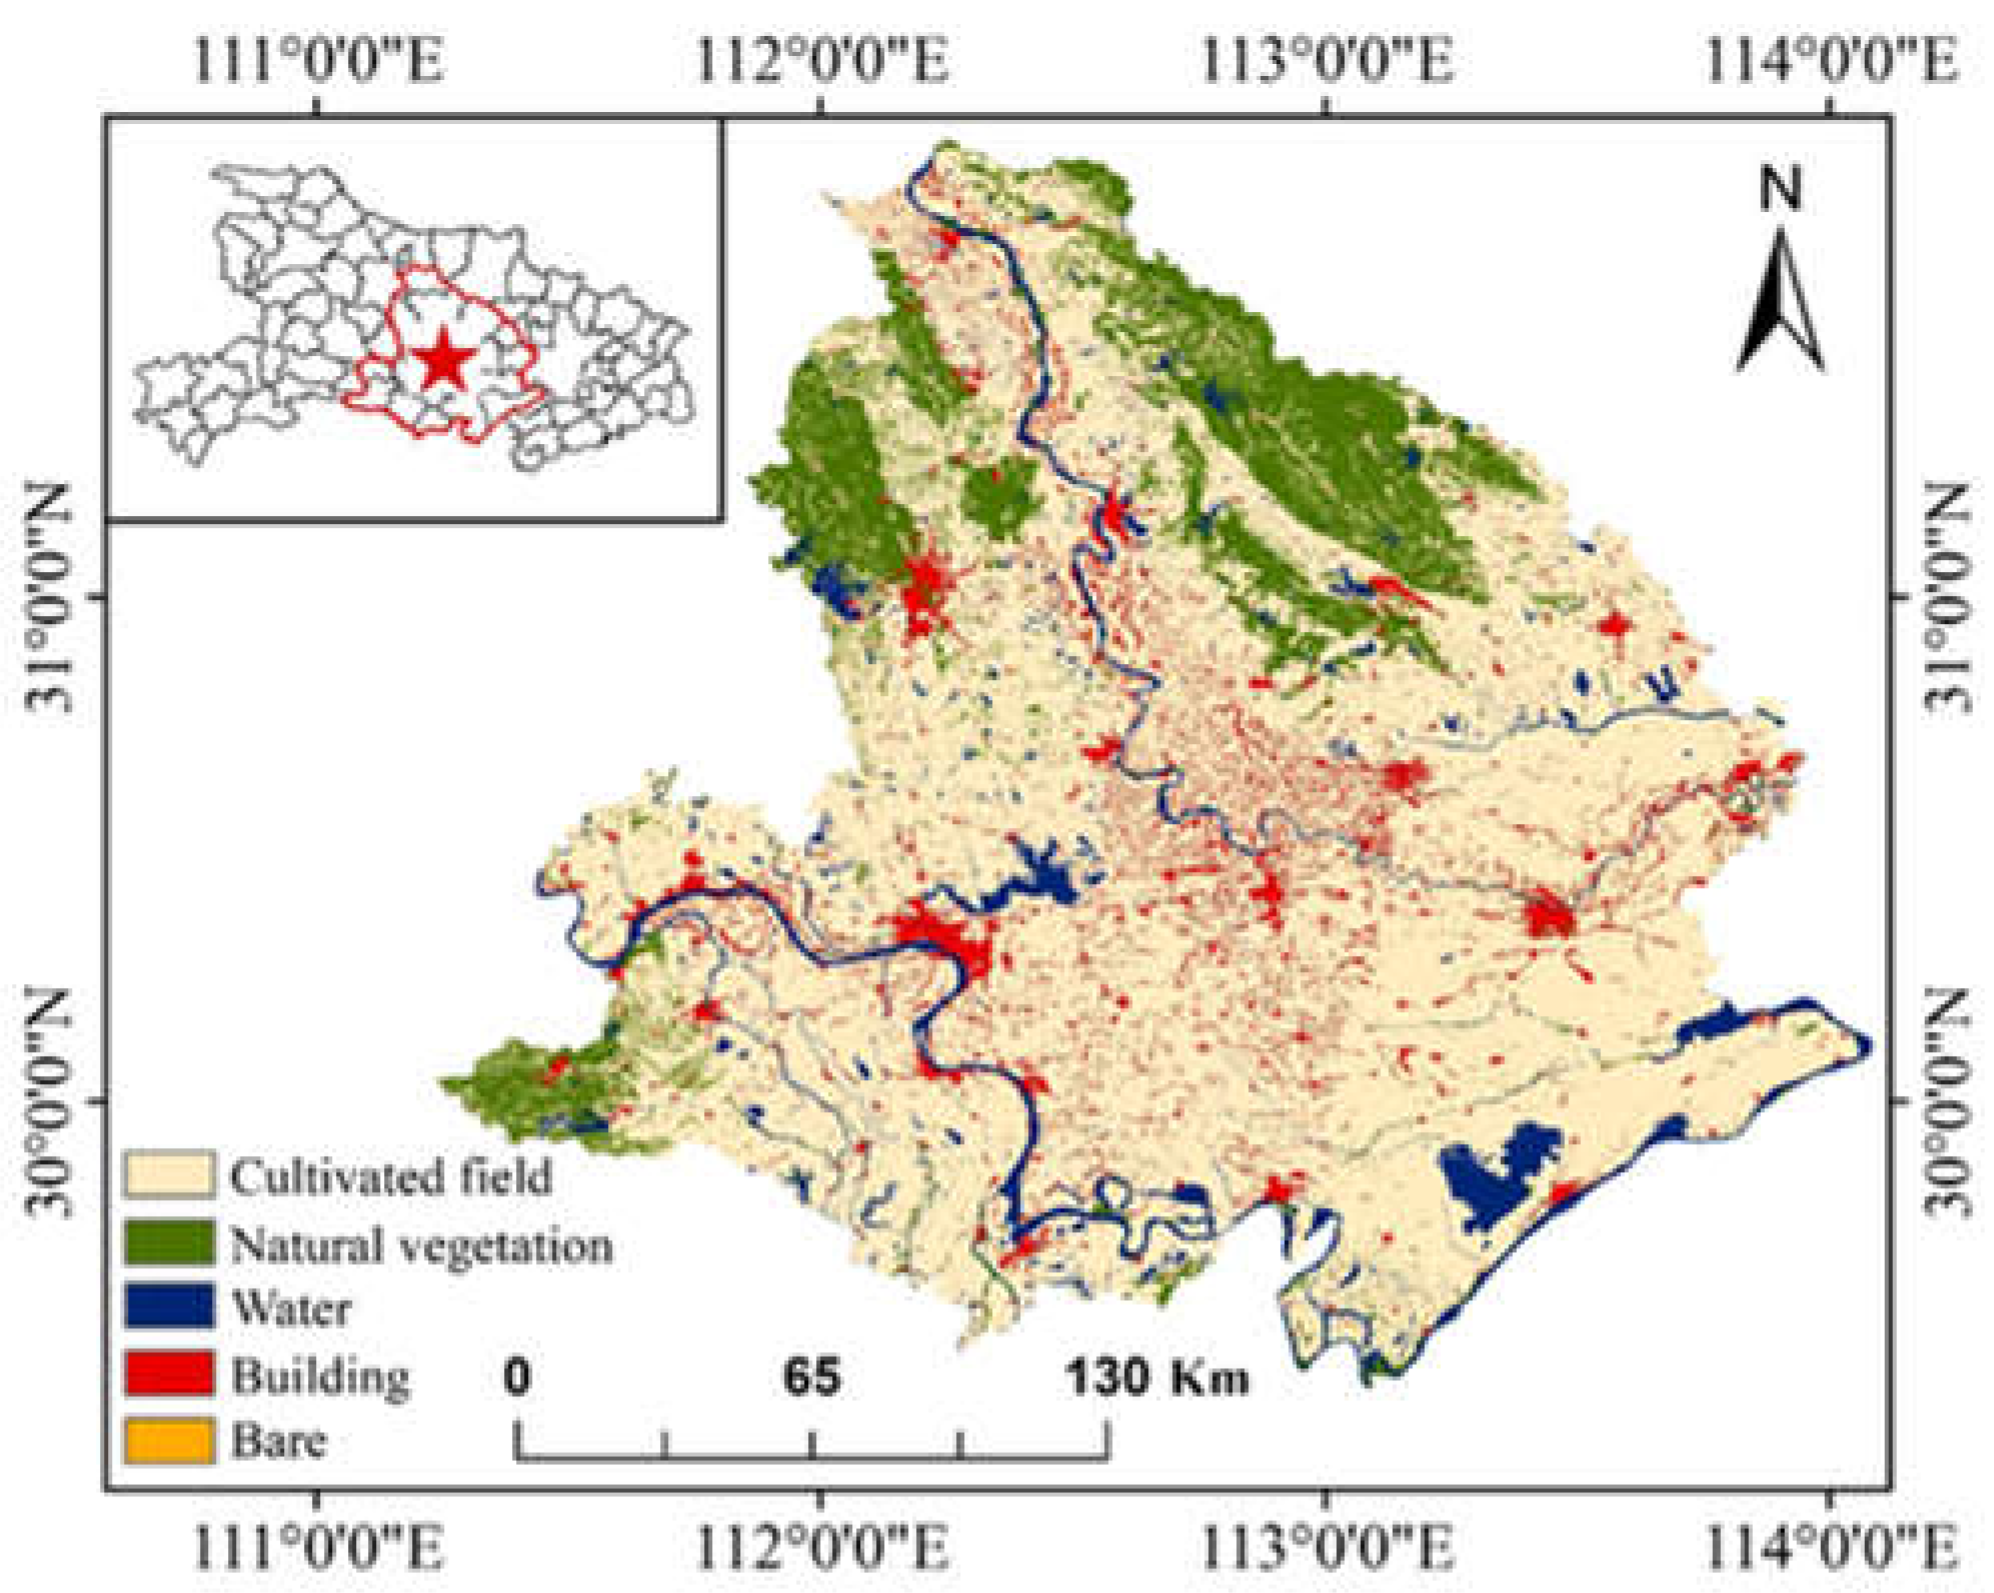
Figure 2.
Optical image coverage and spatial distribution of samples in Jianghan Plain from 2017 to 2022.
Figure 2.
Optical image coverage and spatial distribution of samples in Jianghan Plain from 2017 to 2022.
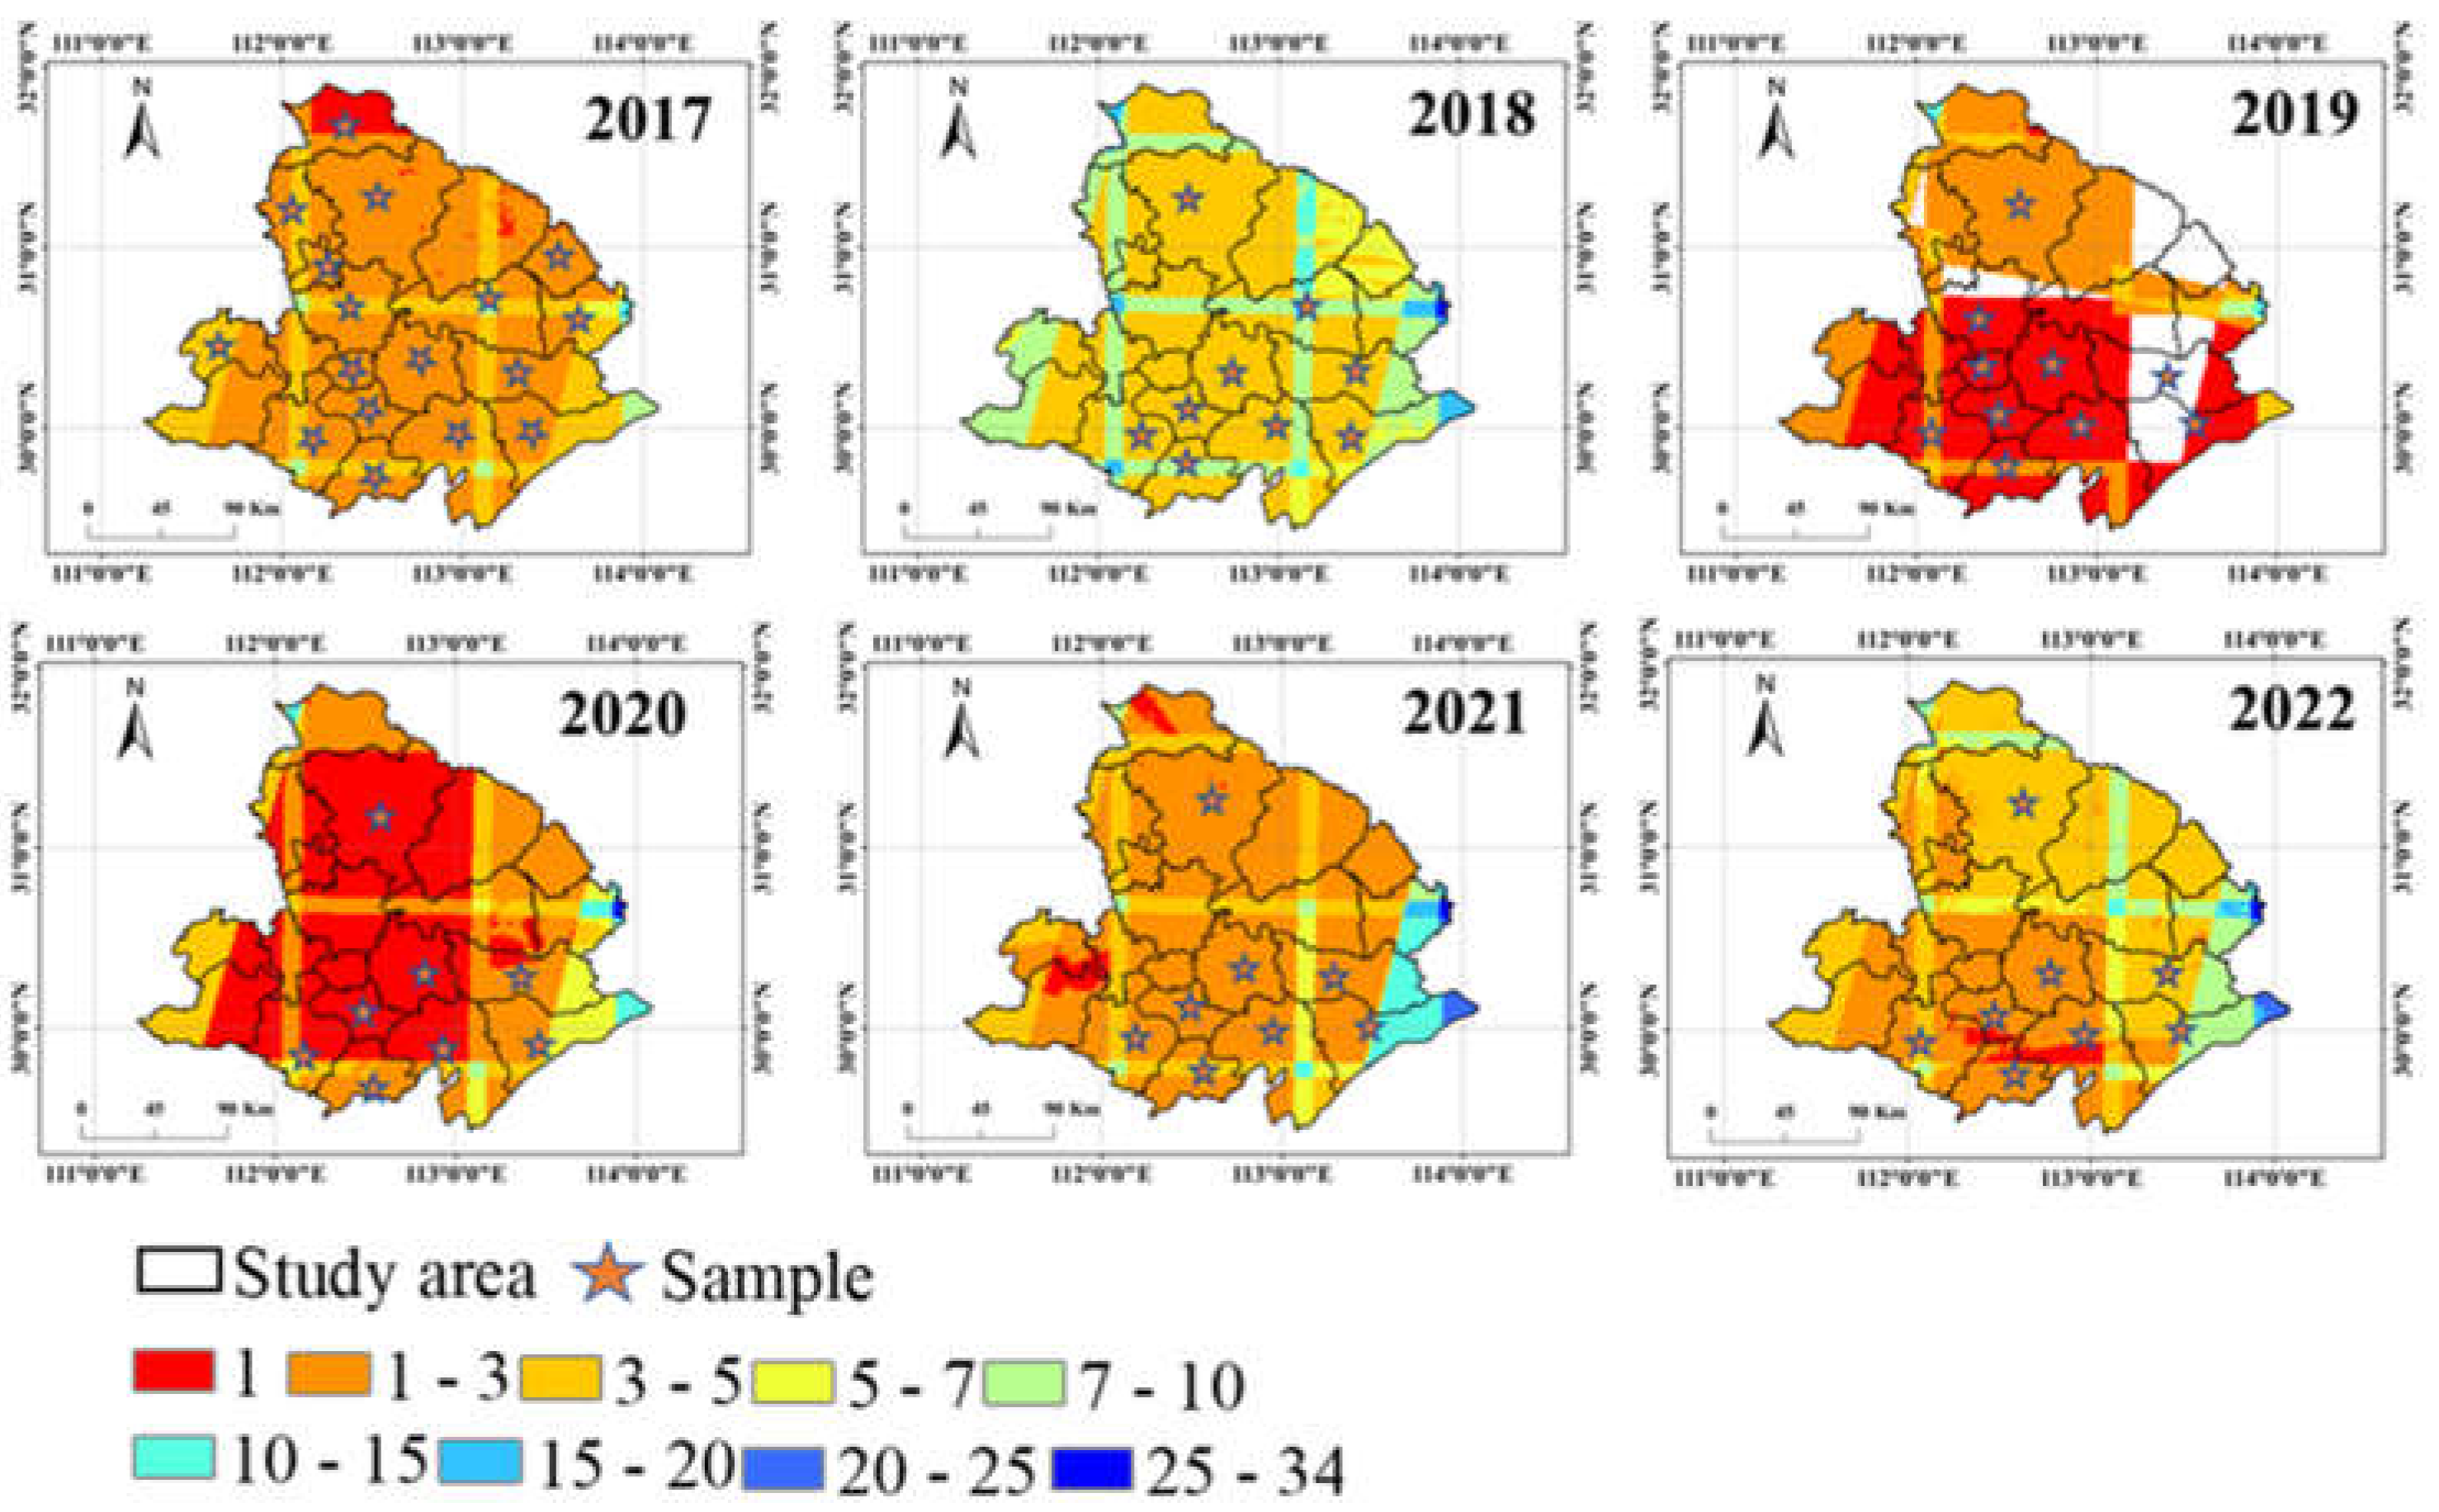
Figure 3.
RGB images showing phenological stages of winter canola in the experiment.
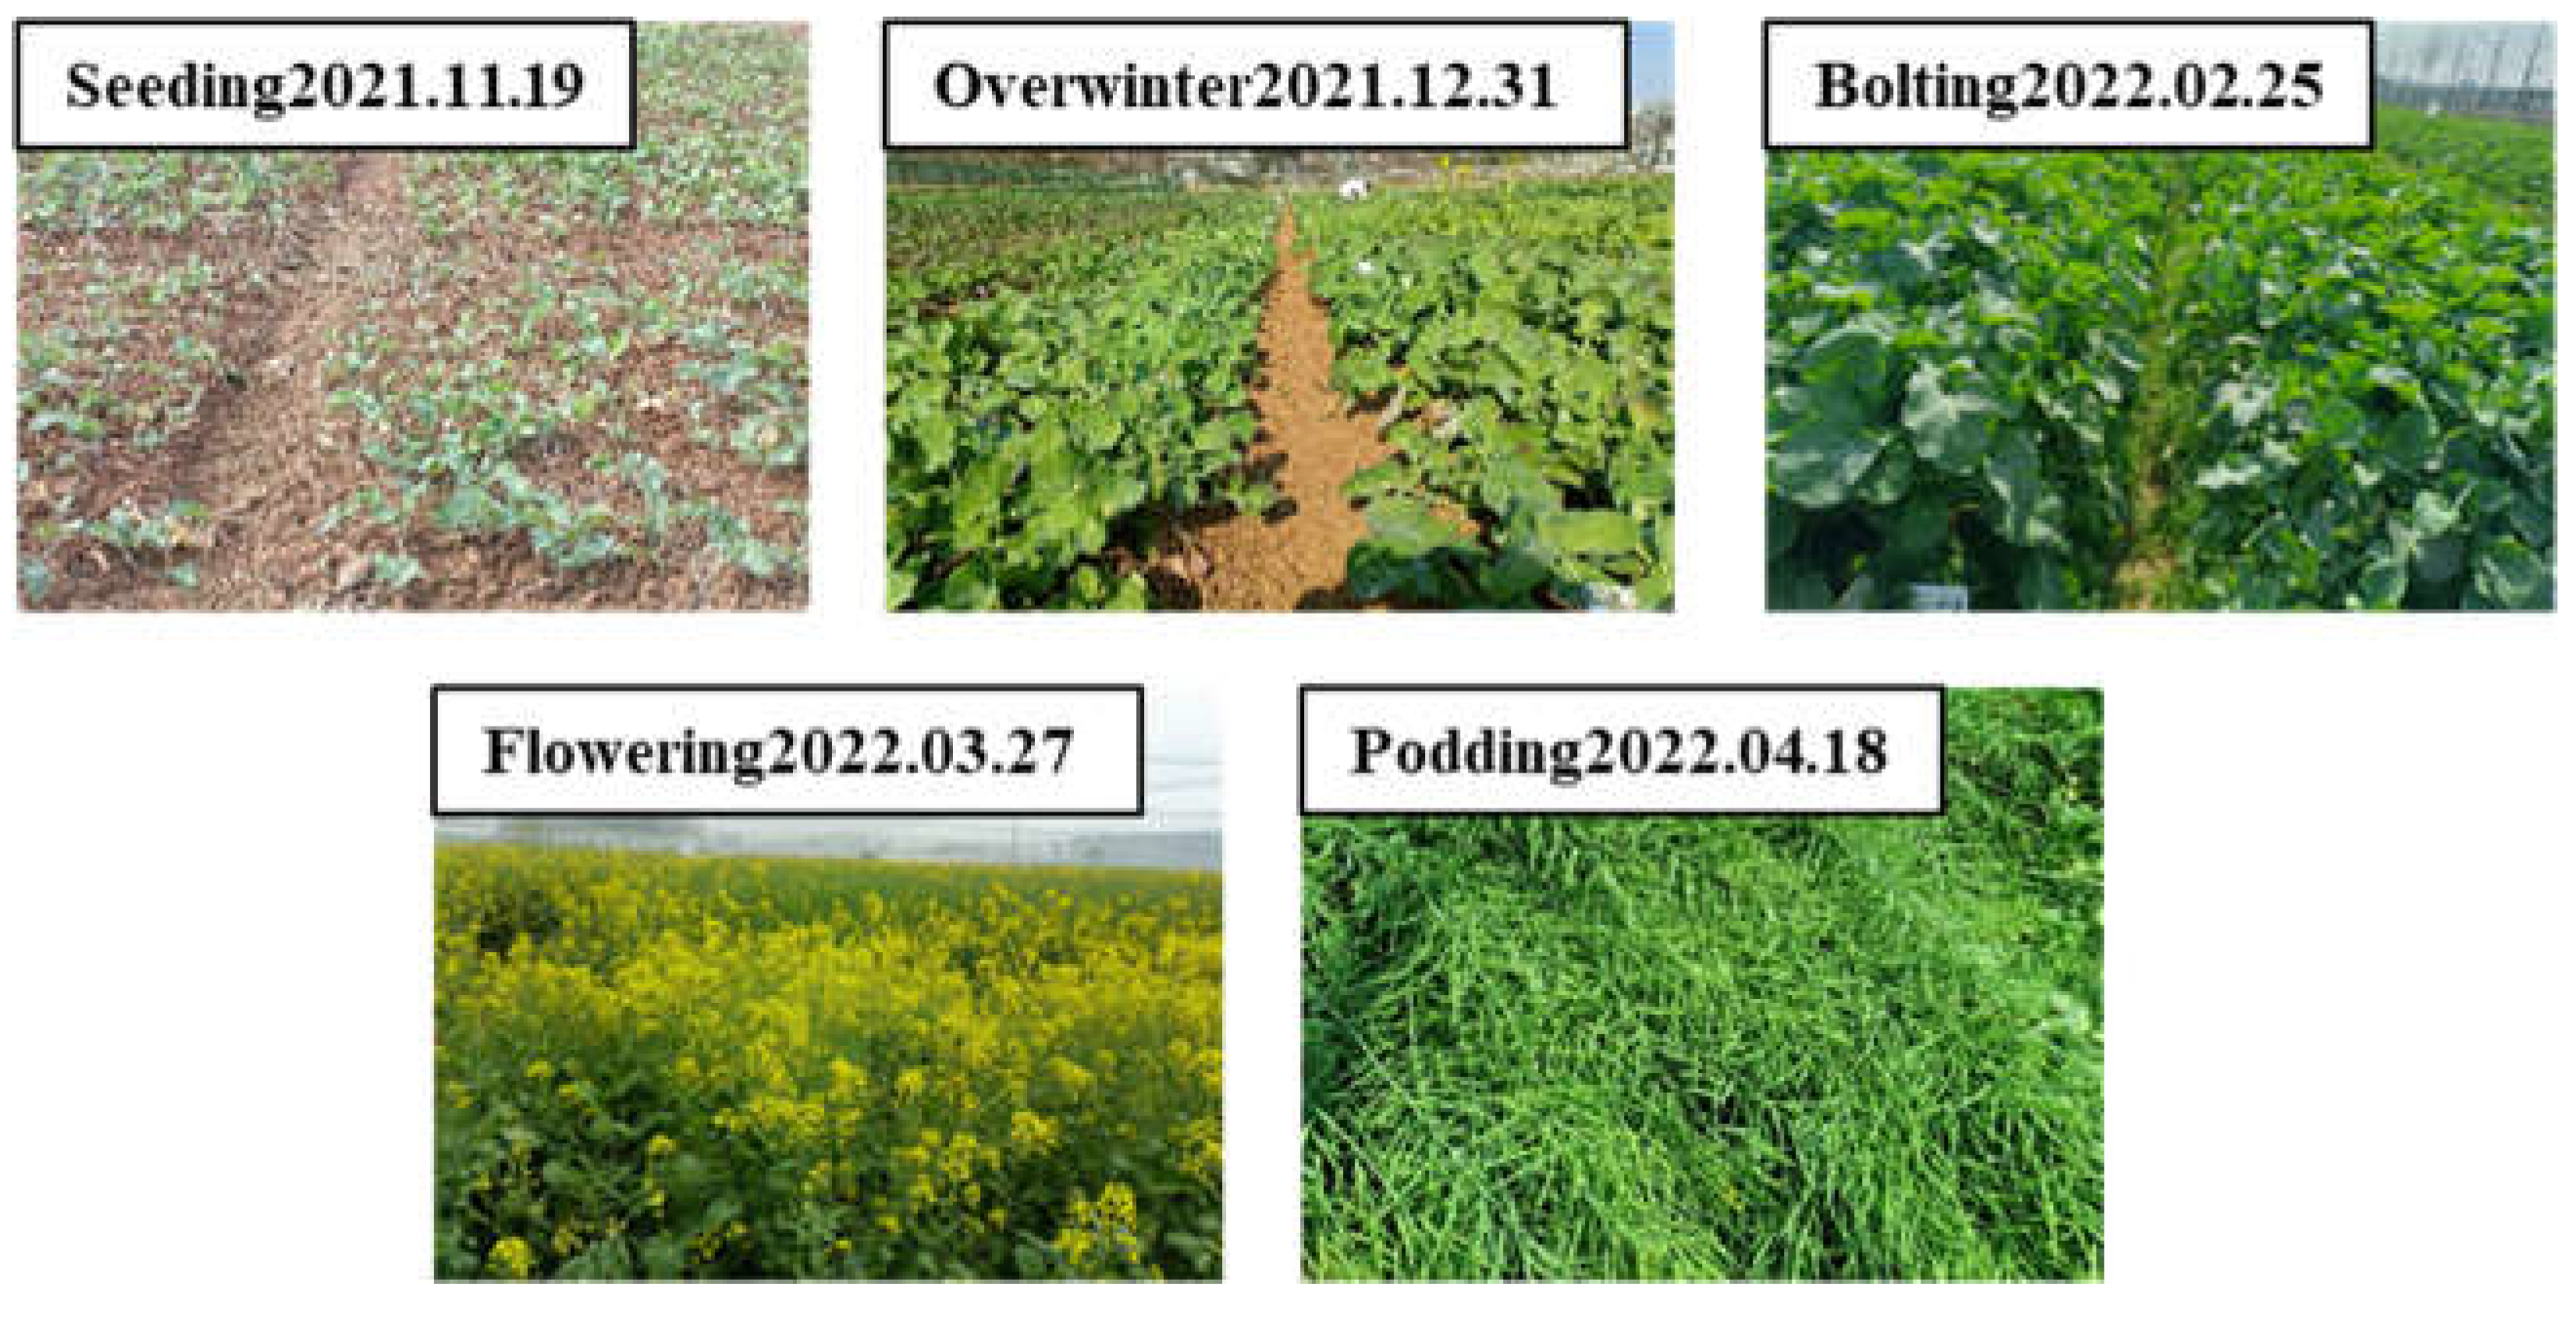
Figure 4.
Flowchart of the study.
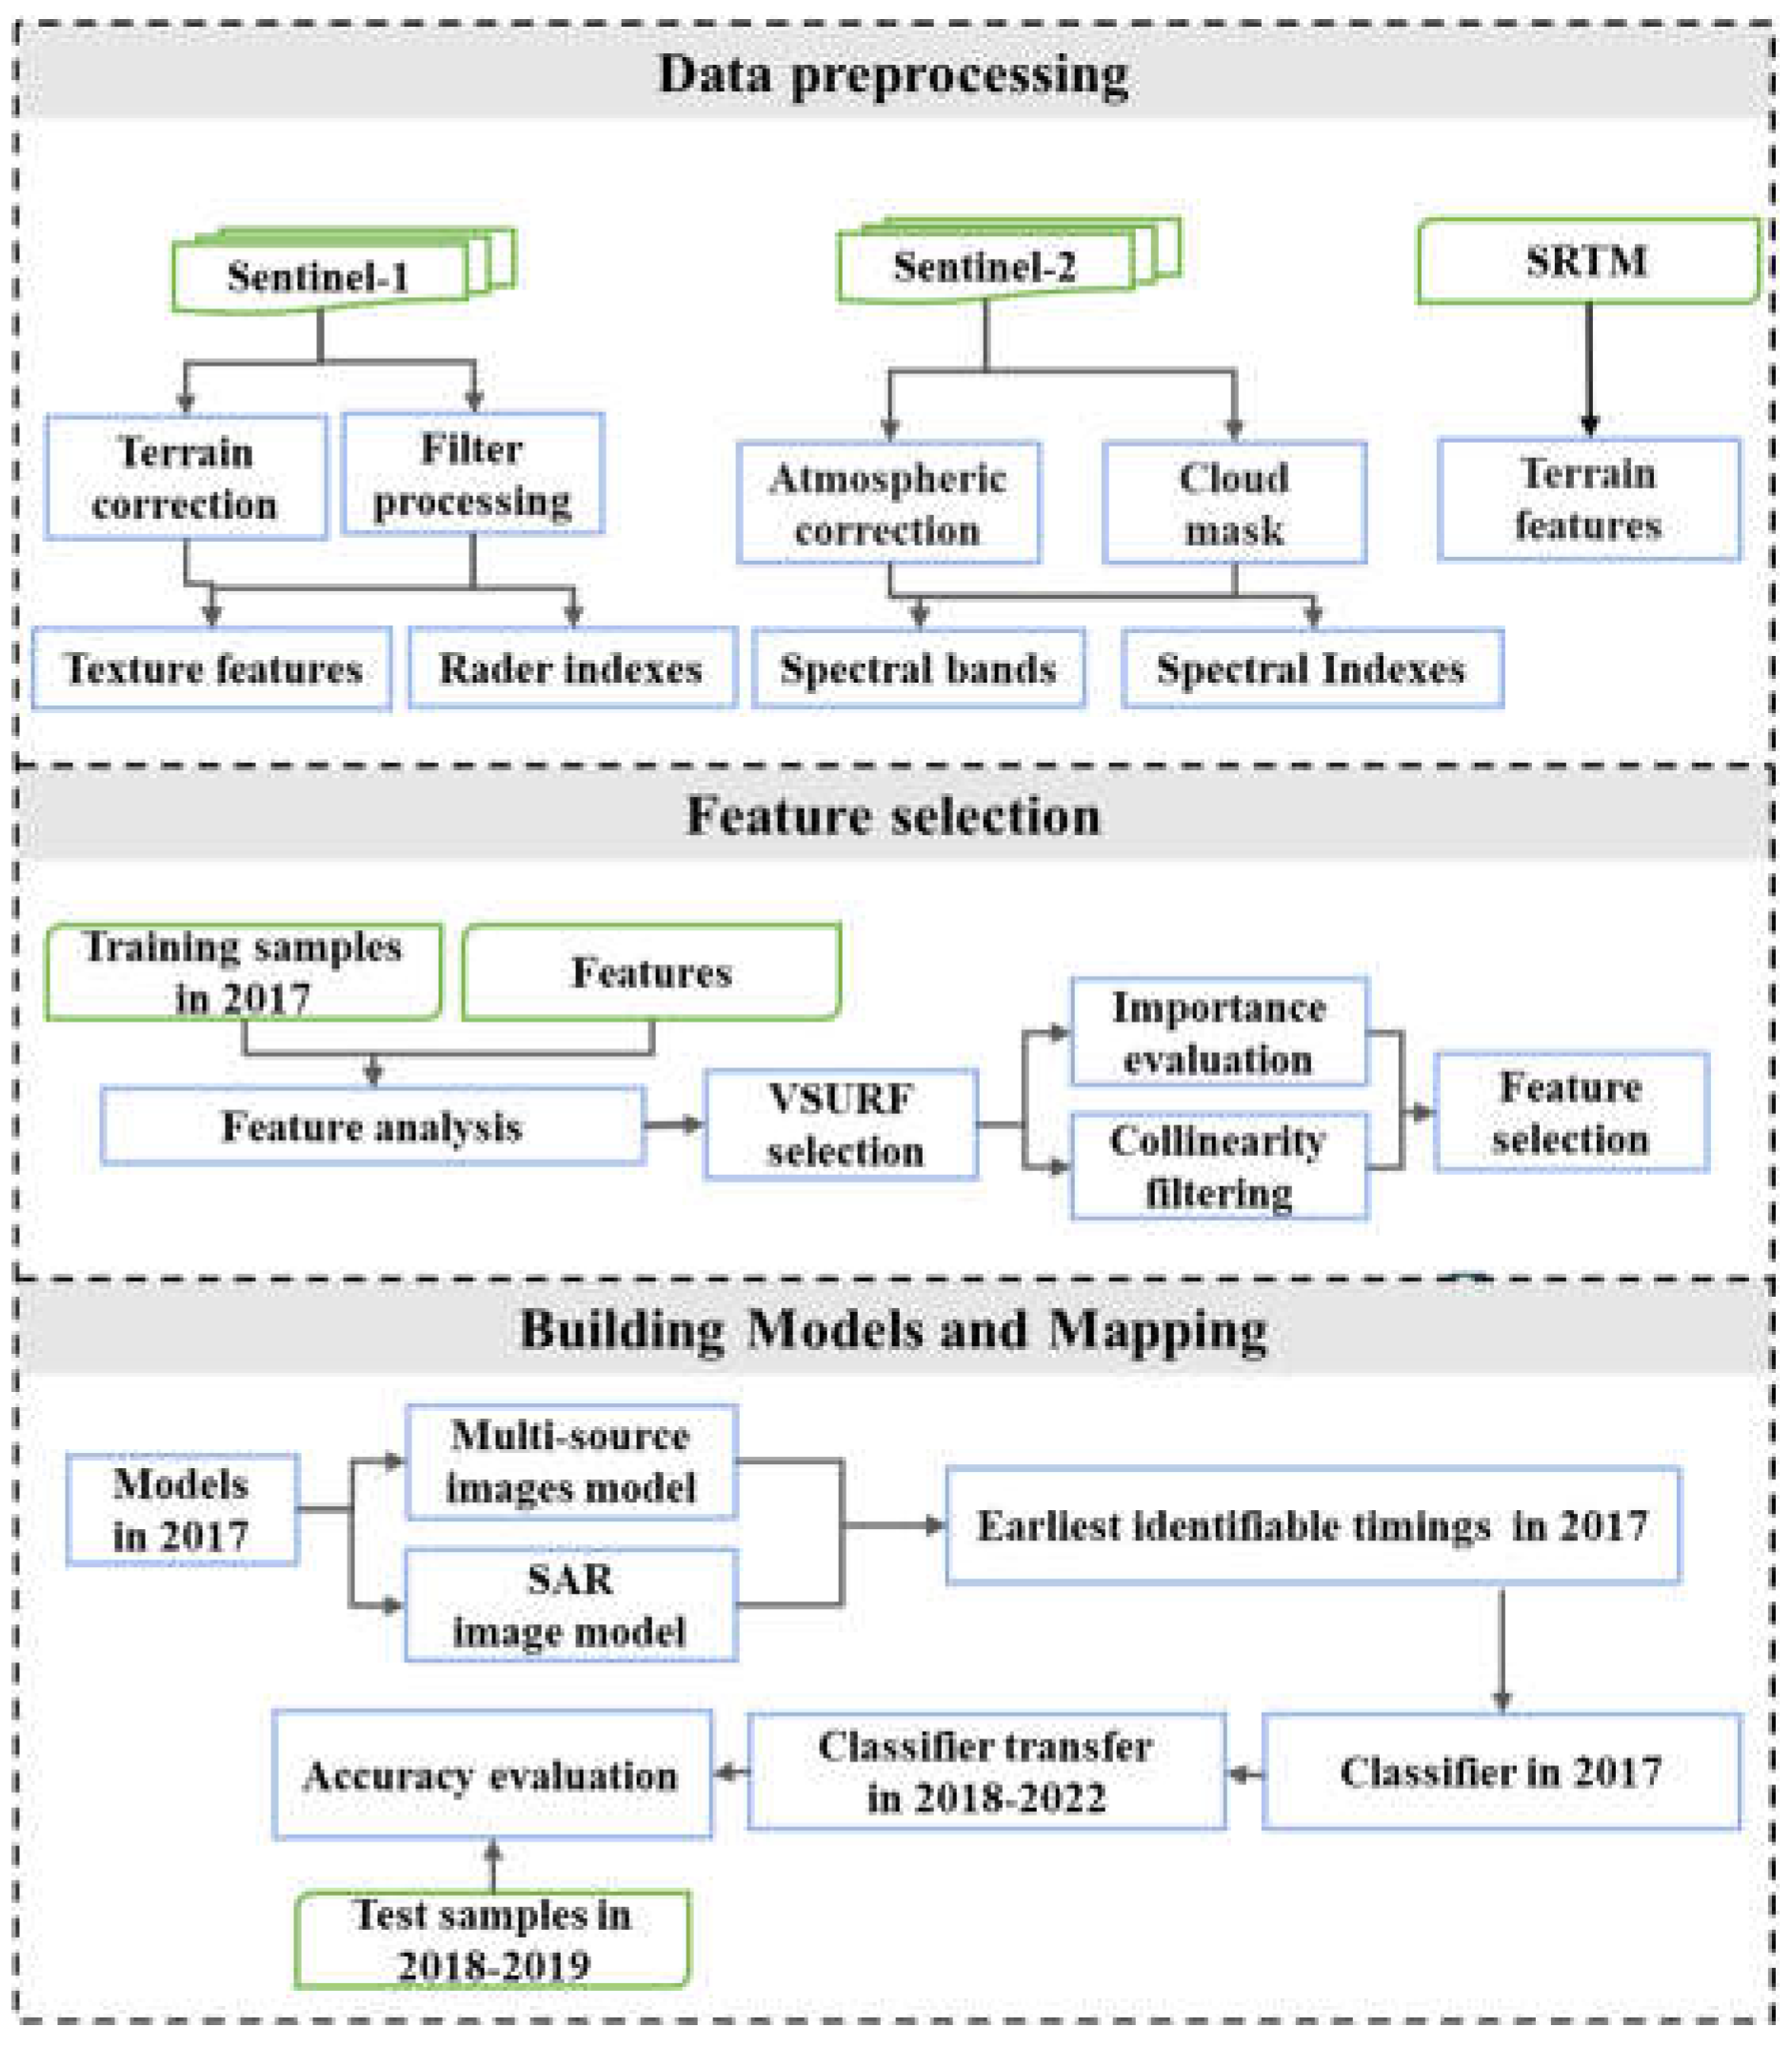
Figure 5.
Backscatter coefficient distributions of winter canola during different phenological stages across different land types.
Figure 5.
Backscatter coefficient distributions of winter canola during different phenological stages across different land types.
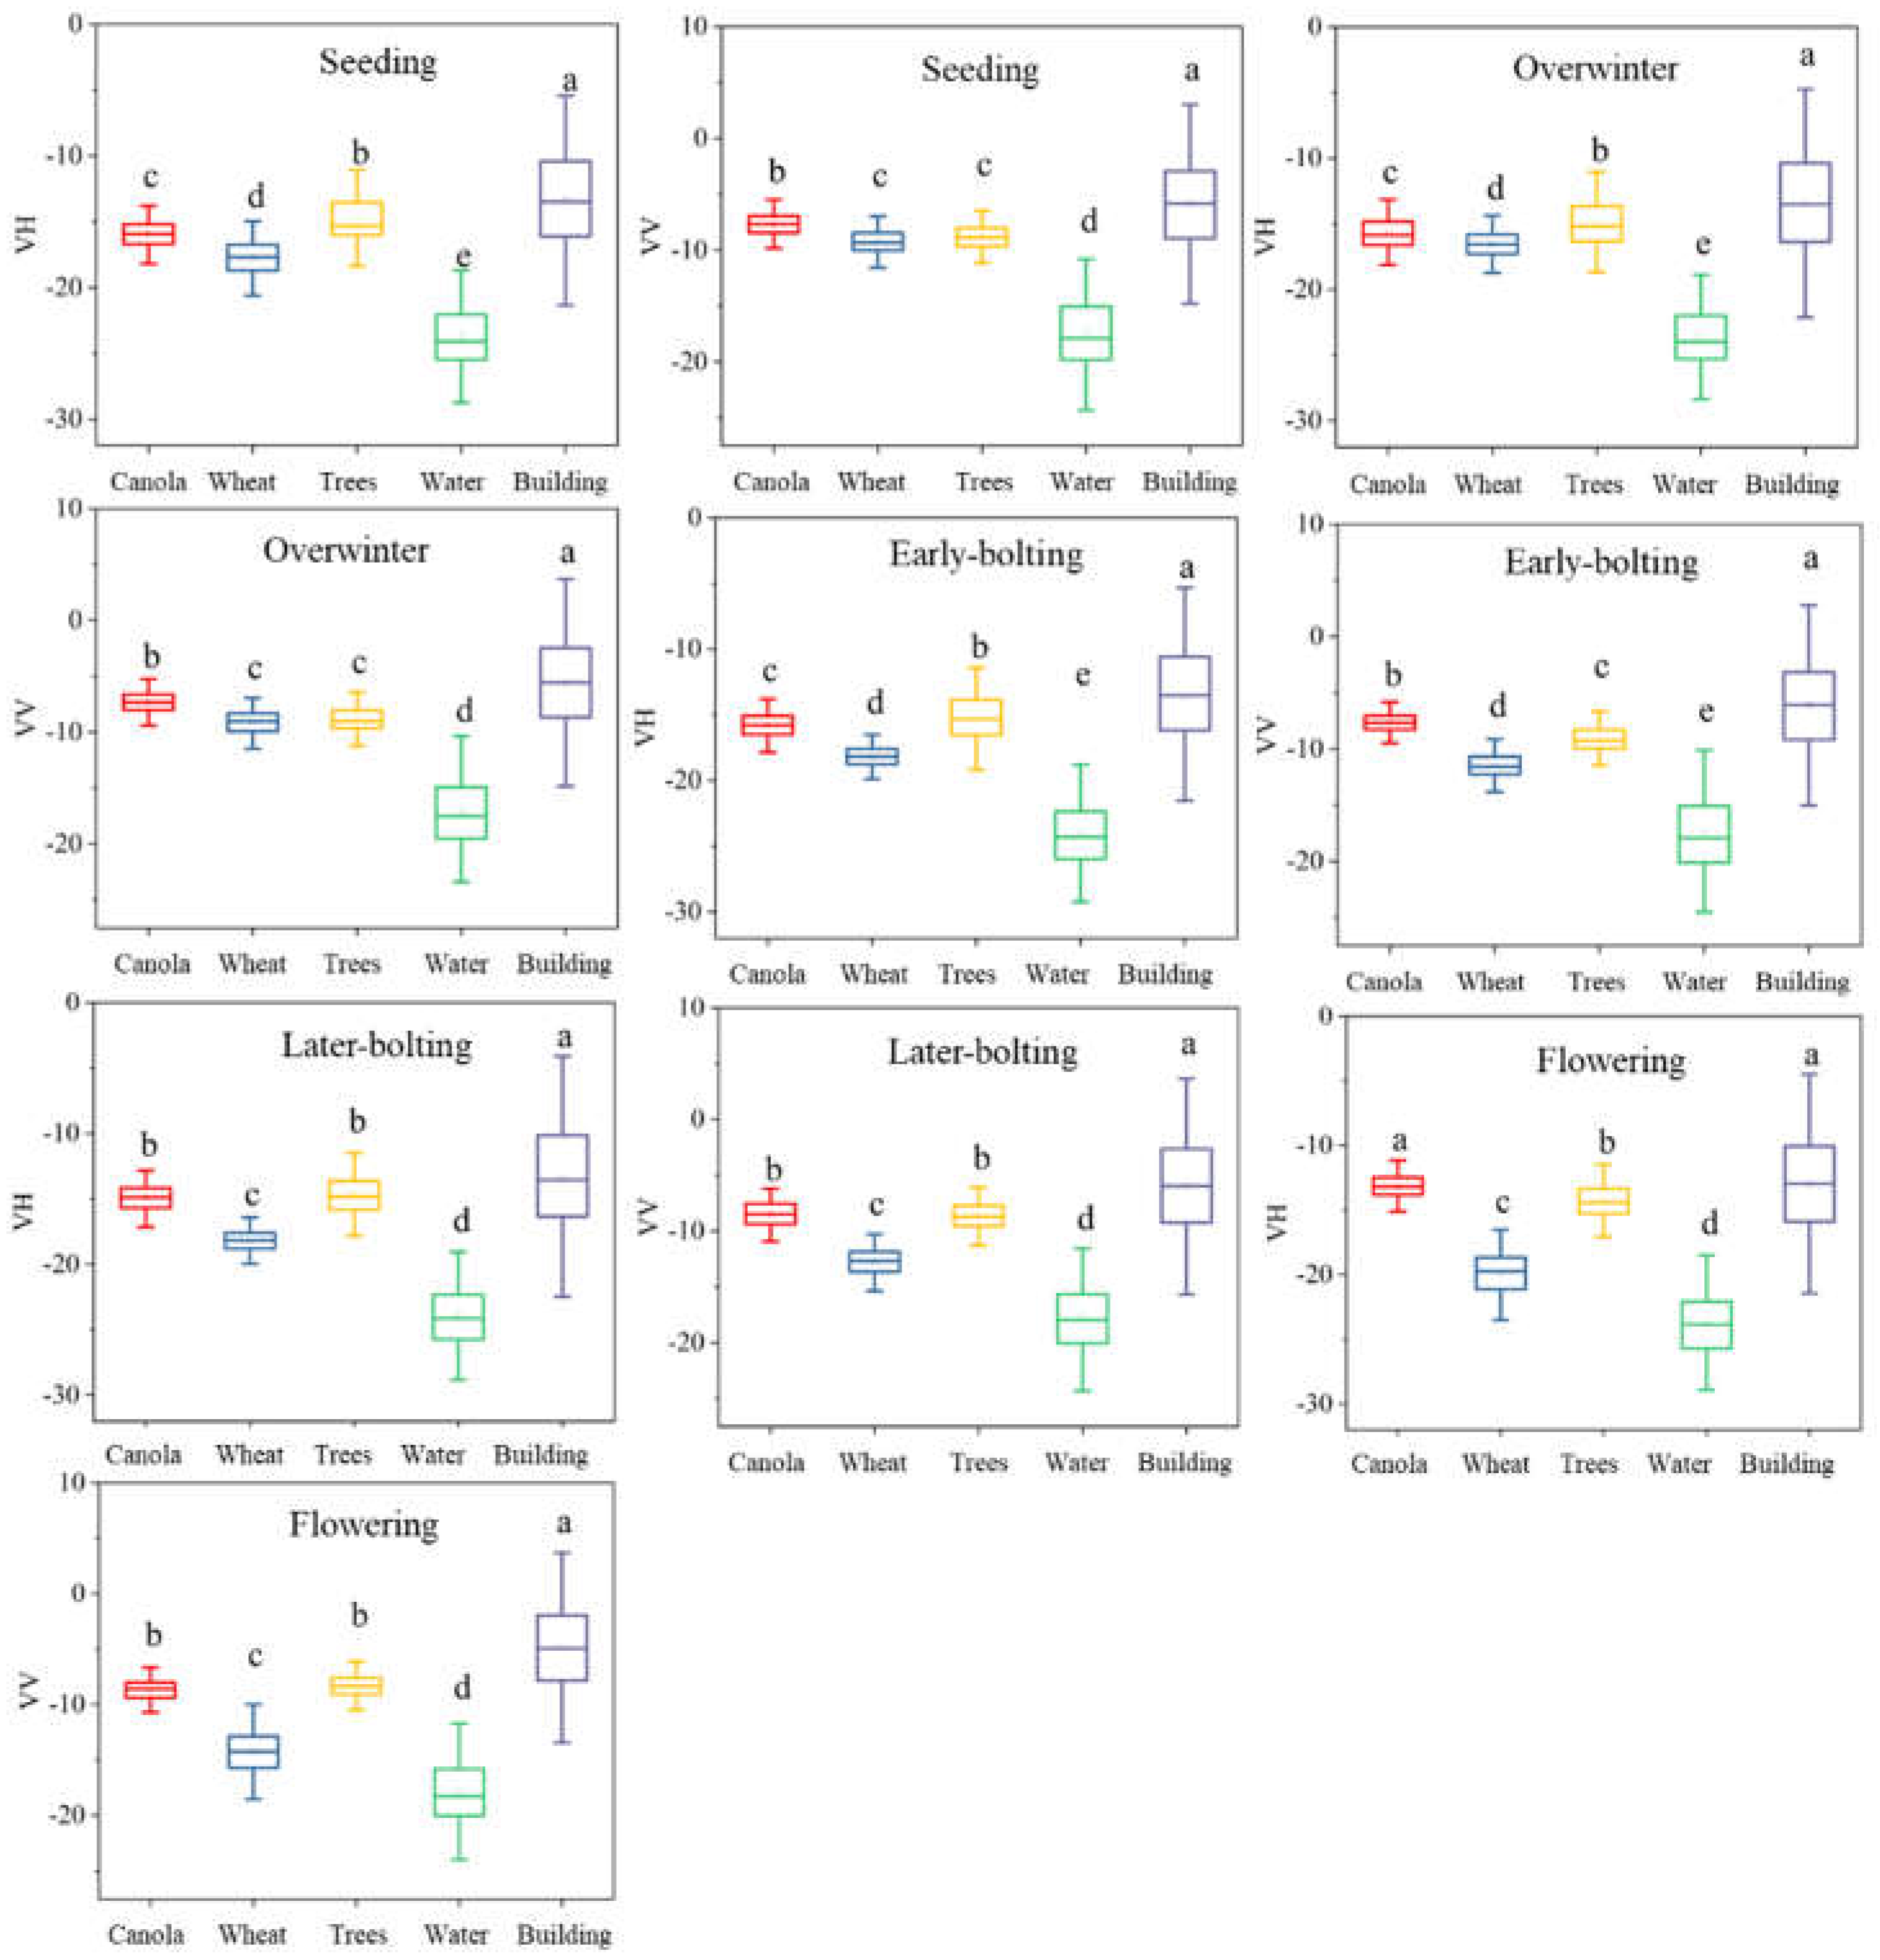
Figure 6.
Textural features of winter canola and other land types at different phenological stages.
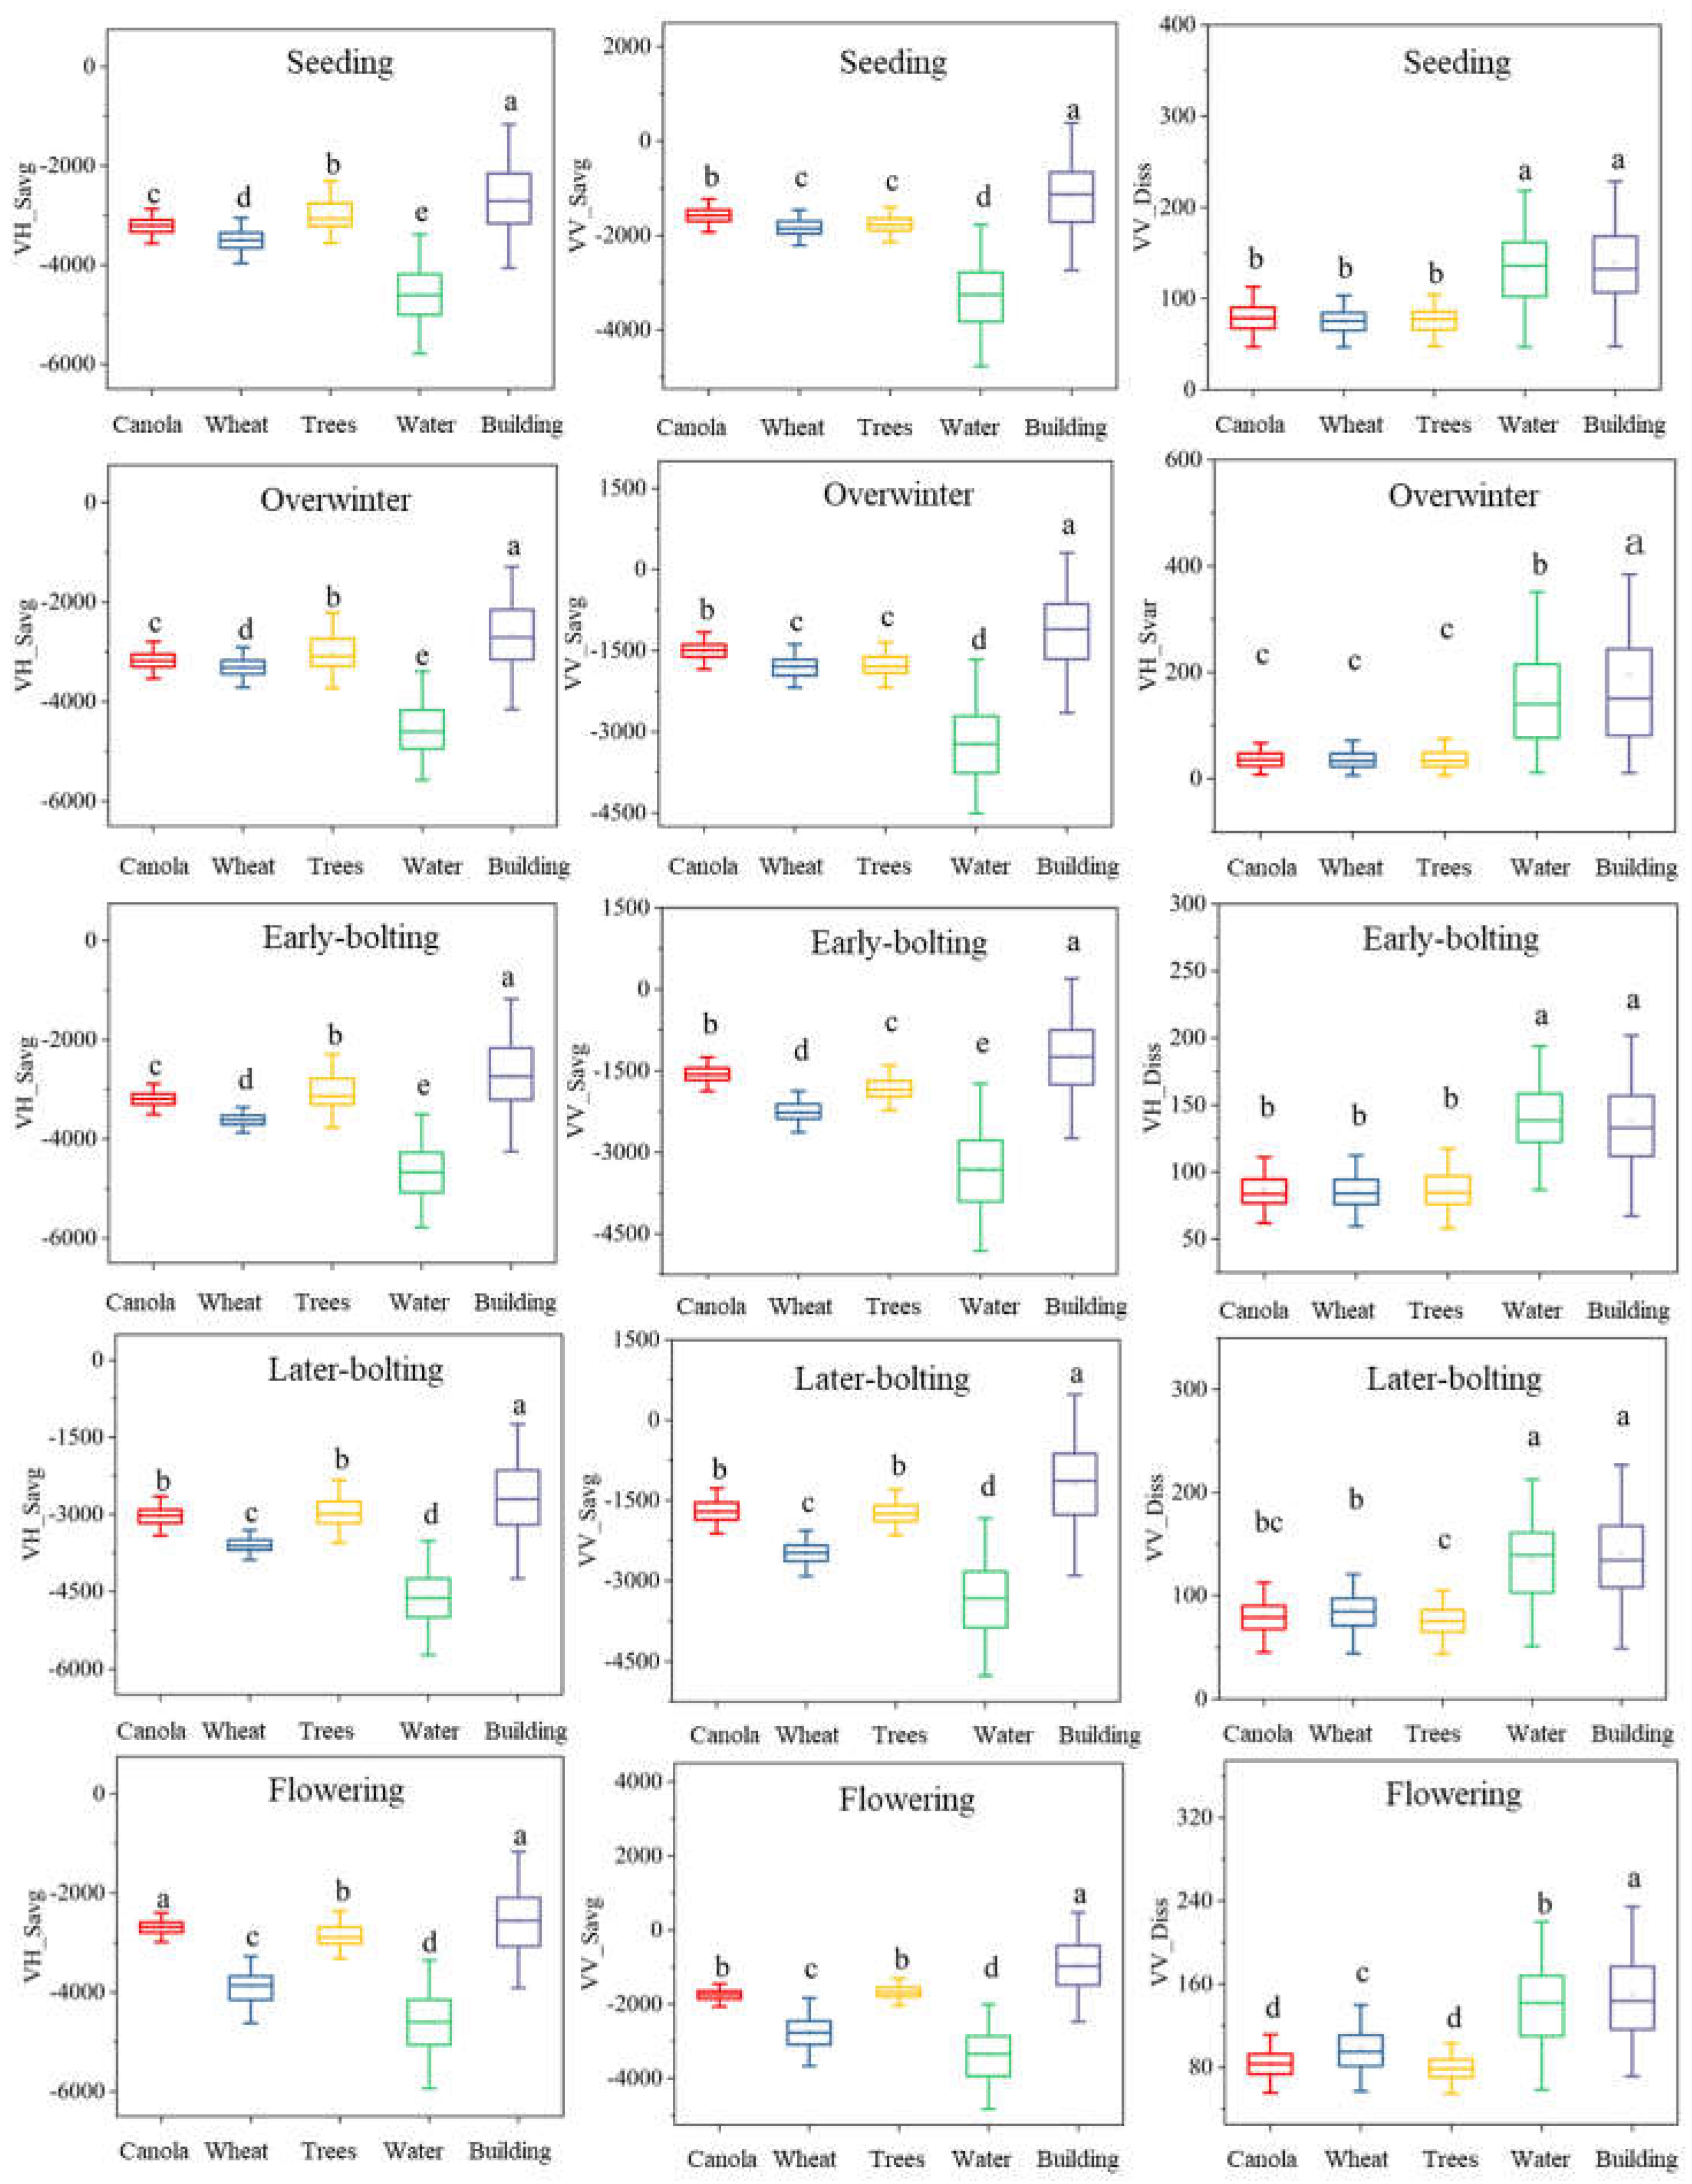
Figure 7.
Spectral features and significant difference tests of land types at different phenological stages.
Figure 7.
Spectral features and significant difference tests of land types at different phenological stages.
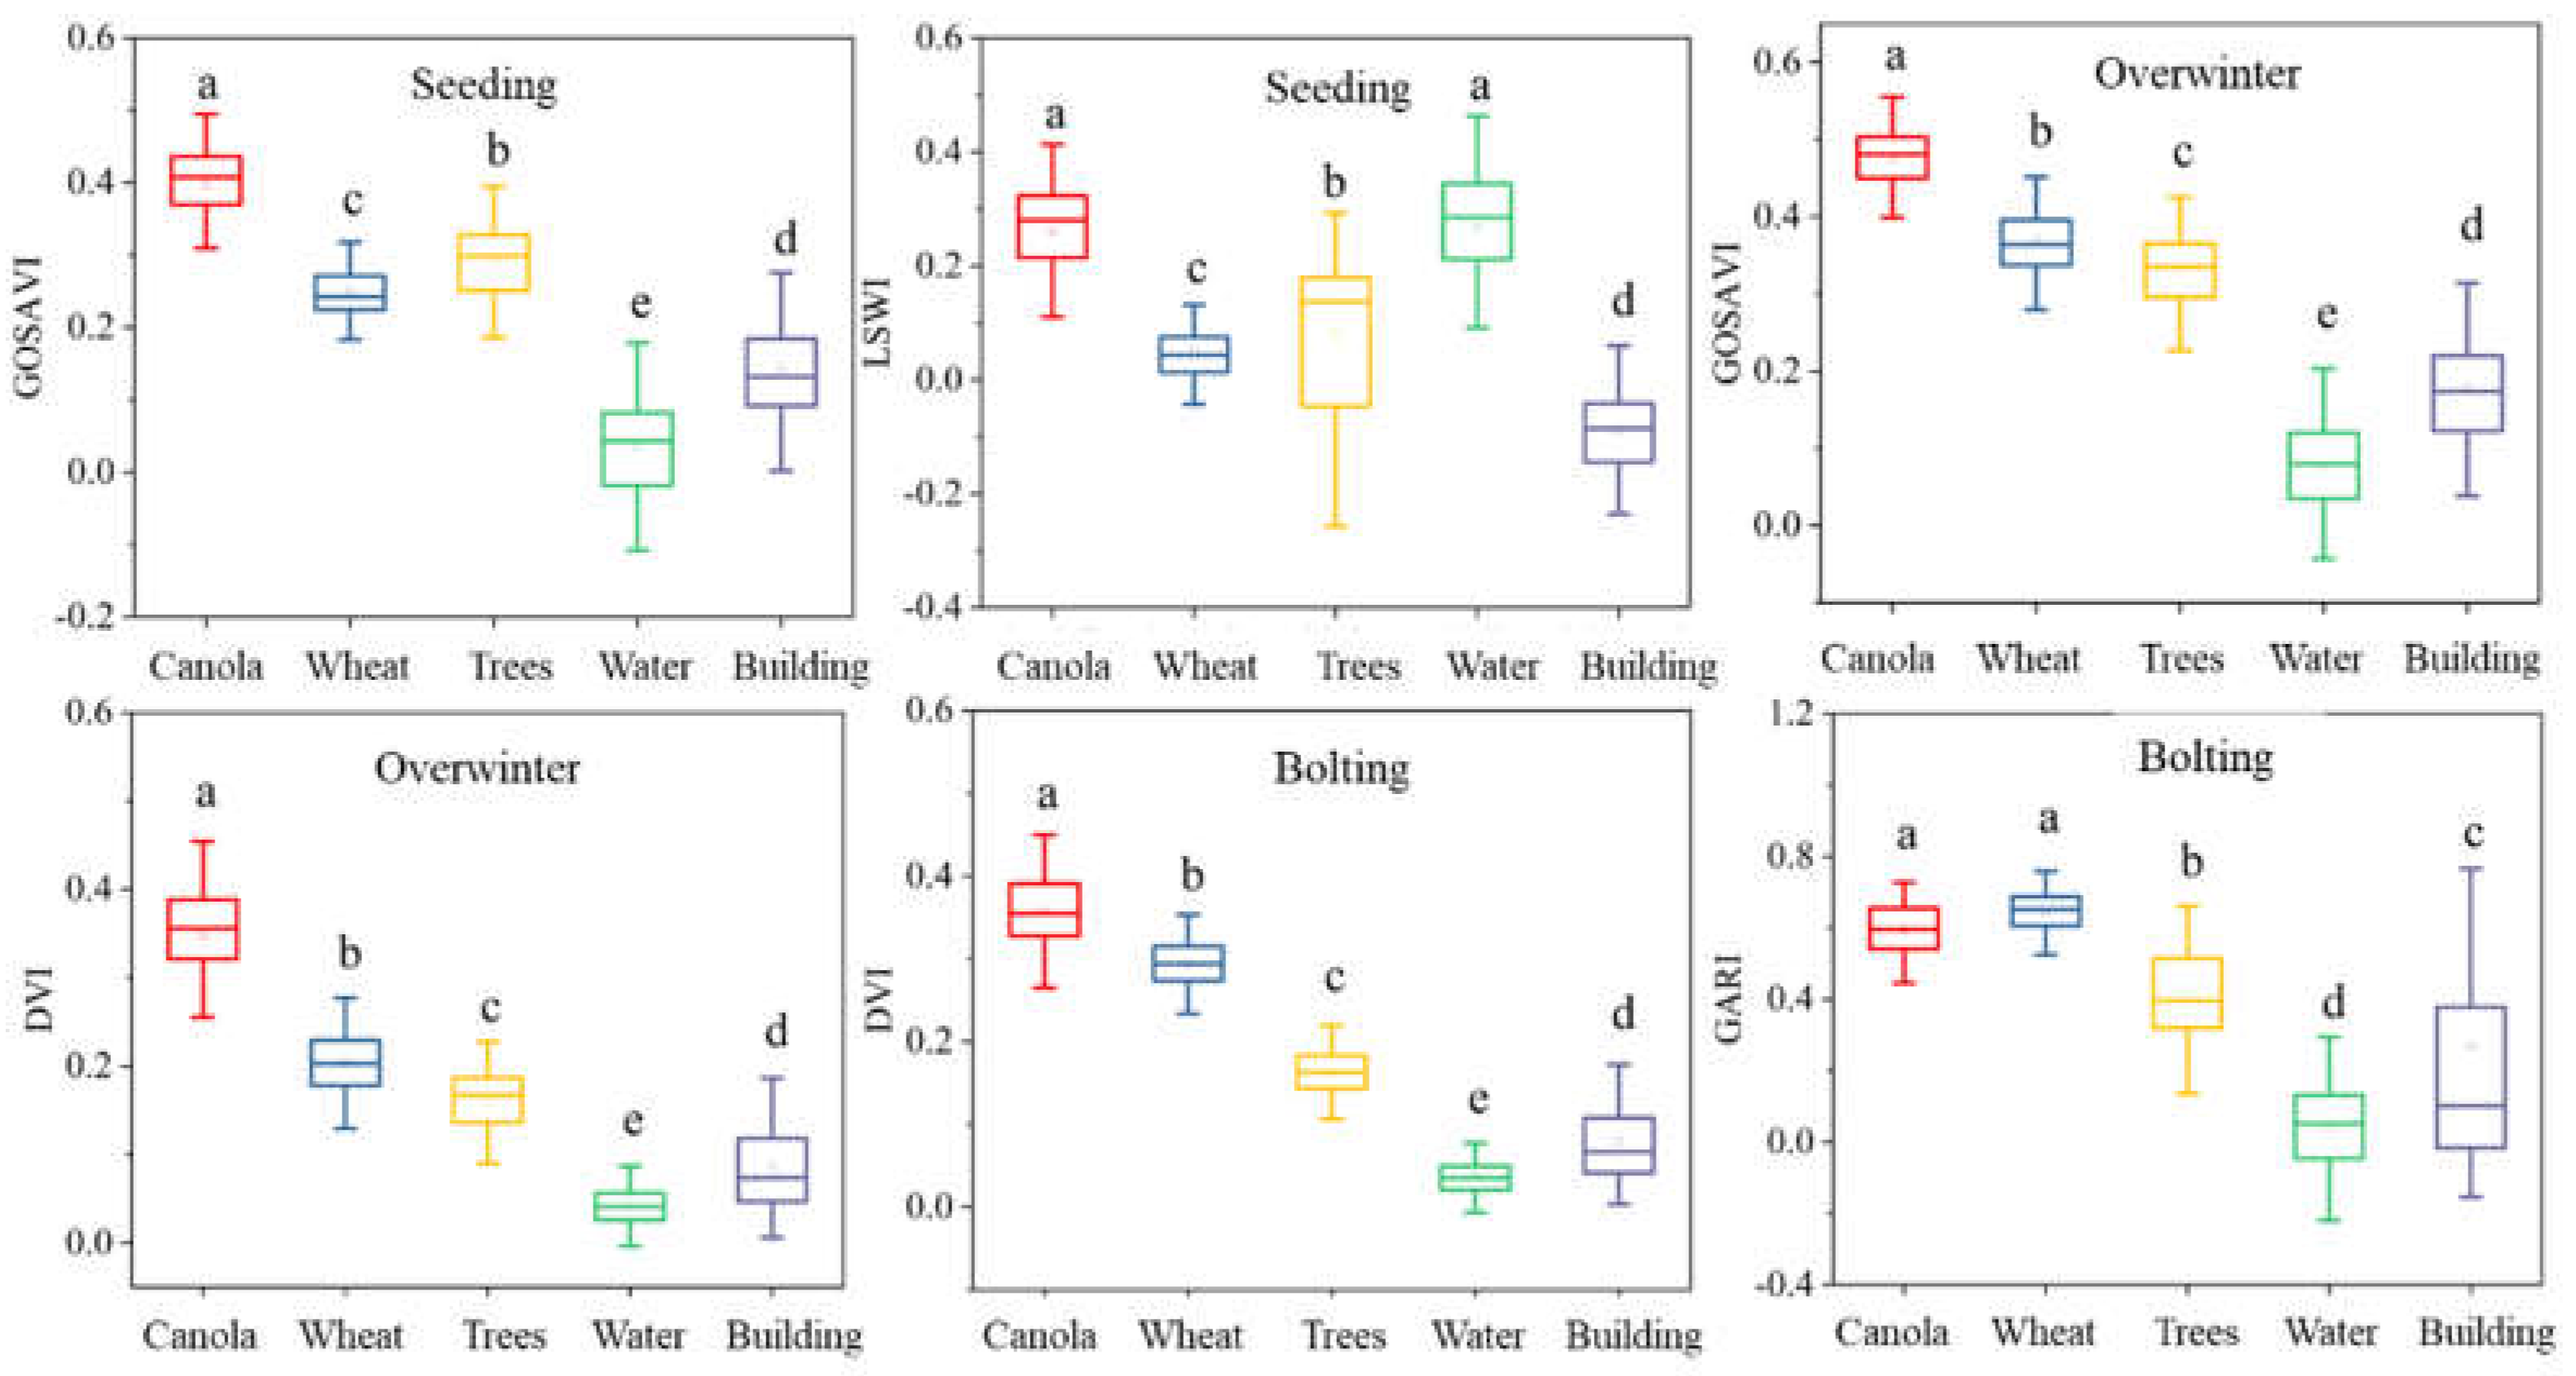
Figure 8.
Mapping accuracy of winter canola at different phenological stages based on Sentinel-1 data.
Figure 8.
Mapping accuracy of winter canola at different phenological stages based on Sentinel-1 data.
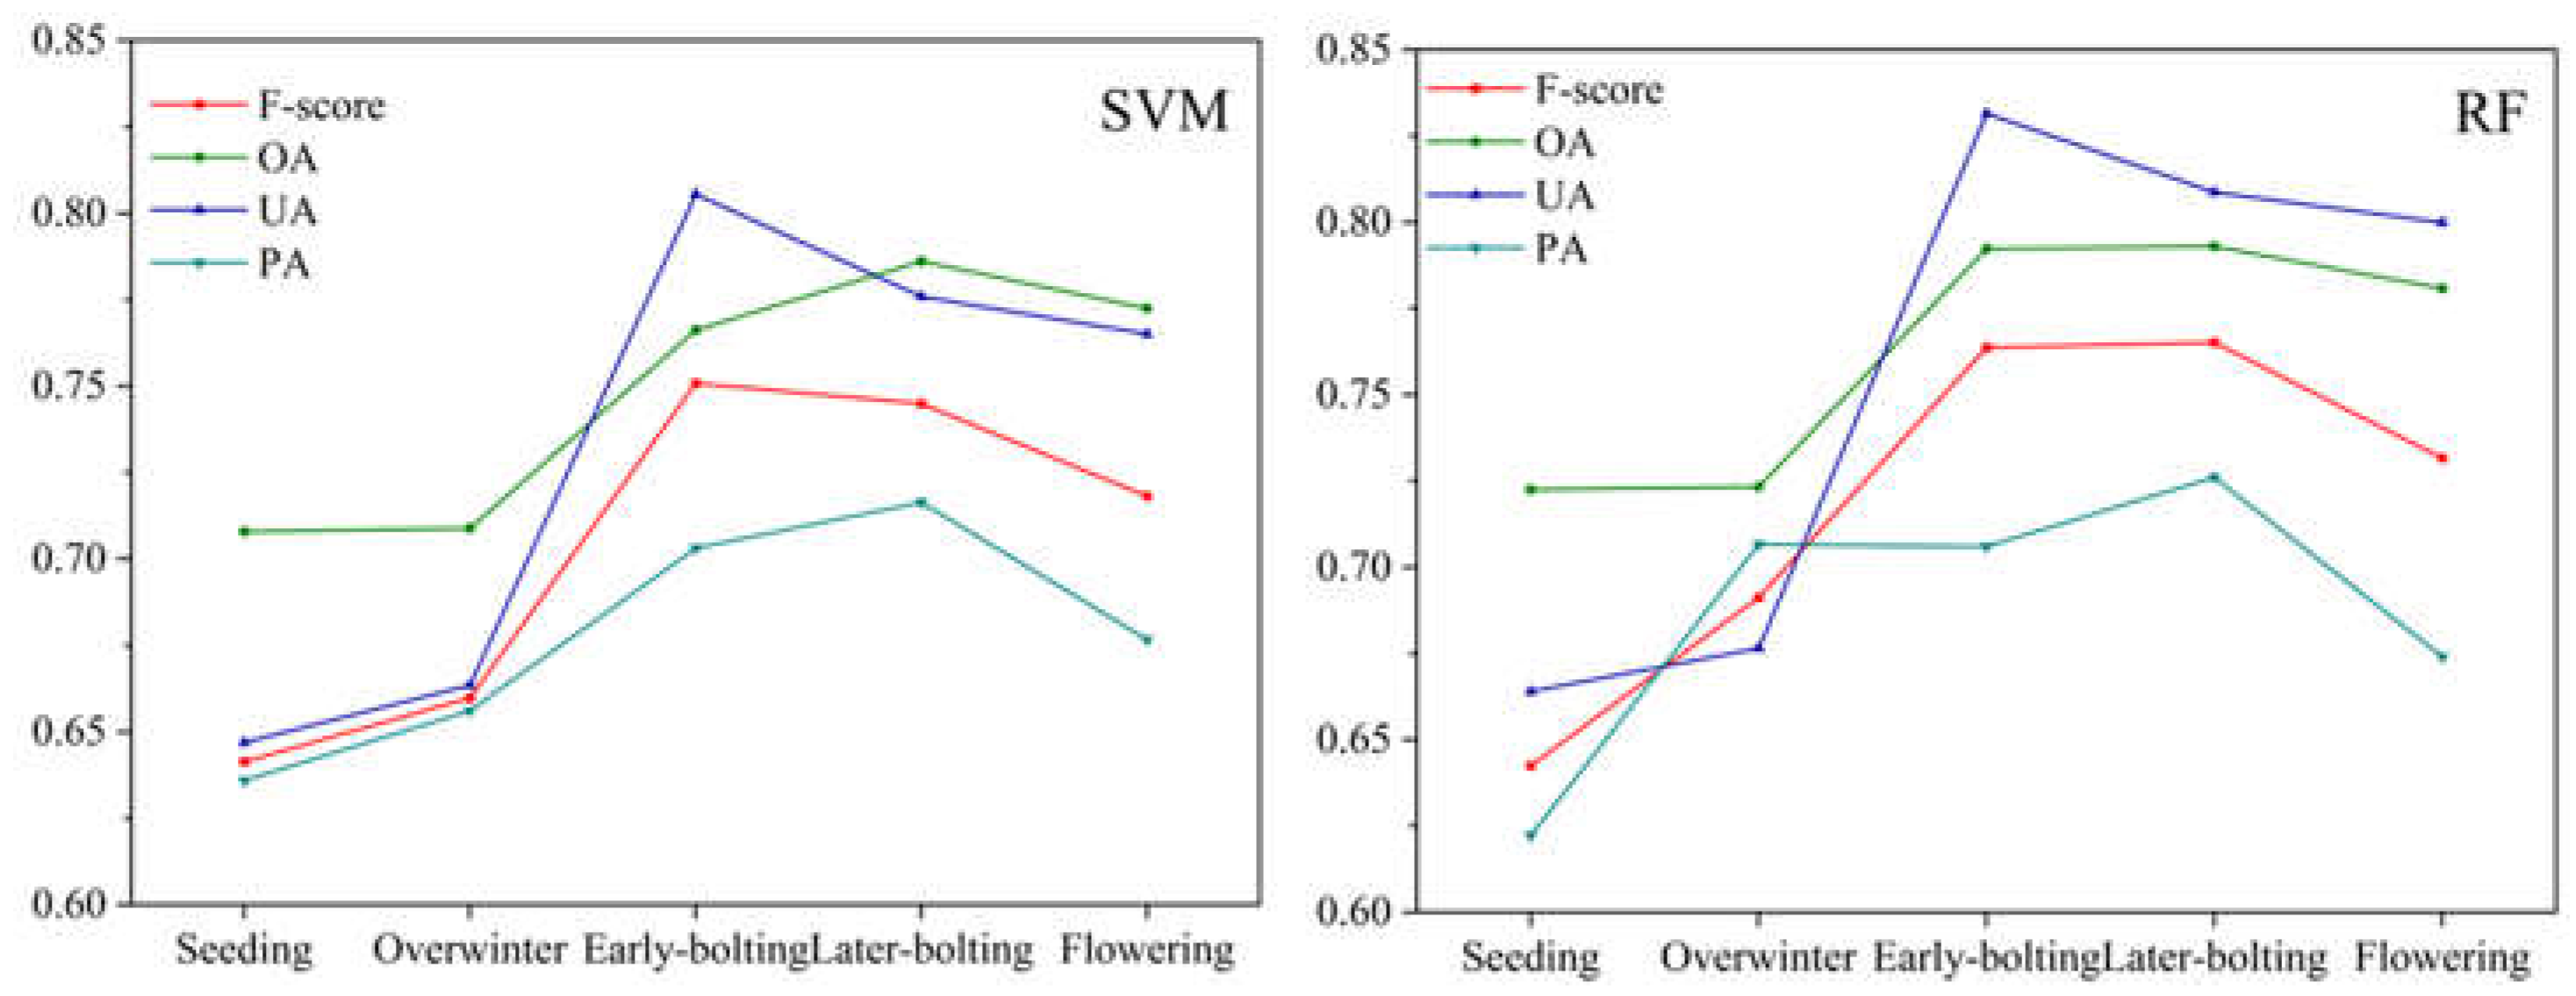
Figure 9.
Mapping accuracy of winter canola in 2018-2022 based Sentinel-1 and Sentinel-2 data.
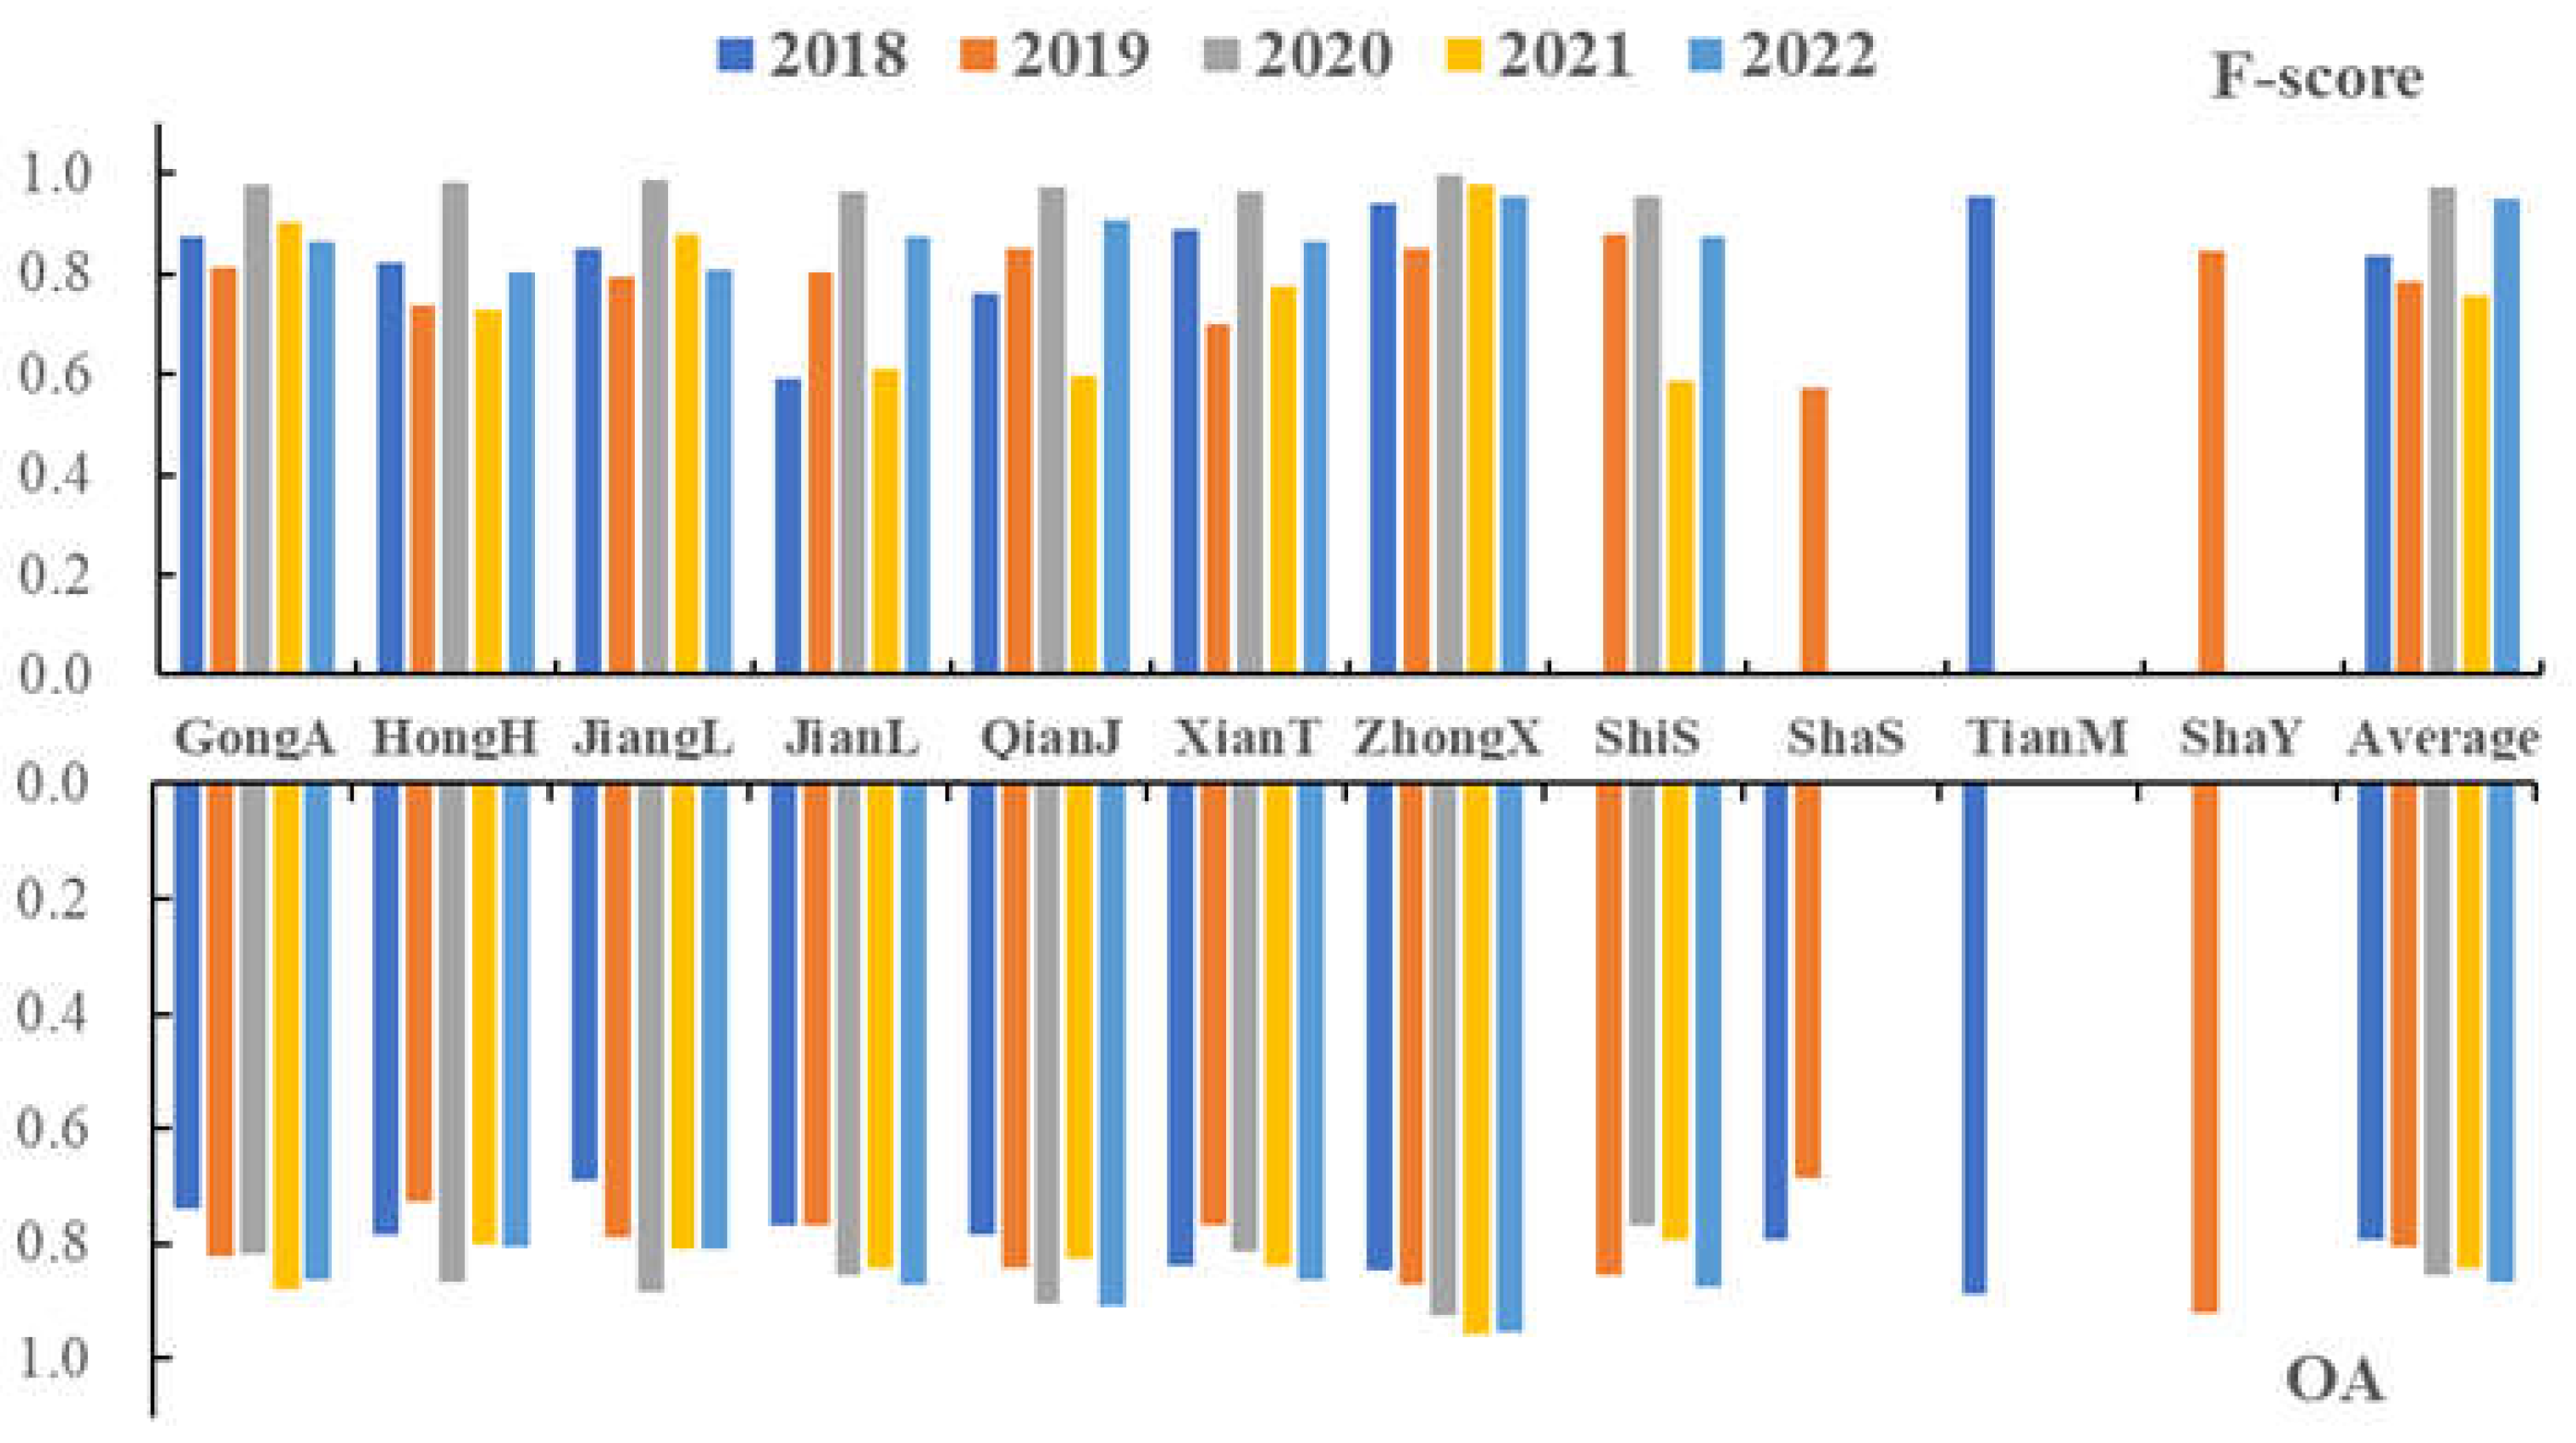
Figure 10.
Maps of winter canola in 2017–2022.
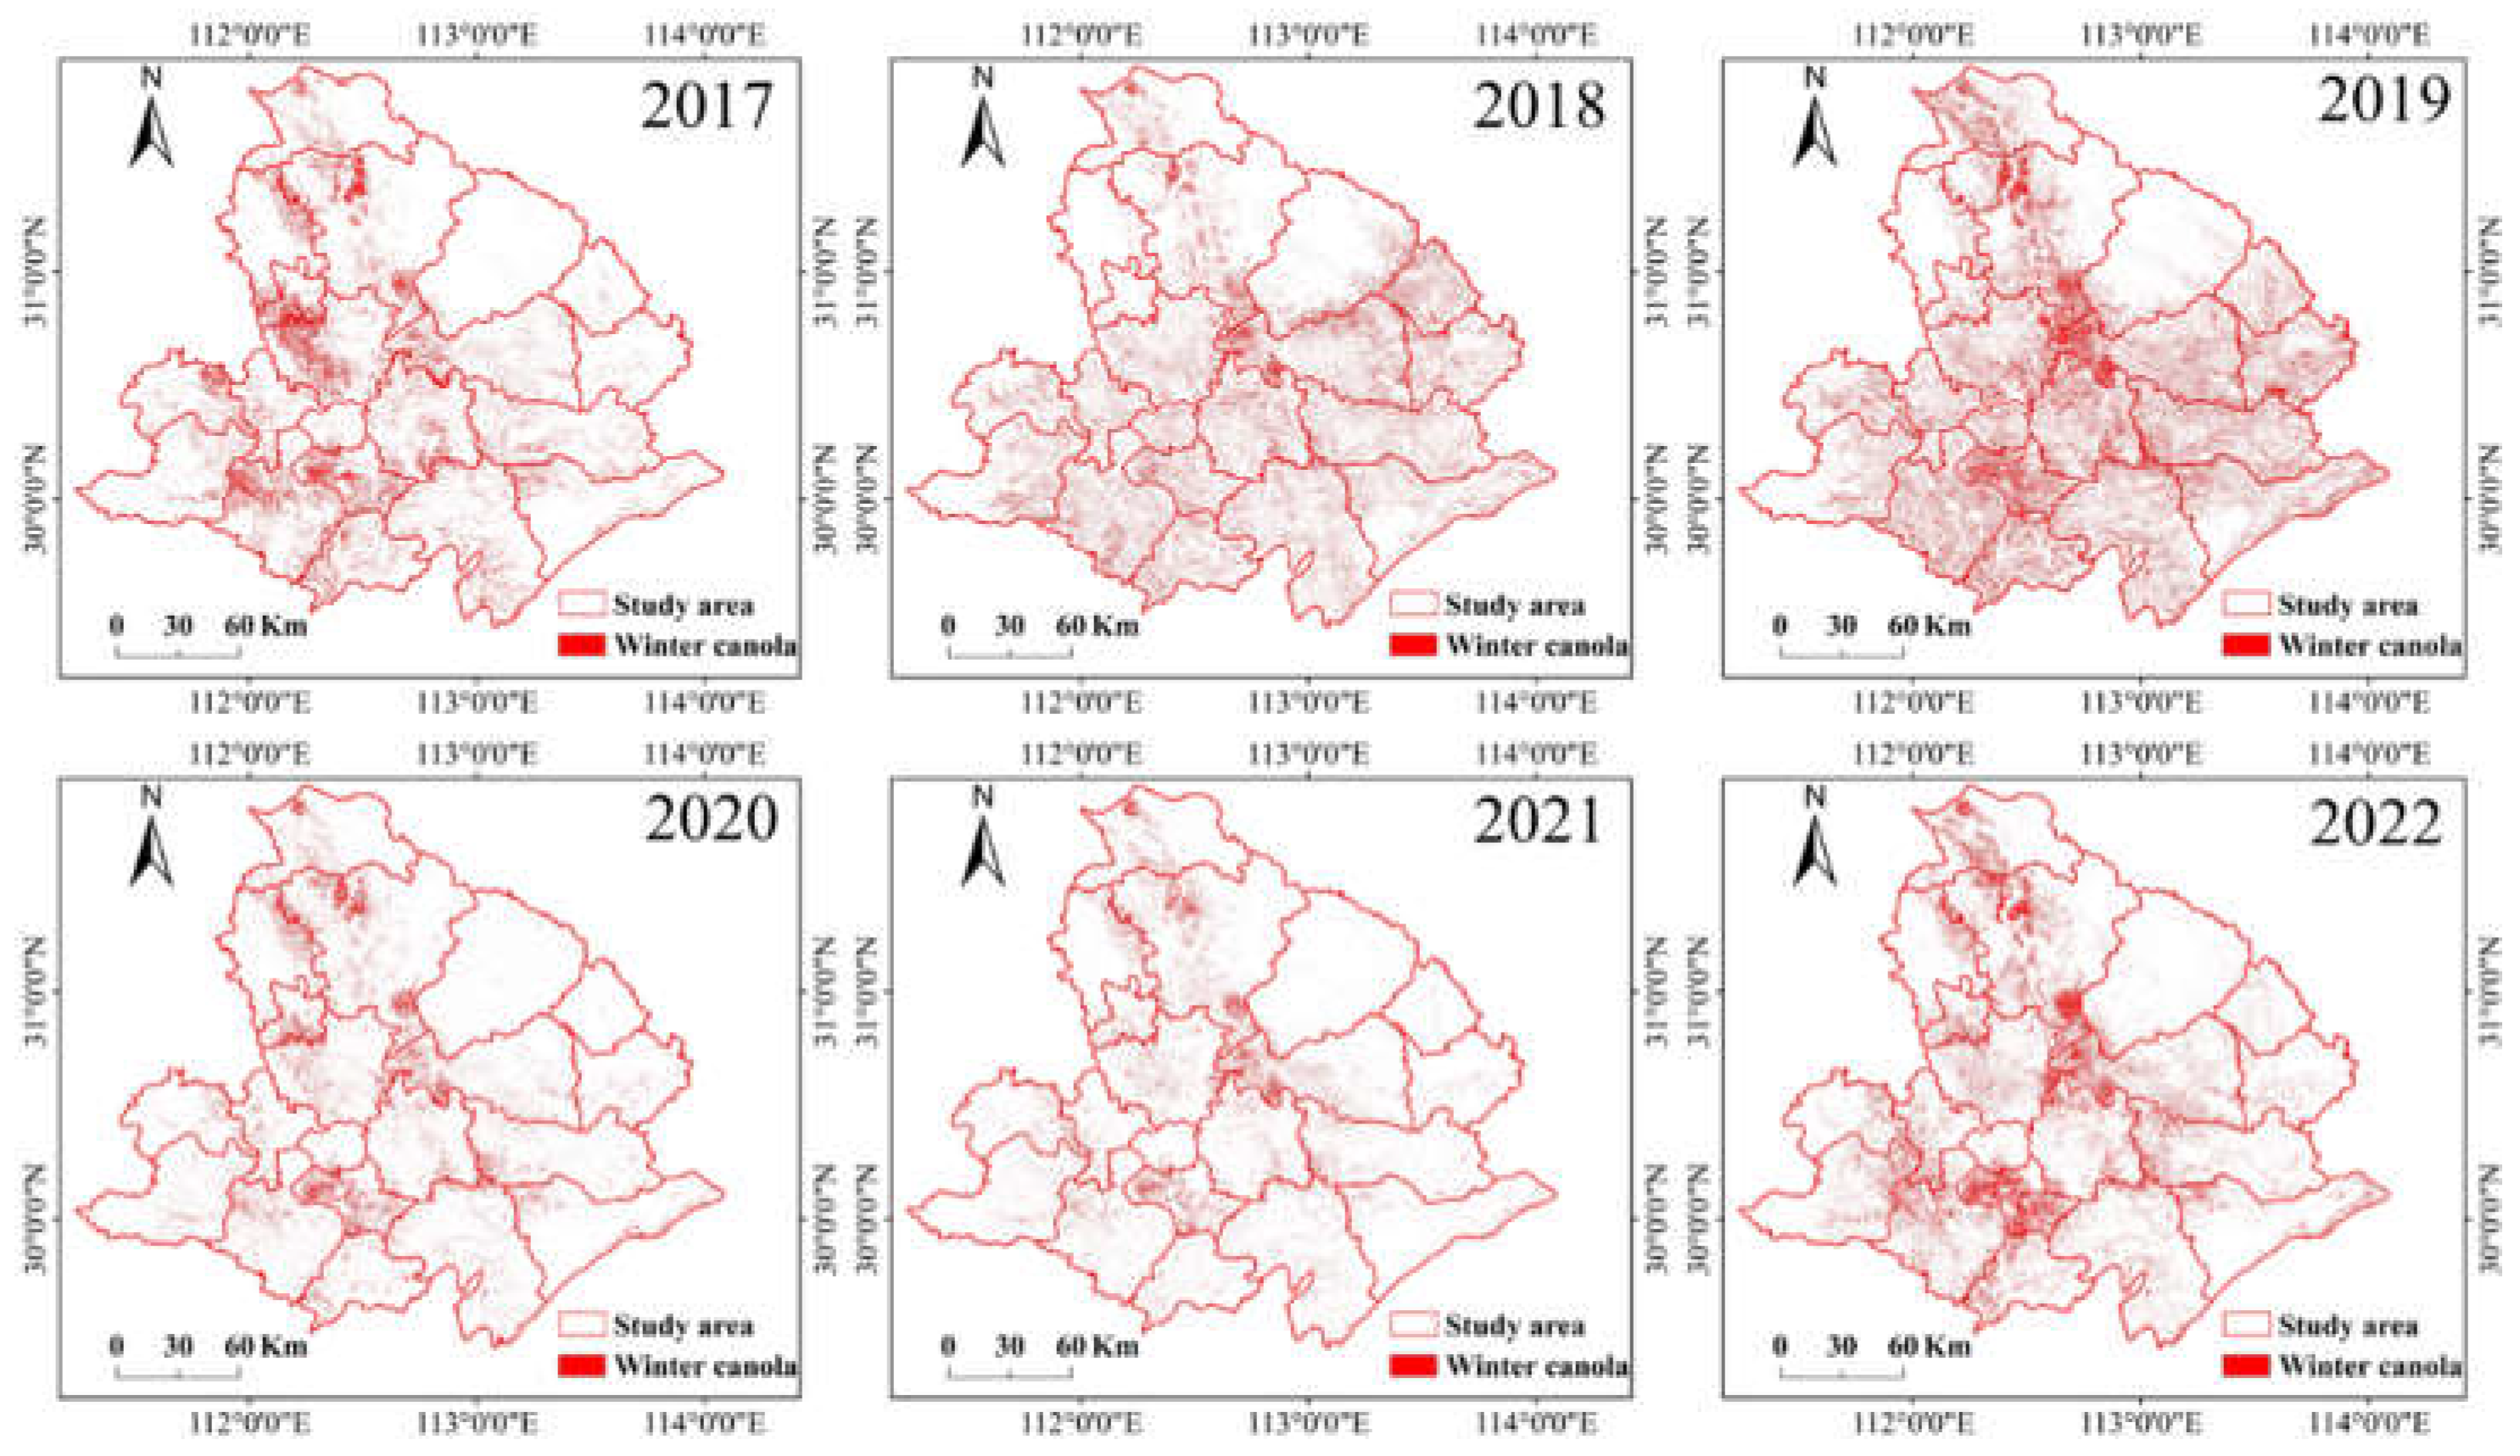

Table 1.
Phenological information of main crops in winter.
| Crop | September | October | November | December | January | February | March | April | May | |||||||||||
|---|---|---|---|---|---|---|---|---|---|---|---|---|---|---|---|---|---|---|---|---|
| Canola | Sowing | Seeding | Overwinter | Bolting | Flowering | Podding | Ripening | |||||||||||||
| Wheat | Sowing | Seeding | Green-up | Jointing | Heading | Ripening | ||||||||||||||
Table 2.
Number of ground samples in 2017-2022.
| Class | 2017 | 2018 | 2019 | 2020 | 2021 | 2022 |
|---|---|---|---|---|---|---|
| Winter canola | 1302 | 521 | 549 | 321 | 320 | 339 |
| Winter wheat | 1216 | 527 | 561 | 340 | 340 | 325 |
| Trees | 1225 | 508 | 559 | 447 | 447 | 447 |
| Water | 1242 | 520 | 591 | 470 | 470 | 470 |
| Building | 1242 | 517 | 585 | 465 | 465 | 465 |
| Total | 6227 | 2593 | 2845 | 2043 | 2042 | 2046 |
Table 3.
Polarization indexes.
| Polarization indexes | Formular | Citation |
|---|---|---|
| SRI | VH/VV | This paper |
| SDI | VH-VV | This paper |
| SNDI | (VH-VV)/(VH+VV) | This paper |
| SDRI | 2*VV/(VH+VV) | This paper |
| SRD | VH/VV-VV/VH | This paper |
| SNDVHvv/VVvh | (VH/VVVV/VH)/(VH/VV+VV/VH) | This paper |
| SMI | (VH+VV)/2 | [30] |
Table 4.
Textural features.
| Textural features | Citation |
|---|---|
| ASM, Contrast, CORR, VAR, IDM, SAVG, SVAR, SENT, ENT, DVAR, DENT, IMCORR1、IMCORR2, MaxCORR | [31] |
| DISS, PROM | [32] |
Table 5.
Feature selection of winter canola at different phenological stages based on Sentinel-1.
| Phenological stages | Selected features |
|---|---|
| Seeding stage(Early December) | VH_Savg、VV_Savg、SMI、SRI、Elevation、SDRI、VV_Diss |
| Overwinter stage(Late December) | VV_Savg、SRI、VV、SND、VH_Savg、Elevation、VH_Svar、VH_Prom |
| Early-bolting stage(Late January) | VV_Savg、VH_Savg、VV、SRI、Elevation、VV_Dvar、VH_Diss |
| Later-bolting stage(Mid February) | SMI、VH_Savg、VH、VV、Elevation、VV_Savg、VV_Diss |
| Flowering stage(Late March) | VH_Savg、VH、SMI、VV_Savg、Elevation、SDI、VV_Diss |
Table 6.
Feature selection of winter canola at different phenological stages based on Sentinel-2 and Sentinel-1.
Table 6.
Feature selection of winter canola at different phenological stages based on Sentinel-2 and Sentinel-1.
| Phenological stages | Selected features |
|---|---|
| Seeding stage(Early December) | B6、B5、B8、RPVI、GOSAVI、LSWI、VV |
| Overwinter stage(Late December) | B6、B7、B8、DVI、GOSAVI、VV、B5 |
| Later-bolting stage(Mid February) | B6、B8、B7、VV、DVI、VH、GARI |
Table 7.
Accuracy evaluation of different data sources at the different phenological stage.
| Model | Data source | Seeding | Overwinter | Bolting | ||||
|---|---|---|---|---|---|---|---|---|
| F-score | OA | F-score | OA | F-score | OA | |||
| RF | S2 | 0.7928 | 80.06% | 0.8445 | 77.53% | 0.9791 | 91.65% | |
| S1+S2 | 0.8010 | 81.48% | 0.8615 | 81.63% | 0.9831 | 94.35% | ||
| SVM | S2 | 0.7658 | 80.93% | 0.8478 | 79.94% | 0.9780 | 92.11% | |
| S1+S2 | 0.7894 | 82.58% | 0.8583 | 82.34% | 0.9800 | 94.48% | ||
Disclaimer/Publisher’s Note: The statements, opinions and data contained in all publications are solely those of the individual author(s) and contributor(s) and not of MDPI and/or the editor(s). MDPI and/or the editor(s) disclaim responsibility for any injury to people or property resulting from any ideas, methods, instructions or products referred to in the content. |
© 2024 by the authors. Licensee MDPI, Basel, Switzerland. This article is an open access article distributed under the terms and conditions of the Creative Commons Attribution (CC BY) license (http://creativecommons.org/licenses/by/4.0/).
Copyright: This open access article is published under a Creative Commons CC BY 4.0 license, which permit the free download, distribution, and reuse, provided that the author and preprint are cited in any reuse.


