Submitted:
06 June 2024
Posted:
07 June 2024
You are already at the latest version
Abstract
Comprising the largest population cohort on this planet, Gen Z presents a future-oriented consumer segment driven by climate change and food. This study sought to investigate Gen Zs’ perceptions to-ward plant-based foods and diets, and explore the relationship between attitude components, meal preparation involvement, personal and lifestyle factors, and perceived barriers in adopting a plant-based diet with willingness to adopt green-eating practices. Using cross-sectional data from uni-versity students in Greece, India and UK, various tools were employed to determine the factors influ-encing youths’ consumer behavior toward animal-protein substitutes. PCA indicated the underlying dimensions of students’ viewpoints on plant-based foods, whereas hierarchical and k-means clustering provided the cluster structure. An ordered probit model was estimated to delineate Gen Zs’ willingness to adopt plant-based diets and distinguish among mostly unwilling, somewhat willing and mostly willing youths. Our findings identified two consumer segments, namely proponents and opponents toward plant-based foods and diets, with statistically significant differences in the perceived health benefits of plant-based diets, attachment to animal-based proteins, perceived exclusion of ani-mal-based foods, dissatisfaction with plant-based foods attributes and demand for ensuring adequate protein intake. The ordered probit model estimates showed that there is a rather «homogeneity» in the factors influencing youths’ intention to adopt plant-based diets, with attitude components, meal prep-aration indicators, perceived barriers to eating “green” and personal factors, viz. self-assessed knowledge on healthy eating and physical activity, being strongly associated with students’ willingness to switch to plant-based diets in all three countries. Mapping potential obstacles and enablers in terms of shifting to more green-eating behaviors, our findings could add information to better understand the factors affecting food choice and youths’ transition to a more sustainable lifestyle.
Keywords:
attitudes toward plant-based foods
; willingness to adopt plant-based diets
; meal preparation involvement
; ordered probit model analysis
; PCA
; cluster analysis
1. Introduction
In the modern food systems, there is a noticeable consumers’ shift to animal-protein substitutes and more plant-based dietary patterns motivated by health and environmental concerns, and contemporary ethical debates [1-3]. The alternative protein market is booming and it is expected to increase from 1.5 billion EUR in 2018 to 2.4 billion EUR in 2025, whereas the gradual replacement of meat with its plant-based substitutes is perceived as a “win-win” situation encompassing positive health and environmental aftereffects [4, 5]. A great body of the literature has stated numerous health repercussions of meat, and especially processed meat consumption, such as type 2 diabetes, life expectancy decrease, cardiovascular diseases and even cancer [6-9]. In addition, meat consumption has been linked with a substantial environmental burden, including greenhouse gas emissions, water pollution, deforestation, and biodiversity loss [7, 10].
Thus, reducing meat consumption and replacing it with plant-based substitutes has an essential role in human health improvement and the mitigation of environmental damage from livestock farming and food production. Nutrition and health interventions promoting plant-based alternatives are therefore indispensable for ensuring population wellbeing and an ecologically sustainable future, whereas a shift of dietary choice to plant-based protein could also guarantee nutritional adequacy, food security and food sufficiency [4]. However, a great proportion of consumers still seem to be reluctant toward plant-based foods, despite their well-documented positive outcomes. Although there is an increase in the number of people switching to a plant-based diet, meat consumption remains highly ingrained in Western culture, and the disposition to reduce the consumption of animal products seems to be relatively low [11]. Recent literature has explored the meat-rich Western dietary pattern [11, 12] indicating the social pressure to decrease meat consumption [13]. This reveals the necessity for further research on the potential barriers in switching to plant-based diets and choosing plant-protein alternatives over animal-based protein. Orienting consumer demand toward reduced meat consumption and increasingly plant-based diets will likely be a vigorous challenge for strengthening environmental and health policy.
An investigation of consumer attitudes toward plant-based diets is considered critical since it can uncover underlying motivational and structural factors influencing the acceptance level of plant-based foods, and contribute to the design of nutrition strategies and the promotion of eating “green”. Many factors have been found to affect consumers’ willingness to adopt a more plant-based diet and reduce their meat consumption including meat attachment factors [12, 14, 15, 2], food choice motives [15-18] and perceptions toward plant-based diets [16, 2, 18-19]. Furthermore, a significant body of the literature noted that perceived health benefits and environmental concerns also had a major influence in establishing plant-based food consumption patterns [3, 5, 15, 20, 21, 22].
Today, Generation Z (Gen Z) comprises a dynamic consumer bracket making food choices determined by a variety of biological (i.e. hunger, appetite, taste), economic (i.e. income, price, availability), social (i.e. culture, family, peers, food trends), psychological (i.e. mood, stress, food neophobia) and lifestyle (e.g. culinary skills, information) factors, perceptions and attitudes [23]. Growing up into a universal foodie culture with a broad range of food options, Gen Zs have developed plentiful senses of taste, differentiating them from previous generations. The eating habits of Gen Zs are linked with environmental and health concerns, which have a major role in establishing food preferences and choices [24, 25]. Employing individual-level data from a sample of university students in Minnesota, Pelletier et al. [26] noted that positive attitudes for foods from local, organic and/or sustainable sources were common in youths, exhibiting higher dietary quality. In addition, Marinova and Bogueva [23] underlined that Gen Zs’ food choices are mostly based on attitude, information and care, instead of cultural factors and the hedonic value of food. Using cross-sectional data from Greece, Kamenidou et al. [27] highlighted the role of meat substitutes in traditional Mediterranean gastronomy (e.g. “fakorizo” - lentils with rice), although it seemed that Gen Zs are unaware of the available meat and dairy plant-based alternatives. Recent evidence from the UK showed that there is a significant rise in the consumption of plant-based foods, especially in adults 24-39 years old with higher income, and supported the hypothesis that plant-based products may help the shift to more green-eating practices [28].
Gen Z cohort has a crucial role in the future of food, since youths demand change, create new food trends, shape future food production, and opt for more resilient food systems. The present study investigated Gen Zs’ attitudes and perceptions toward animal-protein substitutes, and also explored youths’ intention to switch to plant-based diets in Greece, India and UK. The empirical analysis employed individual-level data from a sample of university students, and first sought to determine the underlying dimensions of their attitudes toward plant-based foods and define youths’ segments characteristics with respect to their awareness toward animal-protein substitutes. Furthermore, the factors influencing youths’ willingness to adopt plant-based diets were explored in terms of meal preparation involvement, personal and lifestyle factors, attitude components and perceived barriers to adopt plant-based diets, after controlling for various sociodemographic characteristics.
2. Materials and Methods
2.1. Sampling Selection and Measures
The present research employed cross sectional data from a sample of Gen Z (generation Z) university students in three countries, namely Greece, India and UK. Participants were adults born between mid-to-late 1990s and the early 2010s of any sexual orientation, gender identity, race, or ethnical background. The research received ethical approval from the University of West London (UWL/REC/SHT-00845). The quantitative data selection tool was a validated formal questionnaire, appropriately adapted to the nutrition interests and lifestyle of Gen Zs [29]. After the pre-test of the adapted questionnaire, the final version was distributed online to university students from UK, Greece and India. Participants were recruited via email announcements including the link to the online form of the questionnaire and the consent to research participation, and also ensuring personal data confidentiality. Researchers used snowball nonprobability convenience sampling to enhance inclusion of broader audience [30]. Participation was voluntary and respondents did not receive any form of compensation for taking part to the research. The questionnaire completion time was estimated to be approximately 15 min. Finally, 528 valid questionnaires were selected (107 questionnaires from UK, 115 from Greece and 306 from India). The time period varied since it started between April to September 2022 for UK and September-November 2023 for India and October 2023-January 2024 for Greece.
Students’ responses were coded for the ease of interpretation in subsequent analysis. In the first part of the questionnaire, contextual information was included to describe participants’ sociodemographic characteristics. Respondents were asked to declare gender identification on a categorical variable taking the value 0 for “male”, the value 1 for “female” and the value 2 for “other”. Since responses were classified in the first two categories, the gender indicator was finally expressed as a dummy variable. The age indicator was also recoded as a dichotomous variable taking the value 0 for “18-23 years old” and the value 1 for “over 23 years old”. Educational attainment was described through two categories, namely undergraduate (taking the value 1 for undergraduates, and 0 otherwise) and postgraduate level (taking the value 1 for postgraduates, and 0 otherwise). In addition, students’ term-time residence was explored through a set of three dummies, corresponding to “living with parents or relative”, “university accommodation”, and “living in a private accommodation (either alone or with other students/friends)”.
Meal preparation involvement was evaluated through a set of four dichotomous indicators expressing students’ responsibility for food shopping (value 1 for “most/all responsibility”, value 0 for “otherwise”), meal planning (value 1 for “most/all”, value 0 for “otherwise”), and cooking (value 1 for “most/all”, value 0 for “otherwise”), and self-assessment of culinary skills (value 1 for “very good/excellent culinary skills”, value 0 for “otherwise”). Dichotomous indicators were also constructed to express individual’s personal and lifestyle factors in terms of knowledge on healthy eating, healthiness of current dietary habits, activity level and media influence. In particular, the responses of the participants who considered themselves as highly knowledgeable in healthy eating were encoded with the value 1, whilst all the rest responses reflecting lower levels of knowledgeability were characterized with the value 0. Furthermore, self-perceived balanced diet was described by a dummy variable taking the value 1 for students defining their current diet as healthy/balanced, and the value 0 otherwise. Students were also asked to describe their activity level, and hence a dummy was constructed taking the value 1 for highly active participants and the value 0 for less active individuals. Students were also asked to state whether social media and TV advertising influence people to buy plant-based foods. A dichotomous indicator was created with the value 1 in case of a positive response and 0 otherwise.
To explore students' viewpoints toward the perceived barriers in adopting a plant-based diet, a set of four dichotomous indicators was constructed to delineate absence of interest in consuming plant proteins perceived difficulty in following a plant-based diet, lack of knowledge about the quality of plant proteins, and lack of knowledge about the health benefits of consuming plant proteins. In the last part of the questionnaire, an 18-item variable rated on a five-point Likert scale (totally disagree-disagree-neither neither disagree nor agree-agree-totally agree) was employed to investigate students’ attitudes toward plant-based foods and diets. This scale is analytically presented in Figure 1. Finally, individual’s willingness to adopt a plant-based dietary routine was expressed through an ordinal variable taking the value 0 for mostly unwilling respondents, the value 1 for somewhat willing respondents, and the value 2 for mostly willing participants.
2.2. Methods of Analysis
The present study sought to investigate students’ attitudes toward plant-based foods/diets, outline their consumption profile, and also explore individual’s endorsement of green-eating patterns in Greece, India and UK. Cross-sectional data were analyzed through various statistical techniques to define the main components that underline individuals’ perceptions toward plant-based products and delineate different consumer segments. Econometric analysis also estimated the factors influencing willingness to adopt plant-based diets in Greek, Indian and English students. The models employed are analytically presented below.
- (i)
- Factor analysis
In order to reveal the underlying components depicting students’ attitudes toward plant-based diets and foods, an exploratory factor analysis (EFA) was applied, which comprises a widely used multivariate technique for investigation of scale validity and reduction of the dimensionality in a set of variables. The output of the EFA can be also adopted to facilitate further statistical analysis [Raptou et al. [31]; Raptou & Manolas, [32, 33, 34]. In the present study, EFA was employed to test the potential interdependencies among the observed variables of the 18-item scale describing individuals’ attitudes toward plant-based diets and food products, and uncover the underlying theoretical constructs referred as latent variables [35]. The EFA was conducted via principal component analysis (PCA) with the varimax rotation method to maximize the sum of the variance of the square loadings [36, 37]. The factors produced by the EFA application were enrolled in subsequent statistical analysis [38, 39].
Several prerequisites were suggested before proceeding to the EFA. In particular, the Kaiser–Meyer–Olkin (KMO) criterion of sampling adequacy and the Bartlett's test of sphericity were adopted to assess the suitability of sample sizes for factor analysis and the fitness of the data [Napitupulu et al [40], 35, 41]. KMO estimations over the value of 0.50 indicate data adequacy of the factorial model [42], whereas the Bartlett's test of sphericity tests the null hypothesis that the correlation matrix coincides with the identity matrix, assessing its factorability [43]. The selection of the number of factors was based on the K1 rule, so the extracting factors with eigenvalues over 1 were retained, while the rest were discarded without losing much of the original variability [44]. To achieve the optimal factor solution, all variables with estimated factor loadings over 0.40 on more than one factor were removed from the analysis [45]. Cronbach’s α coefficients were also calculated to indicate the level of reliability and unidimensionality of the set of variables constructing each factor. For values greater than 0.50, all constructs were considered to be in the acceptable range [46-49].
- (ii)
- Cluster Analysis
Cluster analysis (CA) was employed for grouping university students into similar segments based on their attitudes and perceptions toward plant-based diets and foods. The data set included the factors produced by the preceding EFA application. The clusters were considered as mutually exclusive with internal homogeneity and intragroup heterogeneity [50]. In a recent review study, Oyewole and Thopil [51] analytically present and discuss the algorithms and strategies of CA. In the context of the present research, the CA was performed through both hierarchical and non-hierarchical (k-means) clustering techniques. First, hierarchical cluster analysis was applied to uncover the number of clusters after classifying cases into homogenous groups by aggregating them, one at a time, in a series of sequential steps [52-56]. For hierarchical clustering, the Ward’s method was enrolled as the grouping technique, whereas the squared Euclidean distance was adopted as a measure of similarity between cases. The dendrogram produced by the Ward’s method was used to determine the number of clusters. Then, the k-means algorithm was used to develop the clustering model, setting a priori the number of clusters that resulted from the Ward's method [57]. To further validate the cluster structure obtained by CA application, discriminant analysis was employed to explore the accuracy of the cluster solution [58, 59].
- (iii)
- Econometric approach – the ordered probit model
To address students’ endorsement of green-eating patterns, a theoretical framework was employed based on the assumption that individual’s willingness to adopt plant-based diets is related to sociodemographic factors, meal preparation indicators, personal and lifestyle characteristics, attitudes toward plant-based diets and foods, and perceived barriers toward the adoption of green-eating behaviors. Since students’ level of willingness as a dependent variable has possible responses in discrete and ordinal nature, the empirical analysis adopted an ordered probit model to explore individuals’ responsiveness to plant-based eating patterns. The conceptual basis of this approach is rooted in the field of the random utility maximization [60] and has been elaborated in the literature to model ordinal survey responses [61-65]. Therefore, by leveraging the random utility modelling approach, it is assumed that for the individual, the latent dependent variable (individual’s endorsement of green-eating) incorporates two elements: first, a linear combination of a vector of independent variables xi and the parameter vector β that have to be estimated reflecting the relationship between and the variables in xi; and second, an unobserved random variable εi, assumed to be independent and identically distributed with a standard normal distribution that is reflecting unobserved factors of the alternatives for the individual i (i=1,2,3…N) [66, 67]:
Since the dependent variable in the former equation is unobserved, it is measured by a set of ordered responses through a censoring mechanism. In that case, the utility of each alternative is assumed to fall within a specific utility interval. Therefore, the observed ordered dependent variable yi reflecting individuals’ alleged level of willingness to adopt plant-based diets, is expressed as follows:
where μs are threshold parameters to be estimated in order to indicate the range of the normal distribution associated with specific values of the stated response variable along with the parameter vector β, subject to the constraint μ0 < μ1 < … < μj-1. For reasons of identification, one restriction is imposed on the threshold parameters, that is μ0=0. The probability associated with the observed outcome j, where j= 0,1,2,…,J, can be specified by:
where Φ(.) is the standard normal cumulative density function.
The parameters of the model are estimated by maximizing the log-likelihood function. Therefore, the likelihood function and the log-likelihood function can be expressed below as:
where yij is a dichotomous indicator, taking the value of 1 in case the ith individual presents the level of willingness j, and 0 otherwise.
In the context of the present research, the ordinal dependent variable took the following possible values: mostly unwilling to adopt plant-based diets (y=0), somewhat willing to adopt plant-based diets (y=1), and mostly willing to adopt plant-based diets (y=2). Furthermore, the vector of explanatory variables encompassed the sociodemographic dummies (gender, age, educational attainment, accommodation), the meal preparation indicators (responsibility for food shopping, responsibility for meal planning, responsibility for cooking, very good/excellent culinary skills), the personal and lifestyle indicators (knowledgeable about healthy eating, self-perceived balanced diet, high activity level, social media and TV ad influence), the factors resulted from the EFA application, and the indicators describing the perceived barriers in adopting a plant-based diet (absence of interest in consuming plant proteins, perceived difficulty in following a plant-based diet, lack of knowledge about the quality of plant protein, lack of knowledge about the health benefits of consuming plant proteins).
The interpretation of the estimated coefficients of the ordered probit model can be ambiguous, especially for the intermediate categories, because the changes in the probabilities associated to the intermediate categories cannot be signed a priori [67]. Thus, the calculation of the marginal effects is necessary when the ordered probit model is employed. In the context of the present study, the marginal effects of variable on the probability of an individual having each of the three possible levels of willingness can by calculated from the estimated coefficients by the following expressions:
where φ(.) is the density function of the univariate normal distribution. The marginal effect for a continuous variable indicates the change in the predicted probability resulting from an increment unit change in the dependent variable. For a dummy variable, the marginal effect represents the difference between the two probabilities, with and without the variable. All variables are held in their mean levels, except for the variable being interpreted.
3. Results and Discussion
It is crucial to decode the motives behind Gen Zs’ food choices in order to capture the factors associated with the dietary transition to more plant-based food options. Understanding why consumers choose to abstain from meat products, and instead turn to more “green” eating practices, may help health and nutrition scholars to design and implement effective policy regulations that will improve individuals’ dietary patterns. Factors related to environmental protection, food attributes and health improvement should be explored to clarify their influence on eating choices [68-72] and consumers’ adherence to more sustainable diets [73].
3.1. Students’ profile in Greece, India and UK
Table 1 provides an analytical description of the sample. Of the 528 participants, 21.7% and 58% were Greek and Indian university students, whereas the rest 20.3% corresponded to their English counterparts. The predictors presented a wide range of variability across the three countries of interest. The application of chi-square tests revealed that the country of residence had a strong relationship with sociodemographic characteristics, meal preparation indicators, personal and lifestyle factors, perceived barriers in adopting a plant-based diet and willingness to shift toward green dietary patterns (Table 1). In total, the great majority of participants were female undergraduates, 18-23 years old, living in a private accommodation with their parents/relatives or with friends/flatmates. In terms of gender, the sample of English students was close to the distribution in the national population, whereas the male group was underrepresented in both Greece and India. Recent literature has noted a constant gender effect in survey participation with women being more responsive compared to men, especially in online research designs [74, 75, 76]. To avoid biased estimates in subsequent statistical analysis, a weighting scheme was applied based on respondents’ gender in the Greek and Indian subsamples (each group was given a weight corresponding to the proportion in the total population) [77].
Furthermore, most of the university students in UK and a great proportion of Greeks were themselves mainly responsible for food shopping (92.5% and 75.7% respectively), and for planning (84.1% and 66.1% respectively) and preparing their own meals (92.5% and 68.7% respectively) compared to students in India. English and Greek students’ high involvement with meal preparation may be probably due to the lower rates of cohabitation with parents or other relatives. Recent evidence showed that university students, who had to move away from their parents’ home and live alone for the first time, used to establish independence, form new dietary habits and become responsible for the preparation of their meals [78, 79], although longitudinal studies suggested that the healthiness of eating practices declined in most cases [80].
Knowledge about healthy eating was statistically related to the country classification indicator, with English students considering themselves more informed on healthy dietary patterns than their Indian and Greek counterparts (chi-square test=10.02, p<0.01). Similarly, English students seemed quite convinced that they follow a balanced diet (71%), whereas Greek and Indian students were less confident for their dietary choice (64.3% and 57.2% respectively) (chi-square test=6.901, p<0.05). Statistically significant differences regarding the inhibiting factors in following a green diet were also observed across student groups. In particular, the absence of interest in consuming plant proteins and the perceived difficulty were reported as the main barriers to adopting a plant-based diet, mostly by English students. In addition, a statistically significant association between the country of residence and the willingness to adopt a more plant-based diet was revealed (chi-square test=56.092, p<0.01), with Indian students being more receptive to shift toward a more plant-based diet (46.5%) compared to their Greek and English counterparts (14.4% and 19.6% respectively) (Table 1).
3.2. Students’ Attitudes toward Plant-Based Diets and Foods
Participants’ attitudes and perceptions toward plant-based diets and foods are described on Figure 1. High proportions of the students seemed to perceive plant-based foods as overly expensive products (39.4%) of inferior taste compared to conventional products (32.8%), although they shared the opinion that some of them may have a really nice taste (39.9%). The taste of a product is a crucial sensory aspect that has a major effect on consumers’ acceptance [81]. Previous research also indicated that the perceived poor sensory offering of meat substitutes prevented consumers from incorporating them into their diet [82], connoting that the fear of their flavor dislike usually discourages their adoption [83, 84]. Regarding the alleged difficulty in including plant foods in eating routine, great proportions of respondents supported that they are much healthier than their traditional counterparts and agreed that a plant-based diet can be easily adopted by anyone (45.5% and 51.5% respectively). Furthermore, the majority of the students noted that plant-based diets are safe and health promoting (65%), and considered them particularly effective in the prevention and the treatment of chronic diseases (54.2%), as well as in weight loss (45.2%). To further support previous research linking plant-based diets with health benefits [12, 3, 83, 85-87], our findings also showed that young adults attribute significant health-related improvements to the adoption of “green” eating practices.
However, perceptions those plant-based foods were more expensive than conventional products may restrict their uptake, and also discourage individuals from including them in their diets, since price constitutes a determinant of critical importance in dietary choices and food consumption [88-90]. Widespread beliefs that meat products are less expensive, whereas their plant-based substitutes are perceived as higher-priced food options [91, 92, 21], may constitute a barrier toward product trial [22, 93]. However, recent evidence showed that consumers who follow plant-based diets report lower food expenditures than omnivorous individuals [94]. Therefore, in order to promote plant-based dietary practices and encourage their adoption, nutrition interventions should also consider economic repercussions, besides environmental and health consequences. This is especially important for consumer groups, such as young adults and university students, as they are at a transitional stage signifying major lifestyle changes. Many of them had to move away from their parents’ home, live by their own and manage their financial affairs. Therefore, such consumer groups might be more price-sensitive, and hence they should be informed that a shifting to a more-plant-based diet will not destabilize their economic situation.
In addition, participants’ responses uncovered young adults’ frustration on nutrition issues, since they seemed to mix up plant-based eating patterns with vegan diet. Significant proportions of students were convinced that animal foods (like fish), and animal-derived foods (like eggs and dairy products) are always excluded from green-eating patterns noting a lack of information on the different types of plant-based diets (e.g. vegan vs lacto-vegan). With respect to protein consumption, approximately 80% of respondents declared that proteins comprise an important component of a balanced diet, whereas 59.5% of the total sample added that B12 should be monitored when following a plant-based diet (Figure 1). However, student responses suggested that there is no clear viewpoint regarding animal and plant-based proteins. Although great proportions of participants agreed that animal proteins are not the only quality protein sources (57.8%), setting nuts as an excellent protein source (77.1%), almost half of respondents considered meat as a higher quality source of proteins compared to plant-based protein sources (47.7%) (Figure 1). Students’ perceptions may inhibit public confusion over the adequacy of plant foods in the recommended protein and vitamin intake, and mistrust to the quality of the plant-based protein. However, recent food research has shown that a balanced plant-based diet that combines various amino acids through different plant-based food products can ensure the necessary protein for the population needs [95]. Furthermore, new food technology options, such as plant-based products with highly bioavailable plant proteins (e.g. soy), and new microbial fermentation techniques can augment protein quantity and further improve consumers’ health effects [96]. Health and nutrition campaigns could help young adults better understand their dietary and food options, and hence increase their awareness toward plant-based dietary practices.
In order to assess the dimensionality of the components delineating students’ attitudes toward plant-based diets and foods, explorative factor analysis (EFA) was employed through principal component analysis (PCA) with varimax rotation. The KMO measure was 0.796 (>0.50), implying data adequacy for the PCA [35, 40, 41], whereas the Bartlett’s test of Sphericity indicated variable correlation and suitability for structure detection (Chi-square = 2327.589, p<0.01). The EFA of the 18 variables extracted a five-factor solution (eigenvalue>1), and the total variance explained was 58.281%. The Cronbach’s α coefficients were greater than 0.5, showing that all the constructs were in the acceptable range [46, 47, 48, 49].
Table 2 presents the EFA and the reliability analysis output on participants’ perceptions toward plant-based diets and foods. The first factor labeled as “health benefits of plant-based diets” included five variables explaining 13.440% of the total variance and had a reliability coefficient of 0.744. This factor loaded attributes related to the healthiness and safety of plant-based diets and foods, and the adaptation to plant-eating behavior. The second factor accounted for 13.321% of the total variance and comprised four out of the 18 variables that mainly described students’ views on plant-based food products’ characteristics, such as taste and price. This second factor was entitled as “dissatisfaction with plant-based food attributes” and had a reliability coefficient of 0.743. Furthermore, the third factor was found to explain 12.204% of the total variance, and was labeled as “ensuring adequate protein intake in plant-based diets” according to the content of the three variables included. Reliability analysis provided a Cronbach α measure equal to 0.651. The fourth factor, “perceived exclusion of animal-based foods”, incorporated three variables explaining 10.129% of the total variance with a reliability coefficient of 0.656. This factor involved attributes regarding students’ concerns about the consumption restrictions on products of animal origin, such as fish, meat, eggs and dairy foods from plan-based diets. The fifth factor, “attachment to meat proteins”, incorporated three variables explaining 9.276% of the total variance explained, with a reliability coefficient of 0.556. This factor involved attributes regarding students’ perceptions toward the quality of plant-based proteins (Table 2).
3.3. Students’ Segments according to Viewpoints of Plant-Based Diets and Foods
In order to identify students’ segments on the basis of their viewpoints and attitudes toward plant-based diets and food options, cluster analysis was employed based on the factors obtained from the PCA (Table 3).
First, Ward’s hierarchical clustering method was applied to define the optimal number of clusters, followed by k-means algorithm for stabilization purposes [57]. To enhance the validity of our findings we further explored different cluster models ranging from a two-cluster solution to a five-cluster solution via discriminant analysis [59]. The classification results showed that the two-cluster model provided the best interpretive cluster solution, since it presented higher percentages of the original grouped cases correctly classified (97.2%) compared to the rest alternatives. T-tests for the equality of means indicated statistically significant differences between the two clusters in terms of perceptions toward health benefits of plant-based diets, dissatisfaction with plant-based food attributes, ensuring adequate protein intake in plant-based diets, perceived exclusion of animal-based foods and attachment to animal-based proteins. To fulfill the analytical description of the students’ profile on the basis of their behavior toward plant-based foods and diets, cross-tabulation and Pearson’s χ2 statistics were also calculated to identify statistically significant differences between clusters (Table 4).
Cluster 1, labeled as the “plant-based diet proponents”, accounted for 53.8% of the sample and presented the lowest mean factor-scores compared to the other segment in “attachment to animal based proteins” (2.536 vs 3.198, t-test=-10.571, p<0.001), “perceived exclusion of animal-based foods” (2.467 vs 3.772, t-test=-21.730, p<0.001) and “dissatisfaction with plant-based food attributes” (2.487 vs 3.500, t-test=-16.497, p<0.001). The students of this segment seemed to trust the quality of the plant-based protein sources, while being highly satisfied with the attributes of the foods included, and well-informed on the food options in plant-based dietary patterns (Table 3). Cluster 2 was labeled as “plant-based diet opponents” and included 46.2% of respondents. The students classified to this cluster were more skeptical about the health benefits of plant-based foods compared to the members of the other segment (3.443 vs 3.660, t-test=3.370, p<0.01), and also questioned the adequacy of protein intake in plant-based eating habits (4.183 vs 4.033, t-test=-2.318, p<0.05) (Table 3).
Table 4 presents the sociodemographics, the meal preparation habits and the personal/lifestyle characteristics of each cluster. Non-parametric tests showed that sociodemographics are irrelevant to cluster membership. On the other hand, 68% of the proponents of plant-based diets perceived their eating patterns as balanced compared to 54.10% of the opponents’ group (chi-square test=10.652, p<0.01) Furthermore, the responsibility for food shopping and meal planning were found to be statistically associated with cluster profile. Thus, 52.80% of plant-based diet proponents organize their food purchases by themselves compared to 40.60% of plant-based diet opponents (chi-square test=7.984, p<0.01), whereas 50% of the students classified in Cluster 1 used to schedule their meals compared to 37.5% of the opponents’ segment (chi-square test=10.995, p<0.01). Most of the times, individuals who get involved in meal preparation are more interested in nutrition information, new food products and novel food technologies. They are also more likely to read information on food packaging, seek information from various domains, such as social media, cook forums and food influencers, and they become more familiar with the new food products on the supermarket shelves. As a consequence, an increase in familiarity with plant-based foods may decrease food neophobia reactions and overcome motivational adoption barriers to a plant-based dietary shift [97-99]. According to the Table 4, involvement with meal preparation activities can also increase individual’ experience with foods, which in turn may limit neophobic behaviors [98, 100].
3.4. Willingness to Adopt a Plant-Based Diet
An ordered probit regression was adopted to model the willingness to adopt a more plant-based diet, and investigate the influence of sociodemographic characteristics, meal preparation indicators, personal/lifestyle factors and perceived barriers in following plant-based dietary patterns among mostly unwilling, somewhat willing and mostly willing consumers. Table 5, Table 6 and Table 7 present the ordered probit model estimates and the calculated marginal effects for the student subsamples (Greek, Indian, English). Concerning the ordered probit model procedure for the English student subsample, the Likelihood Ratio test indicated that the explanatory variables employed in the estimation process are appropriate (LR chi-squared test=133.66, p<0.01). Similarly, the Wald chi-squared tests indicated that the set of the explanatory variables employed in the ordered probit regression for the Greek and Indian student subsamples are significant (Wald chi-squared=47.13, p<0.01, Wald chi-squared=90.75, p<0.01, respectively).
3.5. The Role of Sociodemographics
With respect to sociodemographic characteristics, several regressors were found to be statistically significant. Term-time residence, and particularly living alone or with friends constituted a determinant factor in Greek students’ decision to adopt plant-based diets (β=1.014, p<0.01). Thus, individuals who declared living alone or with friends in a private accommodation were less likely by 28.7% to reject plant-based diets and had an increased likelihood by 19.2% and 9.4% to be somewhat willing or mostly willing to adopt more green-eating behaviors, respectively (Table 5). It seems that moving away from the family home has a substantial influence on plant-based diet acceptance, especially in Greek youths. The process of food choice and eating is profoundly linked with social norms and rituals in Greek families. There are strong cultural connections between meat consumption and Sunday family gatherings and dinners, whereas meat dishes are considered typical in special religious or national events [98, 101]. In addition, the immediate social environment has a critical role on dietary patterns and food choices. Family environments usually establish specific eating rules forming their members’ dietary habits, and influencing taste preferences and food liking. Most of the times, individuals follow the informal dietary guidelines set in their household, and find obstacles in eating “green” if other family members and relatives are unaware to adopt a more plant based diet [102].
Furthermore, gender (β=0.982, p<0.05) and educational attainment (β=2.480, p<0.01) were positively related to willingness to adopt plant-based behaviors in the Indian subsample (Table 6). Female students were less likely by 20.8% to be somewhat willing and more likely by 33.1% to be mostly willing to adjust to more plant-based eating patterns. Postgraduates also had an increased likelihood of adopting plant-based diets by 57.5% and a lower probability by 3.1% and 54.5% to be adverse or slightly interested in following green-eating patterns, respectively. Our findings further support previous research indicating gender differences in meat endorsement with men being more reluctant to reduce or avoid meat consumption compared to women, whereas the latter were more open to vegetarianism and plant-based diets [103, 3, 15]. Cultural dimensions of masculinity preserve stereotypes that consuming meat is masculine, resulting in lower acceptance of vegetarianism [104].
3.6. The Role of Meal Preparation Activities
Involvement with meal preparation activities was found to be strongly related to engagement in plant-based diets in all subsamples. Responsibility for cooking was inversely related to the willingness to adopt more plant-based diets in Greeks (β=-1.232, p<0.01). The estimated marginal effects revealed that students who prepared and cooked their own meals were more likely by 26.5% to restrict themselves from the adoption of more plant-based diets (Table 5). Recent evidence indicated that family dietary habits continue to have a critical role in university students’ cooking choices and habits, even after they have moved out on their own [105, 106]. Therefore, students whose families attributed major importance to meat dishes were rather more positive about meat consumption and favored meatless meals less. Although the Mediterranean diet comprises the prevalent dietary pattern in Greece and it is a mainly plant-based diet, a great body of the recent literature noted a substantial decrease in Mediterranean diet adherence in the Mediterranean basin, mostly due to lifestyle and socioeconomic changes and a shift to western-type dietary patterns [107-109]. In addition, university life constitutes a transitional stage for young adults who have to compromise health concerns and convenience. The subsequent prioritization of convenience over health may result in an increased consumption of ready-to-eat dishes, which in most cases list meat, fish and/or dairy products in their ingredients and have a high fat content [110].
On the contrary, responsibility for meal planning was found to be positively associated with adherence to plant-based diets in English students (β=1.321, p<0.01), with individuals engaging in meal planning tasks to have a lower probability by 43.9% to be unwilling toward the adoption of green-eating patterns (Table 7). Furthermore, culinary skills were found to be negatively related to willingness to adopt plant-based diets in both Indian (β=-0.862, p<0.05) and English subsamples (-1.087, p<0.05). Thus, Indian students with self-assessed excellent culinary skills had a lower likelihood of adopting more plant-based dietary practices by 29.9% (Table 6), whereas their English counterparts were more likely to be unwilling to move toward green-eating habits by 29.6% (Table 7). As Feher et al. [3] underlined, there is limited information on plant-based dishes and their preparation. At the same time individuals lack knowledge about the types of products that could substitute animal-based protein, whereas those ingredients are often hard to find in food stores [111, 112] and are mostly perceived as premium products of a higher price [22]. Furthermore, the widespread perception that the preparation of plant-based meals is more demanding and time-consuming may discourage the adoption of plant-based dietary patterns [113-114, 95]. Information through various domains (i.e. mass media, social media) on plant-based meal recipes and the cooking process could motivate young adults to experiment with new ingredients and also improve their cooking skills. Information on the health and environmental benefits of plant-based eating habits could also motivate Gen Zs to consume more ethically and overcome the perceived price-obstacle of plant-based foods.
3.7. The Role of Personal and Lifestyle Factors
Several personal and lifestyle factors were found to determine willingness to adopt plant-based diets. In particular, self-assessed knowledge about healthy eating was positively linked with both Greek and English students’ intentions to adopt green-eating patterns (Greeks: β=0.759, p<0.05, English: β=0.856, p<0.05) (Table 5, Table 7). More information can result in arising familiarity with green-eating dietary patterns and a higher self-efficacy for replacing food products like meat with its substitutes [15]. Thus, higher self-assessed knowledge levels would allow Gen Z consumers to become more prone to the endorsement of animal-protein substitutes, whereas their repeated exposure to plant-based meals could help increase positive appraisals and reduce neophobic reactions over time [15, 97, 100].
With regard to physical activity, high levels were inversely associated with willingness to adopt plant-based diets in Indian students (β=-0.755, p<0.01). Thus, individuals with a strong commitment in physical exercise were less likely by 27.8% to move toward more plant-based dietary patterns (Table 6). On the contrary, physically active Greek students were less likely by 14.3% to be opponent toward the adoption of plant-based diets (β=0.710, p<0.10) (Table 5). Differences on the direction of physical activity influence on the acceptability of plant-based diets between Greeks and Indians may be attributed to their established eating habits.
As explained above, although the Mediterranean diet is supposed to comprise the most prevalent dietary pattern in Greece, during the last decades there has been a noticeable shift to more westernized dietary habits, especially in youth population [115-117]. Young adults engaged in systematic physical exercise may be more aware of health issues and nutrition patterns with subsequent health benefits. Thus, they may become less hesitant about trying new food products, such as plant-based foods, or adopt eating practices that will help them improve health outcomes and well-being [21]. On the other hand, India presents the highest percentage of vegetarians worldwide with 29% of the population over 15 years old following a vegetarian diet [118]. However, as Singh et al. [119] noted there is a substantial increase in obesity and overweight rates, marking a nutrition transition away from “faith vegetarianism”, mostly attributed to changes in eating and cooking habits, such as the replacement of whole plant foods with refined carbohydrates, and processed and energy-dense fried foods. Therefore, this increase of negative health outcomes may have made physically active Indian youths question the quality of the plant based dietary patterns, although this should be interpreted with caution and should be further investigated.
3.8. The Role of Attitudes toward Plant-Based Diets
As expected, attitudes toward plant-based diets were significantly associated with the willingness to adopt green-eating patterns (Table 5, Table 6 and Table 7). Thus, consumers’ awareness of ensuring protein adequacy was found to be positively related to the willingness to adopt plant-based diets in all subsamples. The greatest marginal effect, estimated in the English subsample, showed that individuals with a higher level of awareness were less likely by 30.9% to restrict themselves from adopting more plant-based diets. Furthermore, a strong attachment to animal-based proteins seemed to restrain consumers from switching to more plant-based dietary practices in both Greek (β=-0.475, p<0.10) and Indian students (β=-0.218, p<0.10). The perceived exclusion of animal-based foods was inversely linked with intentions to follow a more plant-based diet in both Indian (β=-0.278, p<0.05) and English students (β=-1.982, p<0.01). The greatest marginal effects, estimated in the English subsample, showed that individuals supporting that food options, such as fish, eggs and dairy products are excluded from plant-based diets have a higher probability of approximately 50% to be mostly unwilling to adopt them. Dissatisfaction with plant-based food attributes was a disincentive to adopting more plant-based dietary choices in both Greek (β=-0.538, p<0.10) and Indian students (β=-0.540, p<0.01).
On the other hand, perceived health benefits were positively related to the willingness to adopt more plant-based diets in Indian participants (β=0.406, p<0.01). Surprisingly, English students who agreed on the health benefits of plant-based diets had a higher probability by 40.3% to restrict themselves from the transition to eating “green”. This finding should be taken into consideration with caution, since there may exist external factors, such as the price of plant-based foods, which could limit the purchasing power of English consumers and undermine their shift to more green-eating patterns. With respect to the perceived barriers in adopting plant-based diets, several indicators were found to be statistically significant (Table 5, Table 6 and Table 7). The perceived difficulty in following a plant-based diet was negatively associated with switching to more green-eating patterns in Indian students (β=-0.748, p<0.01). In addition, the lack of knowledge about the health benefits of consuming plant proteins had the major influence in willingness to adopt plant-based diets, with English students suggesting that lack of information may hamper individuals’ transition to plant-based choices.
Our findings corroborated previous research indicating that motivational factors, such as perceived health benefits and wellbeing improvement [3, 4, 12, 15, 21-22] constitute facilitators for the transition to more plant-based diets, whereas dissatisfaction with attributes, such as taste [3, 22, 23, 81, 83] and price [88-90] discourage their adoption. As discussed above, familiarity and convenience with plant-protein substitutes could also influence consumers’ willingness to adopt plant-based diets. Due to lack of experience in terms of purchase, cooking and preparing meals, animal protein substitutes might be perceived as inconvenient [81, 93]. Furthermore, Kerslake et al. [22] noted that omnivores (higher familiarity with meat products) were reluctant to try meat substitutes and perceived meat products as more convenient, whereas vegans and vegetarians (low familiarity with meat products) considered convenient the consumption of meat substitutes. Convenience and familiarity seem to be interrelated since both may constitute barriers toward the adoption of plant-based diets. Plant-based foods comprise a novel category and neophobic reactions may restrain consumers from their trial [97-99]. Besides, the traditional belief that meat comprises a main component of a balanced meat can further deter individuals from consuming plant-based meat substitutes [97], and also preserve established beliefs on the dietary superiority of the animal protein, enhancing consumers’ mistrust toward the quality of the plant-based protein and the protein adequacy of the plant-based eating patterns.
3.9. Study Limitations
Due to the nature of the sample selection method (snowball sampling), there was an overrepresentation of specific sociodemographic segments (i.e. women, undergraduate students) and homogeneity in terms of lifestyle characteristics, such as physical activity and meal preparation involvement. A random sampling selection design in future research could ensure the participation of more sociodemographic groups (i.e. employed young adults, Gen Zs with lower educational status) with differences in lifestyle, eating patterns, nutrition interests and motivational factors toward the adoption of plant-based diets. A longitudinal research design could also provide insights on how attitudes and purchase behavior toward plant-based foods change over time. Given that the present study focused on the perceived healthiness of the plant-based alternatives, future research should take into consideration the environmental aspects, and also explore the potential interrelations between them.
3.10. Implications for the Food Industry
The present research offered a holistic approach to address the linkage of both motivational and structural adoption barriers with Gen Zs’ intention to shift to more green-eating practices. It underlined the factors associated with youths’ awareness of eating “green” and willingness to adopt more plant-based diets, and noted the critical role of meal preparation involvement and attitudes toward plant-based food options. It also explored how personal factors and perceived barriers toward the adoption of plant-based dietary habits were related with the transition to plant-based diets and revealed the mechanism linking health benefits and convenience/familiarity with consumption intention of plant-based foods, as well as the inverse relationship between meat protein endorsement and willingness to shift to plant-based eating patterns. Our findings showed that these factors had a major influence on Gen Zs’ purchase behavior in all three counties, indicating that beyond cultural differences, there is a rather “homogeneity” in young adults, perhaps due to mass media/social media penetration and influence on youths’ lifestyle. To better communicate animal-protein substitutes to the public, health and nutrition scholars should consider how consumers perceive the associated health impacts and the environmental burden of meat production. Also, from the business perspective, it is of great importance to unveil young people’s decision making process in order to cover “future” consumers’ needs and also create stable, long-lasting and “environmentally friendly” choices.
Past evidence showed that individuals seemed uncertain about the quality of the plant-protein sources [95, 120-122]. Information on plant-based food options could help increase familiarity, and also counter neophobic reactions toward plant-based products. To increase consumers’ acceptability toward animal-protein substitutes and reduce neophobia, recent evidence highlighted the need for product development in such a way to make “novel foods resemble familiar foods” [98]. This could also improve their sensory content and satisfy consumers’ preferences for better taste and texture. Furthermore, in order to satisfy young adults’ demand for protein and nutrient adequacy, food industry should also invest in the fortification of the plant-based foods to supply individuals with all the necessary nutrients for a balanced diet (i.e. proteins, iron, B12). Despite the “healthiness challenge”, food fortification could contribute in reaching sustainability goals, since the subsequent decrease in meat production might help moderate the environmental costs. Previous research noted that the combination of both health and environmental goals could help marketers promote plant-based food options with efficacy, since health and environmental benefits are usually integrated in consumers’ conscience [4, 98, 123]. Beyond product improvement, marketers should also pay attention to the disruption in the market of “green” products due to the inadequate labelling regulation. Alcorta et al. [95] commented on the existing initiatives and labelling regulations, noting that the heterogeneity of regulations across countries can “create a climate of uncertainty and result in a stifling of investment and innovation”. Using clear and creative labelling could help better promote plant-based foods and increase their acceptance in young adults.
4. Conclusion
To conclude, plant-based dietary patterns have grabbed the interest of consumers, scientists and policy makers for their potential to integrate healthiness and sustainability. There are also emerging market opportunities for the food industry to meet an increasing demand for healthy and “environmentally friendly” food products and practices. Although the market of animal-protein substitutes is continually expanding, there are still issues that should be considered and improved to curb the structural and motivational barriers toward the acceptance of plant-based foods, enhance Gen Zs’ shift to eating “green” and provide incentives to the food industry for research and innovation.
Author Contributions
Elena Raptou: Writing – review & editing, Writing – original draft, Visualization, Project administration, Methodology, Investigation, Formal analysis, Data curation. Amalia Tsiami and Giulia Negro: Supervision, Investigation, Conceptualization, Writing – review & editing. Veena Ghuriani and Pooja Baweja: Writing – review & editing, Investigation. Slim Smaoui: Writing – review & editing, Investigation. Theodoros Varzakas: Supervision, Investigation, Conceptualization, Writing – review & editing.
Funding
This research received no external funding.
Data Availability Statement
N/A.
Acknowledgments
N/A.
Conflicts of Interest
The authors declare no conflicts of interest.
References
- De Backer, C. J., L. Hudders. Meat morals: relationship between meat consumption consumer attitudes towards human and animal welfare and moral behavior. Meat science, 99 (2015) 68-74.
- Bryant, C.; Szejda, K.; Parekh, N.; Deshpande, V.; Tse, B. A Survey of Consumer Perceptions of Plant-Based and Clean Meat in the USA, India, and China. Front. Sustain. Food Syst. 2019, 3, 432863. [Google Scholar] [CrossRef]
- Fehér, A.; Gazdecki, M.; Véha, M.; Szakály, M.; Szakály, Z. A Comprehensive Review of the Benefits of and the Barriers to the Switch to a Plant-Based Diet. Sustainability 2020, 12, 4136. [Google Scholar] [CrossRef]
- Willett, W.; Rockström, J.; Loken, B.; Springmann, M.; Lang, T.; Vermeulen, S.; Garnett, T.; Tilman, D.; DeClerck, F.; Wood, A.; et al. Food in the Anthropocene: the EAT–Lancet Commission on healthy diets from sustainable food systems. Lancet,.
- Jahn, S.; Furchheim, P.; Strässner, A.-M. Plant-Based Meat Alternatives: Motivational Adoption Barriers and Solutions. Sustainability 2021, 13, 13271. [Google Scholar] [CrossRef]
- Domingo, J.L.; Nadal, M. Carcinogenicity of consumption of red meat and processed meat: A review of scientific news since the IARC decision. Food Chem. Toxicol. 2017, 105, 256–261. [Google Scholar] [CrossRef]
- Clark, M. A., M. Springmann, J. Hill, D. Tilman. Multiple health and environmental impacts of foods. Proceedings of the National Academy of Sciences 116(46) (2019) 23357-23362.
- Harguess, J.M.; Crespo, N.C.; Hong, M.Y. Strategies to reduce meat consumption: A systematic literature review of experimental studies. Appetite 2019, 144, 104478. [Google Scholar] [CrossRef] [PubMed]
- Ranabhat, C.L.; Park, M.-B.; Kim, C.-B. Influence of Alcohol and Red Meat Consumption on Life Expectancy: Results of 164 Countries from 1992 to 2013. Nutrients 2020, 12, 459. [Google Scholar] [CrossRef]
- Grummon, A.H.; Musicus, A.A.; Salvia, M.G.; Thorndike, A.N.; Rimm, E.B. Impact of Health, Environmental, and Animal Welfare Messages Discouraging Red Meat Consumption: An Online Randomized Experiment. J. Acad. Nutr. Diet. 2023, 123, 466. [Google Scholar] [CrossRef]
- Cheah, I.; Shimul, A.S.; Liang, J.; Phau, I. Drivers and barriers toward reducing meat consumption. Appetite 2020, 149, 104636. [Google Scholar] [CrossRef]
- Graça, J.; Calheiros, M.M.; Oliveira, A. Attached to meat? (Un)Willingness and intentions to adopt a more plant-based diet. Appetite 2015, 95, 113–125. [Google Scholar] [CrossRef]
- de Boer, J.; Schösler, H.; Aiking, H. Towards a reduced meat diet: Mindset and motivation of young vegetarians, low, medium and high meat-eaters. Appetite 2017, 113, 387–397. [Google Scholar] [CrossRef]
- Lentz, G.; Connelly, S.; Mirosa, M.; Jowett, T. Gauging attitudes and behaviours: Meat consumption and potential reduction. Appetite 2018, 127, 230–241. [Google Scholar] [CrossRef] [PubMed]
- Graça, J.; Godinho, C.A.; Truninger, M. Reducing meat consumption and following plant-based diets: Current evidence and future directions to inform integrated transitions. Trends Food Sci. Technol. 2019, 91, 380–390. [Google Scholar] [CrossRef]
- Van Loo, E.J.; Hoefkens, C.; Verbeke, W. Healthy, sustainable and plant-based eating: Perceived (mis)match and involvement-based consumer segments as targets for future policy. Food Policy 2017, 69, 46–57. [Google Scholar] [CrossRef]
- Verain, M.C.D.; Sijtsema, S.J.; Dagevos, H.; Antonides, G. Attribute Segmentation and Communication Effects on Healthy and Sustainable Consumer Diet Intentions. Sustainability 2017, 9, 743. [Google Scholar] [CrossRef]
- Vainio, A. How consumers of meat-based and plant-based diets attend to scientific and commercial information sources: Eating motives, the need for cognition and ability to evaluate information. Appetite 2019, 138, 72–79. [Google Scholar] [CrossRef] [PubMed]
- Reipurth, M.F.; Hørby, L.; Gregersen, C.G.; Bonke, A.; Cueto, F.J.P. Barriers and facilitators towards adopting a more plant-based diet in a sample of Danish consumers. Food Qual. Preference 2018, 73, 288–292. [Google Scholar] [CrossRef]
- Cramer, H.; Kessler, C.S.; Sundberg, T.; Leach, M.J.; Schumann, D.; Adams, J.; Lauche, R. Characteristics of Americans Choosing Vegetarian and Vegan Diets for Health Reasons. J. Nutr. Educ. Behav. 2017, 49, 561–567. [Google Scholar] [CrossRef] [PubMed]
- Adamczyk, D., D. Jaworska, D. Affeltowicz, D. Maison. Plant-based dairy alternatives: consumers’ perceptions, motivations, and barriers—results from a qualitative study in Poland, Germany, and France. Nutrients, 14(10) (2022) 2171.
- Kerslake, E., J. A. Kemper, D. Conroy. What's your beef with meat substitutes? Exploring barriers and facilitators for meat substitutes in omnivores, vegetarians, and vegans. Appetite, 170 (2022) 105864.
- Marinova, D., D. Bogueva. Generation Z and Food Choices. In Food in a Planetary Emergency (2022) (pp. 209-229). Singapore: Springer Nature Singapore.
- Su, C.-H.; Tsai, C.-H.; Chen, M.-H.; Lv, W.Q. U.S. Sustainable Food Market Generation Z Consumer Segments. Sustainability 2019, 11, 3607. [Google Scholar] [CrossRef]
- Meixner, O.; Malleier, M.; Haas, R. Towards Sustainable Eating Habits of Generation Z: Perception of and Willingness to Pay for Plant-Based Meat Alternatives. Sustainability 2024, 16, 3414. [Google Scholar] [CrossRef]
- Pelletier, J.E.; Laska, M.N.; Neumark-Sztainer, D.; Story, M. Positive Attitudes toward Organic, Local, and Sustainable Foods Are Associated with Higher Dietary Quality among Young Adults. J. Acad. Nutr. Diet. 2013, 113, 127–132. [Google Scholar] [CrossRef]
- Kamenidou, I.C.; Mamalis, S.A.; Pavlidis, S.; Bara, E.-Z.G. Segmenting the Generation Z Cohort University Students Based on Sustainable Food Consumption Behavior: A Preliminary Study. Sustainability 2019, 11, 837. [Google Scholar] [CrossRef]
- Alae-Carew, C.; Green, R.; Stewart, C.; Cook, B.; Dangour, A.D.; Scheelbeek, P.F. The role of plant-based alternative foods in sustainable and healthy food systems: Consumption trends in the UK. Sci. Total. Environ. 2021, 807, 151041. [Google Scholar] [CrossRef] [PubMed]
- Hughes, G.; Kress, K.; Armbrecht, E.; Mattfeldt-Beman, M. Dietitian Perception of Plant-Based Protein Quality. J. Acad. Nutr. Diet. 2012, 112, A9. [Google Scholar] [CrossRef]
- Leighton, K.; Kardong-Edgren, S.; Schneidereith, T.; Foisy-Doll, C. Using Social Media and Snowball Sampling as an Alternative Recruitment Strategy for Research. Clin. Simul. Nurs. 2021, 55, 37–42. [Google Scholar] [CrossRef]
- Raptou, E.; Mattas, K.; Tsakiridou, E.; Baourakis, G. Assessing the Aftermath of COVID-19 Outbreak in the Agro-Food System: An Exploratory Study of Experts' Perspectives. Front. Nutr. 2022, 9, 769626. [Google Scholar] [CrossRef] [PubMed]
- Raptou, E. , and Evangelos Manolas. Consumption Patterns and Public Attitudes Toward Organic Foods: The Role of Climate Change Awareness. Springer Nature Switzerland AG 2022 In W. Leal Filho and E. Manolas (eds.), Climate Change in the Mediterranean and Middle Eastern Region, Climate Change Management. [CrossRef]
- Finch, W. H. Exploratory factor analysis (2019) (Vol. 182). Sage Publications.
- Schreiber, J.B. Issues and recommendations for exploratory factor analysis and principal component analysis. Res. Soc. Adm. Pharm. 2020, 17, 1004–1011. [Google Scholar] [CrossRef] [PubMed]
- Hamam, M.; Di Vita, G.; Zanchini, R.; Spina, D.; Raimondo, M.; Pilato, M.; D’amico, M. Consumers’ Attitudes and Purchase Intention for a Vitamin-Enriched Extra Virgin Olive Oil. Nutrients 2022, 14, 1658. [Google Scholar] [CrossRef] [PubMed]
- Blanc, S.; Zanchini, R.; Di Vita, G.; Brun, F. The role of intrinsic and extrinsic characteristics of honey for Italian millennial consumers. Br. Food J. 2021, 123, 2183–2198. [Google Scholar] [CrossRef]
- Gewers, F. L., G. R. Ferreira, H. F. D. Arruda, F. N. Silva, C. H. Comin, D. R. Amancio, L. D. F. Costa. Principal component analysis: A natural approach to data exploration. ACM Computing Surveys (CSUR), 54(4) (2021) 1-34.
- Capitello, R.; Agnoli, L.; Begalli, D. Drivers of high-involvement consumers' intention to buy PDO wines: Valpolicella PDO case study. J. Sci. Food Agric. 2015, 96, 3407–3417. [Google Scholar] [CrossRef]
- Di Vita, G.; Zanchini, R.; Falcone, G.; D’amico, M.; Brun, F.; Gulisano, G. Local, organic or protected? Detecting the role of different quality signals among Italian olive oil consumers through a hierarchical cluster analysis. J. Clean. Prod. 2021, 290, 125795. [Google Scholar] [CrossRef]
- Napitupulu, D.; Kadar, J.A.; Jati, R.K. Validity Testing of Technology Acceptance Model Based on Factor Analysis Approach. Indones. J. Electr. Eng. Comput. Sci. 2017, 5, 697–704. [Google Scholar] [CrossRef]
- Yan, L.K.; Chan, J. Understanding Baby Boomers’ Psychological Contradiction in Adopting Automatic Technology: An Application of Protection Motivation Theory. J. China Tour. Res. 2024, 1–23. [Google Scholar] [CrossRef]
- Kaiser, H.F. An index of factorial simplicity. Psychometrika 1974, 39, 31–36. [Google Scholar] [CrossRef]
- de Araujo, P.D.; Faiad, C.; Araujo, W.M.C. Construction and validation of a scale to measure consumers knowledge of food processing and acceptance of processed food. Nutrition 2023, 105, 111869. [Google Scholar] [CrossRef] [PubMed]
- Hayton, J.C.; Allen, D.G.; Scarpello, V. Factor Retention Decisions in Exploratory Factor Analysis: a Tutorial on Parallel Analysis. Organ. Res. Methods 2004, 7, 191–205. [Google Scholar] [CrossRef]
- Beer, L.; Theuvsen, L. Conventional German farmers’ attitudes towards agricultural wood and their willingness to plant an alley cropping system as an ecological focus area: A cluster analysis. Biomass- Bioenergy 2019, 125, 63–69. [Google Scholar] [CrossRef]
- Ekolu, S. O., H. Quainoo. Reliability of assessments in engineering education using Cronbach’s alpha, KR and split-half methods. Global journal of engineering education, 21(1) (2019) 24-29.
- Zhang, N. How does CSR of food company affect customer loyalty in the context of COVID-19: a moderated mediation model. Int. J. Corp. Soc. Responsib. 2022, 7, 1–10. [Google Scholar] [CrossRef]
- Thotongkam, W.; Champahom, T.; Nilplub, C.; Wimuttisuksuntorn, W.; Jomnonkwao, S.; Ratanavaraha, V. Influencing Travelers’ Behavior in Thailand Comparing Situations of during and Post COVID-19. Sustainability 2023, 15, 11772. [Google Scholar] [CrossRef]
- Liu, J.; Yin, C.; Sun, B. Associations between neighborhood environments and health status among Chinese older people during the pandemic: Exploring mediation effects of physical activity. J. Transp. Heal. 2024, 35. [Google Scholar] [CrossRef]
- Hair, J. F., W. C. Black, B. J. Babin, R. E. Anderson, R. Tatham. Multivariate data analysis. Uppersaddle River (2006).
- Oyewole, G.J.; Thopil, G.A. Data clustering: application and trends. Artif. Intell. Rev. 2022, 56, 6439–6475. [Google Scholar] [CrossRef]
- Calvo-Porral, C., J. Orosa-González, F. Blazquez-Lozano. A clustered-based segmentation of beer consumers: from “beer lovers” to “beer to fuddle”. British Food Journal, 120(6) (2018) 1280-1294.
- Di Vita, G.; Zanchini, R.; Gulisano, G.; Mancuso, T.; Chinnici, G.; D'Amico, M. Premium, popular and basic olive oils: mapping product segmentation and consumer profiles for different classes of olive oil. Br. Food J. 2021, 123, 178–198. [Google Scholar] [CrossRef]
- Kaliji, S.A.; Imami, D.; Canavari, M.; Gjonbalaj, M.; Gjokaj, E. Fruit-related lifestyles as a segmentation tool for fruit consumers. Br. Food J. 2022, 124, 126–142. [Google Scholar] [CrossRef]
- Cardello, A.V.; Llobell, F.; Giacalone, D.; Chheang, S.L.; Jaeger, S.R. Consumer Preference Segments for Plant-Based Foods: The Role of Product Category. Foods 2022, 11, 3059. [Google Scholar] [CrossRef] [PubMed]
- Graciano, P.; Gularte, A.C.; Lermen, F.H.; de Barcellos, M.D. Consumer values in the Brazilian market for ethical cosmetics. Int. J. Retail. Distrib. Manag. 2021, 50, 458–478. [Google Scholar] [CrossRef]
- Oroian, C.F.; Safirescu, C.O.; Harun, R.; Chiciudean, G.O.; Arion, F.H.; Muresan, I.C.; Bordeanu, B.M. Consumers’ Attitudes towards Organic Products and Sustainable Development: A Case Study of Romania. Sustainability 2017, 9, 1559. [Google Scholar] [CrossRef]
- Ikegami, M.; Neuts, B. Strategic Options for Campus Sustainability: Cluster Analysis on Higher Education Institutions in Japan. Sustainability 2020, 12, 2527. [Google Scholar] [CrossRef]
- Theodoridis, P.K.; Zacharatos, T.V. Food waste during Covid-19 lockdown period and consumer behaviour - The case of Greece. Socio-Economic Plan. Sci. 2022, 83. [Google Scholar] [CrossRef]
- Akbay, C.; Tiryaki, G.Y.; Gul, A. Consumer characteristics influencing fast food consumption in Turkey. Food Control. 2006, 18, 904–913. [Google Scholar] [CrossRef]
- Lee, M.-K.; Nam, J. The determinants of live fish consumption frequency in South Korea. Food Res. Int. 2019, 120, 382–388. [Google Scholar] [CrossRef]
- Cantillo, J,.J. C. Martín, C. Román. Determinants of fishery and aquaculture products consumption at home in the EU28. Food Quality and Preference, 88 (2021) 104085.
- Krešić, G.; Dujmić, E.; Lončarić, D.; Zrnčić, S.; Liović, N.; Pleadin, J. Determinants of white and fatty fish consumption by Croatian and Italian consumers. Br. Food J. 2022, 125, 2157–2175. [Google Scholar] [CrossRef]
- Boimah, M.; Weible, D. Origin and dairy consumption in West Africa: A cross-cultural analysis of consumer behaviour. Cogent Food Agric. 2023, 9. [Google Scholar] [CrossRef]
- Spina, D.; Zanchini, R.; Hamam, M.; Di Vita, G.; Chinnici, G.; Raimondo, M.; D'Amico, M. Unveiling the exotic fascination of tropical fruits: The role of food values on consumer behavior towards mangoes. J. Agric. Food Res. 2024, 15. [Google Scholar] [CrossRef]
- Greene, W. H., D. A. Hensher. Modeling ordered choices: A primer. Cambridge University Press (2010).
- Greene, W. H. (2000). Econometric analysis 4th edition. International edition, New Jersey: Prentice Hall, 201-215.
- Dominici, A.; Boncinelli, F.; Gerini, F.; Marone, E. Determinants of online food purchasing: The impact of socio-demographic and situational factors. J. Retail. Consum. Serv. 2021, 60, 102473. [Google Scholar] [CrossRef]
- Martinelli, E. , & De Canio, F. (2021). Purchasing veg private labels? A comparison between occasional and regular buyers. Journal of Retailing and Consumer Services, 63, 102748.
- Hielkema, M.H.; Lund, T.B. Reducing meat consumption in meat-loving Denmark: Exploring willingness, behavior, barriers and drivers. Food Qual. Preference 2021, 93. [Google Scholar] [CrossRef]
- Borusiak, B.; Szymkowiak, A.; Kucharska, B.; Gálová, J.; Mravcová, A. Predictors of intention to reduce meat consumption due to environmental reasons – Results from Poland and Slovakia. Meat Sci. 2021, 184, 108674. [Google Scholar] [CrossRef] [PubMed]
- Pais, D.F.; Marques, A.C.; Fuinhas, J.A. The cost of healthier and more sustainable food choices: Do plant-based consumers spend more on food? Agric. Food Econ. 2022, 10, 1–21. [Google Scholar] [CrossRef] [PubMed]
- Sabaté, J.; Soret, S. Sustainability of plant-based diets: back to the future. Am. J. Clin. Nutr. 2014, 100, 476S–482S. [Google Scholar] [CrossRef]
- Keusch, F. Why do people participate in Web surveys? Applying survey participation theory to Internet survey data collection. Manag. Rev. Q. 2015, 65, 183–216. [Google Scholar] [CrossRef]
- Slauson-Blevins, K., K. M. Johnson. Doing gender.
- Becker, R. (2022). Gender and survey participation: An event history analysis of the gender effects of survey participation in a probability-based multi-wave panel study with a sequential mixed-mode design. Methods, data, analyses: a journal for quantitative methods and survey methodology (mda), 16(1), 3-32.
- Carlsson, F.; Merlo, J.; Lindström, M.; Östergren, P.-O.; Lithman, T. Representativity of a postal public health questionnaire survey in Sweden, with special reference to ethnic differences in participation. Scand. J. Public Heal. 2006, 34, 132–139. [Google Scholar] [CrossRef]
- Maillet, M.A.; Grouzet, F.M.E. Understanding changes in eating behavior during the transition to university from a self-determination theory perspective: a systematic review. J. Am. Coll. Heal. 2023, 71, 422–439. [Google Scholar] [CrossRef]
- Mensah, D.O.; Tuomainen, H. Eating alone or together: Exploring university students’ eating patterns before and during the COVID-19 pandemic. Food Foodways 2024, 32, 163–185. [Google Scholar] [CrossRef]
- Hilger, J.; Loerbroks, A.; Diehl, K. Eating behaviour of university students in Germany: Dietary intake, barriers to healthy eating and changes in eating behaviour since the time of matriculation. Appetite 2017, 109, 100–107. [Google Scholar] [CrossRef] [PubMed]
- Weinrich, R. Cross-Cultural Comparison between German, French and Dutch Consumer Preferences for Meat Substitutes. Sustainability 2018, 10, 1819. [Google Scholar] [CrossRef]
- McBey, D.; Watts, D.; Johnstone, A.M. Nudging, formulating new products, and the lifecourse: A qualitative assessment of the viability of three methods for reducing Scottish meat consumption for health, ethical, and environmental reasons. Appetite 2019, 142, 104349. [Google Scholar] [CrossRef] [PubMed]
- Mullee, A.; Vermeire, L.; Vanaelst, B.; Mullie, P.; Deriemaeker, P.; Leenaert, T.; De Henauw, S.; Dunne, A.; Gunter, M.J.; Clarys, P.; et al. Vegetarianism and meat consumption: A comparison of attitudes and beliefs between vegetarian, semi-vegetarian, and omnivorous subjects in Belgium. Appetite 2017, 114, 299–305. [Google Scholar] [CrossRef] [PubMed]
- Clark, L.F.; Bogdan, A.-M. Plant-based foods in Canada: information, trust and closing the commercialization gap. Br. Food J. 2019, 121, 2535–2550. [Google Scholar] [CrossRef]
- Key, T.J.; Appleby, P.N.; Rosell, M.S. Health effects of vegetarian and vegan diets. Proc. Nutr. Soc. 2006, 65, 35–41. [Google Scholar] [CrossRef] [PubMed]
- Key, T.J.; Papier, K.; Tong, T.Y.N. Plant-based diets and long-term health: findings from the EPIC-Oxford study. Proc. Nutr. Soc. 2021, 81, 190–198. [Google Scholar] [CrossRef] [PubMed]
- Herpich, C.; Mueller-Werdan, U.; Norman, K. Role of plant-based diets in promoting health and longevity. Maturitas 2022, 165, 47–51. [Google Scholar] [CrossRef]
- Appleton, K.M.; Dinnella, C.; Spinelli, S.; Morizet, D.; Saulais, L.; Hemingway, A.; Monteleone, E.; Depezay, L.; Perez-Cueto, F.J.A.; Hartwell, H. Consumption of a High Quantity and a Wide Variety of Vegetables Are Predicted by Different Food Choice Motives in Older Adults from France, Italy and the UK. Nutrients 2017, 9, 923. [Google Scholar] [CrossRef]
- Chen, P.-J.; Antonelli, M. Conceptual Models of Food Choice: Influential Factors Related to Foods, Individual Differences, and Society. Foods 2020, 9, 1898. [Google Scholar] [CrossRef] [PubMed]
- Wongprawmas, R.; Mora, C.; Pellegrini, N.; Guiné, R.P.F.; Carini, E.; Sogari, G.; Vittadini, E. Food Choice Determinants and Perceptions of a Healthy Diet among Italian Consumers. Foods 2021, 10, 318. [Google Scholar] [CrossRef] [PubMed]
- Blanco-Gutiérrez, I.; Varela-Ortega, C.; Manners, R. Evaluating Animal-Based Foods and Plant-Based Alternatives Using Multi-Criteria and SWOT Analyses. Int. J. Environ. Res. Public Heal. 2020, 17, 7969. [Google Scholar] [CrossRef] [PubMed]
- Manners, R.; Blanco-Gutierrez, I.; Varela-Ortega, C.; Tarquis, A.M. Transitioning European Protein-Rich Food Consumption and Production Towards More Sustainable Patterns— Strategies and Policy Suggestions. Sustainability 2020, 12, 1. [Google Scholar] [CrossRef]
- Collier, E.S.; Oberrauter, L.-M.; Normann, A.; Norman, C.; Svensson, M.; Niimi, J.; Bergman, P. Identifying barriers to decreasing meat consumption and increasing acceptance of meat substitutes among Swedish consumers. Appetite 2021, 167, 105643. [Google Scholar] [CrossRef]
- Pais, D.F.; Marques, A.C.; Fuinhas, J.A. The cost of healthier and more sustainable food choices: Do plant-based consumers spend more on food? Agric. Food Econ. 2022, 10, 1–21. [Google Scholar] [CrossRef] [PubMed]
- Alcorta, A.; Porta, A.; Tárrega, A.; Alvarez, M.D.; Vaquero, M.P. Foods for Plant-Based Diets: Challenges and Innovations. Foods 2021, 10, 293. [Google Scholar] [CrossRef]
- Tangyu, M.; Muller, J.; Bolten, C.J.; Wittmann, C. Fermentation of plant-based milk alternatives for improved flavour and nutritional value. Appl. Microbiol. Biotechnol. 2019, 103, 9263–9275. [Google Scholar] [CrossRef]
- Hoek, A. C., P. A. Luning, P. Weijzen, W. Engels, F. J. Kok, C. de Graaf. Replacement of meat by meat substitutes. A survey on person-and product-related factors in consumer acceptance. Appetite, 56(3) (2011) 662-673.
- Jahn, S.; Tsalis, G.; Lähteenmäki, L. How attitude towards food fortification can lead to purchase intention. Appetite 2018, 133, 370–377. [Google Scholar] [CrossRef]
- Pasqualone, A. Balancing Innovation and Neophobia in the Production of Food for Plant-Based Diets. Foods 2022, 11, 1702. [Google Scholar] [CrossRef]
- Hoek, A.C.; Elzerman, J.E.; Hageman, R.; Kok, F.J.; Luning, P.A.; de Graaf, C. Are meat substitutes liked better over time? A repeated in-home use test with meat substitutes or meat in meals. Food Qual. Prefer. 2013, 28, 253–263. [Google Scholar] [CrossRef]
- Biermann, G.; Rau, H. The meaning of meat: (Un)sustainable eating practices at home and out of home. Appetite 2020, 153, 104730. [Google Scholar] [CrossRef] [PubMed]
- Kemper, J.A.; White, S.K. Young adults' experiences with flexitarianism: The 4Cs. Appetite 2020, 160, 105073. [Google Scholar] [CrossRef] [PubMed]
- Schösler, H.; de Boer, J.; Boersema, J.J.; Aiking, H. Meat and masculinity among young Chinese, Turkish and Dutch adults in the Netherlands. Appetite 2015, 89, 152–159. [Google Scholar] [CrossRef] [PubMed]
- Nakagawa, S.; Hart, C. Where’s the Beef? How Masculinity Exacerbates Gender Disparities in Health Behaviors. Socius: Sociol. Res. a Dyn. World 2019, 5. [Google Scholar] [CrossRef]
- Blichfeldt, B.S.; Gram, M. Lost in Transition? Student food consumption. High. Educ. 2012, 65, 277–289. [Google Scholar] [CrossRef]
- Namin, A.; Ratchford, B.T.; Clair, J.K.S.; Bui, M. (.; Hamilton, M.L. Dine-in or take-out: Modeling millennials’ cooking motivation and choice. J. Retail. Consum. Serv. 2019, 53, 101981. [Google Scholar] [CrossRef]
- Azzam, A. . Is the world converging to a ‘Western diet’?. Public health nutrition,24(2)(2020) 309-317.
- Obeid, C.A.; Gubbels, J.S.; Jaalouk, D.; Kremers, S.P.J.; Oenema, A. Adherence to the Mediterranean diet among adults in Mediterranean countries: a systematic literature review. Eur. J. Nutr. 2022, 61, 3327–3344. [Google Scholar] [CrossRef] [PubMed]
- Mattas, K.; Raptou, E.; Alayidi, A.; Yener, G.; Baourakis, G. Assessing the Interlinkage between Biodiversity and Diet through the Mediterranean Diet Case. Adv. Nutr. Int. Rev. J. 2023, 14, 570–582. [Google Scholar] [CrossRef]
- AlOudat, M.; Magyar, N.; Simon-Sarkadi, L.; Lugasi, A. Nutritional content of ready-to-eat meals sold in groceries in Hungary. Int. J. Gastron. Food Sci. 2021, 24, 100318. [Google Scholar] [CrossRef]
- Corrin, T.; Papadopoulos, A. Understanding the attitudes and perceptions of vegetarian and plant-based diets to shape future health promotion programs. Appetite 2017, 109, 40–47. [Google Scholar] [CrossRef] [PubMed]
- Aschemann-Witzel, J.; Gantriis, R.F.; Fraga, P.; Perez-Cueto, F.J.A. Plant-based food and protein trend from a business perspective: markets, consumers, and the challenges and opportunities in the future. Crit. Rev. Food Sci. Nutr. 2020, 61, 3119–3128. [Google Scholar] [CrossRef] [PubMed]
- Pohjolainen, P.; Vinnari, M.; Jokinen, P. Consumers’ perceived barriers to following a plant-based diet. Br. Food J. 2015, 117, 1150–1167. [Google Scholar] [CrossRef]
- Varela, P.; Arvisenet, G.; Gonera, A.; Myhrer, K.S.; Fifi, V.; Valentin, D. Meat replacer? No thanks! The clash between naturalness and processing: An explorative study of the perception of plant-based foods. Appetite 2022, 169, 105793. [Google Scholar] [CrossRef] [PubMed]
- Papadaki, S.; Mavrikaki, E. Greek adolescents and the Mediterranean diet: factors affecting quality and adherence. Nutrition 2015, 31, 345–349. [Google Scholar] [CrossRef] [PubMed]
- Grammatikopoulou, M.G.; Gkiouras, K.; Daskalou, E.; Apostolidou, E.; Theodoridis, X.; Stylianou, C.; Galli-Tsinopoulou, A.; Tsigga, M.; Dardavessis, T.; Chourdakis, M. Growth, the Mediterranean diet and the buying power of adolescents in Greece. J. Pediatr. Endocrinol. Metab. 2018, 31, 773–780. [Google Scholar] [CrossRef] [PubMed]
- Raptou, E. The Role of Snack Choices, Body Weight Stereotypes and Smoking Behavior in Assessing Risk Factors for Adolescent Overweight and Obesity. Foods 2021, 10, 557. [Google Scholar] [CrossRef] [PubMed]
- Bhatnagar, R.S.; Padilla-Zakour, O.I. Plant-Based Dietary Practices and Socioeconomic Factors That Influence Anemia in India. Nutrients 2021, 13, 3538. [Google Scholar] [CrossRef] [PubMed]
- Singh, P.N.; Arthur, K.N.; Orlich, M.J.; James, W.; Purty, A.; Job, J.S.; Rajaram, S.; Sabaté, J. Global epidemiology of obesity, vegetarian dietary patterns, and noncommunicable disease in Asian Indians. Am. J. Clin. Nutr. 2014, 100, 359S–364S. [Google Scholar] [CrossRef]
- Sanchez-Sabate, R.; Sabaté, J. Consumer Attitudes Towards Environmental Concerns of Meat Consumption: A Systematic Review. Int. J. Environ. Res. Public Heal. 2019, 16, 1220. [Google Scholar] [CrossRef]
- Malek, L.; Umberger, W.J.; Goddard, E. Committed vs. uncommitted meat eaters: Understanding willingness to change protein consumption. Appetite 2019, 138, 115–126. [Google Scholar] [CrossRef] [PubMed]
- Niederle, P.; Schubert, M.N. HOW does veganism contribute to shape sustainable food systems? Practices, meanings and identities of vegan restaurants in Porto Alegre, Brazil. J. Rural. Stud. 2020, 78, 304–313. [Google Scholar] [CrossRef]
- Lazzarini, G.A.; Zimmermann, J.; Visschers, V.H.; Siegrist, M. Does environmental friendliness equal healthiness? Swiss consumers’ perception of protein products. Appetite 2016, 105, 663–673. [Google Scholar] [CrossRef] [PubMed]
Figure 1.
Consumers’ attitudes toward plant-based foods (% of participants).
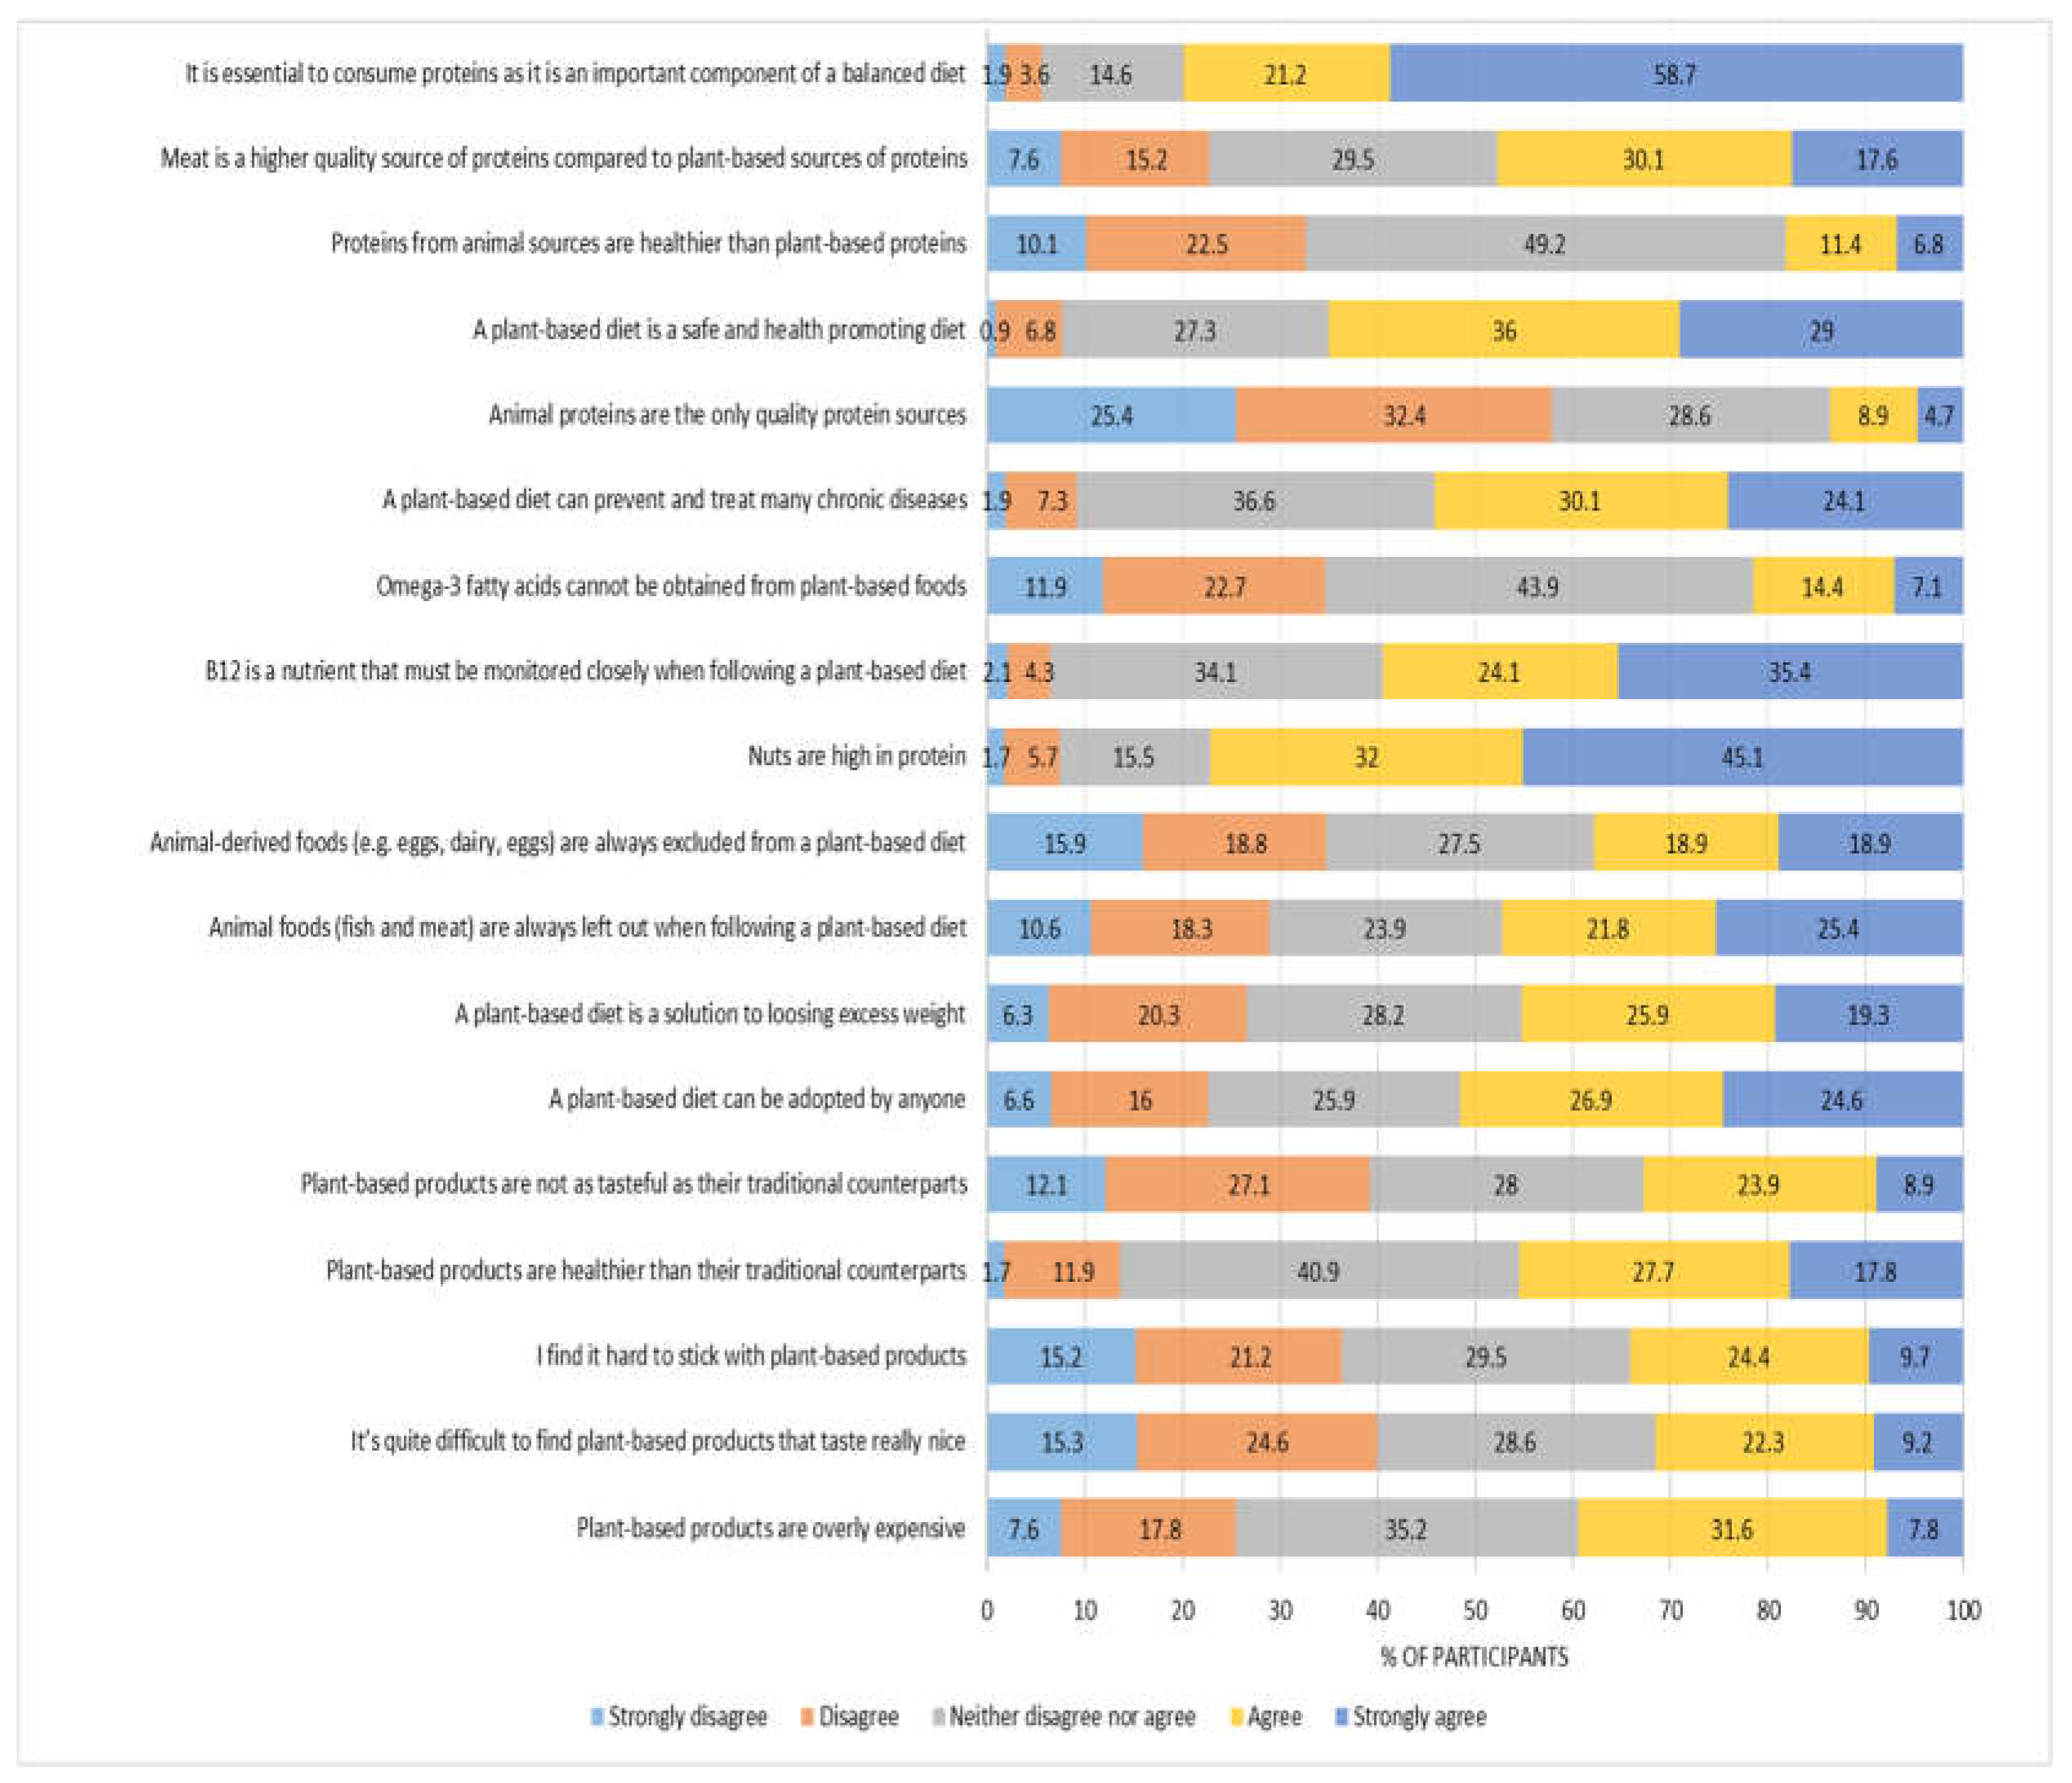

Table 1.
Sample description (N=528).
| Variable | Total sample (N=528) | Greek students (N1=115) | Indian students (N2=306) | English students (N3=107) | Chi-square test | p-value | |
|---|---|---|---|---|---|---|---|
| Gender | Male | 77 | 19 | 2 | 56 | 170.443 | <0.001 |
| (14.6) | (16.5) | (0.7) | (52.3) | ||||
| Female | 451 | 96 | 304 | 51 | |||
| (85.4) | (83.5) | (99.3) | (47.7) | ||||
| Age | 18-23 | 397 | 100 | 294 | 3 | 380.646 | <0.001 |
| (75.2) | (87.0) | (96.1) | (2.8) | ||||
| >23 | 131 | 15 | 12 | 104 | |||
| (24.8) | (13.0) | (3.9) | (97.2) | ||||
| Educational attainment | Undergraduates | 473 | 110 | 298 | 65 | 119.844 | <0.001 |
| (89.6) | (95.7) | (97.4) | (60.7) | ||||
| Postgraduates | 55 | 5 | 8 | 42 | |||
| (10.4) | (4.3) | (2.6) | (39.3) | ||||
| Accommodation | Living with parents /relative | 197 | 22 | 162 | 13 | 77.174 | <0.001 |
| (37.3) | (19.1) | (52.9) | (12.1) | ||||
| University accommodation | 56 | 9 | 24 | 23 | 16.783 | <0.001 | |
| (10.6) | (7.8) | (7.8) | (21.5) | ||||
| Living in a private accommodation | 252 | 80 | 105 | 67 | 53.559 | <0.001 | |
| (47.7) | (69.6) | (34.3) | (62.6) | ||||
| Meal preparation | Responsibility for food shopping | 249 | 87 | 63 | 99 | 212.525 | <0.001 |
| (47.2) | (75.7) | (20.6) | (92.5) | ||||
| Responsibility for meal planning | 229 | 76 | 63 | 90 | 161.142 | <0.001 | |
| (43.4) | (66.1) | (20.6) | (84.1) | ||||
| Responsibility for cooking | 241 | 79 | 63 | 99 | 196.84 | <0.001 | |
| (45.6) | (68.7) | (20.6) | (92.5) | ||||
| Very good/Excellent culinary skills | 67 | 10 | 14 | 43 | 92.864 | <0.001 | |
| (12.7) | (8.7) | (4.6) | (40.2) | ||||
| Personal and lifestyle factors | Knowledgeable about healthy eating | 262 | 65 | 134 | 63 | 10.02 | 0.007 |
| (49.6) | (56.5) | (43.8) | (58.9) | ||||
| Self-perceived balanced diet | 325 | 74 | 175 | 76 | 6.901 | 0.032 | |
| (61.6) | (64.3) | (57.2) | (71.0) | ||||
| High activity level | 83 | 20 | 47 | 16 | 0.320 | 0.852 | |
| (15.7) | (17.4) | (15.4) | (15.0) | ||||
| Social media and TV ad influence | 179 | 40 | 93 | 46 | 5.666 | 0.059 | |
| (33.9) | (34.8) | (30.4) | (43.0) | ||||
| Perceived barriers in adopting a plant-based diet | Absence of interest in consuming plant proteins | 108 | 14 | 50 | 44 | 57.064 | <0.001 |
| (20.5) | (12.2) | (16.7) | (52.0) | ||||
| Perceived difficulty in following a plant based diet | 113 | 38 | 29 | 46 | 85.048 | <0.001 | |
| (21.4) | (33.0) | (9.0) | (54.0) | ||||
| Lack of knowledge about the quality of plant proteins | 74 | 19 | 39 | 16 | 2.195 | 0.334 | |
| (14.0) | (16.0) | (13.0) | (19.0) | ||||
| Lack of knowledge about the health benefits of consuming plant proteins | 83 | 21 | 53 | 9 | 2.595 | 0.273 | |
| (15.7) | (18.0) | (17.0) | (10.0) | ||||
| Willingness to adopt a plant based diet | Mostly unwilling | 63 | 20 | 16 | 27 | 56.092 | <0.001 |
| (14.8) | (18.0) | (7.0) | (27.8) | ||||
| Somewhat willing | 226 | 75 | 100 | 51 | |||
| (53.2) | (67.0) | (46.0) | (52.6) | ||||
| Mostly willing | 136 | 16 | 101 | 19 | |||
| (32.0) | (14.4) | (46.5) | (19.6) | ||||
* %percentages are in parentheses.
Table 2.
Factor analysis (PCA) and reliability analysis output on consumers’ perceptions toward plant based foods (N=528).
Table 2.
Factor analysis (PCA) and reliability analysis output on consumers’ perceptions toward plant based foods (N=528).
| Eigenvalue | Total variance explained % | Factors | Factor loading | Mean | S.D.* | Cronbach α |
|---|---|---|---|---|---|---|
| Factor 1: health benefits of plant-based diets | ||||||
| Plant-based products are healthier than their traditional counterparts | 0.750 | 3.479 | 0.974 | |||
| A plant-based diet is a solution to loosing excess weight | 0.739 | 3.318 | 1.177 | |||
| 2.419 | 13.440 | A plant-based diet is a safe and health promoting diet | 0.680 | 3.852 | 0.949 | 0.744 |
| A plant-based diet can be adopted by anyone | 0.584 | 3.472 | 1.205 | |||
| A plant-based diet can prevent and treat many chronic diseases | 0.540 | 3.676 | 0.970 | |||
| Factor 2: dissatisfaction with plant-based food attributes | ||||||
| It’s quite difficult to find plant-based products that taste really nice | 0.763 | 2.852 | 1.195 | |||
| 2.381 | 13.231 | I find it hard to stick with plant-based products | 0.754 | 2.922 | 1.202 | 0.743 |
| Plant-based products are not as tasteful as their traditional counterparts | 0.735 | 2.903 | 1.159 | |||
| Plant-based products are overly expensive | 0.616 | 3.142 | 1.044 | |||
| Factor 3: Ensuring adequate protein intake in plant-based diets | ||||||
| B12 is a nutrient that must be monitored closely when following a plant-based diet | 0.750 | 3.864 | 1.020 | |||
| 2.197 | 12.204 | It is essential to consume proteins as it is an important component of a balanced diet | 0.704 | 4.313 | 0.975 | 0.651 |
| Nuts are high in protein | 0.695 | 4.131 | 0.986 | |||
| Factor 4: perceived exclusion of animal-based foods | ||||||
| Animal foods (fish and meat) are always left out when following a plant-based diet | 0.841 | 3.330 | 1.317 | |||
| 1.823 | 10.129 | Animal-derived foods (e.g. eggs, dairy, eggs) are always excluded from a plant-based diet | 0.827 | 3.063 | 1.331 | 0.656 |
| Omega-3 fatty acids cannot be obtained from plant-based foods | 0.535 | 2.818 | 1.048 | |||
| Factor 5: attachment to meat proteins | ||||||
| Proteins from animal sources are healthier than plant-based proteins | 0.790 | 2.824 | 0.992 | |||
| 1..670 | 9.276 | Meat is a higher quality source of proteins compared to plant-based sources of proteins | 0.636 | 3.350 | 1.158 | 0.556 |
| Animal proteins are the only quality protein sources | 0.628 | 2.352 | 1.096 | |||
* S.D.: standard deviation.
Table 3.
Cluster analysis results for consumers’ attitudes toward plant based diets (N=528).
| Variables | Total sample | Cluster 1 Plant-based diet proponents (53.8%) |
Cluster 2 Plant-based diet opponents (46.2%) |
Levene’s test for equality of variances | t-test for equality of means |
|||||
|---|---|---|---|---|---|---|---|---|---|---|
| Mean | S.D.* | Mean | S.D.* | Mean | S.D.* | F-test | p-value | t-test | p-value | |
| Health benefits of plant-based diets | 3.560 | 0.746 | 3.660 | 0.756 | 3.443 | 0.717 | 0.691 | 0.406 | 3.370 | 0.001 |
| Dissatisfaction with plant-based food attributes | 2.955 | 0.866 | 2.487 | 0.716 | 3.500 | 0.689 | 1.278 | 0.259 | -16.497 | <0.001 |
| Ensuring adequate protein intake in plant-based diets | 4.102 | 0.763 | 4.033 | 0.860 | 4.183 | 0.624 | 27.373 | <0.001 | -2.318 | 0.021 |
| Perceived exclusion of animal-based foods | 3.070 | 0.953 | 2.467 | 0.749 | 3.772 | 0.630 | 7.389 | 0.007 | -21.730 | <0.001 |
| Attachment to animal-based proteins | 2.842 | 0.789 | 2.536 | 0.709 | 3.198 | 0.727 | 0.141 | 0.708 | -10.571 | <0.001 |
* S.D.: standard deviation.
Table 4.
Cluster profile (N=528).
| Variable | Cluster 1 Plant-based diet proponents (53.8%) |
Cluster 2 Plant-based diet opponents (46.2%) |
Chi-square test* | p-value |
|---|---|---|---|---|
| Gender (female) | 249 | 202 | 2.519 | 0.113 |
| 87.70% | 82.80% | |||
| Age (>23) | 210 | 187 | 0.511 | 0.457 |
| 73.90% | 76.60% | |||
| Education (postgraduates) | 31 | 24 | 0.164 | 0.686 |
| 10.90% | 9.80% | |||
| Living with parents/relatives | 96 | 101 | 3.233 | 0.072 |
| 33.80% | 41.40% | |||
| University accommodation | 32 | 24 | 0.284 | 0.594 |
| 11.30% | 9.80% | |||
| Living in a private accommodation | 143 | 109 | 1.697 | 0.193 |
| 50.40% | 44.70% | |||
| Responsibility for food shopping | 150 | 99 | 7.984 | 0.005 |
| 52.80% | 40.60% | |||
| Responsibility for meal planning | 142 | 87 | 10.995 | 0.001 |
| 50.00% | 35.70% | |||
| Responsibility for cooking | 139 | 102 | 2.697 | 0.101 |
| 48.90% | 41.80% | |||
| Very good/excellent culinary skills | 33 | 34 | 0.635 | 0.426 |
| 11.60% | 13.90% | |||
| Knowledgeable about healthy eating | 151 | 111 | 3.094 | 0.079 |
| 53.20% | 45.50% | |||
| Self-perceived balanced diet | 193 | 132 | 10.652 | 0.001 |
| 68.00% | 54.10% | |||
| High activity level | 51 | 32 | 2.323 | 0.127 |
| 18.00% | 13.10% | |||
| Social media and TV ad influence | 89 | 90 | 1.802 | 0.179 |
| 31.30% | 36.90% |
* α=5%.
Table 5.
Willingness to adopt a plant-based diet – Ordered probit model results for Greek students.
| Variables | Ordered probit model estimates | Marginal effects | ||
|---|---|---|---|---|
| Mostly unwilling | Somewhat willing | Mostly willing |
||
| Sociodemographic characteristics | ||||
| Gender (female) | 0.442 | -0.109 | 0.059 | 0.050 |
| (0.307) | (0.081) | (0.052) | (0.038) | |
| Age (>23) | -0.154 | 0.037 | -0.018 | -0.019 |
| (0.413) | (0.092) | (0.040) | (0.054) | |
| Education (postgraduates) | 0.372 | -0.079 | 0.027 | 0.053 |
| (0.816) | (0.143) | (0.023) | (0.148) | |
| University accommodation | -0.150 | 0.040 | -0.025 | -0.015 |
| (0.630) | (0.178) | (0.122) | (0.056) | |
| Living in a private accommodation | 1.014*** | -0.287*** | 0.192** | 0.094** |
| (0.350) | (0.108) | (0.092) | (0.043) | |
| Meal preparation | ||||
| Responsibility for food shopping | -0.746 | 0.156* | -0.046 | -0.110 |
| (0.539) | (0.089) | (0.049) | (0.108) | |
| Responsibility for meal planning | 0.616 | -0.163 | 0.100 | 0.063 |
| (0.406) | (0.116) | (0.085) | (0.043) | |
| Responsibility for cooking | -1.232*** | 0.265*** | -0.080 | -0.185** |
| (0.337) | (0.079) | (0.070) | (0.074) | |
| Very good/excellent culinary skills | 0.402 | -0.086 | 0.029 | 0.057 |
| (0.501) | (0.090) | (0.025) | (0.087) | |
| Personal/lifestyle factors | ||||
| Knowledgeable about healthy eating | 0.759** | -0.205* | 0.129 | 0.076** |
| (0.374) | (0.106) | (0.088) | (0.035) | |
| Self-perceived balanced diet | -0.524 | 0.120* | -0.053 | -0.068 |
| (0.348) | (0.073) | (0.039) | (0.051) | |
| High activity level | 0.710* | -0.143** | 0.033 | 0.110 |
| (0.423) | (0.068) | (0.050) | (0.092) | |
| Social media and TV ad influence | -0.276 | 0.072 | -0.044 | -0.028 |
| (0.270) | (0.075) | (0.050) | (0.028) | |
| Attitudes toward plant-based diets | ||||
| Health benefits of plant-based diets | 0.159 | -0.040 | 0.022 | 0.018 |
| (0.222) | (0.056) | (0.034) | (0.023) | |
| Dissatisfaction with plant-based food attributes | -0.538* | 0.135* | -0.076 | -0.059 |
| (0.319) | (0.081) | (0.056) | (0.038) | |
| Ensuring adequate protein intake in plant-based diets | 0.545*** | -0.137*** | 0.077* | 0.060** |
| (0.198) | (0.049) | (0.040) | (0.030) | |
| Perceived exclusion of animal-based foods | 0.093 | -0.023 | 0.013 | 0.010 |
| (0.196) | (0.049) | (0.028) | (0.022) | |
| Attachment to animal-based proteins | -0.475* | 0.119* | -0.067 | -0.052* |
| (0.249) | (0.068) | (0.049) | (0.031) | |
| Perceived barriers in adopting a plant-based diet | ||||
| Absence of interest in consuming plant proteins | 0.746* | -0.142** | 0.018 | 0.123 |
| (0.458) | (0.066) | (0.065) | (0.110) | |
| Perceived difficulty in following a plant-based diet | 0.648 | -0.146* | 0.059 | 0.086 |
| (0.434) | (0.085) | (0.040) | (0.077) | |
| Lack of knowledge about the quality of plant proteins | -0.524 | 0.153 | -0.109 | -0.044 |
| (0.524) | (0.172) | (0.147) | (0.032) | |
| Lack of knowledge about the health benefits of consuming plant proteins | -0.315 | 0.088 | -0.059 | -0.029 |
| (0.417) | (0.128) | (0.098) | (0.032) | |
| μ1 | -1.057 | |||
| (1.496) | ||||
| μ2 | 1.510 | |||
| (1.504) | ||||
| LogLikelihood | -74.085 | |||
| Wald chi-squared(22)=47.13, p-value=0.001 | ||||
* statistical significance at p<0.10, **statistical significance at p<0.05, ***statistical significance at p<0.01. Standard errors are in parentheses, Accommodation (living with parents/relative): omitted variable.
Table 6.
Willingness to adopt a more plant-based diet – Ordered probit model results for Indian students.
Table 6.
Willingness to adopt a more plant-based diet – Ordered probit model results for Indian students.
| Variables | Ordered probit model estimates | Marginal effects | ||
|---|---|---|---|---|
| Mostly unwilling | Somewhat willing | Mostly willing | ||
| Sociodemographic characteristics | ||||
| Gender (female) | 0.982** | -0.122 | -0.208*** | 0.331*** |
| (0.476) | (0.097) | (0.043) | (0.119) | |
| Age (>23) | 0.224 | -0.015 | -0.073 | 0.088 |
| (0.441) | (0.035) | (0.134) | (0.169) | |
| Education (postgraduates) | 2.480*** | -0.031*** | -0.545*** | 0.575*** |
| (0.746) | (0.011) | (0.049) | (0.047) | |
| University accommodation | -0.362 | 0.027 | 0.113 | -0.139 |
| (0.304) | (0.030) | (0.083) | (0.112) | |
| Living in a private accommodation | -0.214 | 0.012 | 0.072 | -0.085 |
| (0.206) | (0.013) | (0.068) | (0.081) | |
| Meal preparation | ||||
| Responsibility for food shopping | -0.121 | 0.007 | 0.041 | -0.048 |
| (0.383) | (0.024) | (0.126) | (0.150) | |
| Responsibility for meal planning | 0.290 | -0.013 | -0.102 | 0.115 |
| (0.312) | (0.013) | (0.111) | (0.123) | |
| Responsibility for cooking | -0.006 | 0.000 | 0.002 | -0.002 |
| (0.296) | (0.016) | (0.101) | (0.117) | |
| Very good/excellent culinary skills | -0.862** | 0.098 | 0.201*** | -0.299*** |
| (0.403) | (0.073) | (0.048) | (0.109) | |
| Personal/lifestyle factors | ||||
| Knowledgeable about healthy eating | 0.190 | -0.010 | -0.065 | 0.075 |
| (0.202) | (0.011) | (0.069) | (0.080) | |
| Self-perceived balanced diet | 0.011 | -0.001 | -0.004 | 0.004 |
| (0.196) | (0.011) | (0.067) | (0.078) | |
| High good activity level | -0.755*** | 0.070* | 0.207*** | -0.277*** |
| (0.273) | (0.042) | (0.055) | (0.088) | |
| Social media and TV ad influence | 0.309 | -0.015 | -0.108 | 0.123 |
| (0.199) | (0.010) | (0.071) | (0.078) | |
| Attitudes toward plant-based diets | ||||
| Health benefits of plant-based diets | 0.406*** | -0.022** | -0.139*** | 0.161*** |
| (0.138) | (0.010) | (0.049) | (0.055) | |
| Dissatisfaction with plant-based food attributes | -0.540*** | 0.029*** | 0.185*** | -0.215*** |
| (0.149) | (0.010) | (0.055) | (0.059) | |
| Ensuring adequate protein intake in plant-based diets | 0.266** | -0.014* | -0.091* | 0.106** |
| (0.134) | (0.008) | (0.047) | (0.053) | |
| Perceived exclusion of animal-based foods | -0.278** | 0.015** | 0.095** | -0.110** |
| (0.109) | (0.007) | (0.039) | (0.044) | |
| Attachment to animal-based proteins | -0.218* | 0.012 | 0.075* | -0.087* |
| (0.121) | (0.008) | (0.042) | (0.048) | |
| Perceived barriers in adopting a plant-based diet | ||||
| Absence of interest in consuming plant proteins | -0.158 | 0.009 | 0.053 | -0.062 |
| (0.263) | (0.018) | (0.086) | (0.103) | |
| Perceived difficulty in following a plant-based diet | -0.748** | 0.072 | 0.200*** | -0.272** |
| (0.353) | (0.059) | (0.059) | (0.109) | |
| Lack of knowledge about the quality of plant proteins | 0.406 | -0.017* | -0.144 | 0.161 |
| (0.270) | (0.010) | (0.097) | (0.104) | |
| Lack of knowledge about the health benefits of consuming plant proteins | 0.308 | -0.014 | -0.108 | 0.122 |
| (0.240) | (0.011) | (0.085) | (0.095) | |
| μ1 | 1.361 | |||
| (0.919) | ||||
| μ2 | 0.729 | |||
| (0.924) | ||||
| LogLikelihood | -137.626 | |||
| Wald chi-squared(22)=90.75, p-value<0.001 | ||||
* statistical significance at p<0.10, **statistical significance at p<0.05, ***statistical significance at p<0.01. Standard errors are in parentheses, Accommodation (living with parents/relative): omitted variable.
Table 7.
Willingness to adopt a more plant-based diet – Ordered probit model results for English students.
Table 7.
Willingness to adopt a more plant-based diet – Ordered probit model results for English students.
| Variables | Ordered probit model estimates | Marginal effects | ||
|---|---|---|---|---|
| Mostly unwilling | Somewhat willing | Mostly willing | ||
| Sociodemographic variables | ||||
| Gender (female) | -0.691 | 0.185 | -0.173 | -0.012 |
| (0.426) | (0.121) | (0.115) | (0.015) | |
| Age (>23) | -0.172 | 0.046 | -0.044 | -0.003 |
| (1.080) | (0.313) | (0.299) | (0.014) | |
| Education (postgraduates) | 0.631 | -0.146 | 0.130 | 0.016 |
| (0.465) | (0.099) | (0.088) | (0.020) | |
| University accommodation | 0.886 | -0.171 | 0.136 | 0.035** |
| (0.659) | (0.106) | (0.068) | (0.053) | |
| Living in a private accommodation | 0.405 | -0.108 | 0.101 | 0.007 |
| (0.569) | (0.157) | (0.149) | (0.011) | |
| Meal preparation | ||||
| Responsibility for food shopping | -0.962 | 0.153* | -0.100* | -0.053 |
| (0.887) | (0.084) | (0.053) | (0.096) | |
| Responsibility for meal planning | 1.321** | -0.439** | 0.427* | 0.012 |
| (0.635) | (0.225) | (0.224) | (0.015) | |
| Responsibility for cooking | 0.211 | -0.058 | 0.054 | 0.003 |
| (0.945) | (0.276) | (0.265) | (0.012) | |
| Very good/ excellent culinary skills | -1.087** | 0.296** | -0.275** | -0.021 |
| (0.481) | (0.135) | (0.130) | (0.022) | |
| Personal/lifestyle factors | ||||
| Knowledgeable about healthy eating | 0.856* | -0.225* | 0.209* | 0.016 |
| (0.454) | (0.128) | (0.119) | (0.020) | |
| Self-perceived balanced diet | -0.280 | 0.068 | -0.062 | -0.006 |
| (0.448) | (0.106) | (0.095) | (0.013) | |
| High activity level | 0.408 | -0.087 | 0.076 | 0.012 |
| (0.716) | (0.132) | (0.103) | (0.032) | |
| Social media and TV ad influence | 0.014 | -0.004 | 0.003 | 0.000 |
| (0.424) | (0.107) | (0.099) | (0.008) | |
| Attitudes toward plant-based diets | ||||
| Health benefits of plant-based diets | -1.603*** | 0.403*** | -0.372*** | -0.031 |
| (0.557) | (0.146) | (0.141) | (0.034) | |
| Dissatisfaction with plant-based food attributes | -0.261 | 0.066 | -0.061 | -0.005 |
| (0.322) | (0.082) | (0.075) | (0.008) | |
| Ensuring adequate protein intake in plant-based diets | 1.231* | -0.309* | 0.286* | 0.023 |
| (0.662) | (0.170) | (0.162) | (0.027) | |
| Perceived exclusion of animal-based foods | -1.982*** | 0.498*** | -0.461*** | -0.038 |
| (0.526) | (0.126) | (0.132) | (0.040) | |
| Attachment to animal-based proteins | -0.711 | 0.179 | -0.165 | -0.014 |
| (0.474) | (0.128) | (0.119) | (0.018) | |
| Perceived barriers in adopting a plant-based diet | ||||
| Absence of interest in consuming plant proteins | -0.246 | 0.061 | -0.056 | -0.005 |
| (0.469) | (0.113) | (0.104) | (0.010) | |
| Perceived difficulty in following a plant-based diet | 0.655 | -0.171 | 0.159 | 0.012 |
| (0.486) | (0.133) | (0.124) | (0.016) | |
| Lack of knowledge about the quality of plant proteins | 2.097*** | -0.253*** | 0.005 | 0.248 |
| (0.764) | (0.084) | (0.186) | (0.211) | |
| Lack of knowledge about the health benefits of consuming plant proteins | -2.262** | 0.742*** | -0.730*** | -0.012 |
| (0.913) | (0.197) | (0.201) | (0.014) | |
| μ1 | -8.737 | |||
| (3.889) | ||||
| μ2 | -5.310 | |||
| (3.734) | ||||
| LogLikelihood | -38.940 | |||
| LR chi-squared(22)=73.21, p-value<0.001 | ||||
* statistical significance at p<0.10, **statistical significance at p<0.05, ***statistical significance at p<0.01. Standard errors are in parentheses, Accommodation (living with parents/relative): omitted variable.
Disclaimer/Publisher’s Note: The statements, opinions and data contained in all publications are solely those of the individual author(s) and contributor(s) and not of MDPI and/or the editor(s). MDPI and/or the editor(s) disclaim responsibility for any injury to people or property resulting from any ideas, methods, instructions or products referred to in the content. |
© 2024 by the authors. Licensee MDPI, Basel, Switzerland. This article is an open access article distributed under the terms and conditions of the Creative Commons Attribution (CC BY) license (https://creativecommons.org/licenses/by/4.0/).
Copyright: This open access article is published under a Creative Commons CC BY 4.0 license, which permit the free download, distribution, and reuse, provided that the author and preprint are cited in any reuse.


