Submitted:
27 May 2024
Posted:
06 June 2024
You are already at the latest version
Abstract
Nanostructured lipid carriers (NLC) are typically composed of liquid lipids, solid lipids, and surfactants, enabling the encapsulation of lipophilic drugs. Butamben is a Class II anesthetic drug according to the Biopharmaceutical Classification System (BCS), it has a log P 2.87 and is considered a 'brick dust' (poorly water-soluble and poorly lipid-soluble) drug. This characteristic poses a challenge for the development of NLCs, as they are not soluble in the liquid lipid present in the NLC core. In a previous study [1] we have developed a NLC core consisting of solid lipid (CrodamolTM CP), liquid lipid of medium polarity (SRTM Lauryl lactate), and a hydrophilic excipient (SRTM DMI) that allowed the solubilization of 'brick dust' type of drugs including butamben. In this study, starting from the NLC core formulation previously developed we carried out the optimization of the surfactant system and evaluated their performance in aqueous medium. Three different surfactants (CrodasolTM HS HP, SynperonicTM PE/F68, and CroduretTM 40) were studied and, for each of them, a 2³ factorial design was stablished, with total lipids, % surfactant, and sonication time (min) as the input variables and particle size (nm), polydispersity index (PDI) and zeta potential (mV) as the response variables. Stable NLCs were obtained using CrodasolTM HS HP and SynperonicTM PE/F68 as surfactants. Through a comparison between NLCs developed with and without SRTM DMI, it was observed that besides helping the solubilization of butamben in the NLC core, this excipient helped stabilizing the system and decreasing particle size NLCs containing CrodasolTM HS HP and SynperonicTM PE/F68 presented particle size values in the nanometric scale, PDI lower than 0.3 and zeta potential above |10|mV. Concerning NLCs stability, SBTB-NLC with SynperonicTM PE/F68 and butamben demonstrated stability over a 3-month period in aqueous medium. The remaining NLCs showed phase separation or precipitation during the 3-month analysis. Nevertheless, these formulations could be freeze-dried after preparation, which would avoid precipitation in aqueous medium.
Keywords:
Nanostructured Lipidic Carriers
; Design of Experiment
; Butamben
1. Introduction
The use of low water solubility drugs in the development of pharmaceutical formulations has motivated the research related to the development of new delivery and release systems, which must be capable of increasing their bioavailability and absorption, regardless of the route of administration [2,3]. Drugs exhibiting poor solubility in water are generally classified according to the Biopharmaceutical Classification System (SCB) as belonging to Classes II and IV. This classification considers two key physicochemical parameters: aqueous solubility and intestinal permeability [4,5].
Drugs belonging to class II present low aqueous solubility and high permeability in cell membranes, in this case, in addition to solubility, their dissolution rate will affect their absorption by the gastrointestinal tract, as at this stage of the absorption process the medicine must be solubilized to be absorbed [6,7]. This is the case of butamben, which, besides being classified as Class II, also exhibits a “brick dust” behavior, indicating poor solubility in water and limited solubility in lipids [5,7,8,9]. One of the ways to improve the absorption and bioavailability of these types of drugs is through incorporation into nanostructured lipid carriers (NLC), which increase drug absorption. NLCs reduce formulation particle size, leading to an increase in surface area, which results in greater exposure of lipid fractions in epithelial membranes. This promotes bioadhesion to the gastrointestinal walls, prolonging their residence time in the gastrointestinal tract and thus increasing their absorption [5,7,8,9].
Nanostructured lipid carriers consist of a solid lipid matrix (biodegradable and biocompatible), containing a mixture of solid and liquid lipids dispersed in an aqueous phase containing surfactants. [10,11]. NLCs are considered 2nd generation carriers, as they present a variation in their internal structure when compared to 1st generation carriers (solid lipid nanoparticles, SLN), attributed to the introduction of a liquid lipid. This structural variation disrupts the order of solid lipid crystals, resulting in an increase in drug accommodation spaces and inhibiting drug crystallization. Furthermore, the presence of solid lipids also contributes to inhibiting the drug crystallization process. Due to this, NLCs achieve greater drug incorporation with higher encapsulation efficiency and enhanced stability of the lipid matrix [10,12].
The use of experimental design and optimization (DOE) methods allows the reduction of the number of experiments in order to determine the optimal amount of excipientes and therefore, achieve an adequate and stable formulation in the face of different quality attributes [13,14]. The DOE is a systematic tool in which it is possible to determine the relationships between the input (x) and output (Y) variables, thus providing a better understanding of the process and the optimization of this process. Through DOE, it is possible to optimize the developed formulations, thus generating results that demonstrate the best process conditions and the proportion of excipients to be used to obtain greater quality and effectiveness of the product [13].
Several works have been carried out associating the development of lipid formulations such as nanostructured lipid carriers with strategies that employ the use of DOE. In these articles, the DOE technique is used to optimize the formulation by investigating the effect of changes in the proportion of solid lipid, liquid lipid, surfactant, and co-surfactant on the important characteristics of the NLC formed, as well as the possible influence of the manufacturing process and drug concentration on the quality of the final product. The in-vitro responses used were particle size, PDI, zeta potential to encapsulation efficiency [15,16,17,18,19,20,21,22].
The present paper describes the second part of a the study [1], in which Raman microscopy and DOE were used to evaluate the miscibility between excipients candidates for a medium polarity lipidic core. Thus, it was determined that the ideal mixture would be composed of Crodamol CPTM (40% w/w), Lauryl LactateTM (25% w/w), and DMITM (25% w/w), as they presented adequate miscibility with one another and also good solubilization capacity for butamben, a brick-dust type of drug.
This study evaluated three different types of surfactants for NLC formation in aqueous medium: CrodasolTM HS HP, SynperonicTM PE/F68, and CroduretTM 40 and looked into more details of the use of Super RefinedTM DMI (SRTM DMI) within the lipid core.
2. Materials and Methods
2.1. Excipients
Crodamol™ CP pharma (INCI name: Cetyl Palmitate), Super Refined™ Lauryl Lactate (INCI name: Lauryl Lactate), Super Refined™ DMI (INCI name: Dimethyl Isosorbide), Croduret™ 40 (INCI name: PEG-40 hydrogenated castor oil), Crodasol™ HS HP (INCI name: Macrogol 15 Hydroxystearate), and SynperonicTM PE/F68 (INCI name: Poloxamer 188). All excipients were donated by Croda do Brazil (Campinas, SP, Brazil). All other chemicals and solvents were of analytical grade.
2.2. Preparation of BTB-Loaded NLCs
The nanostructured lipid carrier formulations were prepared using the emulsification-ultrasonication method [23]. The technique involves adding the aqueous phase to the oil phase under agitation using an ultra-turrax, followed by sonication. To prepare the NLC, the lipid phase, composed of CrodamolTM CP, Super RefinedTM Lauryl Lactate, and Super Refined™ DMI along with butamben (5% w/w), was weighed and heated in a water bath to 65°C. Simultaneously, the aqueous phase, consisting of one of the selected surfactants and 10mL of MilliQ water was heated to the same temperature as the lipid phase. The aqueous phase was then added to the lipid phase to form the pre-emulsion, with stirring at 11000 rpm, for 3 minutes using the Ultra-Turrax (T18, IKA WerkeStaufen, Germany). The pre-emulsion formed underwent tip sonication, involving ultrasonic agitation with a titanium microtip (Vibracell equipment – Sonics-VibraCell Sonicator), at an amplitude of 70% and 20KHz nominal frequency, for 5 or 10 minutes with alternating cycles of 30s (on-off). The same procedure was followed for the preparation of drug-free NLC.
2.3. Experimental Design and Optimization of BTB-Loaded NLCs
For NLC formulations, the following variables were studied through a 2³ full factorial design with triplicates at the central point: % total lipids, % surfactant, and a process variable associated with the emulsification-ultrasonication method, the sonication time (min) (Table 1). Butamben concentration was fixed at 5%. The objective of this step was to identify the most promising proportions of the selected excipients and evaluate these formulations based on critical quality attributes: particle size, polydispersity, and zeta potential.
The factorial design shown in Table 1 was carried out for the three selected surfactants (CrodasolTM HS HP, SynperonicTM PE/F68, and CroduretTM 40). Statistical analysis of the results was utilized to examine the influence of each excipient on each response and desirability functions were used to achieve the overall optimization using the Design Expert version 13 (Stat-Ease Inc., Minneapolis, MN, USA) program.
The optimized NLCs determined by the DOE results were prepared with butamben and without butamben to carry out freeze-drying for further Differential Scanning Calorimetry (DSC) and Infrared Spectroscopy (FT-IR) analyses. Furthermore, formulations were prepared with and without the inclusion of SRTM DMI to investigate its influence on the NLC system.
2.4. Characterization of Butamben Loaded-NLC
2.4.1. Particle size, Polydispersity Index (PDI), and Zeta Potential (ZP)
Particle size and zeta potential are important parameters for the physical stability of dispersed systems. The average particle size, polydispersity index (PDI), and zeta potential were determined by dynamic light scattering (DLS) using the Zetasizer Nano ZS 90 analyzer (Malvern Instruments, UK). Determinations were carried out at 25°C. Zeta potential was determined by employing the laser Doppler electrophoresis method. An aliquot of the freshly prepared dispersion was dispersed in deionized water and diluted 1000x for particle size and zeta potential analyses.
2.4.2. Nanoparticle Tracking Analysis
Nanoparticle tracking analysis (NTA) was conducted to determine the size, distribution, and concentration of nanoparticles in the developed formulations, providing a real-time concentration of nanoparticles (particles/mL) [24,25]. Measurements were performed using the NS300 equipment (NanoSight, Amesbury, UK), which is equipped with a 532 nm laser. The samples were diluted in deionized water (50000x) and then transferred to a sample holder with a syringe. Data are expressed as the mean ± standard deviation, and measurements were performed in triplicate.
2.4.3. Differential Scanning Calorimetry (DSC)
Differential scanning calorimetry measurements were performed using the DSC Q100 equipment (TA Instruments, DE, USA). For analysis, the samples were placed in hermetically sealed aluminum crucibles. The test was conducted under a dynamic argon atmosphere (50 mL/min) with a heating rate of 10°C/min and a heating range of 10 to 220°C. The following samples were analyzed: lyophilized NLCs (SBTB-NLC (NLC with SynperonicTM PE/F68, and BTB), CBTB-NLC (NLC with CrodasolTM HS HP, and BTB), S-NLC (NLC with SynperonicTM PE/F68 without BTB), and C-NLC (NLC with CrodasolTM HS HP without BTB)), the drug (Butamben), the solid lipid (CrodamolTM CP), and the surfactants (CrodasolTM HS HP and SynperonicTM PE/F68).
2.4.4. Fourier Transform Infrared-Attenuated Total Reflectance
FTIR spectra were obtained for the lyophilized formulations (SBTB-NLC, CBTB-NLC, S-NLC, and C-NLC), the drug (Butamben), the solid lipid (CrodamolTM CP), and the surfactants (CrodasolTM HS HP, and SynperonicTM PE/F68). The equipment used was an Agilent Cary 630 Fourier transforms infrared spectrophotometer with attenuated total reflectance (ATR FTIR), 128 scans per analysis, resolution of 2.0 cm-1, in the range of 4000 to 400 cm-1.
2.5. 3-Month Stability Study of the Optimized NLCs
Based on the definition of the optimized NLCs, an accelerated stability study of pilot formulations was conducted for a period of up to 3 months, after which the formulations were re-evaluated for particle size, PDI, and zeta potential. The stability test was carried out with NLCs containing BTB, with SRTM DMI, and without SRTM DMI.
3. Results and Discussion
3.1. Factorial Designs
As previously mentioned in the methodology, the selection of excipients for the NLC core and their proportions were determined in a previous study through Raman mapping and DOE [1]. From this previous study, it was established that CrodamolTM CP would be used as a solid lipid, SRTM DMI, and SRTM Lauryl Lactate as a liquid lipid (SRTM DMI is indeed a solvent, however since it goes within with lauryl lactate, it will be denoted here ‘liquid lipid’ as well) and several drugs were evaluated, including Butamben. The proportions between CrodamolTM CP and Super RefinedTM Lauryl Lactate were set at 1:1.6 (w/w), and the ratio of SRTM DMI to Super RefinedTM Lauryl Lactate was 1:1 (w/w).
The 23 factorial design aimed at identifying the optimal percentage of total lipids, the most effective surfactant and its percentage (critical material attributes - CMAs), and the optimal sonication time (critical process attribute - CPP) that would allow the achievement of suitable particle size, PDI, and zeta potential – considered critical quality attributes (CQAS). Table 2 outlines the selected independent and dependent variables along with the specified objectives for particle size, PDI, and zeta potential.
The selected surfactants for the study were CrodasolTM HS HP, SynperonicTM PE/F68, and CroduretTM 40. Through the 2³ design for each surfactant, 11 different experimental combinations were obtained for formulations and subsequent analysis (Table 3).
3.1.1. Interpretation of Responses Obtained for the DOE Using CrodasolTM HS HP as Surfactant
The responses obtained for the design with CrodasolTM HS HP as a surfactant are presented in Table 4. The regression was significant for particle size and PDI and not for zeta potential, i.e. the deliberate experimental variations did not affect this response. Linear models were well adjusted for both responses. The effect of excipients on the responses of interest is detailed in Table 4 and Figure 1, and the residue analysis of linear models is depicted in Figure 2.
As can be seen in Table 4, formulation particle size ranged from 244.93 nm to 698.93 nm, PDI from 0.176 to 0.349, and zeta potential from 25.66 to 29.26.
For the Particle size response, the R² was 0.9987. Residual analysis graphs (Fig.2.A-B) indicated that the residuals follow a normal distribution, are homoscedastic and independent. Additionally, Fig. 2C shows an excellent agreement between the predicted and actual values, thus indicating the model’s good predictive capability. As described in Table 5, the particle size response exhibited two significant main effects and three significant interactions. Analyzing the significant effects, CrodasolTM HS HP, % surfactant (X2), and the total lipid (X1) variables showed positive effects. The positive effect of the surfactant was unexpected since, typically, in such formulations, the surfactant effect is negative, i.e., as the concentration increases, the size decreases. A possible explanation is that higher concentrations of CrodasolTM HS HP result in a predominance of hydrophobic interactions due to non-polar groups, such as the long alkyl chains of the hydroxyl stearate portion of the surfactant, the interactions between the lipids and the surfactant, causing an increase of size [26]. This outcome was also observed by Almousallam and collaborators, who have used Kolliphor® P 188 as a surfactant [27]. The positive effect of the total lipid was attributed to the increase in the lipid concentration causing lipid particle coalescence, and therefore an increase in particle size [26].
For the PDI response, the R² was 0.7348. The residual analysis graphs (Fig.2.D-F) show that the model residuals follow a normal distribution, are homoscedastic and independent. As indicated in Table 5, the PDI response showed only surfactant (X2) as a significant effect. The increase in the concentration of CrodasolTM HS HP is responsible for the increase in the PDI of the formulations, this increase may be because the increase in surfactant causes particle aggregation, resulting from the surfactant binding on the surface of the nanoparticle [28].
Figure 3A shows the 3D surface and it becomes evident that particle size is influenced by the interaction between variables X1 and X2. Higher levels of the variables X1, X2, result in larger particle sizes, whereas lower levels are associated with smaller particle sizes. Consequently, to achieve smaller particle sizes (indicated by the blue region in the graph), it would be ideal to work with a lower % of surfactant (5%), a lower % of total lipids (10%), and a shorter sonication time (5min). The shorter sonication time is due to the interaction between this variable and variable X2. Figure 3B shows the surface graph which clearly indicates that the PDI is influenced solely by variable X2. Therefore, to achieve lower PDIs (indicated by the blue region in the graph), it is advisable to work with a lower % of surfactant (5%).
After processing the data and generating the mathematical model for each property of interest (particle size, PDI, and zeta potential), it was possible to define the optimized formulation for each surfactant used. Desirability was used with the following criteria for the responses: minimize particle size and PDI and maximize zeta potential. The desirability graph indicates the formulation that best meets the desired criteria (the closer to 1 the better).
For the formulation containing CrodasolTM HS HP as a surfactant, the desirability was 0.892 (Figure 3C). Therefore, for the CrodasolTM HS HP surfactant, the optimized formulation was defined with 10% Total Lipids, 5% surfactant, and 7.5 minutes of sonication time. The formulation was prepared again and monitored in the stability study, with subsequent characterization.
3.1.2. Interpretation of Responses Obtained for the DOE Using SynperonicTM PE/F68 as Surfactant
The obtained responses for the design using SynperonicTM PE/F68 as a surfactant are presented in Table 6. The models were significant for particle size and zeta potential whereas the experimental variations did not affect PDI. This indicates the robustness of the CQA regarding the chosen parameters. The lack of fit was nonsignificant for particle size and zeta potential.
For the Particle size, the R² was 0.8465. The residual analysis graphs (Fig.5.A-B) show that the model residuals follow a normal distribution, are homoscedastic, and independent of each other. Additionally Fig. 5C demonstrates the good agreement between predicted and actual values, indicating the predictive capacity of the model. The particle size of the formulations ranged from 157 nm to 260 nm and, as shown in Table 7 and Figure 4, only the surfactant SynperonicTM PE/F68 (X2) has a significant (negative) effect. This negative effect for the surfactant is expected, as the surfactant reduces the surface tension between the lipid and aqueous phases, resulting in the formation of smaller nanoparticles and preventing the coalescence of larger droplets [15,28]. This is clear when analyzing Figure 6A, which includes the surface graphs, Therefore, to obtain smaller particle sizes (indicated by the blue region in the graph), it would be optimal to work with a higher % of surfactant (10%).
For the Zeta Potential response, the R² was 0.9116. In the residual analysis graphs (Figure 5.D-E) it is observed that the model residuals follow a normal distribution, are homoscedastic, and independent of each other. Fig. 5F shows a good agreement between predicted and actual values, thus indicating the good predictive capability of the model. As shown in Table 7 and Figure 4, the Zeta Potential response presented surfactant and sonication time as a significant effects. The zeta potential of the formulations varied between |4| mV and |19.7| mV.
When analyzing Figure 6.B, which includes the surface graphs, it is noted that the variables that affect the zeta potential are surfactant (X2) and sonication time (X3). The variable X2 is associated with an increase in zeta potential when used at its lowest level and the variable X3 is associated with an increase in zeta potential when used at its highest level. Therefore, to obtain higher potentials, it would be optimal to work with a lower % of surfactant (5%), a lower % of total lipid (10%), and a longer sonication time (10 minutes).
For the formulation containing SynperonicTM PE/F68 as a surfactant, the desirability was 0.656 (Figure 6.C). It is worth noting that Figure 6.C is shown in full green, as the particle size effect presented the desirability criterion (size smaller than 260 nm) at all tested points. Therefore, for the surfactant SynperonicTM PE/F68, the optimized formulation was defined with 20% Total Lipids, 10% surfactant, and 10 minutes of sonication time. The formulation was prepared again and monitored in the stability study, with subsequent characterization.
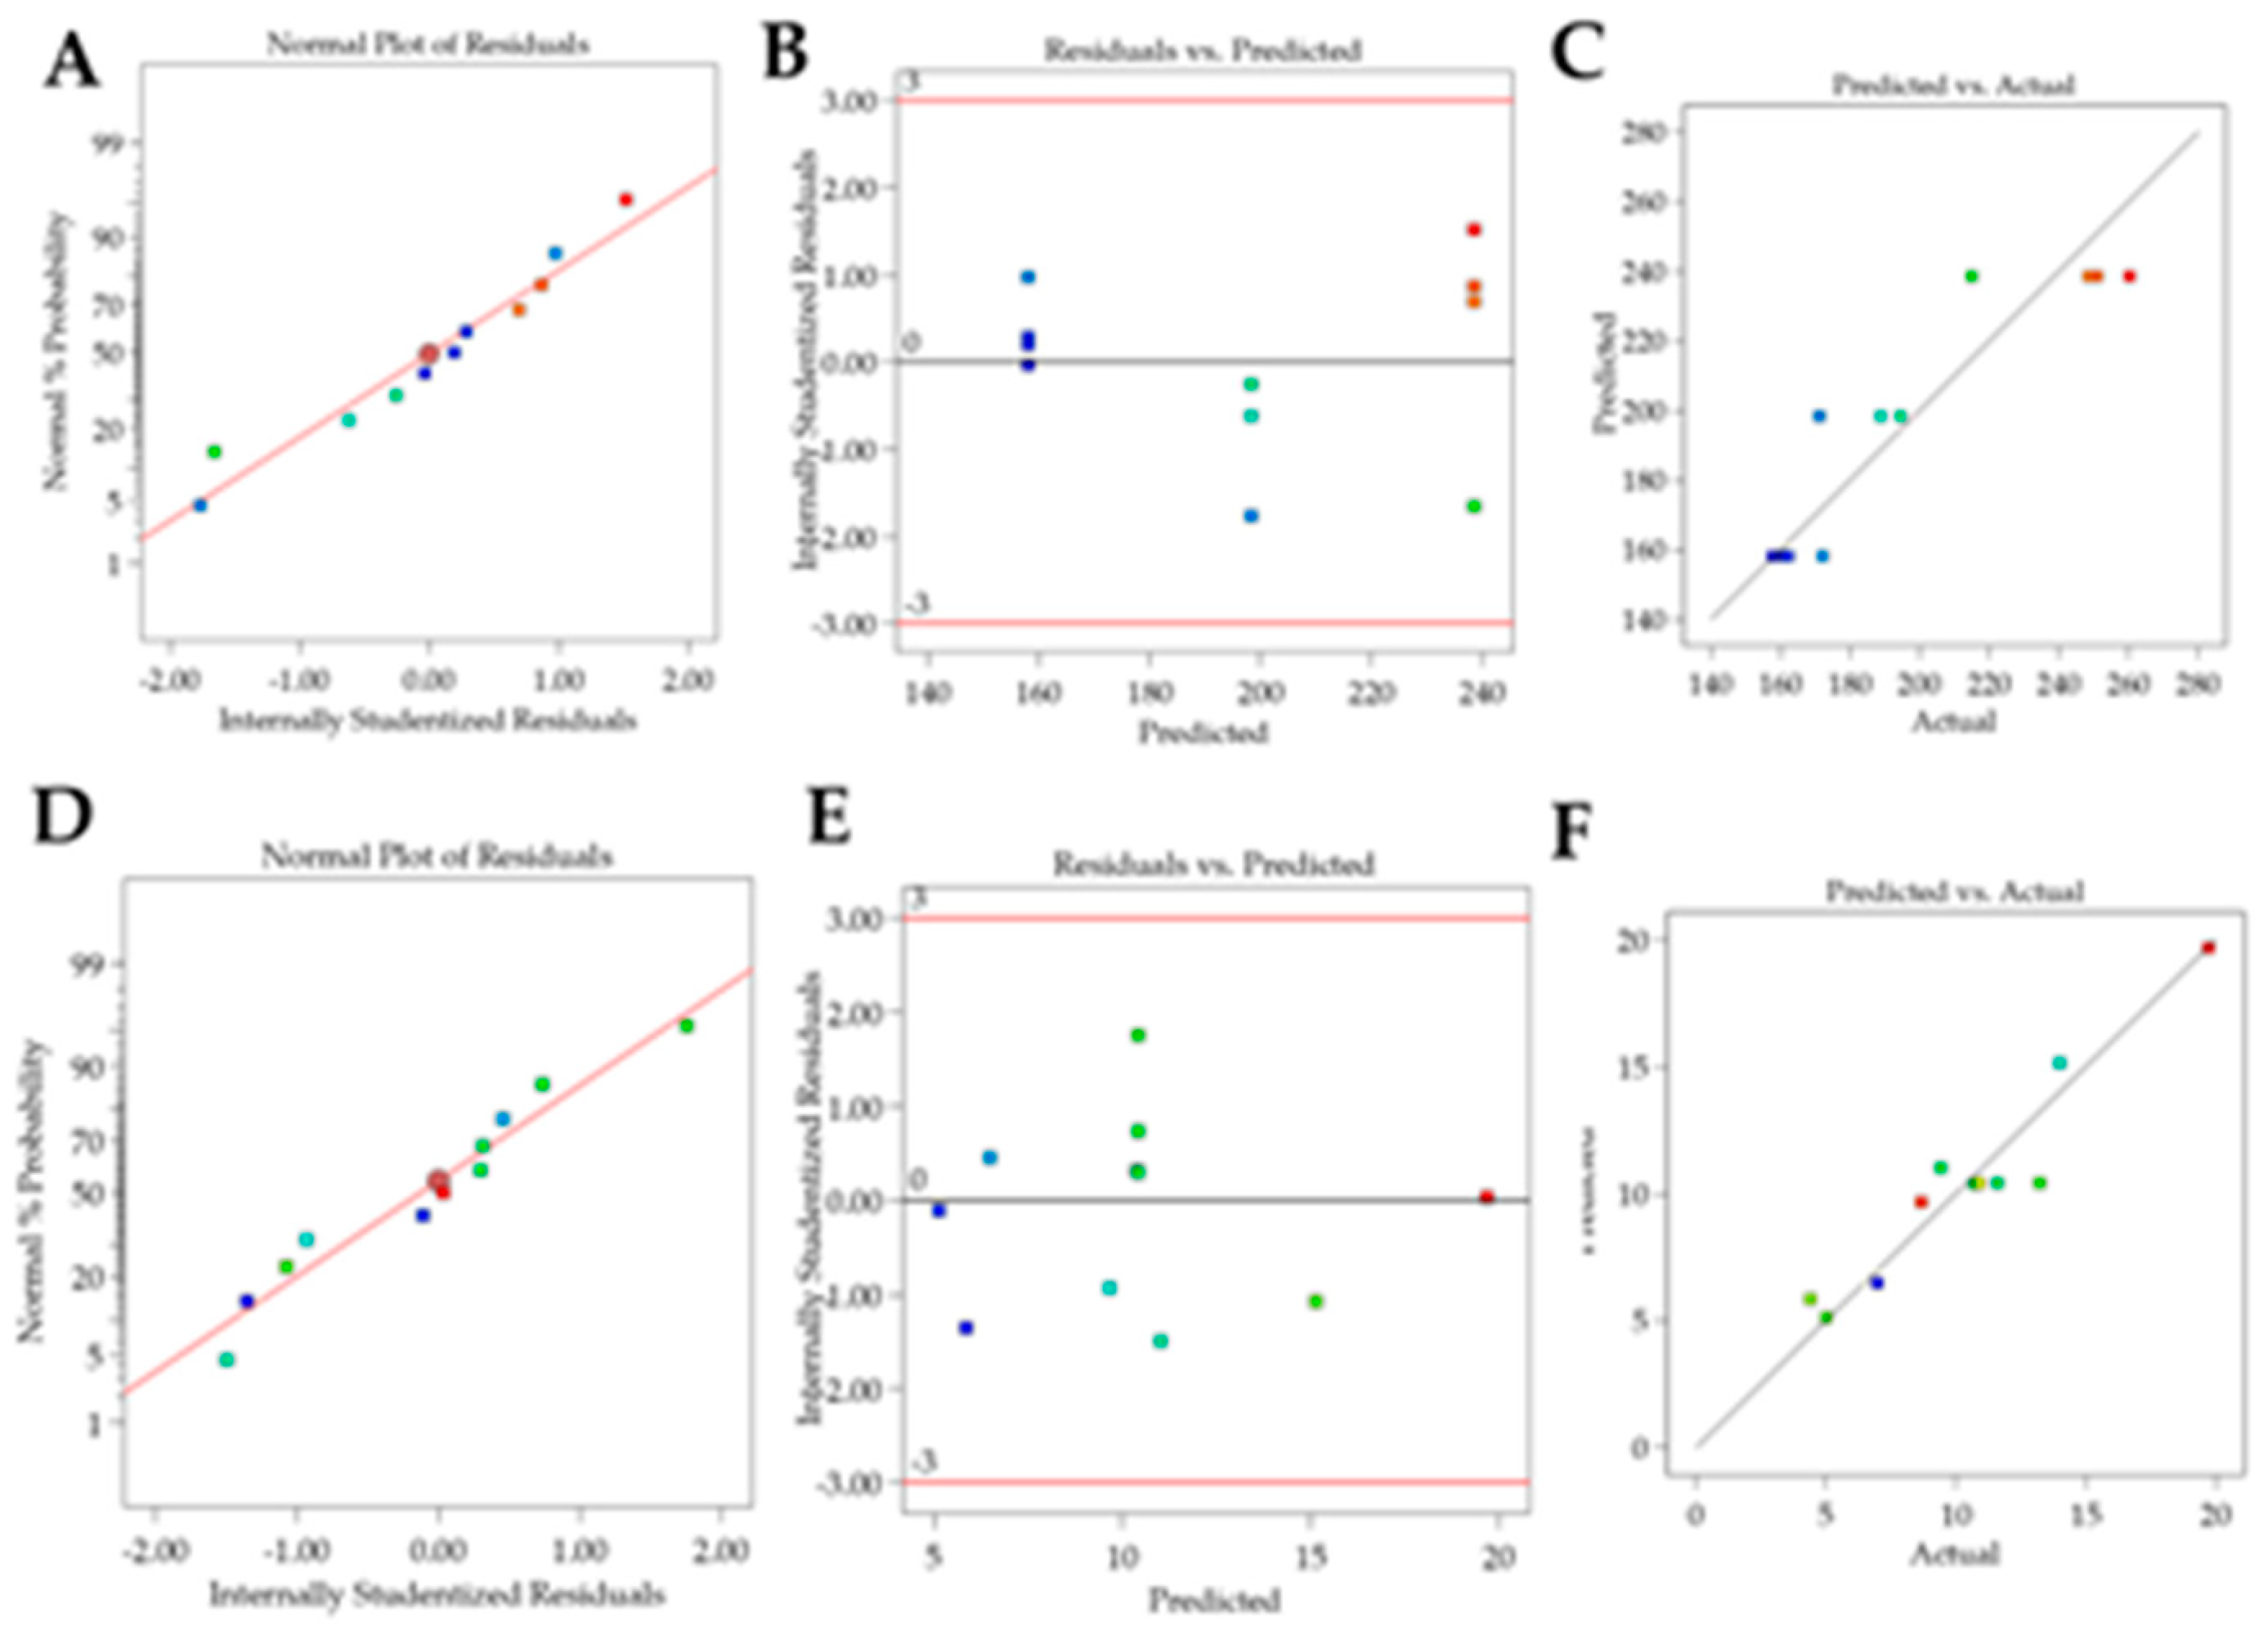
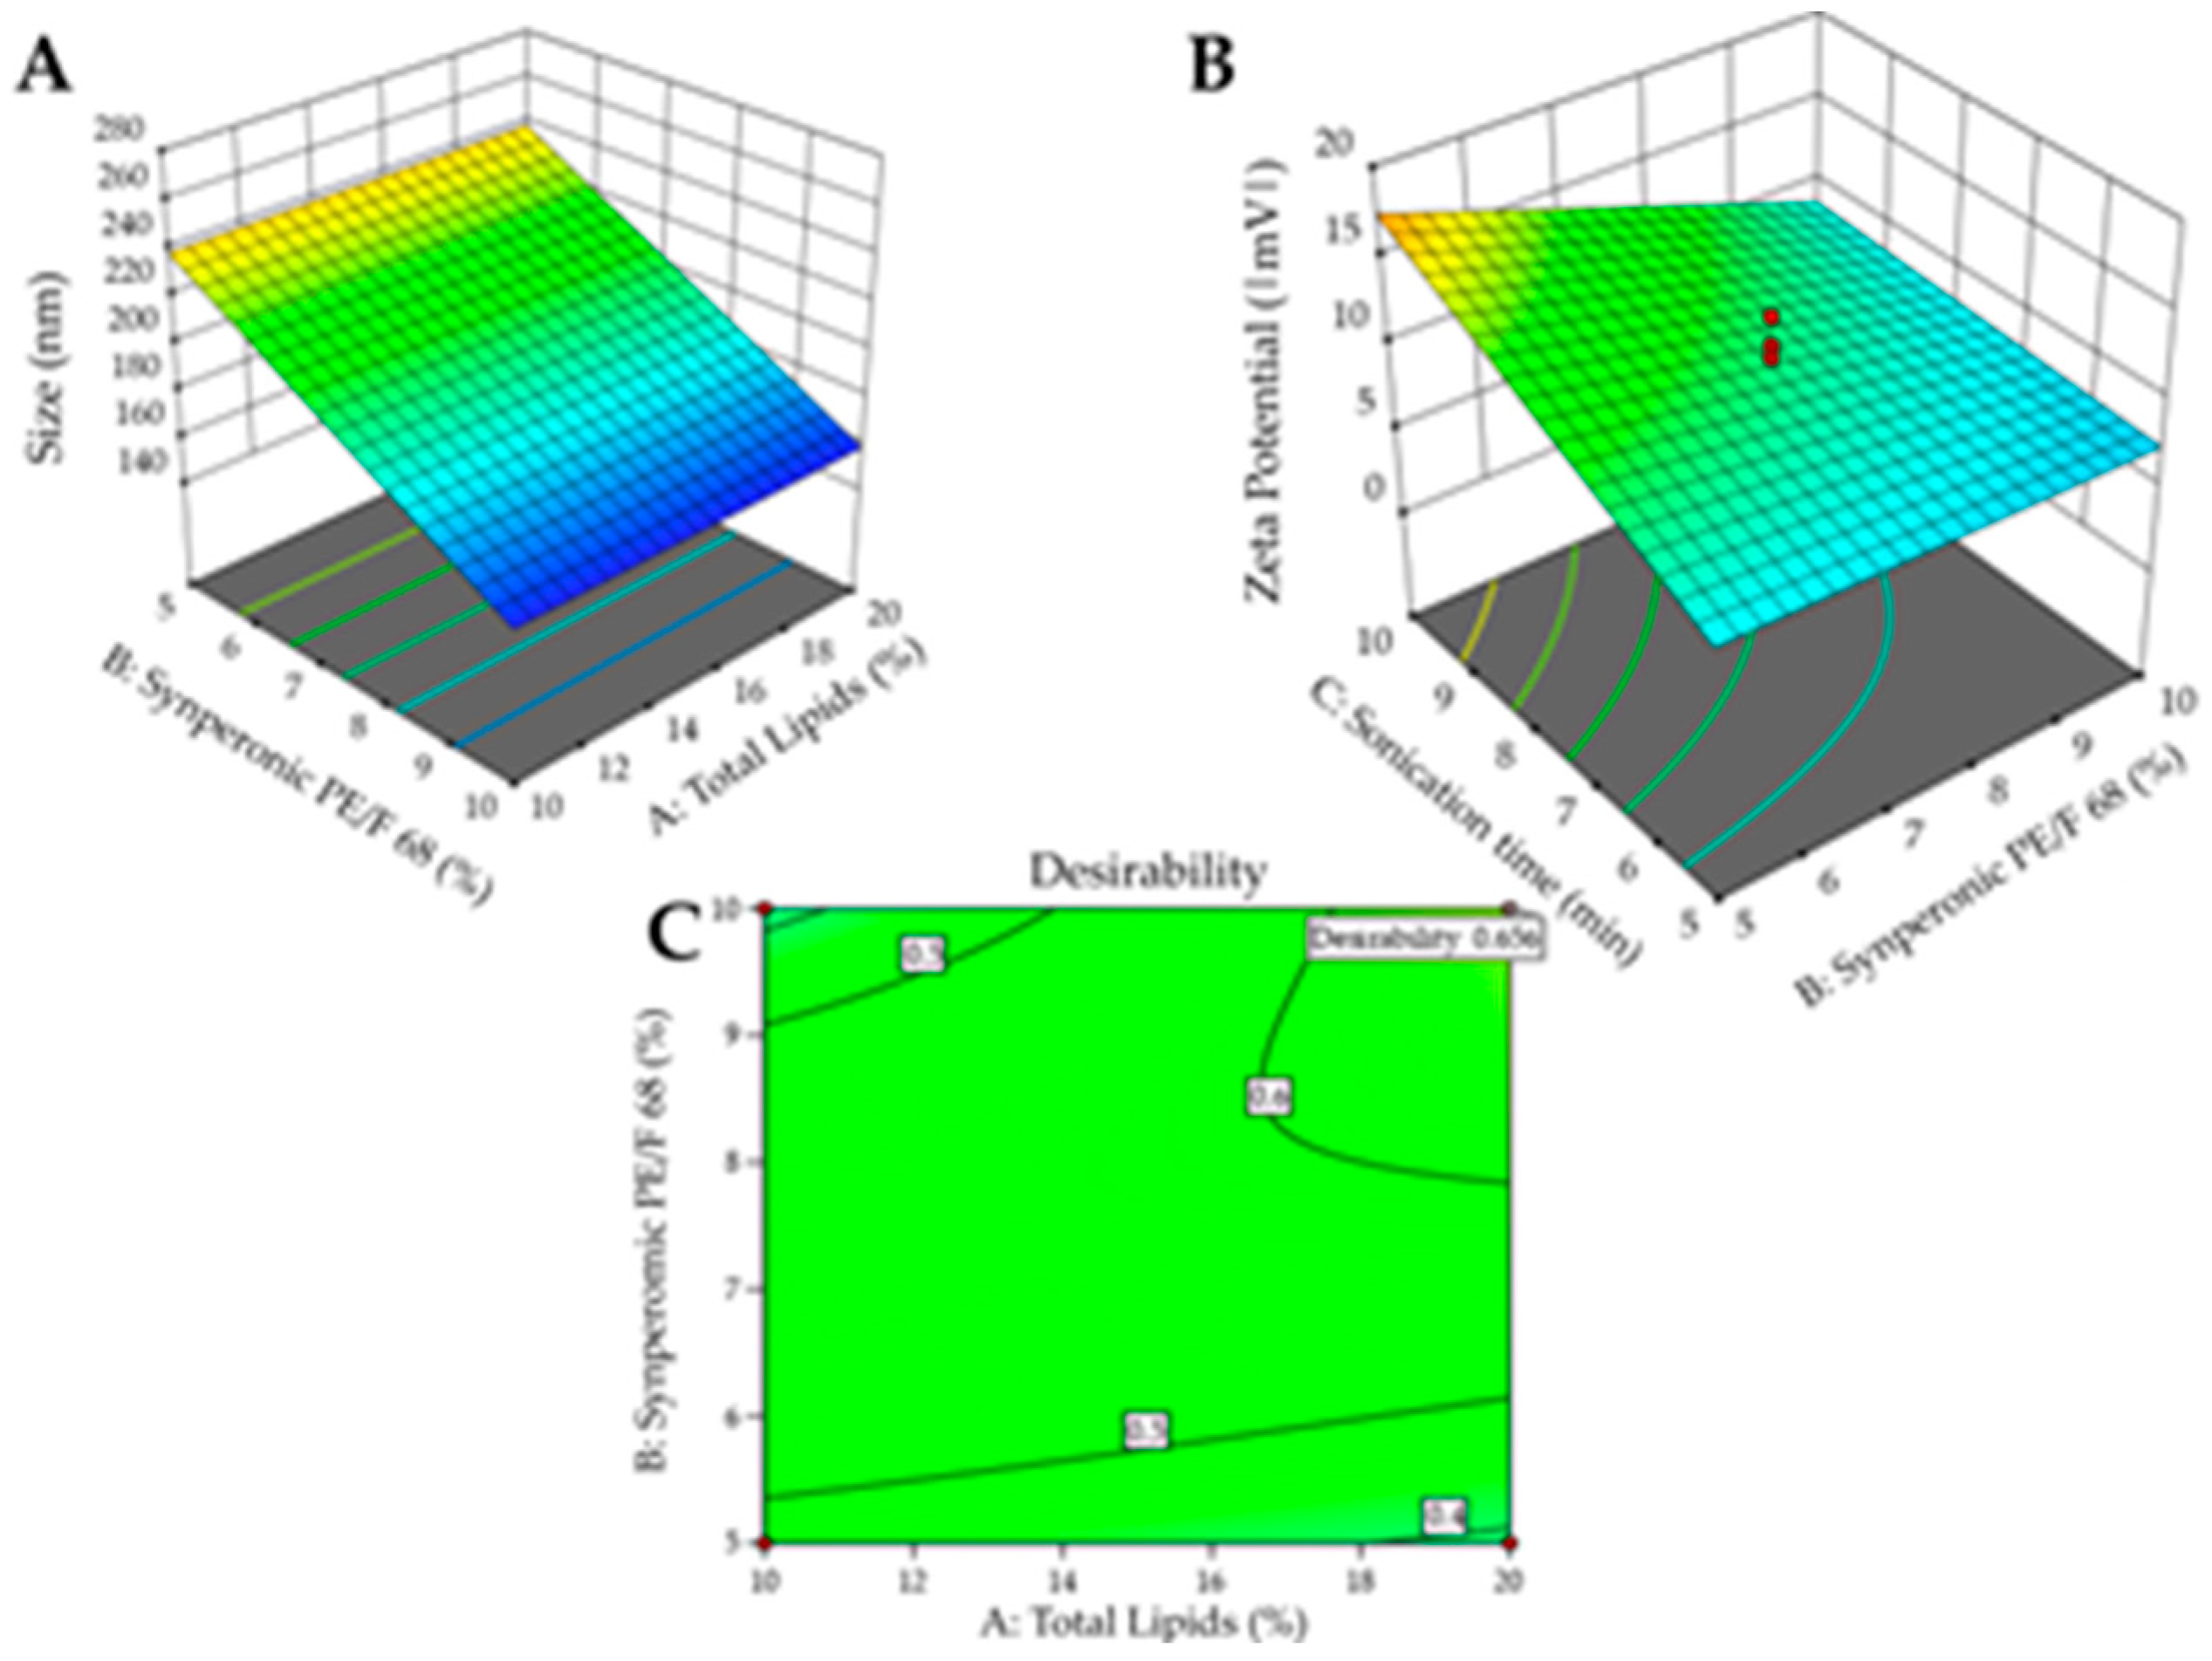
Figure 5.
Graphs containing residue analyses for each planning response containing SynperonicTM PE/F68 as surfactant. A-C: residue analysis referring to the Particle Size response. D-F: residue analysis referring to the Zeta Potential response.
Figure 5.
Graphs containing residue analyses for each planning response containing SynperonicTM PE/F68 as surfactant. A-C: residue analysis referring to the Particle Size response. D-F: residue analysis referring to the Zeta Potential response.
Figure 6.
Surface graphs for the responses of the formulation containing SynperonicTM PE/F68 as surfactant: A – Particle size. B – Zeta Potential and C – desirability graph.
Figure 6.
Surface graphs for the responses of the formulation containing SynperonicTM PE/F68 as surfactant: A – Particle size. B – Zeta Potential and C – desirability graph.
3.1.3. Interpretation of Responses Obtained for the Experimental Design Using CroduretTM 40 as Surfactant
The initial objective was to carry out experimental designs with all the surfactants selected for the project. However, when using CroduretTM 40 in the formulations, phase separation occurred shortly after preparation, indicating that CroduretTM 40 could not form stable NLCs. This could have happened due to its structure, it is an ethoxylated surfactant of plant origin, non-ionic, with an HLB of 13, normally used as an excipient in self-emulsifying drug delivery systems (SEDDS) [29]. Therefore studies with this surfactant were not continued.
3.2. Comparison between Formulations with CrodasolTM HS HP, and SynperonicTM PE/F68
Table 8 presents a summary of the significant effects found for each response in each design, allowing a comparison between the use of different types of surfactants. The variation of the factors was consistent (Table 2 and Table 3). Therefore, the same % total lipids, % surfactant, and sonication time were consistently utilized.
SynperonicTM PE/F68 has the same chemical structure of Poloxamer 188 and consists of triple copolymers formed by Polyethylene glycol-b-polypropylene glycoly-polyethylene glycol (PEO-PPO-PEO) – with 16% PPO and 84% PEO and has an HLB >24. On the other hand, CrodasolTM HS HP is synonymous with Macrogol 15- Hydroxystearate and consists of a mixture of monoesters and diesters of 12-hydroxystearic acid and macrogols obtained through the ethoxylation of 12-hydroxystearic acid, having an HLB of 15. It is observed that the difference in chemical composition between the two surfactants is also reflected in the values of particle size, PDI, and zeta potential. Figure 7 displays the size, PDI, and zeta graphs of the three surfactants used in formulations with BTB.
Analyzing Figure 7, it was observed that formulations with the CrodasolTM HS HP surfactant resulted in larger particle size (244 nm – 698 nm), higher PDI values (0.176 – 0.319), and elevated zeta potential values (|25 -29|), in comparison to formulations containing SynperonicTM PE/F68 (size: 157-260 nm. PDI: 0.091 - 0.172. Zeta: |4.4 – 19| mV) as the surfactant.
Regarding the difference in particle size between CrodasolTM HS HP and SynperonicTM PE/F68, it can be influenced by the hydrophilic-lipophilic balance (HLB) value. CrodasolTM HS HP has an HLB of 15, while SynperonicTM PE/F68 has an HLB of > 24. Since the solid lipid used is CrodamolTM CP, characterized by high hydrophobicity and molecular weight, it contributes to the viscosity of the system. Consequently, this requires a surfactant with a higher HLB [30].
3.3. Characterization of Nanostructured Lipid Carriers with BTB
After determining the proportions of total lipid, liquid lipid and sonication time for each surfactant, the optimized formulations were characterized and their stability was evaluated. Additionally, the optimized formulations were reproduced without the presence of SRTM DMI to investigate the possible influence of the solvent on the nanoparticles. Table 9 presents the optimized formulations that were characterized, while Table 10 details the amount of each excipient used in the formulations without SRTM DMI.
3.4. Particle Size Analysis, Polydispersity Index, and Zeta Potential Determination
The optimized formulations, as outlined in Table 11 and Table 12, were characterized by particle size, PDI, and zeta potential.
Initially, the formulations were analyzed both with and without SRTM DMI in the presence of BTB. These results are presented in Figure 8.
It can be observed that the removal of SR DMITM from the formulations changed particle size and zeta potential, except for the formulation containing CrodasolTM HS HP as a surfactant, in which the zeta potential of the system did not change after removing SRTM DMI. It can be inferred that SRTM DMI helped stabilize the system. The optimized formulations without SRTM DMI exhibited larger particle sizes and lower zeta potentials, generating potentially less stable particles. NLCs with SRTM DMI, having smaller particle sizes, may suggest that SRTM DMI preferred to remain in the lipid nucleus, alongside Super RefinedTM Lauryl Lactate, a compound of medium polarity, rather than leaving the nucleus and entering the aqueous phase of the NLC.
Studies of particle size, PDI, and zeta potential with the optimized formulations without the presence of BTB were also carried out. Results are shown in Table 12.
Table 12 shows that the size of NLC particles containing BTB is larger than that of empty NLCs, and this increase in size may indicate drug encapsulation within the particles. The PDI of NLCs with BTB (CBTB-NLC and SBTB-NLC) decreased slightly compared to S-NLC and C-NLC, remaining below 0.3, which indicates a uniform size distribution. The zeta potential of NLCs with BTB also decreased in formulations containing the two different surfactants, suggesting that the drug contributes to stability through electrostatic repulsion.
Concerning the Zeta Potentials of NLCs with BTB, it is noteworthy that the zeta values obtained from NLCs formulated with SynperonicTM PE/F68 did not reach zeta values below 30 mV. It is known that surfactants of the Poloxamer 188 type confer protective effects due to the hydrophilic corona present in their structure, resulting in zeta potential values that may not be sufficient for electrostatic stabilization. Through electron microscopy, Bhattacharya and co-authors that Kolliphor® P188 provides additional steric and electrostatic stabilization of formulations described it. The presence of this surfactant enhances steric stabilization on the particle surface, even in cases where the charge may be insufficient to generate electrostatic stabilization [31].
According to Shah and co-authors, NCLs can demonstrate enhanced stability, even with a lower zeta potential value, attributed to steric repulsion. This repulsion may result from the adsorption of polymers or non-ionic surfactants on the lipid matrix surface, effectively preventing potential particle aggregation [32].
3.5. Nanoparticle Tracking Analysis
NTA is a technique for measuring size distribution of particles in the sample through the measurement of light scattering properties and Brownian motion. The process involves a laser beam passing through the sampling chamber, where suspended particles in the beam’s path scatter the light. Additionally, it enables the determination of nanoparticle concentration (n° particles/mL) through specific and individual particle counting concerning volume [24].
The results of the NTA analyses are presented in Table 13.
It is observed that all NCLs exhibit particle concentrations on the order of 10¹³ particles/mL, consistent with values found in the literature [15,16,33]. An important parameter to consider in NTA is the Span, which should be lower than 1 to indicate a homogeneous particle size distribution [24]. Formulations containing CrodasolTM HS HP (CBTB-NLC and C-NLC) displayed a Span value greater than 1, indicating a wider range of particle size distribution when compared to SynperonicTM formulations.
When comparing the number of particles between NLCs with BTB and empty NLCs, it is observed that the addition of BTB to the formulations increased the number of nanoparticles in suspension. The same observation was made by Guilherme and collaborators, who utilized Poloxamer 188 as a surfactant and cetyl palmitate as a solid lipid [15].
3.6. Differential Scanning Calorimetry (DSC)
Through this technique, information about the crystallinity of the particles and the interactions between the drug and lipids in the formulation were obtained. Figure 9 displays the DSC curves of the lyophilized NLCs, BTB, CrodamolTM CP, and the two surfactants used. Butamben, CrodamolTM CP, and SynperonicTM PE/F68 exhibited endothermic events at 58.10°C, 55.58°C, and 55.81°C, respectively, corresponding to the melting point of these compounds. These results are in accordance to what is described for these compounds in literature [22,34,35].
In Figure 9, it can be seen that the C-NLC and CBTB-NLC curves present endothermic events at 52.57°C and 54.84°C, respectively. These events are possibly related to the Crodamol™ CP transition. When comparing the enthalpy of fusion and temperature values, a decrease in temperature and enthalpy is noted in both events compared to the temperature and enthalpy of fusion of bulk Crodamol™ CP. This change can be attributed to the nanometer size of the NLC, as explained by the Gibbs-Thomson effect, which postulates that the smaller the particle size, the greater the surface area, leading to a decrease in the melting point of the NLC compared to the solid lipid, and due to the presence of surfactants in the NLC. Furthermore, the decrease in the endothermic event of Crodamol™ CP in NLCs may come from an interaction between the drug and Crodamol™ CP (solid lipid), which may alter the lipid's fusion behavior [36,37,38,39,40].
Similar events are observed in the S-NLC and SBTB-NLC curves (50.56°C and 51.9°C). However, in the case of these NLCs, the surfactant used also presents an endothermic event at 55.81°C (Synperonic™ PE/F68). In these cases, the events observed in NLCs may result from the combination of events related to the solid lipid and the surfactant [40].
When comparing the M-NLC and CBTB-NLC formulations, a decrease in the fusion enthalpy and temperature in the CBTB-NLC is observed, which is expected, as the physical mixture is merely all the solid components present in the NLC, only mixed. The same occurs when comparing M-NLC with SBTB-NLC. This indicates that M-NLC presents more ordered crystal lattice arrangements, unlike NLCs (CBTB-NLC and SBTB-NLC), in which the solid lipid is in less ordered arrangements, contributing to the encapsulation of the drug [37,41,42].
Based on the presented results, it is evident that all NLCs exhibited a decrease in fusion enthalpy, indicating lower lipid crystallinity, minimizing drug expulsion during the storage period [41].
3.7. FTIR
Infrared spectroscopy is used to explore the structural characteristics of lipids and identify potential interactions between the drug and the excipients in the formulations [43,44].
Analyzing Figure 10 it is possible to compare the spectra of the constituents of the formulations with those of the NLCs and with the M-NLC, which is the physical mixture of the developed NLCs. It can be observed that the stretch and deformation signals are consistent with those present in the spectra of CrodamolTM CP, the solid lipid used, and the bands of the surfactants. In the case of S-NLC, and SBTB-NLC, their spectra include characteristic bands of their respective surfactant SynperonicTM PE/F68. The same applies to M-NLC, which has SynperonicTM PE/F68 as a surfactant. Bands in the regions of 1735 cm-1, 1250-970 cm-1, and 3000-2800 cm-1 are present in both CrodamolTM CP and the nanocarrier spectra. Regarding surfactants, bands at 1281-1239 cm-1, and 960-942 cm-1 are found in the spectra of both surfactants used and also in the spectra of the nanocarriers. It is noteworthy that the band in the region between 1275-1245 cm-1 (O-C stretching) is present in the BTB spectrum, however, when observing this band in the nanocarrier spectra, it is noted that both the NLCs loaded with BTB and empty NLCs exhibit similar bands.
When comparing the BTB spectrum with that of the charged NLC (Figure 11), it is evident that the bands at 3420-3341 cm-1 (N-H stretching), 1675-1638 cm-1 (C=C stretching), and 1589 cm-1 (deformation NH2) are absent in the spectra of the charged NLCs, due to the lower concentration of BTB. However, the bands at 1517 cm-1 (C=C stretching – in ring) and 839-700 cm-1 (C-H bending and ring puckering deformation) are identifiable in both the drug spectrum and the BTB-NLCs spectra.
When comparing the spectra of empty NLCs with BTB-NLCs, a similarity in the obtained spectra is observed. This similarity may arise from the mechanical incorporation of the drug into de particle, with only some potential interactions between the components of the formulation and the drug being detected by the technique [37,45,46,47].
Upon analyzing the spectra of BTB-NLCs and M-NLCs (Figure 11), a distinctive band related to O-H stretching (3363-3360 cm-1), is observed, exclusively present in these formulations. This band may be a shifted version of a BTB band, as it is absent in the spectra of empty NLCs. There is a high similarity between the M-NLC spectra and the CBTB-NLC and SBTB-NLC spectra regarding the frequency of bands present (bands 3361, 1603, and 1275 cm-1). However, some of these frequencies have lower intensity in the CBTB-NLC and SBTB-NLC formulations, which may indicate an interaction between the NLC and the drug.
3.8. 3-Month Stability Study of the Optimized NLCs
The evaluated stability parameters were particle size, PDI, and zeta potential. Figure 12 presents the stability results of the formulations.
Based on the results presented in Figure 12 it is observed that in the presence of the drug, the NLCs that have CrodasolTM HS HP in their composition did not show stability over 2 months, presenting phase separation. The only exception is the CBTB-NLC without SRTM DMI. NLCs with SynperonicTM PE/F68 even with lower zeta potentials, presented higher stability than NLCs with CrodasolTM HS HP. This is probably because SynperonicTM PE/F68, provides additional steric and electrostatic stabilization within the NLC and even on the surface of the particles [31].
The study makes us wonder whether it is really important to achieve this type of NLC stability in the form of a dispersion in water since this type of formulation in the liquid state can suffer instability due to oxidation reactions, hydrolysis, phase inversion, crystallization, and polymorphism, which can result in particle aggregation, gelation, and affect drug release [48,49].
Studies report that the ideal approach for NLC would be to freeze-dry the system or add preservatives, so that it obtains long-term stability, preserving the NLC from bacterial contamination and maintaining the properties of the nanoparticles, such as particle size, in addition to preventing degradation reactions (hydrolysis) from occurring [28,48,49,50].
4. Conclusions
DOE-guided study allowed optimizing the total lipid, % of surfactant, and sonication time for NLC development, based on the lipid core previously developed [1]. The three surfactants studied, CrodasolTM HS HP, SynperonicTM PE/F68, and CroduretTM 40 presented different behavior regarding the evaluated responses, particle size, PDI and zeta potential, which was tentatively explained based on their chemical structure.
Comparing CrodasolTM HS HP and SynperonicTM PE/F68, the first resulted in larger particle sizes (244 nm – 698 nm), higher PDI values (0.176 – 0.319), and elevated zeta potential values (|25 -29|), in comparison to the second: size: 157-260 nm. PDI: 0.091 - 0.172. Zeta: |4.4 – 19| mV). CroduretTM 40 did not form stable NLCs. Desirability indicated that for CrodasolTM HS HP as a surfactant, the optimized formulation contained of 10% Total Lipids, 5% of surfactant and required 7.5 minutes of sonication time. For the surfactant SynperonicTM PE/F68, the optimized formulation was defined with 20% Total Lipids, 10% of surfactant, and 10 minutes of sonication time.
We showed it was possible to incorporate butambem, a brick dust type of drug, within the NLC core and obtain particles with suitable size and polydispersity for CrodasolTM HS HP and SynperonicTM PE/F68, using the optimized percentages and conditions.
Regarding the addition of Super RefinedTM DMI to the lipid core, it was observed that this excipient favored the desired NLC properties such as particle size, PDI, and zeta potential, and also contributed to the solubilization of BTB in the core.
Author Contributions
Conceptualization, A.P.M, C.A.R., and M.C.B.. methodology, A.P.M., C.A.R. and G.G. software, A.P.M and C.A.R, formal analysis, A.P.M, C.A.R. and G.G., investigation, A.P.M C.A.R. and G.G., resources, M.C.B., E.P. and R.O.. data curation, A.P.M., C.A.R. and M.C.B.. writing—original draft preparation, A.P.M. and C.A.R. writing—review and editing, A.P.M, C.A.R, M.C.B., E.P, and R.O.. visualization, A.P.M., C.A.R., M.C.B. and R.O.. supervision, M.C.B., E.P. and R.O.. project administration, M.C.B. and R.O.. funding acquisition, M.C.B. and R.O. All authors have read and agreed to the published version of the manuscript.
Funding
The authors acknowledge the research funding agencies: CAPES, CNPq/FAPESP through the INCT Bioanalytics and Croda through project 5795 Chemistry Institute / Lipid Formulations
Institutional Review Board Statement
Not applicable.
Informed Consent Statement
Not applicable.
Data Availability Statement
The data used in this study are available to interested by contacting the author M.C.B. (marciacb@unicamp.br).
Conflicts of Interest
The authors declare there is no conflict of interest, personal or financial origin, that could have appeared to influence the work reported in this paper.
References
- Rios, C.A.; Ondei, R.; Breitkreitz, M.C. Development of a Versatile Lipid Core for Nanostructured Lipid Carriers (NLCs) Using Design of Experiments (DoE) and Raman Mapping. Pharmaceutics 2024, 16. [Google Scholar] [CrossRef]
- Zhu, Z.; Liu, J.; Yang, Y.; Adu-Frimpong, M.; Ji, H.; Toreniyazov, E.; Wang, Q.; Yu, J.; Xu, X. SMEDDS for Improved Oral Bioavailability and Anti-Hyperuricemic Activity of Licochalcone A. J. Microencapsul. 2021, 38, 459–471. [Google Scholar] [CrossRef] [PubMed]
- Kim, D.S.; Cho, J.H.; Park, J.H.; Kim, J.S.; Song, E.S.; Kwon, J.; Giri, B.R.; Jin, S.G.; Kim, K.S.; Choi, H.G.; Kim, D.W. Self-Microemulsifying Drug Delivery System (SMEDDS) for Improved Oral Delivery and Photostability of Methotrexate. Int. J. Nanomedicine 2019, 14, 4949–4960. [Google Scholar] [CrossRef]
- Charalabidis, A.; Sfouni, M.; Bergström, C.; Macheras, P. The Biopharmaceutics Classification System (BCS) and the Biopharmaceutics Drug Disposition Classification System (BDDCS):Beyond Guidelines. Int. J. Pharm. 2019, 566, 264–281. [Google Scholar] [CrossRef]
- Talegaonkar, S.; Bhattacharyya, A. Potential of Lipid Nanoparticles (SLNs and NLCs) in Enhancing Oral Bioavailability of Drugs with Poor Intestinal Permeability. AAPS PharmSciTech 2019, 20. [Google Scholar] [CrossRef] [PubMed]
- Meirinho, S.; Rodrigues, M.; Santos, A.O.; Falcão, A.; Alves, G. Self-Emulsifying Drug Delivery Systems: An Alternative Approach to Improve Brain Bioavailability of Poorly Water Soluble Drugs through Intranasal Administration. Pharmaceutics 2022, 14, 1–28. [Google Scholar] [CrossRef] [PubMed]
- Poovi, G.; Damodharan, N. Lipid Nanoparticles: A Challenging Approach for Oral Delivery of BCS Class-II Drugs. Futur. J. Pharm. Sci. 2018, 4, 191–205. [Google Scholar] [CrossRef]
- Mitsutake, H.; Silva, G.H.R.; De Paula, E.; Breitkreitz, M.C. When it is too much: Identifying butamben excess on the surface of pharmaceutical preformulation samples by Raman mapping. J. Pharm. Bio. Anal. 2023, 235, 115644. [Google Scholar] [CrossRef]
- Elmowafy, M.; Al-Sanea, M.M. Nanostructured Lipid Carriers (NLCs) as Drug Delivery Platform: Advances in Formulation and Delivery Strategies. Saudi Pharm. J. 2021, 29, 999–1012. [Google Scholar] [CrossRef]
- Agrawal, M.; Saraf, S.; Saraf, S.; Dubey, S.K.; Puri, A.; Patel, R.J.; Ajazuddin. Ravichandiran, V.; Murty, U.S.; Alexander, A. Recent Strategies and Advances in the Fabrication of Nano Lipid Carriers and Their Application towards Brain Targeting. J. Control. Release 2020, 321, 372–415. [Google Scholar] [CrossRef]
- Madane, R.G.; Mahajan, H.S. Curcumin-Loaded Nanostructured Lipid Carriers (NLCs) for Nasal Administration: Design, Characterization, and in Vivo Study. Drug Deliv. 2016, 23, 1326–1334. [Google Scholar] [CrossRef] [PubMed]
- da Silva Santos, V.; Badan Ribeiro, A.P.; Andrade Santana, M.H. Solid Lipid Nanoparticles as Carriers for Lipophilic Compounds for Applications in Foods. Food Res. Int. 2019, 122, 610–626. [Google Scholar] [CrossRef] [PubMed]
- Alam, M.I.; Baboota, S.; Ahuja, A.; Ali, M.; Ali, J.; Sahni, J.K. Intranasal Infusion of Nanostructured Lipid Carriers (NLC) Containing CNS Acting Drug and Estimation in Brain and Blood. Drug Deliv. 2013, 20, 247–251. [Google Scholar] [CrossRef]
- Cunha, S.; Costa, C.P.; Loureiro, J.A.; Alves, J.; Peixoto, A.F.; Forbes, B.; Lobo, J.M.S.; Silva, A.C. Double Optimization of Rivastigmine-Loaded Nanostructured Lipid Carriers (NLC) for Nose-to-Brain Delivery Using the Quality by Design (QbD) Approach: Formulation Variables and Instrumental Parameters. Pharmaceutics 2020, 12, 1–27. [Google Scholar] [CrossRef]
- Guilherme, V.A.; Ribeiro, L.N.M.; Alcântara, A.C.S.; Castro, S.R.; Rodrigues da Silva, G.H.; da Silva, C.G.; Breitkreitz, M.C.; Clemente-Napimoga, J.; Macedo, C.G.; Abdalla, H.B.; Bonfante, R.; Cereda, C.M.S.; de Paula, E. Improved Efficacy of Naproxen-Loaded NLC for Temporomandibular Joint Administration. Sci. Rep. 2019, 9, 1–11. [Google Scholar]
- Ribeiro, L.N.M.; Breitkreitz, M.C.; Guilherme, V.A.; da Silva, G.H.R.; Couto, V.M.; Castro, S.R.; de Paula, B.O.; Machado, D.; de Paula, E. Natural Lipids-Based NLC Containing Lidocaine: From Pre-Formulation to in Vivo Studies. Eur. J. Pharm. Sci. 2017, 106, 102–112. [Google Scholar] [CrossRef]
- Castro, S.R.; Ribeiro, L.N.M.; Breitkreitz, M.C.; Guilherme, V.A.; Rodrigues da Silva, G.H.; Mitsutake, H.; Alcântara, A.C.S.; Yokaichiya, F.; Franco, M.K.K.D.; Clemens, D.; Kent, B.; Lancellotti, M.; de Araújo, D.R.; de Paula, E. A Pre-Formulation Study of Tetracaine Loaded in Optimized Nanostructured Lipid Carriers. Sci. Rep. 2021, 11, 1–15. [Google Scholar]
- Da Silva, G.H.R.; de Morais Ribeiro, L.N.; Guilherme, V.A.; de Castro, S.R.; Breitkreitz, M.C.; de Paula, E. Bupivacaine (S75:R25) Loaded in Nanostructured Lipid Carriers: Factorial Design, HPLC Quantification Method and Physicochemical Stability Study. Curr. Drug Deliv. 2017, 15, 388–396. [Google Scholar] [CrossRef]
- Geronimo, G.; Rodrigues da Silva, G.H.; de Moura, L.D.; Ribeiro, L.N.M.; Guilherme, V.A.; Mendonça, T.C.; Castro, S.R.; Breitkreitz, M.C.; de Paula, E. Development of S75:R25 Bupivacaine-Loaded Lipid Nanoparticles Functionalized with Essential Oils for Treating Melanoma. J. Chem. Technol. Biotechnol. 2021, 96, 2197–2207. [Google Scholar] [CrossRef]
- Ribeiro, L.N.M.; Franz-Montan, M.; Breitkreitz, M.C.; Alcântara, A.C.S.; Castro, S.R.; Guilherme, V.A.; Barbosa, R.M.; de Paula, E. Nanostructured Lipid Carriers as Robust Systems for Topical Lidocaine-Prilocaine Release in Dentistry. Eur. J. Pharm. Sci. 2016, 93, 192–202. [Google Scholar] [CrossRef]
- Rodrigues da Silva, G.H.; Ribeiro, L.N.M.; Mitsutake, H.; Guilherme, V.A.; Castro, S.R.; Poppi, R.J.; Breitkreitz, M.C.; de Paula, E. Optimised NLC: A Nanotechnological Approach to Improve the Anaesthetic Effect of Bupivacaine. Int. J. Pharm. 2017, 529, 253–263. [Google Scholar] [CrossRef]
- Da Silva, G.H.R.; Lemes, J.B.P.; Geronimo, G.; De Lima, F.F.; De Moura, L.D.; Dos Santos, A.C.; Carvalho, N.S.; Malange, K.F.; Breitkreitz, M.C.; Parada, C.A.; De Paula, E. Lipid Nanoparticles Loaded with Butamben and Designed to Improve Anesthesia at Inflamed Tissues. Biomater. Sci. 2021, 9, 3378–3389. [Google Scholar] [CrossRef] [PubMed]
- Ghasemiyeh, P.; Mohammadi-Samani, S. Solid Lipid Nanoparticles and Nanostructured Lipid Carriers as Novel Drug Delivery Systems: Applications, Advantages and Disadvantages. Res. Pharm. Sci. 2018, 13, 288–303. [Google Scholar]
- Ribeiro, L.N.D.M.; Couto, V.M.; Fraceto, L.F.; De Paula, E. Use of Nanoparticle Concentration as a Tool to Understand the Structural Properties of Colloids. Sci. Rep. 2018, 8, 1–8. [Google Scholar] [CrossRef]
- Zwain, T.; Alder, J.E.; Sabagh, B.; Shaw, A.; Burrow, A.J.; Singh, K.K. Tailoring Functional Nanostructured Lipid Carriers for Glioblastoma Treatment with Enhanced Permeability through In-Vitro 3D BBB/BBTB Models. Mater. Sci. Eng. C 2021, 121, 111774. [Google Scholar] [CrossRef]
- Rathod, V.R.; Shah, D.A.; Dave, R.H. Systematic Implementation of Quality-by-Design (QbD) to Develop NSAID-Loaded Nanostructured Lipid Carriers for Ocular Application: Preformulation Screening Studies and Statistical Hybrid-Design for Optimization of Variables. Drug Dev. Ind. Pharm. 2020, 46, 443–455. [Google Scholar] [CrossRef]
- Almousallam, M.; Moia, C.; Zhu, H. Development of Nanostructured Lipid Carrier for Dacarbazine Delivery. Int. Nano Lett. 2015, 5, 241–248. [Google Scholar] [CrossRef]
- Subramaniam, B.; Siddik, Z.H.; Nagoor, N.H. Optimization of Nanostructured Lipid Carriers: Understanding the Types, Designs, and Parameters in the Process of Formulations. J. Nanoparticle Res. 2020, 22. [Google Scholar] [CrossRef]
- Nardin, I.; Köllner, S. Successful Development of Oral SEDDS: Screening of Excipients from the Industrial Point of View. Adv. Drug Deliv. Rev. 2019, 142, 128–140. [Google Scholar] [CrossRef]
- Babazadeh, A.; Ghanbarzadeh, B.; Hamishehkar, H. Formulation of Food Grade Nanostructured Lipid Carrier (NLC) for Potential Applications in Medicinal-Functional Foods. J. Drug Deliv. Sci. Technol. 2017, 39, 50–58. [Google Scholar] [CrossRef]
- Bhattacharya, S.; Sharma, S. Dacarbazine-Encapsulated Solid Lipid Nanoparticles for Skin Cancer: Physical Characterization, Stability, in-Vivo Activity, Histopathology, and Immunohistochemistry. Front. Oncol. 2023, 13, 1–15. [Google Scholar] [CrossRef] [PubMed]
- Shah, B.; Khunt, D.; Bhatt, H.; Misra, M.; Padh, H. Intranasal Delivery of Venlafaxine Loaded Nanostructured Lipid Carrier: Risk Assessment and QbD Based Optimization. J. Drug Deliv. Sci. Technol. 2016, 33, 37–50. [Google Scholar] [CrossRef]
- Ortiz, A.C.; Yañez, O.; Salas-Huenuleo, E.; Morales, J.O. Development of a Nanostructured Lipid Carrier (NLC) by a Low-Energy Method, Comparison of Release Kinetics and Molecular Dynamics Simulation. Pharmaceutics 2021, 13. [Google Scholar] [CrossRef] [PubMed]
- Galvão, J.G.; Santos, R.L.; Silva, A.R.S.T.; Santos, J.S.; Costa, A.M.B.; Chandasana, H.; Andrade-Neto, V.V.; Torres-Santos, E.C.; Lira, A.A.M.; Dolabella, S.; Scher, R.; Kima, P.E.; Derendorf, H.; Nunes, R.S. Carvacrol Loaded Nanostructured Lipid Carriers as a Promising Parenteral Formulation for Leishmaniasis Treatment. Eur. J. Pharm. Sci. 2020, 150, 105335. [Google Scholar] [CrossRef] [PubMed]
- Mura, P.; Maestrelli, F.; Cirri, M.; Nerli, G.; Di Cesare Mannelli, L.; Ghelardini, C.; Mennini, N. Improvement of Butamben Anesthetic Efficacy by the Development of Deformable Liposomes Bearing the Drug as Cyclodextrin Complex. Pharmaceutics 2021, 13. [Google Scholar] [CrossRef] [PubMed]
- Dadhania, P.; Vuddanda, P.R.; Jain, A.; Velaga, S.; Singh, S. Intranasal Delivery of Asenapine Loaded Nanostructured Lipid Carriers: Formulation, Characterization, Pharmacokinetic and Behavioural Assessment. RSC Adv. 2016, 6, 2032–2045. [Google Scholar]
- El Assasy, A.E.H.I.; Younes, N.F.; Makhlouf, A.I.A. Enhanced Oral Absorption of Amisulpride Via a Nanostructured Lipid Carrier-Based Capsules: Development, Optimization Applying the Desirability Function Approach and In Vivo Pharmacokinetic Study. AAPS PharmSciTech 2019, 20. [Google Scholar]
- Khosa, A.; Reddi, S.; Saha, R.N. Nanostructured Lipid Carriers for Site-Specific Drug Delivery. Biomed. Pharmacother. 2018, 103, 598–613. [Google Scholar] [CrossRef] [PubMed]
- Chauhan, I.; Yasir, M.; Verma, M.; Singh, A.P. Nanostructured Lipid Carriers: A Groundbreaking Approach for Transdermal Drug Delivery. Adv. Pharm. Bull. 2020, 10, 150–165. [Google Scholar] [CrossRef]
- Teeranachaideekul, V.; Boonme, P.; Souto, E.B.; Müller, R.H.; Junyaprasert, V.B. Influence of Oil Content on Physicochemical Properties and Skin Distribution of Nile Red-Loaded NLC. J. Control. Release 2008, 128, 134–141. [Google Scholar] [CrossRef]
- Ridolfi, D.M. Nanopartículas Lipídicas Sólidas : Encapsulação De Tretinoína Para Aplicação Tópica. <bold>2011</bold>, 82.
- Hou, D.Z.; Xie, C.S.; Huang, K.J.; Zhu, C.H. The Production and Characteristics of Solid Lipid Nanoparticles (SLNs). Biomaterials 2003, 24, 1781–1785. [Google Scholar] [CrossRef] [PubMed]
- Mehnert, W.; Mäder, K. Solid Lipid Nanoparticles: Production, Characterization and Applications. Adv. Drug Deliv. Rev. 2012, 64, 83–101. [Google Scholar] [CrossRef]
- Özdemir, S.; Çelik, B.; Üner, M. <italic>Properties and Therapeutic Potential of Solid Lipid Nanoparticles and Nanostructured Lipid Carriers as Promising Colloidal Drug Delivery Systems</italic>. 2019.
- Managuli, R.S.; Wang, J.T.; Faruqu, F.N.; Kushwah, V.; Raut, S.Y.; Shreya, A.B.; Al-Jamal, K.T.; Jain, S.; Mutalik, S. Asenapine Maleate-Loaded Nanostructured Lipid Carriers: Optimization and in Vitro, Ex Vivo and in Vivo Evaluations. Nanomedicine 2019, 14, 889–910. [Google Scholar] [CrossRef] [PubMed]
- Tadini, M.C.; de Freitas Pinheiro, A.M.; Carrão, D.B.; Aguillera Forte, A.L.S.; Nikolaou, S.; de Oliveira, A.R.M.; Berretta, A.A.; Marquele-Oliveira, F. Method Validation and Nanoparticle Characterization Assays for an Innovative Amphothericin B Formulation to Reach Increased Stability and Safety in Infectious Diseases. J. Pharm. Biomed. Anal. 2017, 145, 576–585. [Google Scholar] [CrossRef]
- Sallam, M.A.; Helal, H.M.; Mortada, S.M. Rationally Designed Nanocarriers for Intranasal Therapy of Allergic Rhinitis: Influence of Carrier Type on in Vivo Nasal Deposition. Int. J. Nanomedicine 2016, 11, 2345–2357. [Google Scholar] [CrossRef] [PubMed]
- Obeidat, W.M.; Schwabe, K.; Müller, R.H.; Keck, C.M. Preservation of Nanostructured Lipid Carriers (NLC). Eur. J. Pharm. Biopharm. 2010, 76, 56–67. [Google Scholar] [CrossRef]
- Varshosaz, J.; Eskandari, S.; Tabbakhian, M. Freeze-Drying of Nanostructure Lipid Carriers by Different Carbohydrate Polymers Used as Cryoprotectants. Carbohydr. Polym. 2012, 88, 1157–1163. [Google Scholar] [CrossRef]
- Beloqui, A.; Solinís, M.Á.; Rodríguez-Gascón, A.; Almeida, A.J.; Préat, V. Nanostructured Lipid Carriers: Promising Drug Delivery Systems for Future Clinics. Nanomedicine Nanotechnology, Biol. Med. 2016, 12, 143–161. [Google Scholar] [CrossRef]
Figure 1.
Pareto chart with significant effects and their interactions in each response for the formulation containing CrodasolTM HS HP as surfactant.
Figure 1.
Pareto chart with significant effects and their interactions in each response for the formulation containing CrodasolTM HS HP as surfactant.
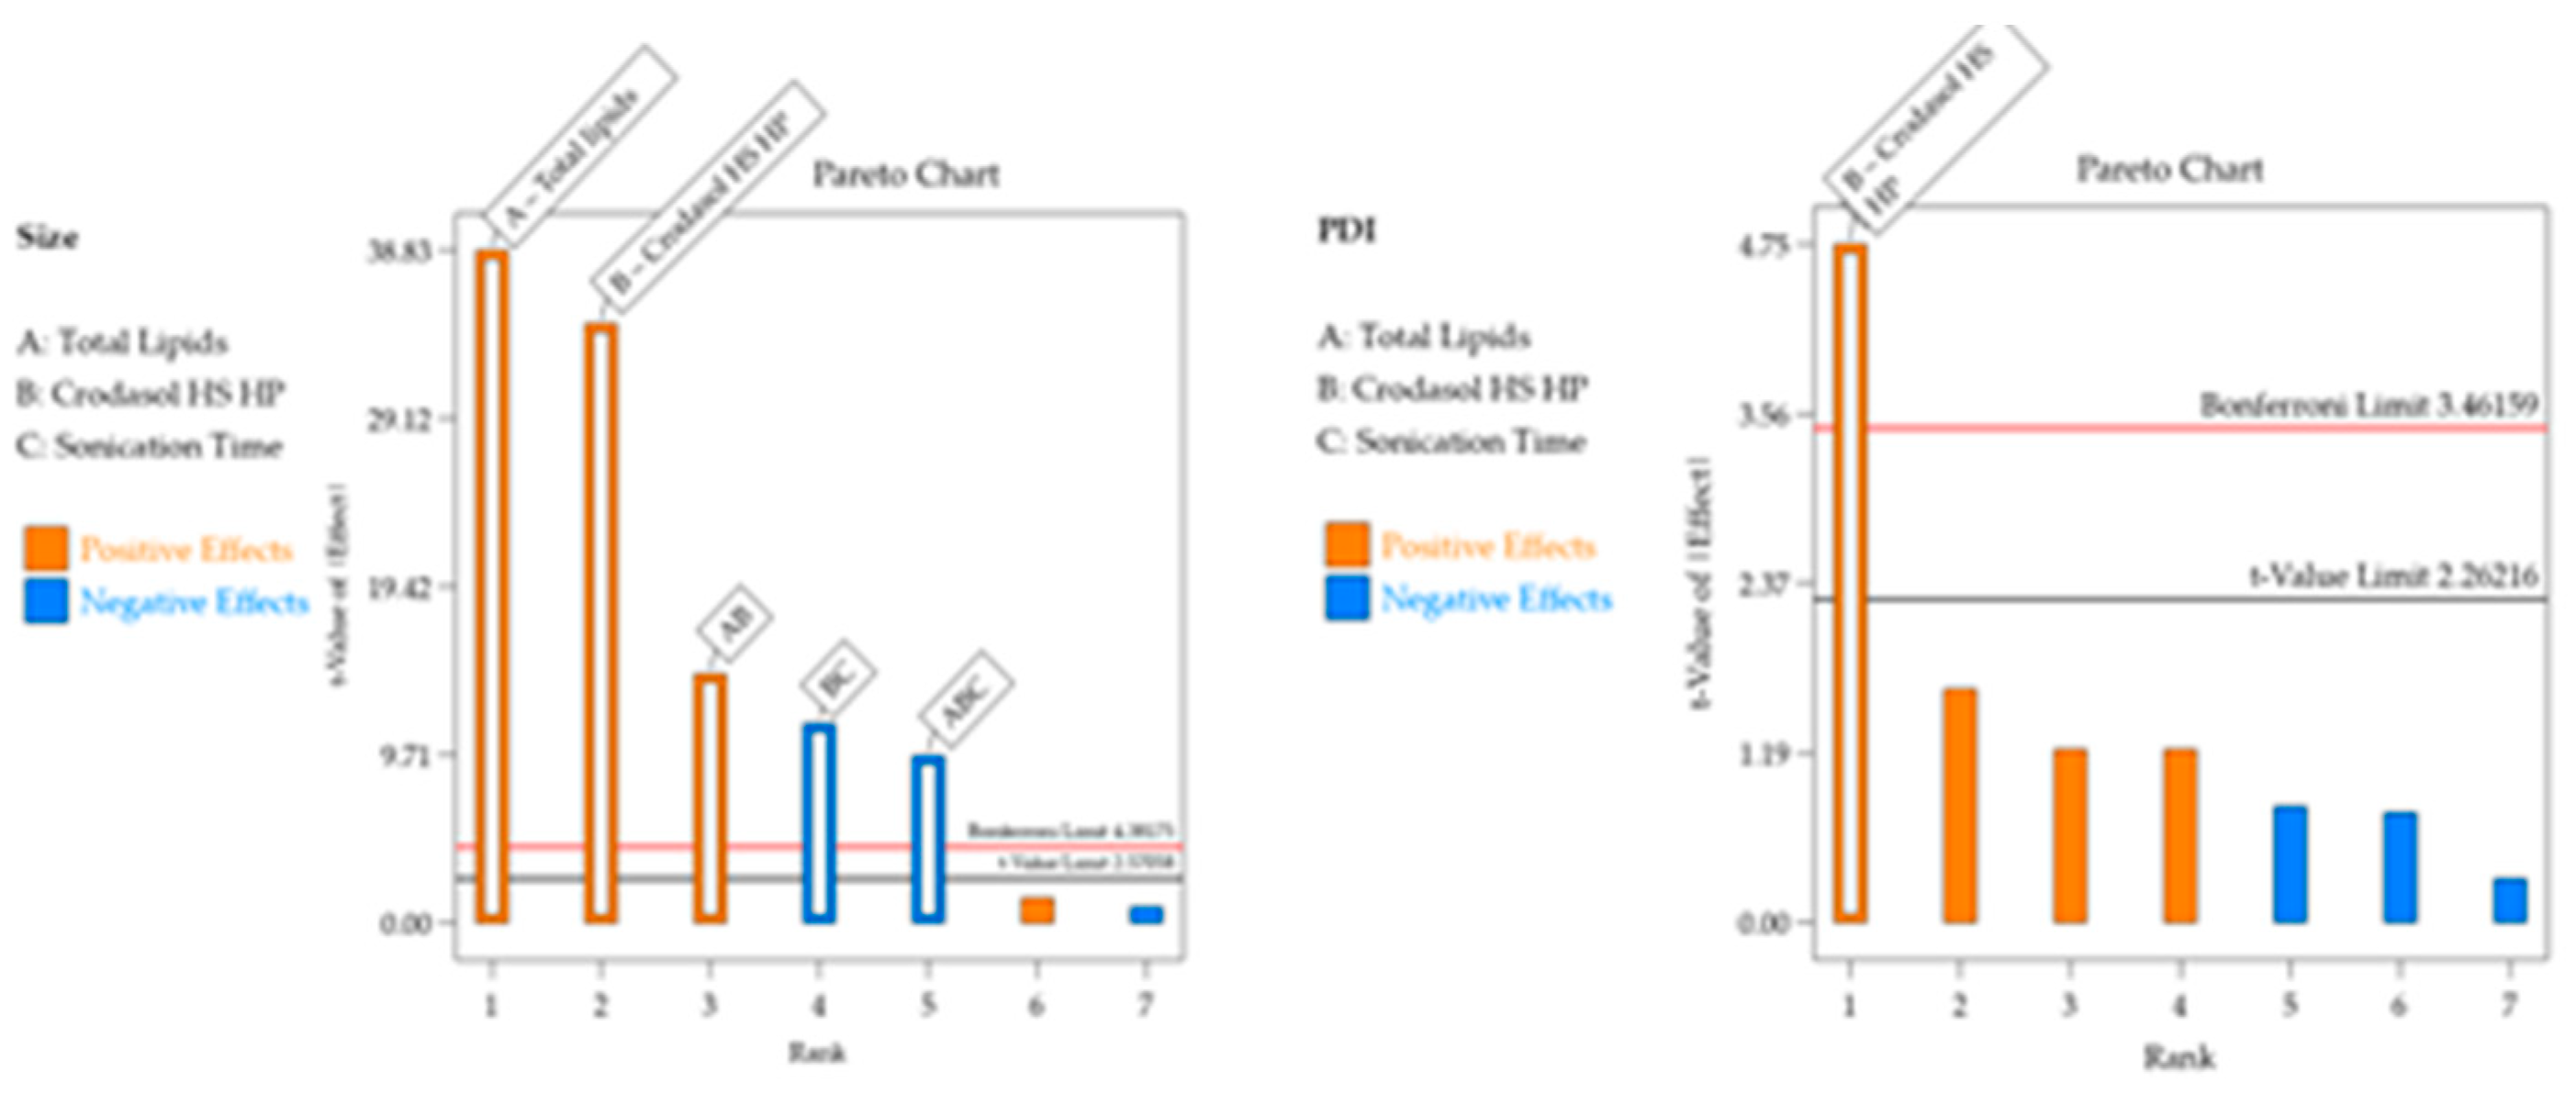
Figure 2.
Graphs of residual analyses for models containing CrodasolTM HS HP as a surfactant. A-C: residual analysis for Particle Size; D-F: residual analysis for the PDI response.
Figure 2.
Graphs of residual analyses for models containing CrodasolTM HS HP as a surfactant. A-C: residual analysis for Particle Size; D-F: residual analysis for the PDI response.
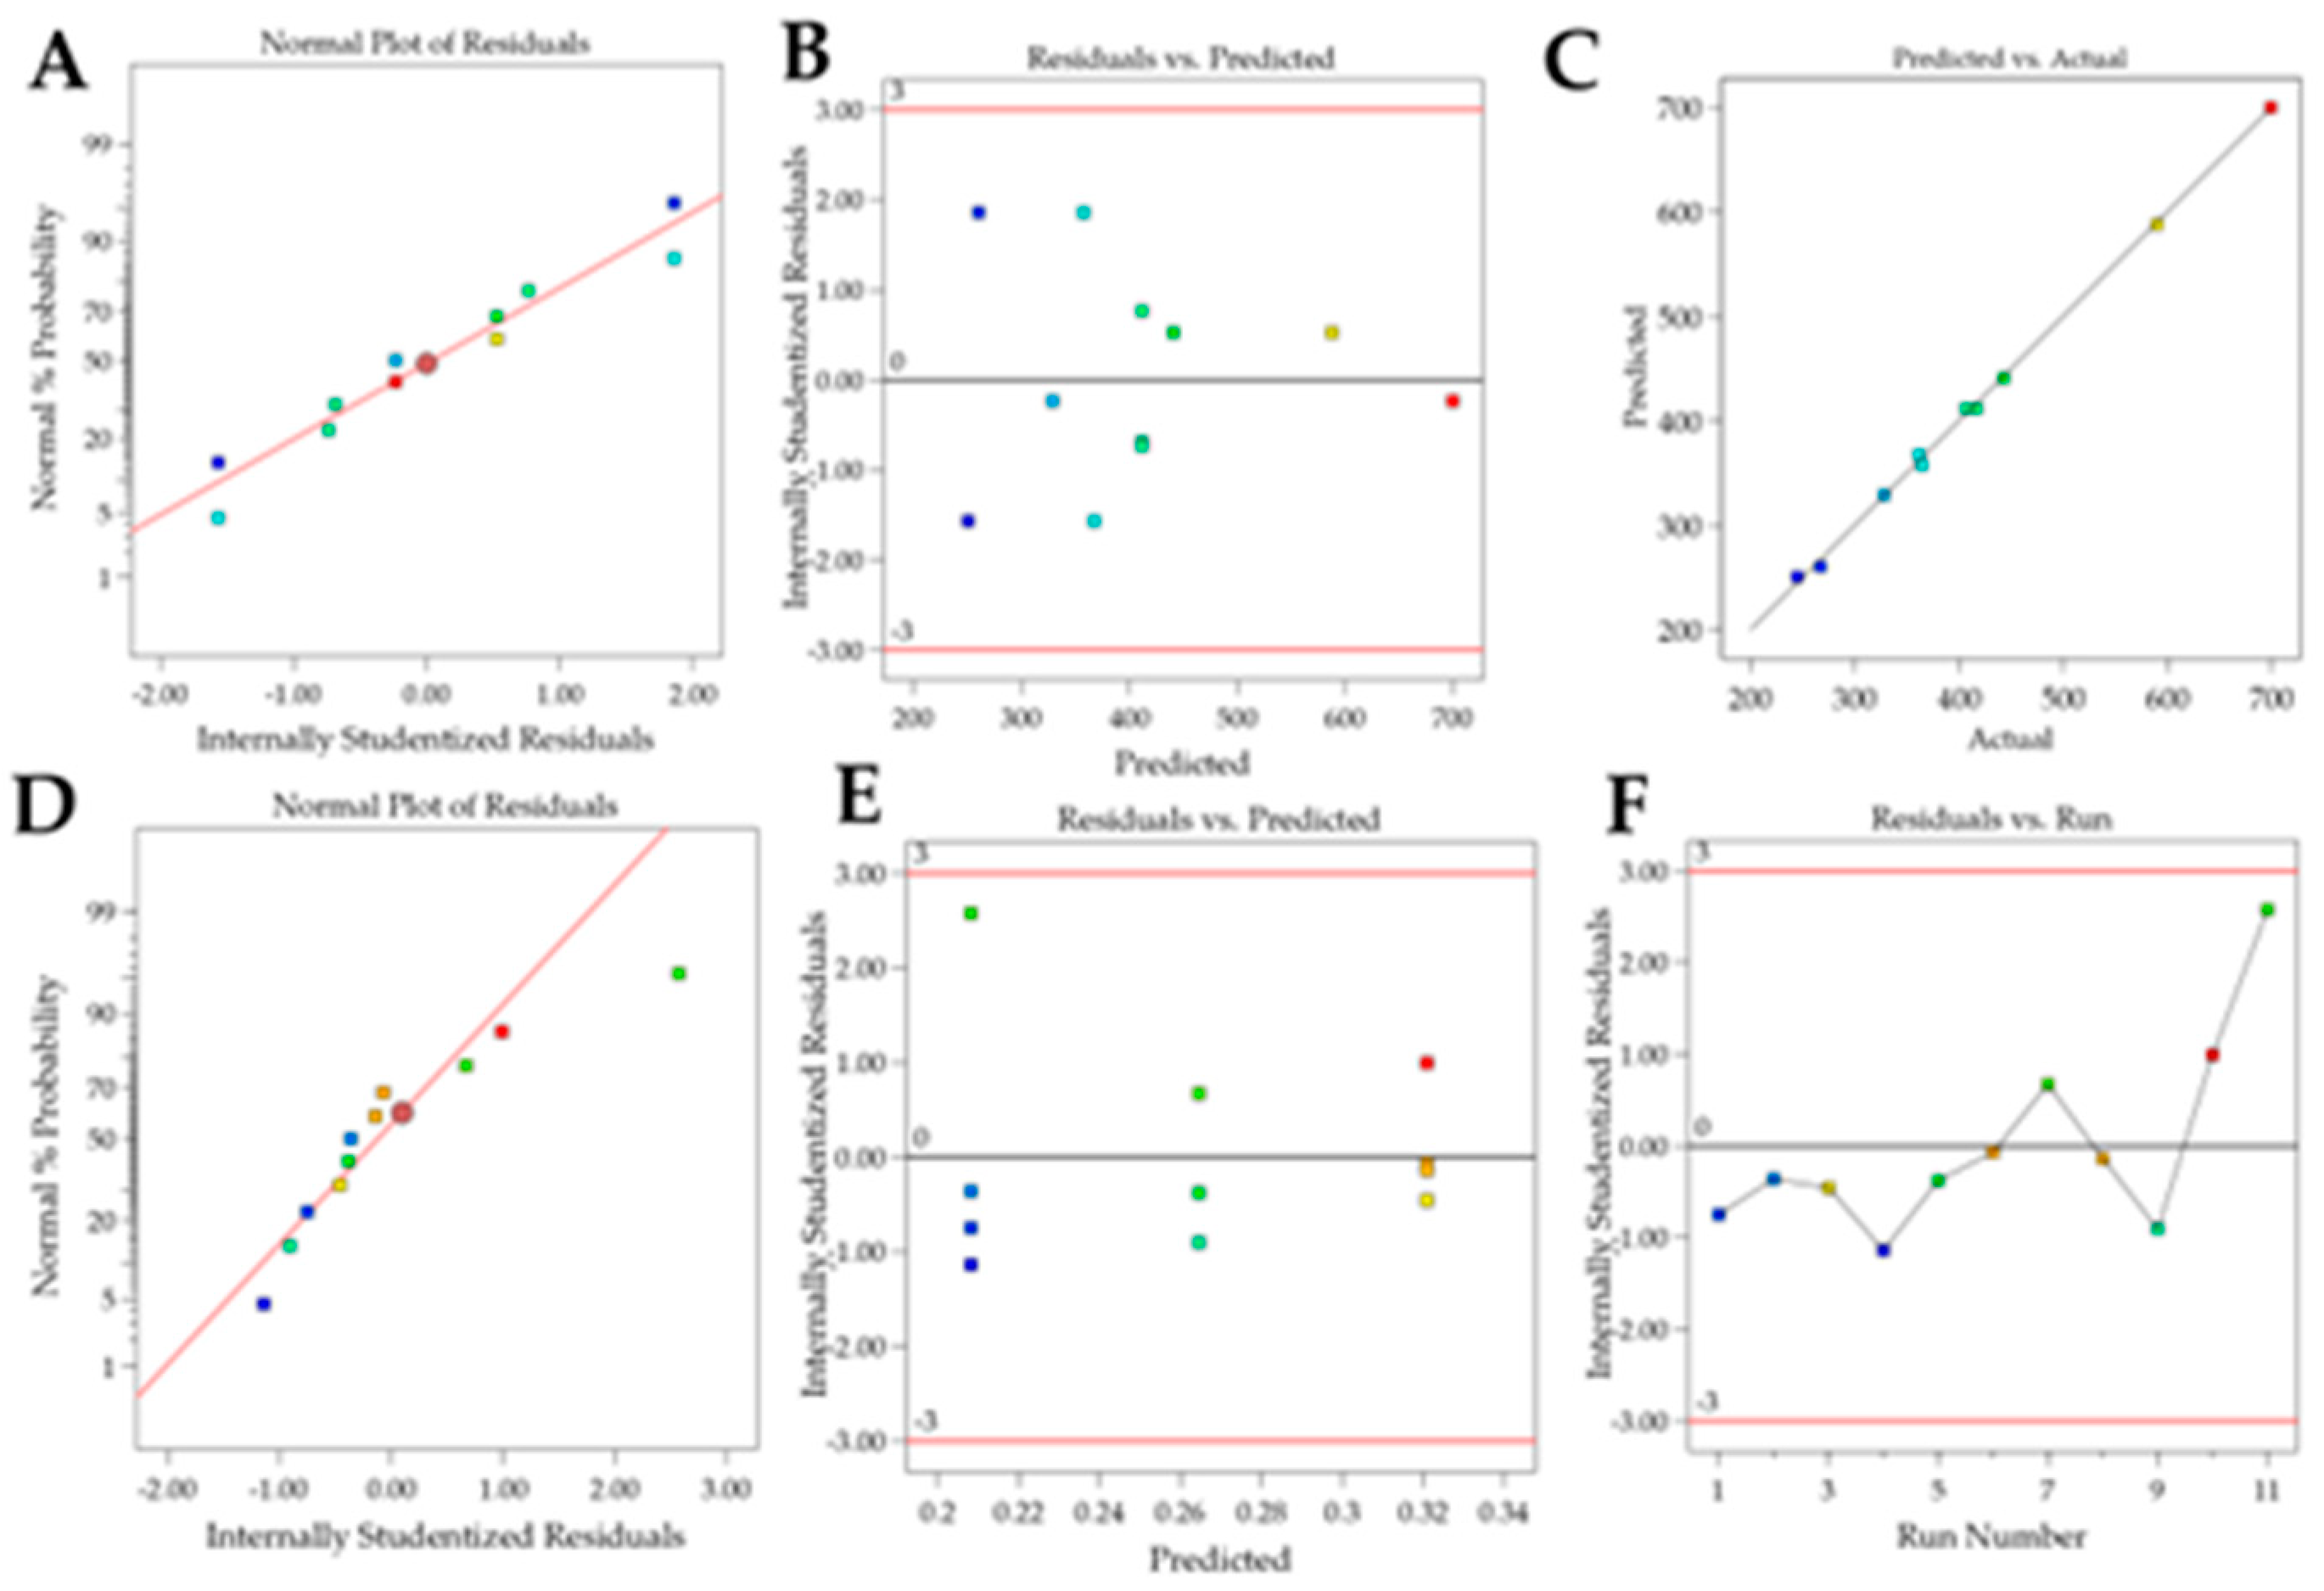
Figure 3.
Surface graphs for the responses of the formulation containing CrodasolTM HS HP as surfactant: A – Particle size. B – PDI and C – desirability graph.
Figure 3.
Surface graphs for the responses of the formulation containing CrodasolTM HS HP as surfactant: A – Particle size. B – PDI and C – desirability graph.
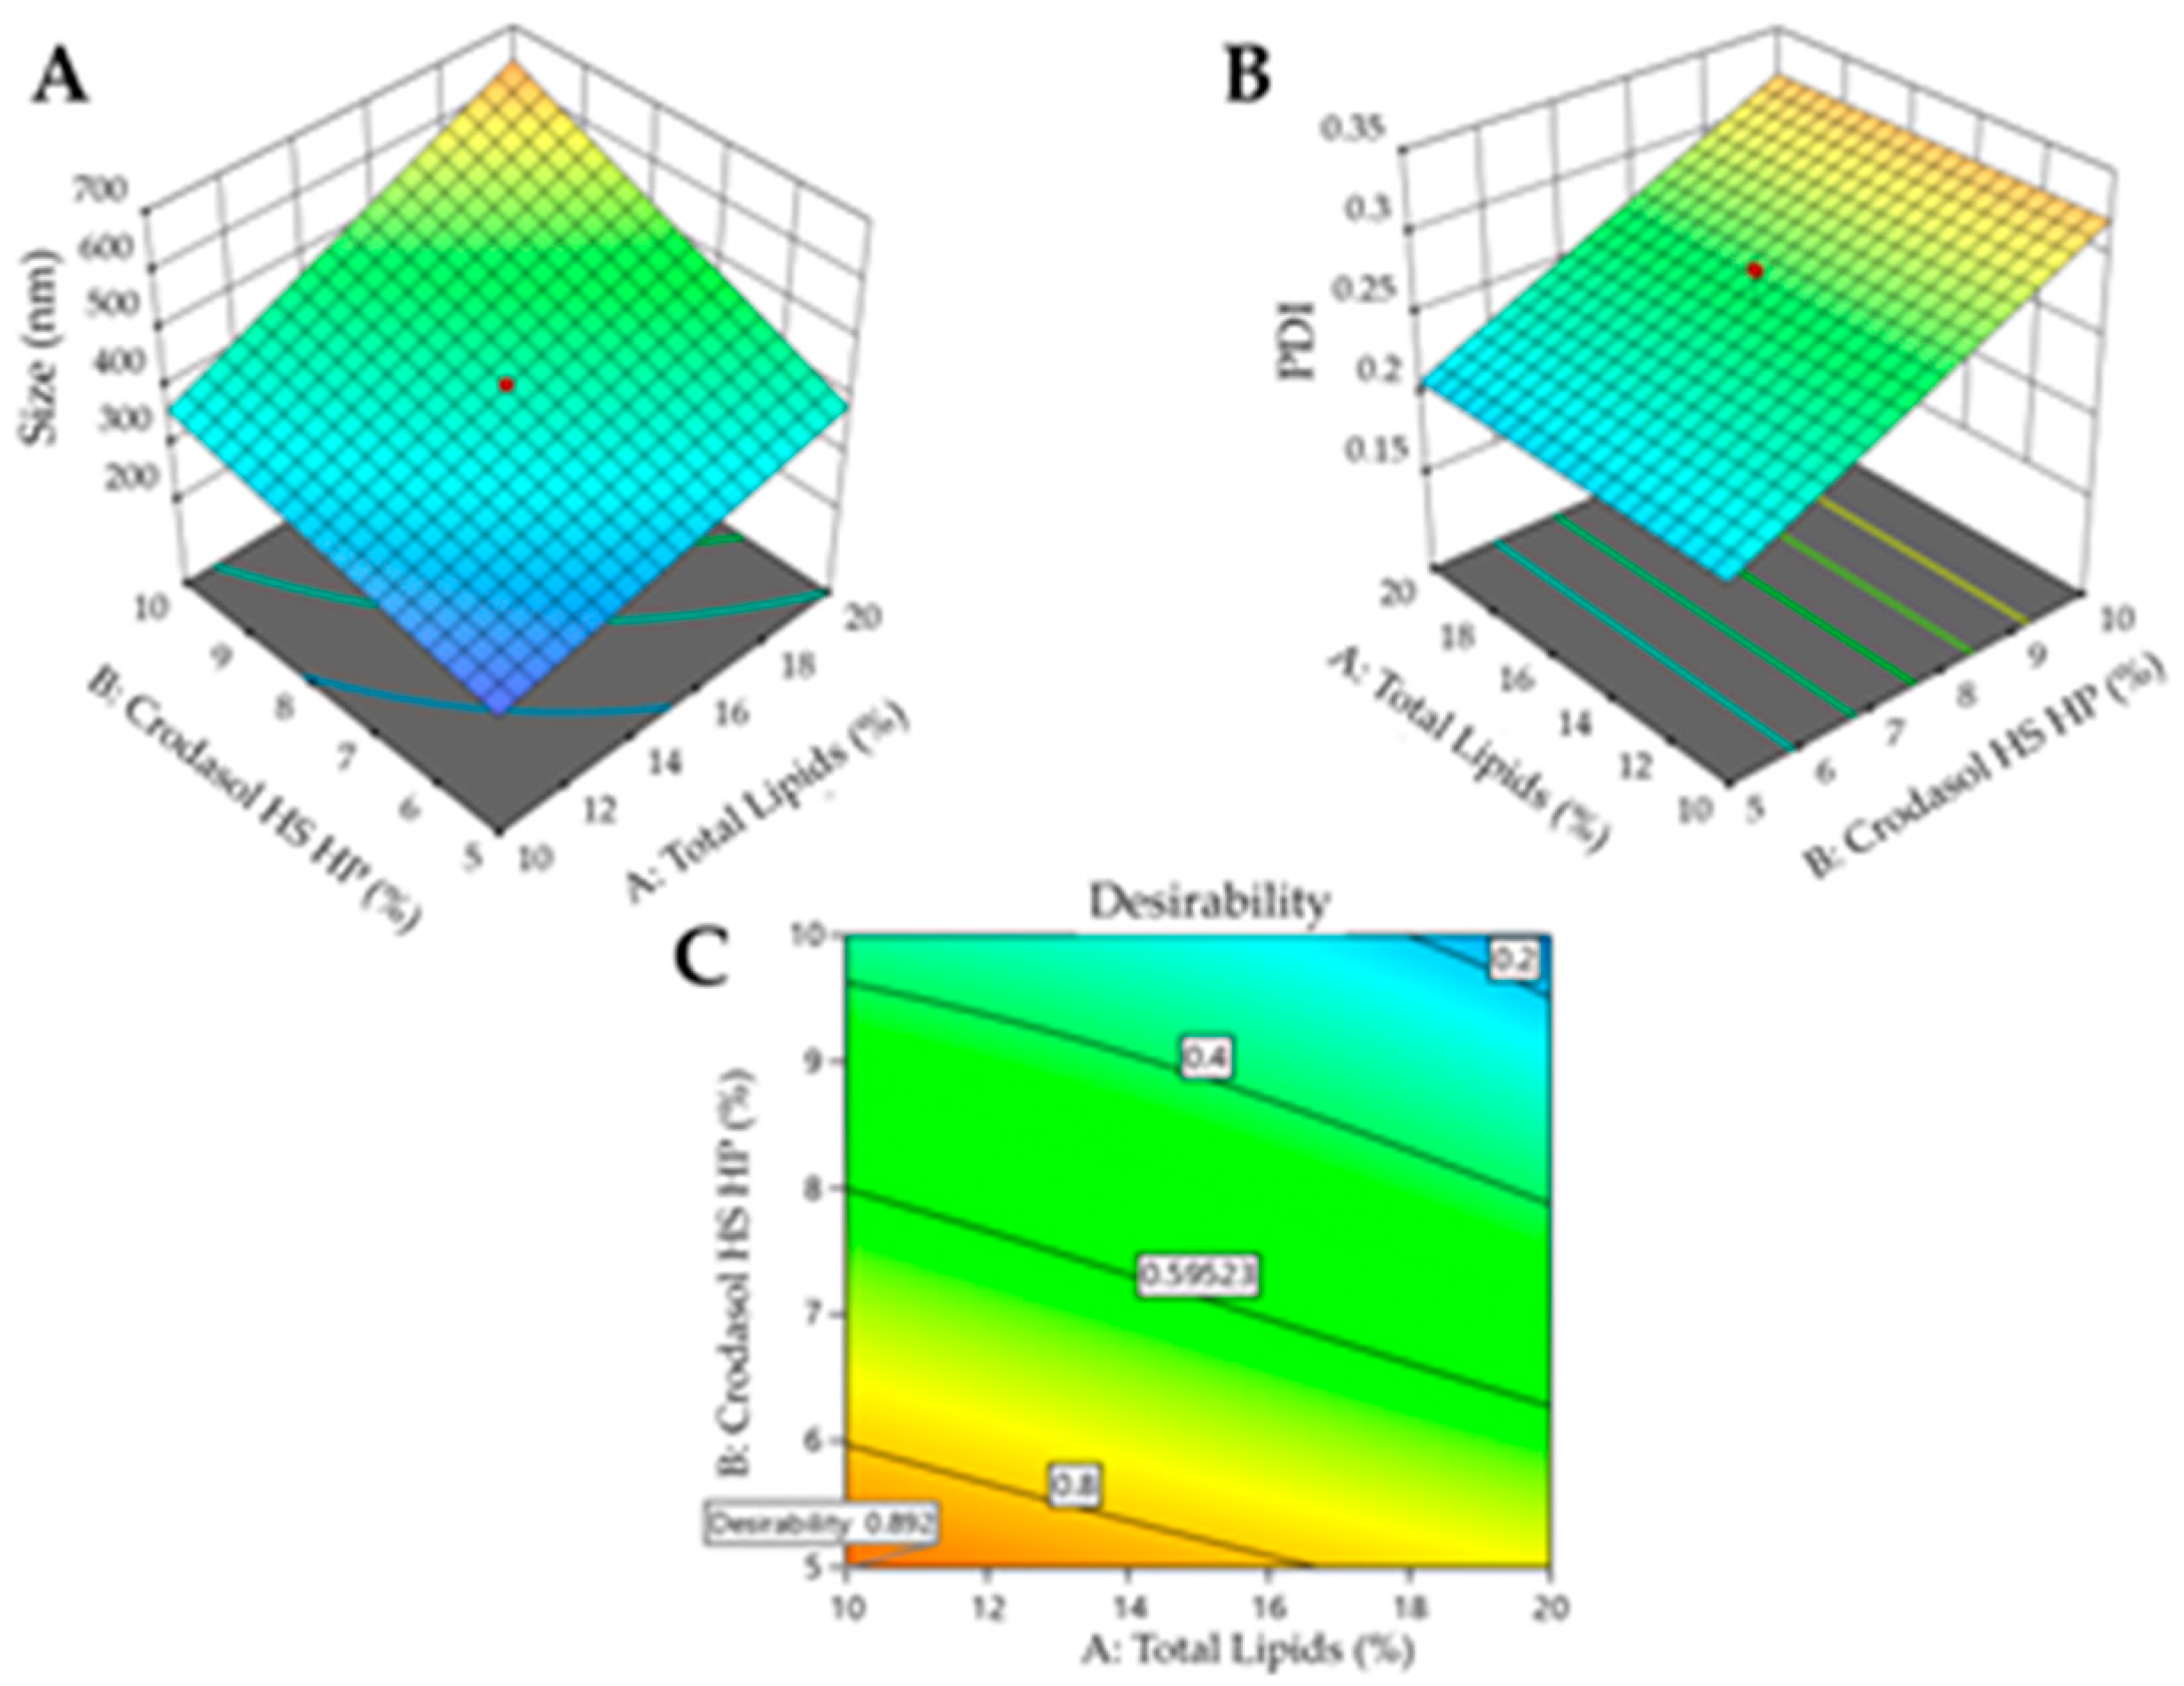
Figure 4.
Pareto chart with significant effects and their interactions in each response for the formulation containing SynperonicTM PE/F68 as surfactant.
Figure 4.
Pareto chart with significant effects and their interactions in each response for the formulation containing SynperonicTM PE/F68 as surfactant.
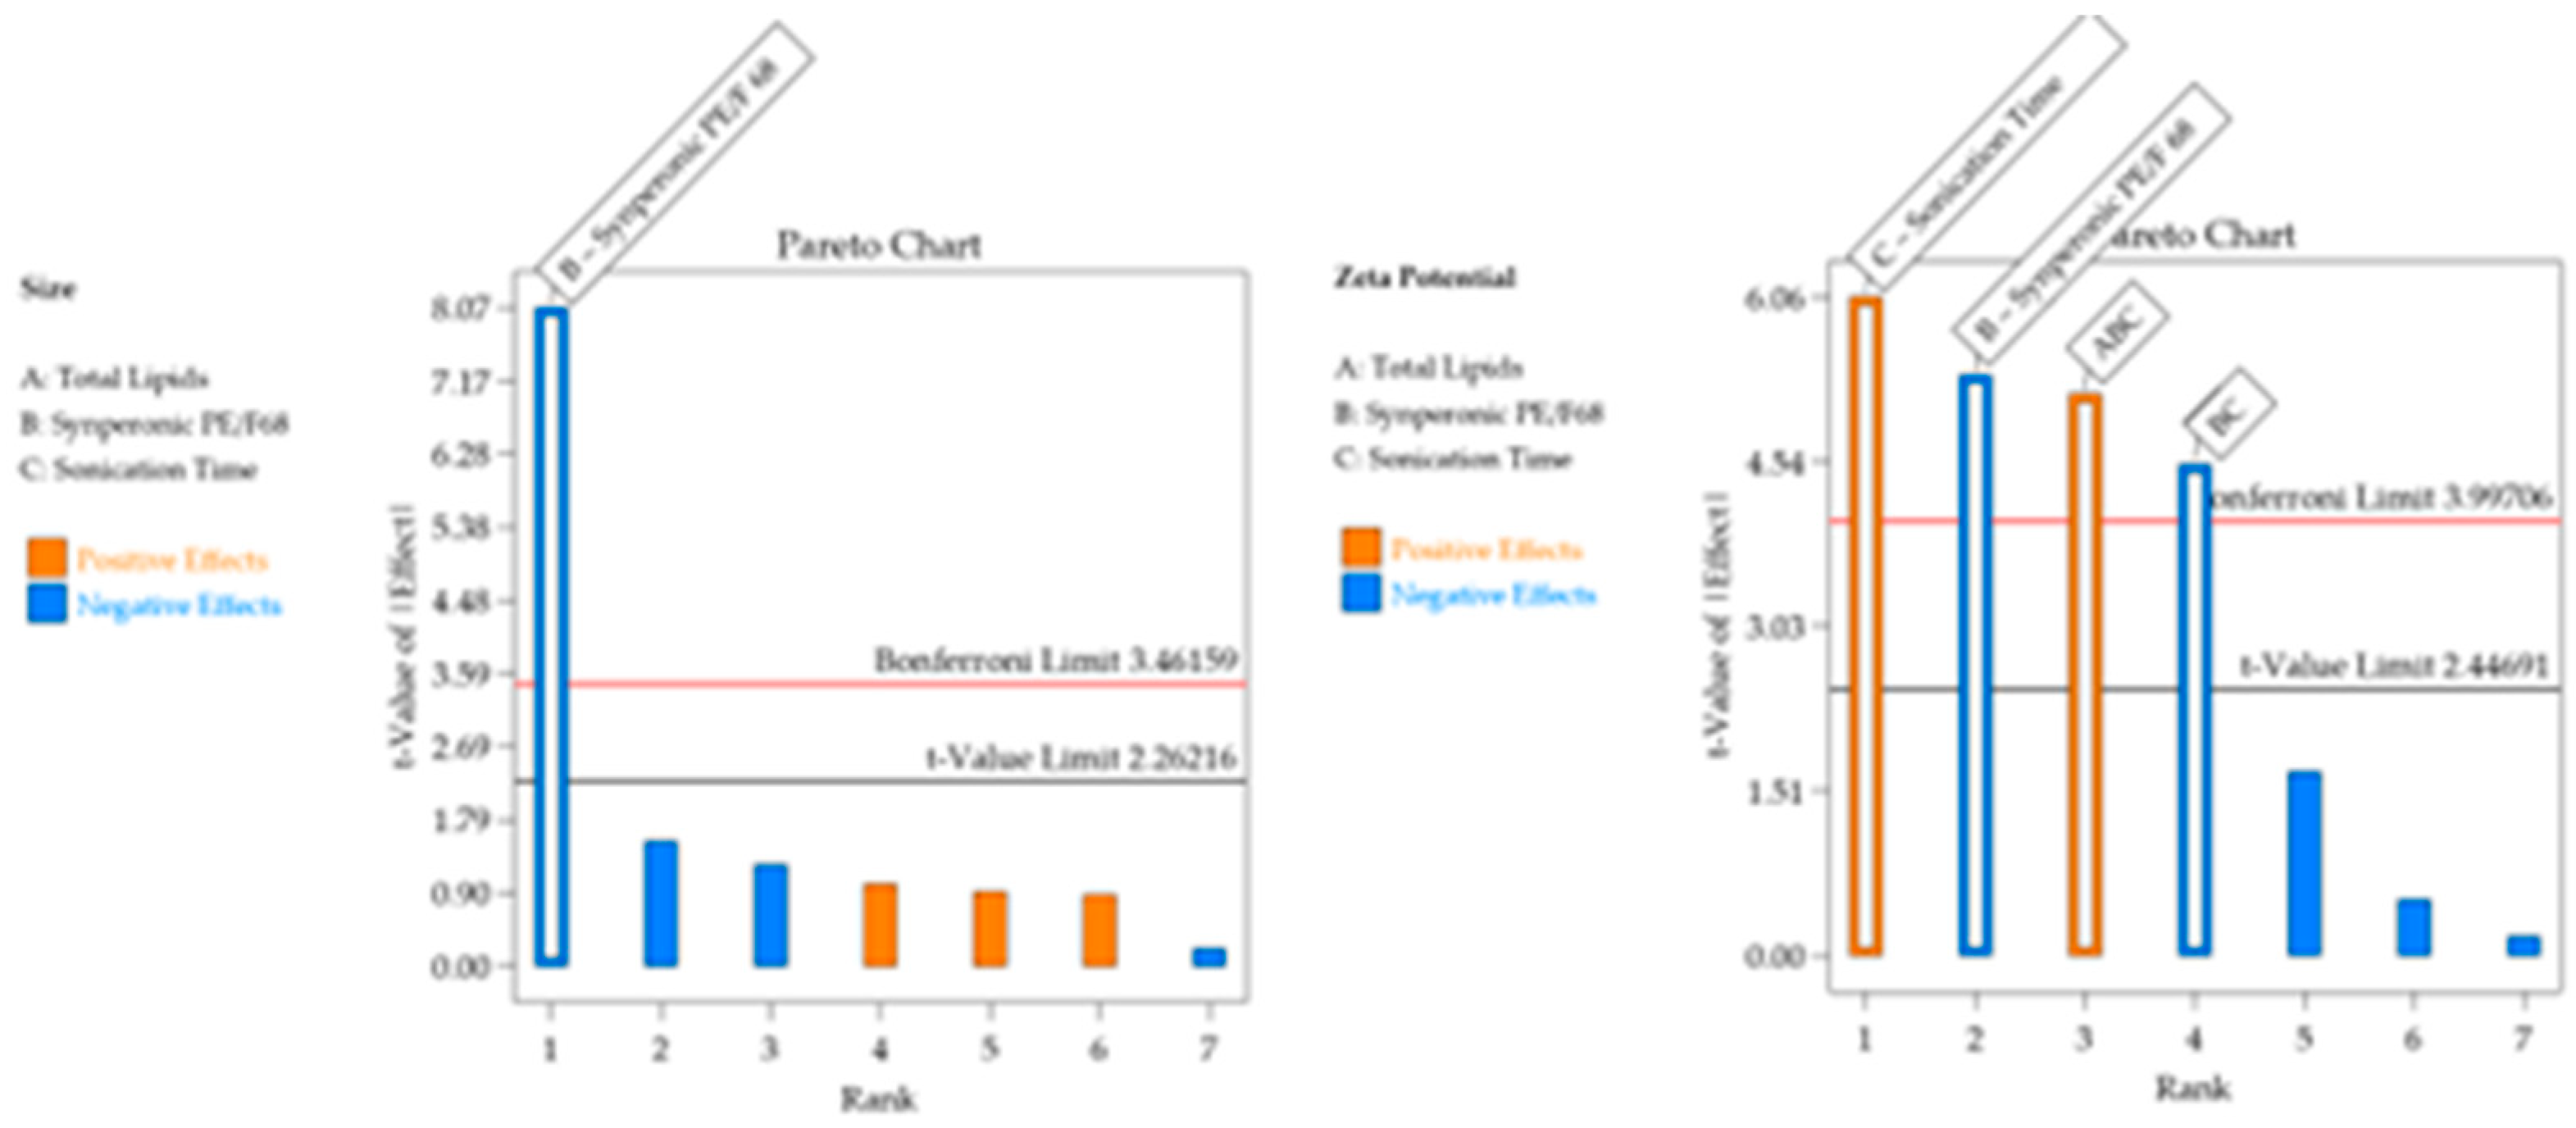
Figure 7.
Size, PDI, and Zeta plots of the DOE formulations with the two surfactants, containing BTB. Zeta Potential Values are expressed in module.
Figure 7.
Size, PDI, and Zeta plots of the DOE formulations with the two surfactants, containing BTB. Zeta Potential Values are expressed in module.
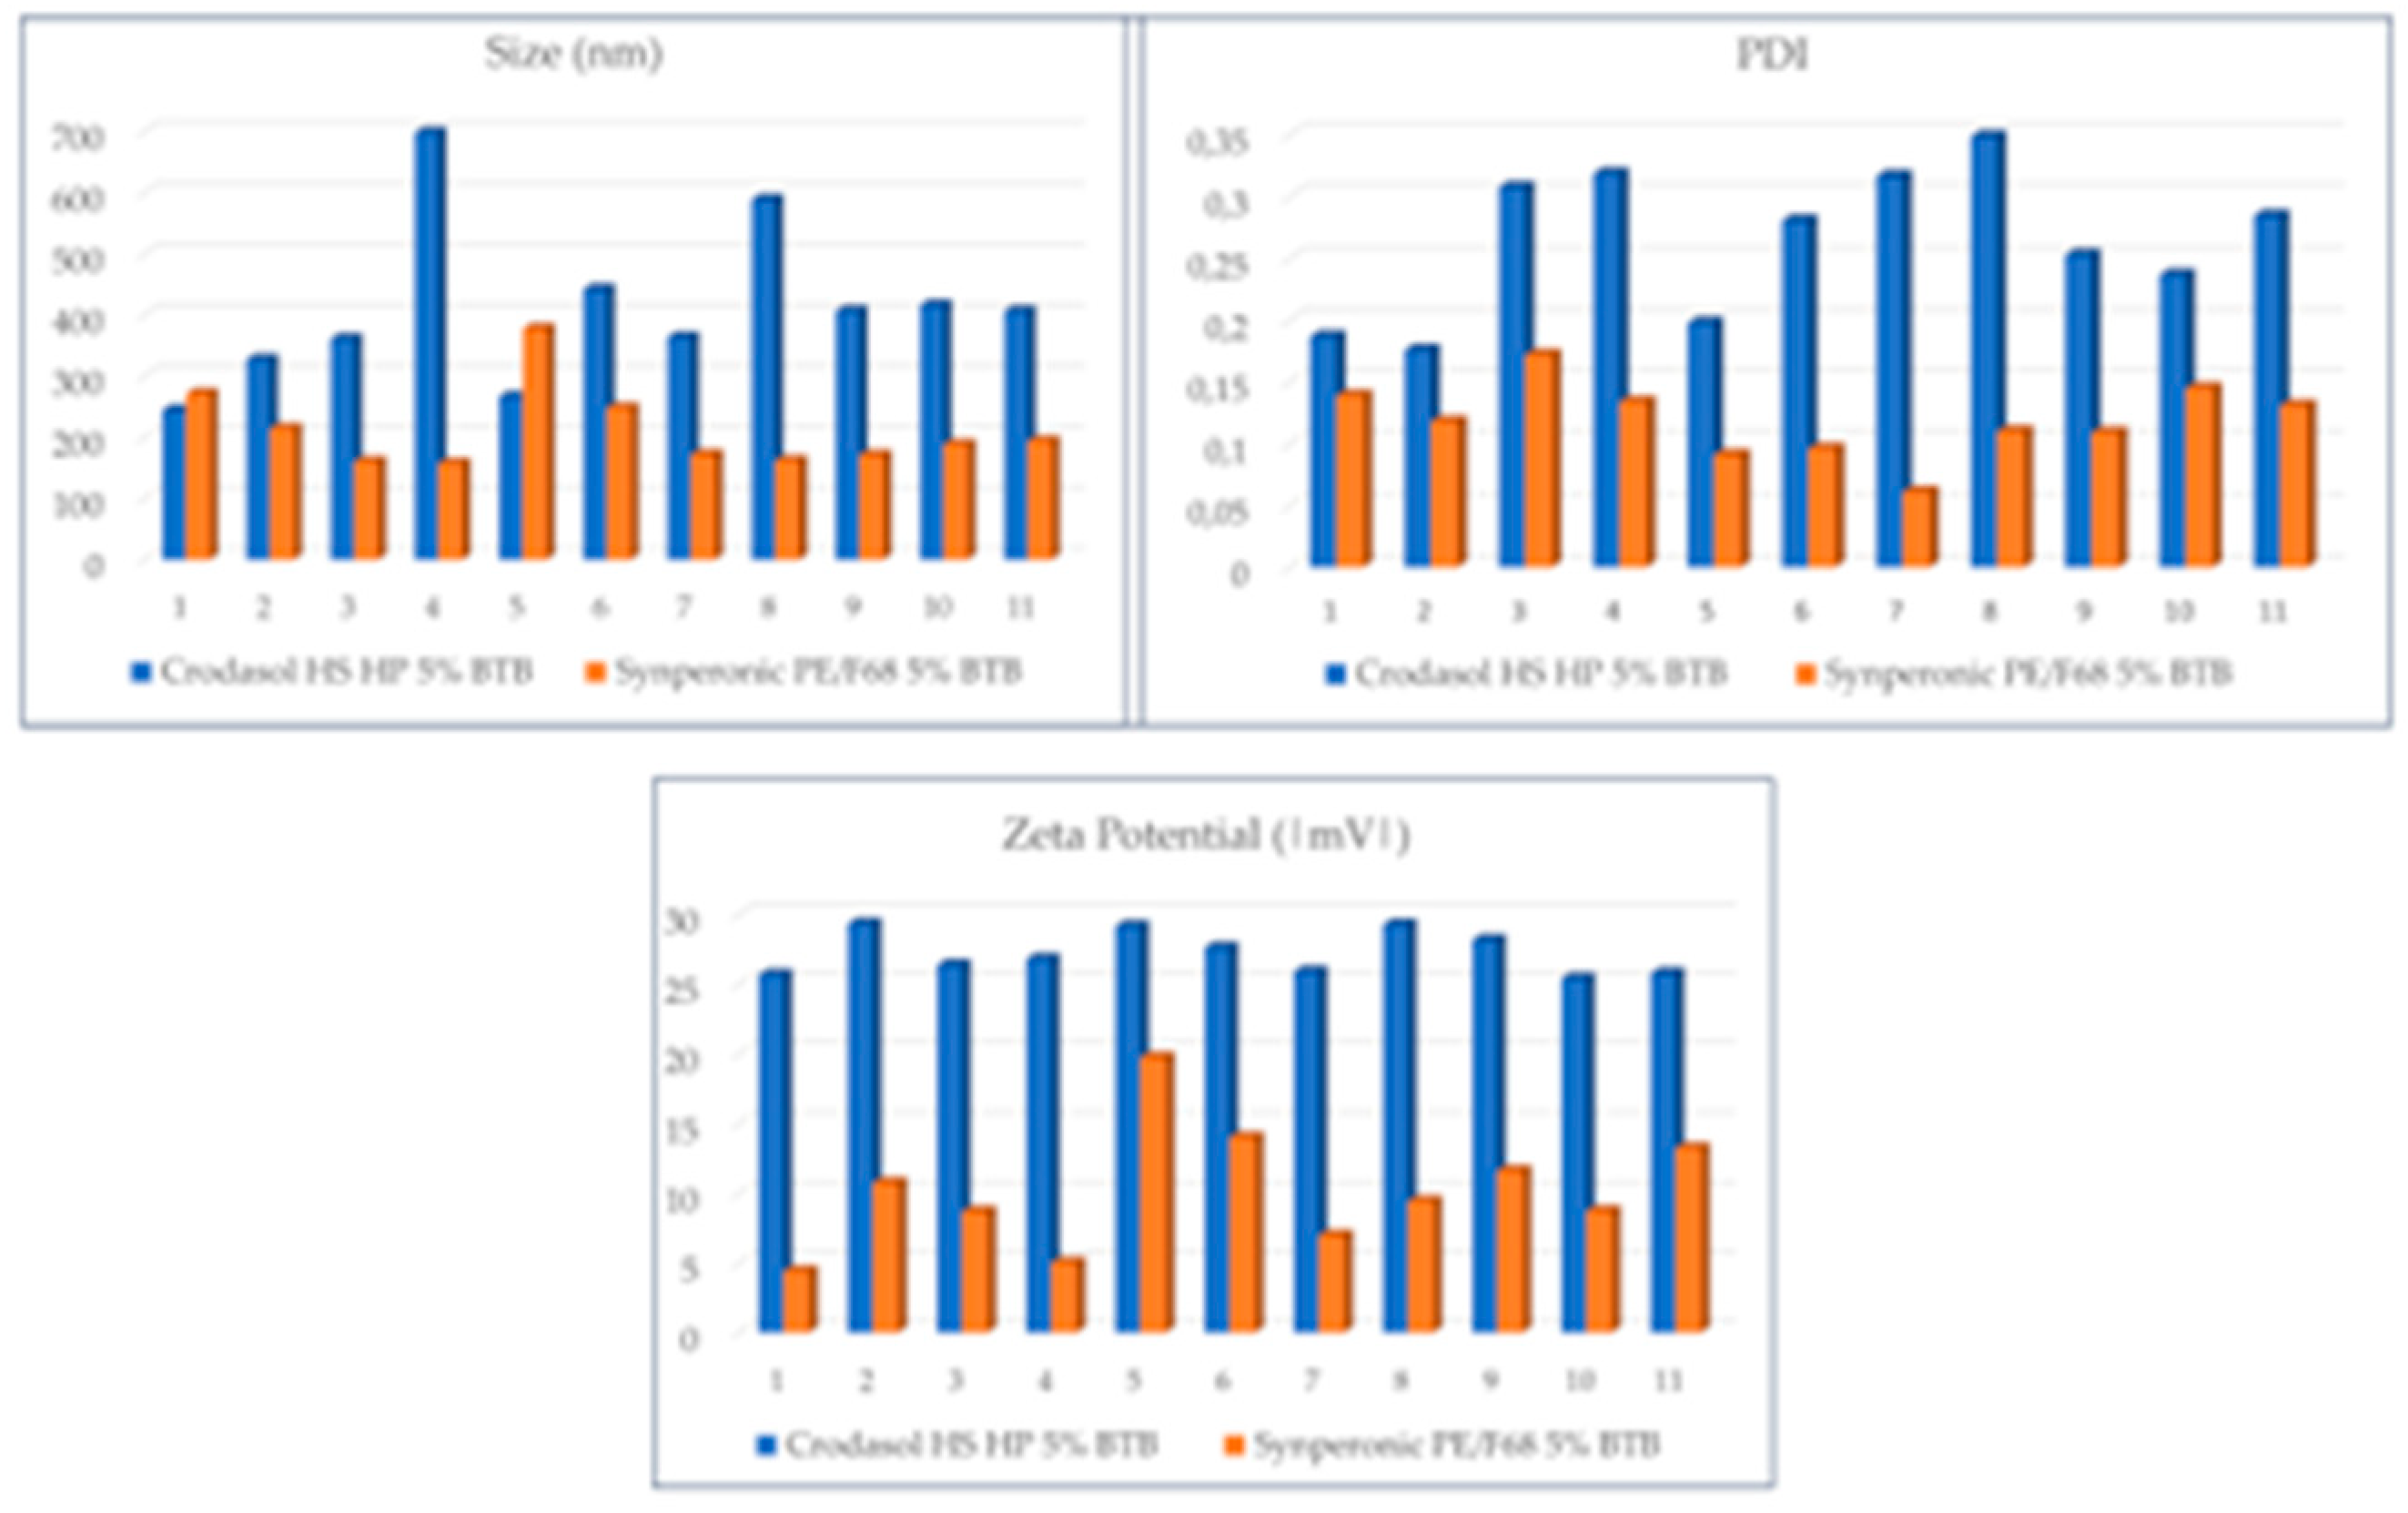
Figure 8.
Graphical presentation of the particle size, PDI, and zeta potential results of the Optimized formulations with and without SRTM DMI.
Figure 8.
Graphical presentation of the particle size, PDI, and zeta potential results of the Optimized formulations with and without SRTM DMI.
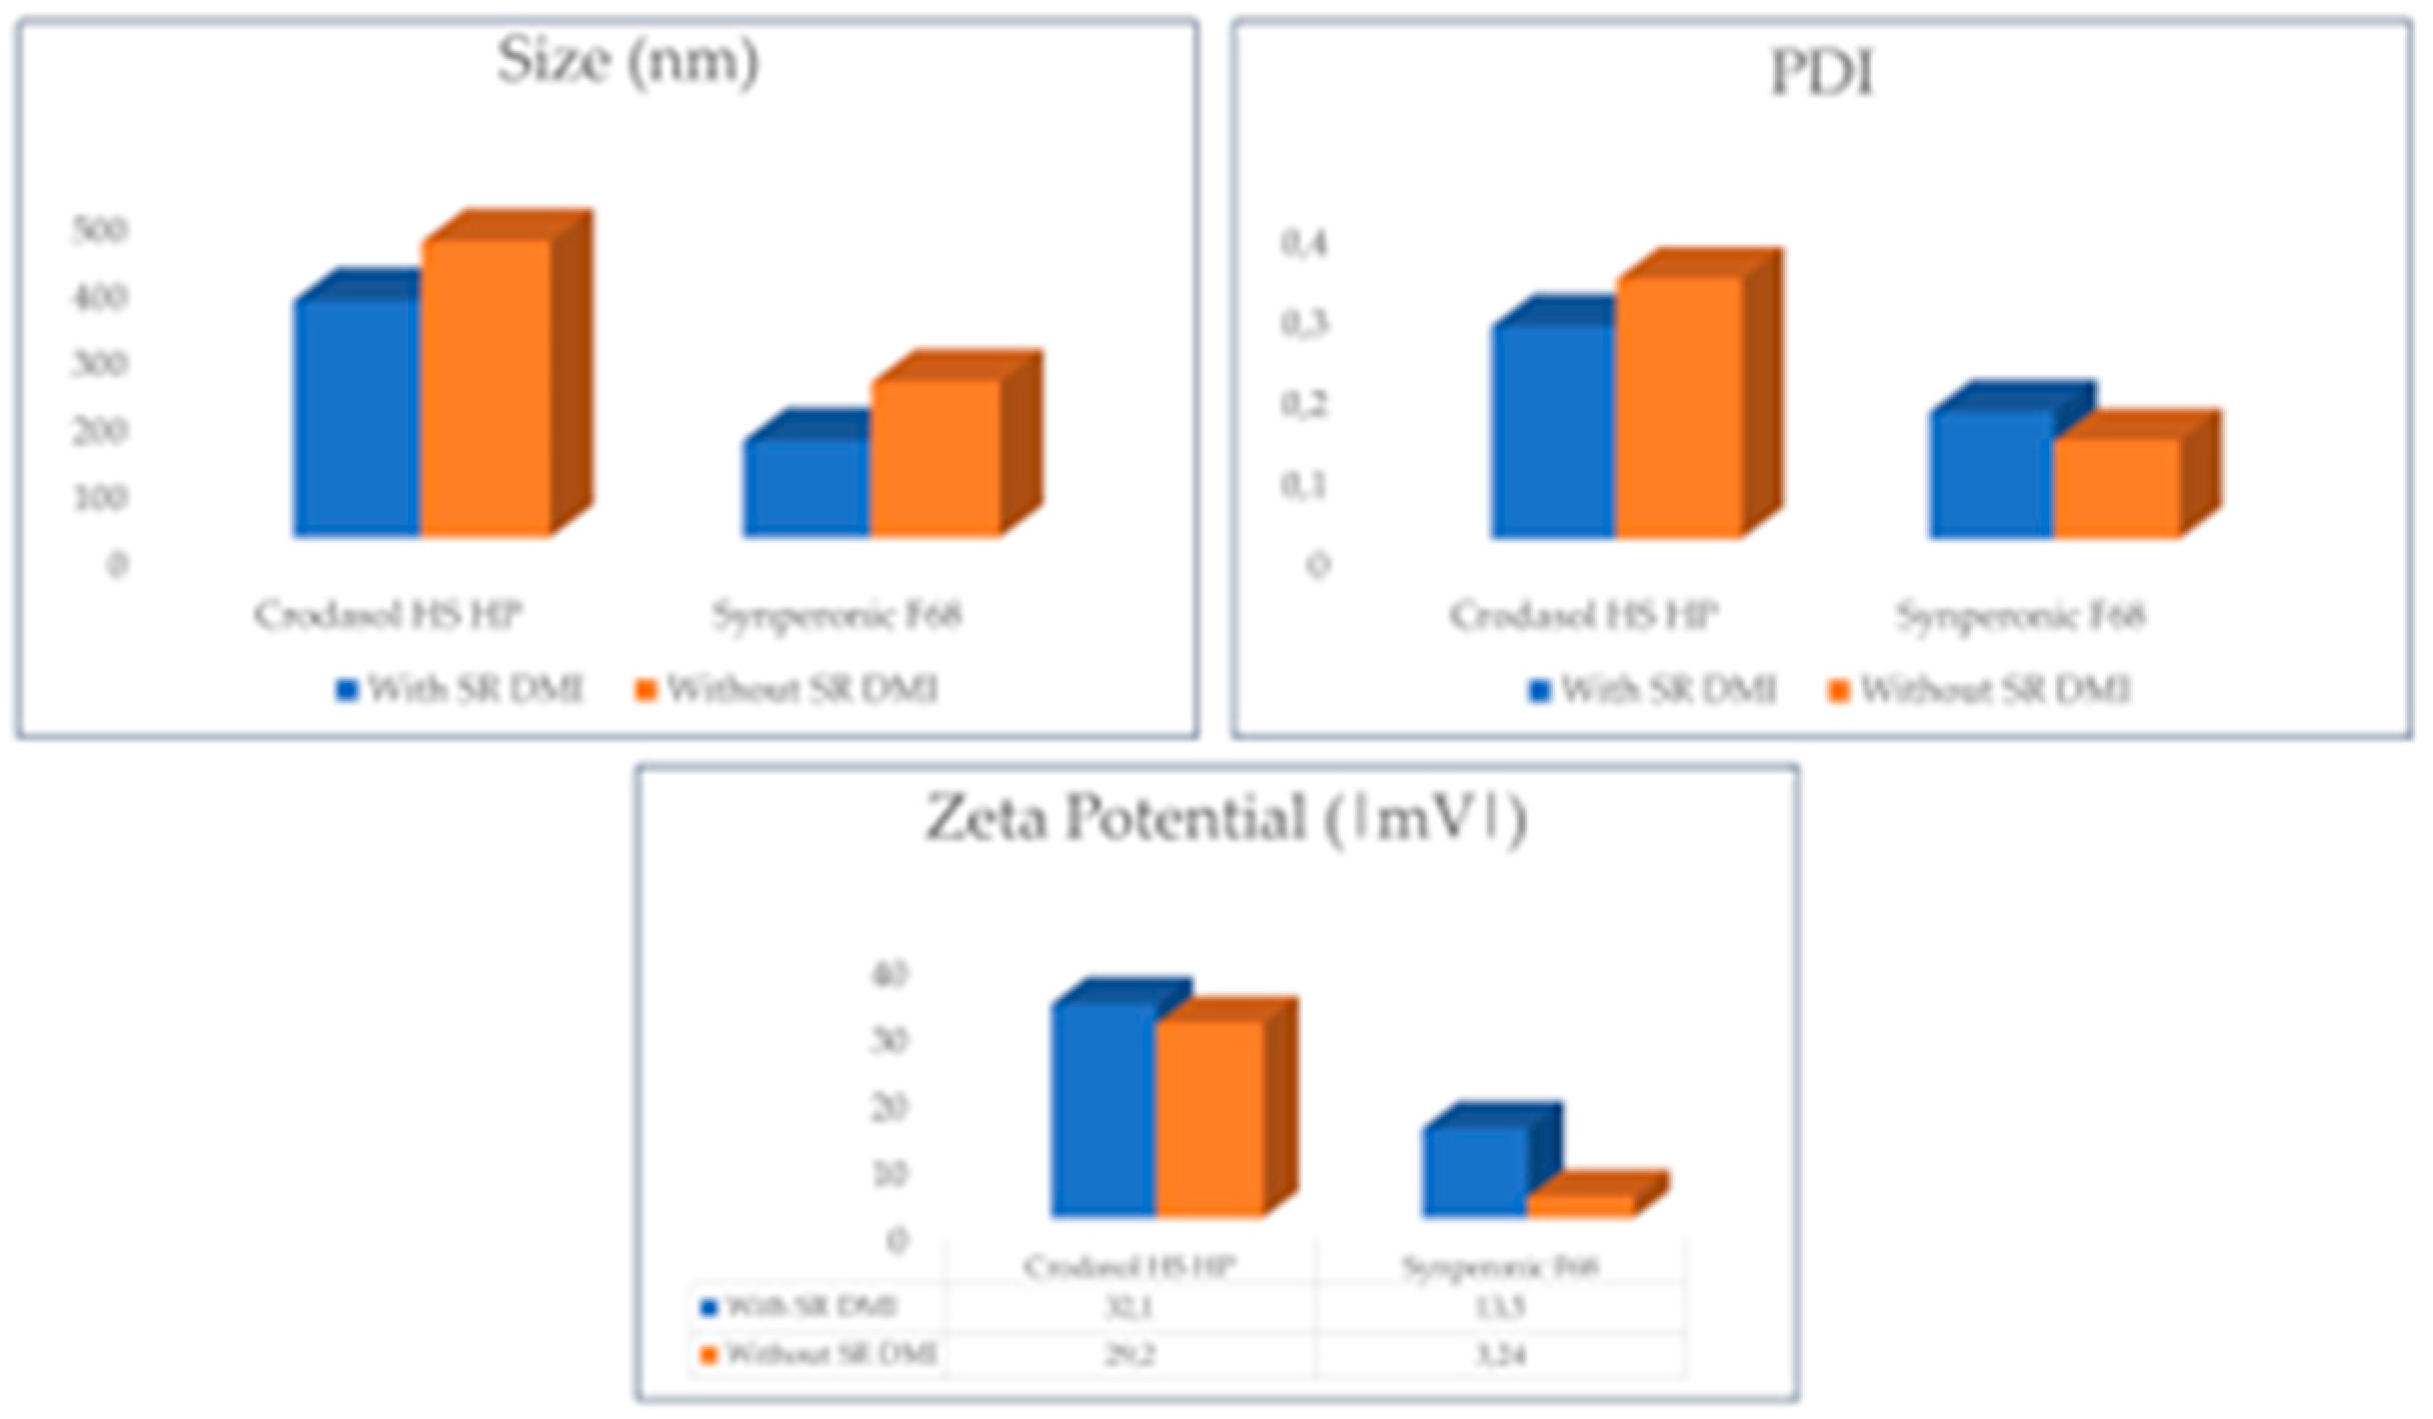
Figure 9.
DSC curves of CrodamolTM CP, CrodasolTM HS HP, SynperonicTM PE/F68, Butamben, and lyophilized NLCs. CBTB-NLC: NLC with CrodasolTM HS HP and BTB. C-NLC: NLC with CrodasolTM HS HP without BTB. SBTB-NLC: NLC with SynperonicTM PE/F68 and BTB. S-NLC: NLC with SynperonicTM PE/F68 without BTB. M-NLC: a physical mixture of the formulation containing: butamben, CrodamolTM CP, and SynperonicTM PE/F68.
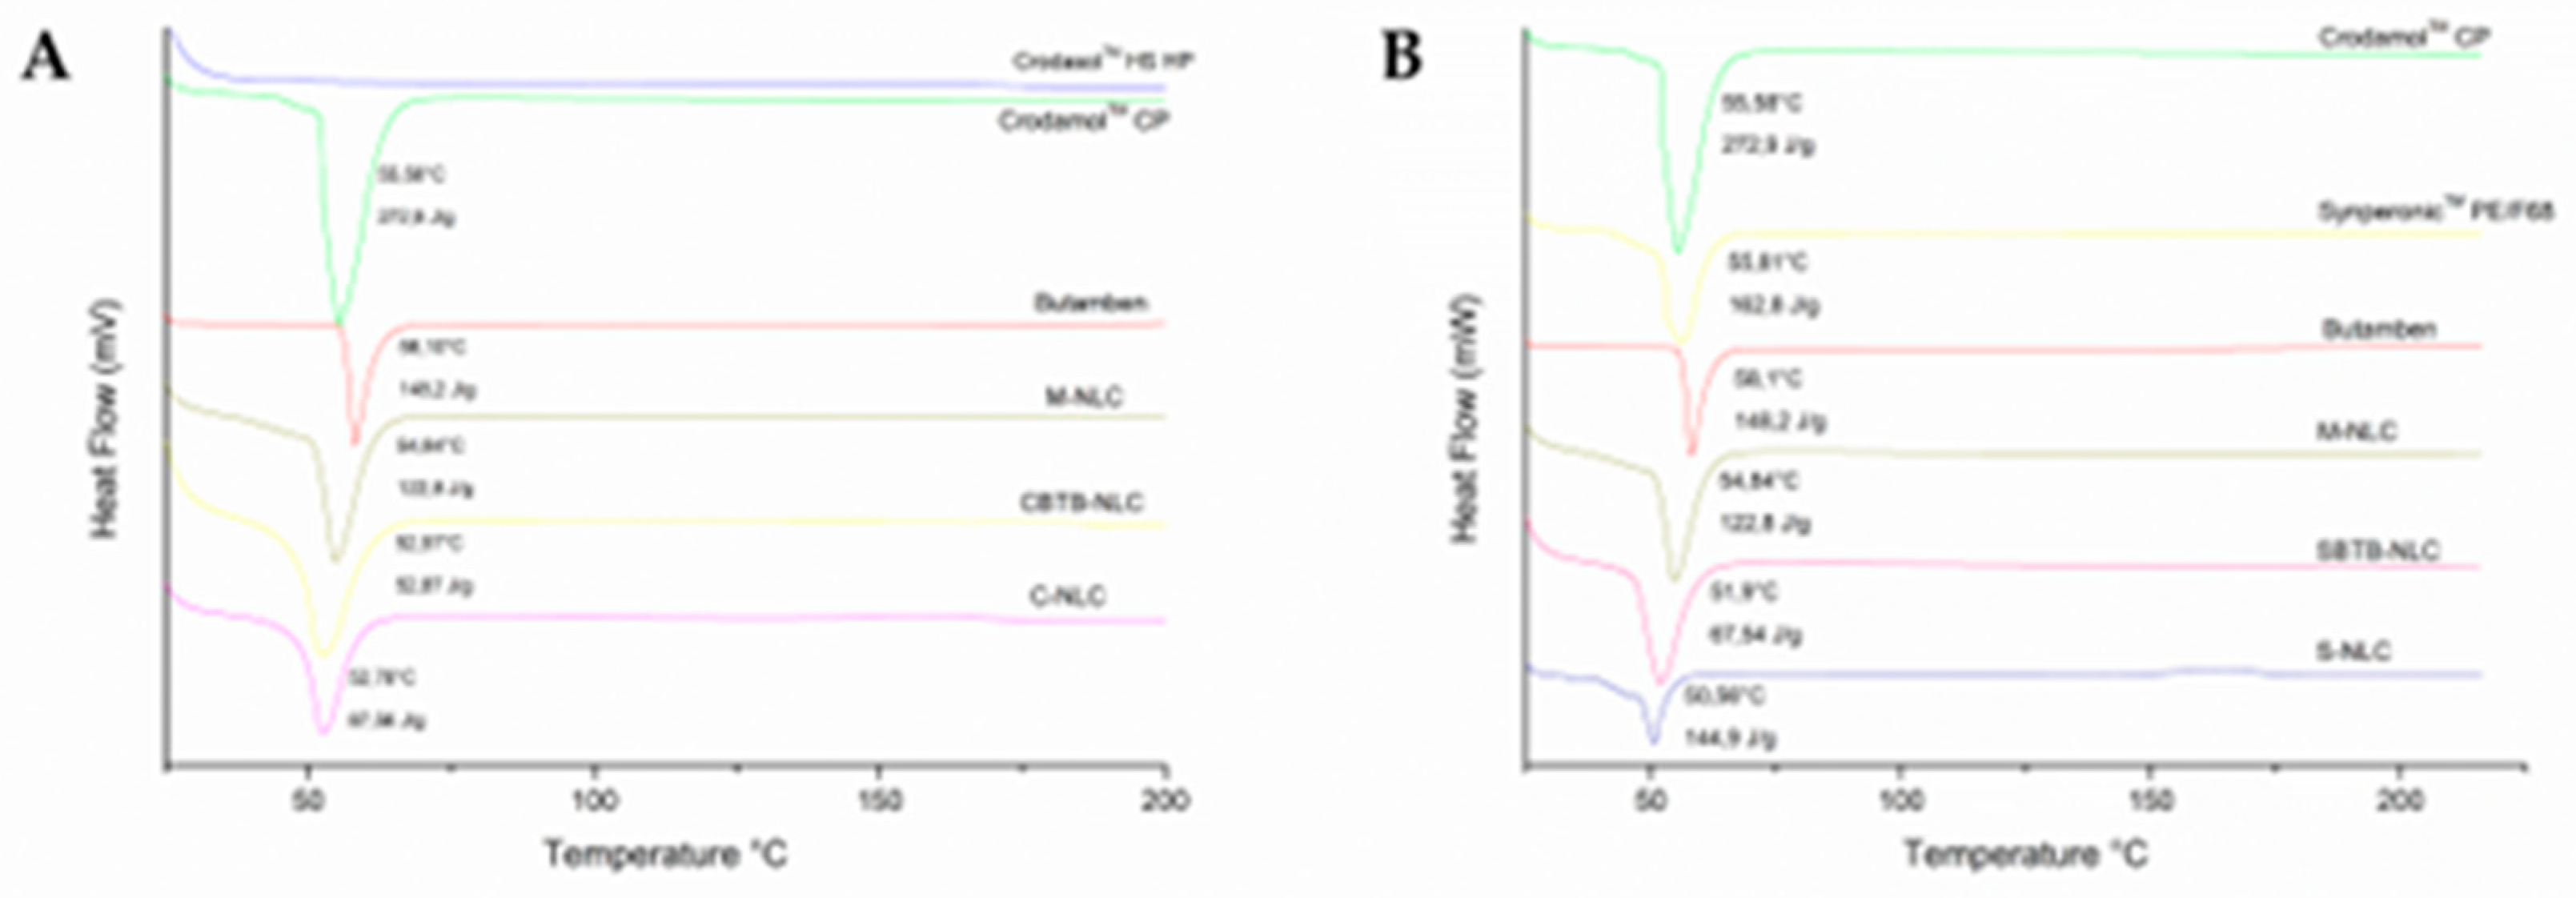
Figure 10.
ATR-FTIR absorption spectra of the excipients, lyophilized NLCs, and the drug.
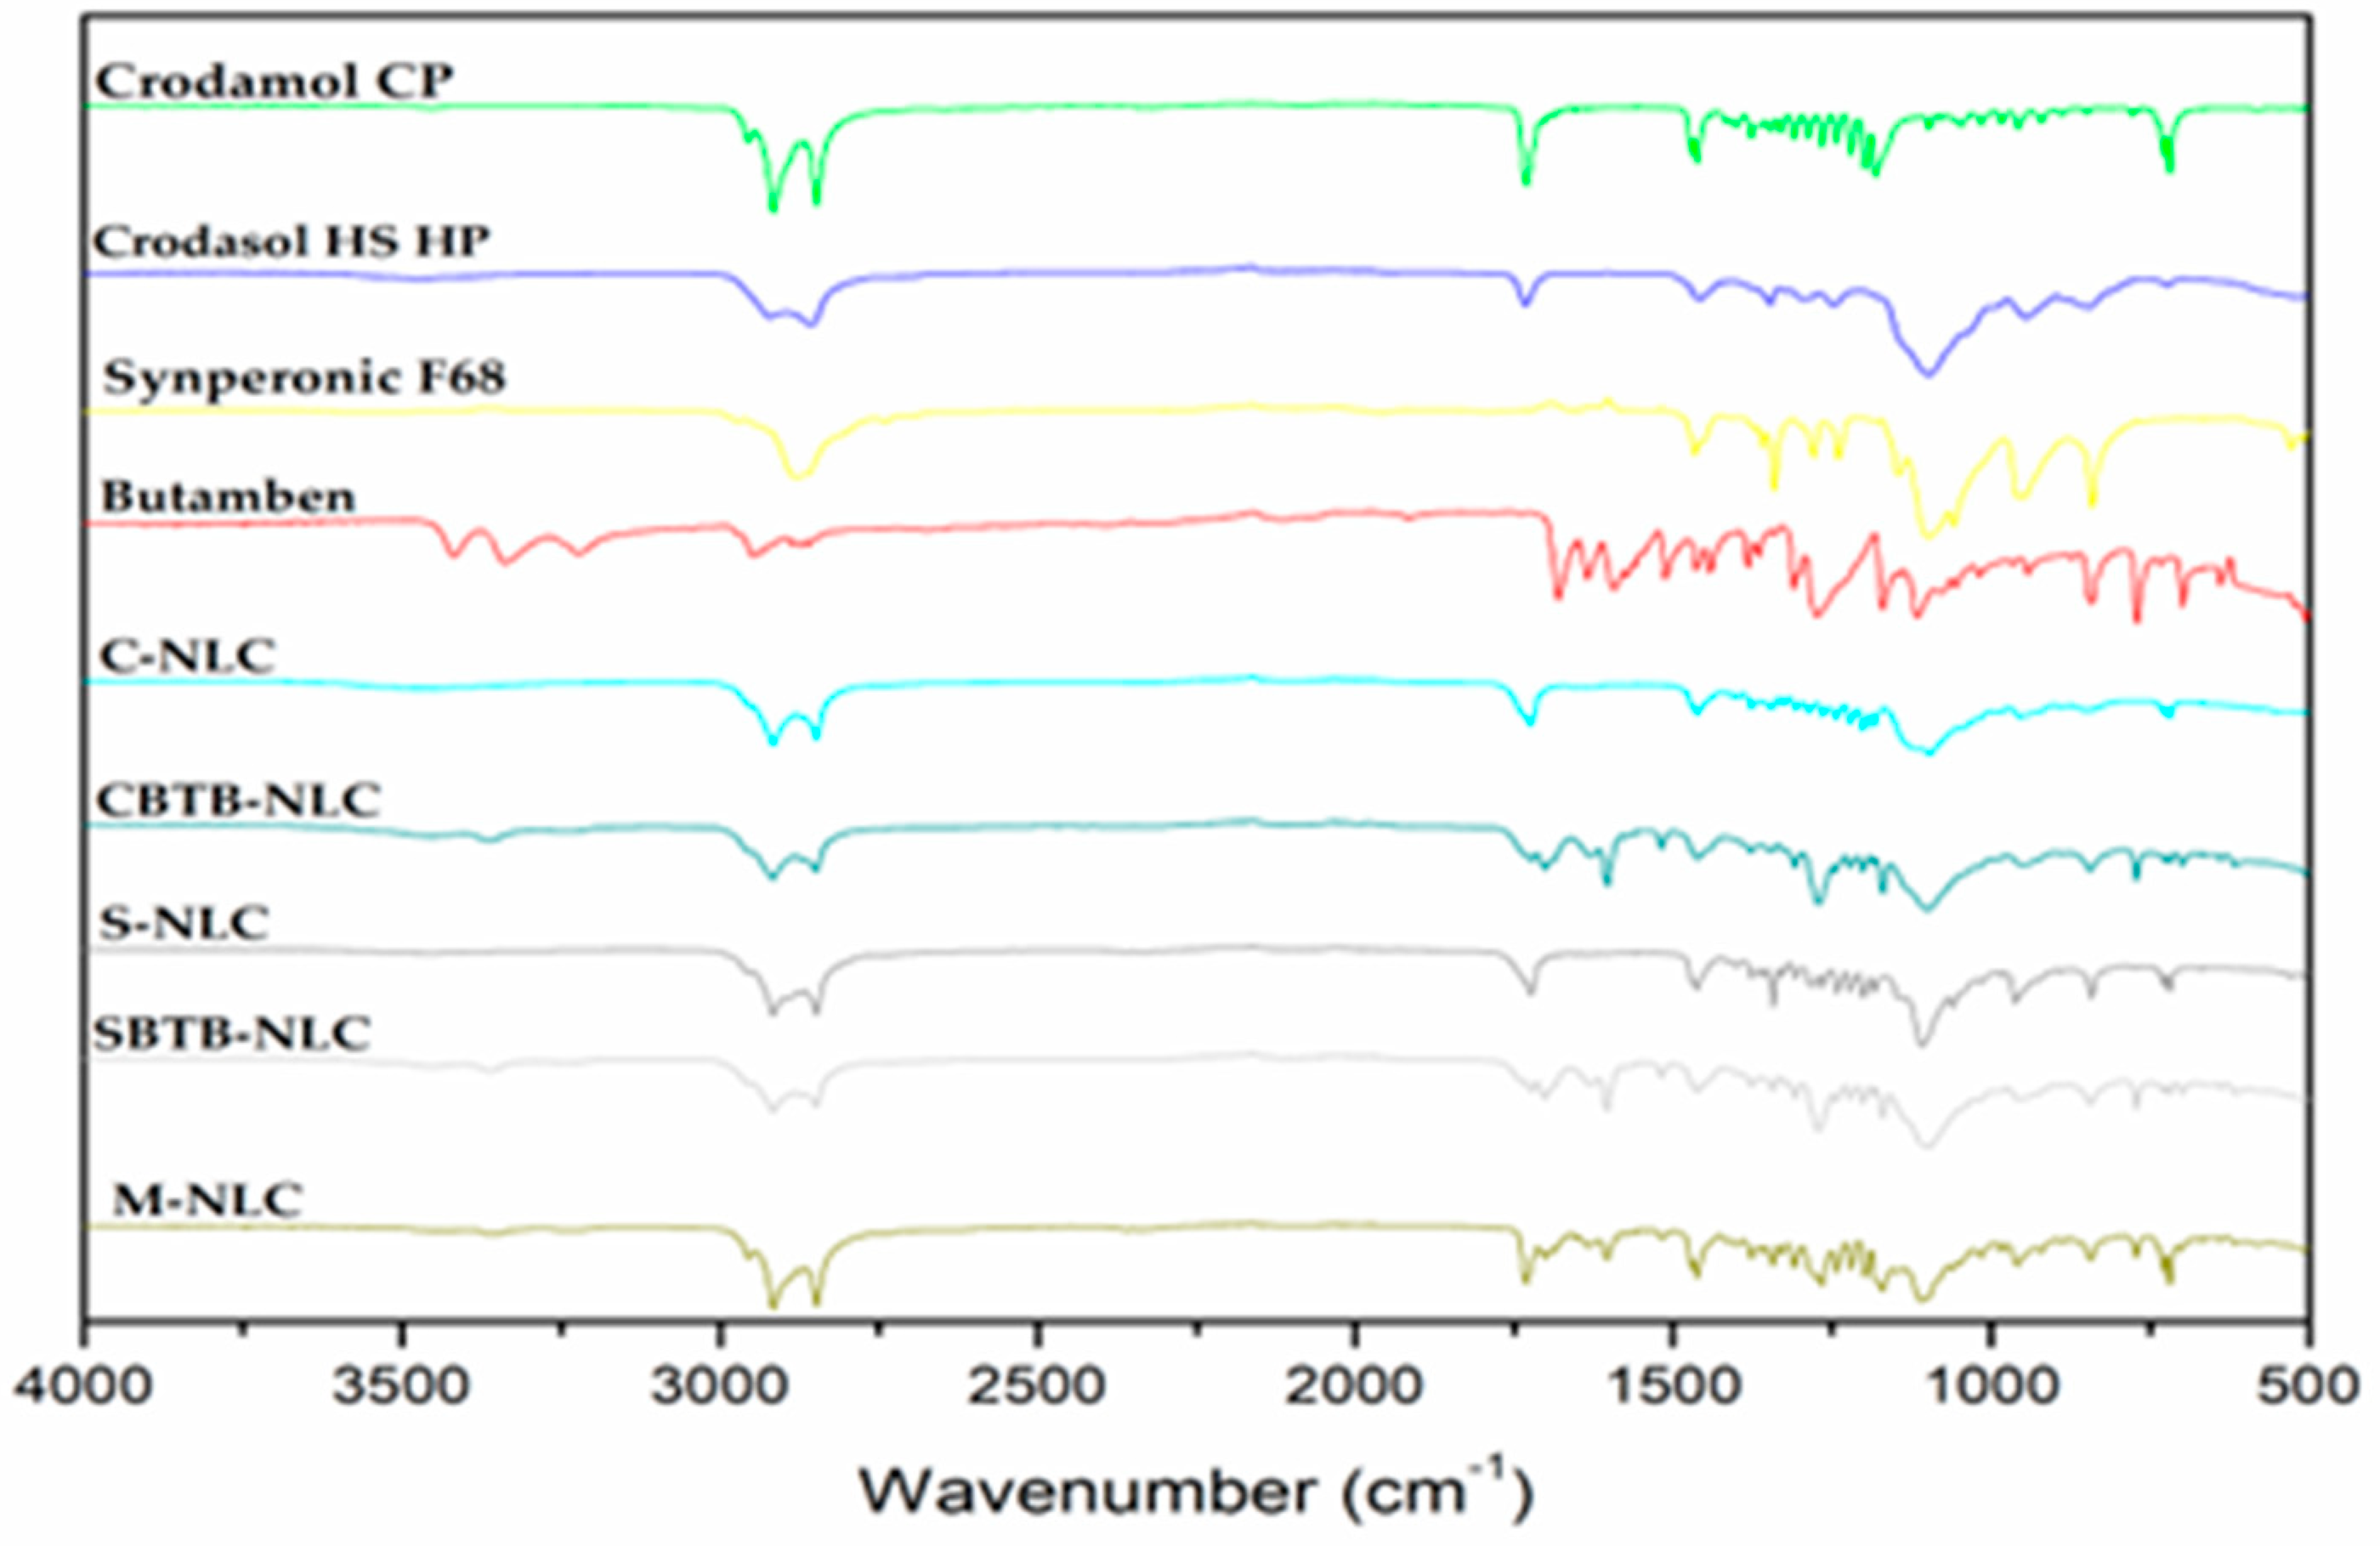
Figure 11.
Magnification of the ATR-FTIR absorption spectra of BTB, C-NLC, CBTB-NLC, S-NLC, and SBTB-NLC.
Figure 11.
Magnification of the ATR-FTIR absorption spectra of BTB, C-NLC, CBTB-NLC, S-NLC, and SBTB-NLC.
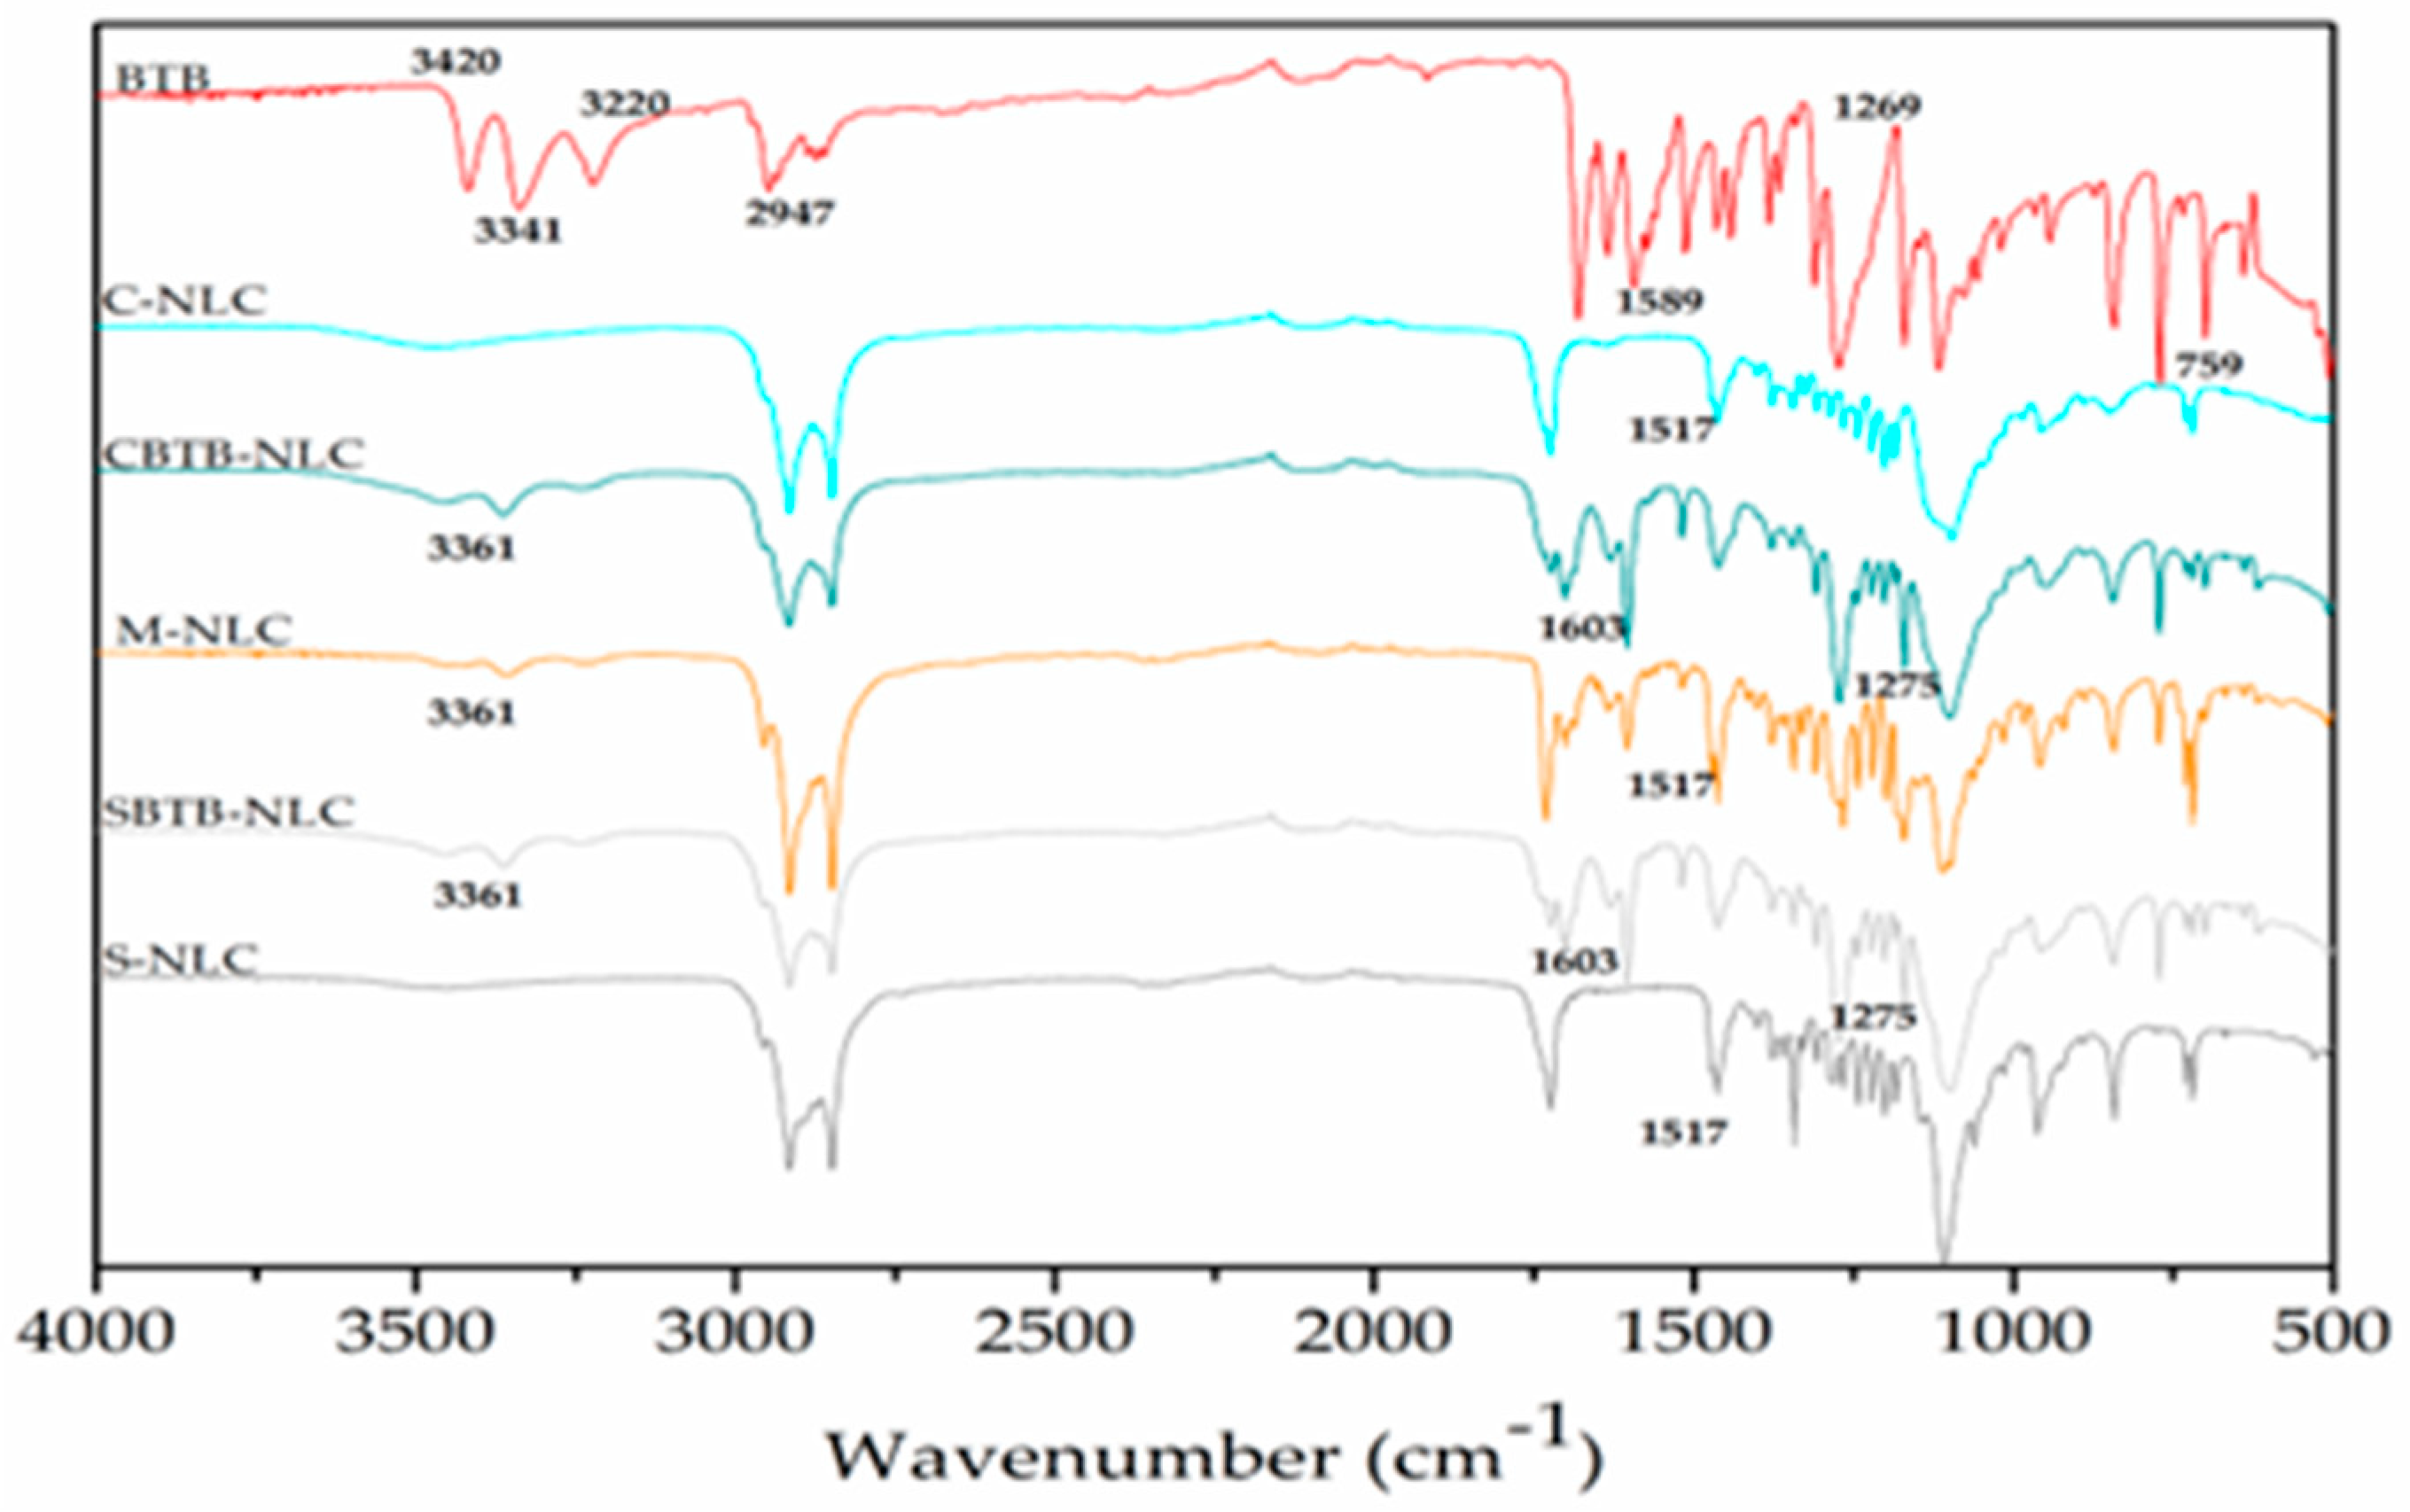
Figure 12.
Results of stability analysis of NLCs with Butamben.
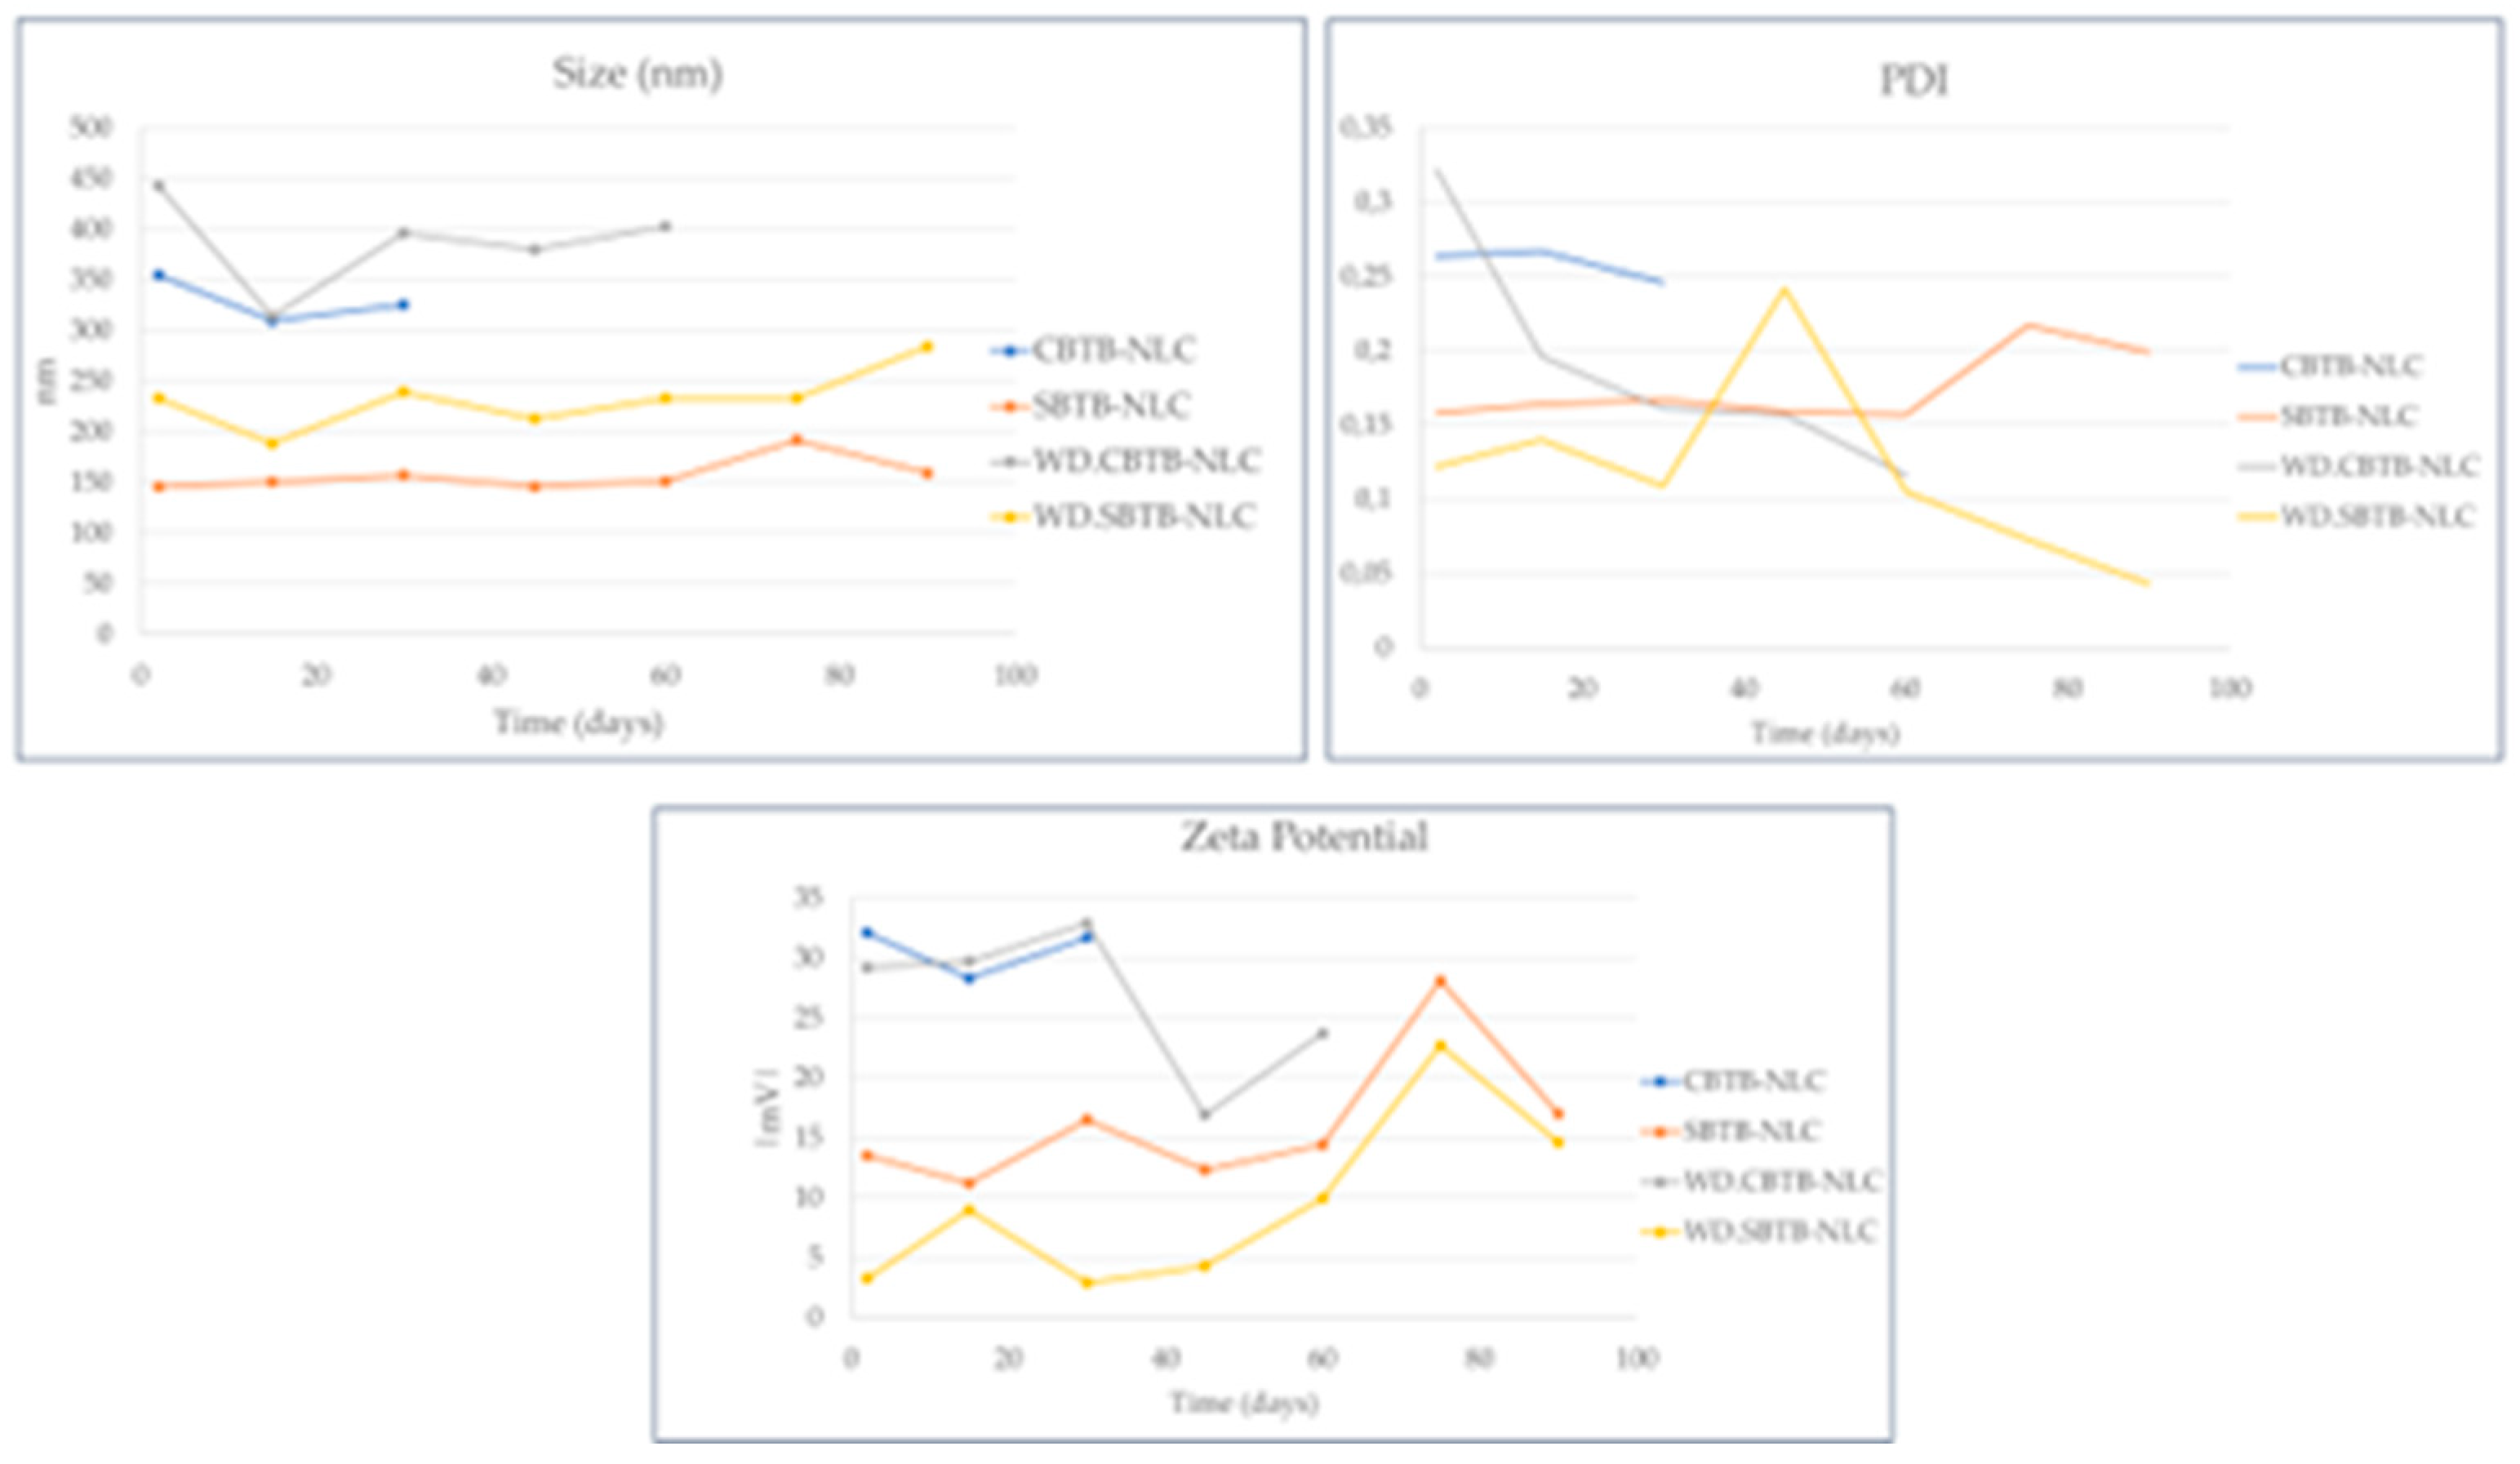

Table 1.
Experimental variables and design levels.
| Variables | Symbols | Low level (-1) | High level (+1) |
| Total lipids (%w/w) | A | 10 | 20 |
| Surfactant (% w/w) | B | 5 | 10 |
| Sonication time (min) | C | 5 | 10 |
Table 2.
Experimental variables and properties of interest, along with the optimization criteria.
| Independent variables | Dependent variables (CQAs) | Optimization criteria |
| % Total lipids | Size | Minimum |
| % Surfactant | PDI | <0.2 |
| Sonication time (min) | Zeta Potential | Maximize |
Table 3.
Experimental design matrix with the 3 central points.
| NLC | A: Total lipids (%), X1 | B: Surfactant (%), X2 | C: Sonication time (min), X3 |
| 1 | 10 | 5 | 5 |
| 2 | 20 | 5 | 5 |
| 3 | 10 | 10 | 5 |
| 4 | 20 | 10 | 5 |
| 5 | 10 | 5 | 10 |
| 6 | 20 | 5 | 10 |
| 7 | 10 | 10 | 10 |
| 8 | 20 | 10 | 10 |
| 9 | 15 | 7.5 | 7.5 |
| 10 | 15 | 7.5 | 7.5 |
| 11 | 15 | 7.5 | 7.5 |
Table 4.
Composition of the formulations and responses obtained in the 2³ design for Butamben encapsulation, using CrodasolTM HS HP as a surfactant.
Table 4.
Composition of the formulations and responses obtained in the 2³ design for Butamben encapsulation, using CrodasolTM HS HP as a surfactant.
| NLC | Factor 1 | Factor 2 | Factor 3 | Response 1 | Response 2 | Response3 |
| A: Total Lipids | B:CrodasolTM HS HP | C: Sonication Time | Size | PDI | Zeta Potential | |
| % | % | min | nm | |mV| | ||
| 1 | 10 | 5 | 5 | 244.93 | 0.187 | 25.66 |
| 2 | 20 | 5 | 5 | 328.06 | 0.176 | 29.33 |
| 3 | 10 | 10 | 5 | 361.76 | 0.308 | 26.36 |
| 4 | 20 | 10 | 5 | 698.93 | 0.319 | 26.8 |
| 5 | 10 | 5 | 10 | 267.16 | 0.198 | 29.16 |
| 6 | 20 | 5 | 10 | 442.7 | 0.281 | 27.62 |
| 7 | 10 | 10 | 10 | 364.4 | 0.317 | 25.9 |
| 8 | 20 | 10 | 10 | 589.8 | 0.349 | 29.26 |
| 9 | 15 | 7.5 | 7.5 | 407.23 | 0.253 | 28.16 |
| 10 | 15 | 7.5 | 7.5 | 416.66 | 0.237 | 25.4 |
| 11 | 15 | 7.5 | 7.5 | 406.9 | 0.285 | 25.76 |
Table 5.
Components with significant effects and their interactions on each response for the formulation containing CrodasolTM HS HP as a surfactant.
Table 5.
Components with significant effects and their interactions on each response for the formulation containing CrodasolTM HS HP as a surfactant.
| Response | Positive effect | Negative effect |
| Size | A, B e AB | BC e ABC |
| PDI | B | - |
| Zeta Potential | - | - |
Table 6.
Composition of the formulations and responses obtained in the 2³ design for Butamben encapsulation, using SynperonicTM PE/F68 as a surfactant.
Table 6.
Composition of the formulations and responses obtained in the 2³ design for Butamben encapsulation, using SynperonicTM PE/F68 as a surfactant.
| NLC | Factor 1 | Factor 2 | Factor 3 | Response 1 | Response 2 | Response3 |
| A: Total Lipids | B: SynperonicTM PE/F68 | C: Sonication Time | Size | PDI | Zeta Potential | |
| % | % | min | nm | |mV| | ||
| 1 | 10 | 5 | 5 | 260.2 | 0.139 | 4.4 |
| 2 | 20 | 5 | 5 | 214.86 | 0.118 | 10.73 |
| 3 | 10 | 10 | 5 | 160.9 | 0.172 | 8.67 |
| 4 | 20 | 10 | 5 | 157.66 | 0.134 | 5.01 |
| 5 | 10 | 5 | 10 | 250.9 | 0.178 | 19.73 |
| 6 | 20 | 5 | 10 | 248.4 | 0.096 | 14 |
| 7 | 10 | 10 | 10 | 172.06 | 0.061 | 6.97 |
| 8 | 20 | 10 | 10 | 162.23 | 0.11 | 9.42 |
| 9 | 15 | 7.5 | 7.5 | 171.16 | 0.109 | 11.6 |
| 10 | 15 | 7.5 | 7.5 | 188.8 | 0.145 | 10.9 |
| 11 | 15 | 7.5 | 7.5 | 194.4 | 0.131 | 13.23 |
Table 7.
Components with significant effects and their interactions on each response for the formulation containing SynperonicTM PE/F68 as a surfactant.
Table 7.
Components with significant effects and their interactions on each response for the formulation containing SynperonicTM PE/F68 as a surfactant.
| Response | Positive effect | Negative effect |
| Size | - | B |
| PDI | - | - |
| Zeta Potential | C, and ABC | B, and BC |
Table 8.
Compilation of data from the three experimental designs carried out containing Butamben. Orange coloring: positive effect. Blue: negative effect.
Table 8.
Compilation of data from the three experimental designs carried out containing Butamben. Orange coloring: positive effect. Blue: negative effect.
| Significant Effects | |||
| NLC | Size | PDI | Zeta Potential |
| CrodasolTM HS HP | % Total lipids, Surfactant, and interactions AB, and BC | Surfactant | - |
| SynperonicTM PE/F68 | Surfactant | - | Sonication Time, Surfactant, and interaction BC |
Table 9.
Composition of optimized NLCs.
| NLC | CP (g) | Lauryl Lactate (g) | SRTM DMI (g) | Surfactant (g) | BTB (g) | Sonication (min) |
| CBTB-NLC | 0.44 | 0.28 | 0.28 | 0.5 | 0.5 | 7.5 |
| C-NLC | 0.44 | 0.28 | 0.28 | 0.5 | - | 7.5 |
| SBTB-NLC | 0.88 | 0.56 | 0.56 | 1 | 0.5 | 10 |
| S-NLC | 0.88 | 0.56 | 0.56 | 1 | - | 10 |
Legend. CP – CrodamolTM CP. BTB – Butamben. CBTB-NLC: NLC with CrodasolTM HS HP, and BTB. C-NLC: NLC with CrodasolTM HS HP without BTB. SBTB-NLC: NLC with SynperonicTM PE/F68, and BTB. S-NLC: NLC with SynperonicTM PE/F68 without BTB.
Table 10.
Composition of the optimized formulations tested without SRTM DMI.
| NLC | CP (g) | Lauryl Lactate (g) | Surfactant (g) | BTB (g) | Sonication (min) |
| WD.CBTB-NLC | 0.61 | 0.39 | 0.5 | 0.5 | 7.5 |
| WD.SBTB-NLC | 1.22 | 0.78 | 1 | 0.5 | 10 |
Legend. CP – CrodamolTM CP. BTB – Butamben. WD.CBTB-NLC: NLC with CrodasolTM HS HP, BTB, and without SRTM DMI. WD.SBTB-NLC: NLC with SynperonicTM PE/F68, BTB without SRTM DMI.
Table 11.
Particle size, PDI, and zeta potential results for the optimized formulations with and without SR DMITM.
Table 11.
Particle size, PDI, and zeta potential results for the optimized formulations with and without SR DMITM.
| NLC | Size (nm) | PDI | Zeta Potential (mV) |
| CBTB-NLC | 354.8 | 0.264 | -32.1 |
| WD.CBTB-NLC | 442.8 | 0.322 | -29.2 |
| SBTB-NLC | 145.6 | 0.158 | -13.5 |
| WD.SBTB-NLC | 233.1 | 0.122 | -3.24 |
Legend. CP – CrodamolTM CP. BTB – Butamben. CBTB-NLC: NLC with CrodasolTM HS HP, and BTB. WD.CBTB-NLC: NLC with CrodasolTM HS HP without SRTM DMI. SBTB-NLC: NLC with SynperonicTM PE/F68, and BTB. WD.SBTB-NLC: NLC with SynperonicTM PE/F68 without SRTM DMI.
Table 12.
Physicochemical characterization of NLCs optimized with and without butamben.
| NLC | Size (nm) | PDI | Zeta Potential (mV) |
| CBTB-NLC | 331.3 | 0.264 | -32.1 |
| C-NLC | 54.5 | 0.275 | -2.47 |
| SBTB-NLC | 166.3 | 0.16 | -9.28 |
| S-NLC | 118.3 | 0.205 | -4.43 |
Table 13.
NTA analysis results.
| NLC | Size (nm) | N° Part. X 10¹³ mL-1 | D10 (nm) | D50 (nm) | D90 (nm) | Span |
| CBTB-NLC | 175.5 ± 7.2 | 3.52 ± 0.74 | 113.2 ± 6.8 | 137.7 ± 6.6 | 305.3 ± 50.9 | 1.39 |
| C-NLC | 96.3 ± 24.4 | 277 ± 0.78 | 53.5 ± 5.6 | 74.1 ± 11.3 | 183.8± 67.7 | 1.75 |
| SBTB-NLC | 162.7 ± 2.9 | 4.40 ± 0.6 | 130.5 ± 2.1 | 155 ± 2.1 | 203.1 ± 3.3 | 0.46 |
| S-NLC | 170.2 ± 1.9 | 2.82 ± 0.22 | 135.1 ± 1.2 | 166.3 ± 3.8 | 211.5 ± 1.2 | 0.46 |
Legend. CP – CrodamolTM CP. BTB – Butamben. CBTB-NLC: NLC with CrodasolTM HS HP and BTB. C-NLC: NLC with CrodasolTM HS HP without BTB. SBTB-NLC: NLC with SynperonicTM PE/F68 and BTB. S-NLC: NLC with SynperonicTM PE/F68 without BTB.
Disclaimer/Publisher’s Note: The statements, opinions and data contained in all publications are solely those of the individual author(s) and contributor(s) and not of MDPI and/or the editor(s). MDPI and/or the editor(s) disclaim responsibility for any injury to people or property resulting from any ideas, methods, instructions or products referred to in the content. |
© 2024 by the authors. Licensee MDPI, Basel, Switzerland. This article is an open access article distributed under the terms and conditions of the Creative Commons Attribution (CC BY) license (http://creativecommons.org/licenses/by/4.0/).
Copyright: This open access article is published under a Creative Commons CC BY 4.0 license, which permit the free download, distribution, and reuse, provided that the author and preprint are cited in any reuse.


